Article

Engineering Saccharomyces cerevisiae to Enhance Fatty Acid Production via Formate Electrolytes

1
College of Life Science and Technology, Beijing Advanced Innovation Center for Soft Matter Science and Engineering, Beijing University of Chemical Technology, Beijing 100029, China
2
College of Chemical Engineering, Beijing University of Chemical Technology, Beijing 100029, China
3
State Key Laboratory of Green Biomanufacturing, Beijing University of Chemical Technology, Beijing 100029, China
*
Author to whom correspondence should be addressed.
These authors contributed equally to this work.
Fermentation 2025, 11(12), 664; https://doi.org/10.3390/fermentation11120664
Submission received: 28 September 2025 / Revised: 21 November 2025 / Accepted: 24 November 2025 / Published: 27 November 2025
(This article belongs to the Special Issue Yeast Fermentation, 2nd Edition)

Abstract

Fossil fuel overuse drives excessive CO2 emissions, exacerbating environmental degradation and climate change. Coupling electrochemistry with microbial fermentation provides a promising route to convert CO2 into fuels and chemicals. However, microbial electrolytic solution tolerance remains a critical bottleneck, as observed in model organisms like Saccharomyces cerevisiae (S. cerevisiae). To address this, we engineered S. cerevisiae to utilize electrochemically derived formate, thereby boosting free fatty acids (FFAs) production. By optimizing culture conditions and heterologously expressing formate dehydrogenase (FDH), we improved formate assimilation efficiency. Additionally, we introduced stress-resistant genes for a better electrolytic solution tolerance to sustain growth and FFAs synthesis under harsh electrolytic conditions (e.g., high formate/salt ion concentrations), eliminating the need to separate formate from the electrolyte post-electrolysis. In the presence of 4 g/L formate electrolytic medium, the engineered strain YB061 achieved a 41.9% increase in biomass and a formate conversion rate exceeding 97.0%. Compared to the parental strain, YB061 enhanced FFAs production by 92.8% by utilizing formate-containing electrolytes, demonstrating great potential for bio-electrochemical manufacturing. However, further work is needed to improve yeast tolerance to high formate concentrations and to enable direct coupling of CO2 electroreduction with microbial cultivation.

1. Introduction

With global population continuing to grow, it is estimated to reach 9–11 billion by 2050 [1]. Excessive fossil fuel consumption has caused severe energy and environmental crises [2]. CO2 emissions have severely impacted the environment and climate. Historical records indicate that atmospheric CO2, which remained stable at 200–280 ppm for 40,000 years, has increased to 414 ppm over the past five decades, contributing to climate change, sea-level rise, and biodiversity loss [3]. Thus, the imperative to curtail our carbon footprint is paramount to sustain the burgeoning population and their material demands. Global CO2 recycling faces challenges, with plant-based carbon fixation hampered by phosphorus deficiency and poor soil nutrients [4,5]. Consequently, substantial research efforts have focused on developing innovative CO2 conversion technologies. Currently, the most promising approaches include thermochemical [6], photochemical [7], and electrochemical [8] processes. Among them, electrochemistry exhibits significant potential in efficiently converting CO2 into value-added compounds.
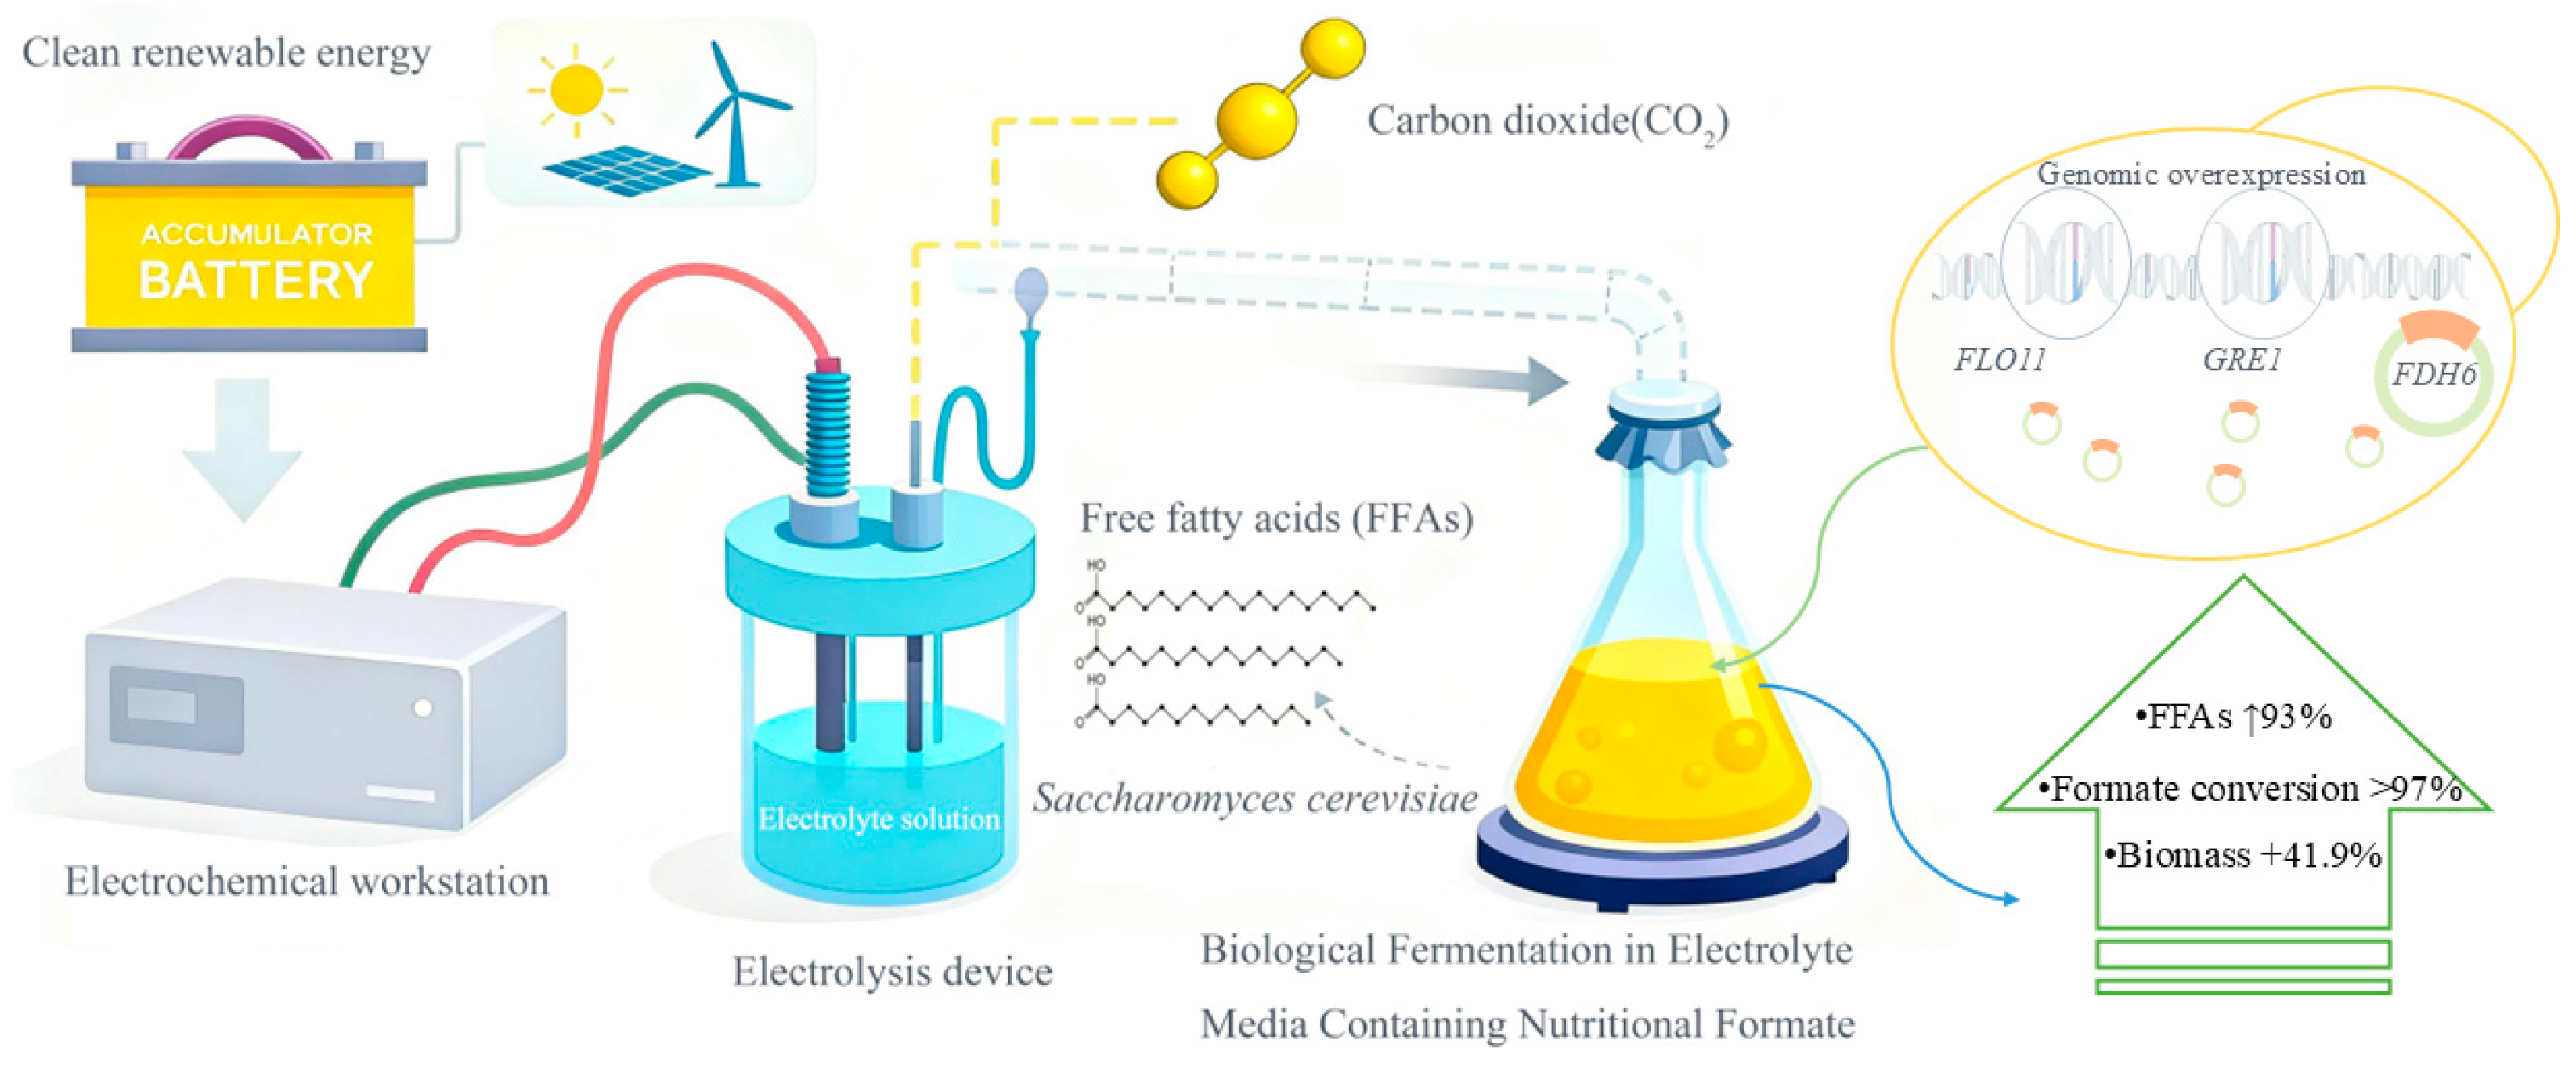
Significant progress has been made in electrochemical CO2 conversion to C1 and C2 compounds [9,10]. Representative products include C1 compounds such as formate [11,12], methanol [13,14], methane [15,16], and carbon monoxide [17,18], as well as C2 compounds like acetic acid [19,20]. However, the conversion of CO2 into oxygenated long-chain compounds or more complex valuable products remains challenging [10,21], primarily due to limitations in electron/proton transfer dynamics and catalyst stability [22,23]. Biocatalysis offers advantages over electrocatalysis via diverse metabolic pathways and enzymes that produce complex or high-value products [3]. However, this approach generally requires pre-reduced carbon substrates, and microbial utilization of highly oxidized CO2 demands extra energy to form reduced intermediates [6]. As shown in Figure 1, a carbon-negative strategy, implemented in third-generation biorefineries, uses renewable energy (e.g., solar and wind) to convert CO2 into intermediates (e.g., formate) for microbial fermentation, producing high-value chemicals and fuels [3,22,24]. Examples of green biomanufacturing include the reduction of CO2 and H2 to acetate by Thermoanaerobacter kivui, followed by the utilization of acetate by S. cerevisiae for the synthesis of vitamin B9 and biomass protein [25]. In addition, continuous CO2 conversion to acetate and formate via a solid-state electrolyte reactor provides both carbon skeletons and reducing equivalents for β-farnesene biosynthesis in Yarrowia lipolytica, enabling engineered strains to produce β-farnesene directly from CO2 [26].
Formate is a low-toxicity and biocompatible molecule that can be oxidized by formate dehydrogenase (FDH) into CO2 with concomitant NADH generation, thereby serving as both a carbon source and an energy provider. This process also alleviates the inhibitory effects associated with formate accumulation. Under certain conditions, FDH can catalyze the reverse reaction, reducing CO2 to formate, which, when coupled to cellular energy metabolism, can indirectly enhance cell vitality [27]. In addition, formate represents a promising microbial fuel because of its high hydrogen density, convenient and safe storage, excellent solubility, and low reduction potential [28,29]. Electrochemically generated formate poses challenges for microbial systems, as its high concentration and the accompanying salt ions can impair microbial viability and utilization. Although bipolar membrane electrodialysis can separate formate [30], it increases process complexity and cost. Therefore, enhancing microbial adaptation to formate electrolytes is necessary to enable direct, non-separated applications.
S. cerevisiae is particularly suited for large-scale industrial applications due to its robust tolerance and adaptability to harsh fermentation conditions [31,32]. As a potential alternative to petrochemicals, lipid compounds are traditionally derived from plant or animal sources [33]; however, microorganisms offer unique advantages owing to their innate FFAs biosynthesis capabilities [34]. Building on our previously developed high-fatty-acid-producing S. cerevisiae strains, this study investigates their adaptation to formate electrolytes to enhance formate utilization. By doing so, formate can serve as both a carbon source and a reducing power, promoting FFAs production and improving microbial potential for carbon-negative and clean energy applications. Cultivation conditions were optimized, and metabolic engineering was applied to enable S. cerevisiae to grow and accumulate FFAs directly in electrolytes containing high concentrations of salts and formate. Enhanced compatibility between microbes and electrolytes resulted in over 99.0% formate utilization and at least a 92.8% increase in FFAs yield. These improvements enhance the integration efficiency of CO2 electrolysis with microbial clean energy production and provide a novel strategy for carbon-negative research.

2. Materials and Methods

2.1. Strains and Plasmids

The strains and plasmids used in this study are listed in Appendix A Table A1, Table A2, Table A7 and Table A8. PrimeSTAR DNA polymerase, PrimeSTAR Max, and DNA marker were purchased from TaKaRa Biomedical Technology Co., Ltd. (Beijing, China). Restriction endonucleases for plasmid construction were obtained from New England Biolabs (Ipswich, MA, USA). Taq PCR mix for colony verification was obtained from Biomed (Beijing, China). DNA gel purification and plasmid extraction kits were purchased from Omega Bio-tek (Norcross, GA, USA). Oligonucleotide primers were synthesized by Qingke Biotechnology Co., Ltd. (Beijing, China), and their sequences are listed in Appendix A Table A3. Unless otherwise specified, all chemicals were purchased from China National Pharmaceutical Group Co., Ltd. (Beijing, China). The mixture of fatty acid methyl esters (FAMEs) was obtained from Sigma-Aldrich (St. Louis, MO, USA).

2.2. Culture Media and Growth Conditions

The compositions of the media used for cell cultivation are summarized in Appendix A Table A4, while the formulations of the trace element solution and the vitamin stock solution are provided in Appendix A Table A5 and Table A6, respectively. Escherichia coli (E. coli) strains were cultured in LB medium supplemented with ampicillin in a rotary shaker at 37 °C and 200 rpm. S. cerevisiae strains were cultivated at 30 °C and 220 rpm under different conditions depending on the experimental stage. The media employed for S. cerevisiae included YPD medium, synthetic complete medium lacking uracil (SC-Ura), Delft medium, 5-fluoroorotic acid (5-FOA) agar plates, as well as simulated and real nutritive formate electrolyte solutions (EFSs and REFSs) containing defined salt and carbon compositions for bio-electrochemical investigations. EFSs consisted of 0.5 M K2SO4 supplemented with different concentrations of sodium formate (3–9 g/L) and Delft medium, adjusted to pH 5, whereas REFSs were prepared using the same base composition but derived directly from the electrochemical CO2 reduction process, potentially containing trace metal ions or detergent residues. The detailed formulations are provided in Table 1. For transformation or inoculum preparation, S. cerevisiae seed cultures were grown in YPD medium. SC-Ura medium was used for the selection of plasmid-bearing strains carrying the URA3 marker gene, whereas counter-selection for plasmid loss was performed on 5-FOA agar plates following liquid cultivation.
Free fatty acid production was carried out in shake-flask fermentation. Delft medium contained 5 g/L (NH4)2SO4, 14.4 g/L KH2PO4, 0.5 g/L MgSO4·7H2O, 20 g/L glucose, a trace metal mixture, and a vitamin solution. When necessary, 40 mg/L histidine and/or 60 mg/L uracil were supplemented. From a 24 h preculture, cells were inoculated into 20 mL of Delft medium at an initial OD600 of 0.1 and cultivated for 96 h at 30 °C with shaking at 220 rpm.

2.3. Measurement of Microbial Growth and Metabolite

2.3.1. Determination of Microbial Growth

Microbial growth was monitored by measuring the optical density at 600 nm (OD600). Measurements were performed using a EU-2600 visible spectrophotometer (Onlab Instruments, Shanghai, China). Samples with OD600 values exceeding the linear detection range were appropriately diluted with sterile ultrapure water, and the actual OD600 values were calculated according to the corresponding dilution factors.

2.3.2. Determination of Extracellular Metabolites

High-performance liquid chromatography (HPLC, Shimadzu LC-20AT, Kyoto, Japan) equipped with a refractive index detector (RID) and a UV detector set at 210 nm was employed to quantify glucose and formate. The analysis was performed using 5 mM H2SO4 as the mobile phase at a flow rate of 0.6 mL/min. An Aminex HPX-87H column (Bio-Rad, Hercules, CA, USA) was maintained at 65 °C, with an injection volume of 10 μL. Standard calibration curves were prepared by diluting a mixed solution containing 20 g/L glucose and 10 g/L formate into five gradient concentrations using the mobile phase.

2.3.3. Determination of FFAs

The quantification of free fatty acids (FFAs) was performed via extraction followed by methylation. After 72 h and 96 h of cultivation, 200 μL of the culture broth was sampled and diluted with an equal volume of deionized water to prepare a diluted cell suspension. Then, 10 μL of 40% tetrabutylammonium hydroxide was added as a basic catalyst, followed by 200 μL of dichloromethane containing 200 mM methyl iodide as the methylating agent, and 100 μg of tetradecenoic acid as the internal standard. The mixture was vortexed vigorously at 1400 rpm for 30 min and centrifuged at 5000× g for 10 min to separate the phases. A 100 μL aliquot of the organic layer was transferred to a GC vial with a glass insert and evaporated to dryness over approximately 4 h. The resulting fatty acid methyl esters (FAMEs) were re-dissolved in 100 μL of n-hexane prior to analysis by gas chromatography-mass spectrometry (GCMS-QP2010 SE, Shimadzu, Japan).
The GC temperature program was set as follows: the initial column temperature was 40 °C for 2 min, then increased to 130 °C at a rate of 30 °C/min, followed by a further ramp to 280 °C at a rate of 10 °C/min, held for 3 min. The injector, transfer line, and ion source temperatures were maintained at 280 °C, 300 °C, and 230 °C, respectively. A 1 μL sample was injected with helium as the carrier gas at 1.0 mL/min. Data acquisition was performed in full-scan mode (50–650 m/z), and quantitative analysis was conducted using LabSolutions LC/GC (version 5.87) [35,36].

2.4. Genetic Manipulation

To construct S. cerevisiae strains adapted to electrolyte environments and capable of efficient FFAs production, CRISPR-Cas9-mediated genome editing was employed in strain YJZ45 [36] to overexpress GRE1 and FLO11. Plasmids were assembled using standard molecular cloning techniques, including PCR amplification, gel extraction, restriction digestion, and homologous recombination. All genetic constructs were verified by DNA sequencing. The primers used in this study are listed in Appendix A Table A2. The gene sequences of formate dehydrogenases (FDH) from different host organisms were obtained from the National Center for Biotechnology Information (NCBI; https://www.ncbi.nlm.nih.gov/ accessed on 27 September 2025). Codon optimization of FDH genes and plasmid construction procedures were performed as described in our previously published work [37].

2.5. Experimental Setup of CO2 Electroreduction in Flow Cell

The flow cell consisted of three chambers (anolyte, catholyte, and gas flow). The cathode gas diffusion layer (GDE) with an exposed area of 1 cm2 was placed between the catholyte and gas chambers, with the catalyst layer facing the electrolyte. The commercial bismuth oxycarbonate (Aladdin) was used as the cathode catalyst. An IrO2/Ti anode was used in the anolyte chamber, and a cation exchange membrane (Nafion 117) separated the two liquid compartments. An Ag/AgCl (3.5 M KCl) reference electrode was positioned in the catholyte chamber. Catholyte and anolyte were circulated using peristaltic pumps (8 mL min−1). CO2 was fed into the gas chamber through a digital mass flow controller. The anode and cathode compartments were compressed with equal torque, with electrode–membrane distances of 1.2 cm. The electrolysis current density was set as 200 mA cm−2 to reach the acquired formate concentration.

2.6. Statistical Analysis

Data are presented as mean ± standard deviation (SD) of three independent experiments. Statistical significance was determined using the t-test with SPSS 24.0 (IBM SPSS, v.25, Armonk, NY, USA). Differences were considered statistically significant at p < 0.05, highly significant at p < 0.01, and extremely significant at p < 0.001.

2.7. Quantitative Real-Time PCR (qPCR) Analysis

RNA extraction: Three single colonies were inoculated into YPD medium and cultured until the optical density at 600 nm (OD600) reached approximately 1.0. Total RNA was extracted using a Total RNA Extraction Kit (Cat# R1200, Solarbio Science & Technology Co., Ltd., Beijing, China) according to the manufacturer’s instructions. All procedures were performed under RNase-free conditions.
Reverse transcription: The extracted total RNA was used as a template for complementary DNA (cDNA) synthesis using the PrimeScript™ RT Master Mix kit (RR036A, Solarbio Science & Technology Co., Ltd., Beijing, China) following the manufacturer’s protocol.
qPCR amplification: Quantitative real-time PCR was performed using the TB Green Premix Ex Taq™ II kit (RR820A, Solarbio Science & Technology Co., Ltd., Beijing, China) with cDNA as the template. The reactions were run on a QuantStudio 3 Real-Time PCR System (Thermo Fisher Scientific, Shanghai, China). The fluorescence intensity and ΔCt values were automatically recorded. Each strain was analyzed in triplicate, and the ACT1 gene was used as an internal reference for normalization.

3. Results

3.1. System Design of the Trophic Electrolyte and the Bioadapted Electrolyte

The formate-containing electrolyte is nutrient-deficient for non-native methylotrophic S. cerevisiae, severely inhibiting cell growth and formate utilization efficiency. To address this issue, a nutrient-enhanced electrolyte system was constructed by supplementing the electrolyte with Delft medium containing 2.0% glucose (composition provided in Table 1). However, in both the CO2 reduction reaction CO2 reduction reaction (CO2RR) to formate and subsequent microbial utilization of the formate electrolyte, the choice of electrolyte salt critically influences electrocatalytic efficiency and microbial growth. Based on principles of biocompatibility and ionic strength matching, three CO2RR electrolyte salts—KCl, KH2PO4, and K2SO4—were selected (as shown in Table 1). These salts exhibit equivalent potassium ion concentrations and similar ionic strengths. Consequently, by evaluating the effects of simulated nutritive electrolytes on S. cerevisiae strains, a better electrolyte composition with higher biocompatibility and suitable pH can be identified. As shown in Figure 1, the present study provides essential parameters for the development of electrochemical-biological hybrid systems and establishes the foundation for bypassing the step of separating formate, thereby enabling microorganisms to directly utilize formate contained in the electrolyte.

3.2. Investigation of Simulated Nutrient-Type Electrolytes and Culture Conditions

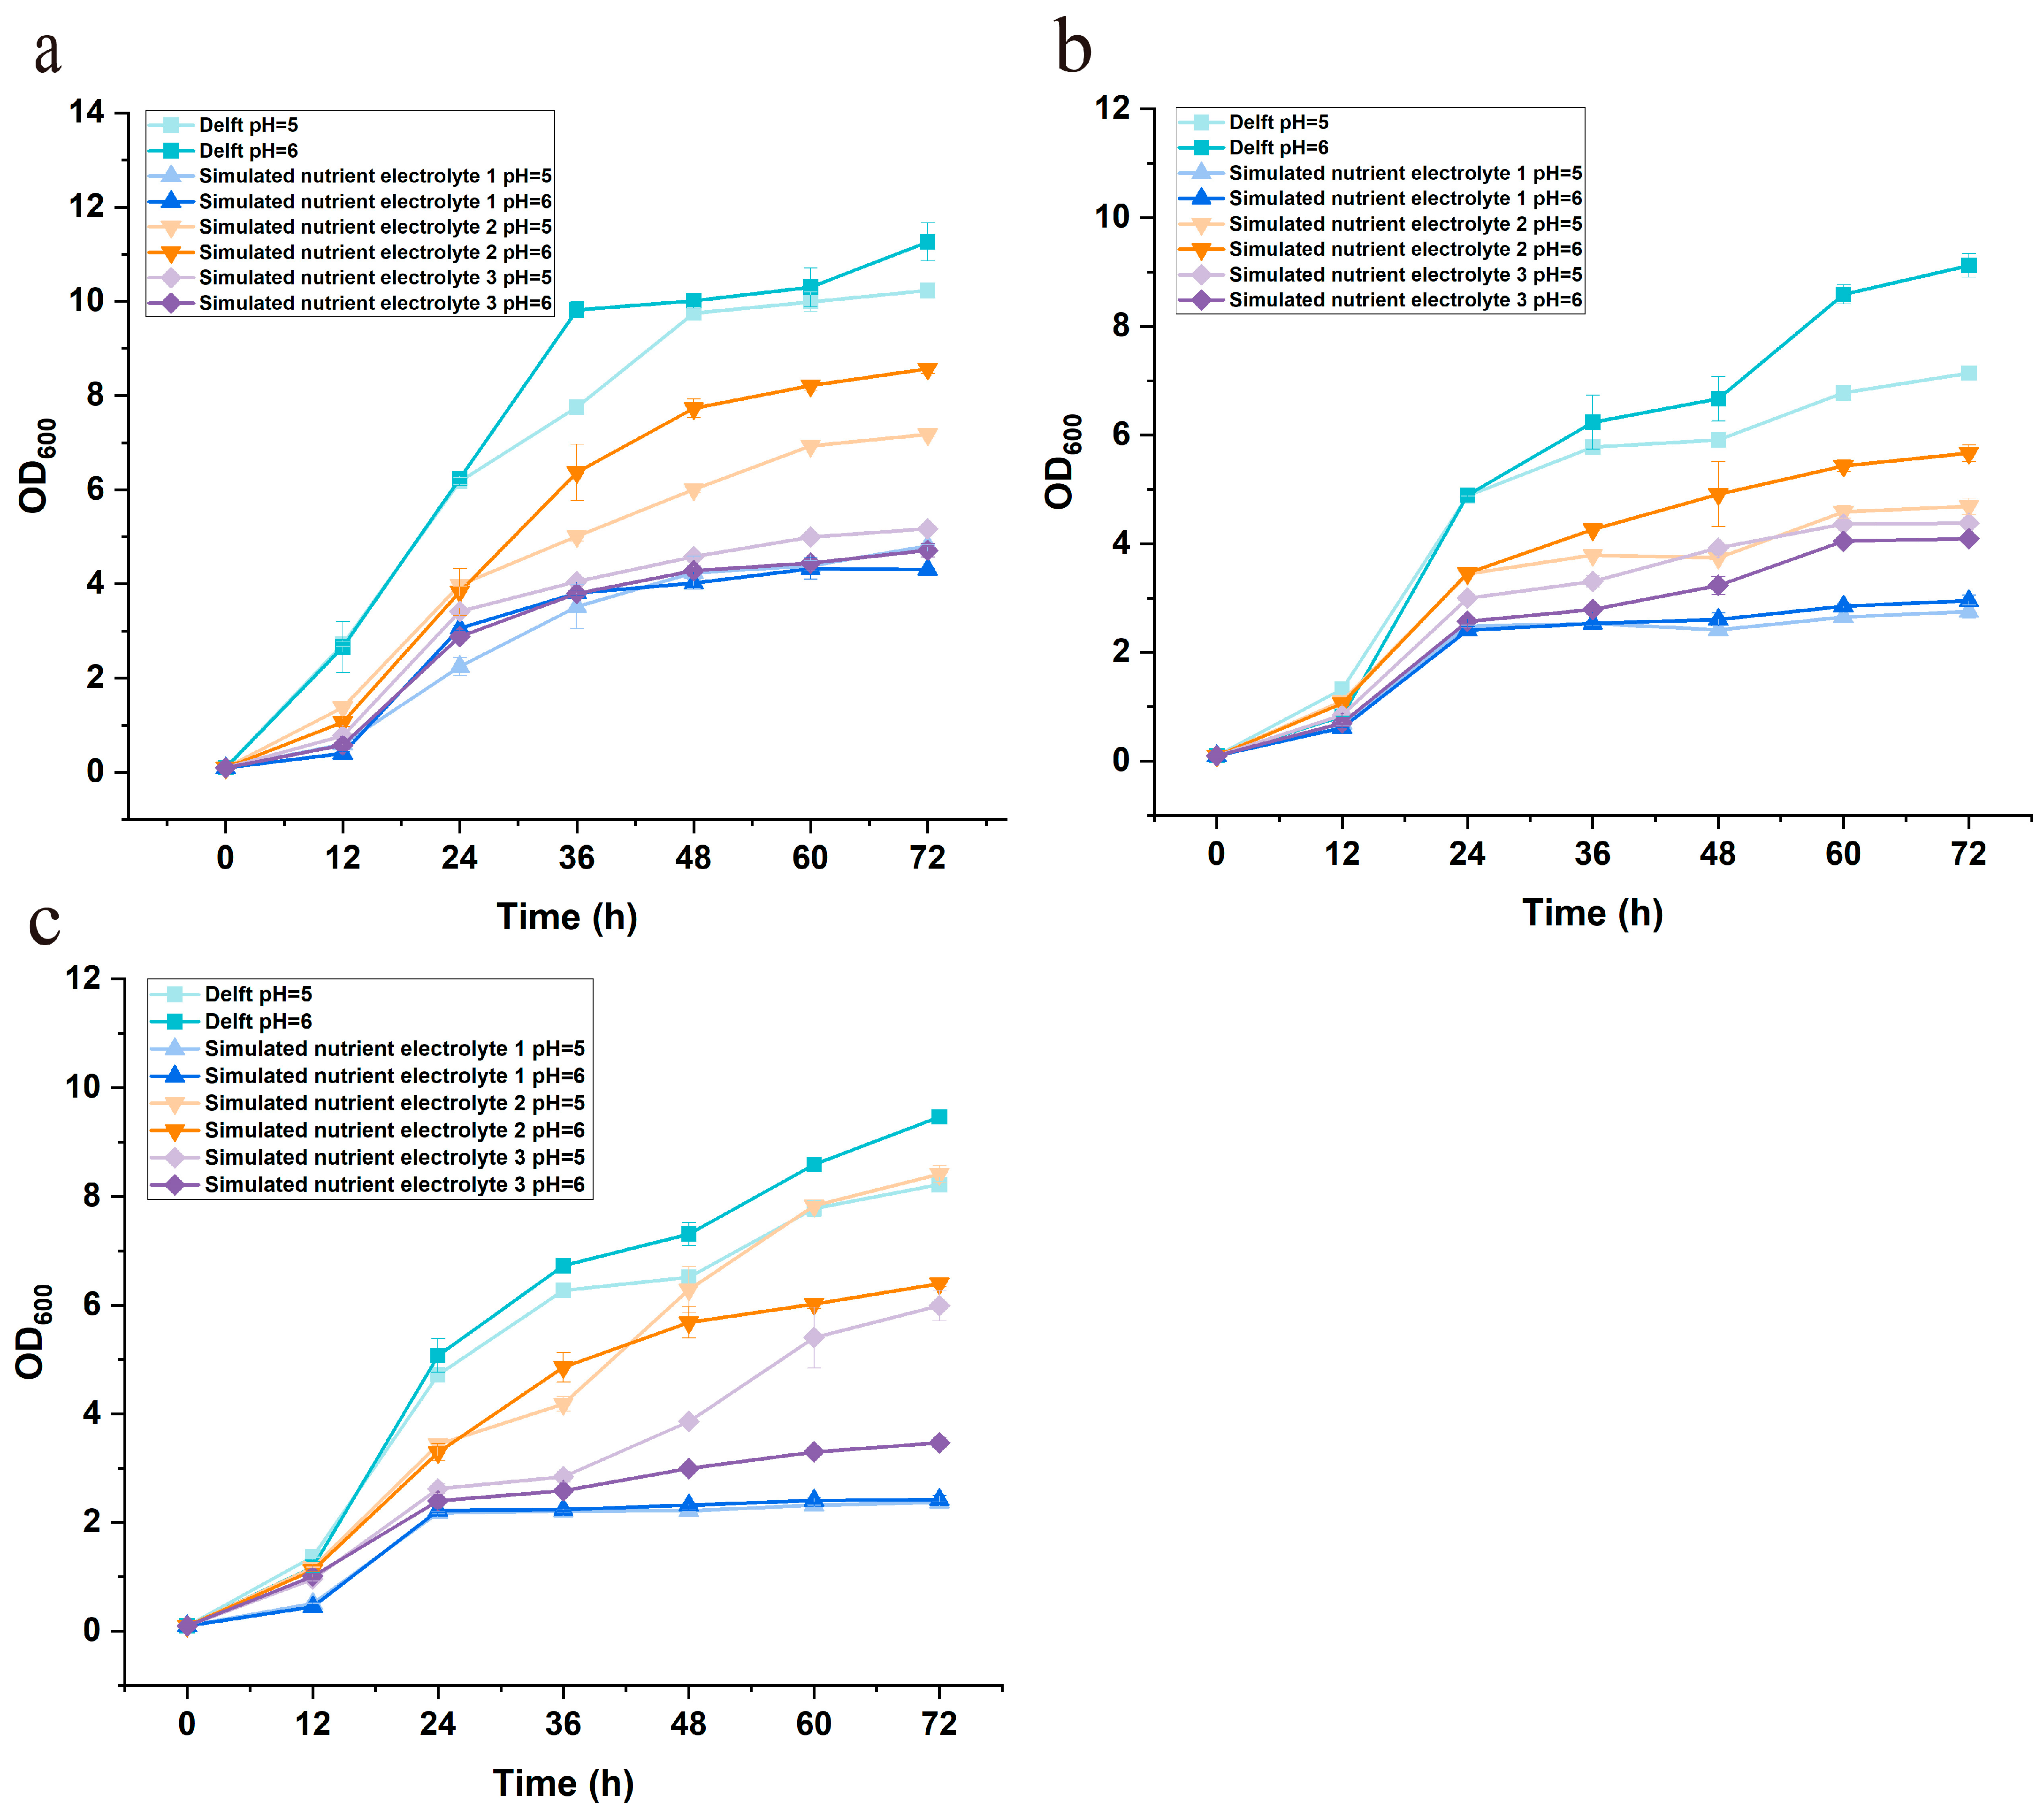
As shown in Table 1, the major differences among the three simulated nutrient electrolytes (E1, E2, and E3) lie in their salt compositions: E1 contains KCl, E2 contains K2SO4, and E3 contains KH2PO4. In this study, the chassis strain CEN.PK113-11C and two high–free fatty acid (FFAs)-producing derivatives, YJZ45 [36] and PDH2 [38], were cultivated in Delft medium and in the three electrolytes (E1, E2, and E3) under two initial pH conditions (pH 5 and pH 6). The growth results are summarized in Figure 2. In Delft medium, all three strains exhibited superior growth compared to the electrolyte-containing media (Figure 2a,b). Both CEN.PK113-11C and PDH2 showed an optimal growth pH of 6. Under both pH 5 and pH 6 conditions, their growth in E2 was consistently better than in E1 or E3. Relative to Delft medium, E1, E2, and E3 exerted different levels of growth inhibition on these two strains, with the inhibitory effect ranked as E1 (KCl) > E3 (KH2PO4) > E2 (K2SO4). Notably, CEN.PK113-11C exhibited the best growth in E2 at pH 6, reaching an OD600 of 8.4, whereas PDH2 showed relatively poor growth in all three electrolytes. The detailed osmotic pressure calculations comparing these electrolytes have been added in Appendix B.1.
As shown in Figure 2c, YJZ45 also exhibited an optimal growth pH of 6 in Delft medium. However, in the presence of electrolytes, its growth in E1 and E3 was markedly lower than in E2. In E2, growth at pH 5 was superior to that at pH 6: at pH 5, the OD600 reached 8.4 after 72 h, which was approximately 31.2% higher than the OD600 of 6.4 observed at pH 6. The growth performance at pH 5 in E2 was nearly comparable to that in Delft medium, with only 11.8% lower than the maximum OD600 (9.4) achieved in Delft at pH 6. Taken together, among the three electrolytes tested, E2 (K2SO4) supported a better growth. This observation is consistent with theoretical osmotic pressure calculations (Table A9), which indicate that 0.5 M K2SO4 exhibits the lowest osmotic pressure (~37 atm) compared with 1 M KH2PO4 and 1 M KCl (~50 atm). The lower osmotic pressure of E2 likely contributed to better cellular stability and growth performance. CEN.PK113-11C reached an OD600 of 8.4 at pH 6, while YJZ45 reached a similar OD600 of 8.4 at pH 5. Considering that YJZ45 is an FFAs-overproducing strain, it was selected for subsequent studies, with pH 5 determined as its optimal cultivation condition. Notably, in this optimized E2 electrolyte system, the CO2 reduction reaction achieved a maximum Faradaic efficiency of 89.8% toward formate and maintained stable 12 h potentiostatic electrolysis, ensuring that sufficient formate was available for microbial utilization to enhance FFAs production.
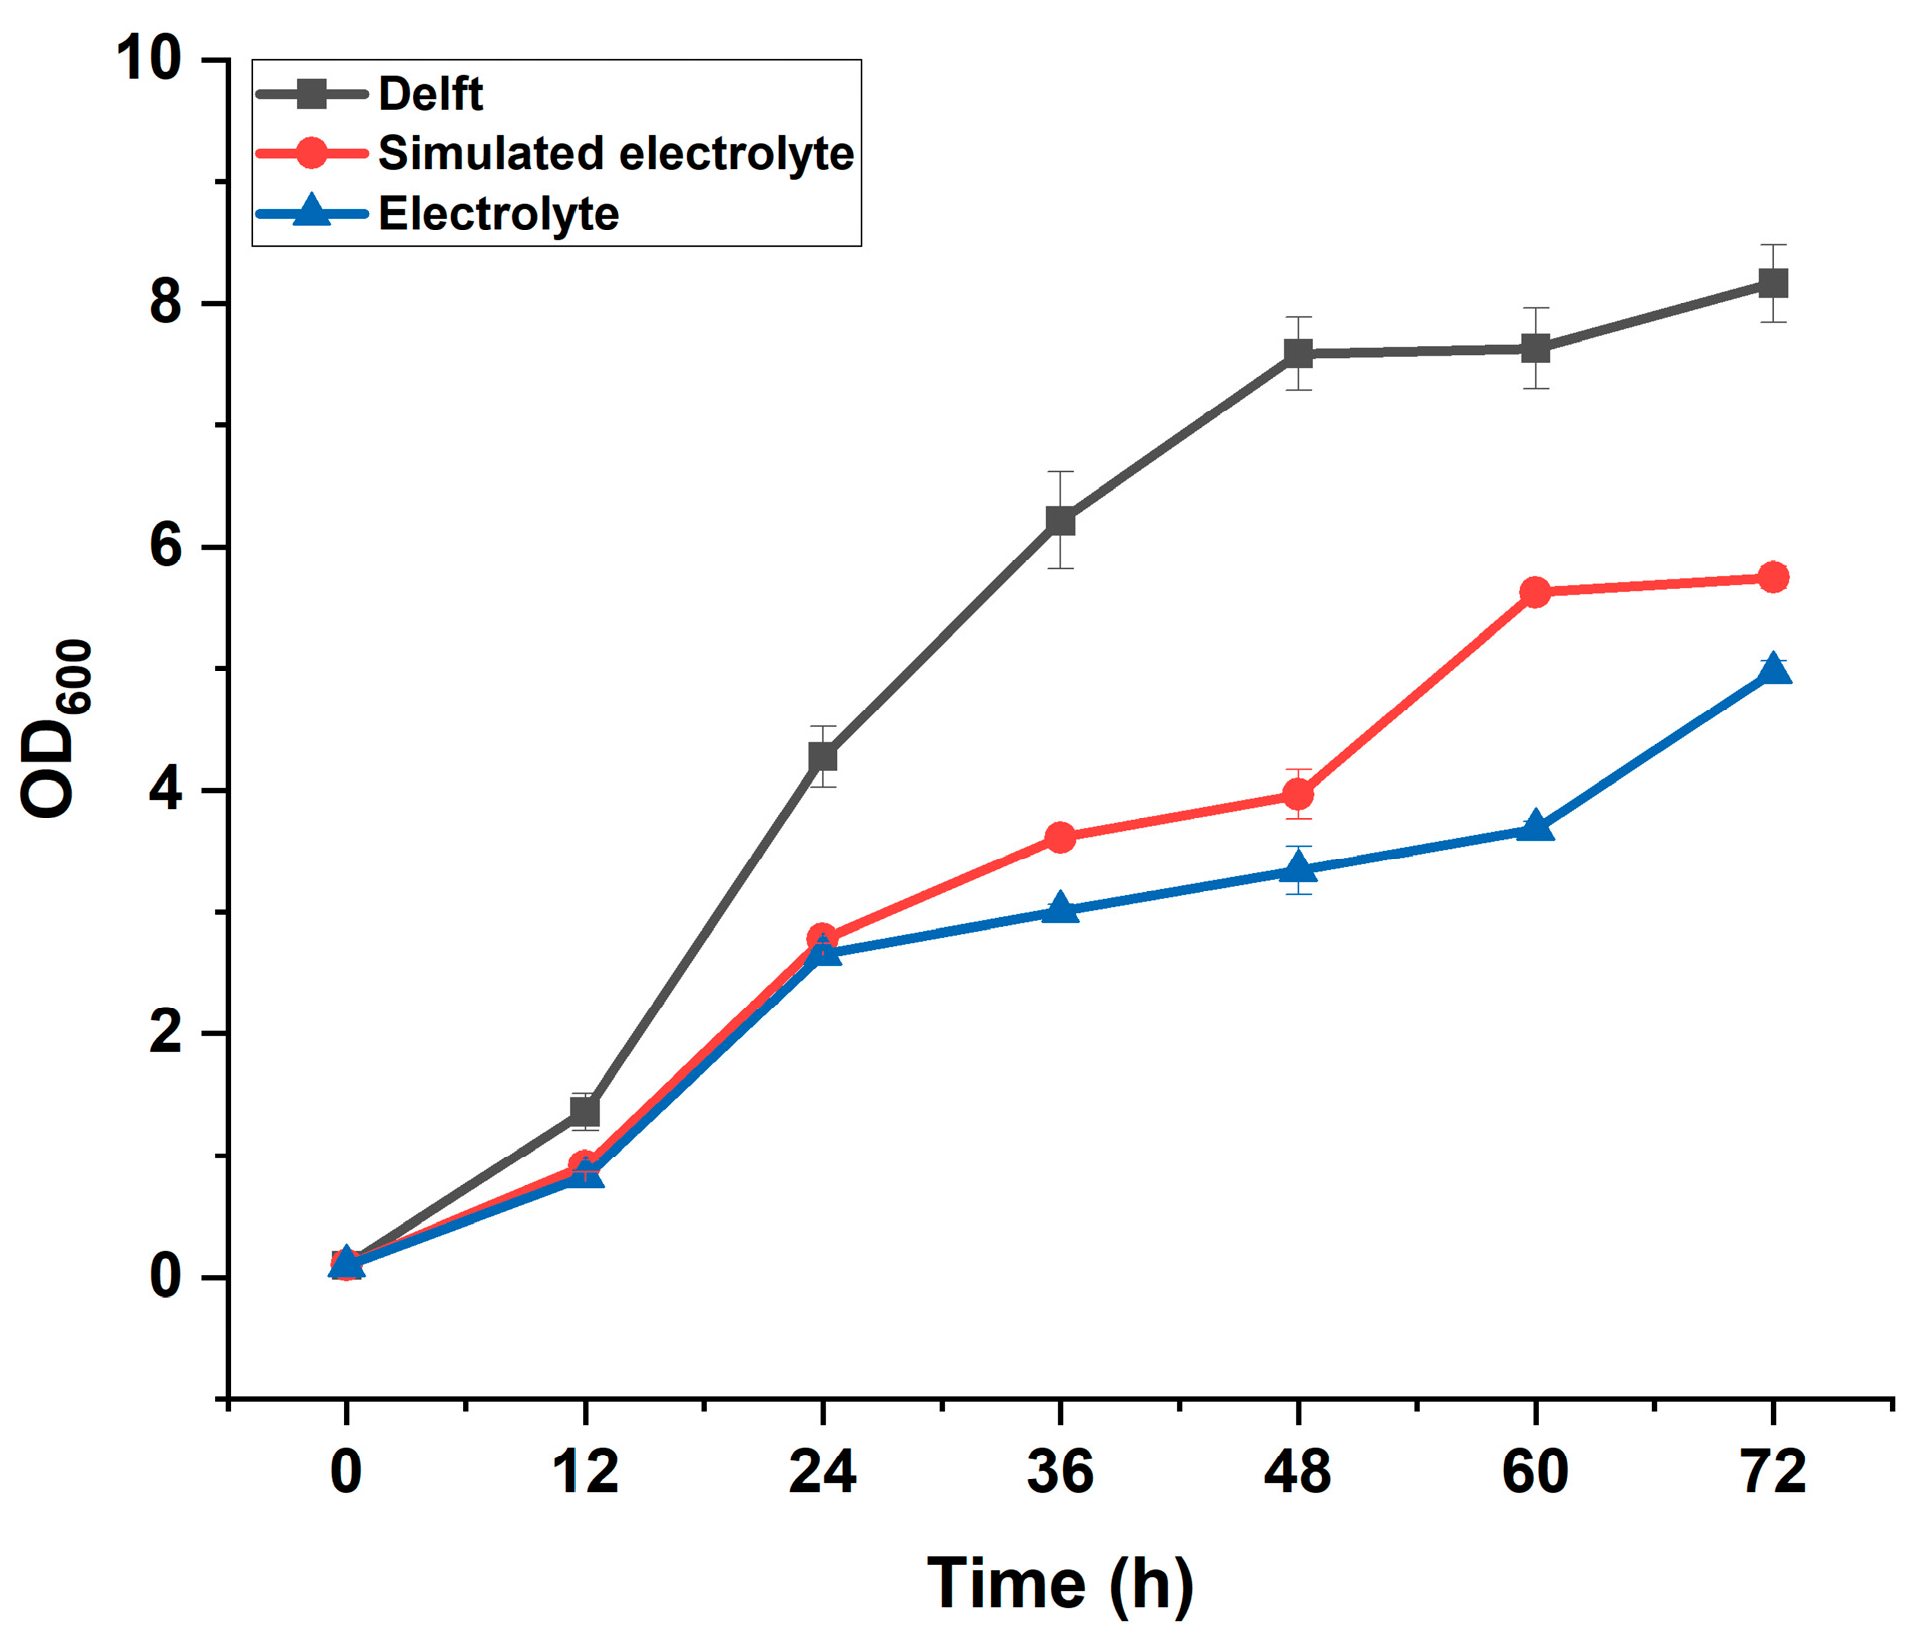
Through experiments, suitable electrolyte types, microbial strains, and optimal pH were preliminarily determined. However, due to the complexity of the electrolysis process, the actual electrolyte may contain minor by-products such as methanol, metal ions, and reactive oxygen species in addition to the main components, which could inhibit microbial growth. To validate the feasibility of using the Simulated nutritive formate electrolyte solution (EFS) in subsequent experiments, the growth of YJZ45 in the simulated nutritive electrolyte (EFS03) was compared with that in the real nutritive formate electrolyte solution (REFS04). As shown, microbial growth in the simulated electrolyte was slightly better than in the real electrolyte, but the difference was less than 10%, indicating that the simulated electrolyte can effectively substitute for the real system in microbial cultivation assessments.

3.3. Screening of FDH Genes Identifies the Optimal FDH for Enhanced FFAs Production and Adaptation to Simulated Nutritive Electrolytes Solution in S. cerevisiae

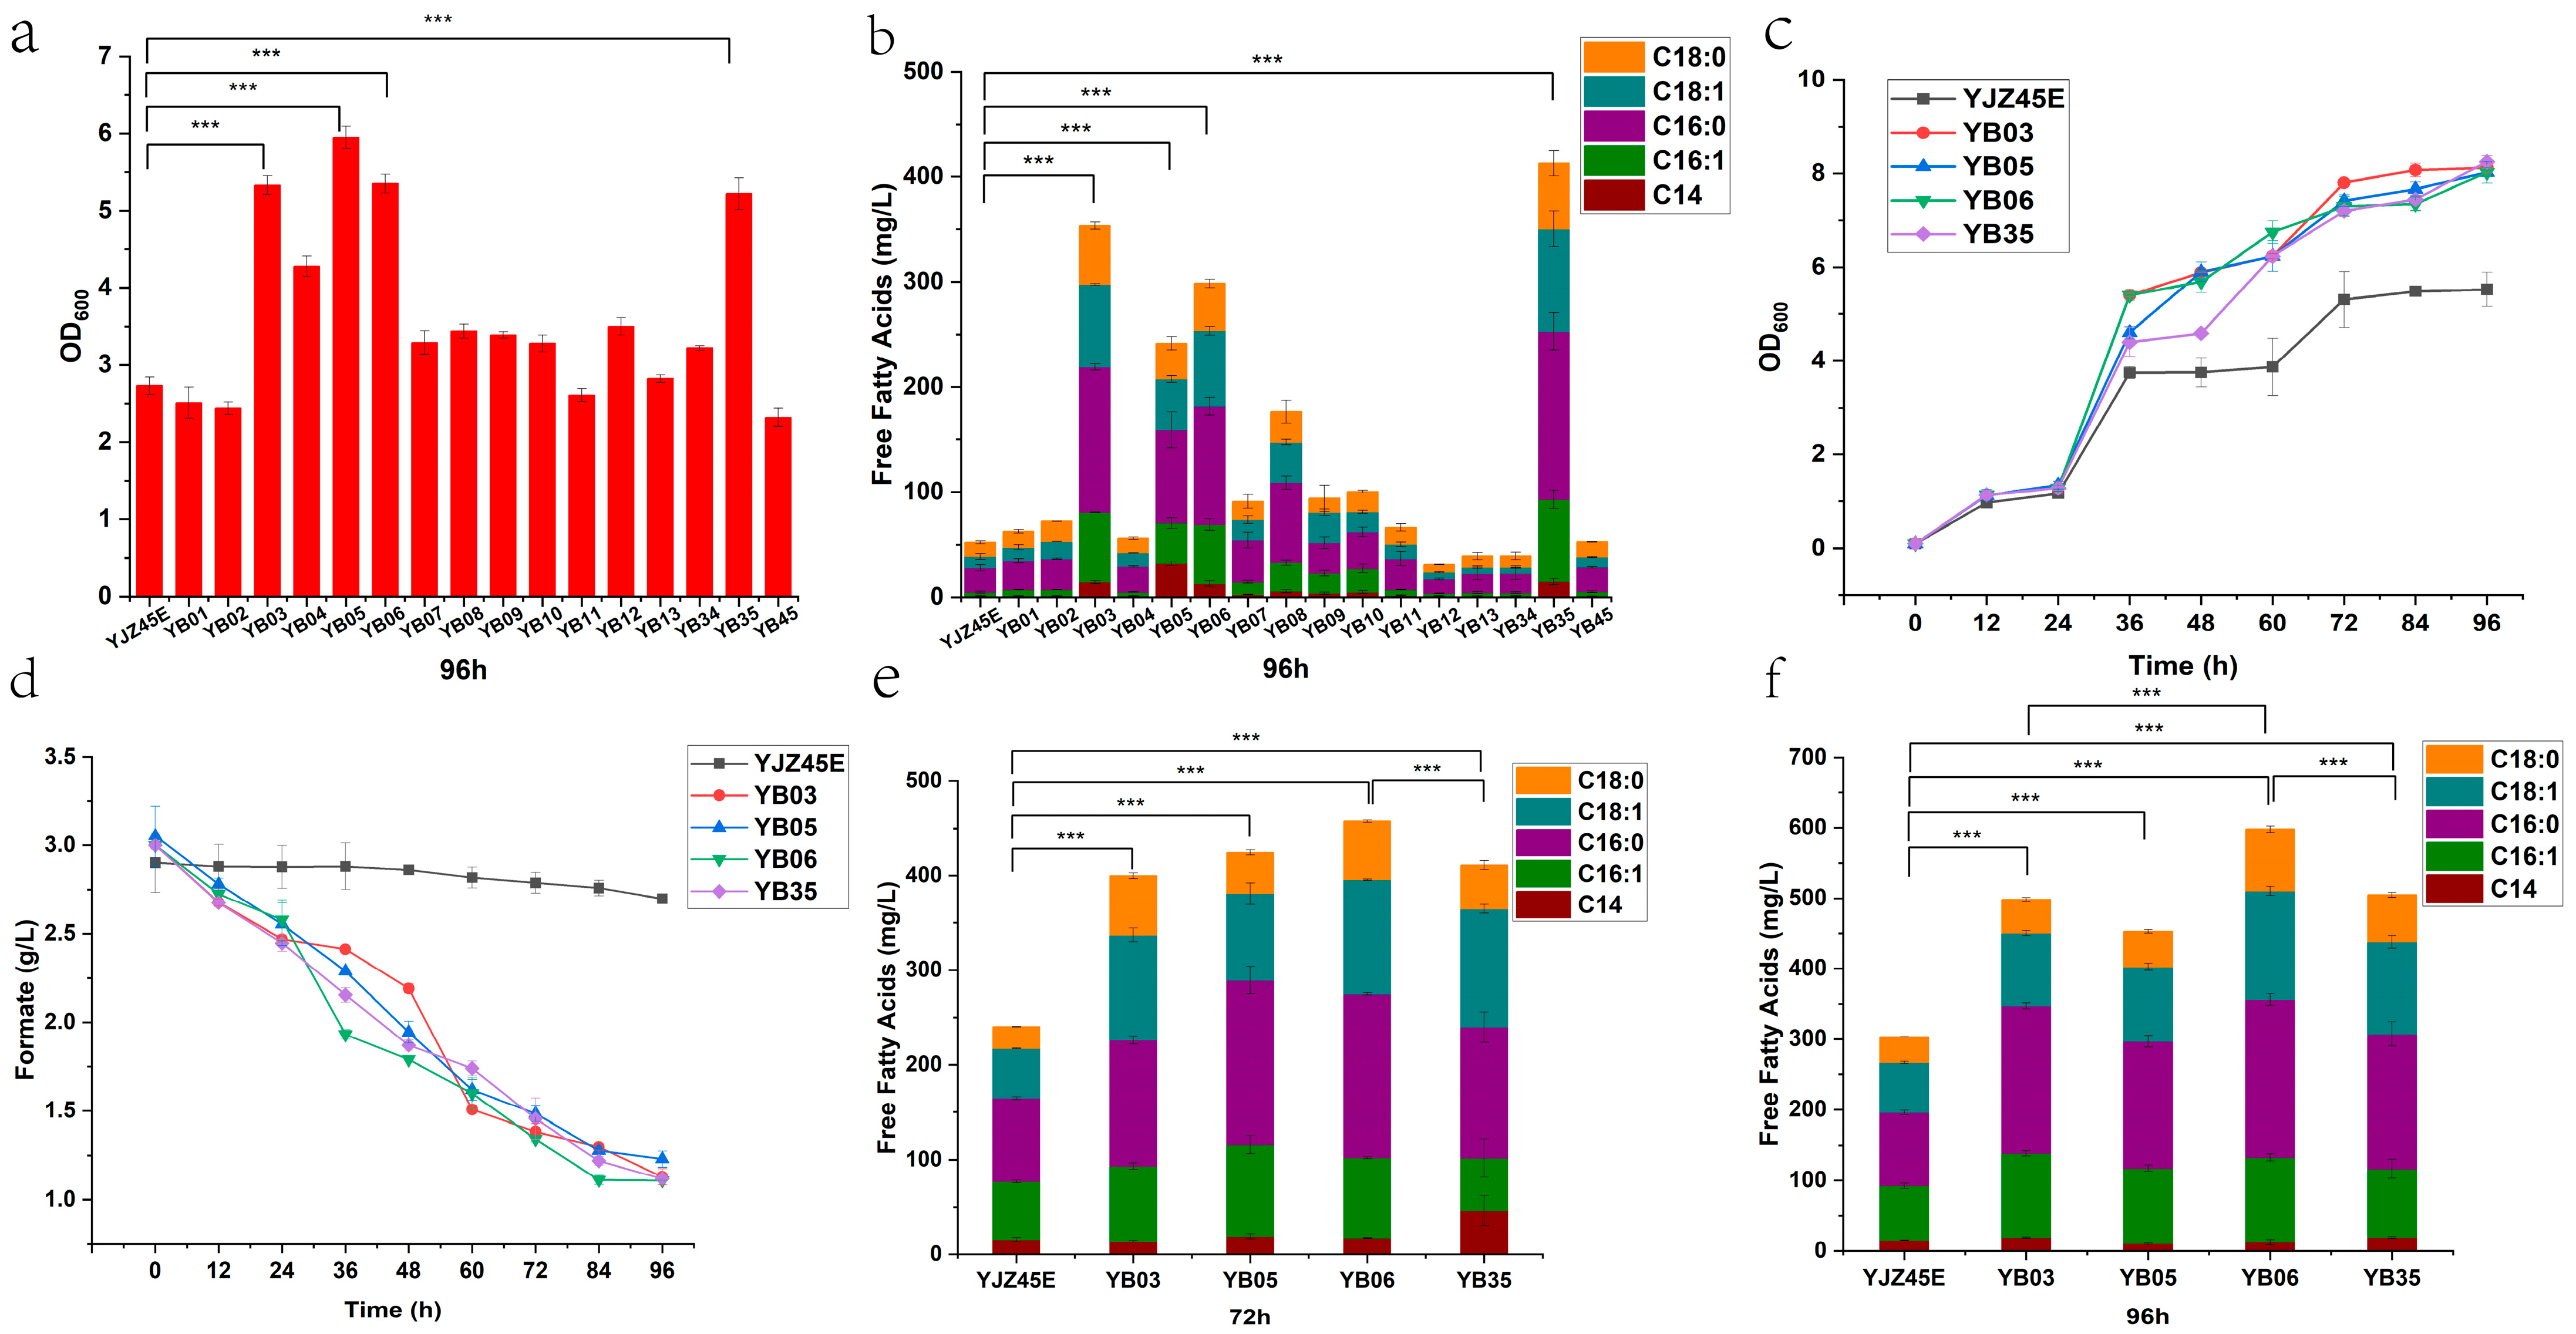
Notably, as shown in Appendix B Figure A1, Figure A7 and Figure A8, the growth of YJZ45 was markedly reduced in the simulated nutritive electrolytes solution supplemented with formate, indicating that the presence of formate exerted a detrimental effect on this strain. To improve the utilization and tolerance of YJZ45 toward formate, in this study we individually overexpressed 13 annotated genes (FDH1 to FDH13) YJZ45, FDH1 to FDH13, as well as several dual-gene combinations that had previously shown favorable results, such as FDH34 (a combination of FDH3 and FDH4), FDH35 (a combination of FDH3 and FDH5), and FDH45 (a combination of FDH4 and FDH5) [29]. A summary of the 13 engineered formate dehydrogenases and their sequence sources is provided in Table A7. The engineered strains carrying single-gene overexpression were designated YB01–YB13, while those harboring dual-gene constructs (FDH34, FDH35, FDH45) were named YB34, YB35, and YB45, respectively. The strain containing the empty plasmid was designated YJZ45E. These 16 engineered strains, together with the control strain YJZ45E, were tested in small-scale tube experiments containing simulated nutritive electrolytes solution (REFS03): and extracellular metabolites, growth curves, and FFAs production were determined. As shown in Figure 3a,b and Figure A2, most of the engineered strains exhibited significantly enhanced growth and FFAs production compared with the control YJZ45E. Among them, YB03, YB05, YB06, and YB35 were particularly notable: YB05 achieved a 100% increase in biomass relative to the control at 96 h, while YB35 reached the highest FFAs titer of 432 mg/L, representing an almost 800% improvement compared with the control.
Extracellular metabolite profiling was performed for the engineered strains. As shown in Appendix B Figure A3 and Figure A4, at 72 h, the accumulation of by-products such as glycerol and ethanol was generally lower in the high-producing strains. After 96 h, as shown in Appendix B Figure A4, the glycerol in the experimental group was almost completely consumed, while a small amount of ethanol remained. This is likely because the glucose was exhausted after 72 h, prompting the yeast to reuse ethanol and glycerol as secondary carbon sources to sustain its survival.
The four high-producing strains YB03, YB05, YB06, and YB35, previously identified through small-scale tube screening, together with the control strain YJZ45E, were further subjected to shake-flask fermentation in a simulated nutritive electrolytes solution (EFS03). Their growth profiles, formate consumption, and FFAs production were monitored over 96 h (Figure 3c). The results showed that, although the engineered strains exhibited distinct growth dynamics, their final biomass at 96 h was comparable and not significantly different. However, compared with the control strain YJZ45E, the OD600 values of the overexpression strains increased by approximately 60.7% (from 5.1 to 8.2). These findings demonstrate that heterologous FDH expression markedly enhanced the growth performance of S. cerevisiae in simulated nutritive electrolytes solution (EFS).
Formate consumption analysis (Figure 3d) revealed that strains YB03, YB06, and YB35 exhibited similar performance, each consuming approximately 1.9 g/L formate at a rate of 19.7 mg/L/h. As shown in Figure 3e,f, YB06 consistently achieved the highest FFAs production at both 72 h and 96 h, reaching a maximum titer of 605 mg/L at 96 h, which represented a 99.6% increase compared with the control. In addition, its biomass increased by 56.3%, with OD600 rising from 5.5 to 8.2. Notably, in scaled-up shake-flask fermentation, YB06 outperformed YB35, which had previously shown superior performance in tube-scale experiments. Consequently, in this experiment, FDH6 was identified as the most effective formate dehydrogenase for enhancing metabolic performance under simulated nutritive electrolytes solution (EFS). These findings further underscore the pivotal role of FDH genes in improving the tolerance and adaptability of S. cerevisiae to formate and high-salt environments.

3.4. Investigation of Genes Related to Compatibility with Simulated Nutritive Electrolytes Solution (EFS)

The introduction of the FDH6 gene into strain YJZ45 substantially enhanced its formate utilization efficiency, achieving a consumption of 1.9 g/L formate. However, there remains potential for further improvement. To advance formate utilization, we implemented a genetic engineering strategy aimed at increasing the strain’s tolerance to simulated nutritive electrolytes solution (EFS). Based on prior transcriptomic analysis from laboratory adaptive evolution experiments designed to boost formate tolerance in S. cerevisiae [37], four candidate genes were selected: the osmolarity-associated genes FLO11 and SIP18, and the cell wall-related genes GRE1 and SPS100. A summary of the four genes and their sequence sources is provided in Appendix A Table A8. To evaluate their effects on microbial performance under simulated nutritive electrolytes solution (EFS) conditions, each native promoter of these genes was replaced with the strong constitutive promoter pTEF1 at the genomic level to achieve overexpression. RT-qPCR analysis was performed on the four overexpression strains derived from YJZ45, and all strains were confirmed to achieve successful overexpression. The RT-qPCR results are shown in Figure A5.
As shown in Figure 4, the four target genes were first overexpressed in the parental strain YJZ45 (without FDH6), and tube fermentation was conducted in simulated nutritive electrolytes solution (EFS03). As demonstrated in Figure 4a, compared to the original strain YJZ45 (OD600 = 1.72), YJZ45-GRE1 exhibited a 26.7% increase in biomass with an OD600 of 2.1, while YJZ45-FLO11 showed a 19.7% increase with an OD600 of 2.06. In contrast, YJZ45-SIP18 and YJZ45-SPS100 displayed no significant improvement. Subsequently, GRE1 and FLO11 were further overexpressed in YB06 (which harbors FDH6), and flask fermentation was performed using simulated nutritive electrolytes solution (EFS03). As illustrated in Figure 4b, compared to YB06 (OD600 = 8.0), YB06-GRE1 achieved a 9.8% increase in biomass with an OD6600 of 8.82, and YB06-FLO11 showed a 7.5% increase with an OD600 of 8.6. Moreover, the dual-overexpression strain YB061 (simultaneously overexpressing GRE1 and FLO11) reached an OD6600 of 9.5 at 96 h, representing an 18.5% increase over YB06 and a 72.4% increase compared to the original strain YJZ45E (OD6600 = 5.5).
In terms of FFAs production (Figure 4c), YJZ45E and YB06 produced 362 mg/L and 605 mg/L at 96 h, respectively. YB06-GRE1 and YB06-FLO11 reached 672 mg/L and 665 mg/L, corresponding to increases of 11.0% and 9.9% compared to YB06. The double-overexpression strain YB061 produced 720 mg/L, which was 19.0% higher than YB06 and 98.8% higher than YJZ45E. It is noteworthy that in EPS03, the volumetric productivity (Qₚ) of YJZ45E, YB06, and YB061 were 3.8 mg/L/h, 6.3 mg/L/h, and 7.5 mg/L/h, respectively. Their specific growth rates (μ) were 0.092 h−1, 0.1008 h−1, and 0.10551 h−1, respectively. Additional parameters, including specific productivity, yield of product on biomass, and average growth rate, are provided in Table A10 in Appendix B. Furthermore, RT-qPCR analysis (see Figure A6) confirmed that YB061 achieved overexpression of two target genes. This further demonstrates that the enhanced growth and production performance of YB061 is attributable to the overexpression of these two genes.
Notably, as shown in Figure 4d, all gene-overexpressing strains exhibited enhanced formate consumption in the simulated nutritive electrolytes solution (EFS03). YB061 consumed up to 2.9 g/L formate, nearly depleting the formate available in the medium. This indicates that YB061 still possesses significant biological potential for further formate utilization.

3.5. YB061 Optimal Formate Concentration for Simulated Nutritive Electrolytes Solution

To further explore the biological potential of YB061 for formate utilization, we leveraged the convenience of Simulated nutritive formate electrolyte solution (EFS) by preparing formulations containing 3, 4, 5, 6, and 9 g/L of formate, which were designated as EFS03, EFS04, EFS05, EFS06, and EFS09: Strain YB061 was inoculated into shake flasks containing these formate gradients for fermentation, during which growth performance, formate consumption, and FFAs production were monitored.
As shown in Figure 5a, the maximum biomass at 96 h in EFS04 reached an OD600 of 9.1, which was not significantly different from EFS03. Notably, when the formate concentration increased to 5 g/L (EFS05), the biomass decreased compared with EFS03, reaching an OD600 of 8.9. Further increases in formate concentration led to a corresponding decline in biomass at 96 h.
Figure 5b,c show that YB061 consumed 2.9 g/L, 3.89 g/L, and 3.7 g/L of formate in the 3, 4, and 5 g/L conditions, respectively, by 96 h. The corresponding FFAs production levels were 743 mg/L, 835 mg/L, and 790 mg/L. In terms of both formate consumption and FFAs yield, the 4 g/L formate condition was identified as the optimal concentration for YB061, providing important insights for bio-electrochemical conversion of formate into FFAs. It is noteworthy that in EPS04, the volumetric productivity (Qₚ) of YB061 was 8.697 mg/L/h, and its specific growth rate (μ) was 0.1100 h−1. Additional parameters, including specific productivity, yield of product on biomass, and average growth rate, are provided in Table A10 in Appendix B.

3.6. Fermentation Validation of YJZ45E, YB06, and YB061 in Real Nutritive Formate Electrolyte Solution (REFS04)

Finally, the original strain YJZ45E, along with YB06 and YB061, was subjected to flask fermentation in real nutritive formate electrolyte solution (REFS04). Growth, formate consumption, and FFAs production at 96 h were monitored. As shown in Figure 6a, YB061 demonstrated the highest growth performance (OD600 = 7.8), whereas YJZ45E and YB06 reached lower values of 5.5 and 6.9, respectively, at 96 h. Compared to the unmodified YJZ45E, YB061 exhibited a 41.9% increase in biomass.
Figure 6b shows that YB061 consumed 3.9 g/L formate, accounting for 97.5% of the total formate available in the real nutritive formate electrolyte solution (REFS04). As illustrated in Figure 6c, FFAs production at 96 h reached 338 mg/L, 507 mg/L, and 652 mg/L for YJZ45E, YB06, and YB061, respectively. Compared with the original strain, YB061 achieved a 92.8% increase in FFAs production when cultured in the real nutritive formate electrolyte solution (REFS), illustrating a promising approach for bio-electrochemical manufacturing. It is noteworthy that in REPS04, the volumetric productivity (Qₚ) of YJZ45E, YB06, and YB061 were 3.5 mg/L/h, 5.9 mg/L/h, and 9.8 mg/L/h, respectively. Their specific growth rates (μ) were 0.064 h−1, 0.0664 h−1, and 0.0690 h−1, respectively. Additional parameters, including specific productivity, yield of product on biomass, and average growth rate, are provided in Table A10 in Appendix B.

4. Discussion

Currently, the integration of renewable electricity with CO2 reduction to produce biochemicals and high-value products such as glucose [39], ectoine [40], biodiesel [41], polyhydroxybutyrate (PHB) [42], single-cell protein [43], and L-sorbose [10] through coupled bio-manufacturing technologies has emerged as a feasible and promising pathway. However, the poor compatibility between electrocatalytic and biocatalytic modules remains a significant barrier to realizing this approach [43]. There are problems such as the incompatibility between the reaction environment of the biocatalytic unit and the working conditions of the electrochemical unit. The reaction environment of the biocatalytic unit is often difficult to reconcile with the operating conditions of the electrochemical unit [44]. In particular, the electrolytes used in the electrocatalytic module typically exhibit high pH and ionic strength, whereas biosynthesis is generally carried out under low pH and low salinity conditions, usually requiring two separate units. Moreover, the intermediates generated in the chemical phase must undergo additional separation and purification before entering the biological phase, which complicates the overall process and increases production costs [39,45]. Therefore, investigating the compatibility between microbial and electrocatalytic systems is indispensable. On the microbial side, strains with inherent tolerance to high salinity and alkaline pH can be selected to better adapt to the harsh electrolyte environment [46,47]. For microorganisms that inherently possess certain desirable traits or production performance, genetic engineering can be applied to regulate the expression of intracellular oxidoreductases, thereby effectively restoring redox balance and improving microbial tolerance. In addition, modulation of the FFAs chain length and saturation, as well as the ratio of phospholipids to sterols in the cell membrane, can alter membrane fluidity and permeability, thereby enhancing resistance to inhibitors [48]. Alternatively, adaptive evolution under harsh conditions can also be employed to further improve compatibility with electrolytes [49].
Furthermore, key genes can be identified and engineered to improve microbial tolerance to acids [50], salts [51], and other stressors, thereby enhancing adaptability to electrolytes. Alternatively, microbial mechanisms such as quorum sensing [52] can be explored to improve the resilience of electroactive biofilms to high-salt shocks [53], among other strategies. For example, in this study, overexpression of the FDH6 gene in strain YJZ45 enhanced its ability to utilize formate from a simulated nutrient electrolyte. In addition, genomic overexpression of GRE1 and FLO11 in engineered strains was implemented to improve tolerance to combined formate and electrolyte stress, likely by stabilizing intracellular homeostasis and the cell wall. The impact of these modifications is evident from Figure A7 and Figure A8, which show that under the combined stress of formate and electrolytes, the growth and FFAs production of strains without these modifications were significantly impaired, whereas engineered strains maintained higher performance. The NADH generated by FDH6 oxidation of formate can be partially converted to NADPH via endogenous transhydrogenase-like systems (e.g., Utr1p and Pos5p), providing additional reducing power for NADPH-dependent FFAs biosynthesis. The resulting strain YB06 exhibited markedly improved formate utilization, with biomass increased by 60.7% and FFAs production increased by 99.6% compared with YJZ45E. However, with changes in electrolysis processes and efficiencies, it remains necessary to explore more efficient FDHs. One promising option is the recently reported metal-dependent cnFDH [54], which shows higher catalytic efficiency and could further enhance the utilization and tolerance of high-concentration formate electrolytes while providing microorganisms with additional reducing equivalents. Beyond this, introducing more efficient formate assimilation pathways [29] could supply greater carbon skeletons for microbial growth and FFAs synthesis. Notably, optimization of central carbon metabolism could also minimize carbon loss during glucose utilization and redirect carbon fluxes toward biomass formation and product synthesis [55].
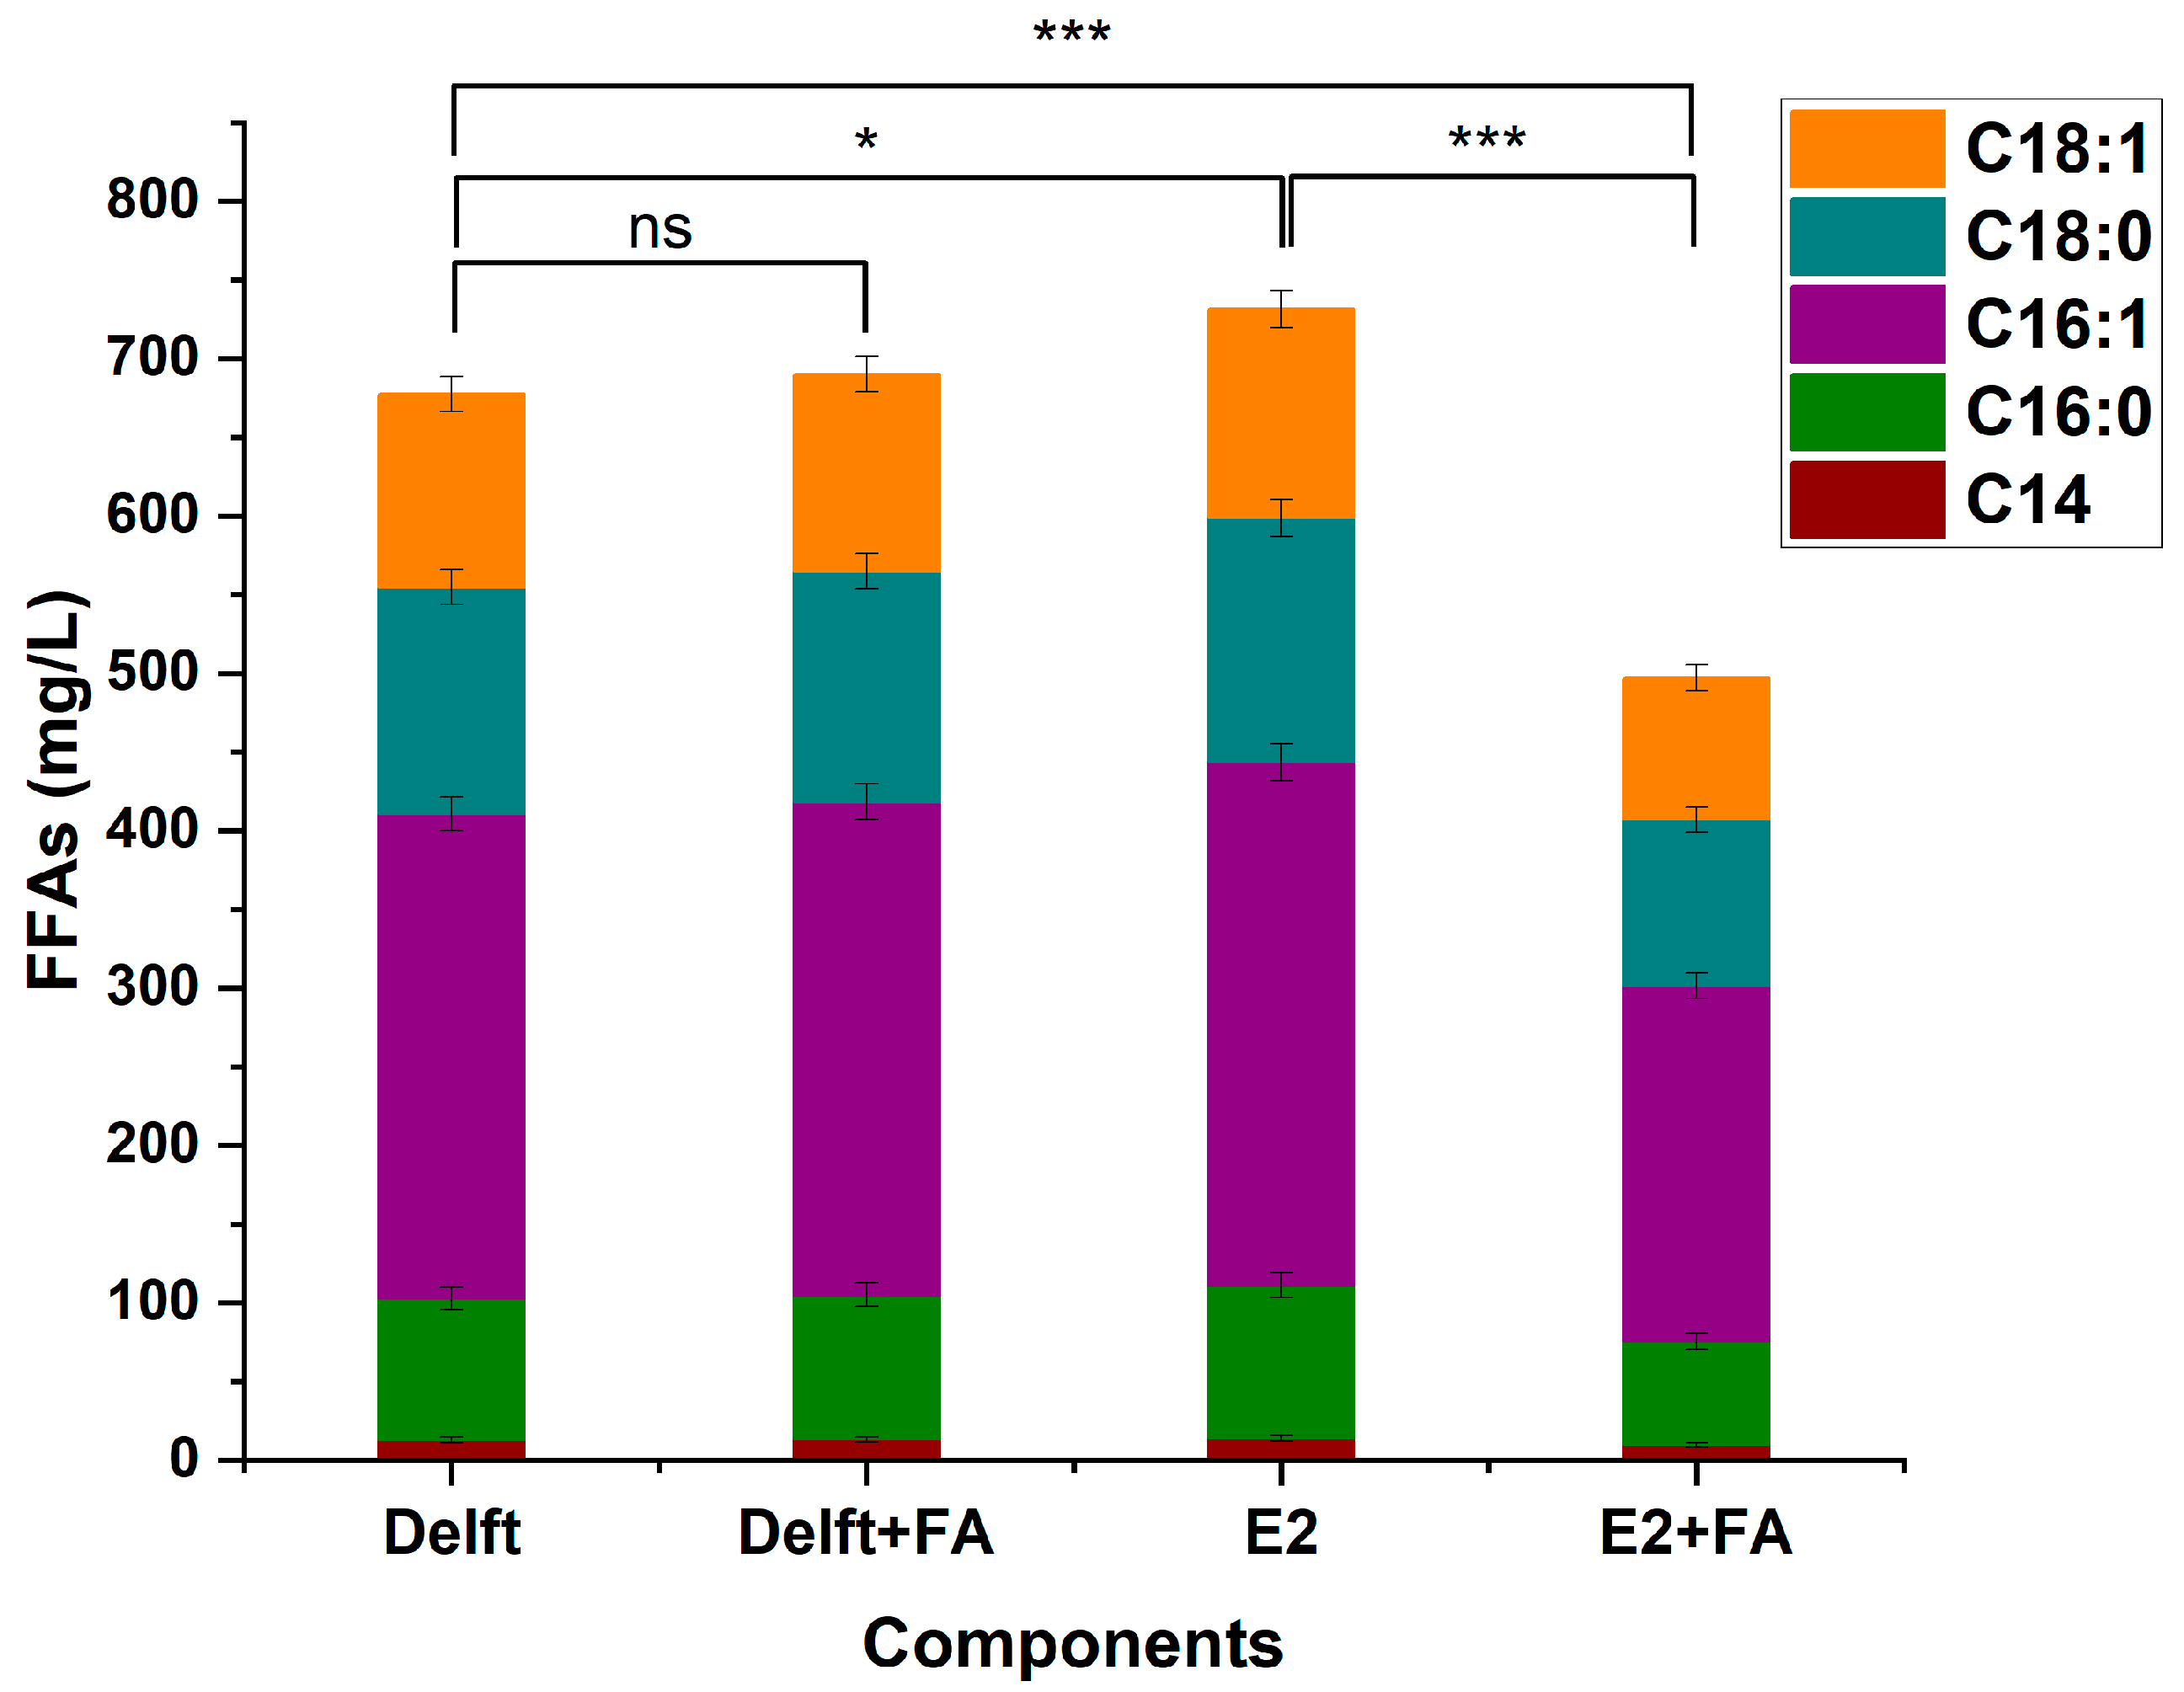
Importantly, Figure A8 shows the FFAs production of YJZ45E after 96 h cultivation under different medium conditions. The presence of formate did not enhance growth or FFAs production; instead, it exerted a mild inhibitory effect, particularly during the mid-to-late cultivation phase. In the Simulated Nutritive Electrolyte 2 (Delft + 0.5 M K2SO4) and Simulated Nutritive Formic Electrolyte groups, the addition of formate caused a more pronounced reduction in both biomass and FFAs titers, suggesting a synergistic stress effect of K2SO4 and formate. In contrast, the engineered strain YB061, with genomic overexpression of GRE1 and FLO11, exhibited improved tolerance under these conditions. GRE1 likely contributes to intracellular homeostasis under osmotic and ionic stress, while FLO11 may stabilize the cell wall and promote biofilm formation, buffering the effects of environmental stress. These functions help maintain cellular integrity and metabolic activity, supporting growth and FFAs production in challenging electrolyte environments. Collectively, these results highlight the utility of stress-responsive genes in engineering yeast strains for enhanced performance under combined salt and formate stress. Previous studies indicate that combined stress from unusual substrates or additives can affect microbial growth and metabolism [56,57,58] supporting the use of stress-tolerance gene overexpression in S. cerevisiae to maintain robust performance.
In this study, a high-glucose medium was primarily employed to provide a reproducible and well-controlled metabolic background for assessing the effect of formate supplementation on free fatty acid (FFAs) production. Glucose, as the most extensively studied carbon source in S. cerevisiae, provides well-characterized metabolic fluxes and product profiles, enabling a clear evaluation of the applied strategy. Compared with the FFAs titer of 1485 mg·L−1 reported for the strain SynENG056 [59], our current study shows a lower production level, likely due to the more extensive genetic modifications in SynENG 056 that favor FFAs synthesis. Future work will focus on implementing additional targeted modifications and exploring alternative carbon sources and metabolic conditions to further optimize FFAs production and cellular growth performance.

5. Limitations and Future Perspectives

Despite the promising results obtained through FDH6-mediated formate utilization and the genomic overexpression of FLO11 and GRE1, which collectively enhanced the strain’s adaptability to formate-rich electrolytes and improved FFAs production, several limitations remain. The present study is restricted to laboratory-scale batch experiments, and the direct coupling of CO2 electroreduction to formate with yeast cultivation has not yet been achieved. Yeast tolerance to high formate concentrations and overall carbon conversion efficiency also remain limited. Furthermore, potential mass transfer constraints, oxygen limitation, and redox imbalance may emerge during scale-up or continuous operation, potentially affecting productivity and system stability.
Future work should focus on improving strain robustness through adaptive laboratory evolution and optimizing metabolic and cofactor balancing pathways to minimize CO2 loss. Integrating CO2 fixation routes, such as Calvin–Benson–Bassham cycle enzymes, could further enhance carbon utilization efficiency. From a process engineering perspective, reactor optimization—particularly in pH control, gas–liquid mass transfer, and formate feeding strategies—will be essential to achieve stable and efficient operation under industrially relevant conditions.
To comprehensively evaluate the sustainability and feasibility of this renewable electricity-driven CO2 bioconversion system, future studies will conduct life cycle assessment (LCA) and techno-economic analysis (TEA). Moreover, process integration and scale-up with CO2 electroreduction reactors should be explored toward establishing a closed-loop carbon recycling platform with optimized environmental, economic, and operational performance.

6. Conclusions

Enhancing the compatibility between microorganisms and electrolytes solution is an urgent and critical challenge. However, limitations in the production rate and universality of electrolytes have constrained biologists’ ability to study microbial adaptability to these conditions. In this study, S. cerevisiae was employed as a model organism to investigate the optimal conditions for its growth in electrolyte solution. A simulated nutritive electrolyte solution (EFS) was formulated based on the primary components of real nutritive formate electrolyte solution (REFS), enabling the exploration and improvement of microbial adaptability. Using biomass and FFAs production as key metrics, the optimal formate dehydrogenase was identified under simulated nutritive electrolyte (EFS) solution conditions to enhance the strain’s ability to utilize formate. Genetic engineering was further applied to significantly improve the strain’s resistance to the electrolyte solution. Finally, in the presence of 4 g/L formate in the real nutrient formate electrolyte, the biomass of strain YB061 increased by 41.9% compared with the parental strain YJZ45E, and utilization of the formate electrolyte resulted in a 92.8% increase in FFAs production. These findings provide novel insights and a new direction for research aimed at enhancing the compatibility between microorganisms and electrolytes solution. Nevertheless, challenges remain in scaling up this system, including limited yeast tolerance to high formate concentrations and potential mass transfer or redox constraints. Future efforts should focus on integrating CO2 electroreduction with microbial cultivation and optimizing strain robustness and process conditions for industrial application.

Author Contributions

Y.H.; Investigation, Formal analysis, Writing—original draft. Y.W.; Investigation, Formal analysis; T.M.; Formal analysis. S.S.; Writing—review and editing, Supervision. Z.W., C.S. and Y.F.; Writing—review and editing, Funding acquisition. F.Y.; Resources, Writing—review and editing. Z.L.; Conceptualization, Supervision, Project Administration, Funding Acquisition, Writing—Review and Editing. All authors have read and agreed to the published version of the manuscript.

Funding

The research was supported by the National Key Research and Development Program of China (no. 2024YFB4205900) and National Natural Science Foundation of China (no. 22211530047).

Institutional Review Board Statement

Not applicable.

Informed Consent Statement

Not applicable.

Data Availability Statement

Data are contained within the article and Appendix A and Appendix B.

Conflicts of Interest

The authors declare no conflicts of interest.

Appendix A

Table A1. S. cerevisiae strains used in this study.
StrainGenotype or CharacteristicResource
CEN.PK113-11CMATa MAL2-8c SUC2 his3Δ1 ura3-52Laboratory preservation
PDH2MATa MAL2-8c SUC2 URA3-52 HFDPOXFAAFAA
HIS3Δ, X-3::pPGK1-|p|A-tPMA1_pPGI1-IpIA2-tPYK1, XI-5::pTDH3-pdhB-tCYC1_pTEF1-Ipd-tADH1_pTPI1-pdhA-tTEF1_pADH1-aceF-tPGI1 (+pGapN)
Laboratory preservation [38]
YJZ45MATa MAL2-8c SUC2 URA3-52 hfd1Δ pox1Δ faa1Δ faa4Δ
HIS3Δ::HIS3 + (TPIp-MmACL-FBA1t) + (TDH3p-RtME-CYC1t) + (tHXT7p-’MDH3-TDH2t) + (PGK1p-CTP1-ADH1t) + (TEF1p-’tesA-HIS3t) URA3Δ::(TPIp-RtFAS1-FBA1t) + (TEF1p-RtFAS2-CYC1t) + amdSym
Laboratory preservation [36]
YJZ45EYJZ45 with pSP-GM2
YB01YJZ45 with pFDH1This study
YB02YJZ45 with pFDH2This study
YB03YJZ45 with pFDH3This study
YB04YJZ45 with pFDH4This study
YB05YJZ45 with pFDH5This study
YB06YJZ45 with pFDH6This study
YB07YJZ45 with pFDH7This study
YB08YJZ45 with pFDH8This study
YB09YJZ45 with pFDH9This study
YB10YJZ45 with pFDH10This study
YB11YJZ45 with pFDH11This study
YB12YJZ45 with pFDH12This study
YB13YJZ45 with pFDH13This study
YB34YJZ45 with pFDH34This study
YB35YJZ45 with pFDH35This study
YB45YJZ45 with pFDH45This study
YB001YJZ45-(TEF1p-FLO11)This study
YB002YJZ45-(TEF1p-SIP18)This study
YB003YJZ45-(TEF1p-SPS100)This study
YB004YJZ45-(TEF1p-GRE1)This study
YB061YJZ45-TEF1p-GRE1, TEF1p-FLO11
Table A2. Plasmids used in this study.
PlasmidsGenotype or CharacteristicResource
pSP-GM22 μm, AmpR, URA3, TEF1p, CYC1t, PGK1p, ADH1tLaboratory preservation
pCas-lacZ-SalI2μ ori, AmpR, SNR52p, lacZα, gRNA scaffold, ADH1t, CAS9Laboratory preservation
pST1-G-URA3pUC18 vector contains the gRNA scaffold, SNR52 promotor, URA3 gene and SNR52 terminatorLaboratory preservation
pFDH1pSP-GM2-(TEF1p-FDH1-CYC1t)Laboratory preservation
pFDH2pSP-GM2-(TEF1p-FDH2-CYC1t)Laboratory preservation
pFDH3pSP-GM2-(TEF1p-FDH3-CYC1t)Laboratory preservation
pFDH4pSP-GM2-(TEF1p-FDH4-CYC1t)Laboratory preservation
pFDH5pSP-GM2-(TEF1p-FDH5-CYC1t)Laboratory preservation
pFDH6pSP-GM2-(TEF1p-FDH6-CYC1t)Laboratory preservation
pFDH7pSP-GM2-(TEF1p-FDH7-CYC1t)Laboratory preservation
pFDH8pSP-GM2-(TEF1p-FDH8-CYC1t)Laboratory preservation
pFDH9pSP-GM2-(TEF1p-FDH9-CYC1t)Laboratory preservation
pFDH10pSP-GM2-(TEF1p-FDH10-CYC1t)Laboratory preservation
pFDH11pSP-GM2-(TEF1p-FDH11-CYC1t)Laboratory preservation
pFDH12pSP-GM2-(TEF1p-FDH12-CYC1t)Laboratory preservation
pFDH13pSP-GM2-(TEF1p-FDH13-CYC1t)Laboratory preservation
pFDH34pSP-GM2-(TEF1p-FDH3-CYC1t)- (PGK1p-FDH4-ADH1t)Laboratory preservation
pFDH35pSP-GM2-(TEF1p-FDH3-CYC1t)- (PGK1p-FDH5-ADH1t)Laboratory preservation
pFDH45pSP-GM2-(TEF1p-FDH4-CYC1t)- (PGK1p-FDH5-ADH1t)Laboratory preservation
pCas-sgRNA-FLO11Plasmid pCas-lacZ-SalI to over expression the gene FLO11This study
pCas-sgRNA-SIP18Plasmid pCas-lacZ-SalI to over expression the gene SIP18This study
pCas-sgRNA-SPS100Plasmid pCas-lacZ-SalI to over expression the gene SPS100This study
pCas-sgRNA-GRE1Plasmid pCas-lacZ-SalI to over expression the gene GRE1This study
Note: The bolded text in the table represents the names of the overexpressed genes.
Table A3. Primers used in this study.
Primer No.NameSequence (5′-3′)
P1FLO11-gRNA1-upAAAGGTCTCAGACTTTAGAACCACAACATGACGAGTTTTAGAGCTAGAAATAGCAAGTTAAAATAAGGCT
P2FLO11-gRNA2-upAAAGGTCTCACGCAATTAGAACCACAACATGACGGTTTTAGAGCTAGAAATAGCAAGTTAAAATAAGGCT
P3SIP18-gRNA1-upAAAGGTCTCAGATCATGATCATGAATACAGTACGGTTTTAGAGCTAGAAATAGCAAGTTAAAATAAGGCT
P4SIP18-gRNA2-upAAAGGTCTCACGCATGCCTAGGGACAAAACTTTGGTTTTAGAGCTAGAAATAGCAAGTTAAAATAAGGCT
P5SPS100-gRNA1-upAAAGGTCTCAGATCTATTTTCTGCTCATAAACCGGTTTTAGAGCTAGAAATAGCAAGTTAAAATAAGGCT
P6SPS100-gRNA2-upAAAGGTCTCACGCATCTTAGGGGAATTTTCAACAGTTTTAGAGCTAGAAATAGCAAGTTAAAATAAGGCT
P7GRE1-gRNA1-upAAAGGTCTCAGATCCCGTTACGTGCTTGTTAATCGTTTTAGAGCTAGAAATAGCAAGTTAAAATAAGGCT
P8GRE1-gRNA2-upAAAGGTCTCACGCAAGATATTAAGAGTTGAGGGTGTTTTAGAGCTAGAAATAGCAAGTTAAAATAAGGCT
P9gRNA1-downAAAGGTCTCATGCGCAAGCCCGGAATC
P10gRNA2-downAAAGGTCTCAAAACGACACAGGGTAATAACTGATATAATTAAATTGAAGCTC
P11FLO11-TEF1-UPCGGTATTAAACGTATAAAAAGCACCCTATTCATCAGTTATTATCCCCACACACCATAGCTTCA
P12FLO11-TEF1-DOWNCTTAGATTAGATTGCTATGCTTTCTTTCATGCAAAGACCATTTCTACTCGCTTATTTGGTCCTTTCGC
P13SIP18-TEF1-UPCGGTATATAAACGTATCTTAAAGGGAGCGGTATGTAAAATGGATAGCCACACACCATAGCTTCA
P14SIP18-TEF1-DOWNCTTAGATTAGATTGCTATGCTTTCTTTCATGTCTAACATGATGAATAAGTTCGCTGAAAAATTACAAG
P15SPS100-TEF1-UPCGGTATAGTTCTTGGCTTAGCAATTACATTTAACGCTGATGATCCTCCACACACCATAGCTTCA
P16SPS100-TEF1-DOWNCTTAGATTAGATTGCTATGCTTTCTTTCATGAAATTCACATCAGTGCTAGCATTTTTTCTTGCAACTT
P17GRE1-TEF1-UPCGGTATGGGAAATGGTTAGAAAAGACCGAAATCCTTTTTTTGGTCTCCACACACCATAGCTTCA
P18GRE1-TEF1-DOWNCTTAGATTAGATTGCTATGCTTTCTTTCATGTCCA
ATCTATTAAACAAGTTTGCTGATAAGTTGCACG
P19qACT1-FTCGTTCCAATTTACGCTGGTT
P20qACT1-RCGGCCAAATCGATTCTCAA
P21qGRE1-FGACCAGACTAGACAACAGCGT
P22qGRE1-RCTGGAAGTCGTTACCGCCA
P23qSIP18-FCATCAGAAGGGAAAGAACGCC
P24qSIP18-RCGTAAGTCTTCCAATCGTTCGC
P25qSPS100-FCTTTGAGTTTCTTCTGCTCAATCGT
P26qSPS100-RAGTGTAAGGAGGGAAAACACC
Table A4. Medium and its composition table.
Name of MediumMedium ComponentsPurpose
LB medium5 g/L yeast extract; 10 g/L peptone; 10 g/L NaCl; Add 100 mg/L ampicillin when necessary.Cultivate E. coli
YPD medium10 g/L yeast extract, 20 g/L peptone and 20 g/L glucose.Cultivate S. cerevisiae
SC-Ura medium5 g/L (NH4)2SO4, 1.7 g/L YNB (without amino acids), 1.914 g/L amino acid mixture without uracil, 20 g/L glucose, with the pH adjusted to 6 using NaOH.Cultivate S. cerevisiae strains harboring the plasmid with URA3
SC-5-FOA solid medium6.7 g/L YNB, 0.77g /L amino acid mixture and 0.8 g/L 5-fluoroacetic acid, 20 g/L AGAR.It was used to screen S. cerevisiae cells that had lost the URA3 plasmid.
Delft medium5 g/L (NH4)2SO4, 3 g/L KH2PO4, 0.5 g/L MgSO4·7H2O, 20 g/L glucose, a trace metal mixture, and a vitamin solution.Cultivate S. cerevisiae
Formate -Containing electrolyte solutionElectrolyte salt solution + FormateThe composition of conventional formate electrolyte
Simulated nutritive electrolyte 1(E1)1 M KCl + Delft medium (containing 2% glucose)Determine the suitable electrolyte
salt for the electrochemical-biological coupling system
Simulated nutritive electrolyte2(E2)0.5 M K2SO4 + Delft medium (containing 2% glucose)
Simulated nutritive electrolyte 3(E3)1 M KH2PO4 + Delft medium (containing 2% glucose)
Simulated nutritive formate electrolyte solution 0.5 M K2SO4 + Formate + Delft medium (containing 2% glucose)
Real nutritive formate electrolyte solution0.5 M K2SO4 + Formate + Delft medium + possibly trace amounts of metal electrode dissolution or detergent residuesEvaluation of the adaptation capability of the engineered strain YB061 to the electrolyte.
Table A5. Formulation of Trace Element Mixture Solution.
ReagentMother Liquor ConcentrationReagent
FeSO4·7H2O3 g/LFeSO4·7H2O
ZnSO4·7H2O4.5 g/LZnSO4·7H2O
CaCl2·2H2O4.5 g/LCaCl2·2H2O
MnCl2·4H2O1 g/LMnCl2·4H2O
CoCl2·6H2O300 mg/LCoCl2·6H2O
CuSO4·5H2O300 mg/LCuSO4·5H2O
NaMoO4·2H2O300 mg/LNaMoO4·2H2O
H3BO4300 mg/LH3BO4
KI300 mg/LKI
Na2EDTA·2H2O300 mg/LNa2EDTA·2H2O
Table A6. Vitamin Stock Solution Formulation.
ReagentConcentration
Biotin50 mg/L
D-Calcium Pantothenate1 g/L
Thiamine HCl1 g/L
Pyridoxine hydrochloride1 g/L
4-aminobenzoic acid0.2 g/L
Nicotinic aci1 g/L
Inositol25 g/L
Adjust the pH to 6.5 with 1 M NaOH solution, dilute to 1 L, and filter to remove bacteria.
Table A7. Summary of 13 engineered formate dehydrogenases (FDHs) and their sequence sources.
Sequential Number of Tested FDHsOriginAccession Number (NCBI)Position of MutationReference
FDH1Lentilactobacillus buchneriWP_013726924.1None[29]
FDH2Mycolicibacterium vaccaeAAB36206.10_insert_M; C146S; A198G; D221Q; C256V[29]
FDH3[Candida] boidiniiO13437None[29]
FDH4Pseudomonas sp. 1012GUG_A (corresponds to WP_029354581.1 cluster)X335C[29]
FDH5Pseudomonas sp. 1012GUG_A (corresponds to WP_029354581.1 cluster)D222S; H224N; X335C[29]
FDH6Pseudomonas sp. 1012GUG_A (corresponds to WP_029354581.1 cluster)D222S; X335C[29]
FDH7Pseudomonas sp. 101PDB: 2GUG_A (corresponds to WP_029354581.1 cluster)D222A; H224N; X335C[29]
FDH8Pseudomonas sp. 1012GUG_A (corresponds to WP_029354581.1 cluster)D222A; X335C[29]
FDH9Pseudomonas sp. 1012GUG_A (corresponds to WP_029354581.1 cluster)D222Q; H224N; X335C[29]
FDH10Pseudomonas sp. 1012GUG_A (corresponds to WP_029354581.1 cluster)D222Q; X335C[29]
FDH11[Candida] boidiniiO13437 D195Q; Y196R; Q197N[29]
FDH12Arabidopsis thalianaNP_196982.1None[29]
FDH13[Candida] boidiniiO13437D227Q; L229H[29]
Table A8. Summary of four genes and their sources.
GeneOrganismGene ID (NCBI)
FLO11S. cerevisiae S288C854836
SIP18S. cerevisiae S288C855213
SPS100S. cerevisiae S288C856541
GRE1S. cerevisiae S288C855878

Appendix B

Figure A1. Feasibility assessment of Simulated nutritive formate electrolyte solution (EFS03) versus the Real nutritive formate electrolyte solution (REFS03). The control group consisted of Delft medium supplemented with 3 g/L formate at initial pH = 5. The simulated nutritive electrolytes solution was prepared with Delft medium, 0.5 M K2SO4, and 3 g/L formate. The Real nutritive formate electrolyte solution (REFS03) was produced by electrolysis using 0.5 M K2SO4 to generate 3 g/L formate, followed by supplementation with Delft medium. Each experiment was performed with three biological replicates, and data are presented as mean ± standard deviation (SD), with error bars indicating SD.
Fermentation 11 00664 g0a1
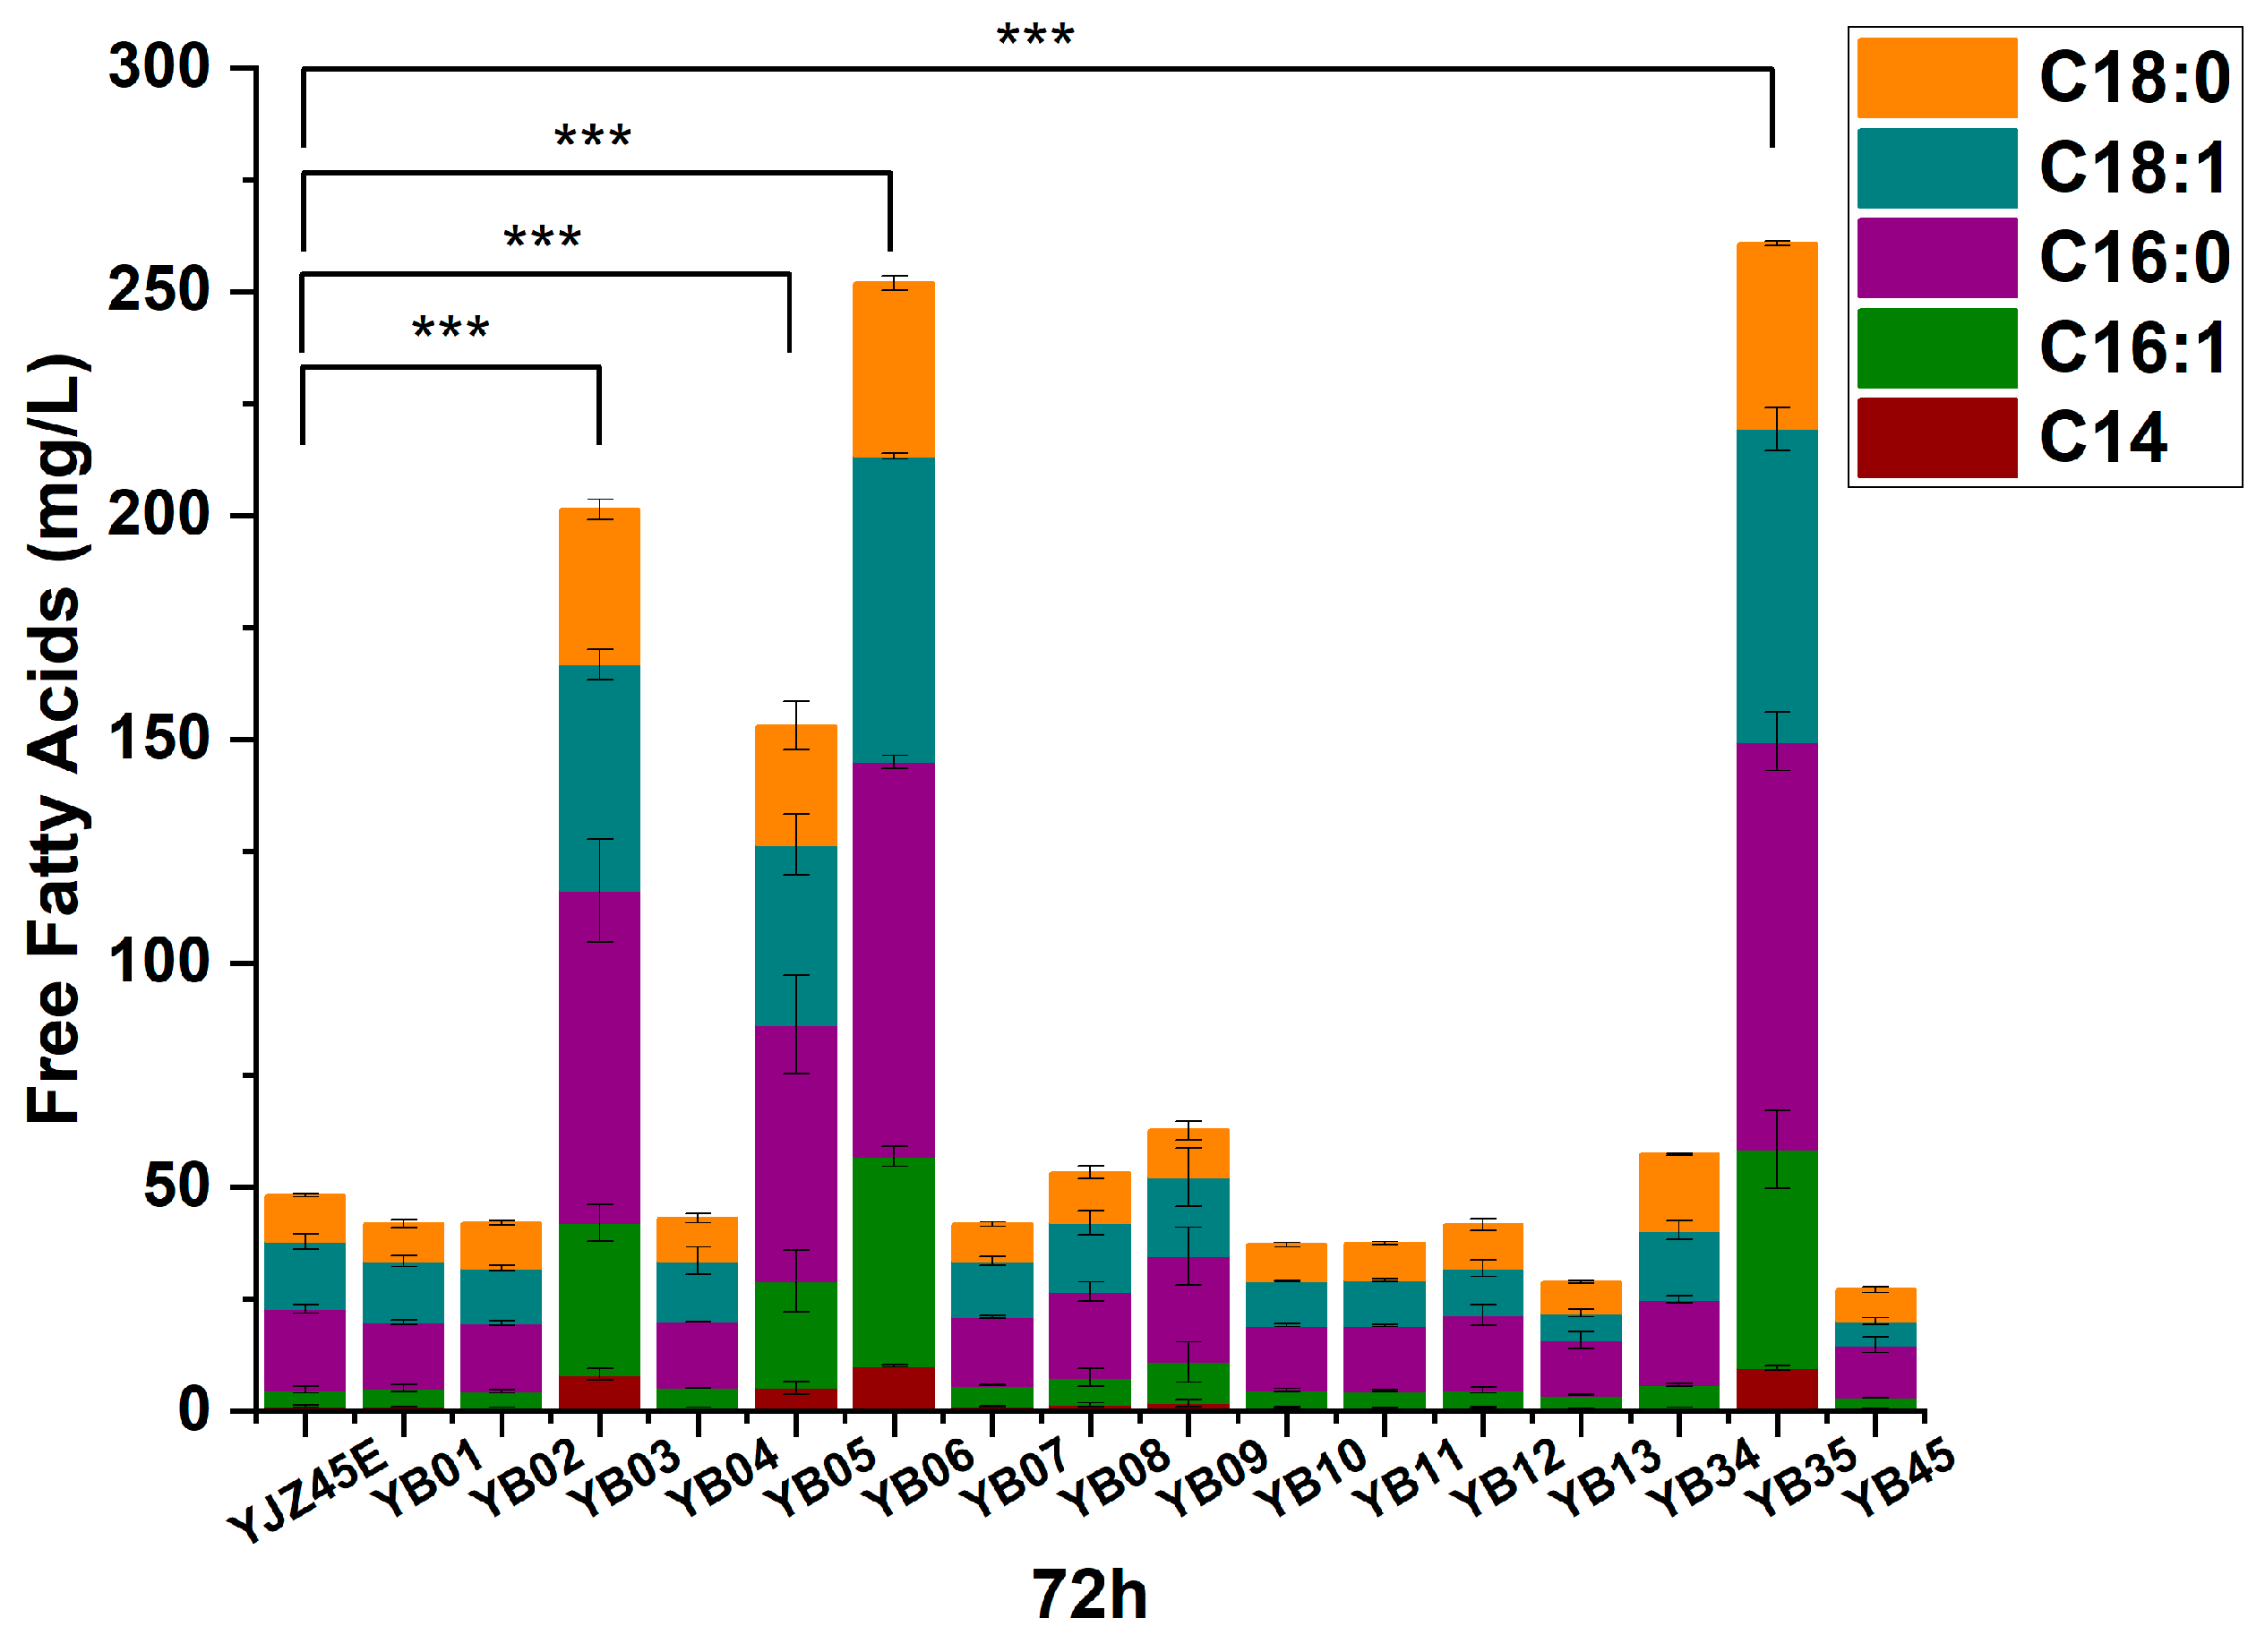
Figure A2. FFAs production at 72 h by the control strain and the 16 overexpression strains. Each experiment was performed with three biological replicates, and data are presented as mean ± standard deviation (SD), with error bars indicating SD. with error bars indicating SD. Statistical significance was assessed using the t-test: p < 0.001 is indicated by by ***.
Fermentation 11 00664 g0a2
Figure A3. Extracellular metabolite profiles at 72 h for the control and overexpression strains. Each experiment was performed with three biological replicates, and data are presented as mean ± standard deviation (SD), with error bars indicating SD.
Fermentation 11 00664 g0a3
Figure A4. Extracellular metabolite profiles at 96 h for the control and overexpression strains. Each experiment was performed with three biological replicates, and data are presented as mean ± standard deviation (SD), with error bars indicating SD.
Fermentation 11 00664 g0a4
To address the concern regarding molecular characterization, we conducted comprehensive RT-qPCR analyses to confirm the successful overexpression of the engineered genes.
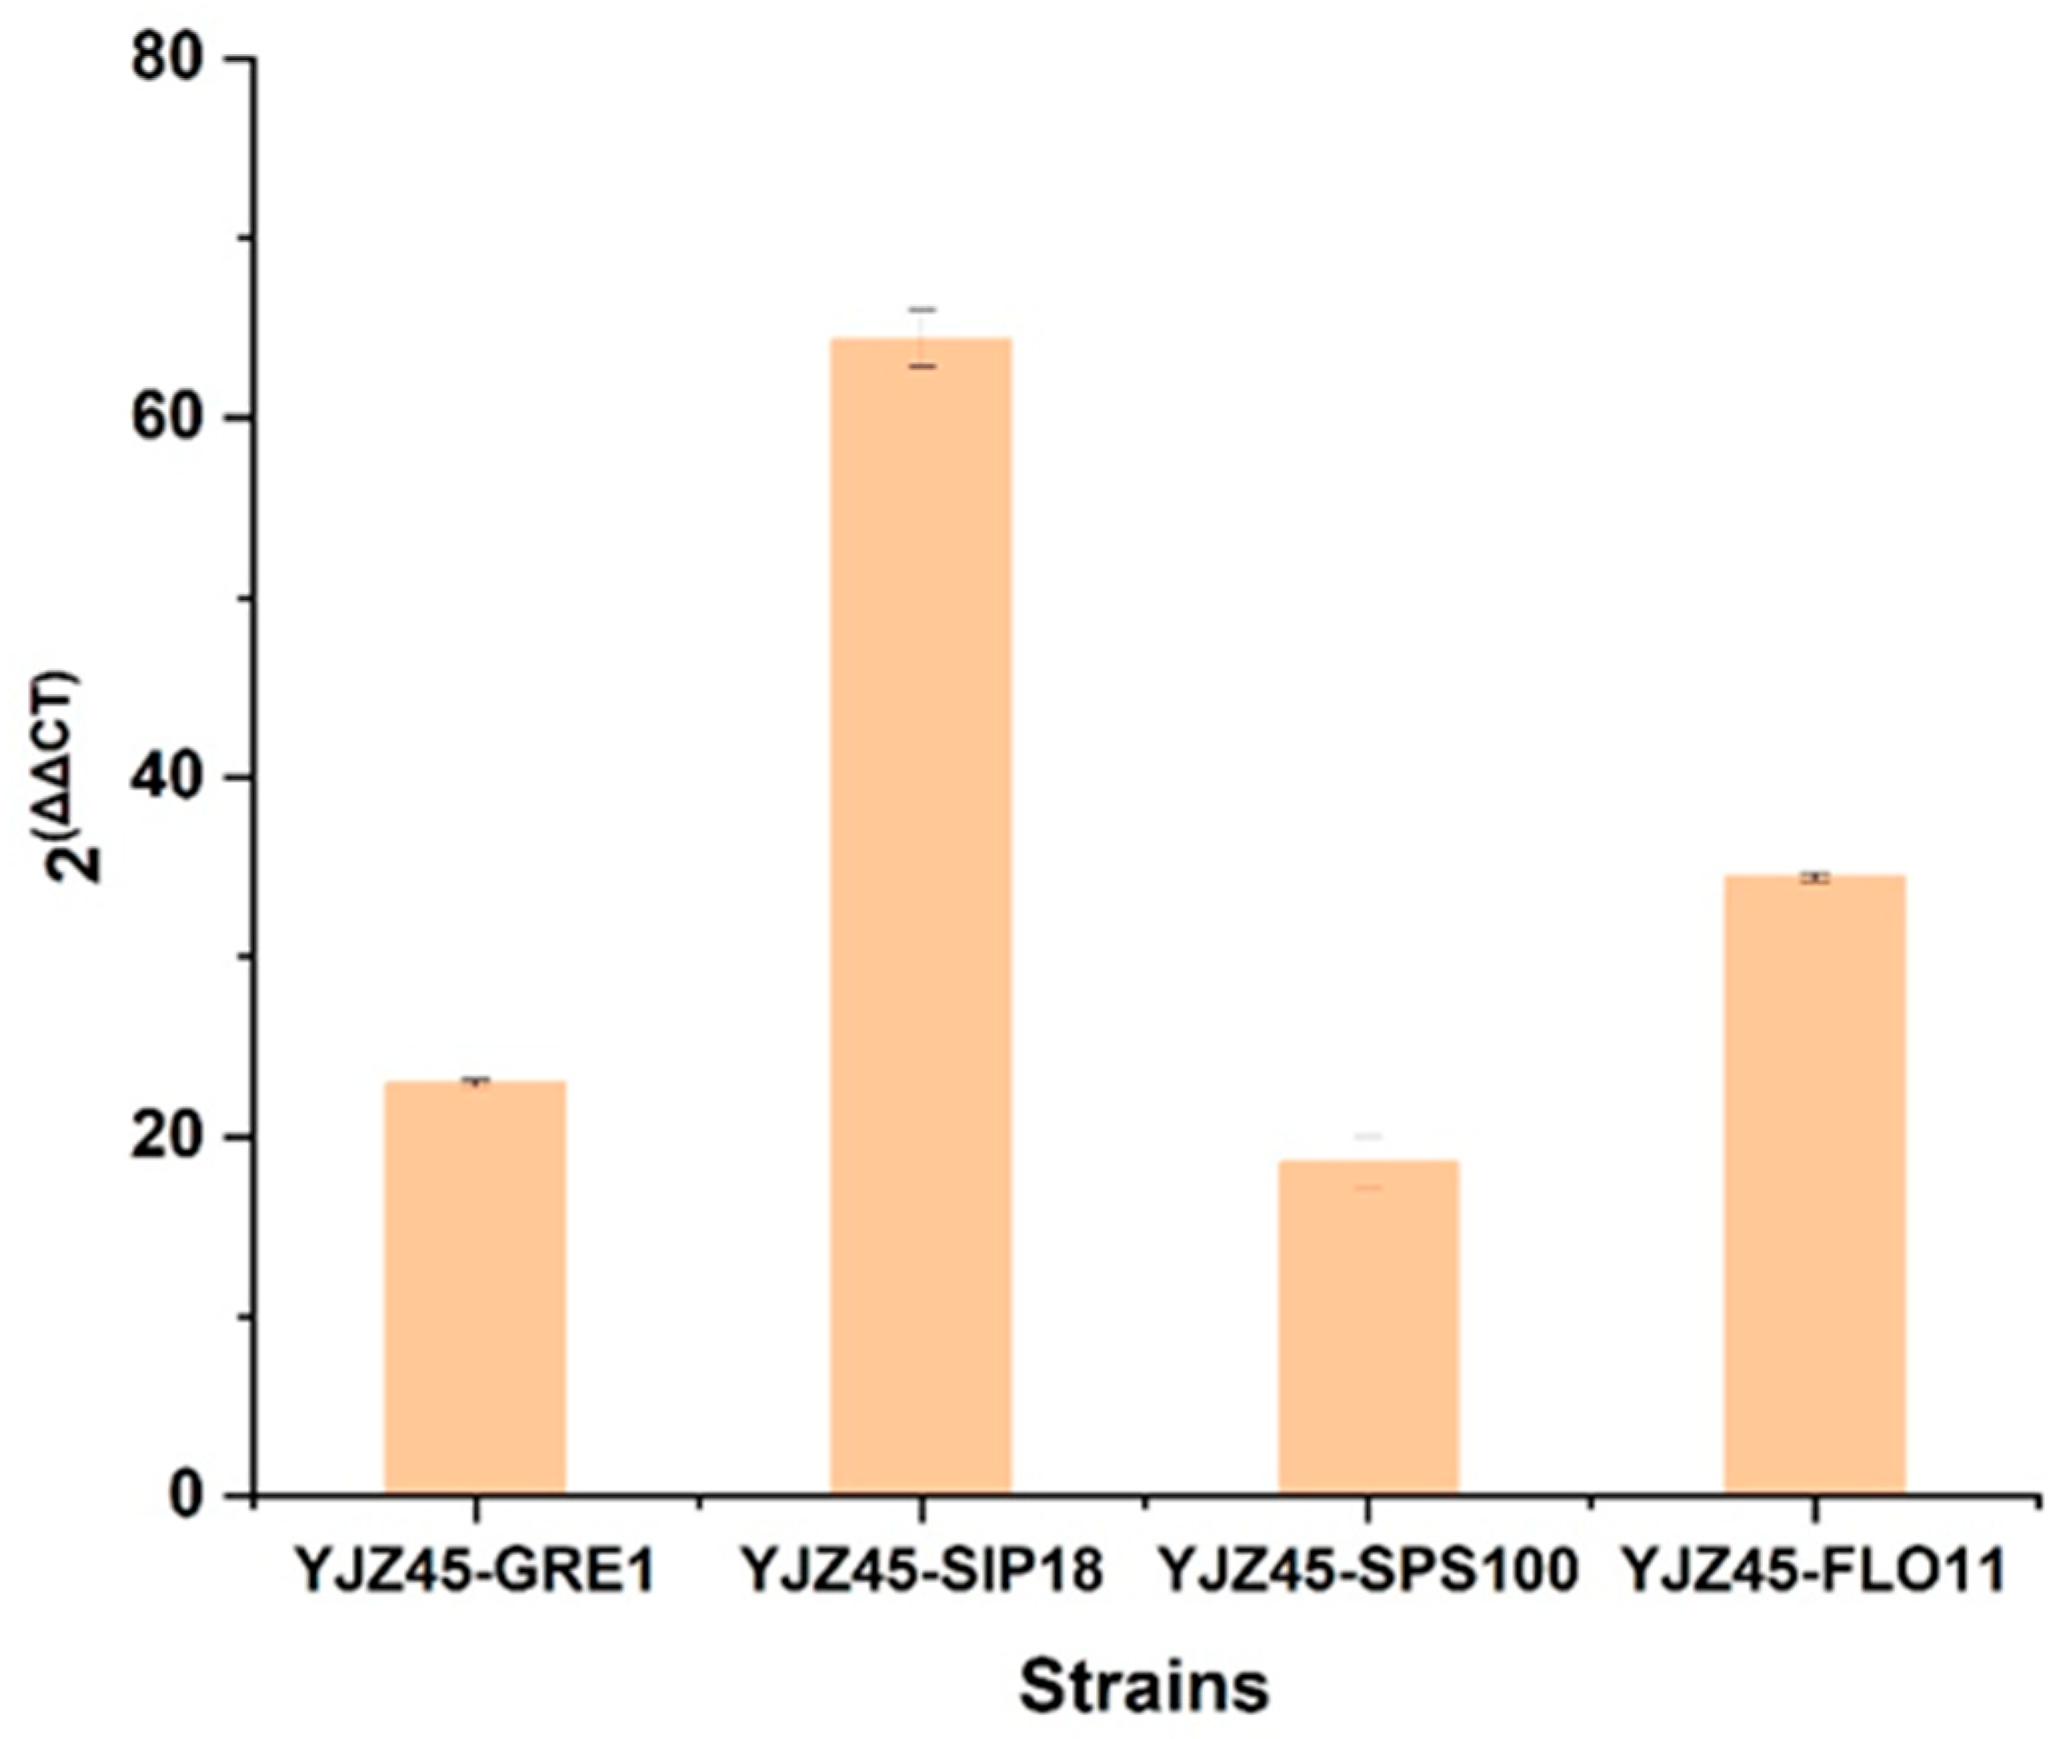
First, for strain YJZ45 and its overexpression derivatives, we performed RT-qPCR using ACT1 as the reference gene and YJZ45 as the control strain. As shown in Figure A5, the transcript levels of GRE1 (2−ΔΔCt = 22.95), SIP18 (2−ΔΔCt = 64.4), SPS100 (2−ΔΔCt = 18.55), and FLO11 (2−ΔΔCt = 34.43) were all markedly elevated, confirming that each target gene was successfully overexpressed YJZ45-derived single-gene overexpression strains.
Figure A5. RT-qPCR analysis of GRE1, FLO11, SIP18, and SPS100 in YJZ45-derived single-gene overexpression strains. using ACT1 as the reference gene and YJZ45 as the control strain. Each experiment was performed with three biological replicates, and data are presented as mean ± standard deviation (SD), with error bars indicating SD.
Fermentation 11 00664 g0a5
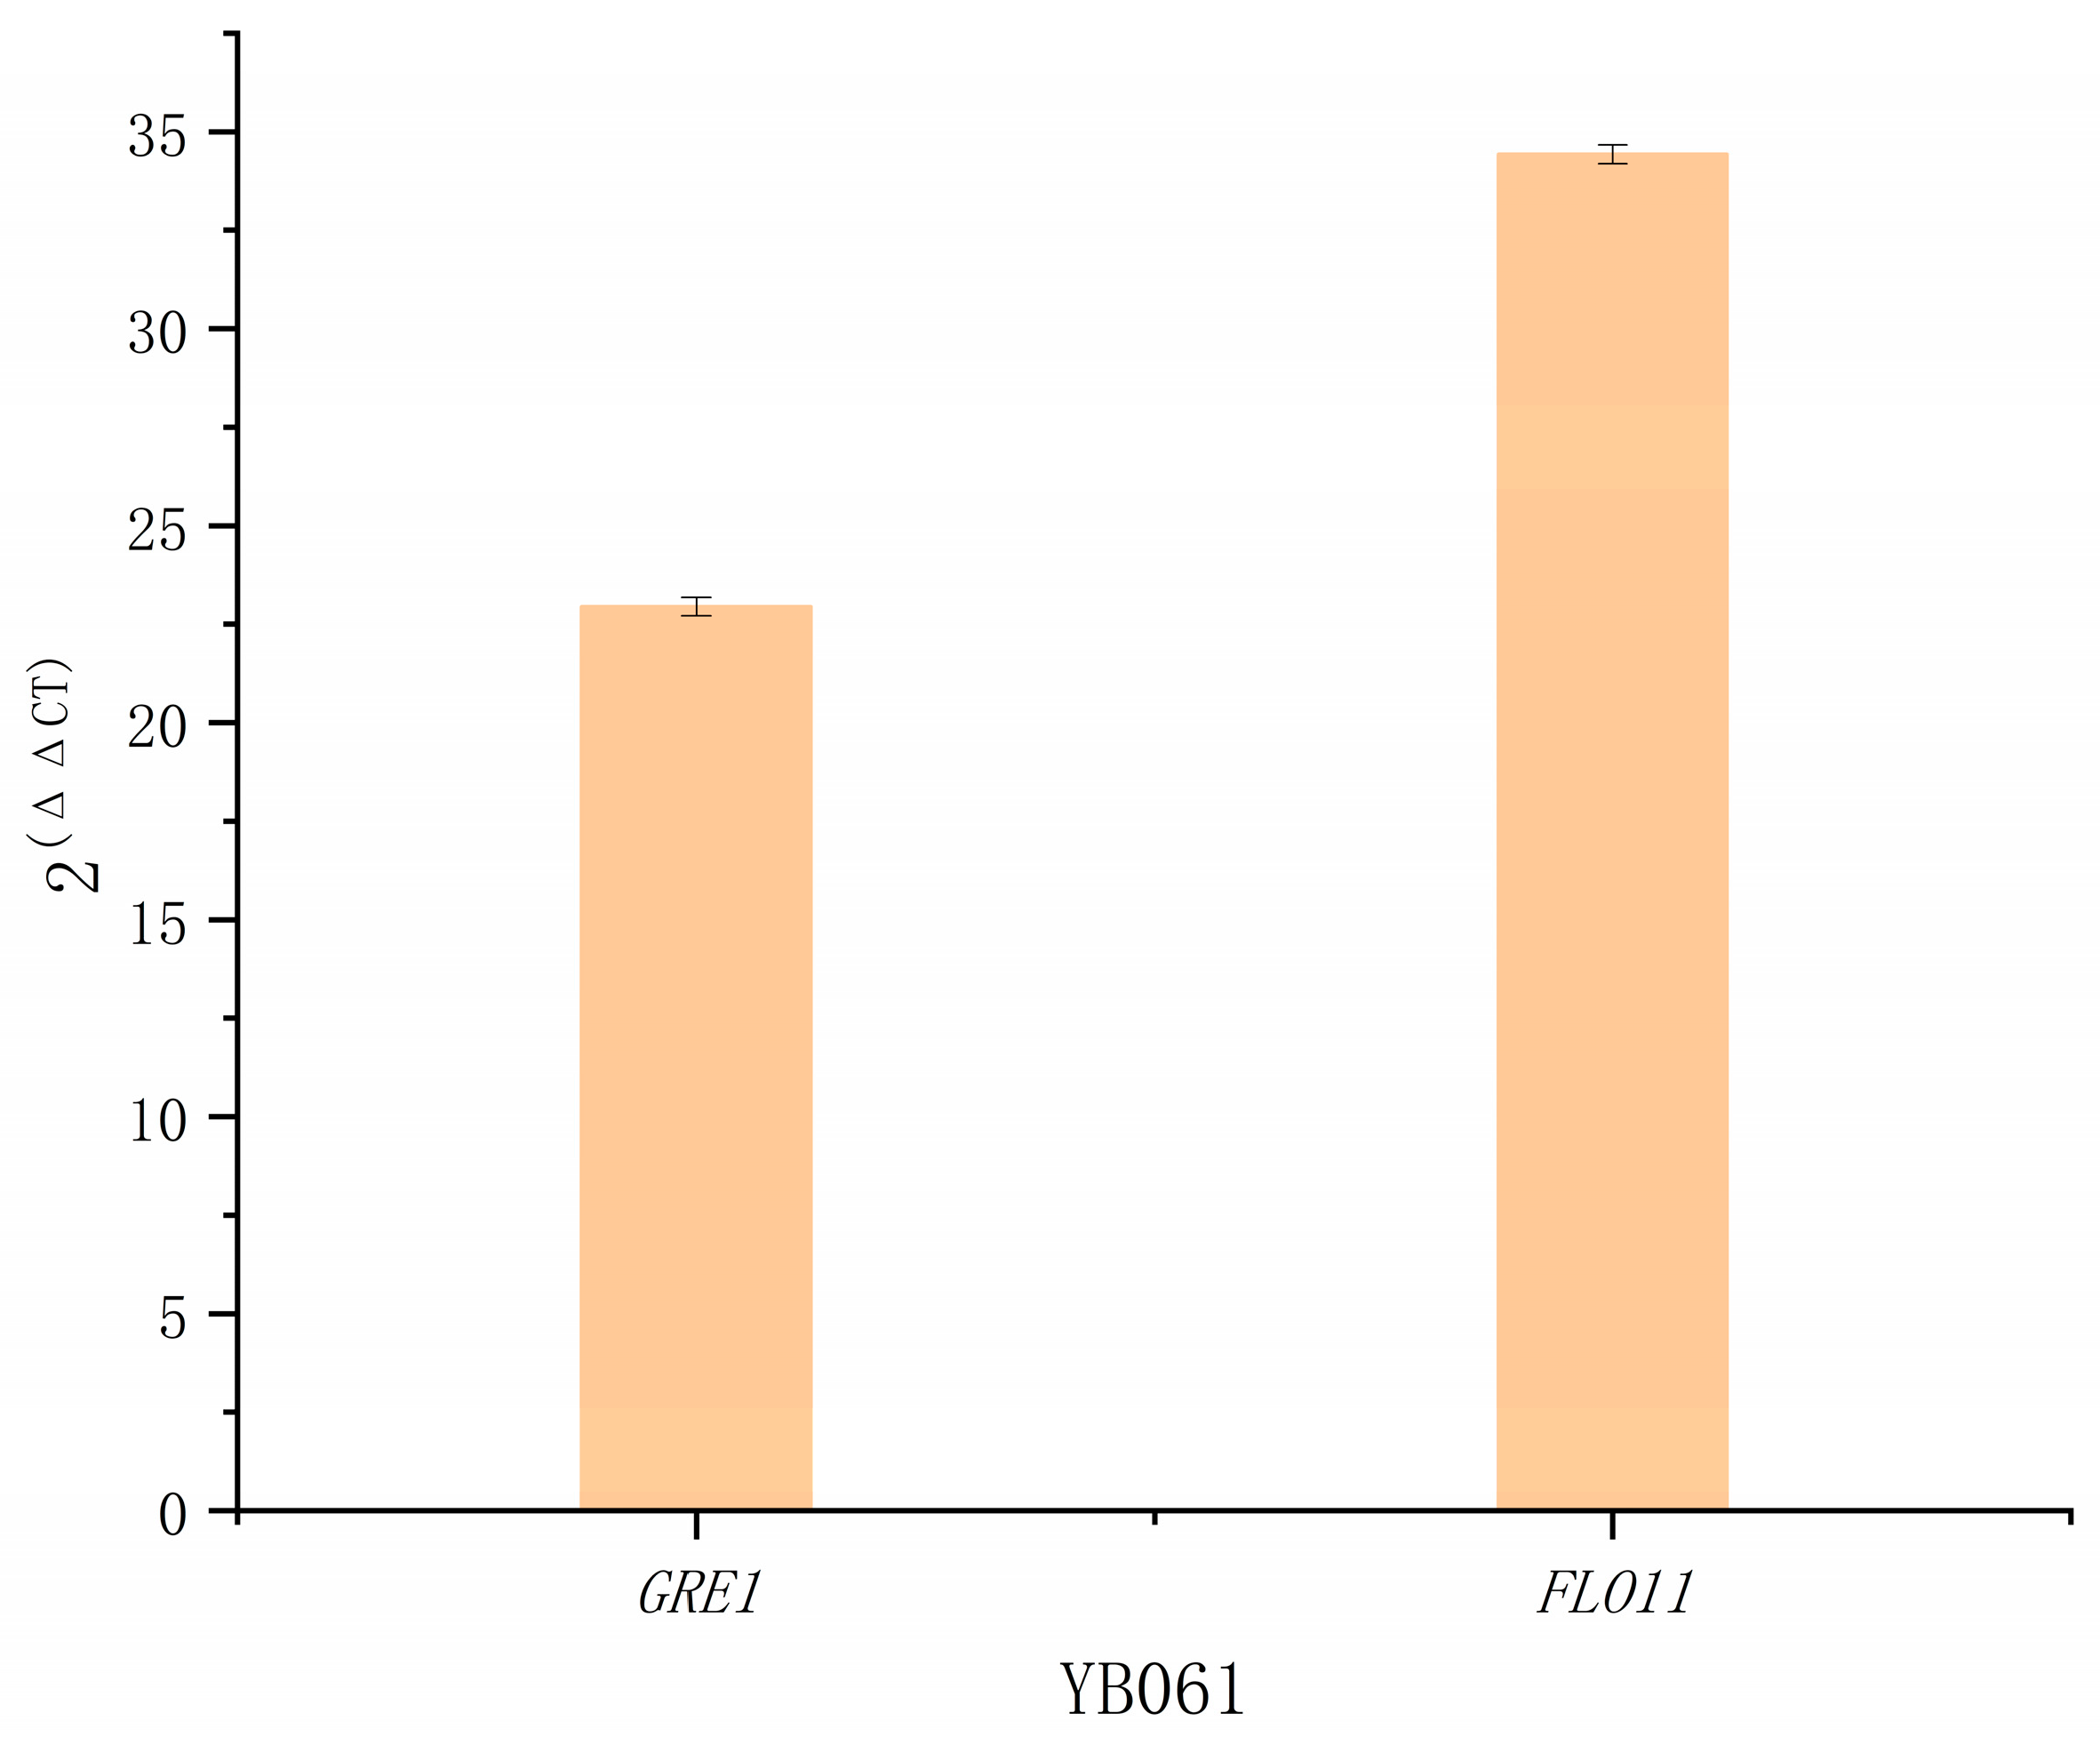
Subsequently, using YB06 as the control strain and ACT1 as the reference gene, we conducted RT-qPCR for the engineered strain YB061, which simultaneously overexpresses GRE1 and FLO11. As presented in Figure A6, the transcript levels of GRE1 (2−ΔΔCt = 22.95) and FLO11 (2−ΔΔCt = 34.43) were significantly increased, demonstrating successful co-overexpression of both genes in YB061.
Figure A6. RT-qPCR analysis of GRE1 and FLO11 expression in YB061, using ACT1 as the reference gene and YJZ45 as the control strain. Each experiment was performed with three biological replicates, and data are presented as mean ± standard deviation (SD), with error bars indicating SD.
Fermentation 11 00664 g0a6
These RT-qPCR data provide solid molecular evidence supporting the correct genetic modifications and confirm the overexpression of GRE1, FLO11, and related stress-response genes. These results validate the reliability of the engineering strategy and substantiate that overexpression of GRE1 and FLO11 contributes to the enhanced growth and free fatty acid production observed in the modified strains.
Figure A7. Growth profiles of the control strain YJZ45E cultivated in different media with or without formate supplementation. Each experiment was performed with three biological replicates, and data are presented as mean ± standard deviation (SD), with error bars indicating SD.
Fermentation 11 00664 g0a7
Figure A8. FFAs production of YJZ45E after 96 h cultivation under different medium conditions. Each experiment was performed with three biological replicates, and data are presented as mean ± standard deviation (SD), with error bars indicating SD. with error bars indicating SD. Statistical significance was assessed using the t-test: p < 0.05 is indicated by *, and p < 0.001 by ***. “ns” stands for “not statistically significant”.
Fermentation 11 00664 g0a8

Appendix B.1. Osmotic Pressure Calculation of Electrolyte Salts

To evaluate the possible osmotic pressure effect of different potassium salts, the theoretical osmotic pressure (π) at 30 °C (303 K) was calculated using the van’t Hoff equation:
π = iMRT
where π is the osmotic pressure (atm), i is the van’t Hoff factor, M is the molar concentration (mol/L), R = 0.08206 L·atm·mol−1·K−1, and T = 303 K.
Table A9. Theoretical osmotic pressure of different potassium salts calculated by the van’t Hoff equation.
Electrolyte SaltConcentration M (mol/L)iπ = iMRT (atm)
0.5 M K2SO40.533 × 0.5 × 0.08206 × 303 ≈ 37.2 atm
1 M KH2PO41.022 × 1 × 0.08206 × 303 ≈ 49.7 atm
1 M KCl1.022 × 1 × 0.08206 × 303 ≈ 49.7 atm
Note: The osmotic pressure of the three salts ranged from approximately 37 to 50 atm. The 0.5 M K2SO4 system exhibited the lowest osmotic pressure, consistent with experimental results showing better cellular stability and product formation.

Appendix B.2. Calculation of Key Performance Metrics for the Engineered Strains

Table A10. Summary of performance parameters for engineered yeast strains.
Condition of CultureSimulated Electrolyte with 3 g/L Formic AcidSimulated Electrolyte with 4 g/L Formic Acid4 g/L Formic Acid Real Electrolyte
StrainYJZ45EYB06YB061YB061YJZ45EYB06YB061
Initial OD6000.10.10.10.10.10.10.1
Final OD600 (96 h)5.589.59.15.56.97.8
Average biomass per liter(g/L)2.3723.413.9664.1782.162.7133.267
Dry cell weight(g/L)3.785.536.585.43.784.765.39
96 h free fatty acid production (mg/L)362605720835338507652
g FFAs/g glucose0.01810.03030.0360.041750.01690.025350.0326
g FFAs/g biomass0.09580.10940.10940.15460.08940.10650.121
Volumetric Productivity (mg/L/h) of FFAs3.776.3027.58.6973.525.9379.791
Specific Productivity (g/g biomass/h) of FFAs0.001590.00180.001890.0020810.00160.001950.00208
Yield of Product on Biomass (Yp/x) (g FFAs/g biomass)0.067030.07660.076590.092770.06260.074550.08467
Specific Growth Rate (μ) (h−1)0.0920.10080.105510.110.06240.0664 0.069
Average Growth Rate (g/L/h)0.03940.0590.06850.06560.03870.0490.0547

References

  1. Pastor, A.V.; Palazzo, A.; Havlik, P.; Biemans, H.; Wada, Y.; Obersteiner, M.; Kabat, P.; Ludwig, F. The global nexus of food–trade–water sustaining environmental flows by 2050. Nat. Sustain. 2019, 2, 499–507. [Google Scholar] [CrossRef]
  2. Achakulwisut, P.; Erickson, P.; Guivarch, C.; Schaeffer, R.; Brutschin, E.; Pye, S. Global fossil fuel reduction pathways under different climate mitigation strategies and ambitions. Nat. Commun. 2023, 14, 5425. [Google Scholar] [CrossRef]
  3. Liu, Z.; Wang, K.; Chen, Y.; Tan, T.; Nielsen, J. Third-generation biorefineries as the means to produce fuels and chemicals from CO2. Nat. Catal. 2020, 3, 274–288. [Google Scholar] [CrossRef]
  4. Han, X.; Zhou, G.; Luo, Q.; Ferlian, O.; Zhou, L.; Meng, J.; Qi, Y.; Pei, J.; He, Y.; Liu, R.; et al. Plant biomass responses to elevated CO2 are mediated by phosphorus uptake. Sci. Total Environ. 2023, 863, 160775. [Google Scholar] [CrossRef] [PubMed]
  5. Jiang, M.; Crous, K.Y.; Carrillo, Y.; Macdonald, C.A.; Anderson, I.C.; Boer, M.M.; Farrell, M.; Gherlenda, A.N.; Castañeda-Gómez, L.; Hasegawa, S.; et al. Microbial competition for phosphorus limits the CO2 response of a mature forest. Nature 2024, 630, 660–665. [Google Scholar] [CrossRef] [PubMed]
  6. Ye, R.-P.; Ding, J.; Gong, W.; Argyle, M.D.; Zhong, Q.; Wang, Y.; Russell, C.K.; Xu, Z.; Russell, A.G.; Li, Q.; et al. CO2 hydrogenation to high-value products via heterogeneous catalysis. Nat. Commun. 2019, 10, 5698. [Google Scholar] [CrossRef]
  7. Fang, S.; Rahaman, M.; Bharti, J.; Reisner, E.; Robert, M.; Ozin, G.A.; Hu, Y.H. Photocatalytic CO2 reduction. Nat. Rev. Methods Primers 2023, 3, 61. [Google Scholar] [CrossRef]
  8. Birdja, Y.Y.; Pérez-Gallent, E.; Figueiredo, M.C.; Göttle, A.J.; Calle-Vallejo, F.; Koper, M.T.M. Advances and challenges in understanding the electrocatalytic conversion of carbon dioxide to fuels. Nat. Energy 2019, 4, 732–745. [Google Scholar] [CrossRef]
  9. Kibria Nabil, S.; McCoy, S.; Kibria, M.G. Comparative life cycle assessment of electrochemical upgrading of CO2 to fuels and feedstocks. Green Chem. 2021, 23, 867–880. [Google Scholar] [CrossRef]
  10. Liu, G.; Zhong, Y.; Liu, Z.; Wang, G.; Gao, F.; Zhang, C.; Wang, Y.; Zhang, H.; Ma, J.; Hu, Y.; et al. Solar-driven sugar production directly from CO2 via a customizable electrocatalytic–biocatalytic flow system. Nat. Commun. 2024, 15, 2636. [Google Scholar] [CrossRef]
  11. Wissink, T.; Rollier, F.A.; Muravev, V.; Heinrichs, J.M.J.J.; van de Poll, R.C.J.; Zhu, J.; Anastasiadou, D.; Kosinov, N.; Figueiredo, M.C.; Hensen, E.J.M. Ce Promotion of In2O3 for Electrochemical Reduction of CO2 to Formate. ACS Catal. 2024, 14, 16589–16604. [Google Scholar] [CrossRef]
  12. Li, B.; Chen, J.; Wang, L.; Xia, D.; Mao, S.; Xi, L.; Liu, H.; Ying, S.; Wang, Y. High-Performance Bi-Based Catalysts for CO2 Reduction: In Situ Formation of Bi/Bi2O2CO3 and Enhanced Formate Production. Adv. Sci. 2025, 12, e2415616. [Google Scholar] [CrossRef]
  13. Zhang, G.; Wang, T.; Zhang, M.; Li, L.; Cheng, D.; Zhen, S.; Wang, Y.; Qin, J.; Zhao, Z.J.; Gong, J. Selective CO2 electroreduction to methanol via enhanced oxygen bonding. Nat. Commun. 2022, 13, 7768. [Google Scholar] [CrossRef] [PubMed]
  14. Cheon, S.; Li, J.; Wang, H. In Situ Generated CO Enables High-Current CO2 Reduction to Methanol in a Molecular Catalyst Layer. J. Am. Chem. Soc. 2024, 146, 16348–16354. [Google Scholar] [CrossRef]
  15. Zhou, X.; Shan, J.; Chen, L.; Xia, B.Y.; Ling, T.; Duan, J.; Jiao, Y.; Zheng, Y.; Qiao, S.Z. Stabilizing Cu2+ Ions by Solid Solutions to Promote CO2 Electroreduction to Methane. J. Am. Chem. Soc. 2022, 144, 2079–2084. [Google Scholar] [CrossRef]
  16. Xu, Z.; Lu, R.; Lin, Z.-Y.; Wu, W.; Tsai, H.-J.; Lu, Q.; Li, Y.C.; Hung, S.-F.; Song, C.; Yu, J.C.; et al. Electroreduction of CO2 to methane with triazole molecular catalysts. Nat. Energy 2024, 9, 1397–1406. [Google Scholar] [CrossRef]
  17. Seong, H.; Jo, Y.; Efremov, V.; Kim, Y.; Park, S.; Han, S.M.; Chang, K.; Park, J.; Choi, W.; Kim, W.; et al. Transplanting Gold Active Sites into Non-Precious-Metal Nanoclusters for Efficient CO2-to-CO Electroreduction. J. Am. Chem. Soc. 2023, 145, 2152–2160. [Google Scholar] [CrossRef] [PubMed]
  18. Zeng, Q.; Tian, S.; Liu, H.; Xu, L.; Cui, P.; Chen, D.; Wang, J.; Yang, J. Fine AgPd Nanoalloys Achieving Size and Ensemble Synergy for High-Efficiency CO2 to CO Electroreduction. Adv. Funct. Mater. 2023, 33, 2307444. [Google Scholar] [CrossRef]
  19. Jin, J.; Wicks, J.; Min, Q.; Li, J.; Hu, Y.; Ma, J.; Wang, Y.; Jiang, Z.; Xu, Y.; Lu, R.; et al. Constrained C2 adsorbate orientation enables CO-to-acetate electroreduction. Nature 2023, 617, 724–729. [Google Scholar] [CrossRef]
  20. Wang, H.; Sui, H.; Ding, Y.; Yang, Y.; Su, Y.; Li, H. Tailoring CO2 Adsorption Configuration with Spatial Confinement Switches Electroreduction Product from Formate to Acetate. J. Am. Chem. Soc. 2025, 147, 6095–6107. [Google Scholar] [CrossRef] [PubMed]
  21. Zhang, L.; Zhao, Z.J.; Gong, J. Nanostructured Materials for Heterogeneous Electrocatalytic CO2 Reduction and their Related Reaction Mechanisms. Angew. Chem. Int. Ed. 2017, 56, 11326–11353. [Google Scholar] [CrossRef] [PubMed]
  22. Garg, S.; Li, M.; Weber, A.Z.; Ge, L.; Li, L.; Rudolph, V.; Wang, G.; Rufford, T.E. Advances and challenges in electrochemical CO2 reduction processes: An engineering and design perspective looking beyond new catalyst materials. J. Mater. Chem. A 2020, 8, 1511–1544. [Google Scholar] [CrossRef]
  23. Yang, L.; Pawar, A.U.; Sivasankaran, R.P.; Lee, D.; Ye, J.; Xiong, Y.; Zou, Z.; Zhou, Y.; Kang, Y.S. Intermediates and their conversion into highly selective multicarbons in photo/electrocatalytic CO2 reduction reactions. J. Mater. Chem. A 2023, 11, 19172–19194. [Google Scholar] [CrossRef]
  24. Hu, G.; Li, Z.; Ma, D.; Ye, C.; Zhang, L.; Gao, C.; Liu, L.; Chen, X. Light-driven CO2 sequestration in Escherichia coli to achieve theoretical yield of chemicals. Nat. Catal. 2021, 4, 395–406. [Google Scholar] [CrossRef]
  25. Schmitz, L.M.; Kreitli, N.; Obermaier, L.; Weber, N.; Rychlik, M.; Angenent, L.T. Power-to-vitamins: Producing folate (vitamin B9) from renewable electric power and CO2 with a microbial protein system. Trends Biotechnol. 2024, 42, 1691–1714. [Google Scholar] [CrossRef]
  26. Bi, H.; Wang, K.; Xu, C.; Wang, M.; Chen, B.; Fang, Y.; Tan, X.; Zeng, J.; Tan, T. Biofuel synthesis from carbon dioxide via a bio-electrocatalysis system. Chem. Catal. 2023, 3, 100557. [Google Scholar] [CrossRef]
  27. Du, C.; Li, Y.; Xiang, R.; Yuan, W. Formate Dehydrogenase Improves the Resistance to Formic Acid and Acetic Acid Simultaneously in Saccharomyces cerevisiae. Int. J. Mol. Sci. 2022, 23, 3406. [Google Scholar] [CrossRef]
  28. Cotton, C.A.R.; Claassens, N.J.; Benito-Vaquerizo, S.; Bar-Even, A. Renewable methanol and formate as microbial feedstocks. Curr. Opin. Biotechnol. 2020, 62, 168–180. [Google Scholar] [CrossRef]
  29. Wang, K.; Da, Y.; Bi, H.; Liu, Y.; Chen, B.; Wang, M.; Liu, Z.; Nielsen, J.; Tan, T. A one-carbon chemicals conversion strategy to produce precursor of biofuels with Saccharomyces cerevisiae. Renew. Energy 2023, 208, 331–340. [Google Scholar] [CrossRef]
  30. Wang, Z.; Yan, J.; Wang, H.; Fu, W.; He, D.; Wang, B.; Wang, Y.; Xu, T. Separation and conversion of CO2 reduction products into high-concentration formic acid using bipolar membrane electrodialysis. J. Membr. Sci. 2024, 708, 123016. [Google Scholar] [CrossRef]
  31. Caspeta, L.; Chen, Y.; Ghiaci, P.; Feizi, A.; Buskov, S.; Hallström, B.M.; Petranovic, D.; Nielsen, J. Altered sterol composition renders yeast thermotolerant. Science 2014, 346, 75–78. [Google Scholar] [CrossRef] [PubMed]
  32. Mattanovich, D.; Sauer, M.; Gasser, B. Yeast biotechnology: Teaching the old dog new tricks. Microb. Cell Fact. 2014, 13, 34. [Google Scholar] [CrossRef]
  33. Okamoto, A.; Hashimoto, K.; Nealson, K.H. Flavin redox bifurcation as a mechanism for controlling the direction of electron flow during extracellular electron transfer. Angew. Chem. Int. Ed. Engl. 2014, 53, 10988–10991. [Google Scholar] [CrossRef]
  34. Lennen, R.M.; Pfleger, B.F. Microbial production of fatty acid-derived fuels and chemicals. Curr. Opin. Biotechnol. 2013, 24, 1044–1053. [Google Scholar] [CrossRef] [PubMed]
  35. Dong, G.; Zhao, Y.; Ding, W.; Xu, S.; Zhang, Q.; Zhao, H.; Shi, S. Metabolic engineering of Saccharomyces cerevisiae for de novo production of odd-numbered medium-chain fatty acids. Metab. Eng. 2024, 82, 100–109. [Google Scholar] [CrossRef]
  36. Zhou, Y.J.; Buijs, N.A.; Zhu, Z.; Qin, J.; Siewers, V.; Nielsen, J. Production of fatty acid-derived oleochemicals and biofuels by synthetic yeast cell factories. Nat. Commun. 2016, 7, 11709. [Google Scholar] [CrossRef]
  37. Wang, K.; Liu, Y.; Wu, Z.; Wu, Y.; Bi, H.; Liu, Y.; Wang, M.; Chen, B.; Nielsen, J.; Liu, Z.; et al. Investigating formate tolerance mechanisms in Saccharomyces cerevisiae and its application. Green Carbon 2023, 1, 65–74. [Google Scholar] [CrossRef]
  38. Zhang, Y.; Su, M.; Qin, N.; Nielsen, J.; Liu, Z. Expressing a cytosolic pyruvate dehydrogenase complex to increase free fatty acid production in Saccharomyces cerevisiae. Microb. Cell Fact. 2020, 19, 226. [Google Scholar] [CrossRef]
  39. Zheng, T.; Zhang, M.; Wu, L.; Guo, S.; Liu, X.; Zhao, J.; Xue, W.; Li, J.; Liu, C.; Li, X.; et al. Upcycling CO2 into energy-rich long-chain compounds via electrochemical and metabolic engineering. Nat. Catal. 2022, 5, 388–396. [Google Scholar] [CrossRef]
  40. Guo, S.; Li, C.; Su, Y.; Huang, X.; Zhang, C.; Dai, Y.; Ji, Y.; Fu, R.; Zheng, T.; Fei, Q.; et al. Scalable Electro-Biosynthesis of Ectoine from Greenhouse Gases. Angew. Chem. Int. Ed. Engl. 2025, 64, e202415445. [Google Scholar] [CrossRef]
  41. Chen, K.; Zhang, P.; Chen, Y.; Fei, C.; Yu, J.; Zhou, J.; Liang, Y.; Li, W.; Xiang, S.; Dai, S.Y.; et al. Electro-biodiesel empowered by co-design of microorganism and electrocatalysis. Joule 2025, 9, 101769. [Google Scholar] [CrossRef]
  42. Stöckl, M.; Harms, S.; Dinges, I.; Dimitrova, S.; Holtmann, D. Corrigendum: From CO2 to Bioplastic—Coupling the Electrochemical CO2 Reduction with a Microbial Product Generation by Drop-in Electrolysis. ChemSusChem 2021, 14, 2780. [Google Scholar] [CrossRef] [PubMed]
  43. Cui, H.; Liu, W.; Ma, C.; Shiri, P.; Zhu, Z.; Jiang, H.; Li, D.; Zhang, L. Converting CO2 to single-cell protein via an integrated electrocatalytic-biosynthetic system. Appl. Catal. B Environ. Energy 2024, 350, 123946. [Google Scholar] [CrossRef]
  44. Chen, H.; Simoska, O.; Lim, K.; Grattieri, M.; Yuan, M.; Dong, F.; Lee, Y.S.; Beaver, K.; Weliwatte, S.; Gaffney, E.M.; et al. Fundamentals, Applications, and Future Directions of Bioelectrocatalysis. Chem. Rev. 2020, 120, 12903–12993. [Google Scholar] [CrossRef] [PubMed]
  45. Hann, E.C.; Overa, S.; Harland-Dunaway, M.; Narvaez, A.F.; Le, D.N.; Orozco-Cárdenas, M.L.; Jiao, F.; Jinkerson, R.E. A hybrid inorganic-biological artificial photosynthesis system for energy-efficient food production. Nat. Food 2022, 3, 461–471. [Google Scholar] [CrossRef] [PubMed]
  46. Xia, C.; Yu, M.; Deng, J.; Tang, H.; Wang, Y.; Li, Y.Q. Engineered Halomonas sp. Y3 enables highly efficient upcycling of poly(ethylene terephthalate) to polyhydroxyalkanoates. Bioresour. Technol. 2025, 436, 133039. [Google Scholar] [CrossRef]
  47. Chen, Y.; Liu, Y.; Meng, Y.; Jiang, Y.; Xiong, W.; Wang, S.; Yang, C.; Liu, R. Elucidating the salt-tolerant mechanism of Halomonas cupida J9 and unsterile ectoine production from lignocellulosic biomass. Microb. Cell Fact. 2024, 23, 237. [Google Scholar] [CrossRef]
  48. Tian, L.; Qi, T.; Zhang, F.; Tran, V.G.; Yuan, J.; Wang, Y.; He, N.; Cao, M. Synthetic biology approaches to improve tolerance of inhibitors in lignocellulosic hydrolysates. Biotechnol. Adv. 2025, 78, 108477. [Google Scholar] [CrossRef]
  49. Han, J.; Sun, Z.; Chen, Y.; Guo, J.; Zhang, S.; Ji, C. Adaptive laboratory evolution and mechanisms of salt tolerance in Lactiplantibacillus plantarum. Food Biosci. 2025, 63, 105811. [Google Scholar] [CrossRef]
  50. Wu, D.; Qi, W.; Nie, W.; Lu, Z.; Ye, Y.; Li, J.; Sun, T.; Zhu, Y.; Cheng, H.; Wang, X. BacFlash signals acid-resistance gene expression in bacteria. Cell Res. 2021, 31, 703–712. [Google Scholar] [CrossRef]
  51. Li, J.; Xu, X.; Chen, C.; Xu, L.; Du, Z.; Gu, L.; Xiang, P.; Shi, D.; Huangfu, X.; Liu, F. Conductive materials enhance microbial salt-tolerance in anaerobic digestion of food waste: Microbial response and metagenomics analysis. Environ. Res. 2023, 227, 115779. [Google Scholar] [CrossRef]
  52. Chen, S.; Jing, X.; Tang, J.; Fang, Y.; Zhou, S. Quorum sensing signals enhance the electrochemical activity and energy recovery of mixed-culture electroactive biofilms. Biosens. Bioelectron. 2017, 97, 369–376. [Google Scholar] [CrossRef]
  53. Zhou, S.; An, W.; Zhao, K.; Lin, L.; Yang, S.; Zhang, Y.; Xu, M. Protection of electroactive biofilms against hypersaline shock by quorum sensing. Water Res. 2023, 233, 119823. [Google Scholar] [CrossRef]
  54. Cowan, A.E.; Hillers, M.; Rainaldi, V.; Collas, F.; Choudhary, H.; Zakaria, B.S.; Bieberach, G.G.; Carruthers, D.N.; Grabovac, M.; Gin, J.W.; et al. Fast growth and high-titer bioproduction from renewable formate via metal-dependent formate dehydrogenase in Escherichia coli. Nat. Commun. 2025, 16, 5908. [Google Scholar] [CrossRef] [PubMed]
  55. Zhou, H.; Zhang, Y.; Long, C.P.; Xia, X.; Xue, Y.; Ma, Y.; Antoniewicz, M.R.; Tao, Y.; Lin, B. A citric acid cycle-deficient Escherichia coli as an efficient chassis for aerobic fermentations. Nat. Commun. 2024, 15, 2372. [Google Scholar] [CrossRef]
  56. Herkenhoff, M.E.; Brödel, O.; Frohme, M. Aroma component analysis by HS-SPME/GC–MS to characterize Lager, Ale, and sour beer styles. Food Rev. Int. 2024, 194, 114763. [Google Scholar] [CrossRef] [PubMed]
  57. Praia, A.B.; Herkenhoff, M.E.; Broedel, O.; Frohme, M.; Saad, S.M.I. Sour Beer with Lacticaseibacillus paracasei subsp. paracasei F19: Feasibility and Influence of Supplementation with Spondias mombin L. Juice and/or By-Product. Foods 2022, 11, 4068. [Google Scholar] [CrossRef]
  58. Herkenhoff, M.E.; Battistini, C.; Praia, A.B.; Rossini, B.C.; Dos Santos, L.D.; Brödel, O.; Frohme, M.; Saad, S.M.I. The combination of omics strategies to evaluate starter and probiotic strains in the Catharina sour Brazilian-style beer. Food Rev. Int. 2023, 167, 112704. [Google Scholar] [CrossRef]
  59. Yu, T.; Liu, Q.; Wang, X.; Liu, X.; Chen, Y.; Nielsen, J. Metabolic reconfiguration enables synthetic reductive metabolism in yeast. Nat. Metab. 2022, 4, 1551–1559. [Google Scholar] [CrossRef] [PubMed]
Figure 1. Formate electrolytes derived from CO2 electroreduction enhanced FFA production in engineered S. cerevisiae. Schematic illustration of the bio-electrochemical conversion of CO2 to FFAs. Left (blue/yellow shading for illustration purposes): Renewable energy sources drive the electrochemical reduction of CO2 to formate in the electrolyte solution. Center (dashed arrow): The grey dashed arrow indicates the direct transfer of the formate-containing electrolyte to the fermentation flask, eliminating the need for separation. Top right (schematic of S. cerevisiae): The strain overexpresses FDH6 (plasmid-born) and stress-resistance genes FLO11 and GRE1 (genomically integrated) to enhance formate utilization and tolerance to the formate-containing electrolytic medium. Bottom right (green arrow): The green arrow summarizes the enhanced performance of the engineered strain YJZ061, showing ~93% increase in FFAs, >97% formate conversion, and 41.9% higher biomass compared to the parental strain.
Fermentation 11 00664 g001
Figure 2. Investigation of simulated nutritive electrolytes and culture conditions. (a) Growth performance of the wild-type strain CEN.PK113-11C in three simulated nutrient electrolytes under different pH conditions; (b) Growth performance of the high-FFAs-producing strain PDH2 under the same conditions; (c) Growth performance of the high-FFAs-producing strain YJZ45 under the same conditions. All experiments were conducted in shake flasks with three biological replicates. Data are presented as mean ± standard deviation, and error bars indicate the standard error (n = 3).
Fermentation 11 00664 g002
Figure 3. Identification of the optimal FDH enhances S. cerevisiae growth and FFAs accumulation in formate-supplemented electrolytes. (a) Growth of the control strain and 16 FDH-overexpressing strains at 96 h in small-scale tube cultures; (b) FFAs production of the control strain and 16 FDH-overexpressing strains at 96 h in small-scale tube cultures; (c) Growth curves of the control and engineered strains in flask fermentations; (d) Formate consumption profiles of the control and engineered strains within 96 h in flask fermentations; (e) FFAs titers of the control and engineered strains at 72 h in flask fermentations; (f) FFAs titers of the control and engineered strains at 96 h in flask fermentations. All experiments were performed in simulated nutritive electrolyte solution (EFS03) with three biological replicates per group. Data are presented as mean ± standard deviation (SD), with error bars indicating SD. Statistical significance was assessed using the t-test: p < 0.001 by ***.
Fermentation 11 00664 g003
Figure 4. Investigation of genes associated with adaptation to simulated nutritive electrolytes solution (EFS03). (a) Growth curves of the control strain YJZ45 and four FDH-overexpressing strains in small-scale tube fermentations; (b) Growth curves of the control strain YB06 and other effective FDH-overexpressing strains in flask fermentations; (c) FFAs titers of YJZ45E, YB06, and FDH-overexpressing strains at 96 h in flask fermentations; (d) Formate consumption of YJZ45E, YB06, and FDH-overexpressing strains at 96 h in flask fermentations. All experiments were conducted in simulated nutritive electrolytes solution (EFS03) supplemented with 3 g/L formate. Notably, panel (a) was obtained from small-scale tube fermentations, while panels (bd) were derived from flask fermentations, resulting in differences in growth behavior. Each experiment was performed with three biological replicates, and data are presented as mean ± standard deviation (SD), with error bars indicating SD. Statistical significance was assessed using the t-test: p < 0.05 is indicated by *, p < 0.01 by **, and p < 0.001 by ***. “ns” stands for “not statistically significant”.
Fermentation 11 00664 g004
Figure 5. Optimal formate concentration in simulated nutritive electrolytes solution (EFS) for YB061. (a) Growth curves of YB061 in simulated nutritive electrolytes solution with five different formate concentrations; (b) Formate consumption by YB061 in simulated nutritive electrolytes solution (EFS) with five different formate concentrations; (c) FFAs production by YB061 after 96 h of flask fermentation in simulated nutritive electrolytes solution (EFS) with five different formate concentrations. Each experiment was performed with three biological replicates, and data are presented as mean ± standard deviation (SD), with error bars indicating SD. Statistical significance was assessed using the t-test: p < 0.01 by **, and p < 0.001 by ***.
Fermentation 11 00664 g005
Figure 6. Fermentation validation of YJZ45E, YB06, and YB061 in real nutritive formate electrolyte solution containing 4 g/L formate. (a) Growth curves of YJZ45E, YB06, and YB061 in real nutritive formate electrolyte solution (REFS04); (b) Formate consumption profiles of YJZ45E, YB06, and YB061 in real nutritive electrolytic solution (REFS04); (c) FFAs production by YJZ45E, YB06, and YB061 after 96 h of cultivation in real nutritive formate electrolyte solution (REFS04). Each experiment was performed with three biological replicates, and data are presented as mean ± standard deviation (SD), with error bars indicating SD. Statistical significance was assessed using the t-test: p < 0.001 by ***.
Fermentation 11 00664 g006
Table 1. Exploration of nutritional electrolytes and bio-adaptive electrolytes.
TypeMain Ingredients
The composition of conventional formate electrolyte: Electrolyte salt solution + formate
Simulated nutritive electrolyte 1 (E1)1 M KCl + Delft medium (containing 2.0% glucose)
Simulated nutritive electrolyte 2 (E2)0.5 M K2SO4 + Delft medium (containing 2.0% glucose)
Simulated nutritive electrolyte 3 (E3)1 M KH2PO4 + Delft medium (containing 2.0% glucose)
Simulated nutritive formate electrolyte solution (EFS) 10.5 M K2SO4 + Formate (3 g/L, 4 g/L, 5 g/L,6 g/L, or 9 g/L formic acid) + Delft medium (containing 2.0% glucose), pH 5
Real nutritive formate electrolyte solution (REFS) 20.5 M K2SO4 + Formate (3 g/L or 4 g/L) + Delft medium + possibly trace amounts of metal electrode dissolution or detergent residues
1 They were designated as EFS03, EFS04, EFS05, EFS06, and EFS09 based on formate concentration. 2 They were designated as REFS03 and REFS04 based on formate concentration.
Disclaimer/Publisher’s Note: The statements, opinions and data contained in all publications are solely those of the individual author(s) and contributor(s) and not of MDPI and/or the editor(s). MDPI and/or the editor(s) disclaim responsibility for any injury to people or property resulting from any ideas, methods, instructions or products referred to in the content.