Appendix A
Table A1.
S. cerevisiae strains used in this study.
Table A1.
S. cerevisiae strains used in this study.
| Strain | Genotype or Characteristic | Resource |
|---|
| CEN.PK113-11C | MATa MAL2-8c SUC2 his3Δ1 ura3-52 | Laboratory preservation |
| PDH2 | MATa MAL2-8c SUC2 URA3-52 HFD1Δ POX1Δ FAA1Δ FAA4Δ
HIS3Δ, X-3::pPGK1-|p|A-tPMA1_pPGI1-IpIA2-tPYK1, XI-5::pTDH3-pdhB-tCYC1_pTEF1-Ipd-tADH1_pTPI1-pdhA-tTEF1_pADH1-aceF-tPGI1 (+pGapN) | Laboratory preservation [38] |
| YJZ45 | MATa MAL2-8c SUC2 URA3-52 hfd1Δ pox1Δ faa1Δ faa4Δ
HIS3Δ::HIS3 + (TPIp-MmACL-FBA1t) + (TDH3p-RtME-CYC1t) + (tHXT7p-’MDH3-TDH2t) + (PGK1p-CTP1-ADH1t) + (TEF1p-’tesA-HIS3t) URA3Δ::(TPIp-RtFAS1-FBA1t) + (TEF1p-RtFAS2-CYC1t) + amdSym | Laboratory preservation [36] |
| YJZ45E | YJZ45 with pSP-GM2 | |
| YB01 | YJZ45 with pFDH1 | This study |
| YB02 | YJZ45 with pFDH2 | This study |
| YB03 | YJZ45 with pFDH3 | This study |
| YB04 | YJZ45 with pFDH4 | This study |
| YB05 | YJZ45 with pFDH5 | This study |
| YB06 | YJZ45 with pFDH6 | This study |
| YB07 | YJZ45 with pFDH7 | This study |
| YB08 | YJZ45 with pFDH8 | This study |
| YB09 | YJZ45 with pFDH9 | This study |
| YB10 | YJZ45 with pFDH10 | This study |
| YB11 | YJZ45 with pFDH11 | This study |
| YB12 | YJZ45 with pFDH12 | This study |
| YB13 | YJZ45 with pFDH13 | This study |
| YB34 | YJZ45 with pFDH34 | This study |
| YB35 | YJZ45 with pFDH35 | This study |
| YB45 | YJZ45 with pFDH45 | This study |
| YB001 | YJZ45-(TEF1p-FLO11) | This study |
| YB002 | YJZ45-(TEF1p-SIP18) | This study |
| YB003 | YJZ45-(TEF1p-SPS100) | This study |
| YB004 | YJZ45-(TEF1p-GRE1) | This study |
| YB061 | YJZ45-TEF1p-GRE1, TEF1p-FLO11 | |
Table A2.
Plasmids used in this study.
Table A2.
Plasmids used in this study.
| Plasmids | Genotype or Characteristic | Resource |
|---|
| pSP-GM2 | 2 μm, AmpR, URA3, TEF1p, CYC1t, PGK1p, ADH1t | Laboratory preservation |
| pCas-lacZ-SalI | 2μ ori, AmpR, SNR52p, lacZα, gRNA scaffold, ADH1t, CAS9 | Laboratory preservation |
| pST1-G-URA3 | pUC18 vector contains the gRNA scaffold, SNR52 promotor, URA3 gene and SNR52 terminator | Laboratory preservation |
| pFDH1 | pSP-GM2-(TEF1p-FDH1-CYC1t) | Laboratory preservation |
| pFDH2 | pSP-GM2-(TEF1p-FDH2-CYC1t) | Laboratory preservation |
| pFDH3 | pSP-GM2-(TEF1p-FDH3-CYC1t) | Laboratory preservation |
| pFDH4 | pSP-GM2-(TEF1p-FDH4-CYC1t) | Laboratory preservation |
| pFDH5 | pSP-GM2-(TEF1p-FDH5-CYC1t) | Laboratory preservation |
| pFDH6 | pSP-GM2-(TEF1p-FDH6-CYC1t) | Laboratory preservation |
| pFDH7 | pSP-GM2-(TEF1p-FDH7-CYC1t) | Laboratory preservation |
| pFDH8 | pSP-GM2-(TEF1p-FDH8-CYC1t) | Laboratory preservation |
| pFDH9 | pSP-GM2-(TEF1p-FDH9-CYC1t) | Laboratory preservation |
| pFDH10 | pSP-GM2-(TEF1p-FDH10-CYC1t) | Laboratory preservation |
| pFDH11 | pSP-GM2-(TEF1p-FDH11-CYC1t) | Laboratory preservation |
| pFDH12 | pSP-GM2-(TEF1p-FDH12-CYC1t) | Laboratory preservation |
| pFDH13 | pSP-GM2-(TEF1p-FDH13-CYC1t) | Laboratory preservation |
| pFDH34 | pSP-GM2-(TEF1p-FDH3-CYC1t)- (PGK1p-FDH4-ADH1t) | Laboratory preservation |
| pFDH35 | pSP-GM2-(TEF1p-FDH3-CYC1t)- (PGK1p-FDH5-ADH1t) | Laboratory preservation |
| pFDH45 | pSP-GM2-(TEF1p-FDH4-CYC1t)- (PGK1p-FDH5-ADH1t) | Laboratory preservation |
| pCas-sgRNA-FLO11 | Plasmid pCas-lacZ-SalI to over expression the gene FLO11 | This study |
| pCas-sgRNA-SIP18 | Plasmid pCas-lacZ-SalI to over expression the gene SIP18 | This study |
| pCas-sgRNA-SPS100 | Plasmid pCas-lacZ-SalI to over expression the gene SPS100 | This study |
| pCas-sgRNA-GRE1 | Plasmid pCas-lacZ-SalI to over expression the gene GRE1 | This study |
Table A3.
Primers used in this study.
Table A3.
Primers used in this study.
| Primer No. | Name | Sequence (5′-3′) |
|---|
| P1 | FLO11-gRNA1-up | AAAGGTCTCAGACTTTAGAACCACAACATGACGAGTTTTAGAGCTAGAAATAGCAAGTTAAAATAAGGCT |
| P2 | FLO11-gRNA2-up | AAAGGTCTCACGCAATTAGAACCACAACATGACGGTTTTAGAGCTAGAAATAGCAAGTTAAAATAAGGCT |
| P3 | SIP18-gRNA1-up | AAAGGTCTCAGATCATGATCATGAATACAGTACGGTTTTAGAGCTAGAAATAGCAAGTTAAAATAAGGCT |
| P4 | SIP18-gRNA2-up | AAAGGTCTCACGCATGCCTAGGGACAAAACTTTGGTTTTAGAGCTAGAAATAGCAAGTTAAAATAAGGCT |
| P5 | SPS100-gRNA1-up | AAAGGTCTCAGATCTATTTTCTGCTCATAAACCGGTTTTAGAGCTAGAAATAGCAAGTTAAAATAAGGCT |
| P6 | SPS100-gRNA2-up | AAAGGTCTCACGCATCTTAGGGGAATTTTCAACAGTTTTAGAGCTAGAAATAGCAAGTTAAAATAAGGCT |
| P7 | GRE1-gRNA1-up | AAAGGTCTCAGATCCCGTTACGTGCTTGTTAATCGTTTTAGAGCTAGAAATAGCAAGTTAAAATAAGGCT |
| P8 | GRE1-gRNA2-up | AAAGGTCTCACGCAAGATATTAAGAGTTGAGGGTGTTTTAGAGCTAGAAATAGCAAGTTAAAATAAGGCT |
| P9 | gRNA1-down | AAAGGTCTCATGCGCAAGCCCGGAATC |
| P10 | gRNA2-down | AAAGGTCTCAAAACGACACAGGGTAATAACTGATATAATTAAATTGAAGCTC |
| P11 | FLO11-TEF1-UP | CGGTATTAAACGTATAAAAAGCACCCTATTCATCAGTTATTATCCCCACACACCATAGCTTCA |
| P12 | FLO11-TEF1-DOWN | CTTAGATTAGATTGCTATGCTTTCTTTCATGCAAAGACCATTTCTACTCGCTTATTTGGTCCTTTCGC |
| P13 | SIP18-TEF1-UP | CGGTATATAAACGTATCTTAAAGGGAGCGGTATGTAAAATGGATAGCCACACACCATAGCTTCA |
| P14 | SIP18-TEF1-DOWN | CTTAGATTAGATTGCTATGCTTTCTTTCATGTCTAACATGATGAATAAGTTCGCTGAAAAATTACAAG |
| P15 | SPS100-TEF1-UP | CGGTATAGTTCTTGGCTTAGCAATTACATTTAACGCTGATGATCCTCCACACACCATAGCTTCA |
| P16 | SPS100-TEF1-DOWN | CTTAGATTAGATTGCTATGCTTTCTTTCATGAAATTCACATCAGTGCTAGCATTTTTTCTTGCAACTT |
| P17 | GRE1-TEF1-UP | CGGTATGGGAAATGGTTAGAAAAGACCGAAATCCTTTTTTTGGTCTCCACACACCATAGCTTCA |
| P18 | GRE1-TEF1-DOWN | CTTAGATTAGATTGCTATGCTTTCTTTCATGTCCA
ATCTATTAAACAAGTTTGCTGATAAGTTGCACG |
| P19 | qACT1-F | TCGTTCCAATTTACGCTGGTT |
| P20 | qACT1-R | CGGCCAAATCGATTCTCAA |
| P21 | qGRE1-F | GACCAGACTAGACAACAGCGT |
| P22 | qGRE1-R | CTGGAAGTCGTTACCGCCA |
| P23 | qSIP18-F | CATCAGAAGGGAAAGAACGCC |
| P24 | qSIP18-R | CGTAAGTCTTCCAATCGTTCGC |
| P25 | qSPS100-F | CTTTGAGTTTCTTCTGCTCAATCGT |
| P26 | qSPS100-R | AGTGTAAGGAGGGAAAACACC |
Table A4.
Medium and its composition table.
Table A4.
Medium and its composition table.
| Name of Medium | Medium Components | Purpose |
|---|
| LB medium | 5 g/L yeast extract; 10 g/L peptone; 10 g/L NaCl; Add 100 mg/L ampicillin when necessary. | Cultivate E. coli |
| YPD medium | 10 g/L yeast extract, 20 g/L peptone and 20 g/L glucose. | Cultivate S. cerevisiae |
| SC-Ura medium | 5 g/L (NH4)2SO4, 1.7 g/L YNB (without amino acids), 1.914 g/L amino acid mixture without uracil, 20 g/L glucose, with the pH adjusted to 6 using NaOH. | Cultivate S. cerevisiae strains harboring the plasmid with URA3 |
| SC-5-FOA solid medium | 6.7 g/L YNB, 0.77g /L amino acid mixture and 0.8 g/L 5-fluoroacetic acid, 20 g/L AGAR. | It was used to screen S. cerevisiae cells that had lost the URA3 plasmid. |
| Delft medium | 5 g/L (NH4)2SO4, 3 g/L KH2PO4, 0.5 g/L MgSO4·7H2O, 20 g/L glucose, a trace metal mixture, and a vitamin solution. | Cultivate S. cerevisiae |
| Formate -Containing electrolyte solution | Electrolyte salt solution + Formate | The composition of conventional formate electrolyte |
| Simulated nutritive electrolyte 1(E1) | 1 M KCl + Delft medium (containing 2% glucose) | Determine the suitable electrolyte
salt for the electrochemical-biological coupling system |
| Simulated nutritive electrolyte2(E2) | 0.5 M K2SO4 + Delft medium (containing 2% glucose) |
| Simulated nutritive electrolyte 3(E3) | 1 M KH2PO4 + Delft medium (containing 2% glucose) |
| Simulated nutritive formate electrolyte solution | 0.5 M K2SO4 + Formate + Delft medium (containing 2% glucose) |
| Real nutritive formate electrolyte solution | 0.5 M K2SO4 + Formate + Delft medium + possibly trace amounts of metal electrode dissolution or detergent residues | Evaluation of the adaptation capability of the engineered strain YB061 to the electrolyte. |
Table A5.
Formulation of Trace Element Mixture Solution.
Table A5.
Formulation of Trace Element Mixture Solution.
| Reagent | Mother Liquor Concentration | Reagent |
|---|
| FeSO4·7H2O | 3 g/L | FeSO4·7H2O |
| ZnSO4·7H2O | 4.5 g/L | ZnSO4·7H2O |
| CaCl2·2H2O | 4.5 g/L | CaCl2·2H2O |
| MnCl2·4H2O | 1 g/L | MnCl2·4H2O |
| CoCl2·6H2O | 300 mg/L | CoCl2·6H2O |
| CuSO4·5H2O | 300 mg/L | CuSO4·5H2O |
| NaMoO4·2H2O | 300 mg/L | NaMoO4·2H2O |
| H3BO4 | 300 mg/L | H3BO4 |
| KI | 300 mg/L | KI |
| Na2EDTA·2H2O | 300 mg/L | Na2EDTA·2H2O |
Table A6.
Vitamin Stock Solution Formulation.
Table A6.
Vitamin Stock Solution Formulation.
| Reagent | Concentration |
|---|
| Biotin | 50 mg/L |
| D-Calcium Pantothenate | 1 g/L |
| Thiamine HCl | 1 g/L |
| Pyridoxine hydrochloride | 1 g/L |
| 4-aminobenzoic acid | 0.2 g/L |
| Nicotinic aci | 1 g/L |
| Inositol | 25 g/L |
Table A7.
Summary of 13 engineered formate dehydrogenases (FDHs) and their sequence sources.
Table A7.
Summary of 13 engineered formate dehydrogenases (FDHs) and their sequence sources.
| Sequential Number of Tested FDHs | Origin | Accession Number (NCBI) | Position of Mutation | Reference |
|---|
| FDH1 | Lentilactobacillus buchneri | WP_013726924.1 | None | [29] |
| FDH2 | Mycolicibacterium vaccae | AAB36206.1 | 0_insert_M; C146S; A198G; D221Q; C256V | [29] |
| FDH3 | [Candida] boidinii | O13437 | None | [29] |
| FDH4 | Pseudomonas sp. 101 | 2GUG_A (corresponds to WP_029354581.1 cluster) | X335C | [29] |
| FDH5 | Pseudomonas sp. 101 | 2GUG_A (corresponds to WP_029354581.1 cluster) | D222S; H224N; X335C | [29] |
| FDH6 | Pseudomonas sp. 101 | 2GUG_A (corresponds to WP_029354581.1 cluster) | D222S; X335C | [29] |
| FDH7 | Pseudomonas sp. 101 | PDB: 2GUG_A (corresponds to WP_029354581.1 cluster) | D222A; H224N; X335C | [29] |
| FDH8 | Pseudomonas sp. 101 | 2GUG_A (corresponds to WP_029354581.1 cluster) | D222A; X335C | [29] |
| FDH9 | Pseudomonas sp. 101 | 2GUG_A (corresponds to WP_029354581.1 cluster) | D222Q; H224N; X335C | [29] |
| FDH10 | Pseudomonas sp. 101 | 2GUG_A (corresponds to WP_029354581.1 cluster) | D222Q; X335C | [29] |
| FDH11 | [Candida] boidinii | O13437 | D195Q; Y196R; Q197N | [29] |
| FDH12 | Arabidopsis thaliana | NP_196982.1 | None | [29] |
| FDH13 | [Candida] boidinii | O13437 | D227Q; L229H | [29] |
Table A8.
Summary of four genes and their sources.
Table A8.
Summary of four genes and their sources.
| Gene | Organism | Gene ID (NCBI) |
|---|
| FLO11 | S. cerevisiae S288C | 854836 |
| SIP18 | S. cerevisiae S288C | 855213 |
| SPS100 | S. cerevisiae S288C | 856541 |
| GRE1 | S. cerevisiae S288C | 855878 |
Appendix B
Figure A1.
Feasibility assessment of Simulated nutritive formate electrolyte solution (EFS03) versus the Real nutritive formate electrolyte solution (REFS03). The control group consisted of Delft medium supplemented with 3 g/L formate at initial pH = 5. The simulated nutritive electrolytes solution was prepared with Delft medium, 0.5 M K2SO4, and 3 g/L formate. The Real nutritive formate electrolyte solution (REFS03) was produced by electrolysis using 0.5 M K2SO4 to generate 3 g/L formate, followed by supplementation with Delft medium. Each experiment was performed with three biological replicates, and data are presented as mean ± standard deviation (SD), with error bars indicating SD.
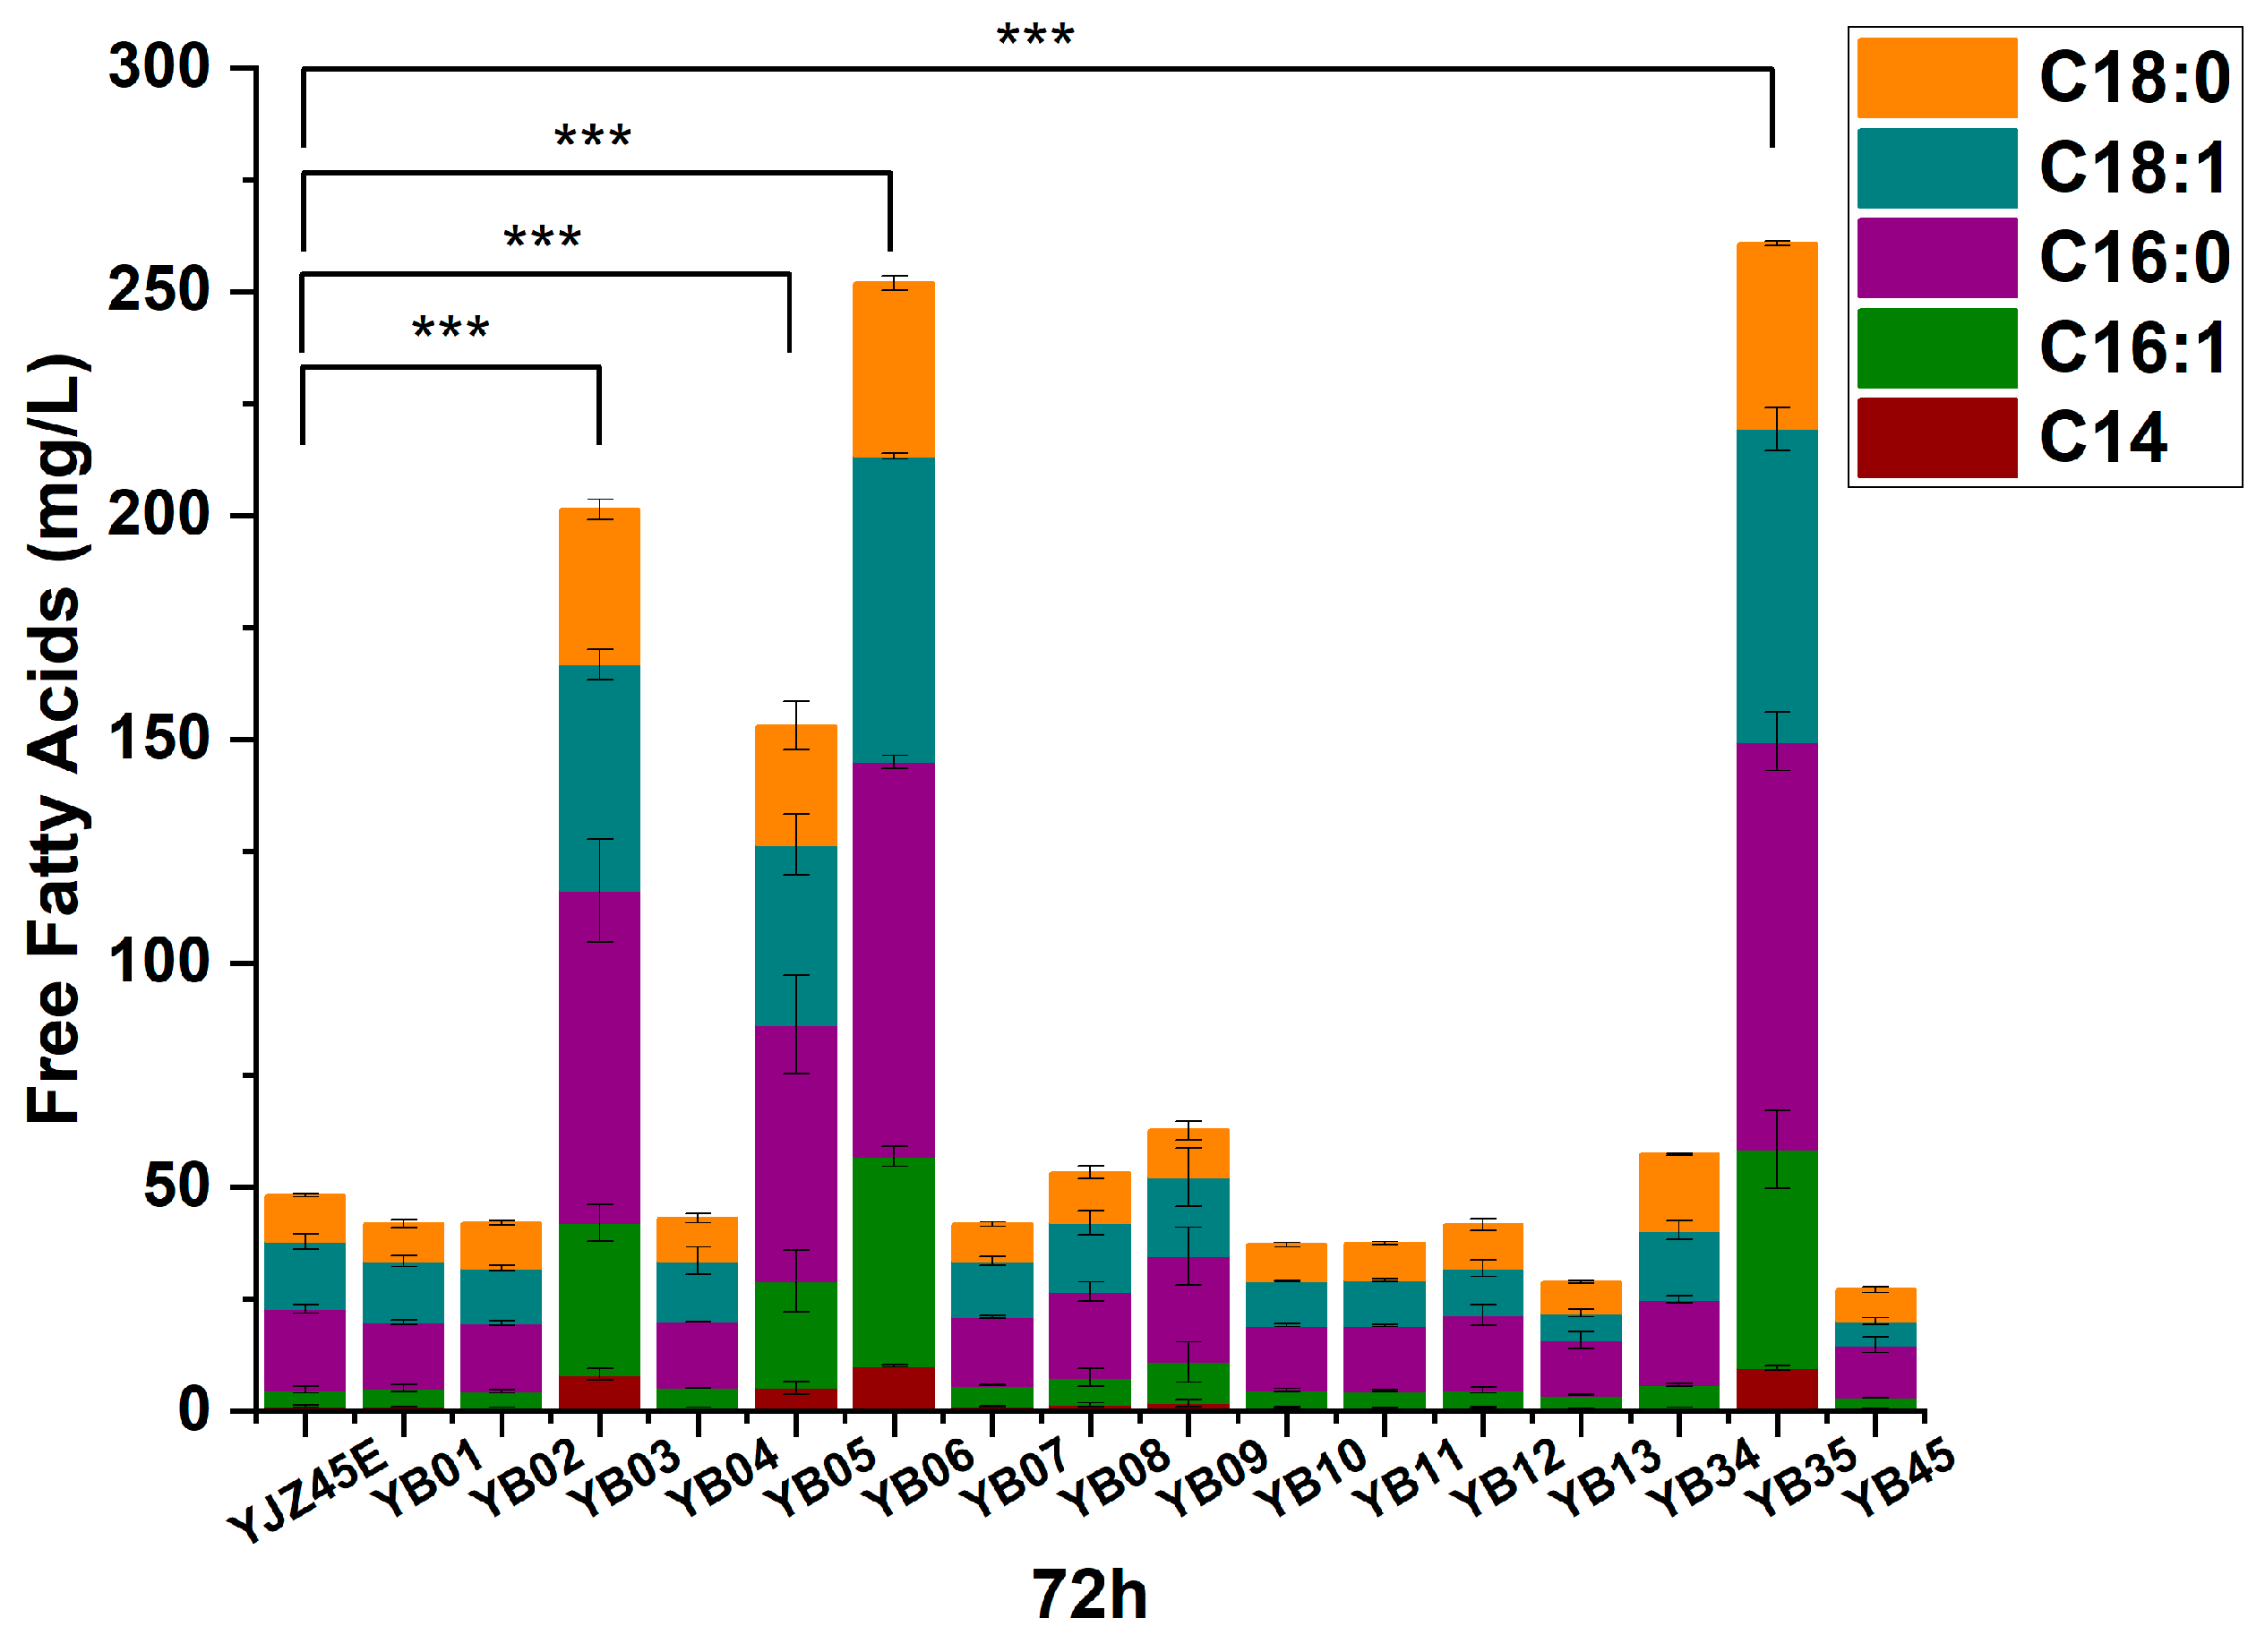
Figure A2.
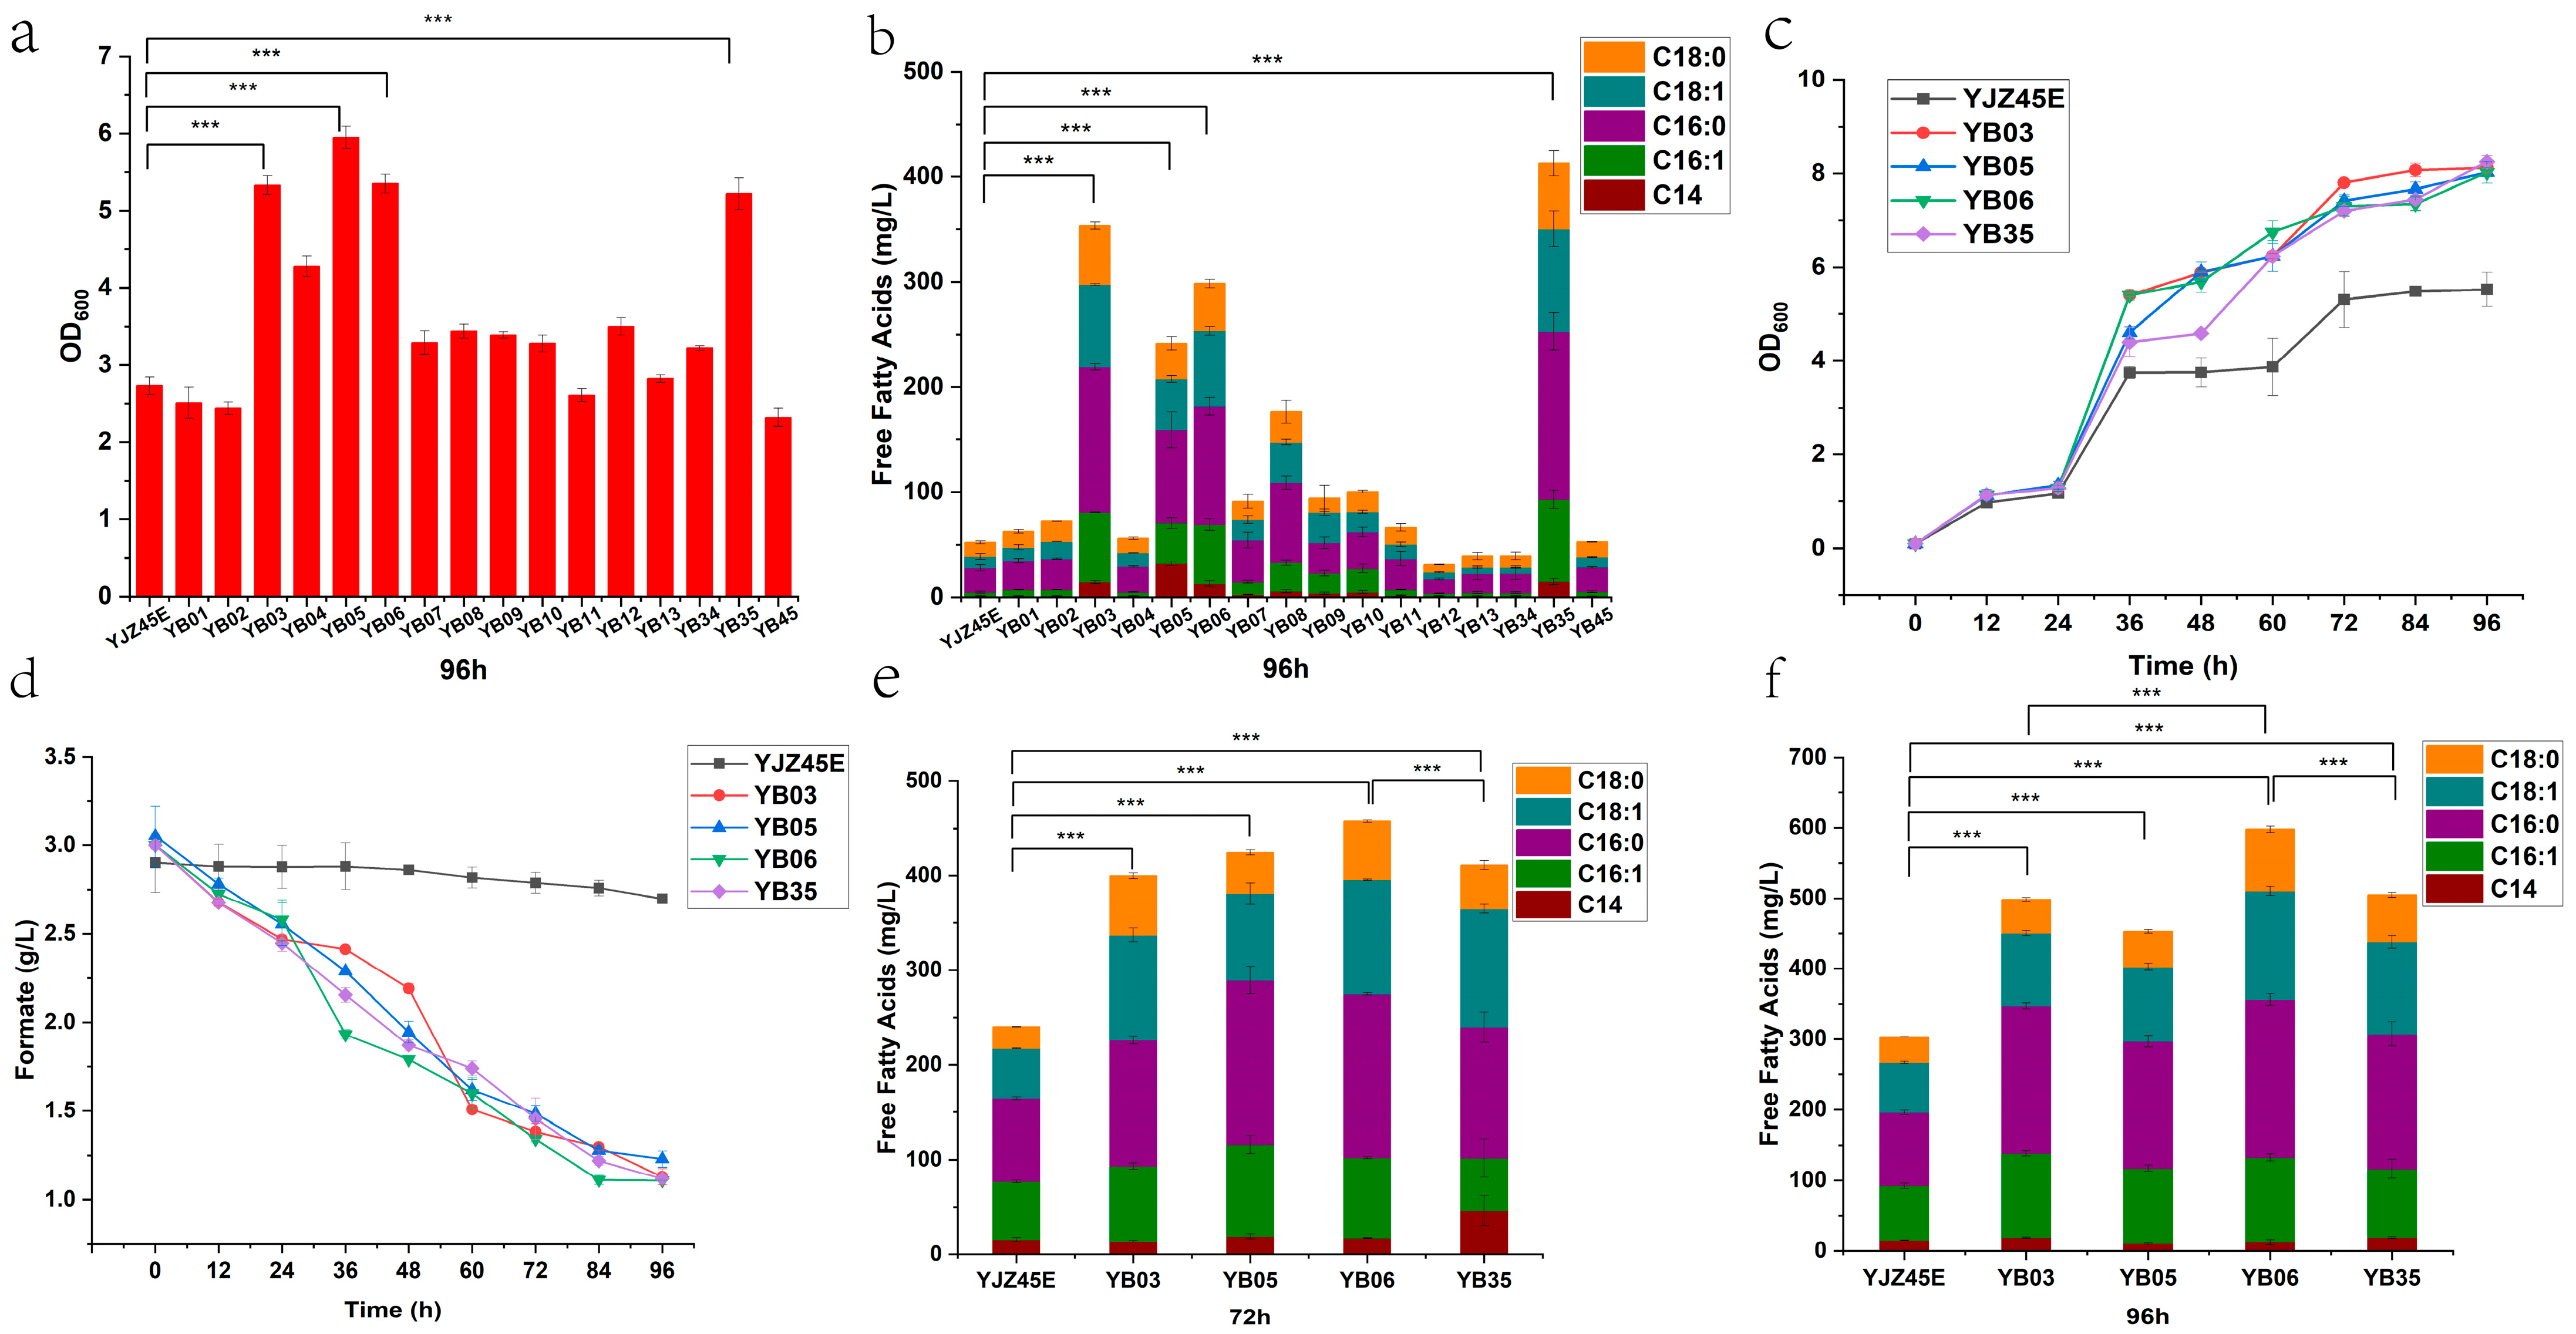
FFAs production at 72 h by the control strain and the 16 overexpression strains. Each experiment was performed with three biological replicates, and data are presented as mean ± standard deviation (SD), with error bars indicating SD. with error bars indicating SD. Statistical significance was assessed using the t-test: p < 0.001 is indicated by by ***.
Figure A3.
Extracellular metabolite profiles at 72 h for the control and overexpression strains. Each experiment was performed with three biological replicates, and data are presented as mean ± standard deviation (SD), with error bars indicating SD.
Figure A3.
Extracellular metabolite profiles at 72 h for the control and overexpression strains. Each experiment was performed with three biological replicates, and data are presented as mean ± standard deviation (SD), with error bars indicating SD.
Figure A4.
Extracellular metabolite profiles at 96 h for the control and overexpression strains. Each experiment was performed with three biological replicates, and data are presented as mean ± standard deviation (SD), with error bars indicating SD.
Figure A4.
Extracellular metabolite profiles at 96 h for the control and overexpression strains. Each experiment was performed with three biological replicates, and data are presented as mean ± standard deviation (SD), with error bars indicating SD.
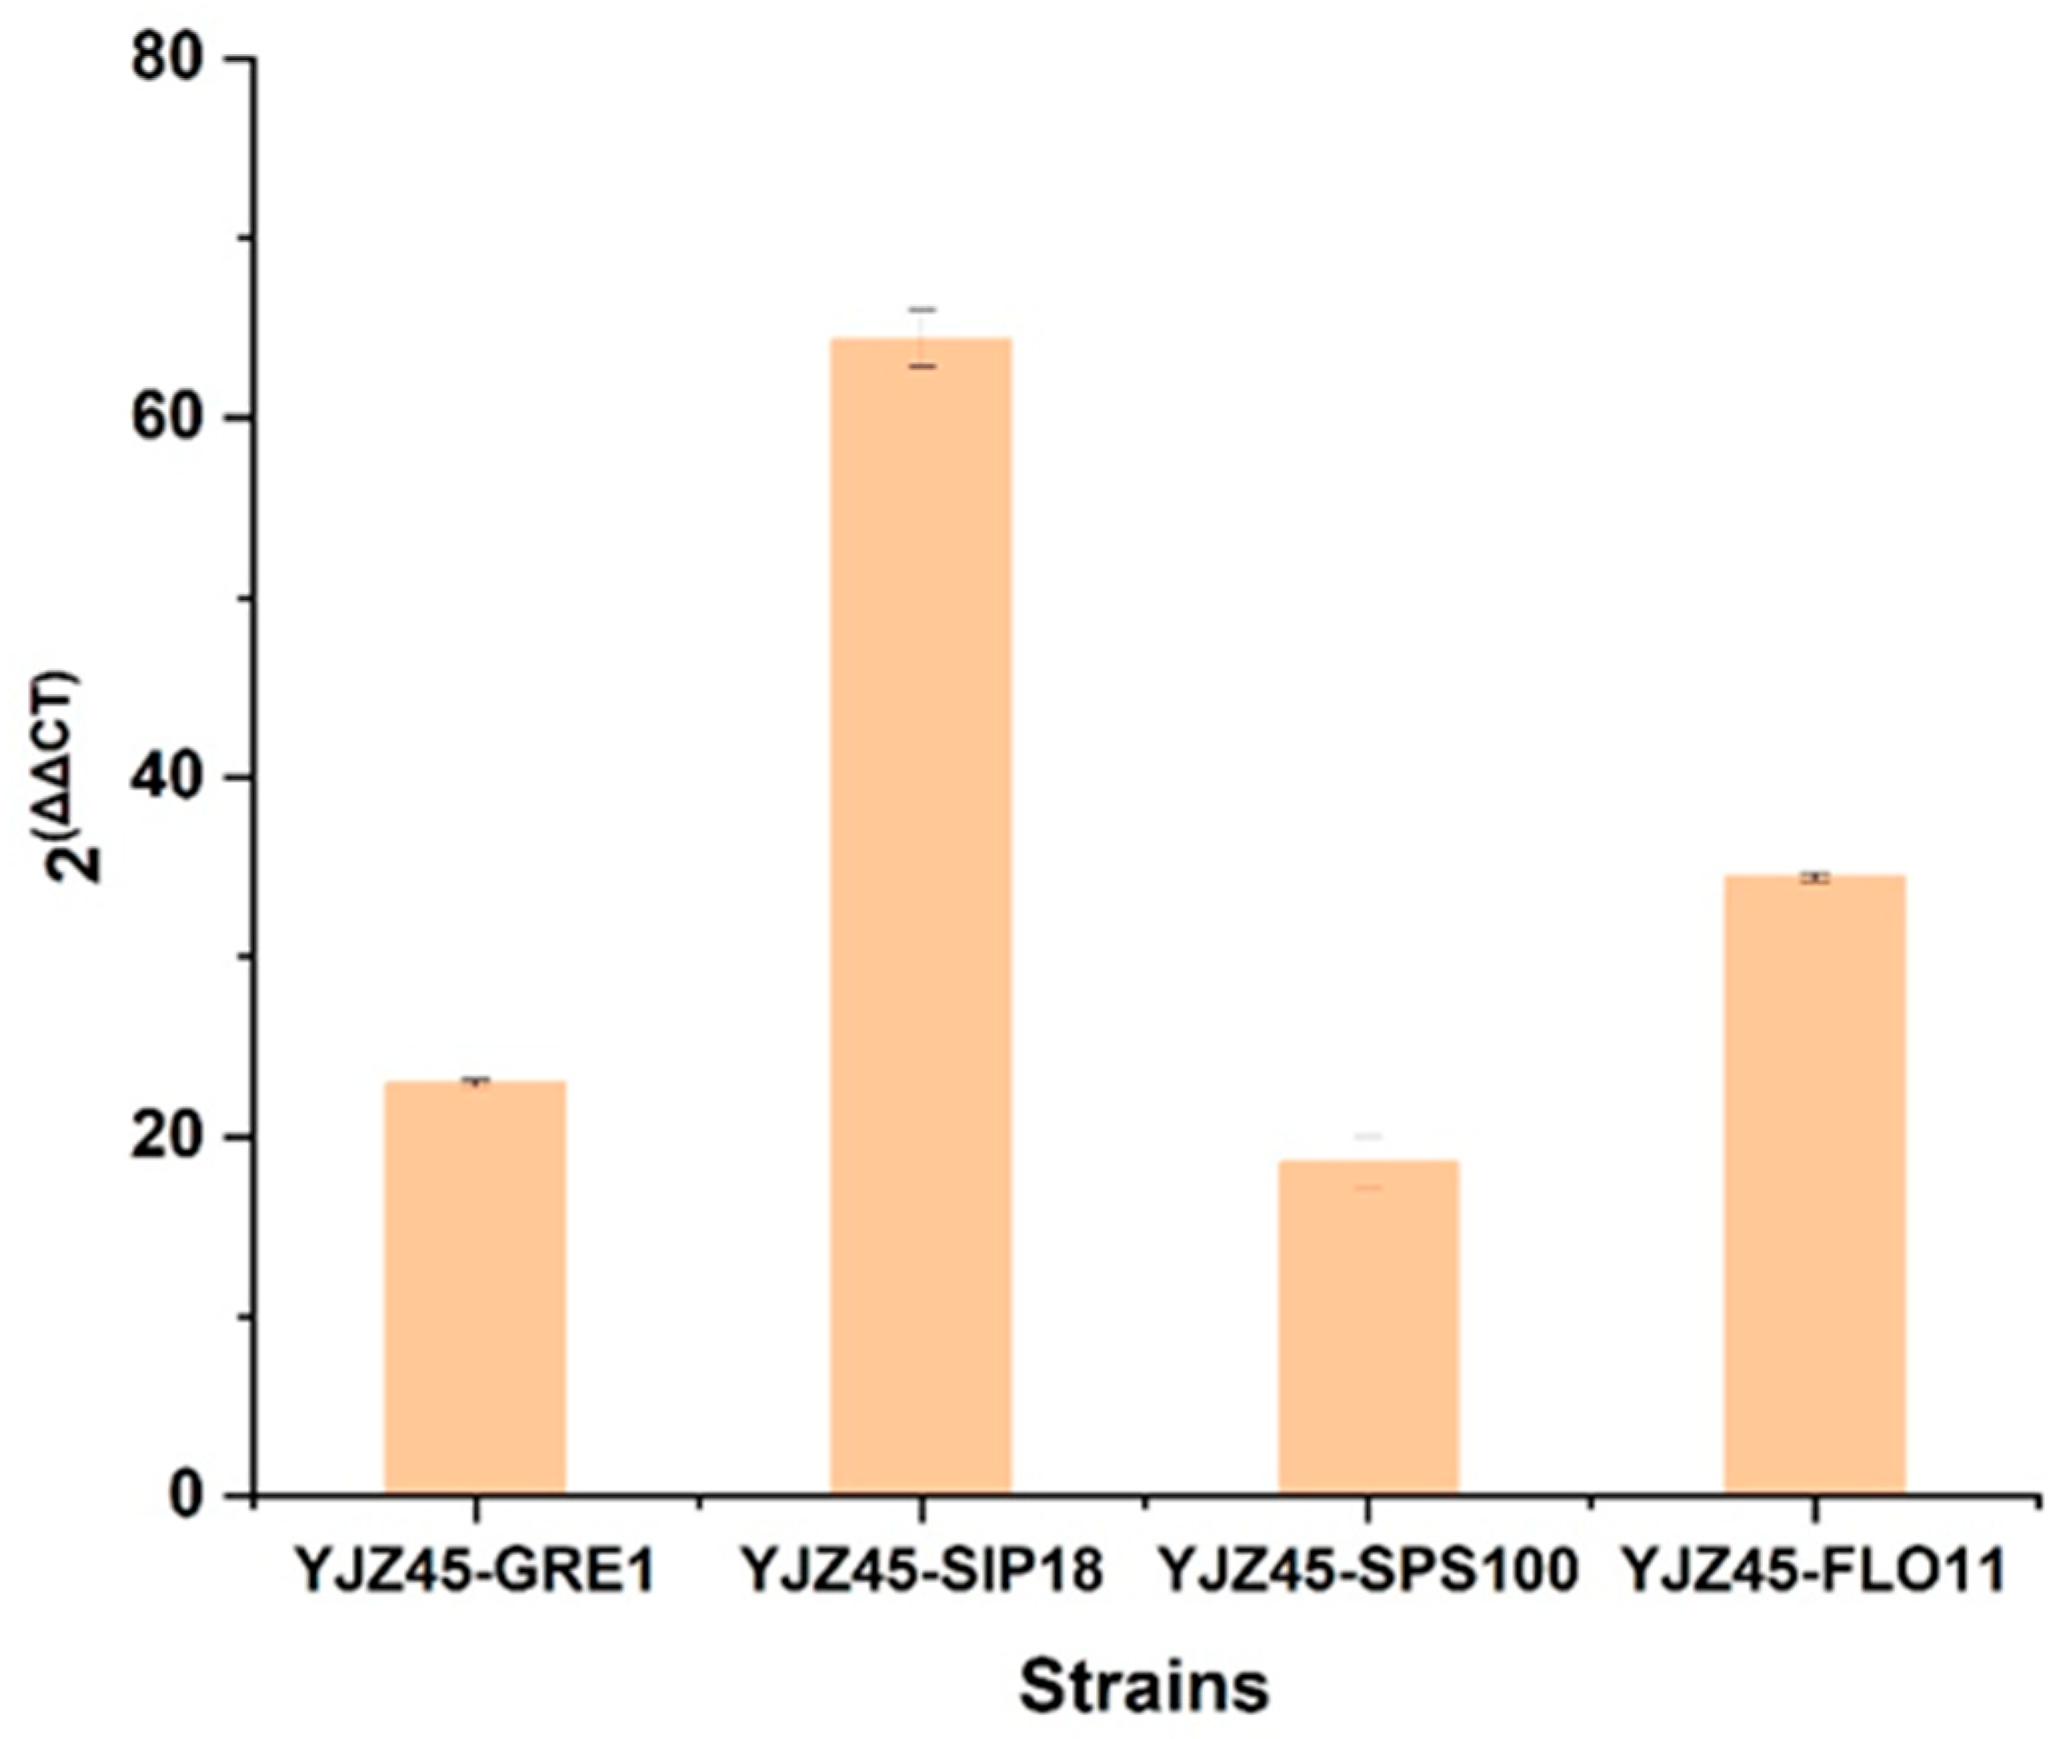
To address the concern regarding molecular characterization, we conducted comprehensive RT-qPCR analyses to confirm the successful overexpression of the engineered genes.
First, for strain YJZ45 and its overexpression derivatives, we performed RT-qPCR using
ACT1 as the reference gene and YJZ45 as the control strain. As shown in
Figure A5, the transcript levels of
GRE1 (2
−ΔΔCt = 22.95),
SIP18 (2
−ΔΔCt = 64.4),
SPS100 (2
−ΔΔCt = 18.55), and
FLO11 (2
−ΔΔCt = 34.43) were all markedly elevated, confirming that each target gene was successfully overexpressed YJZ45-derived single-gene overexpression strains.
Figure A5.
RT-qPCR analysis of GRE1, FLO11, SIP18, and SPS100 in YJZ45-derived single-gene overexpression strains. using ACT1 as the reference gene and YJZ45 as the control strain. Each experiment was performed with three biological replicates, and data are presented as mean ± standard deviation (SD), with error bars indicating SD.
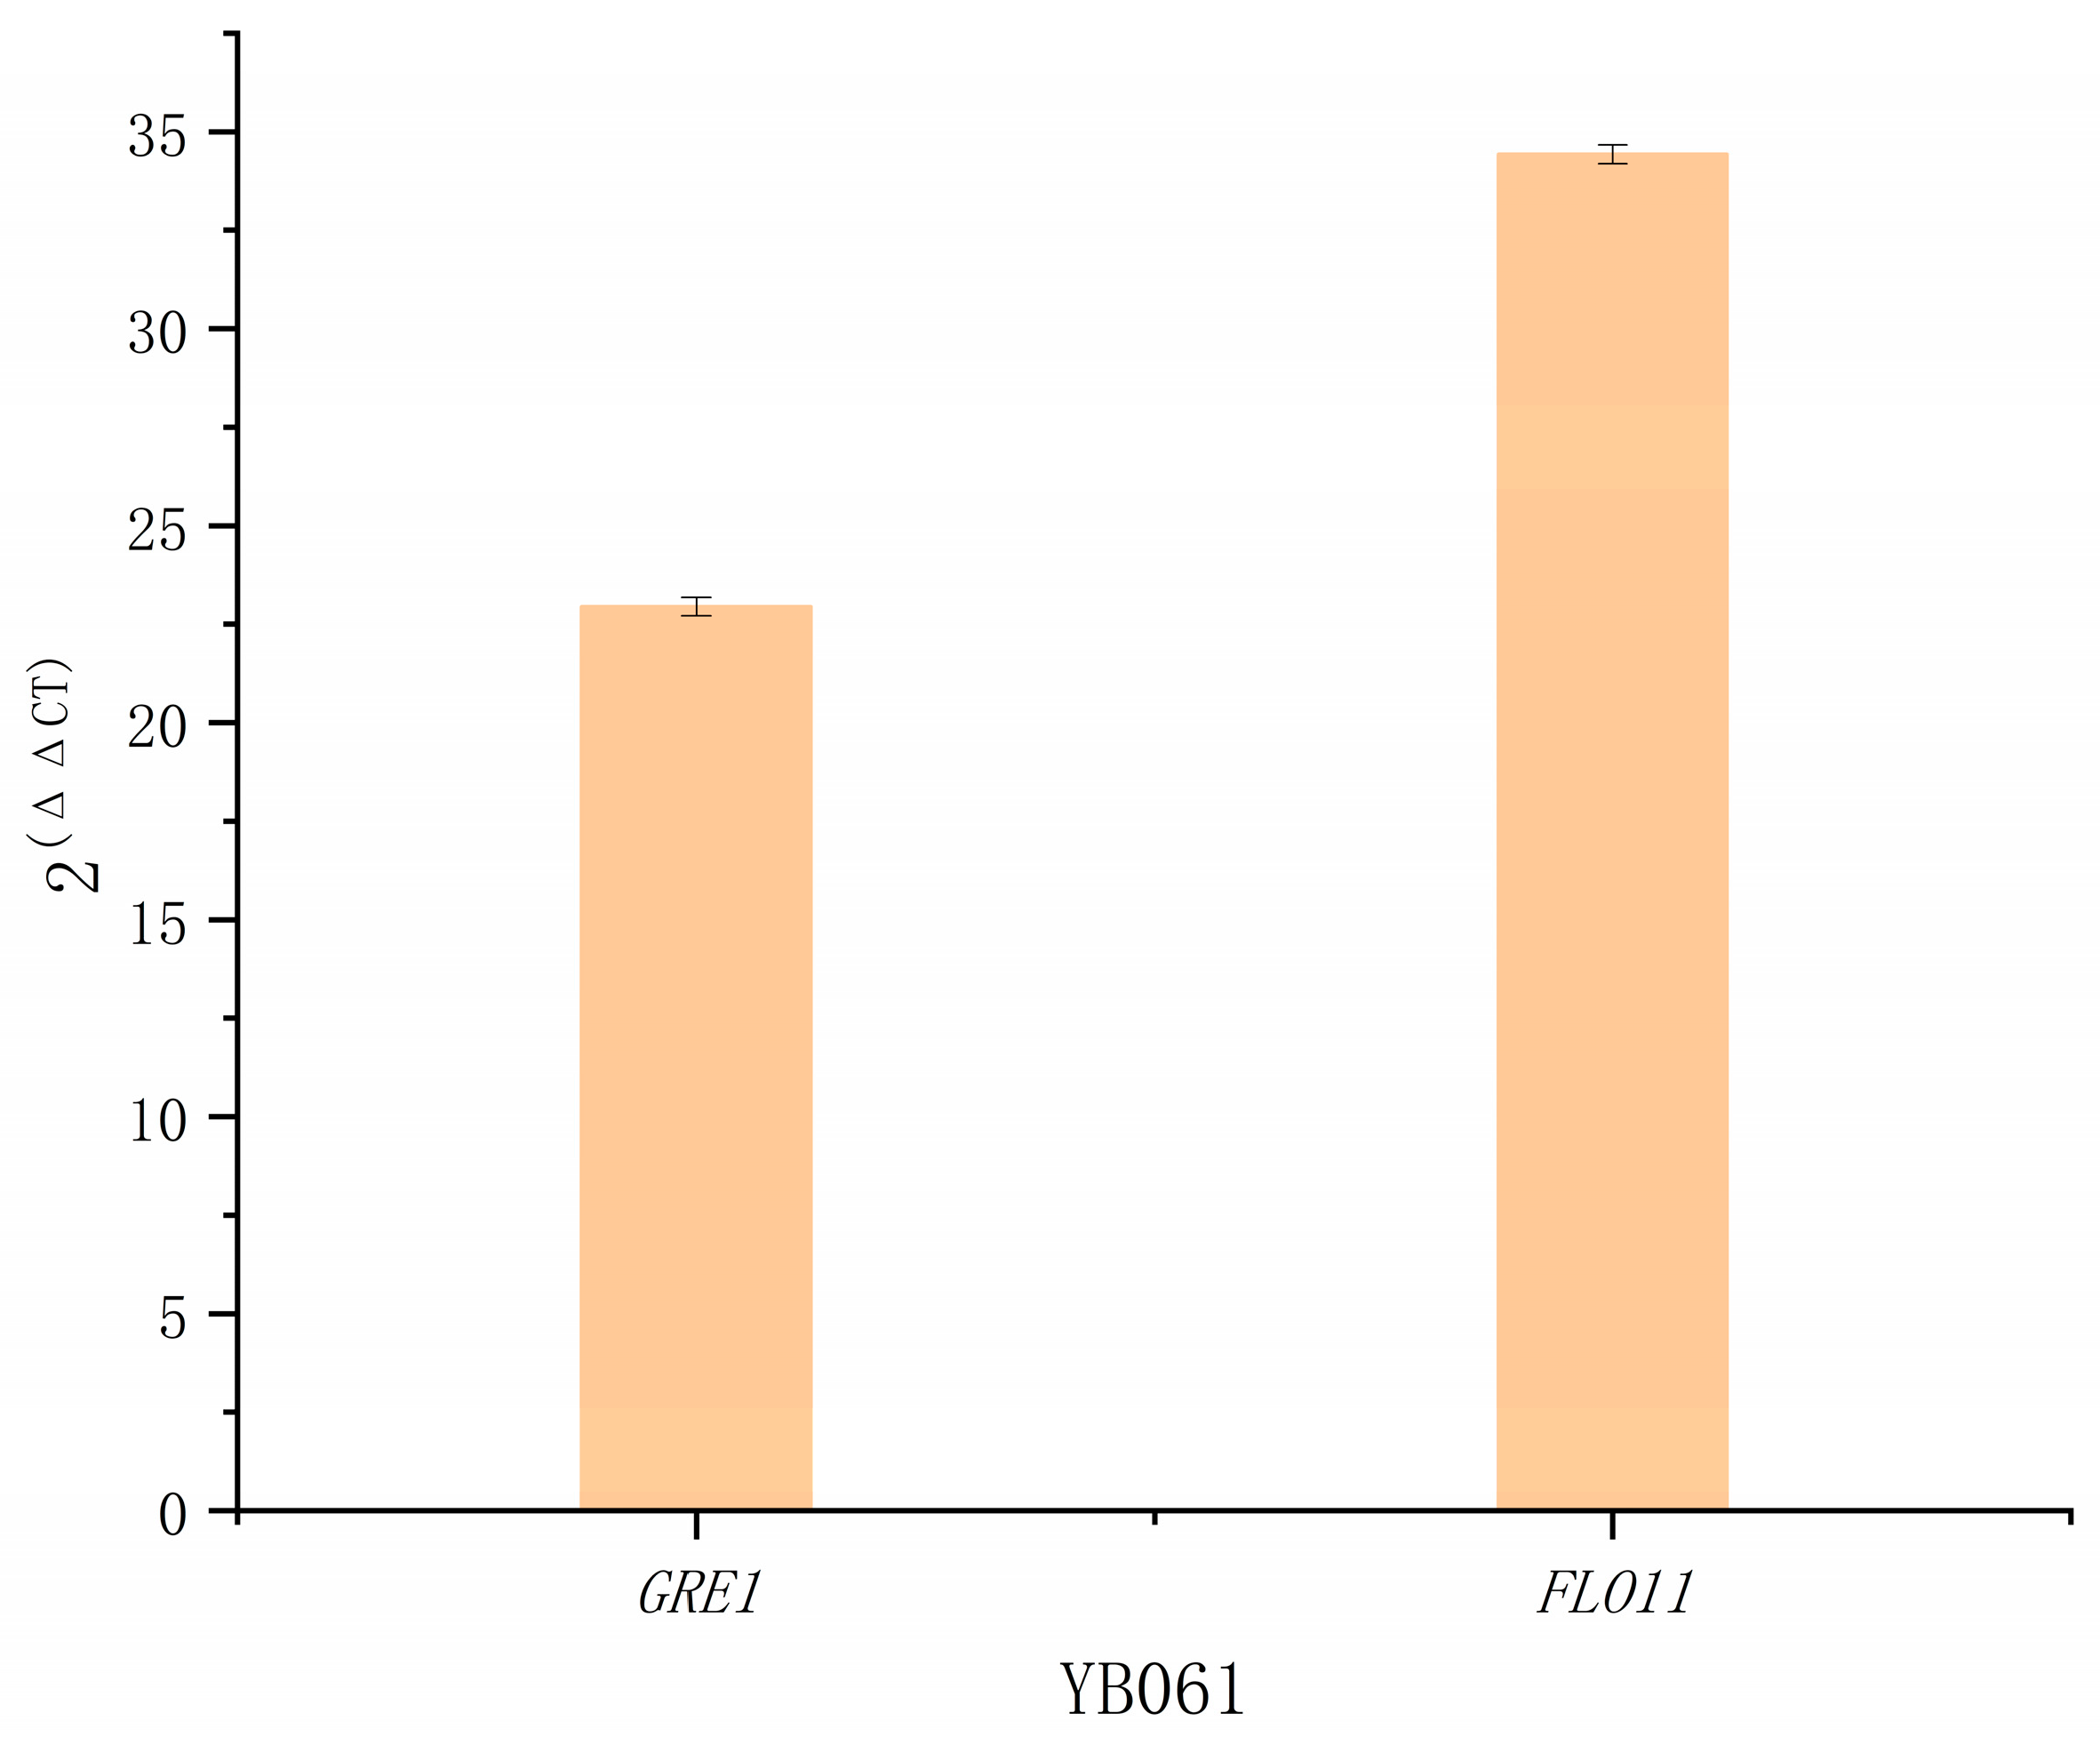
Subsequently, using YB06 as the control strain and
ACT1 as the reference gene, we conducted RT-qPCR for the engineered strain YB061, which simultaneously overexpresses
GRE1 and
FLO11. As presented in
Figure A6, the transcript levels of
GRE1 (2
−ΔΔCt = 22.95) and
FLO11 (2
−ΔΔCt = 34.43) were significantly increased, demonstrating successful co-overexpression of both genes in YB061.
Figure A6.
RT-qPCR analysis of GRE1 and FLO11 expression in YB061, using ACT1 as the reference gene and YJZ45 as the control strain. Each experiment was performed with three biological replicates, and data are presented as mean ± standard deviation (SD), with error bars indicating SD.
Figure A6.
RT-qPCR analysis of GRE1 and FLO11 expression in YB061, using ACT1 as the reference gene and YJZ45 as the control strain. Each experiment was performed with three biological replicates, and data are presented as mean ± standard deviation (SD), with error bars indicating SD.
These RT-qPCR data provide solid molecular evidence supporting the correct genetic modifications and confirm the overexpression of GRE1, FLO11, and related stress-response genes. These results validate the reliability of the engineering strategy and substantiate that overexpression of GRE1 and FLO11 contributes to the enhanced growth and free fatty acid production observed in the modified strains.
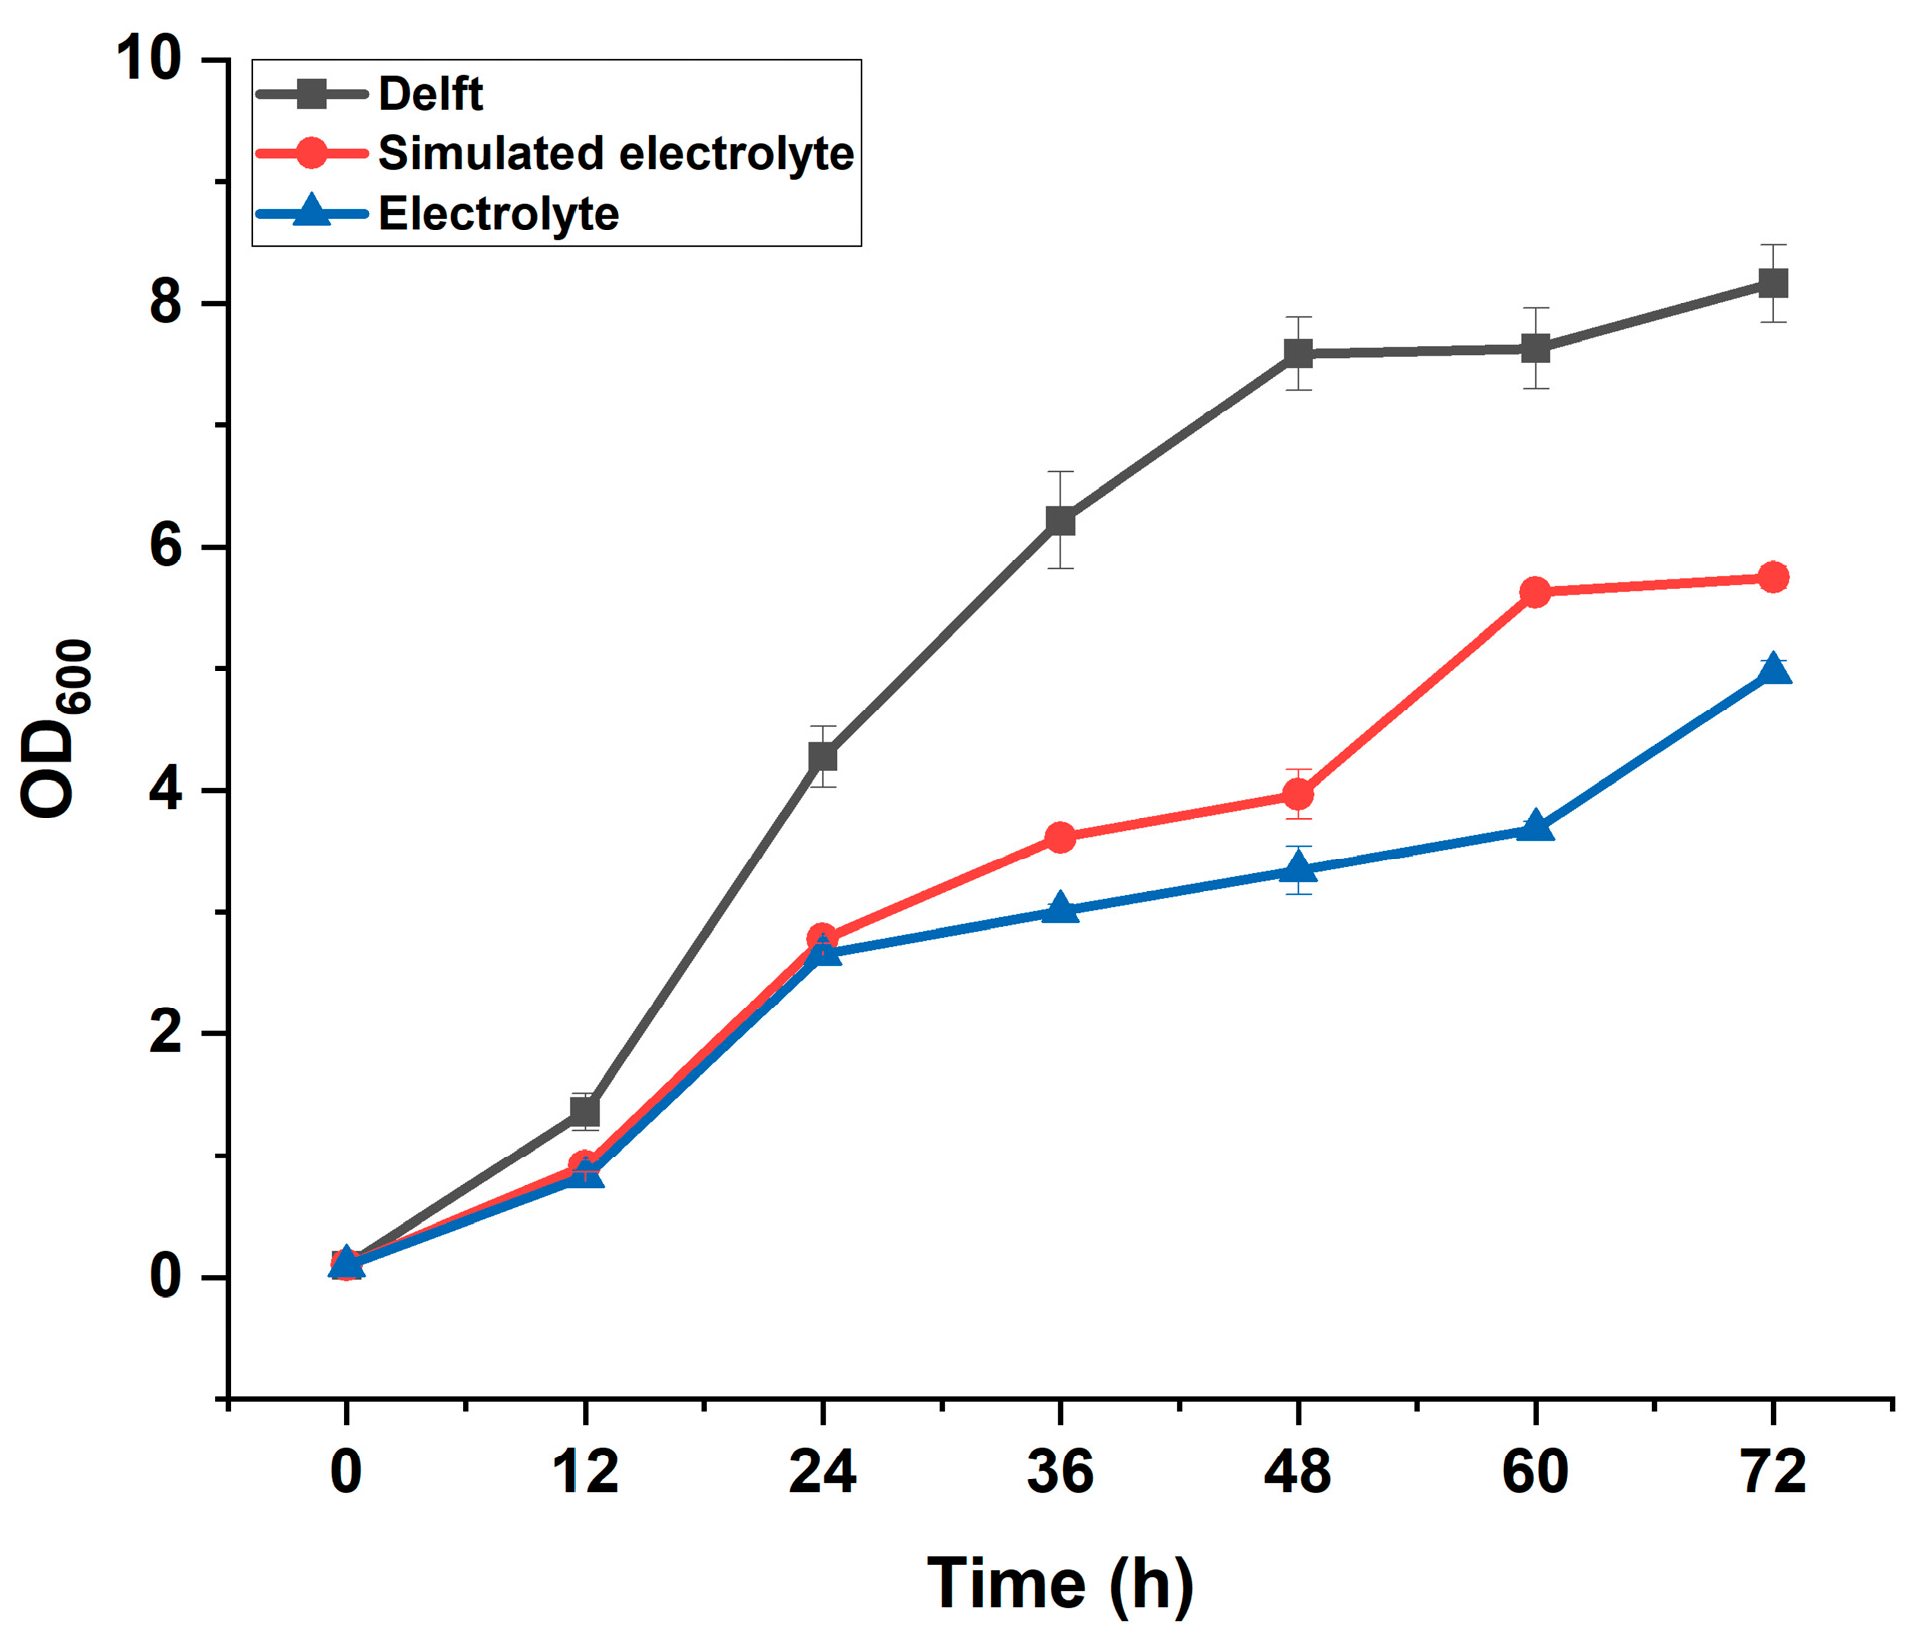
Figure A7.
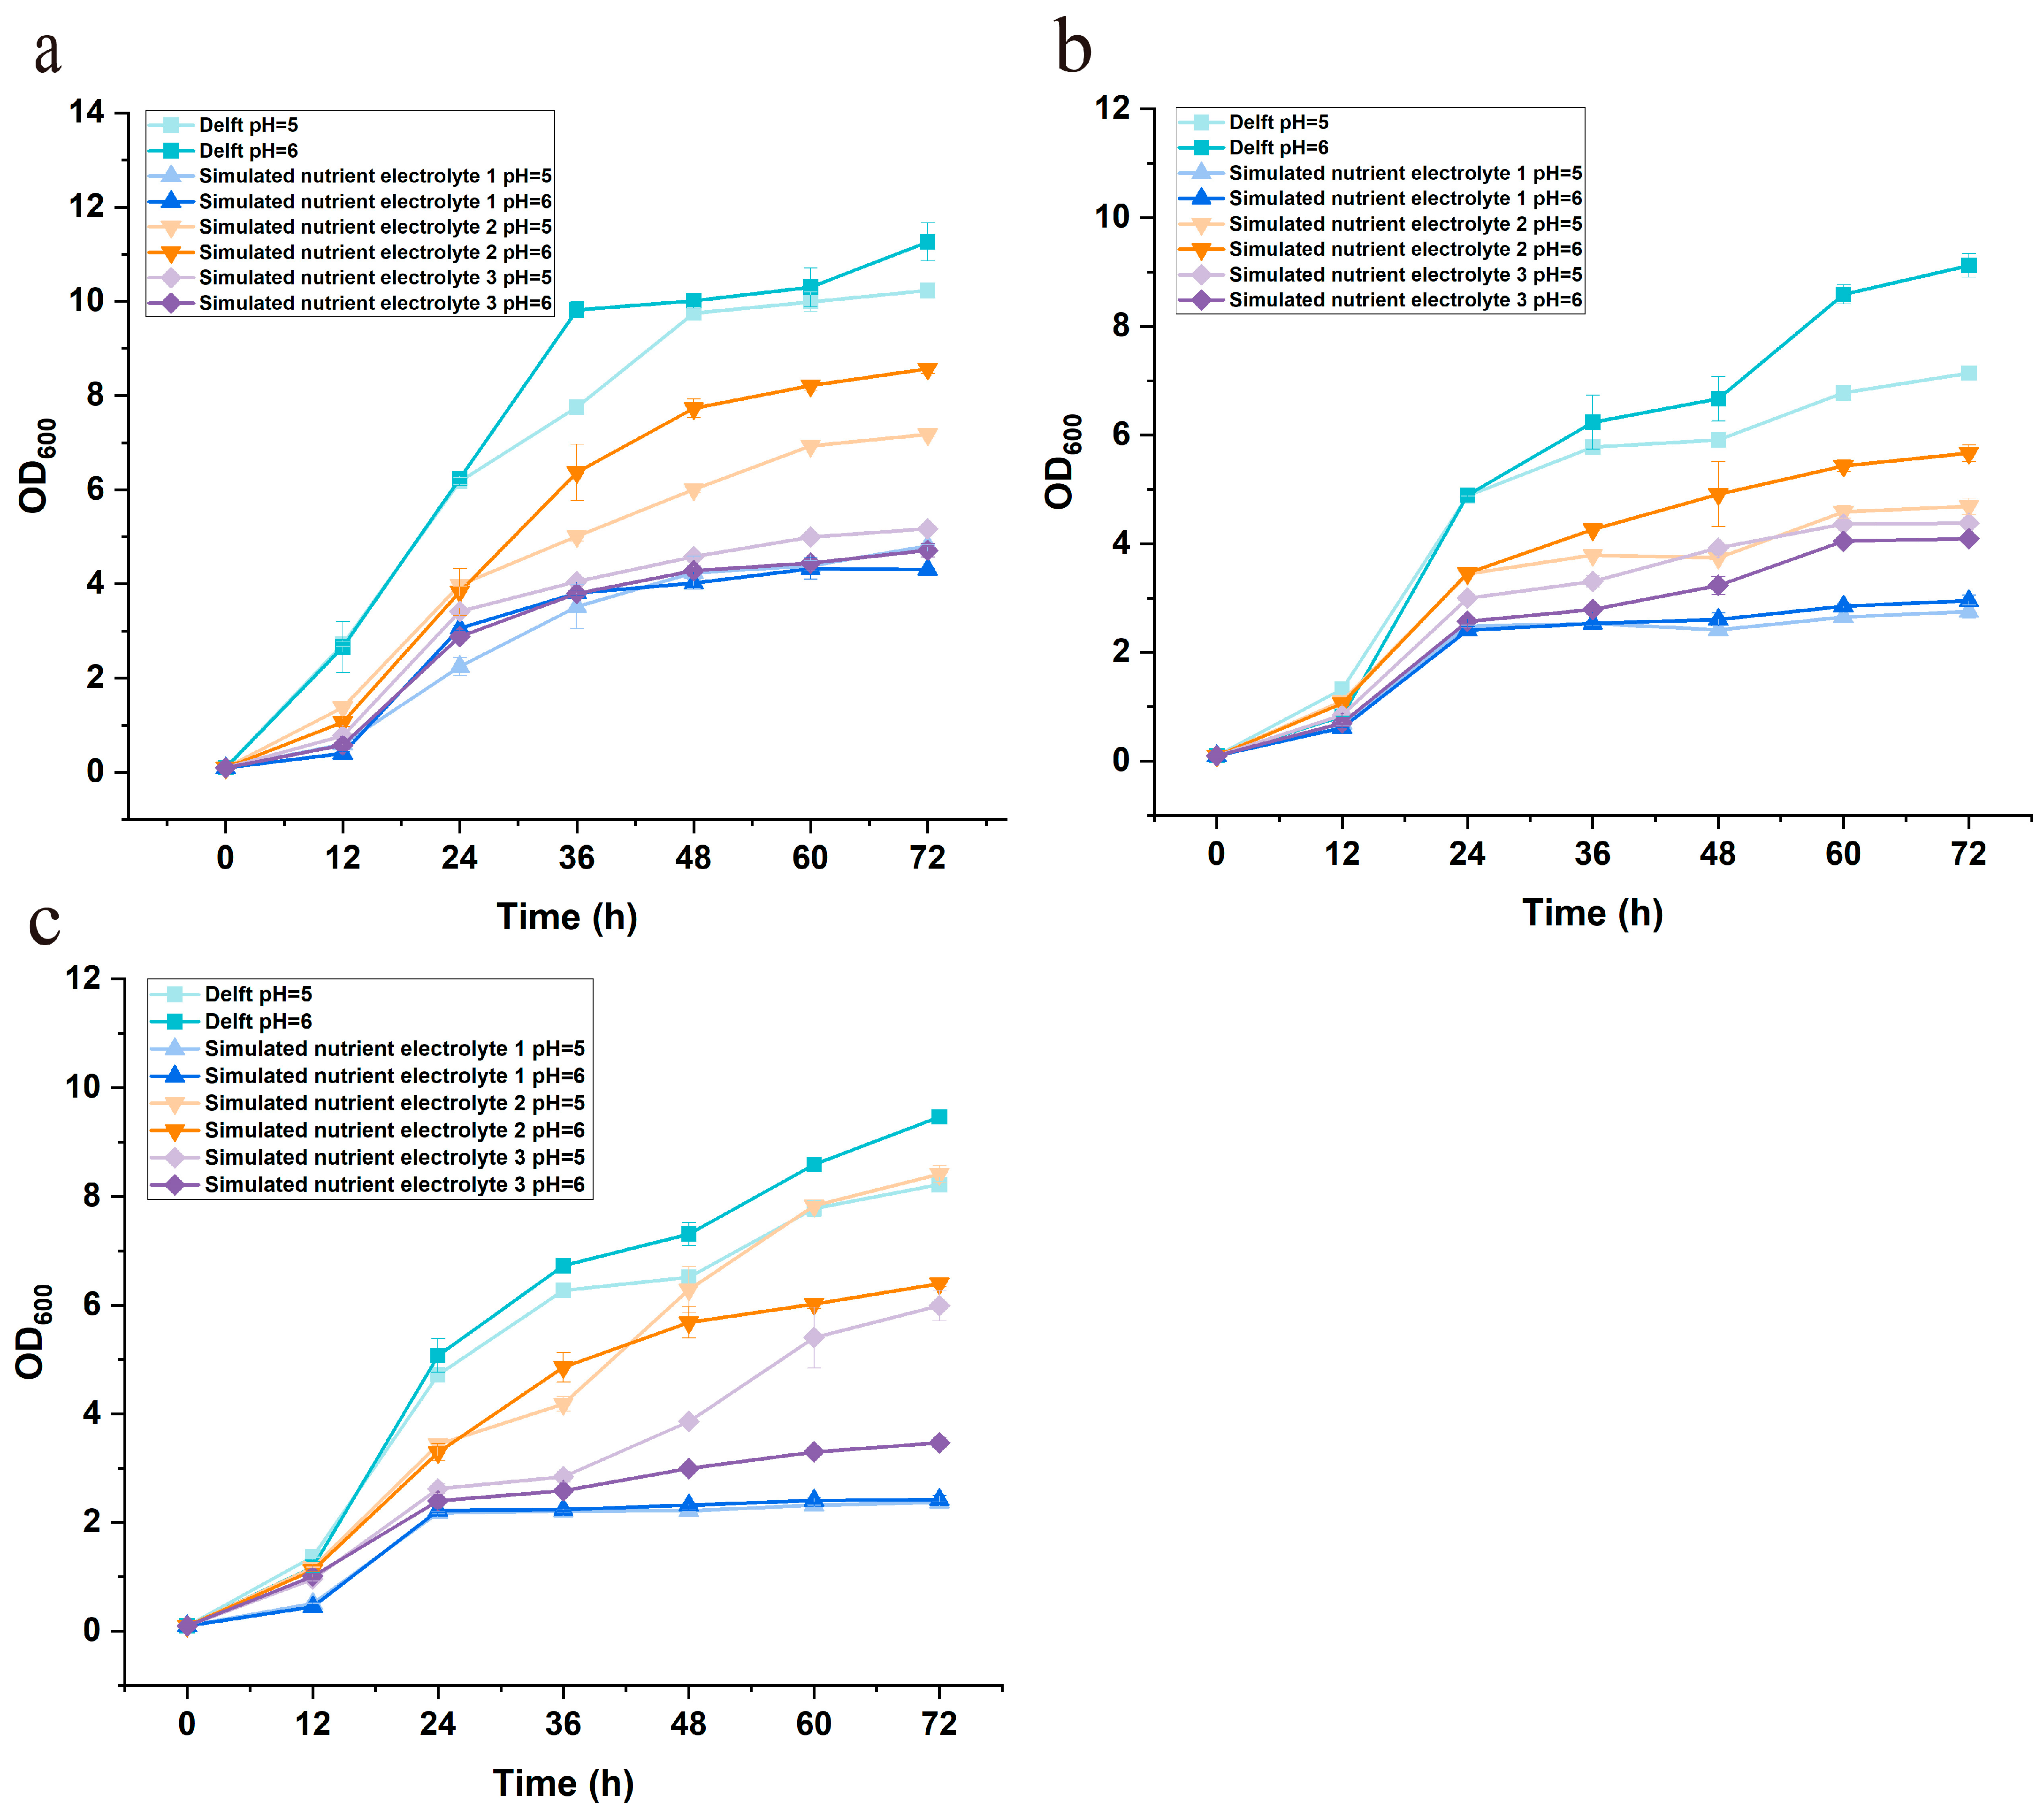
Growth profiles of the control strain YJZ45E cultivated in different media with or without formate supplementation. Each experiment was performed with three biological replicates, and data are presented as mean ± standard deviation (SD), with error bars indicating SD.
Figure A7.
Growth profiles of the control strain YJZ45E cultivated in different media with or without formate supplementation. Each experiment was performed with three biological replicates, and data are presented as mean ± standard deviation (SD), with error bars indicating SD.
Figure A8.
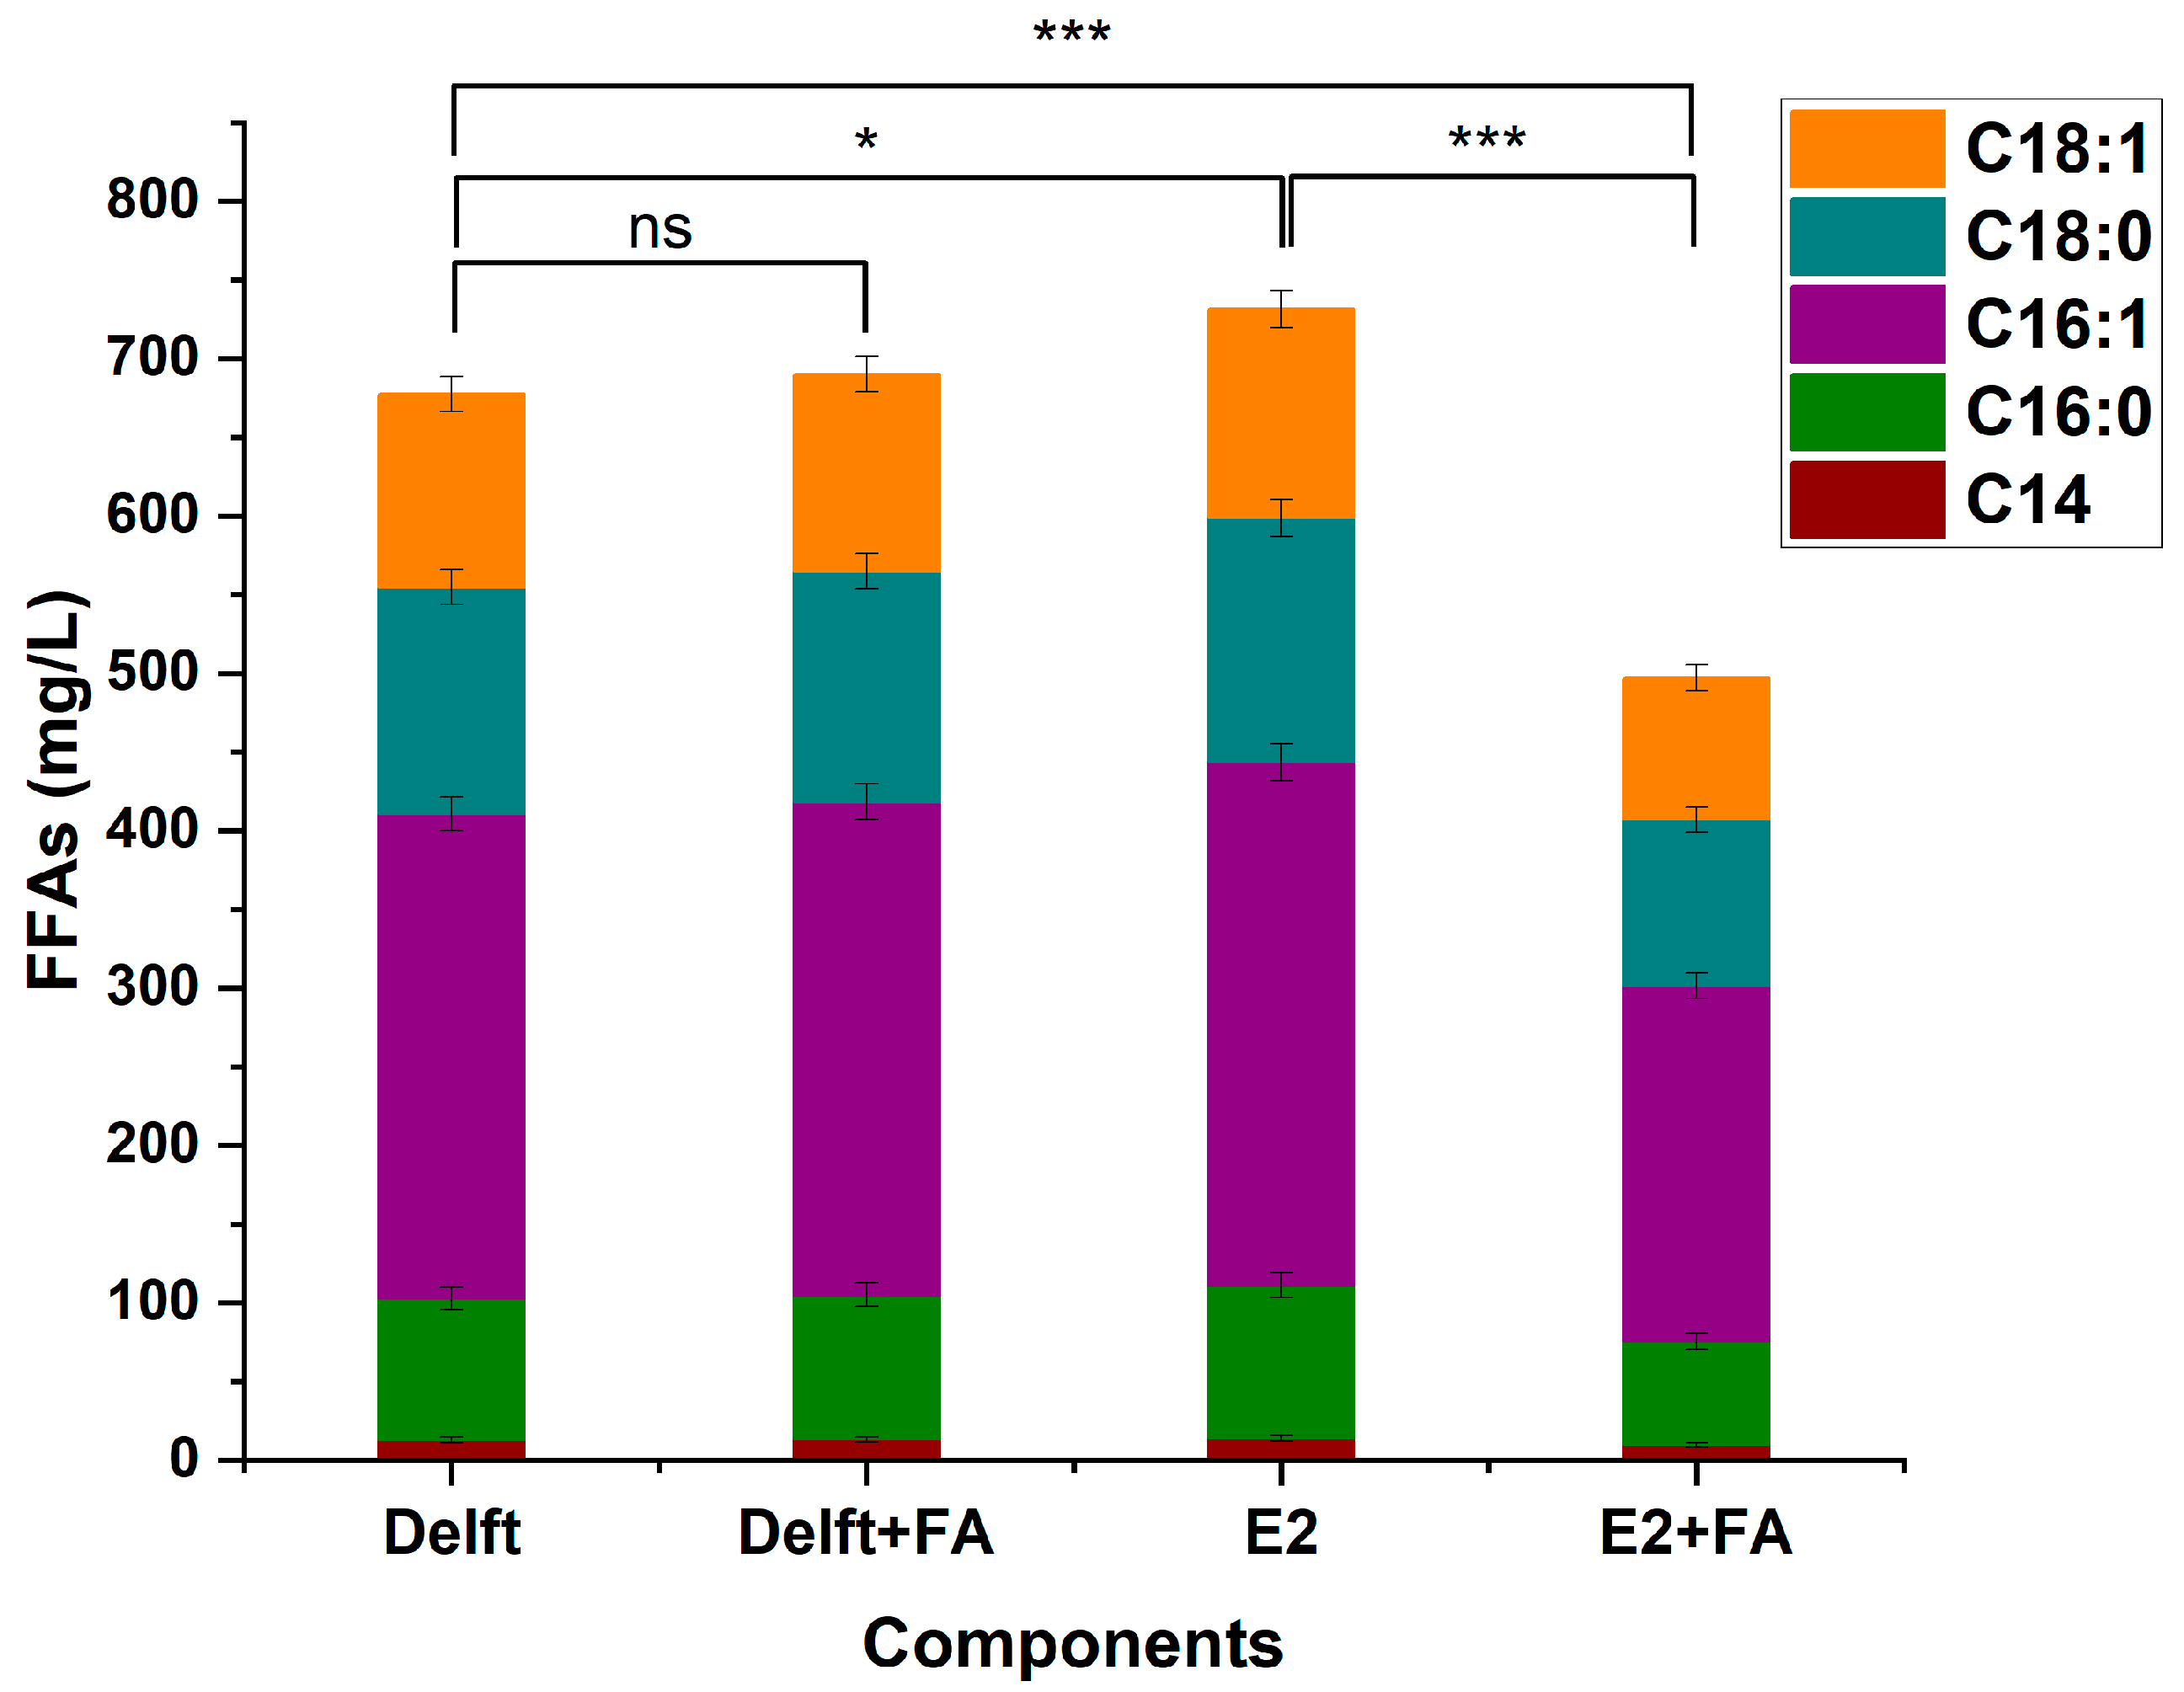
FFAs production of YJZ45E after 96 h cultivation under different medium conditions. Each experiment was performed with three biological replicates, and data are presented as mean ± standard deviation (SD), with error bars indicating SD. with error bars indicating SD. Statistical significance was assessed using the t-test: p < 0.05 is indicated by *, and p < 0.001 by ***. “ns” stands for “not statistically significant”.
Appendix B.1. Osmotic Pressure Calculation of Electrolyte Salts
To evaluate the possible osmotic pressure effect of different potassium salts, the theoretical osmotic pressure (
π) at 30 °C (303 K) was calculated using the van’t Hoff equation:
where
π is the osmotic pressure (atm),
i is the van’t Hoff factor,
M is the molar concentration (mol/L),
R = 0.08206 L·atm·mol
−1·K
−1, and
T = 303 K.
Table A9.
Theoretical osmotic pressure of different potassium salts calculated by the van’t Hoff equation.
Table A9.
Theoretical osmotic pressure of different potassium salts calculated by the van’t Hoff equation.
| Electrolyte Salt | Concentration M (mol/L) | i | π = iMRT (atm) |
|---|
| 0.5 M K2SO4 | 0.5 | 3 | 3 × 0.5 × 0.08206 × 303 ≈ 37.2 atm |
| 1 M KH2PO4 | 1.0 | 2 | 2 × 1 × 0.08206 × 303 ≈ 49.7 atm |
| 1 M KCl | 1.0 | 2 | 2 × 1 × 0.08206 × 303 ≈ 49.7 atm |
Appendix B.2. Calculation of Key Performance Metrics for the Engineered Strains
Table A10.
Summary of performance parameters for engineered yeast strains.
Table A10.
Summary of performance parameters for engineered yeast strains.
| Condition of Culture | Simulated Electrolyte with 3 g/L Formic Acid | Simulated Electrolyte with 4 g/L Formic Acid | 4 g/L Formic Acid Real Electrolyte |
|---|
| Strain | YJZ45E | YB06 | YB061 | YB061 | YJZ45E | YB06 | YB061 |
| Initial OD600 | 0.1 | 0.1 | 0.1 | 0.1 | 0.1 | 0.1 | 0.1 |
| Final OD600 (96 h) | 5.5 | 8 | 9.5 | 9.1 | 5.5 | 6.9 | 7.8 |
| Average biomass per liter(g/L) | 2.372 | 3.41 | 3.966 | 4.178 | 2.16 | 2.713 | 3.267 |
| Dry cell weight(g/L) | 3.78 | 5.53 | 6.58 | 5.4 | 3.78 | 4.76 | 5.39 |
| 96 h free fatty acid production (mg/L) | 362 | 605 | 720 | 835 | 338 | 507 | 652 |
| g FFAs/g glucose | 0.0181 | 0.0303 | 0.036 | 0.04175 | 0.0169 | 0.02535 | 0.0326 |
| g FFAs/g biomass | 0.0958 | 0.1094 | 0.1094 | 0.1546 | 0.0894 | 0.1065 | 0.121 |
| Volumetric Productivity (mg/L/h) of FFAs | 3.77 | 6.302 | 7.5 | 8.697 | 3.52 | 5.937 | 9.791 |
| Specific Productivity (g/g biomass/h) of FFAs | 0.00159 | 0.0018 | 0.00189 | 0.002081 | 0.0016 | 0.00195 | 0.00208 |
| Yield of Product on Biomass (Yp/x) (g FFAs/g biomass) | 0.06703 | 0.0766 | 0.07659 | 0.09277 | 0.0626 | 0.07455 | 0.08467 |
| Specific Growth Rate (μ) (h−1) | 0.092 | 0.1008 | 0.10551 | 0.11 | 0.0624 | 0.0664 | 0.069 |
| Average Growth Rate (g/L/h) | 0.0394 | 0.059 | 0.0685 | 0.0656 | 0.0387 | 0.049 | 0.0547 |
