Article

Meta-Analysis of Incorporating Camelina and Its By-Products into Ruminant Diets and Their Effects on Ruminal Fermentation, Methane Emissions, Milk Yield and Composition, and Metabolic Profile

1
Department of Animal Nutrition and Nutritional Diseases, Faculty of Veterinary Medicine, Kafkas University, Kars 36100, Türkiye
2
Department of Animal Nutrition and Nutritional Diseases, Faculty of Veterinary Medicine, Ondokuz Mayıs University, Samsun 55139, Türkiye
3
Department of Animal Nutrition and Nutritional Diseases, Faculty of Veterinay Medicine, Selçuk University, Konya 42250, Türkiye
4
Department of Animal Nutrition and Nutritional Disease, Faculty of Veterinary Medicine, Atatürk University, Erzurum 25240, Türkiye
5
Department of Agricultural, Food and Forestry Science (SAAF), University of Palermo, Viale delle Scienze 13, 90128 Palermo, Italy
6
Department of Livestock Management, Faculty of Veterinary and Animal Sciences, The Islamia University of Bahawalpur, Bahawalpur 63100, Pakistan
7
Department of Animal Nutrition and Nutritional Diseases, Faculty of Veterinary Medicine, Ankara University, Ankara 06070, Türkiye
*
Author to whom correspondence should be addressed.
Fermentation 2025, 11(10), 593; https://doi.org/10.3390/fermentation11100593
Submission received: 28 August 2025 / Revised: 9 October 2025 / Accepted: 11 October 2025 / Published: 16 October 2025
(This article belongs to the Special Issue Research Progress of Rumen Fermentation)

Abstract

The incorporation of Camelina sativa and its by-products (oil, meal, seeds, and expellers) into ruminant diets improves feed efficiency and reduces environmental impacts. This systematic review and meta-analysis, conducted in line with PRISMA guidelines, identified 79 studies, of which 8 met strict inclusion criteria, yielding 23 comparisons. Data were analyzed using random-effects models in R with additional meta-regression and sensitivity analyses. Camelina supplementation significantly reduced dry matter intake (DMI; MD = −0.63 kg/day, p = 0.0188) with high heterogeneity (I2 = 98.6%), largely attributable to product type and dosage. Although the pooled effect on daily milk yield was non-significant (MD = −1.11 kg/day, p = 0.1922), meta-regression revealed a significant positive dose–response relationship (β = 0.3981, p < 0.0001), indicating higher milk yield at greater Camelina inclusion levels. Camelina oil and its mixtures reduced rumen pH and methane emissions, consistent with polyunsaturated fatty acid (PUFA)-mediated suppression of methanogenesis. Impacts on milk fat and protein are inconsistent, but improvements in unsaturated fatty acid profiles, including omega-3 and conjugated linoleic acid (CLA), have been reported. Camelina also lowered milk urea (MD = −1.71 mmol/L), suggesting improved nitrogen utilization. Despite promising outcomes, substantial variability and limited sample sizes restrict generalizability, underscoring the need for standardized, long-term trials.

1. Introduction

Global livestock production is increasingly scrutinized, particularly in the ruminant sector, owing to environmental, economic, and resource sustainability concerns [1,2]. Traditional feed ingredients, such as soybean meals and maize, are resource-intensive and subject to market fluctuations, particularly in regions dependent on imports [3,4,5,6]. Therefore, increasing attention has been paid to the use of agri-food by-products [7] and non-conventional feed resources in animal diets to lower feed costs and environmental footprints [8,9,10]. However, oilseed by-products, such as linseed, safflower, crambe, and sesame cakes or meals, have great potential because of their high protein and residual lipid content [11,12,13]. Enteric methane (CH4) emissions from ruminants are increasingly emphasized in global climate negotiations because of their substantial contribution to greenhouse gas outputs [14,15]. Feed additives primarily affect volatile fatty acid (VFA) pathways and the ruminal hydrogen balance, which are major sources of methane reactivity, without impairing lactation performance [16,17,18]. The rumen-available polyunsaturated and monounsaturated fatty acids (PUFAs and MUFAs) can mitigate methane emissions [19] through responses depending on the fatty acid type [20], basal diet composition, and animal physiology [19,21]. In this context, the search for plant-based feed ingredients that improve both nutrient use efficiency and environmental performance is important for the successful transition of the livestock sector to sustainable systems [22].
Camelina sativa (false flax), a Brassicaceae oilseed crop tolerant to drought and cold, is a promising alternative feed ingredient [13,23]. Its superior nutritional quality compared to conventional grains supports its inclusion in ruminant diets [24,25,26]. Camelina seeds and their by-products (meal, expeller, and oil) contain high levels of protein, omega-3 fatty acids (α-linolenic acid), tocopherols, polyphenols, glucosinolates, and other anti-nutritional factors [27,28]. However, innovations in processing technologies, such as heat treatment, enzymatic processes, and solvent extraction, have enabled the safe inclusion of various Camelina-based products in ruminant diets [29,30]. The responses reported by experimental studies were mixed but mostly positive, with a reduction in methane emissions [24,31], improvements in the milk fatty acid profile and oxidative status [32,33], and no significant effects on feed intake, digestibility, or microbial fermentation at moderate inclusion levels [31,33]. Fermentation characteristics and methane reduction potential were comparable to those of soybean meal, highlighting its environmental potential [34]. Soybean meal can be replaced by Camelina meal without any detrimental effects on animal performance, while enhancing the PUFA profile and antioxidant properties [35]. However, high inclusion levels have been associated with reduced milk fat yield, increased fatty acid levels, and signs of glucosinolate-related toxicity [24,32].
Despite the growing body of research, findings on Camelina supplementation remain inconsistent, particularly regarding DMI, milk production, methane output, and nutrient digestibility [27]. Differences in the in vivo experiments, Camelina product type (seed, meal, oil, or expeller), doses applied, and animal species studied at various physiological stages with different basal diet compositions may account for these discrepancies [11,24]. Meta-analyses of studies conducted with brassica-derived feeds, such as those containing glucosinolates, have embraced positive to negative consequences depending on the dose and species [27]. However, none of the previous meta-analyses have focused on Camelina sativa and its by-products in ruminant diets. Additionally, the absence of a more formal quantitative synthesis hampers the ability of nutritionists and producers to make informed inclusion decisions in Camelina. Therefore, this systematic review and meta-analysis was conducted to delineate the scope, direction, and variability of Camelina’s effects on ruminant performance, rumen fermentation, methane emissions, milk composition, and metabolic indicators by consolidating data from controlled trials and identifying the factors influencing outcome variability.

2. Materials and Methods

2.1. Search Strategy

A PRISMA-compliant meta-analysis [36] was conducted to evaluate the effects of Camelina sativa and its by-products on ruminants. Three major databases (PubMed, Scopus, and Web of Science (WOS)) were searched from their inception until 6 August 2025. The search was restricted to English-language peer-reviewed articles. All studies were imported into the EndNoteTM reference management software (version 21.5, Clarivate Analytics, Philadelphia, PA, USA) for duplicate removal and subsequent screening [37]. The search query—(Camelina OR “Camelina sativa” OR Camelina meal OR Camelina oil) AND (ruminant OR dairy cow OR sheep OR cattle) AND (performance OR growth OR digestibility OR ruminal fermentation OR methane OR enteric emissions OR milk composition OR metabolic)—was applied using controlled vocabulary and Boolean operators.

2.2. Inclusion Criteria

Eligible studies were randomized or controlled in vivo trials using ruminant species (cattle, sheep, goats, buffalo, or deer). Each study included at least one treatment involving Camelina sativa or its derivatives (meal, oil, or seed) and a control group fed a basal diet without Camelina sativa. Further studies are required to report quantitative outcomes on performance (DMI and milk yield), ruminal fermentation (pH and VFAs), enteric methane, milk composition, or biochemical indicators. Both individual animal and pen-level studies were accepted if sample sizes were reported.

2.3. Exclusion Criteria

Studies were excluded if (1) they were conducted with non-ruminant animals (poultry, swine, or laboratory rodents), (2) dietary treatments did not contain supplements of Camelina sativa or its by-products, (3) quantitative results on studied variables were missing, and (4) publication type included narrative reviews, editorials, or conference abstracts without original experimental data.

2.4. Data Extraction

A structured data extraction framework was developed to ensure consistency and minimize bias across studies. Data were extracted independently by two reviewers and crosschecked for accuracy. Discrepancies were resolved through discussion until a consensus was reached. The extracted variables were as follows: (1) study identification (first author and publication year), (2) animal species and type of experimental design, (3) diet drying treatments, form and inclusion level of Camelina by-products used, and other dietary compositions, and (4) number of animals per group fed each diet, duration of full feeding period and time supporting ruminal cannula insertion, and all relevant outcome metrics. Group-level data (mean, standard deviation, and sample size) were recorded for each comparison. When standard errors (SEs) were reported, they were converted to standard deviations (SDs) using the formula: SD = SE × √n. If multiple inclusion levels of Camelina sativa were tested within a study, each level was considered an independent comparison, assuming distinct animal groups. When units differed among the studies, the outcomes were standardized for consistency before the meta-analysis. The main outcomes were grouped into four categories: (1) growth performance (dry matter intake (DMI) and milk yield), (2) ruminal fermentation and methane emissions, (3) milk composition (milk protein and milk fat), and (4) metabolic biochemical parameters (blood metabolites). Seven studies were included for DMI, four for milk yield, three for methane emissions and fermentation, eight for milk composition (four protein-related and four fat-related), and five studies related to biochemical attributes.

2.5. Risk of Bias Assesment

The methodological quality and risk of bias of all included in vivo studies were assessed using the SYRCLE Bias (RoB) tool [38], which was specifically adapted from the Cochrane framework for animal intervention studies. The tool covers ten key domains: sequence generation, baseline characteristics, allocation concealment, random housing, blinding of caregivers and outcome assessors, completeness of outcome data, selective reporting, and other potential sources of bias. Two reviewers independently evaluated each study using SYRCLE’s risk of bias tool. Discrepancies were resolved through discussion until consensus was reached. Each domain was rated as having a low, moderate, or high risk of bias, based on the level of methodological rigor and reporting transparency. The overall risk of bias for each study was summarized by aggregating the domain-level judgments.

2.6. Statistical Analyses

Statistical analyses were conducted in R (version 4.4.2) using the “metafor” (version 4.6-0) [39] and “meta” (version 7.0-0) [40] packages within RStudio (version 2025.09.1+401, “Cucumberleaf Sunflower” release) and Quarto (version 1.7.32). The restricted maximum likelihood (REML) estimator was used because heterogeneity among the study results was expected, and an independent random-effects meta-analysis was applied to each outcome group. The extracted outcomes were categorized into four major groups: (1) growth performance (dry matter intake and milk yield), (2) ruminal fermentation and methane emissions, (3) milk composition (milk protein and fat), and (4) metabolic and biochemical parameters (blood metabolites). Separate random-effects meta-analyses were performed for each group to ensure outcome-specific effect estimation and to avoid pooling heterogeneous variables within a single model. Data were analyzed using the mean differences (MDs) for continuous outcomes measured in consistent units, and standardized mean differences (SMDs; Hedges’ g) for outcomes reported on non-comparable scales. Between-study heterogeneity was assessed using Cochran’s Q test, between-study variance (τ2), and the I2 statistic, where I2 values of 25%, 50%, and 75% were interpreted as low, moderate, and high heterogeneity, respectively. To explore potential sources of heterogeneity, mixed-effects meta-regression models were used [41], particularly for variations in outcome type, Camelina inclusion level, and product form. Forest plots were used to visualize the pooled effect sizes, and funnel plot symmetry and Egger’s regression test were applied to detect potential publication bias [42]. When asymmetry was detected, the trim-and-fill method was used to estimate the adjusted pooled effects. Sensitivity analyses were performed using the leave-one-out approach [43] and influence diagnostics (Cook’s distance and studentized residuals) to evaluate the robustness of the results. All findings were interpreted at a significance level of α = 0.05 and reported in accordance with the PRISMA 2020 guidelines.

3. Results

3.1. Study Selection

The study selection process adhered to the PRISMA (Preferred Reporting Items for Systematic Reviews and Meta-Analyses) guidelines to ensure methodological transparency and reduce selection bias [36]. We identified 79 studies in the initial systematic search, covering three major databases (PubMed, Scopus, and Web of Science (WOS)). The review included quantitative and qualitative research, of which 51 were quantitative and 27 were qualitative. This step reduced the number of relevant studies to 51, following the identification and removal of a single duplicate record. Of these 51 studies, 30 were open-access and 21 were not accessible for free and were thus excluded due to availability restrictions. This returned 30 open-access works for title and abstract screening. Ten studies were excluded from abstract screening. This left a pool of 20 studies that were eligible for full-text screening. Twelve studies were excluded (four in vitro studies and eight with insufficient data for meta-analytical synthesis, such as means, standard deviations, or sample sizes). Eight studies met the inclusion criteria and were included in the meta-analysis. The flow of the selection process is outlined in the PRISMA diagram (Figure 1), which summarizes the step-by-step reduction from the initial records to the final set of studies included in the quantitative synthesis.

3.2. Study Characteristics

Although the eight studies included in this meta-analysis differed in terms of animal species, experimental design, intervention type, and outcome, they all met the predefined inclusion criteria. Selected studies have been performed with dairy cows, beef heifers, or sheep under controlled feeding conditions, and are mostly designed to incorporate randomized or complete Latin square arrangements. This included oil, meal, and expeller, where the interventions comprised of these administered in different forms at inclusion levels from 2.9 to 16% of dietary dry matter for Camelina. The control group received a diet without Camelina products, which were isoenergetic and isonitrogenous. The outcomes included dry matter intake (DMI), milk production and composition, ruminal fermentation, methane emissions, blood metabolites, hormone levels, and digestibility parameters. Table 1 presents structured summaries of the study designs, intervention protocols, comparators, and measured outcomes.

3.3. Risk of Bias Assessment

Risk of bias (RoB) was evaluated for all included in vivo studies using SYRCLE’s RoB tool. Among the eight studies assessed, Christodoulou et al. (2021) [32] presented a low risk of bias, whereas the remaining seven were rated as having a moderate risk, primarily due to unclear reporting of allocation concealment and blinding procedures (Table 2).

3.4. Effects of Camelina on Ruminant Performance

3.4.1. Dry Matter Intake (DMI)

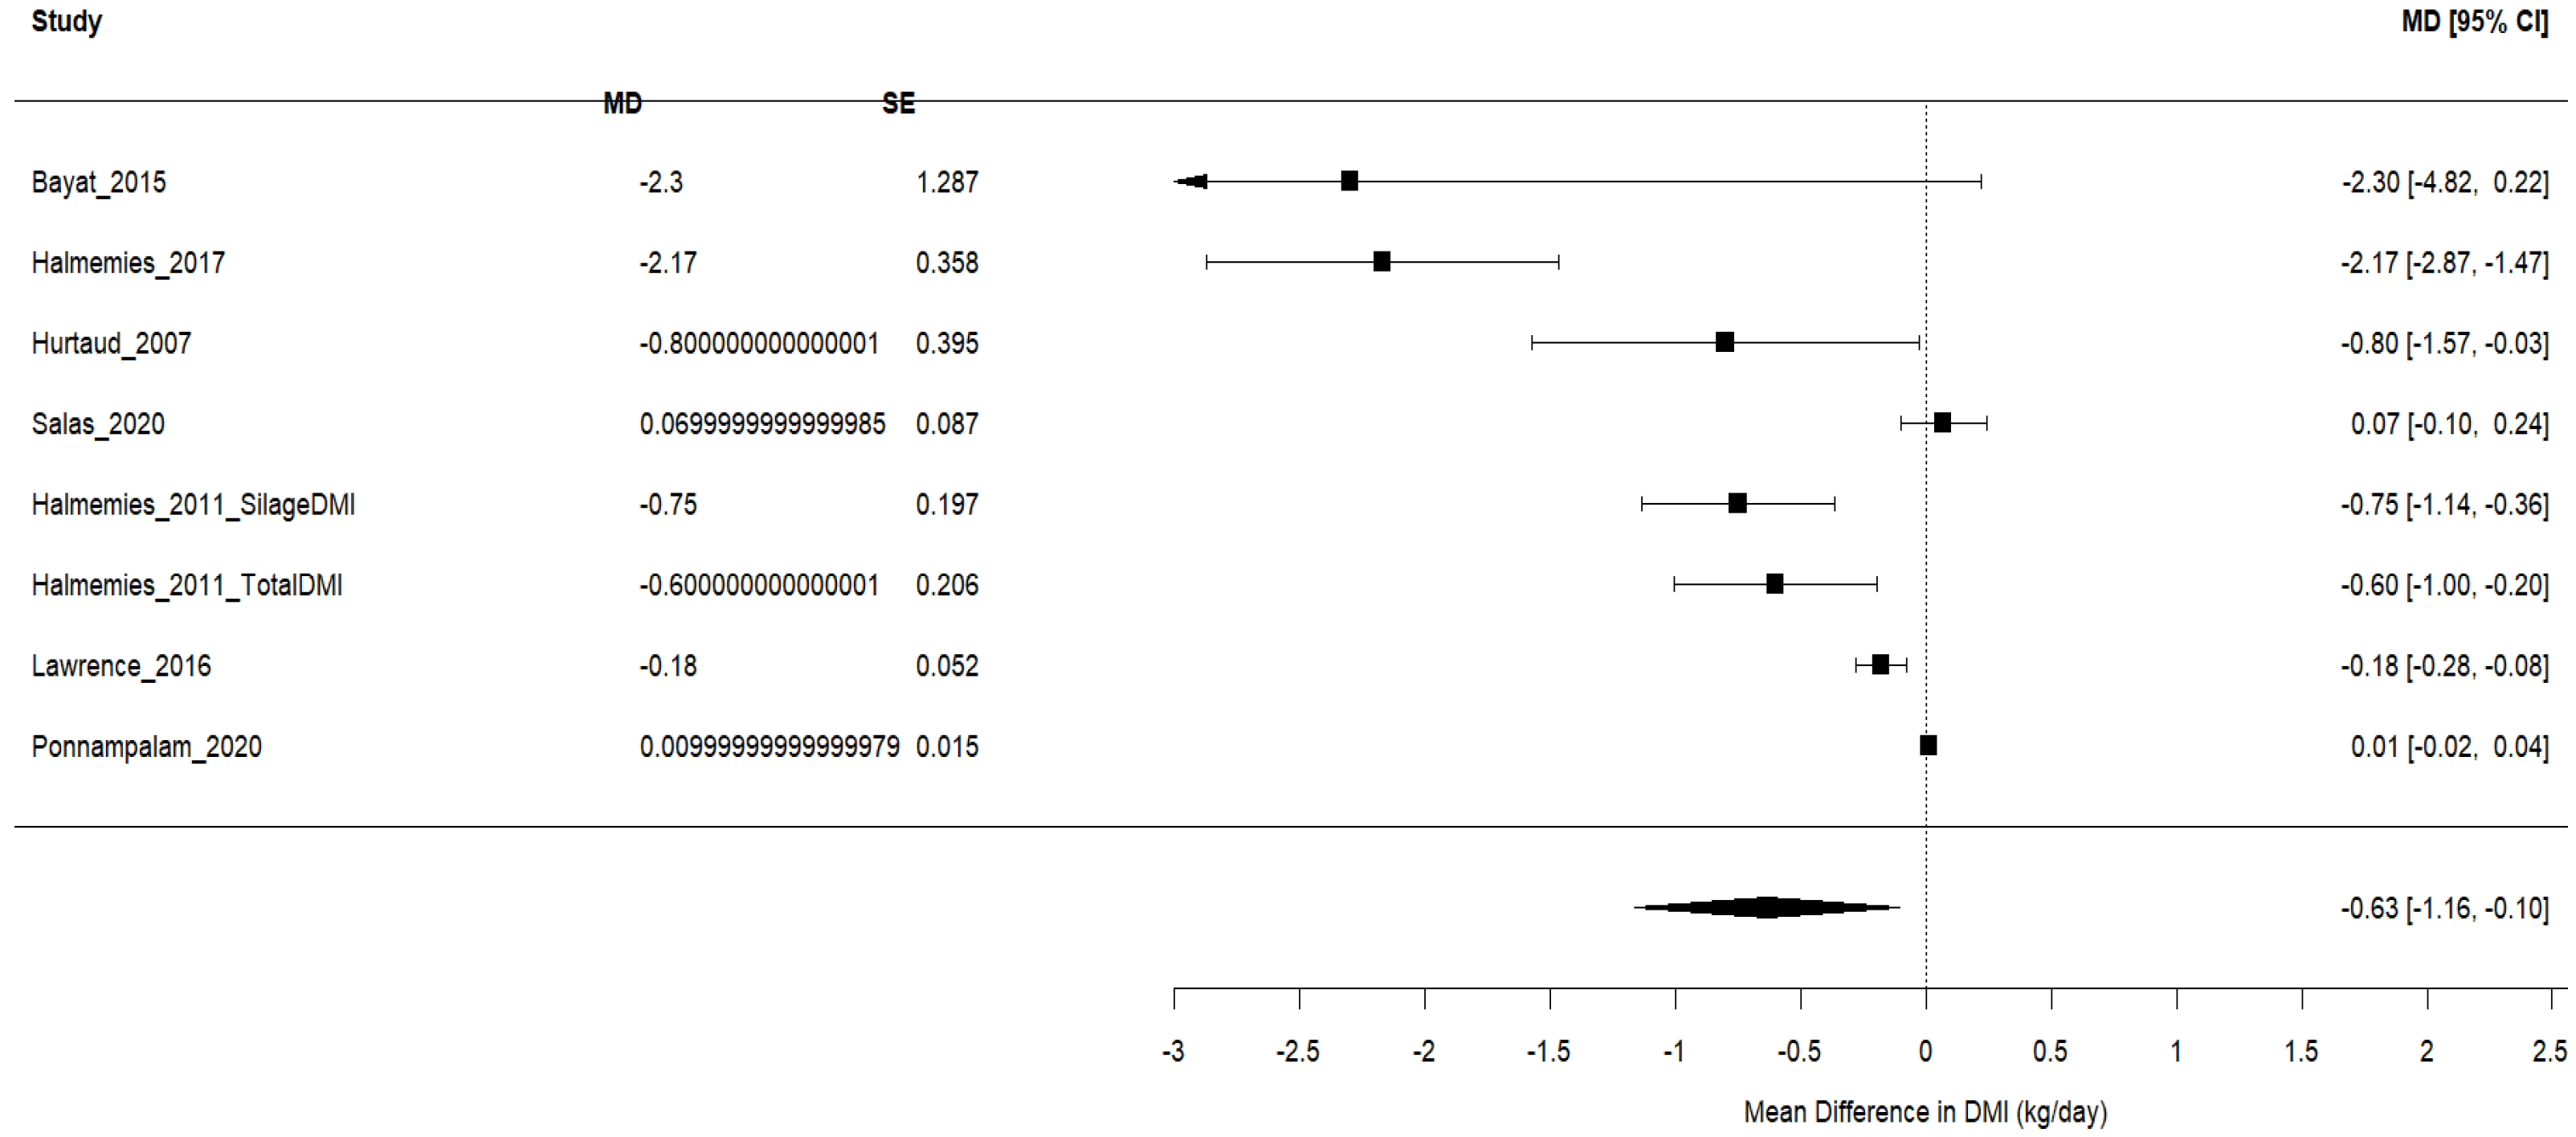
A random-effects meta-analysis of eligible studies indicated that Camelina sativa and its by-products significantly reduce dry matter intake in ruminants. The pooled mean difference was −0.63 kg/day (95% CI: −1.16 to −0.10; p = 0.0188), showing a moderate but statistical decrease of dry matter intakes (Figure 2).
Substantial between-study heterogeneity was detected (I2 = 98.6%; τ2 = 0.4803; Q (7) = 78.87, p < 0.0001), suggesting high variability among studies. For example, the effect sizes of individual studies also varied, with large reductions reported by Bayat, Kairenius [44] (−2.30 kg/day) and Halmemies-Beauchet-Filleau et al. [46] (−2.17 kg/day), while Ponnampalam et al. [49] showed near-zero effects. To explore possible moderators, subgroup meta-regression was performed using Camelina inclusion level as a continuous moderator. However, the slope coefficient was negative (β = −0.0318, p = 0.1939), indicating a non-significant trend toward greater reductions in DMI at higher inclusion rates. Moreover, neither dosage nor the Camelina product type explained the high heterogeneity (R2 = 0%).
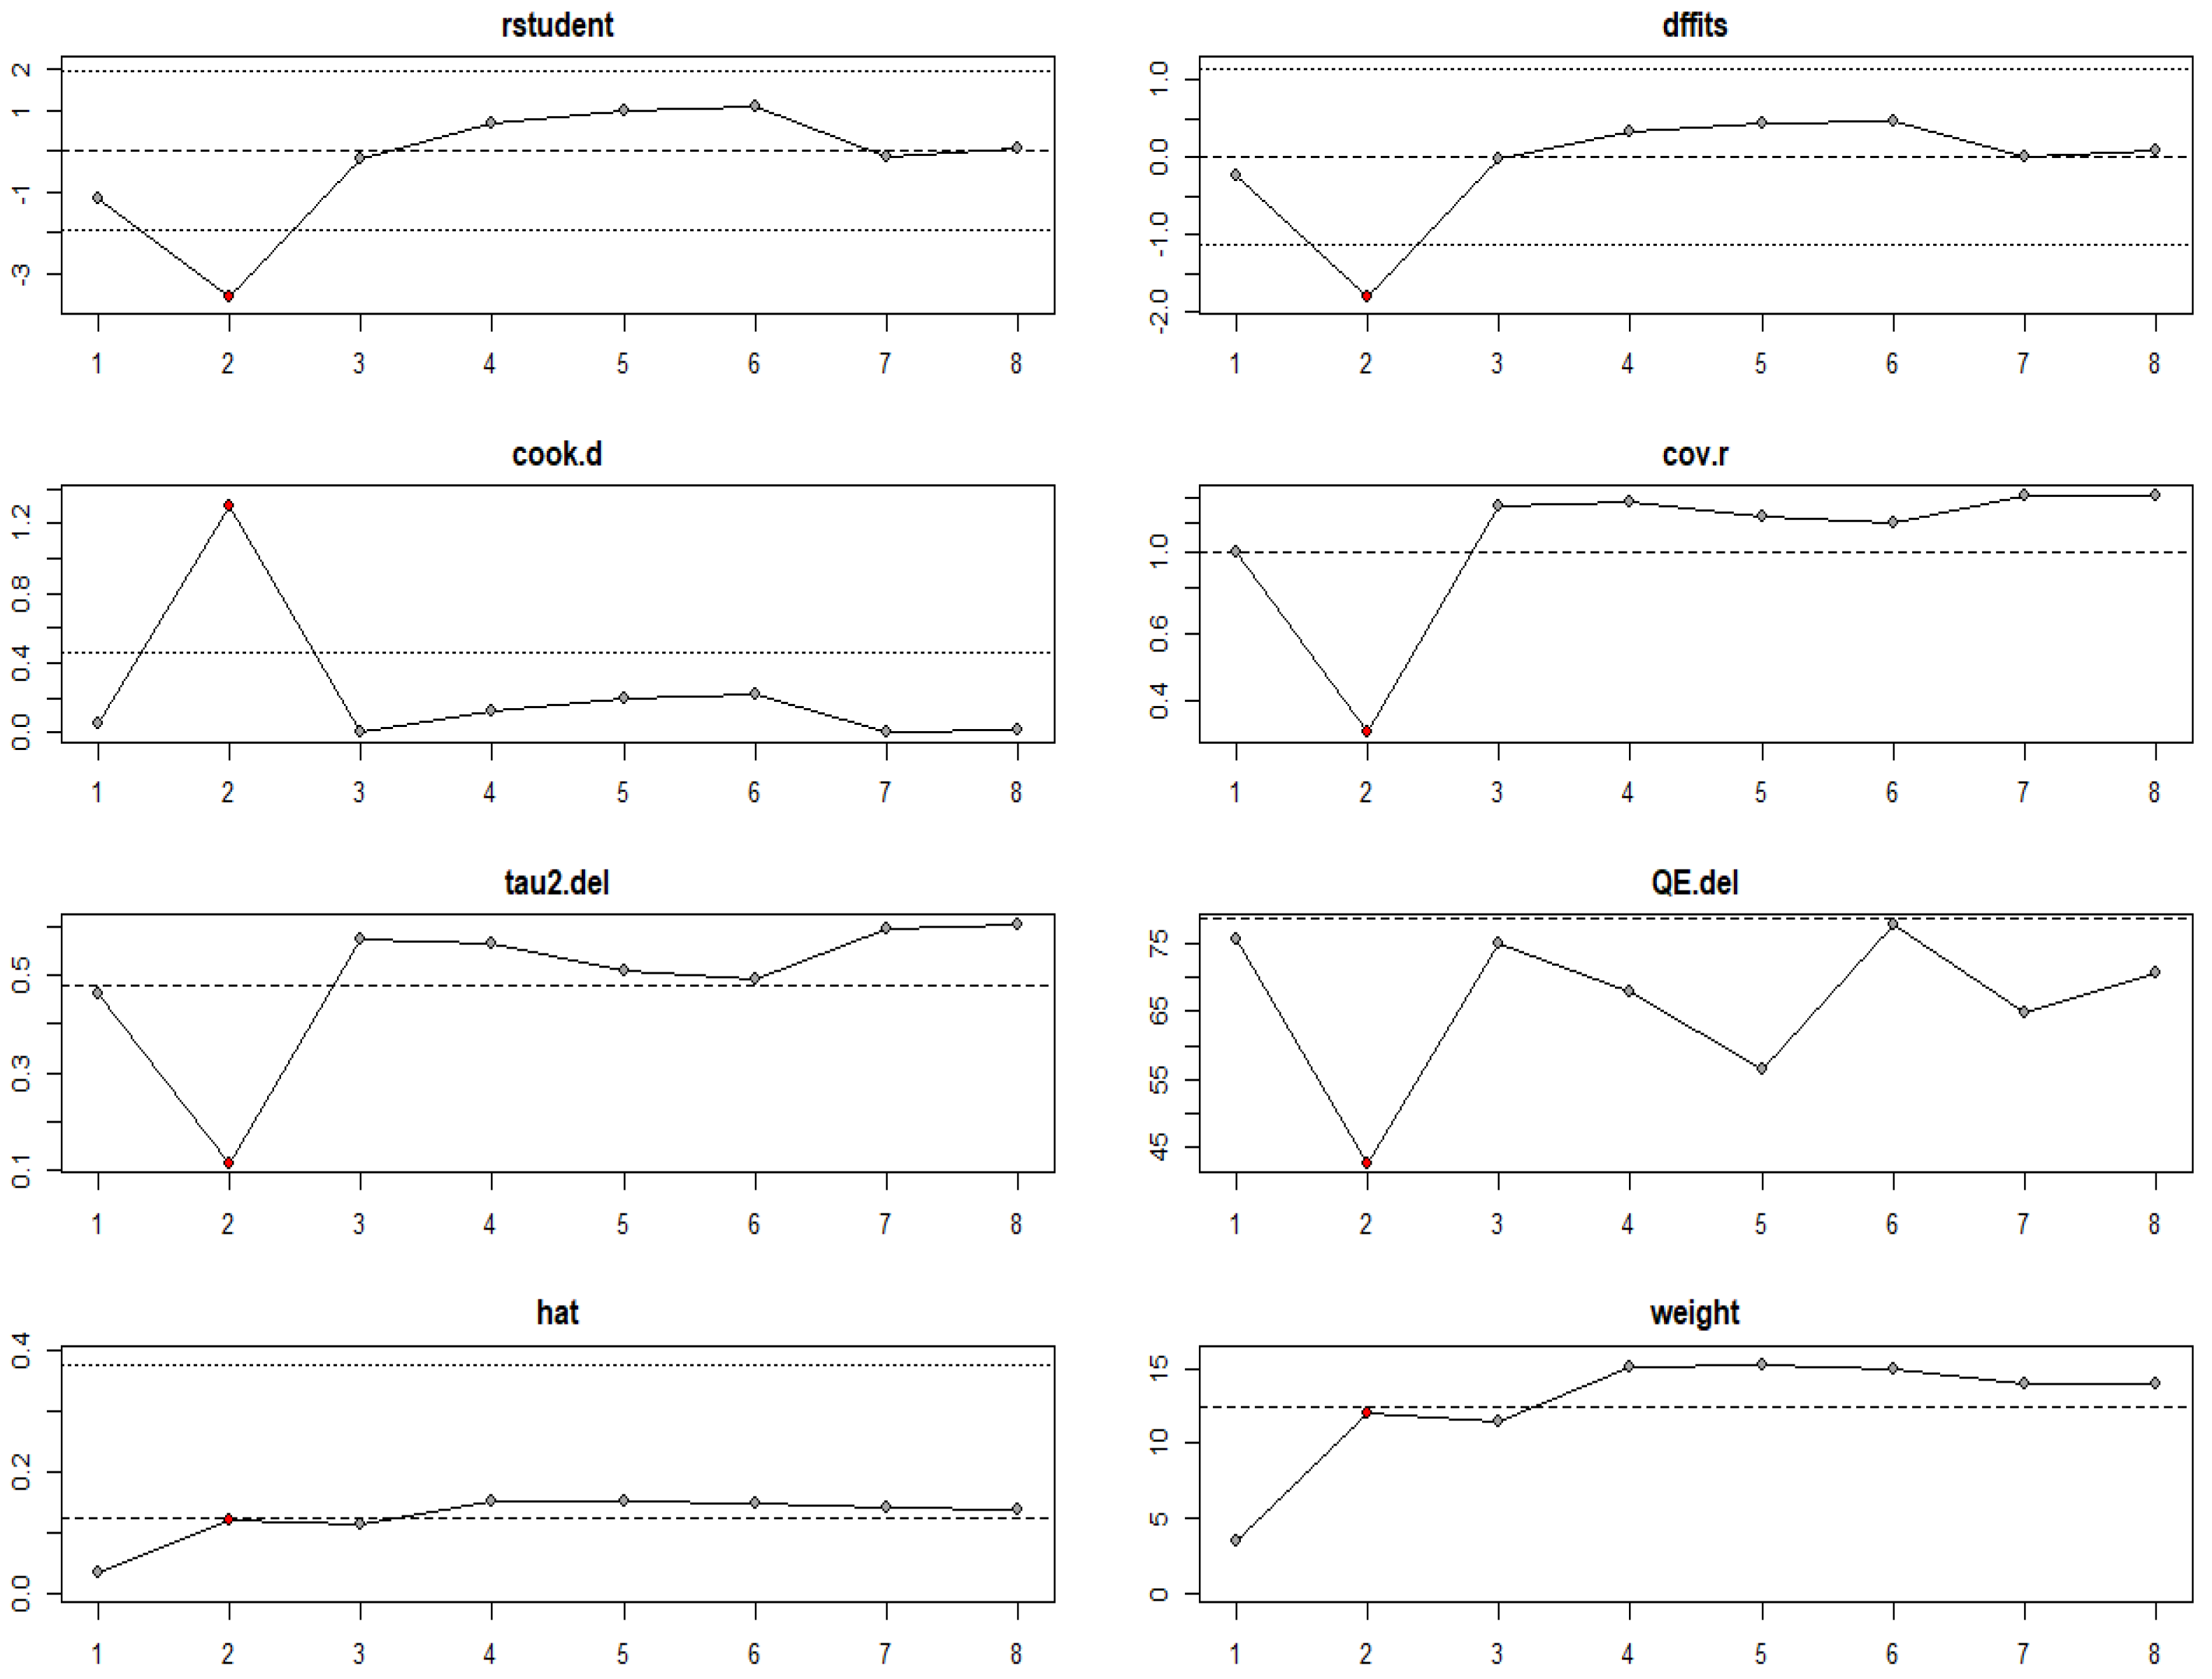
Leave-one-out sensitivity analysis showed that the pooled estimate was stable, with no individual study exerting an undue influence on the overall effect. Excluding the study by Halmemies-Beauchet-Filleau et al. [46] reduced τ2 from 0.48 to 0.12 and slightly attenuated the effect size (MD = −0.33; 95% CI: −0.63 to −0.02), confirming a moderate but non-dominating influence. Influence diagnostics (Cook’s distance, studentized residuals, and hat values) identified the study by Halmemies-Beauchet-Filleau et al. [46] as the most influential point, although it was still within acceptable limits (Figure 3).
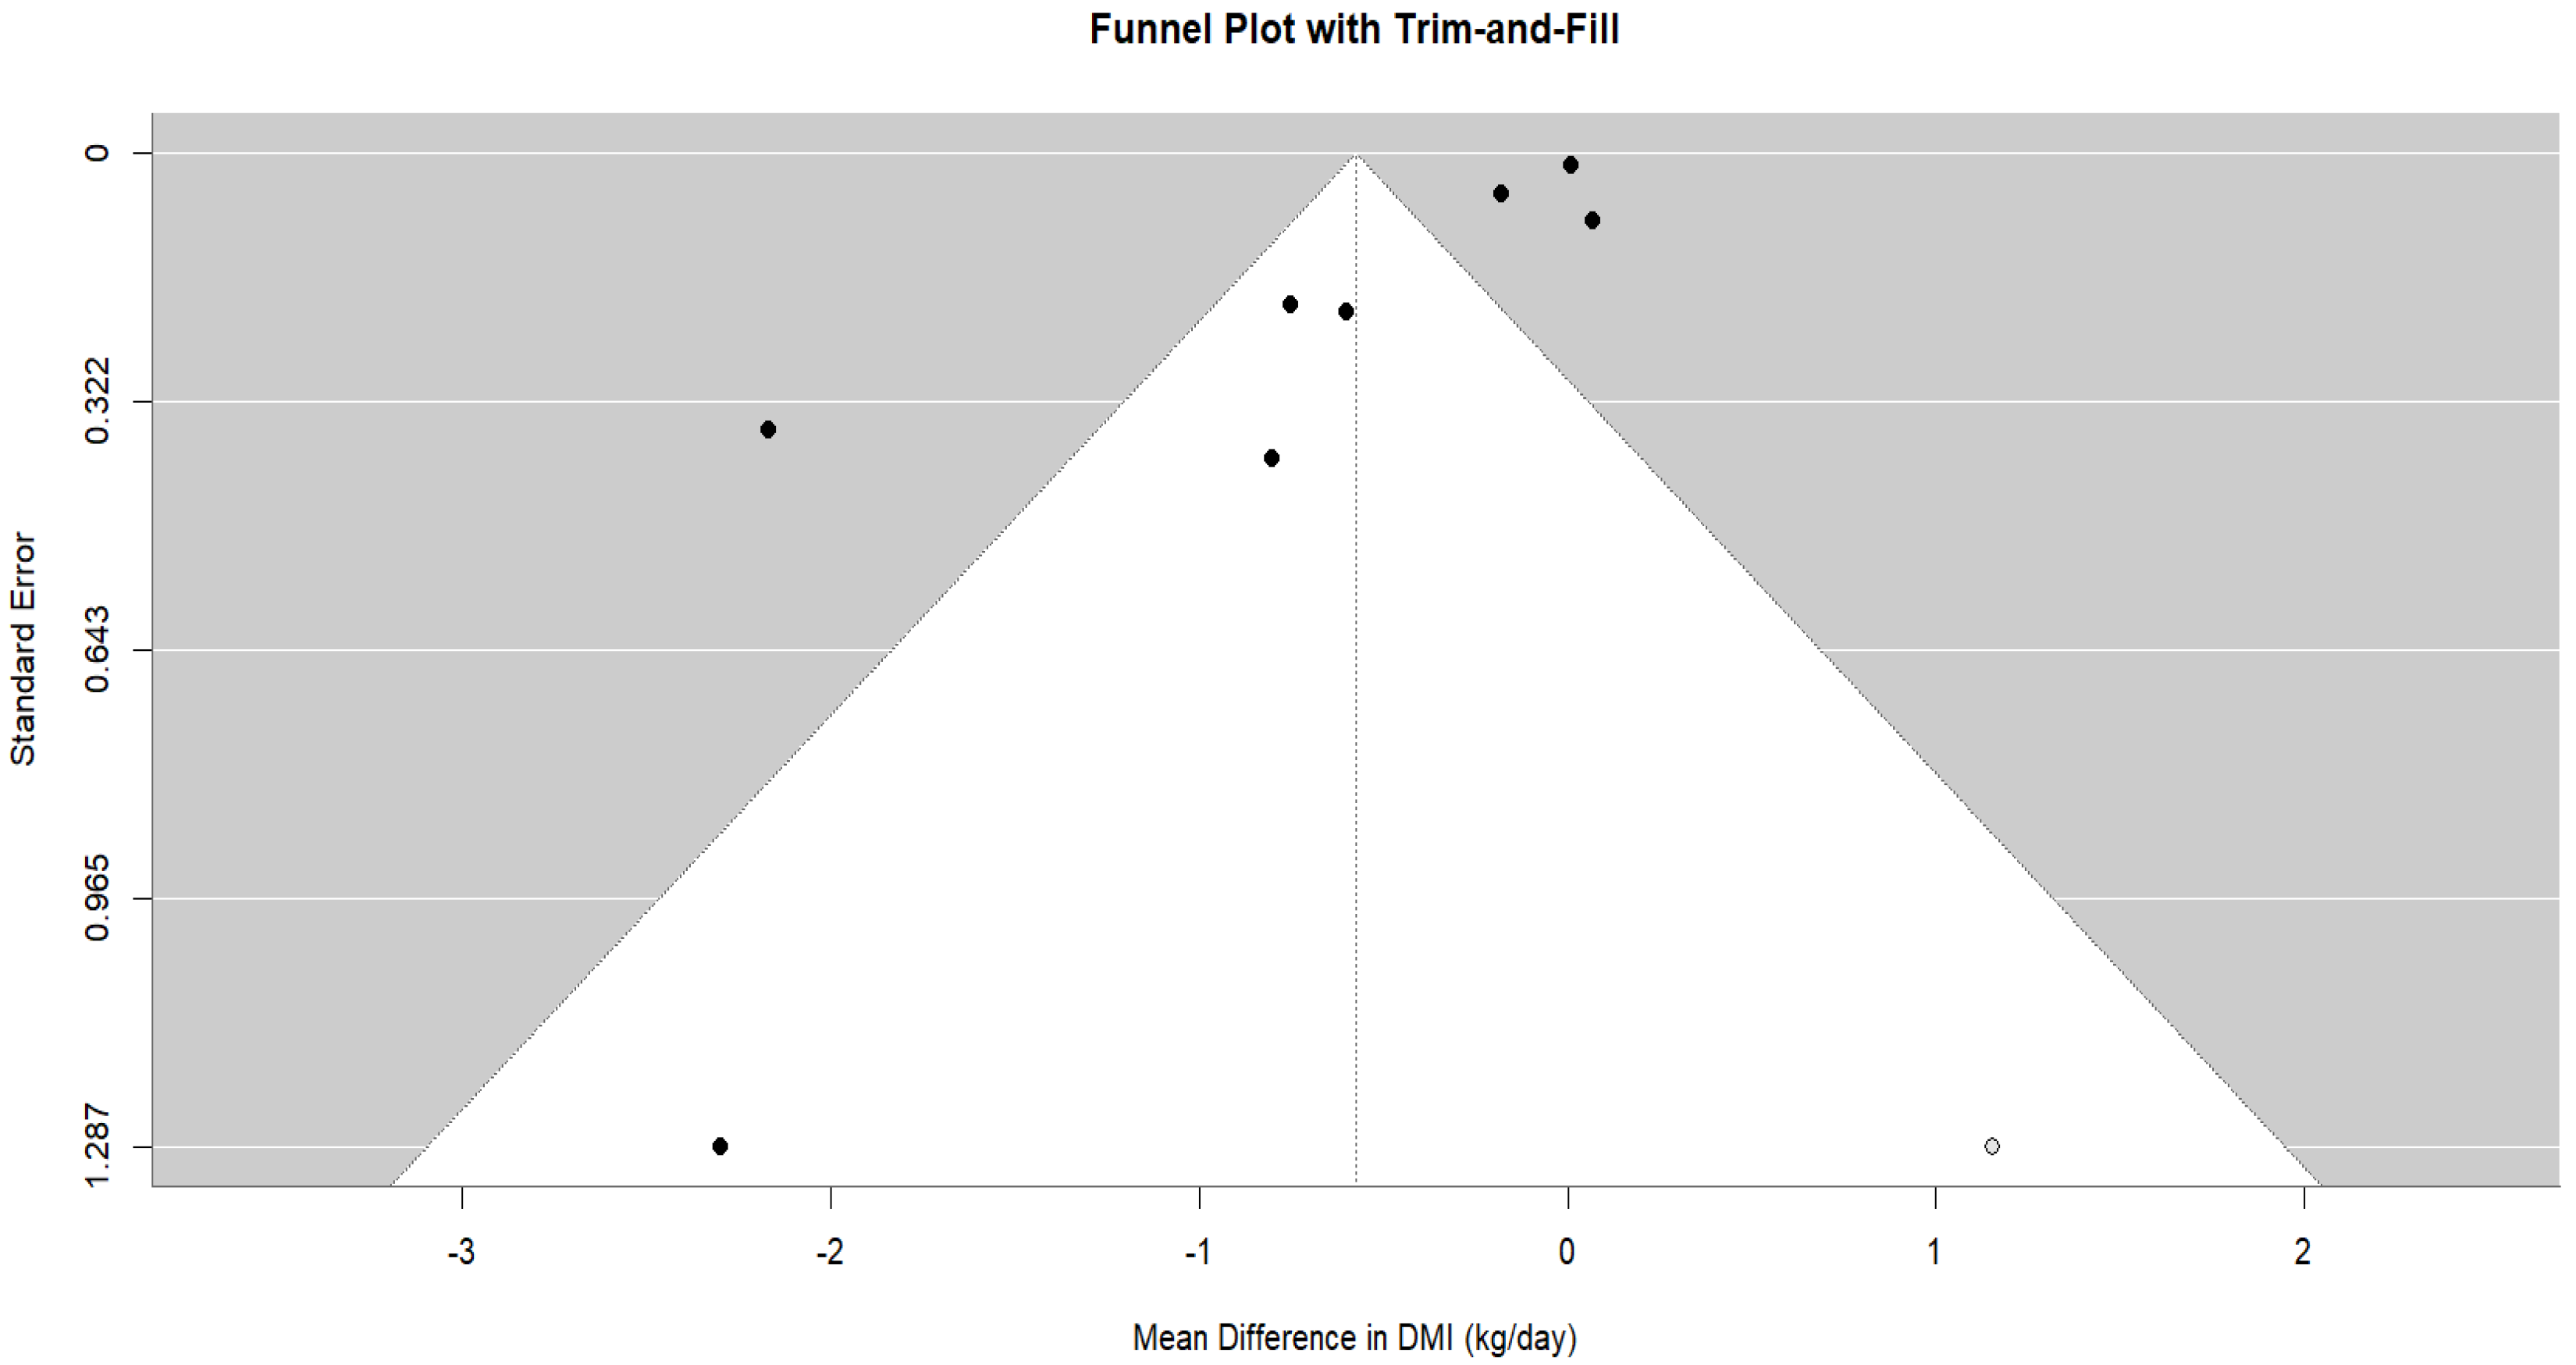
The funnel plot revealed slight asymmetry (Figure 4), which was supported by Egger’s regression test (z = −3.90, p < 0.0001), indicating potential small study effects. After imputing one missing study using the trim-and-fill method, the adjusted pooled estimate shifted slightly toward null, suggesting a minor publication bias effect.

3.4.2. Milk Yield

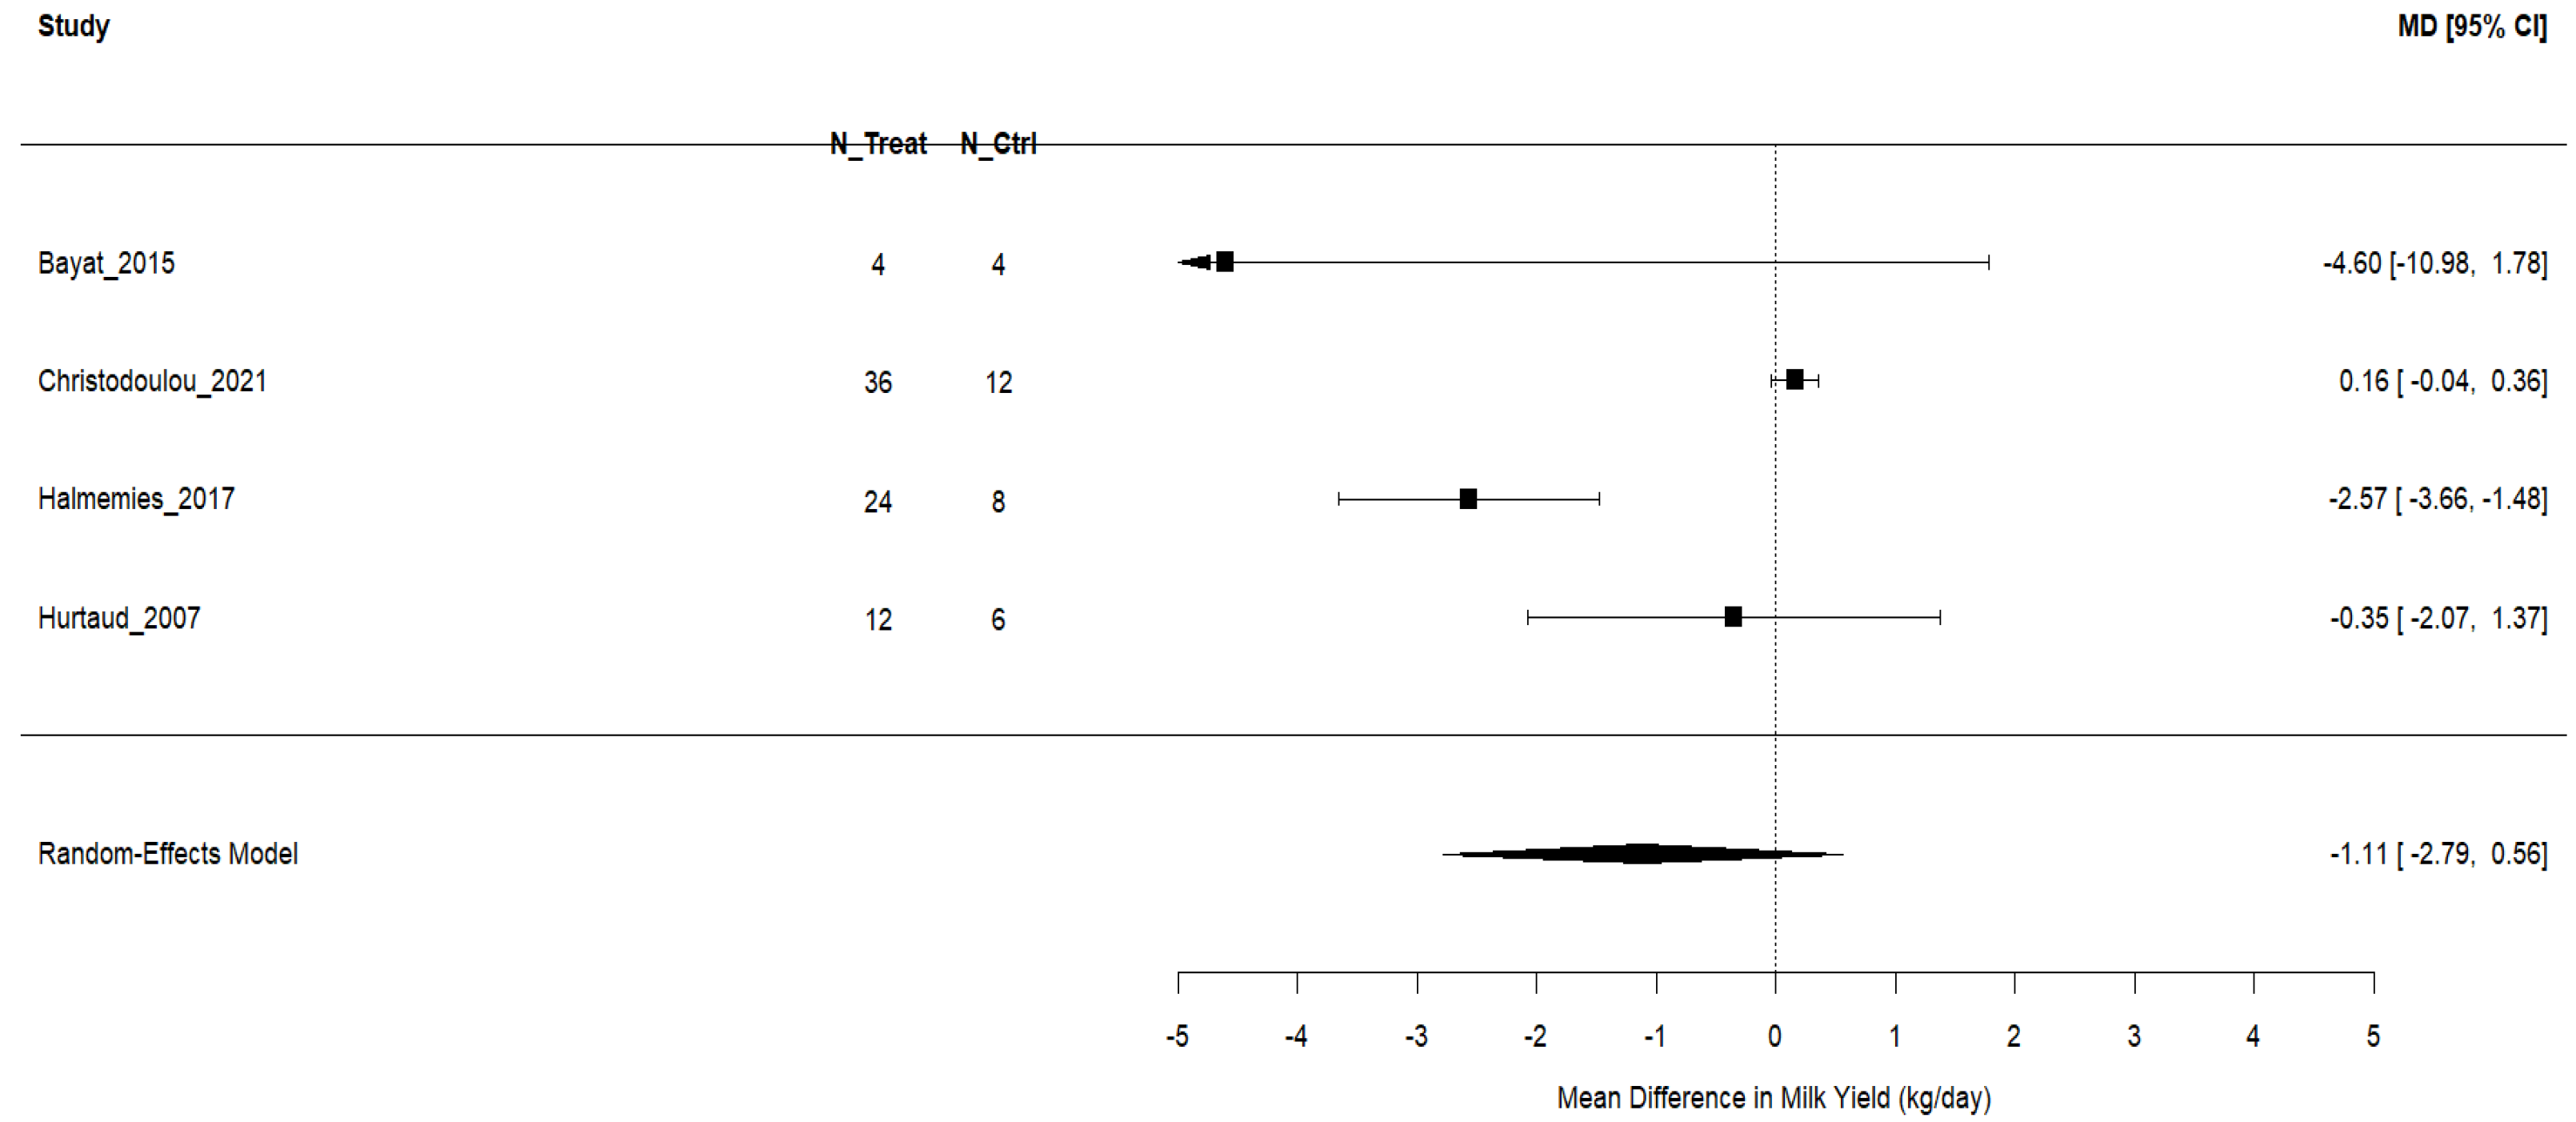
A random-effects meta-analysis was performed to investigate the effect of Camelina supplementation on milk yield in ruminants using four studies that were included in this analysis. The pooled mean difference showed no significant decrease in milk yield of −1.11 kg/day (95% CI: −2.79 to 0.56; p = 0.1922), with substantial heterogeneity between studies (I2 = 85.63%; τ2 = 1.996; Q (3) = 25.77, p < 0.0001). The forest plot (Figure 5) showed the significant decrease in milk yield by Bayat et al. [44] and Halmemies-Beauchet-Filleau et al. [46], a slight increase by Christodoulou et al. (2021) [32], and no notable difference by Hurtaud and Peyraud [47].
A mixed-effects meta-regression (Figure 6) was used to investigate the potential dose–response relationships with Camelina inclusion level (% of diet DM) as a continuous moderator. The analysis revealed a significant positive association (β = 0.3981; 95% CI: 0.2415 to 0.5548; p < 0.0001), with the between-study variance fully explained (R2 =100%; τ2 = 0; I2 = 0%). These findings indicate that higher dietary inclusion levels of Camelina may sustain or even enhance the milk yield in ruminants.
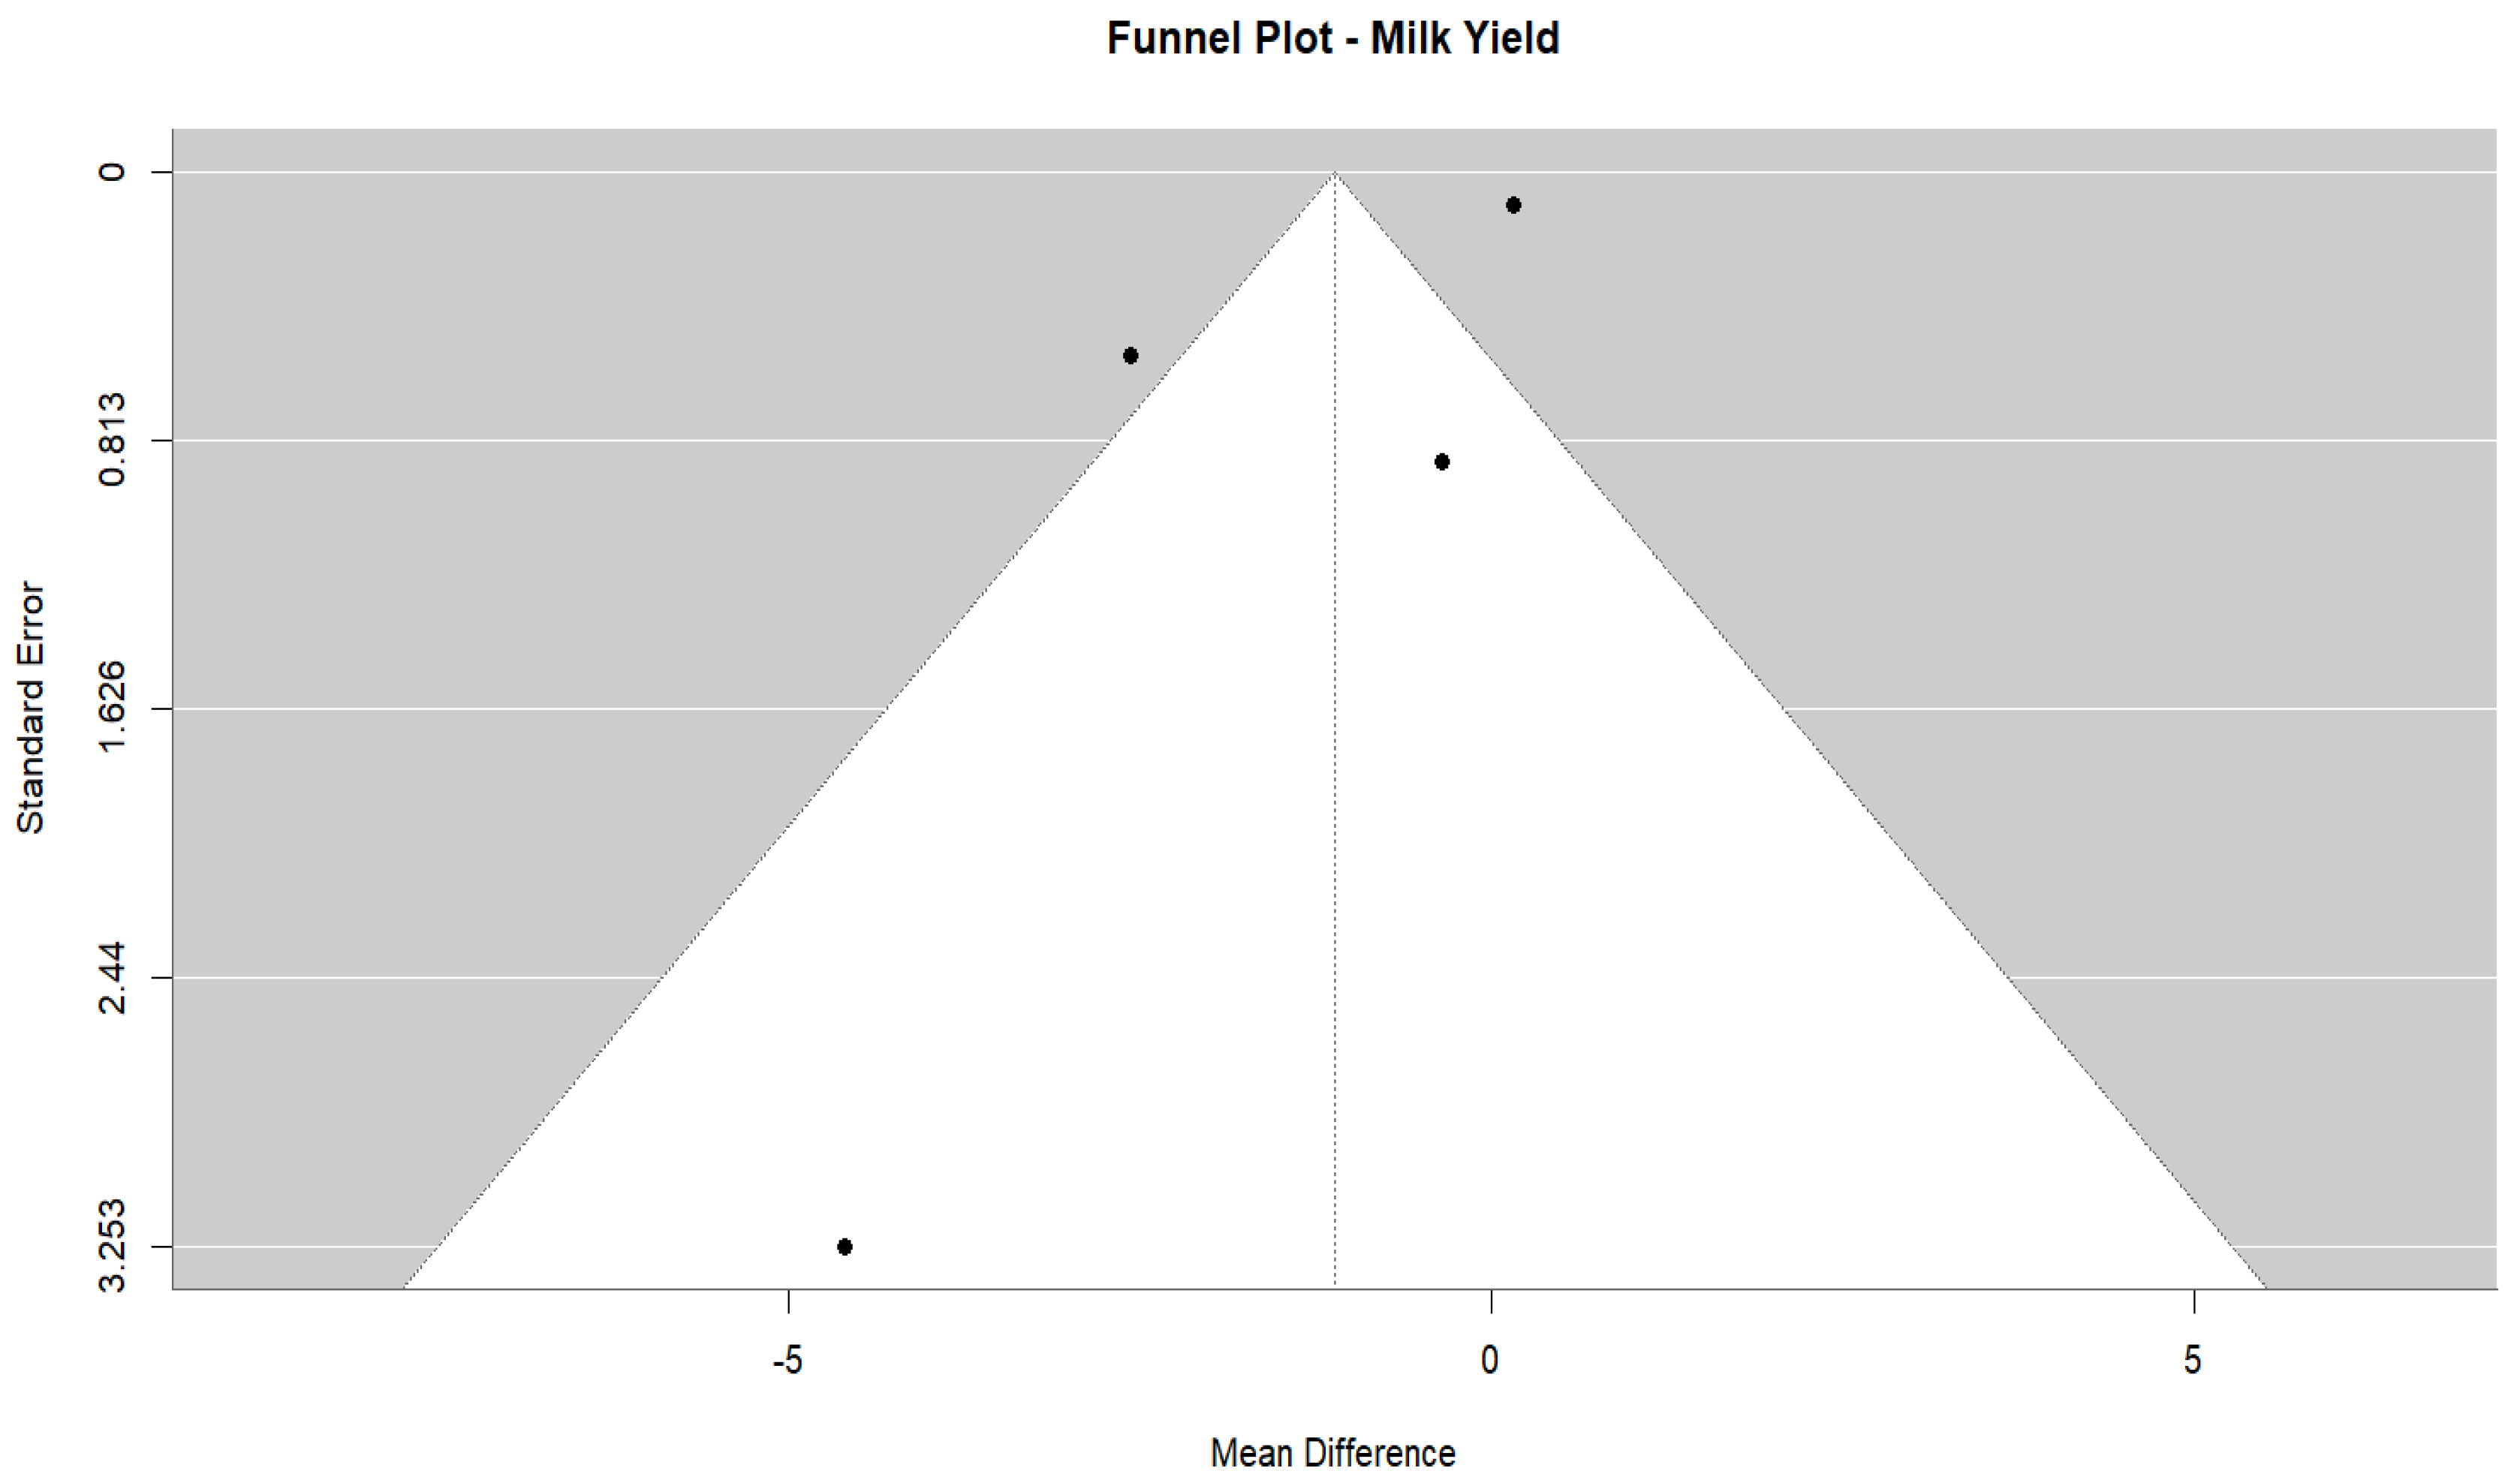
Sensitivity analysis using a leave-one-out approach indicated that the overall results were moderately influenced by the individual studies. The removal of the study by Halmemies-Beauchet-Filleau et al. [46] reversed the pooled effect (MD = +0.15 kg/d) and eliminated heterogeneity (I2~0%), indicating its strong weighting in model predictions. However, this study was the only one to partially drive the main null result. Publication bias was assessed using funnel plots and Egger’s test for asymmetry (Figure 7). Although a slight visual asymmetry was evident, Egger’s test was non-significant (z = −1.15; p = 0.2483) and the estimated regression intercept was close to zero (b = −0.2709; 95% CI: −2.38, 1.83), indicating no statistically significant small study effects.

3.5. Effects of Camelina on Milk Composition

3.5.1. Milk Protein

A random-effects meta-analysis determined the effects of Camelina-based products on milk protein in dairy cows by using eight comparisons from four studies. The overall pooled MD was 1.06 g/kg (95% CI −1.87 to 3.99, p = 0.48), indicating no significant overall effect (Figure 8). The heterogeneity was high between studies (τ2 = 17.15, I2 = 99.05%, Q = 117.85, p < 0.0001). Specifically, supplementation with Camelina oil and meal was more related to milk protein decreases, such as MD = −1.40 to −1.60 g/kg in the study by Halmemies-Beauchet-Filleau et al. [46], while Halmemies-Beauchet-Filleau et al. [45] reported high positive effects (+8.0 to +8.4 g/kg) when assessing kangaroo oil and its expeller.
To explore potential dose–response relationships, a meta-regression was conducted using Camelina dosage (% of dietary DM) as a continuous moderator. The slope of the regression was negative but not statistically significant (β = −0.95, p = 0.44), indicating no clear linear relationship between Camelina dose and milk protein outcome.
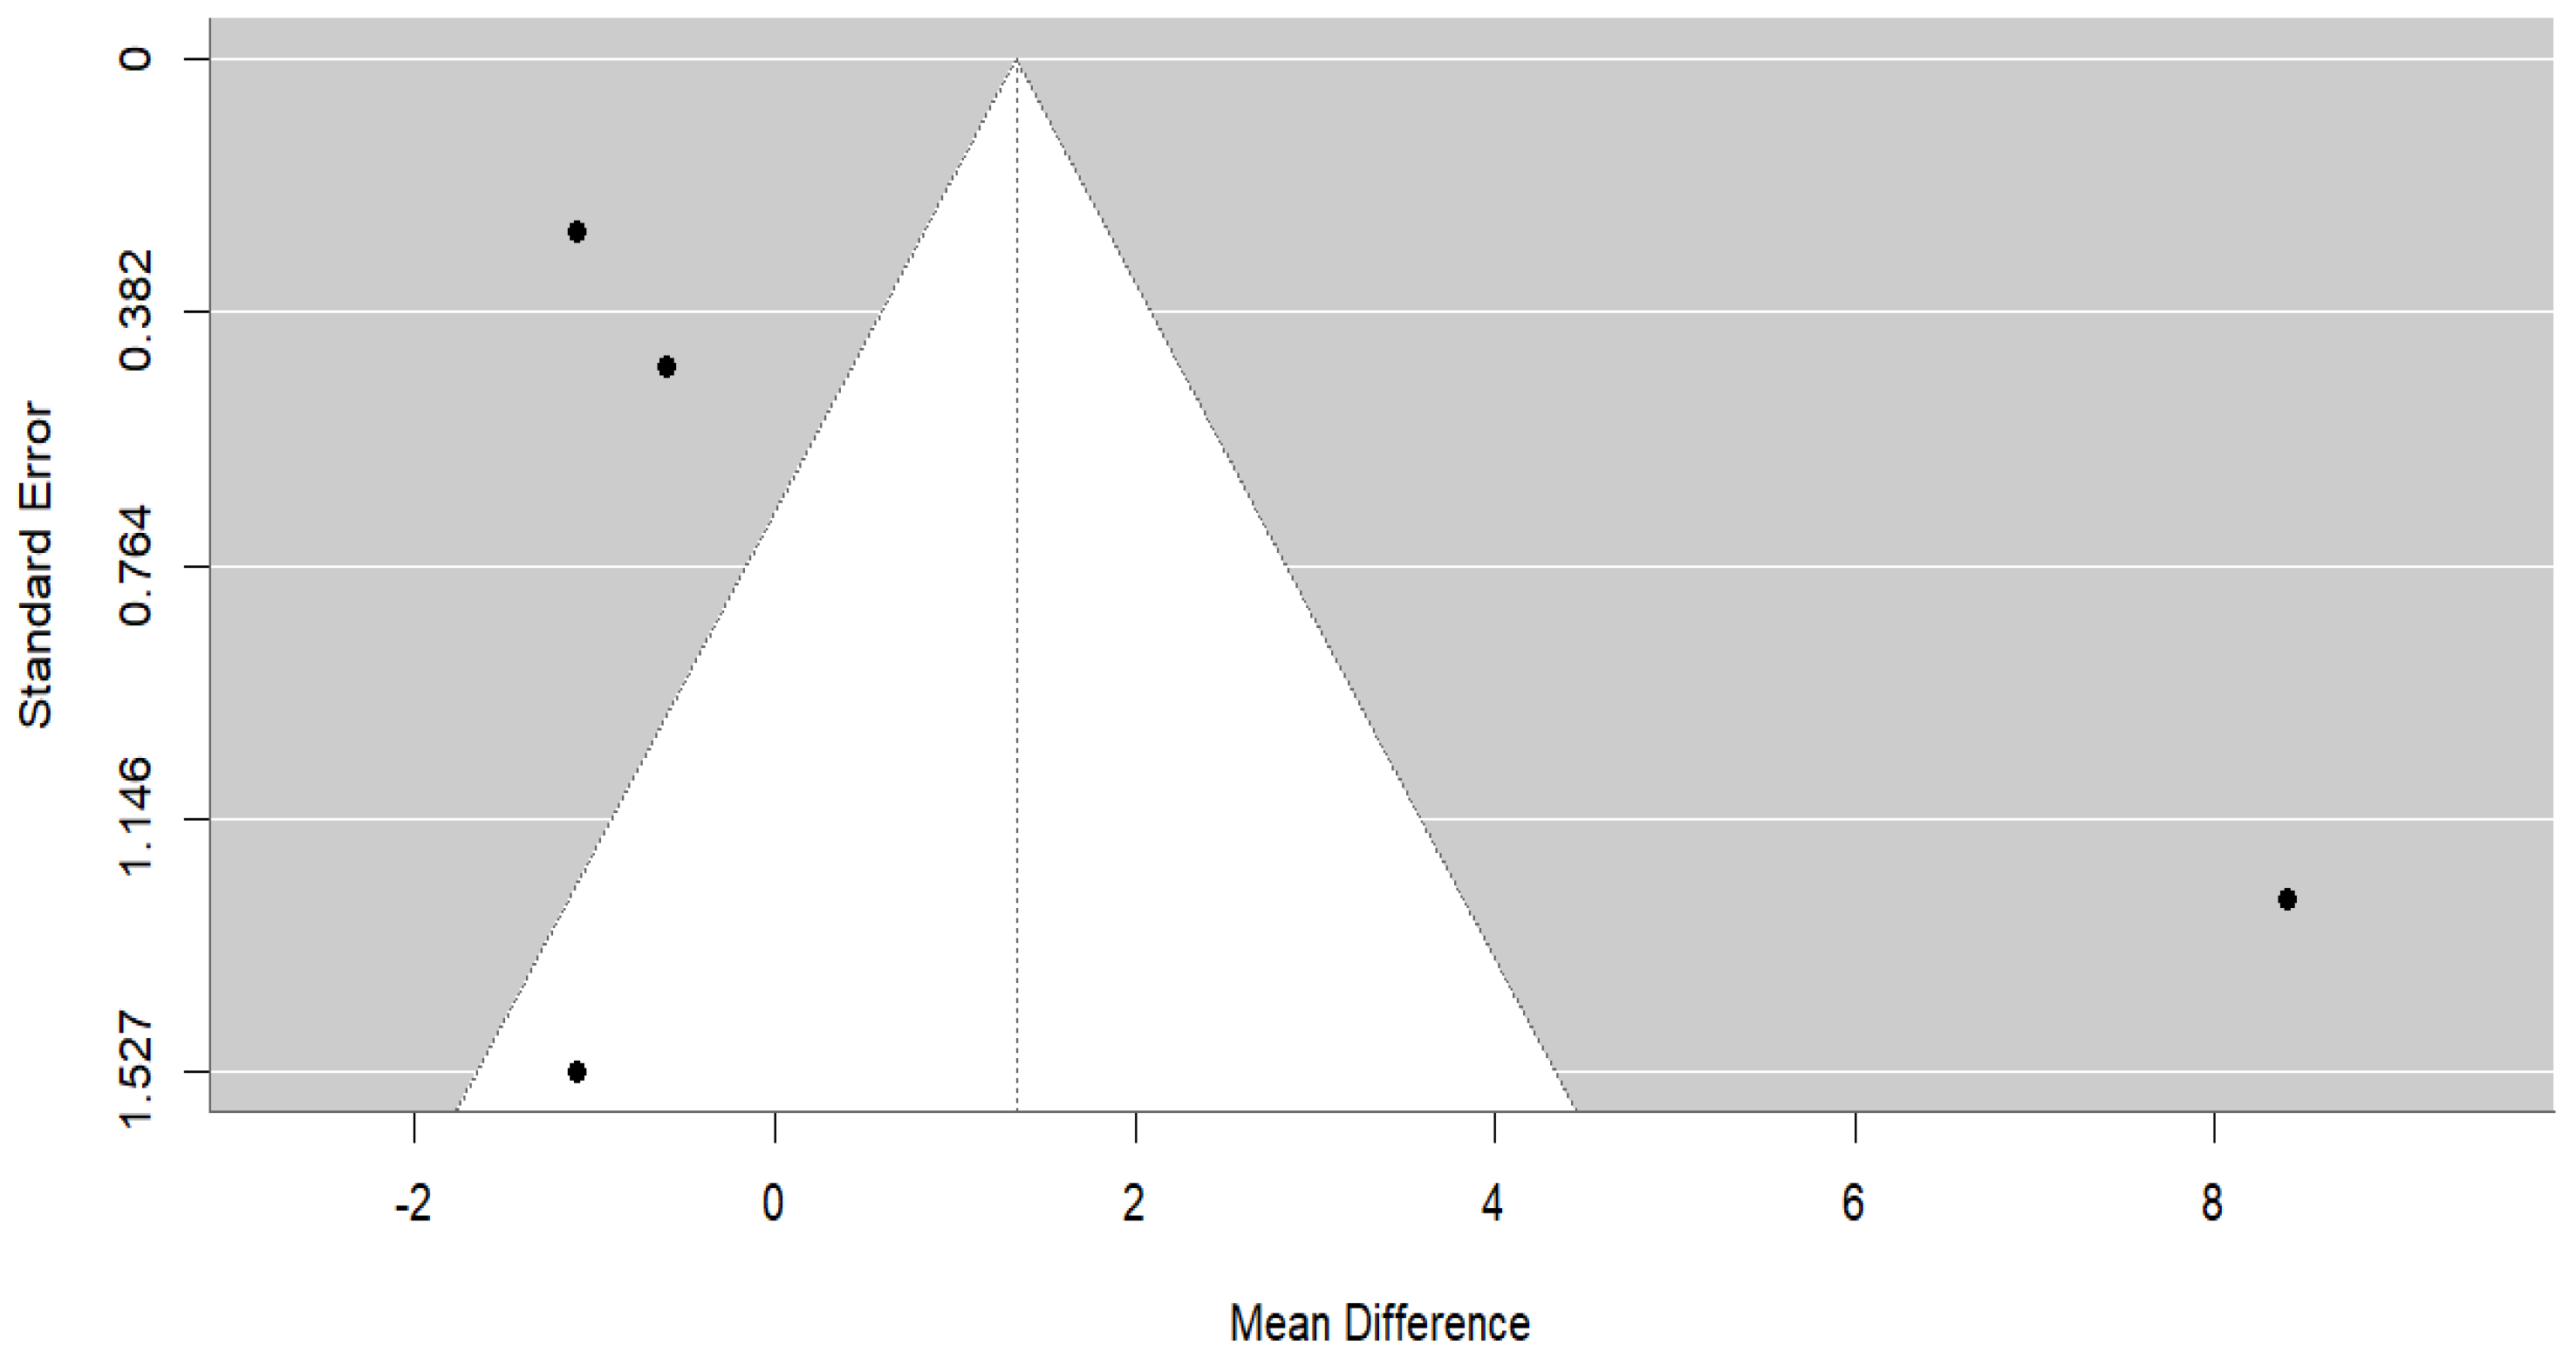
The leave-one-out sensitivity analysis confirmed the disproportionate influence of the Halmemies-Beauchet-Filleau et al. [45] study, with a large drop in the pooled estimate (MD ≈ 0.02–0.07 g/kg) upon its exclusion. Regarding small study effects, visual inspection of the funnel (Figure 9) revealed asymmetry. However, the Egger’s regression test was not non-significant (Z = 0.6660, p = 0.5054), indicating the absence of publication bias.

3.5.2. Milk Fat

Seven comparisons from four studies were assessed for the effects of Camelina sativa and its by-products on milk fat percentage. The pooled analysis using a random-effects model revealed a non-significant milk fat concentration with Camelina supplementation of −2.11 g/kg (95% CI: −7.73 to 3.50; p = 0.4606; Figure 10). Between-study heterogeneity was high (I2 = 96.4%; Q = 176.58; p < 0.0001). Overall, the effects of Camelina oil were not consistent and were dependent in some cases on the individual study but with high certainty. Increases in milk fat could be significant at 4% (Halmemies-Beauchet-Filleau et al. [46]; MD = 4.37 g/kg; 95% CI: 2.02 to 7.32), or reductions in net output were seen with Camelina meal (Hurtaud and Peyraud [47]; MD = −17.00 g/kg; 95% CI: −24.76 to −9.24).
Heterogeneity was explored by performing a dose–response meta-regression with dosage as a continuous moderator. However, the dosage effect was statistically non-significant (R2 = 29.1%; β = −0.54 g/kg per % increase; 95% CI: −1.26 to 0.17 p = 0.1354). Camelina form or species differences were a possible source of heterogeneity not accounted for by dosage and may have influenced outcomes, as significant residual heterogeneity was still present (QE = 8.20, p = 0.042). The sensitivity analysis by leave-one-out showed that no study significantly affected the estimated overall effect. However, omission of the study by Hurtaud and Peyraud [47] changed I2 to 87.6%. Although there was a slight asymmetry in the funnel plot (Figure 11), no significant evidence of publication bias was found in Egger’s test (p = 0.9601).

3.6. Ruminant Fermentation and Methane Emissions

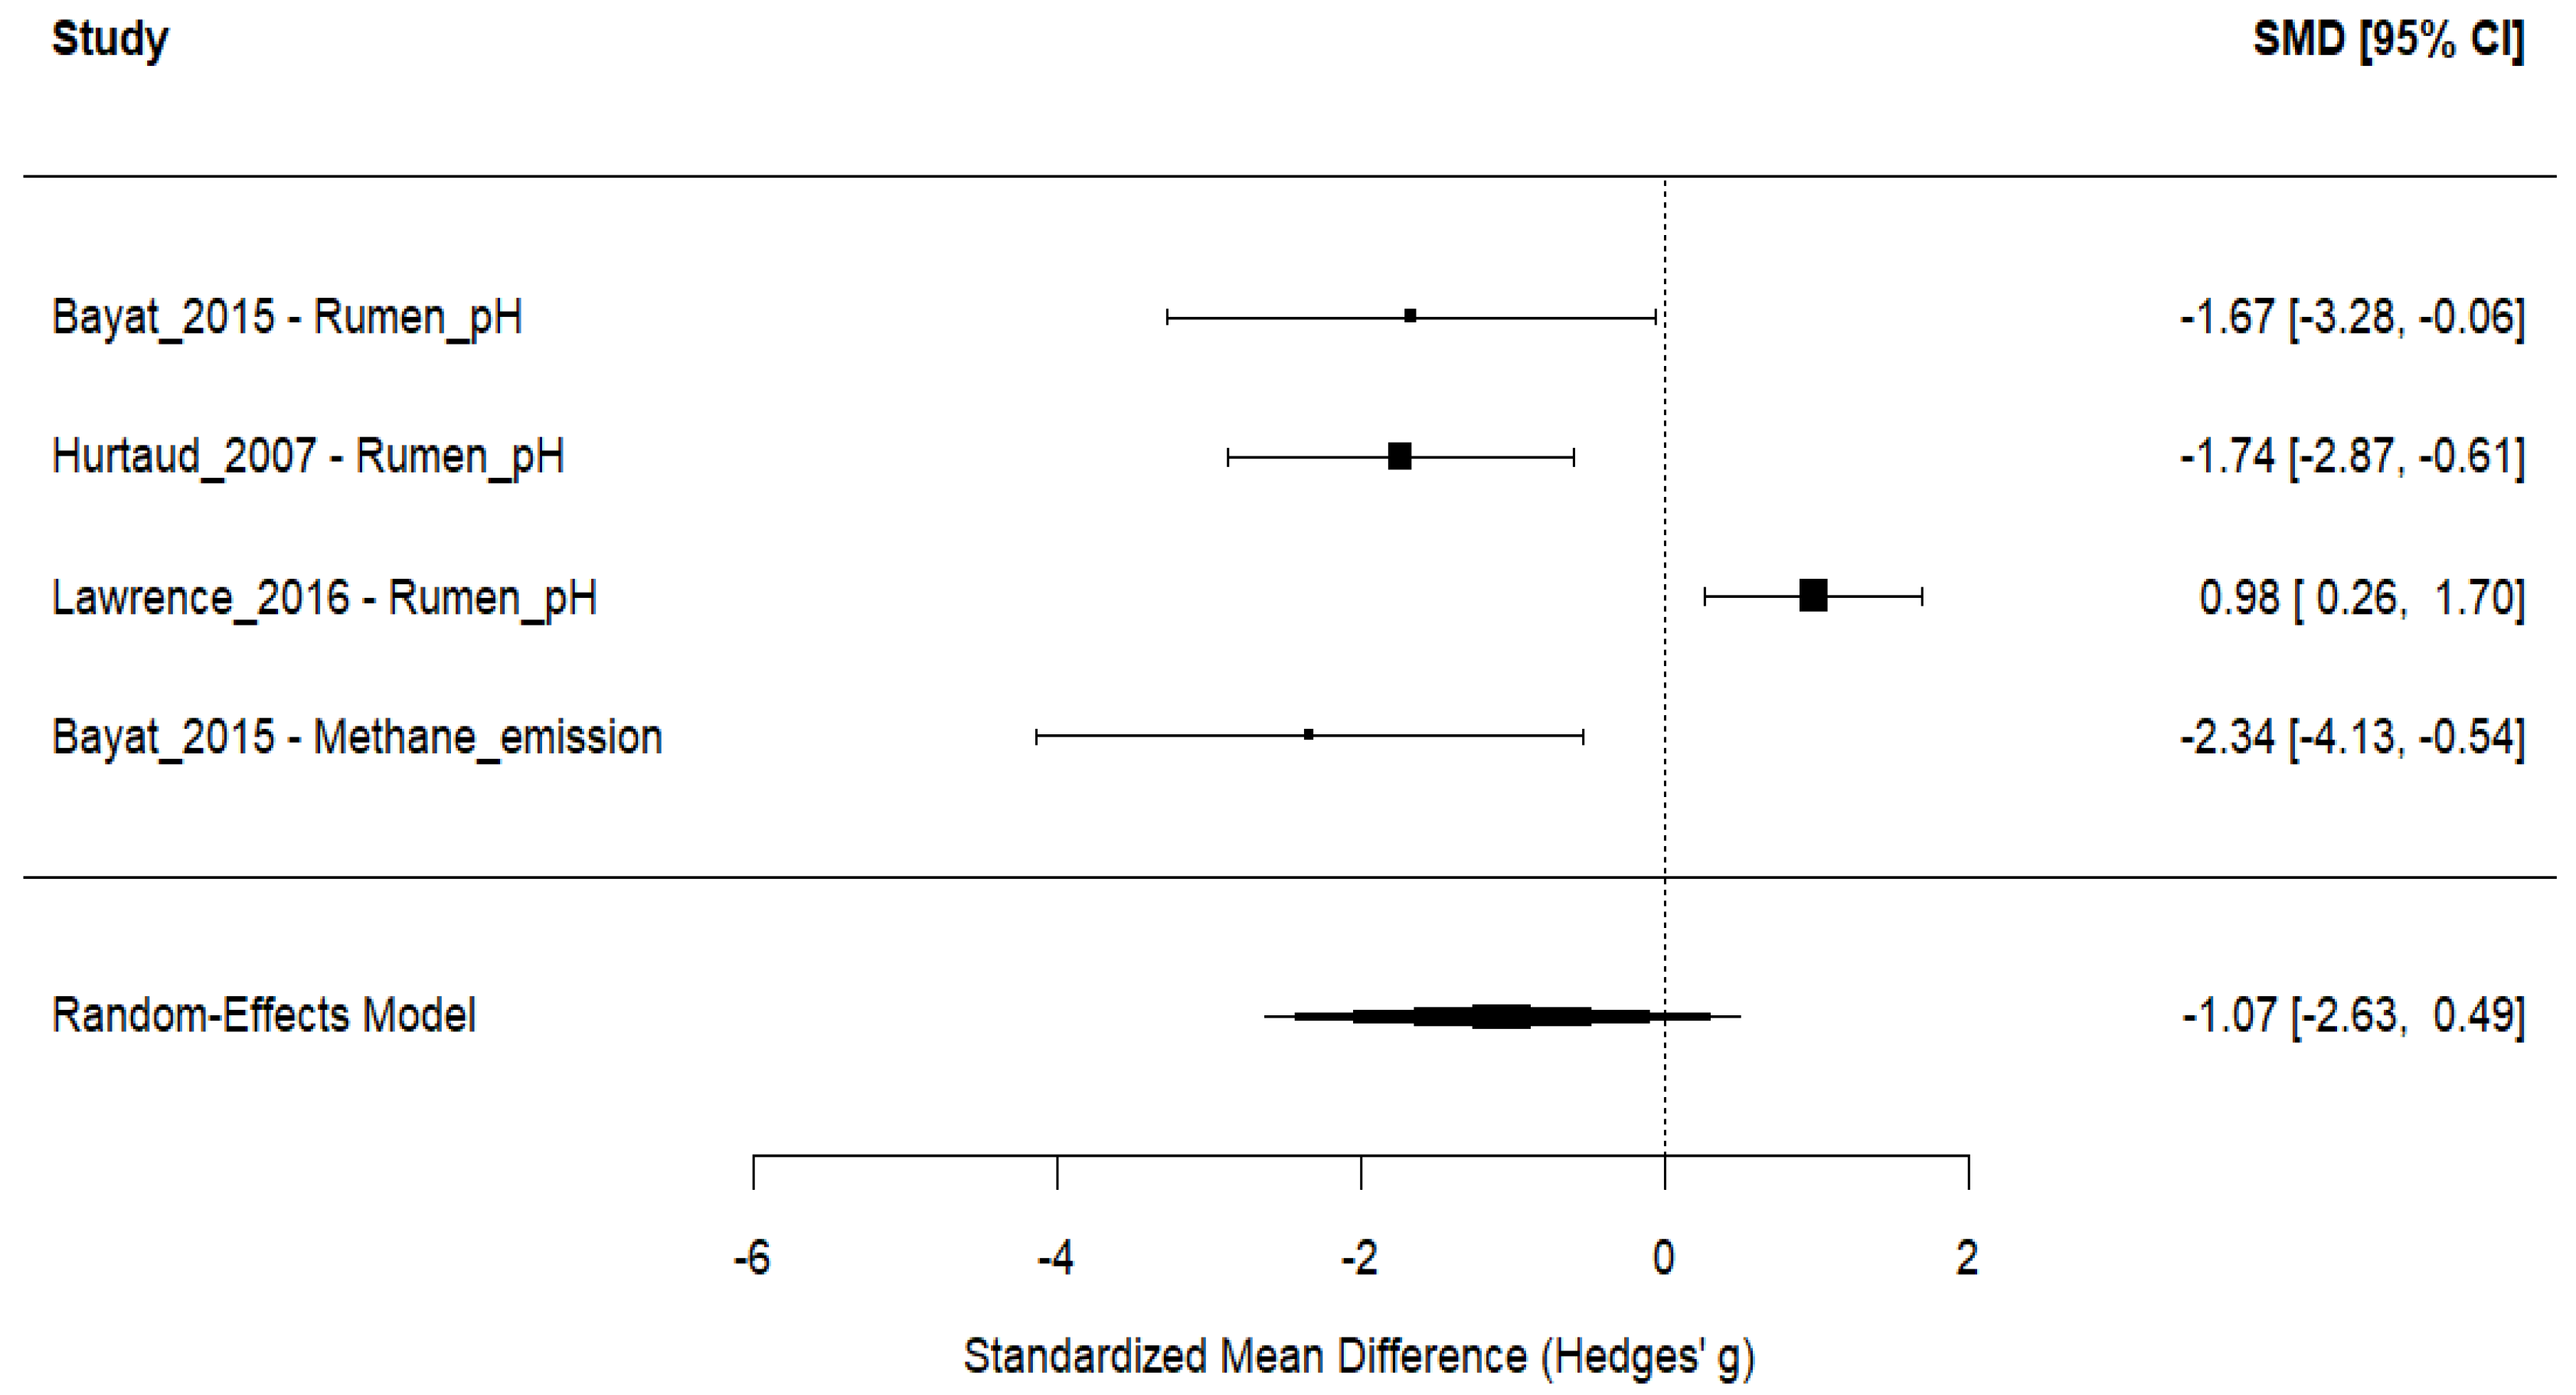
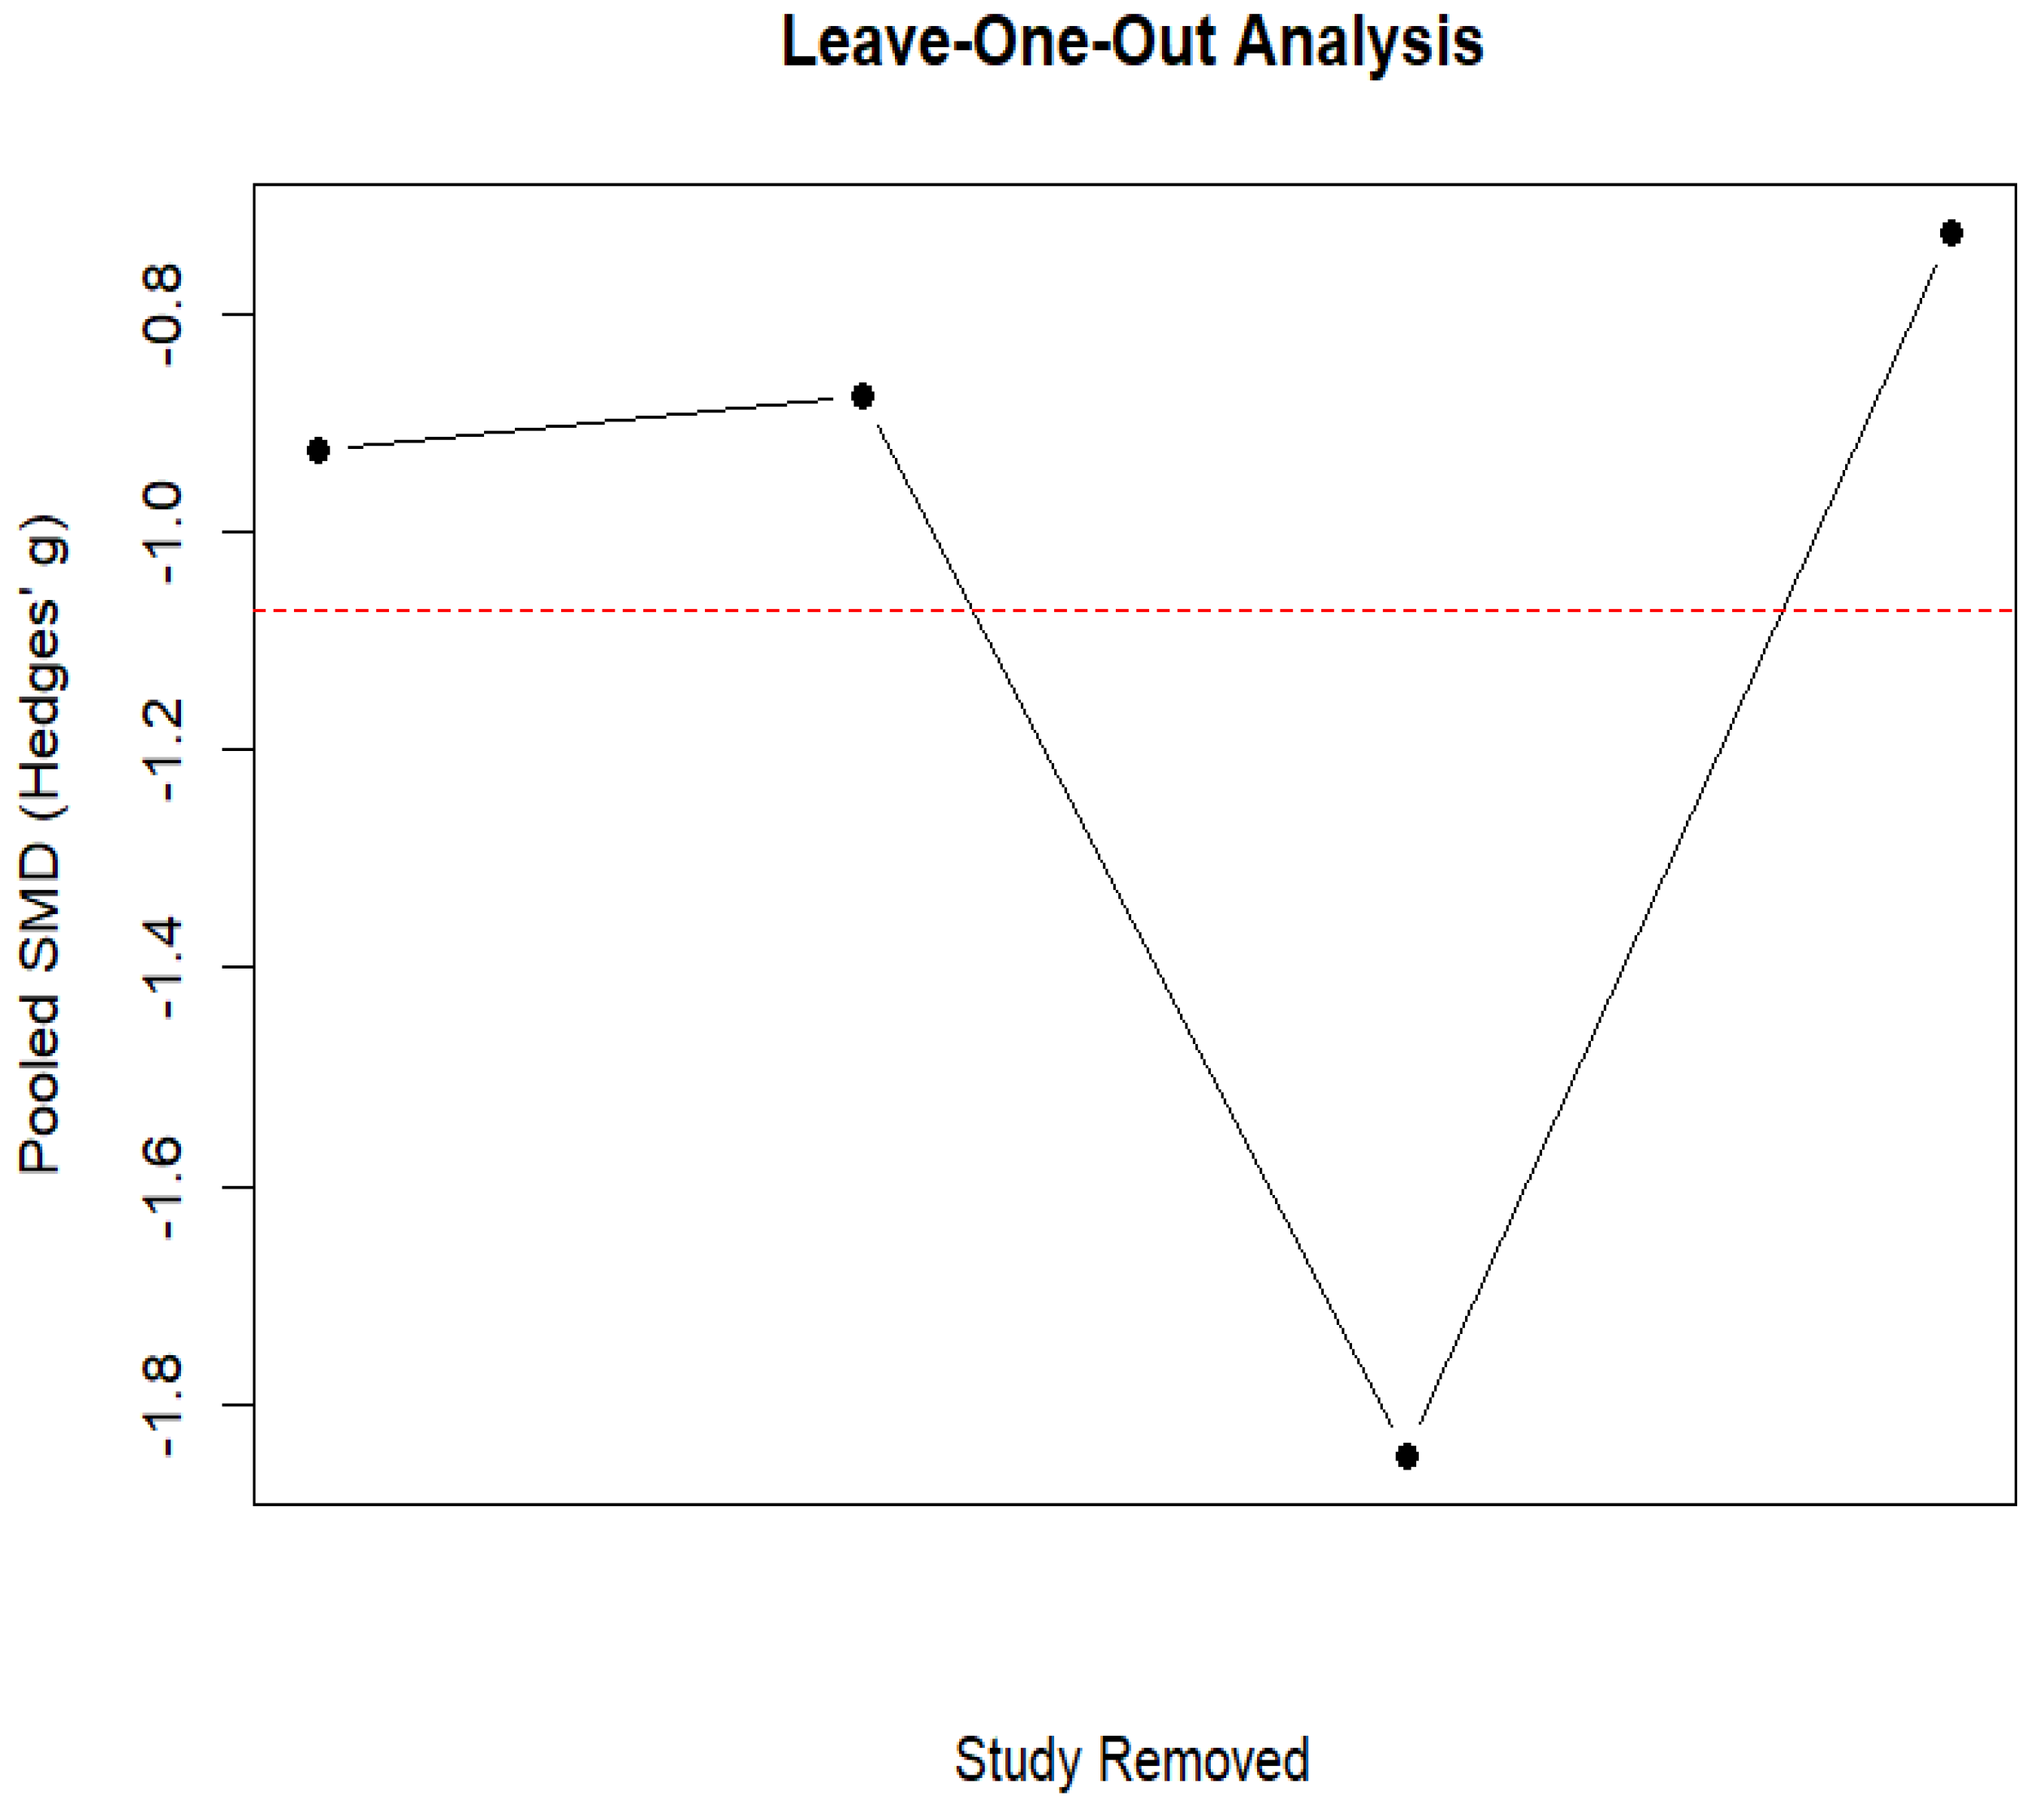
The meta-analysis showed a non-significant pooled SMD of −1.07 (95% CI: −2.63, 0.49; p = 0.178) and high heterogeneity among included studies with τ2 = 2.0715 and I2 = 84.54%. In the forest plot (Figure 12), two studies reported a significant reduction in rumen pH (Bayat et al. [44]: SMD = −1.67; Hurtaud and Peyraud [47]: SMD = −1.74), whereas one study by Lawrence et al. [48] showed a moderate increase in rumen pH (SMD = 0.98). In addition, Camelina oil supplementation significantly reduced methane emissions (Bayat et al. [44] (SMD = −2.34)).
The subgroup meta-regression based on treatment type explained 100% of the between-study heterogeneity (R2 = 100%), and residual heterogeneity was eliminated (τ2 = 0, I2 = 0). This pattern was supported by the negative linear treatment contrast for Camelina oil (estimate = −2.95; 95% CI: −4.34 to −1.55; p < 0.0001) and seed + meal treatments (estimate = −2.72; 95% CI: −4.06, −1.38; p < 0.0001), whereas Camelina meal alone showed a positive effect on rumen pH compared with the control diets. Sensitivity analysis excluding the study by Lawrence et al. [48], which reported an increase in rumen pH, yielded a more negative pooled effect size (SMD = −1.85, p < 0.0001) and eliminated all heterogeneity (Figure 13).
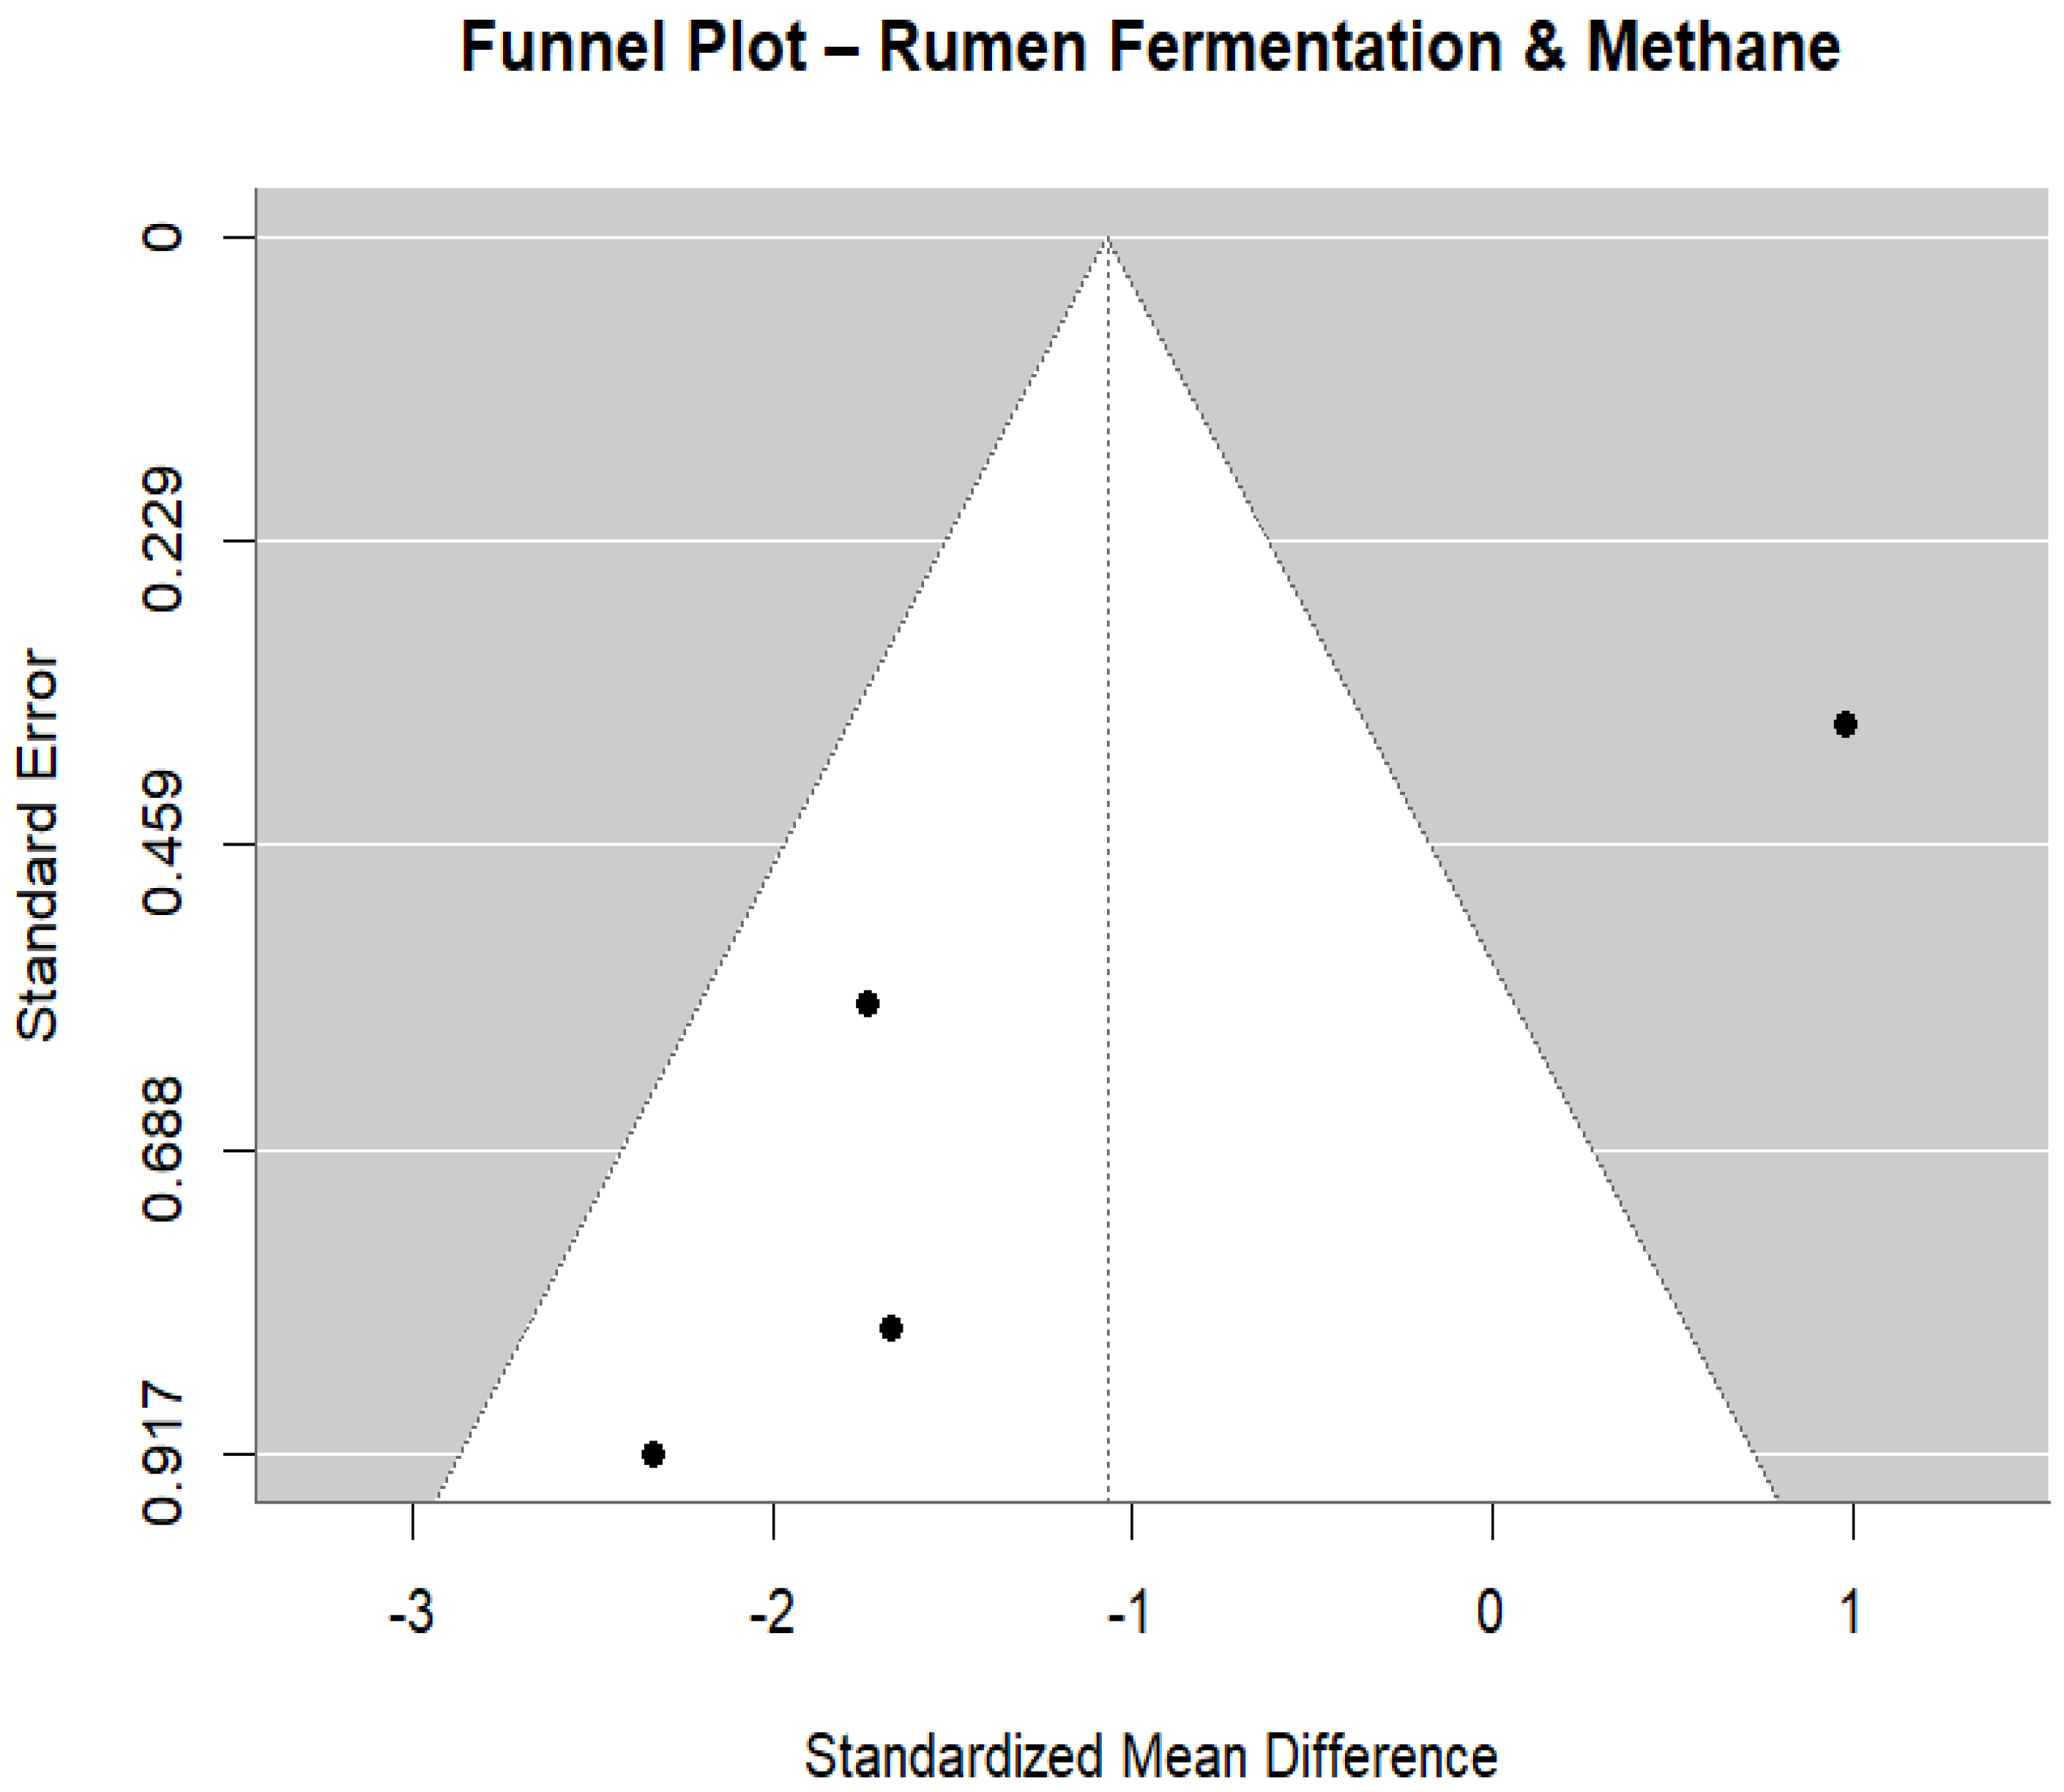
However, the funnel plot and Egger’s regression test indicated a potential publication bias (z = −2.43, p = 0.015), suggesting that small study effects may be present in the current evidence base (Figure 14).

3.7. Effects of Camelina on Biochemical Attributes

The meta-analysis using 23 comparisons showed that treated animals were significantly decreased compared to the control with a pooled mean difference (MD = −0.26 mmol/L; 95% CI: −0.49 to −0.02), as shown in Figure 15. This implies a small reduction in the pooled effects in favor of the Camelina treatment, but this difference was statistically significant. Nevertheless, with 100% I2 and τ2 = 0.33, significant heterogeneity was detected. Outcome as a moderator explained all the observed heterogeneity when meta-regression was performed (R2 = 99.99%, QM = 218.87, p < 0.0001), suggesting that most of this heterogeneity was due to differences in outcomes. The reduction in milk urea (−1.71 mmol/L) associated with Camelina and positive mean differences for digestibility traits, IGF-1, and insulin suggest that the direction and magnitude of the effects may vary depending on the outcome measured.
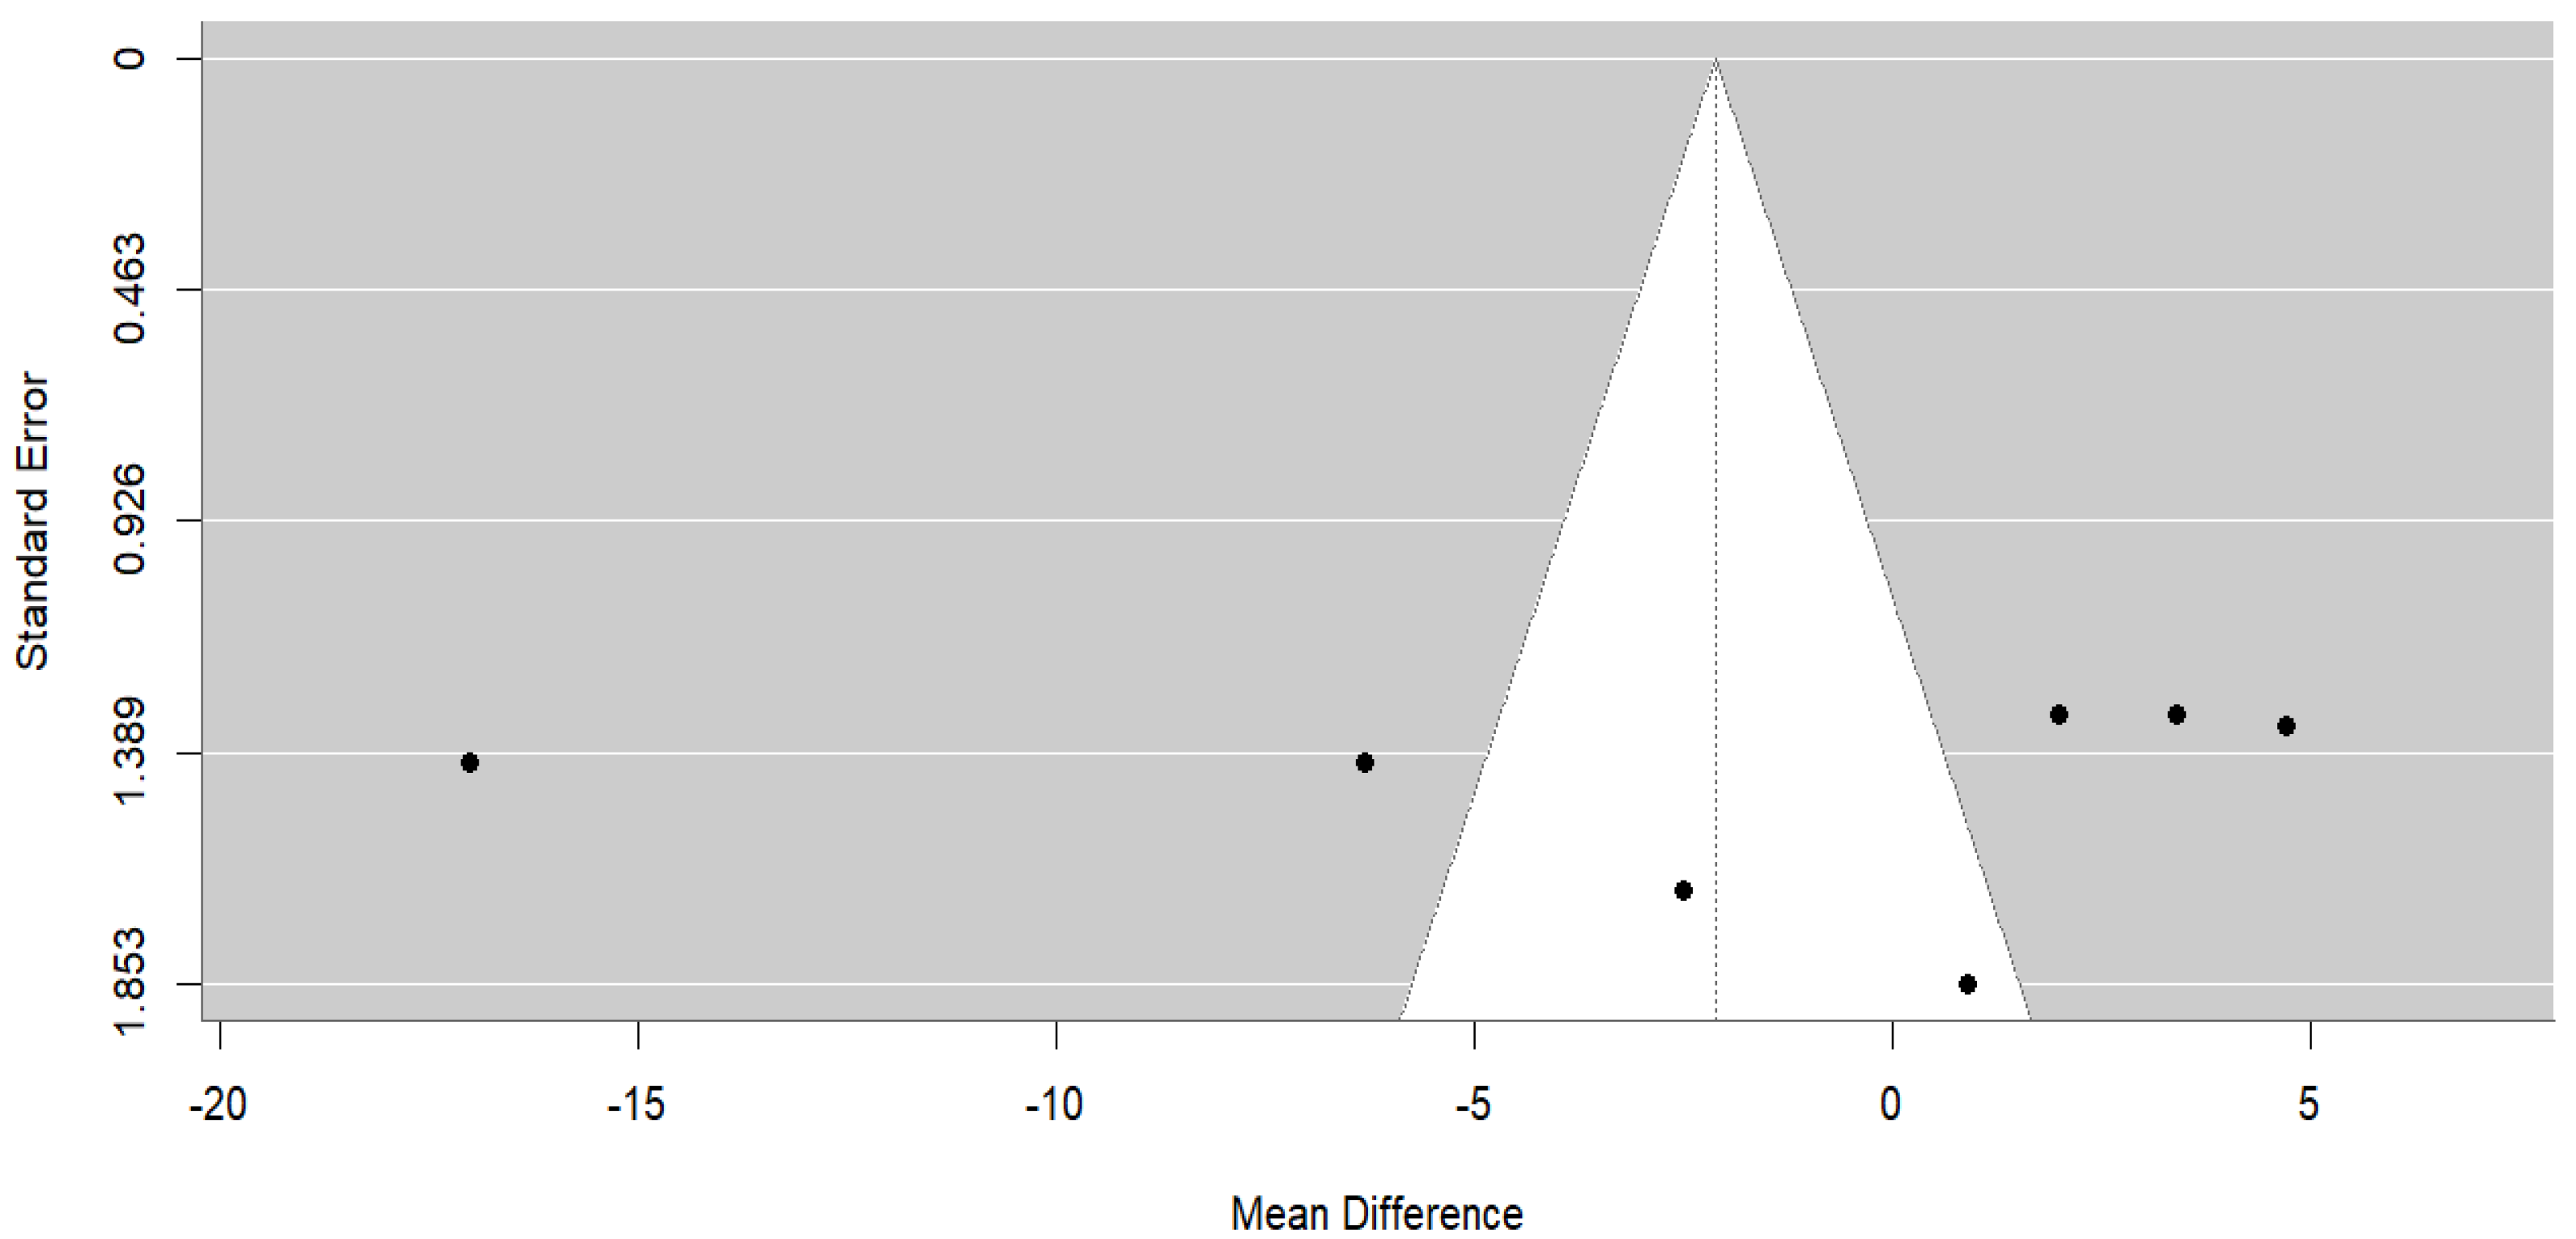
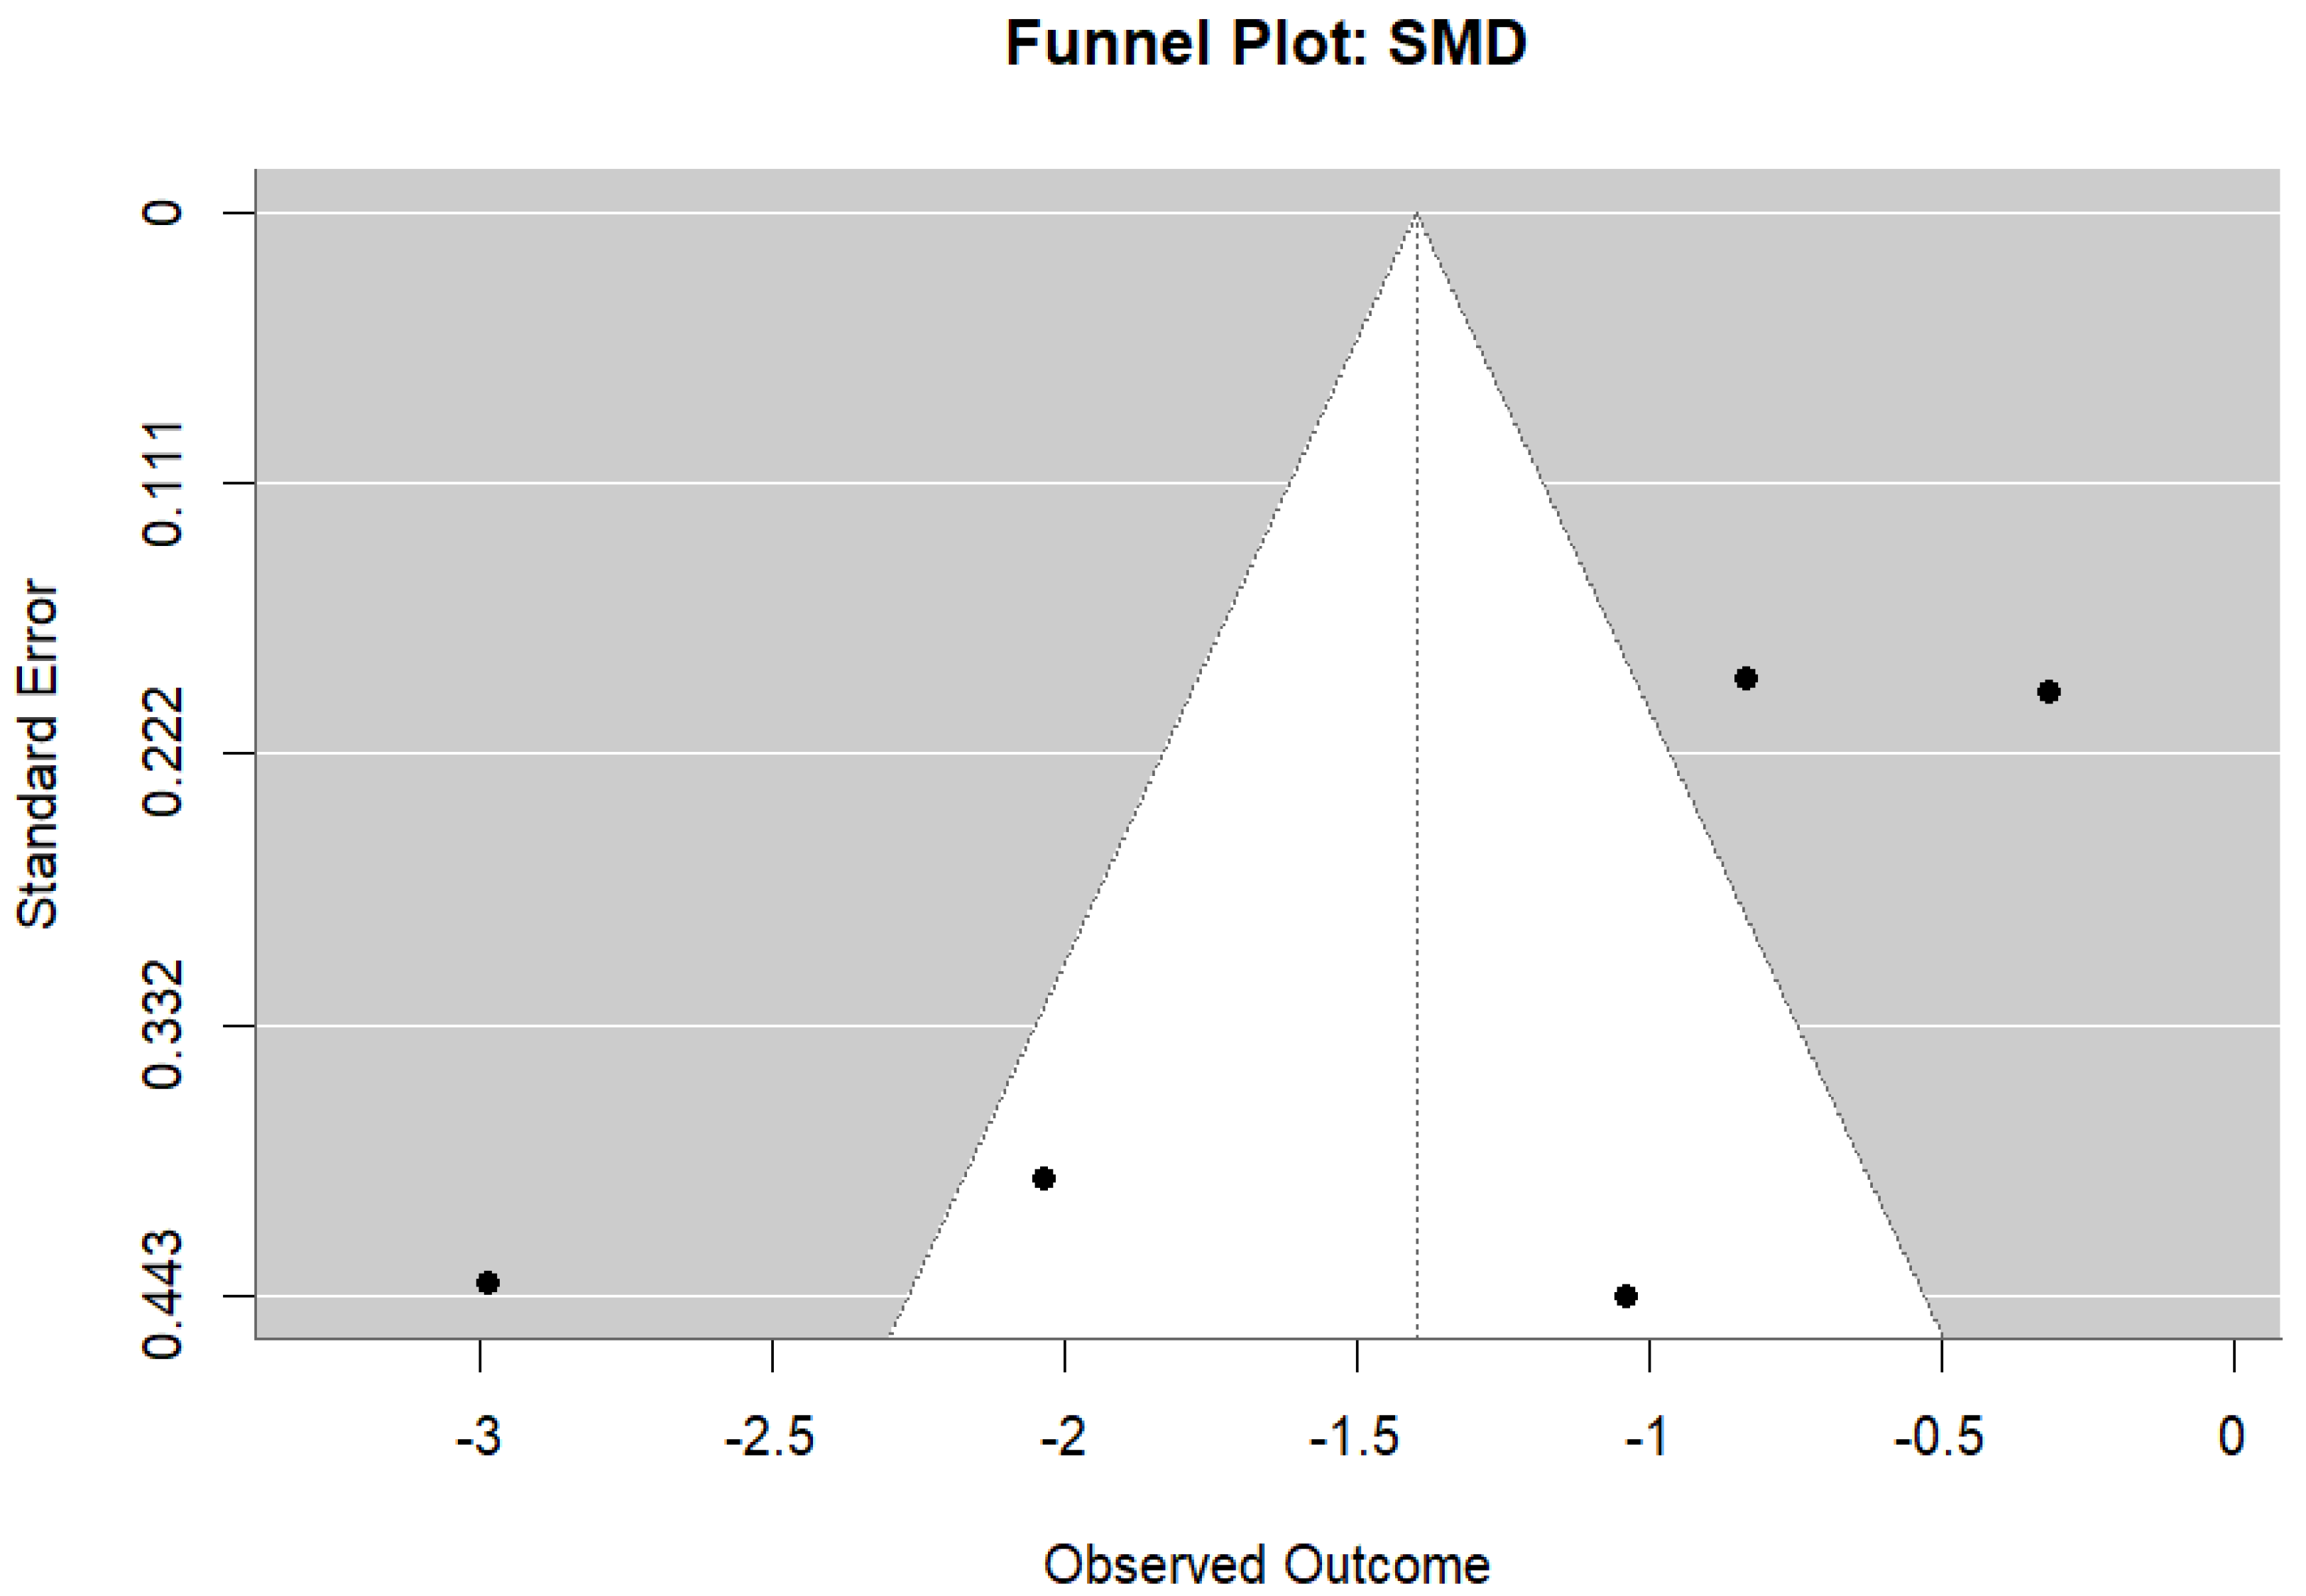
The leave-one-out sensitivity analysis suggested that the pooled estimate was robust, remained stable with the exclusion of any single study, and consistently favored the beneficial direction of effect. The mean differences did not change substantially (−0.27, −0.18), and the significance of the pooled estimate was maintained (p < 0.05). Although the funnel plot (Figure 16) appeared asymmetric, the Egger’s regression test showed no statistically significant evidence of publication bias (z = −2.01, p = 0.44).

4. Discussion

This study presents a meta-analysis evaluating the effects of Camelina sativa and its by-products on dry matter intake, milk production, ruminal fermentation, methane emissions, milk composition, and metabolic biochemical attributes in ruminants. Overall, Camelina supplementation exhibited limited but variable effects, suggesting that its efficacy depends on the inclusion level, form of the product, animal species, or study design.
Camelina supplementation decreased dry matter intake, which corroborated the results of several studies. For instance, Bayat et al. [44] and Halmemies-Beauchet-Filleau et al. [46] reported that DMI in dairy cows taking Camelina oil supplements decreased and demonstrated reductions in DMI at inclusion levels above 4% of dietary DM. Similarly, Hurtaud and Peyraud [47] reported a lower intake of both Camelina meal and seeds. Such reductions are due to palatability problems, anti-nutritional factors (glucosinolates), and a high PUFA content. In comparison, De Marzo et al. [51] suggested species-specific tolerance to Camelina seed inclusion, and up to 10% Camelina seed inclusion had no detrimental effects on lamb growth or carcass quality. Furthermore, Salas et al. [50] reported that there were no differences in intake or digestibility in beef heifers fed 9% Camelina expeller, and these detrimental effects on DMI were observed in dairy systems or when oil was used instead of expellers or meals.
The non-significant effect of Camelina supplementation on milk yield is a poor indicator of important subtleties. Bayat et al. [44] and Halmemies-Beauchet-Filleau et al. [46] found the same reduction in DMI, resulting in reduced milk yield. Moderate seed inclusion did not change milk yield, as reported by Christodoulou et al. [32]. The meta-regression identified dose–response trends that showed a variation in milk yield at higher inclusion levels. These results are in line with those of Hurtaud and Peyraud [47], who found that Camelina meal decreased milk fat yield, but milk volume was not strongly affected. The loss of intake is compensated for by preserving the production at certain inclusion levels owing to the energy density provided by the oil.
Decreased fermentation pH and methane emissions were observed in the meta-analysis when Camelina oil was fed. These findings are backed up by Bayat et al. [44], with CH4 depressing by 6% Camelina oil (even if there were no substantial changes in VFA profiles). Similarly, Christodoulou et al. [52] and Dai et al. [53], using high-throughput sequencing techniques, observed significant changes in the microbial community structure, especially a reduction in methanogens and cellulolytic bacteria, after the inclusion of Camelina seeds. Brandao et al. [54] reported that increased propionate and decreased acetate levels with Camelina seed supplementation could decrease hydrogen availability for methanogenesis. These findings are consistent with the proposed mechanism that PUFA-rich oilseeds, such as Camelina, lower methane production through microbial shifts and alternative hydrogen sinks.
A meta-analysis showed that Camelina did not affect milk protein or fat content. However, heterogeneity was high. Halmemies-Beauchet-Filleau et al. [45] and Halmemies-Beauchet-Filleau et al. [46] indicated an increase in unsaturated fatty acids (UFA), mainly omega-3 and CLA, including oil or expeller forms. Christodoulou et al. [32] and Hurtaud and Peyraud [47] found decreasing values of milk fat percentage when animals received Camelina meal. Such variation could be due to differences in the basal diet, form of the Camelina product, and inclusion rate. For example, Halmemies-Beauchet-Filleau et al. [46] found linear increases in beneficial FAs (cis-9, trans-11 CLA) after incremental supplementation with Camelina oil (2–6%) without a decrease in the total fat output. In contrast, a much stronger decrease in fat content was observed with meal supplementation, indicating the form-dependent effects of Camelina [47].
Camelina inclusion reduced most of the observed metabolic parameters, although the effect was modest for some indicators (milk urea), implying an improvement in the efficiency of nitrogen use for milk production. Lawrence et al. [48] and Christodoulou et al. [32] reported altered blood metabolite profiles and improved antioxidant status (SOD, CAT, and GSH-Px) in heifers and ewes, respectively. This is due to the PUFA and antioxidant profiles of Camelina, which modulate oxidative stress and metabolic pathways. This is also supported by Peng et al. [55], who reported that moist heat-treated Camelina seeds resulted in increased ruminal escape of protein and increased intestinal digestibility, underlining the importance of processing to achieve optimal metabolic effects.
Despite the use of a robust statistical modeling approach to address confounding factors, some limitations should be acknowledged. Only eight studies were eligible for the meta-analysis. Therefore, the generalizability of our findings is limited. The significant heterogeneity across outcomes probably reflects differences in diet formulation, product form (seed, oil, meal, and expeller), and inclusion levels. Small sample sizes limited the power of some subgroup analyses (fermentation and DMI). In addition, a possible publication bias was observed in a few domains, including DMI and fermentation. This may indicate underreporting of neutral or negative outcomes, which are often observed in nutrition trials. Finally, the incomplete reporting of statistics (SDs and SEMs) in several studies prevented the inclusion of relevant data in the quantitative synthesis.

5. Conclusions

This meta-analysis provides quantitative evidence that Camelina sativa and its by-products influence several aspects of ruminant nutrition, although their effects are both product- and dose-dependent. Camelina supplementation significantly reduced dry matter intake, particularly at higher oil inclusion levels, indicating possible palatability or anti-nutritional effects. Despite a non-significant overall reduction in milk yield, meta-regression revealed a positive dose–response relationship, suggesting that moderate to high inclusion levels may sustain or enhance production efficiency. Camelina oil and its combined products tended to lower rumen pH and methane emissions, supporting the proposed PUFA-mediated suppression of methanogenesis. Although the effects on milk fat and protein contents were inconsistent, improvements in the unsaturated fatty acid profile of milk (notably omega-3 and CLA) were frequently observed. Moreover, reductions in milk urea and improved antioxidant activity indicated enhanced nitrogen utilization and a systemic oxidative balance. Considerable heterogeneity and limited study numbers constrained generalizability, emphasizing the need for standardized, long-term in vivo trials. Collectively, these findings support the potential of Camelina by-products as sustainable feed ingredients to improve the nutritional quality of ruminant products while mitigating their environmental impacts.

Author Contributions

Conceptualization, R.R., M.N.T. and O.S.; methodology, R.R. and O.S.; formal analysis, R.R., H.M.N. and M.W.; supervision, I.A., B.I. and O.S.; validation, M.T.; data curation, R.R., H.M.N., M.W. and B.I.; writing—original draft, R.R., M.U.H. and I.A.; writing—review and editing, M.U.H., M.T. and R.G.; funding acquisition, M.T. All authors have read and agreed to the published version of the manuscript.

Funding

This research received no external funding.

Institutional Review Board Statement

The study was carried out without the involvement of animals.

Informed Consent Statement

Not applicable.

Data Availability Statement

The original contributions presented in this study are included in the article. Further inquiries can be directed to the corresponding author.

Conflicts of Interest

The authors declare no conflicts of interest.

References

  1. Michalk, D.L.; Kemp, D.R.; Badgery, W.B.; Wu, J.; Zhang, Y.; Thomassin, P.J. Sustainability and future food security—A global perspective for livestock production. Land Degrad. Dev. 2019, 30, 561–573. [Google Scholar] [CrossRef]
  2. Vastolo, A.; Serrapica, F.; Cavallini, D.; Fusaro, I.; Atzori, A.S.; Todaro, M. Alternative and novel livestock feed: Reducing environmental impact. Front. Vet. Sci. 2024, 11, 1441905. [Google Scholar] [CrossRef]
  3. Rashid, M.; Archimede, H. Utilization Prospects and Limitation of Non-Conventional Feed Resources in Ruminant Ration. Ph.D. Thesis, Université des Antilles, Pointe-à-Pitre, France, 2024. [Google Scholar]
  4. Raza, M.A.; Din, A.M.U.; Yasin, H.S.; Gul, H.; Shah, G.A.; Zhiqi, W.; Hassan, M.J.; Bilal, M.; Gitari, H.; Iqbal, R.; et al. Maize/legume intercropping increases nutrient uptake, crop yields, land productivity, and economic profits in resource-intensive arid-irrigated areas. J. Soil Sci. Plant Nutr. 2025, 25, 8316–8332. [Google Scholar] [CrossRef]
  5. Iheanacho, S.; Hornburg, S.C.; Schulz, C.; Kaiser, F. Toward resilient aquaculture in Africa: Innovative and sustainable aquafeeds through alternative protein sources. Rev. Aquac. 2025, 17, e13009. [Google Scholar] [CrossRef]
  6. Liu, D.; Jin, J.; Qiu, X.; He, R.; Li, L.; Yang, J. Toward crop–livestock integration: A comprehensive framework for cropping system adaptation assessment to mitigate forage shortage. Environ. Dev. Sustain. 2024, in press. [Google Scholar] [CrossRef]
  7. Hassan, M.U.; Vastolo, A.; Gannuscio, R.; Maniaci, G.; Mancuso, I.; Calabro, S.; Gallo, A.; Todaro, M.; Cutrignelli, M.I. Effects of feeding prickly pear by-product silage as a partial replacement of concentrate on dairy ewes: Milk characteristics, nutrient utilisation and in vitro ruminal fermentation. Anim. Feed. Sci. Technol. 2025, 324, 116330. [Google Scholar] [CrossRef]
  8. Malenica, D.; Kass, M.; Bhat, R. Sustainable management and valorization of agri-food industrial wastes and by-products as animal feed: For ruminants, non-ruminants and as poultry feed. Sustainability 2022, 15, 117. [Google Scholar] [CrossRef]
  9. Sime, A.G.; Duguma, B.S. The Role of Non-Conventional Feeds in Small Ruminant Production and Their Implication for Feed Cost Reduction in Ethiopia—A Mini Review. Vet. Med. Sci. 2025, 11, e70554. [Google Scholar] [CrossRef] [PubMed]
  10. Azzahra, D.; Husada, C.P.; Yanto, E. Nutritional Evaluation of Fermented Agro-Industrial Byproducts as Alternative Feed Ingredients for Sustainable Livestock Production. Feed Nutr. Res. J. 2025, 1, 1–9. [Google Scholar]
  11. Oancea, A.-G.; Dragomir, C.; Cismileanu, A. The effects of minor oilseeds cakes on rumen metabolism and productive performances of ruminants. Arch. Zootech. 2022, 25, 130–157. [Google Scholar] [CrossRef]
  12. Bilal Sadiq, M. Oilseed Meal Proteins; A Functional and Nutritional Food Ingredient. J. Culin. Sci. Technol. 2025, 23, 157–160. [Google Scholar] [CrossRef]
  13. Ahmed, I.; Riaz, R.; Sizmaz, Ö. Sustainable Livestock Farming with Oil Seed Crops and Their By-Products. Ank. Üniv. Vet. Fak. Derg. 2024, 71, 371–383. [Google Scholar] [CrossRef]
  14. Faizan, M. Enteric methane production in ruminants: Its effect on global warming and mitigation strategies—A review. Pak. J. Sci. 2024, 76, 16–38. [Google Scholar]
  15. Hristov, A.N.; Solomon, S. Perspective: Enteric methane mitigation and its impact on livestock hydrogen emissions. J. Dairy Sci. 2025, 108, 1–5. [Google Scholar] [CrossRef] [PubMed]
  16. Palangi, V.; Lackner, M. Management of enteric methane emissions in ruminants using feed additives: A review. Animals 2022, 12, 3452. [Google Scholar] [CrossRef]
  17. Serbester, U. The role of feed additives in enhancing ruminant performance and sustainability. In Animal Feeds and Additives; IntechOpen: London, UK, 2025. [Google Scholar] [CrossRef]
  18. Ahmed, M.G.; Elwakeel, E.A.; El-Zarkouny, S.Z.; Al-Sagheer, A.A. Environmental impact of phytobiotic additives on greenhouse gas emission reduction, rumen fermentation manipulation, and performance in ruminants: An updated review. Environ. Sci. Pollut. Res. 2024, 31, 37943–37962. [Google Scholar] [CrossRef]
  19. de Ondarza, M.B.; de Souza, V.C.; Kebreab, E.; Tricarico, J.M. Understanding potential opportunities and risks associated with feeding supplemental rumen available fats to mitigate enteric methane emissions in lactating dairy cows. J. Dairy Sci. 2024, 107, 8072–8083. [Google Scholar] [CrossRef] [PubMed]
  20. Youngmark, E.C.; Kraft, J. Milk Fatty Acids as Potential Biomarkers of Enteric Methane Emissions in Dairy Cattle: A Review. Animals 2025, 15, 2212. [Google Scholar] [CrossRef] [PubMed]
  21. Carta, S.; Correddu, F.; Steri, R.; Zilio, D.M.; Cesarani, A.; Pulina, G.; Nudda, A. Effect of grape pomace supplementation in mid-lactation dairy ewes on production and quality of milk and methane emissions. J. Anim. Sci. 2025, 103, skaf237. [Google Scholar] [CrossRef]
  22. Mercês, Z.d.C.d.; Salvadori, N.M.; Evangelista, S.M.; Cochlar, T.B.; Strasburg, V.J.; da Silva, V.L.; Oliveira, V.R.d. Effectiveness, challenges, and environmental impacts of new food strategies with plant and animal protein products. Foods 2024, 13, 3217. [Google Scholar] [CrossRef]
  23. Ghidoli, M.; Ponzoni, E.; Araniti, F.; Miglio, D.; Pilu, R. Genetic Improvement of Camelina sativa (L.) Crantz: Opportunities and Challenges. Plants 2023, 12, 570. [Google Scholar] [CrossRef]
  24. Riaz, R.; Ahmed, I.; Sizmaz, O.; Ahsan, U. Use of Camelina sativa and by-products in diets for dairy cows: A Review. Animals 2022, 12, 1082. [Google Scholar] [CrossRef] [PubMed]
  25. Ahmad, M.; Waraich, E.A.; Hafeez, M.B.; Zulfiqar, U.; Ahmad, Z.; Iqbal, M.A.; Raza, A.; Slam, M.S.; Rehman, A.; Younis, U.; et al. Changing climate scenario: Perspectives of Camelina sativa as low-input biofuel and oilseed crop. In Global Agricultural Production: Resilience to Climate Change; Springer: Cham, Switzerland, 2023; pp. 197–236. [Google Scholar]
  26. Kidane, B.; Hunde, W.; Urugo, M.M.; Tessema, F.; Teka, T.A. Camelina Oil as Ethiopia’s Next Edible Oil: Insights into Chemical Composition and Agro-Ecological Adaptability-A Review. J. Oleo Sci. 2025, 74, 655–666. [Google Scholar] [CrossRef]
  27. Gao, M.; Irawan, A.; El-Sherbiny, M.; Szumacher-Strabel, M.; Cieślak, A.; Setiawan, M.A.; Jallal, H.; Fusaro, I.; Jayanegara, A.; Yanza, Y.R.; et al. Meta-analysis of incorporating glucosinolates into diets and their effects on ruminant performance, ruminal fermentation, methane emissions, milk composition, and metabolic biochemical attributes. Animals 2025, 15, 1480. [Google Scholar] [CrossRef]
  28. Guendouz, A.; Hannachi, A.; Benidir, M.; Fellahi, Z.E.A.; Frih, B. Agro-biochemical Characterisation of Camelina sativa: A review. Agric. Rev. 2022, 43, 278–287. [Google Scholar] [CrossRef]
  29. Delver, J.J.; Smith, Z.K. Opportunities for Camelina Meal as a Livestock Feed Ingredient. Agriculture 2024, 14, 116. [Google Scholar] [CrossRef]
  30. Yalçın, S.; Ramay, M.S.; Yalçınkaya, H.; Kardoğan, Ö.; Erkurt, A.; Kılınç, B.; Gebeş, E.S.; Bundur, A.; Onbaşılar, E.E.; Yalçın, S.; et al. Evaluation of high levels of solvent extracted Camelina sativa meal in diets on performance, blood indices, cecal microorganisms, and nutrient digestibility in broilers. Trop. Anim. Health Prod. 2025, 57, 1–13. [Google Scholar] [CrossRef] [PubMed]
  31. Sızmaz, Ö.; Çalık, A.; Bundur, A. In vitro fermentation characteristics of camelina meal comparison with soybean meal. Livest. Stud. 2021, 61, 9–13. [Google Scholar] [CrossRef]
  32. Christodoulou, C.; Mavrommatis, A.; Mitsiopoulou, C.; Symeon, G.; Dotas, V.; Sotirakoglou, K.; Kotsampasi, B.; Tsiplakou, E. Assessing the optimum level of supplementation with camelina seeds in ewes’ diets to improve milk quality. Foods 2021, 10, 2076. [Google Scholar] [CrossRef]
  33. Tadayon, Z.; Rouzbehan, Y.; Abarghuei, M.; Rezaei, J. The effects of feeding increasing levels of camelina meal as a protein supplement on the performance of Holstein dairy cows. J. Dairy Sci. 2025, 108, 9579–9594. [Google Scholar] [CrossRef]
  34. Botta, C.; Tsoureki, D.; Gautam, A.; Patz, S.; Pissaridi, K.; Ferrocino, I.; Franciosa, I.; Cocolin, L.; Huson, D.H.; Rantsiou, K. The pros and cons of tracking the microbial contamination in infant food processing chain through amplicon sequencing and metagenomics. In Food System Microbiomes: Abstracts Book; 2024; pp. 1–161. Available online: https://iris.unito.it/handle/2318/1998634 (accessed on 9 October 2025).
  35. Paula, E.M.; da Silva, L.G.; Brandao, V.L.N.; Dai, X.; Faciola, A.P. Feeding canola, camelina, and carinata meals to ruminants. Animals 2019, 9, 704. [Google Scholar] [CrossRef]
  36. Page, M.J.; McKenzie, J.E.; Bossuyt, P.M.; Boutron, I.; Hoffmann, T.C.; Mulrow, C.D.; Shamseer, L.; Tetzlaff, J.M.; Akl, E.A.; Brennan, S.E.; et al. The PRISMA 2020 statement: An updated guideline for reporting systematic reviews. BMJ 2021, 372, n71. [Google Scholar] [CrossRef] [PubMed]
  37. Bramer, W.M.; Giustini, D.; De Jonge, G.B.; Holland, L.; Bekhuis, T. De-duplication of database search results for systematic reviews in EndNote. J. Med. Libr. Assoc. 2016, 104, 240–243. [Google Scholar] [CrossRef]
  38. Hooijmans, C.R.; Rovers, M.M.; De Vries, R.B.; Leenaars, M.; Ritskes-Hoitinga, M.; Langendam, M.W. SYRCLE’s risk of bias tool for animal studies. BMC Med. Res. Methodol. 2014, 14, 43. [Google Scholar] [CrossRef]
  39. Viechtbauer, W. Conducting meta-analyses in R with the metafor package. J. Stat. Softw. 2010, 36, 1–48. [Google Scholar] [CrossRef]
  40. Balduzzi, S.; Rücker, G.; Schwarzer, G. How to perform a meta-analysis with R: A practical tutorial. Evid. Based Ment. Health 2019, 22, 153–160. [Google Scholar] [CrossRef] [PubMed]
  41. Duval, S.; Tweedie, R. Trim and fill: A simple funnel-plot–based method of testing and adjusting for publication bias in meta-analysis. Biometrics 2000, 56, 455–463. [Google Scholar] [CrossRef]
  42. Egger, M.; Smith, G.D.; Schneider, M.; Minder, C. Bias in meta-analysis detected by a simple, graphical test. BMJ 1997, 315, 629–634. [Google Scholar] [CrossRef]
  43. Viechtbauer, W.; Cheung, M.W.L. Outlier and influence diagnostics for meta-analysis. Res. Synth. Methods 2010, 1, 112–125. [Google Scholar] [CrossRef]
  44. Bayat, A.R.; Kairenius, P.; Stefanski, T.; Leskinen, H.; Comtet-Marre, S.; Forano, E.; Chaucheyras-Durand, F.; Shingfield, K.J. Effect of camelina oil or live yeasts (Saccharomyces cerevisiae) on ruminal methane production, rumen fermentation, and milk fatty acid composition in lactating cows fed grass silage diets. J. Dairy Sci. 2015, 98, 3166–3181. [Google Scholar] [CrossRef] [PubMed]
  45. Halmemies-Beauchet-Filleau, A.; Kokkonen, T.; Lampi, A.M.; Toivonen, V.; Shingfield, K.J.; Vanhatalo, A. Effect of plant oils and camelina expeller on milk fatty acid composition in lactating cows fed diets based on red clover silage. J. Dairy Sci. 2011, 94, 4413–4430. [Google Scholar] [CrossRef]
  46. Halmemies-Beauchet-Filleau, A.; Shingfield, K.J.; Simpura, I.; Kokkonen, T.; Jaakkola, S.; Toivonen, V.; Vanhatalo, A. Effect of incremental amounts of camelina oil on milk fatty acid composition in lactating cows fed diets based on a mixture of grass and red clover silage and concentrates containing camelina expeller. J. Dairy Sci. 2017, 100, 305–324. [Google Scholar] [CrossRef]
  47. Hurtaud, C.; Peyraud, J.L. Effects of feeding camelina (seeds or meal) on milk fatty acid composition and butter spreadability. J. Dairy Sci. 2007, 90, 5134–5145. [Google Scholar] [CrossRef]
  48. Lawrence, R.D.; Anderson, J.L.; Clapper, J.A. Evaluation of camelina meal as a feedstuff for growing dairy heifers. J. Dairy Sci. 2016, 99, 6215–6228. [Google Scholar] [CrossRef]
  49. Ponnampalam, E.N.; Knight, M.I.; Moate, P.J.; Jacobs, J.L. An alternative approach for sustainable sheep meat production: Implications for food security. J. Anim. Sci. Biotechnol. 2020, 11, 83. [Google Scholar] [CrossRef]
  50. Salas, H.; Castillejos, L.; Faturi, C.; Ferret, A. Effects of replacing canola meal with camelina expeller on intake, total tract digestibility, and feeding behavior of beef heifers fed high-concentrate diets. Transl. Anim. Sci. 2020, 4, 922–932. [Google Scholar] [CrossRef]
  51. De Marzo, D.; Laudadio, V.; Khan, R.U.; Tufarelli, V.; Maiorano, G. Feeding of Camelina sativa Seeds to Light-Type Gentile di Puglia Lambs: Effect on Productive Performance and Muscle Fatty Acid Composition. Anim. Biotechnol. 2023, 34, 2360–2366. [Google Scholar] [CrossRef]
  52. Christodoulou, C.; Mavrommatis, A.; Loukovitis, D.; Symeon, G.; Dotas, V.; Kotsampasi, B.; Tsiplakou, E. Inclusion of Camelina sativa Seeds in Ewes’ Diet Modifies Rumen Microbiota. Animals 2023, 13, 377. [Google Scholar] [CrossRef] [PubMed]
  53. Dai, X.X.; Weimer, P.J.; Dill-McFarland, K.A.; Brandao, V.L.N.; Suen, G.; Faciola, A.P. Camelina Seed Supplementation at Two Dietary Fat Levels Change Ruminal Bacterial Community Composition in a Dual-Flow Continuous Culture System. Front. Microbiol. 2017, 8, 2147. [Google Scholar] [CrossRef] [PubMed]
  54. Brandao, V.L.N.; Silva, L.G.; Paula, E.M.; Monteiro, H.F.; Dai, X.; Lelis, A.L.J.; Faccenda, A.; Poulson, S.R.; Faciola, A.P. Effects of replacing canola meal with solvent-extracted camelina meal on microbial fermentation in a dual-flow continuous culture system. J. Dairy Sci. 2018, 101, 9028–9040. [Google Scholar] [CrossRef] [PubMed]
  55. Peng, Q.H.; Khan, N.A.; Wang, Z.S.; Yu, P.Q. Moist and dry heating-induced changes in protein molecular structure, protein subfractions, and nutrient profiles in camelina seeds. J. Dairy Sci. 2014, 97, 446–457. [Google Scholar] [CrossRef] [PubMed]
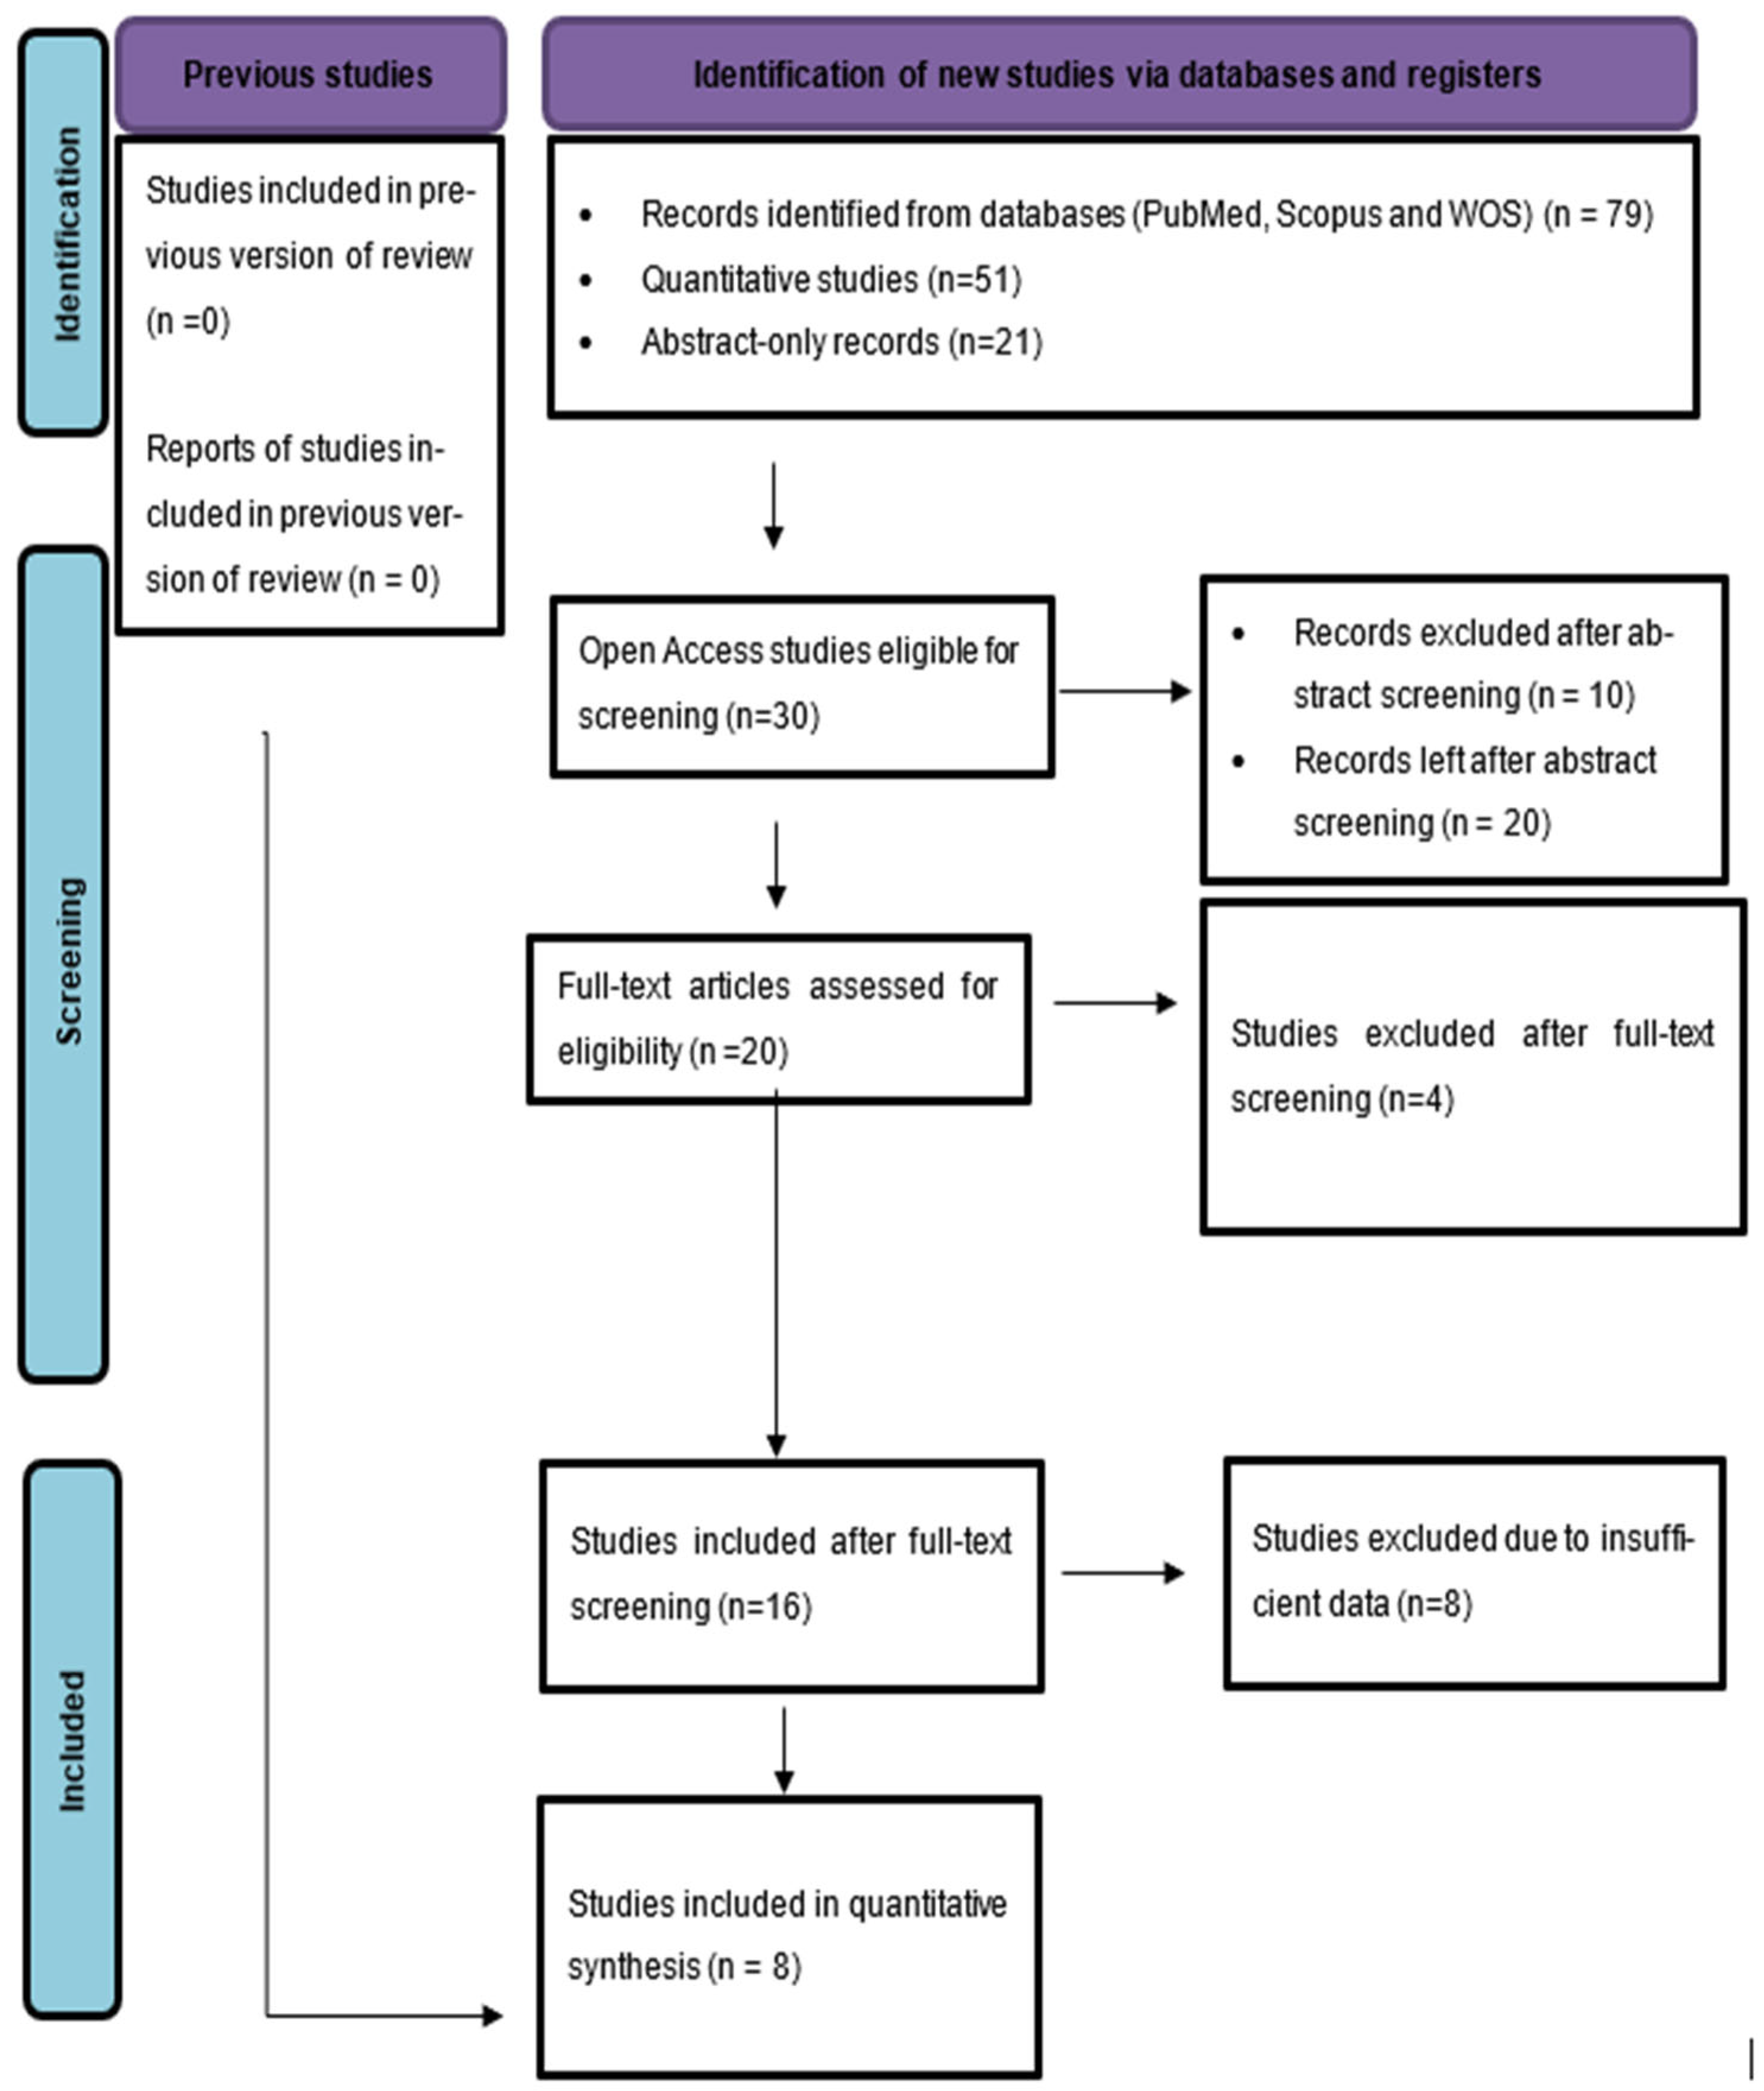
Figure 1. PRISMA 2020 flow diagram illustrating the identification, screening, eligibility, and inclusion of studies for the meta-analysis. A total of 79 records were identified, 20 full-text articles were assessed for eligibility, and 8 studies were included in the quantitative synthesis.
Fermentation 11 00593 g001
Figure 2. Forest plot illustrates the mean difference (MD) in dry matter intake (DMI, kg/day) between Camelina-supplemented and control groups across studies. Data are derived from Bayat et al. [44], Halmemies-Beauchet-Filleau et al. [46], Hurtaud and Peyraud [47], Salas et al. [50], Halmemies-Beauchet-Filleau et al. [45], Lawrence et al. [48], and Ponnampalam et al. [49].
Fermentation 11 00593 g002
Figure 3. Influence diagnostics plots for the meta-analysis on dry matter intake (DMI), highlighting the study by Halmemies-Beauchet-Filleau et al. [46] (identified as No. 2) as a potential outlier or influential study based on studentized residuals (rstudent), Cook’s distance (cook.d), and its influence on heterogeneity (tau2.del) and model fit (QE.del). The red dot indicates the data point corresponding to the potentially influential study, while the dashed horizontal lines represent reference thresholds for detecting outliers or high influence values in each diagnostic metric.
Fermentation 11 00593 g003
Figure 4. Funnel plot with trim-and-fill method suggesting potential publication bias in the meta-analysis of DMI (kg/day).
Fermentation 11 00593 g004
Figure 5. Forest plot shows the mean difference (MD) in milk yield (kg/day) between ruminants supplemented with Camelina and control groups. The pooled estimate was calculated using a random-effects model. The squares represent individual study estimates, and the horizontal lines indicate 95% confidence intervals (CIs). The diamond denotes the overall pooled effect size with its CI. The arrow indicates that the CI extends beyond the displayed x-axis range. Data are derived from Bayat et al. [44], Christodoulou et al. [32], Halmemies-Beauchet-Filleau et al. [46], and Hurtaud and Peyraud [47].
Fermentation 11 00593 g005
Figure 6. Dose–response meta-regression between Camelina inclusion level (% of dry matter) and mean difference in milk yield (kg/day).
Fermentation 11 00593 g006
Figure 7. Funnel plot for studies evaluating the effect of Camelina supplementation on milk yield. Each point represents an individual study, plotted by its mean difference (x-axis) and standard error (y-axis). The vertical dashed line indicates the overall pooled mean difference, while the shaded regions represent the pseudo–95% confidence limits within which studies are expected to scatter in the absence of publication bias or small-study effects.
Fermentation 11 00593 g007
Figure 8. Forest plot showing the mean difference (MD) in milk protein concentration (g/kg) between ruminants supplemented with Camelina and control diets. The pooled estimate was calculated using a random-effects model. The squares represent individual study estimates, and the horizontal lines indicate 95% confidence intervals (CIs). The diamond denotes the overall pooled effect size with its CI. Data are derived from Bayat et al. [44], Halmemies-Beauchet-Filleau et al. [46] Halmemies-Beauchet-Filleau et al. [45], and Hurtaud and Peyraud [47].
Fermentation 11 00593 g008
Figure 9. Funnel plot for studies evaluating the effect of Camelina supplementation on milk protein concentration. Each point represents an individual study, plotted by its mean difference (x-axis) and standard error (y-axis). The vertical dashed line indicates the overall pooled mean difference, while the shaded regions represent the pseudo–95% confidence limits within which studies are expected to fall in the absence of publication bias or small-study effects.
Fermentation 11 00593 g009
Figure 10. Forest plot shows the mean difference (MD) in milk fat concentration (g/kg) between ruminants supplemented with Camelina and control groups. The pooled effect was estimated using a random-effects model. Squares represent individual study estimates, and horizontal lines indicate 95% confidence intervals. The diamond at the bottom shows the overall pooled effect. Data are derived from Bayat, Kairenius [44], Christodoulou et al. [32], Halmemies-Beauchet-Filleau et al. [45] and Hurtaud and Peyraud [47].
Fermentation 11 00593 g010
Figure 11. Funnel plot assessing publication bias in studies reporting the effect of Camelina supplementation on milk fat concentration. Each point represents an individual study, plotted by its mean difference (x-axis) and standard error (y-axis). The vertical dashed line indicates the overall pooled effect estimate. The shaded regions represent the pseudo–95% confidence limits, within which studies are expected to lie in the absence of publication bias or small-study effects.
Fermentation 11 00593 g011
Figure 12. Forest plot showing the standardized mean differences (SMD; Hedges’ g) for the effect of Camelina supplementation on rumen pH and methane emission. The pooled estimate was obtained using a random-effects model. Squares represent individual study effect sizes with 95% confidence intervals, and the diamond indicates the overall pooled effect. Data are derived from Bayat et al. [44], Hurtaud and Peyraud [47], and Lawrence et al. [48].
Fermentation 11 00593 g012
Figure 13. Leave-one-out sensitivity analysis evaluating the influence of individual studies on the pooled standardized mean difference (SMD; Hedges’ g) for Camelina supplementation effects. Each point represents the recalculated overall effect size when the corresponding study is removed. The red dashed line indicates the pooled SMD from the full model including all studies.
Fermentation 11 00593 g013
Figure 14. Funnel plot evaluating potential publication bias in studies reporting the effects of Camelina supplementation on rumen fermentation and methane emission. Each point represents a study, plotted by its standardized mean difference (SMD; x-axis) and standard error (y-axis). The vertical dashed line indicates the pooled SMD from the meta-analysis. The shaded regions represent the pseudo–95% confidence limits, within which studies are expected to lie in the absence of small-study effects or publication bias.
Fermentation 11 00593 g014
Figure 15. Forest plot of metabolic and digestibility outcomes (mmol/L or equivalent units). Forest plot showing the mean differences (MD) in metabolic and digestibility parameters (mmol/L) in ruminants supplemented with Camelina products compared to controls. The pooled estimate was derived using a random-effects model. Squares represent individual study effects, and horizontal lines denote 95% confidence intervals. The diamond indicates the overall pooled effect. Data are derived from Halmemies-Beauchet-Filleau et al. [46], Hurtaud and Peyraud [47], Lawrence et al. [48], and Salas et al. [50].
Fermentation 11 00593 g015
Figure 16. Funnel plot assessing potential publication bias based on standardized mean differences (SMD) for outcomes related to Camelina supplementation. Each point represents an individual study plotted by its observed effect size (x-axis) and standard error (y-axis). The vertical dashed line indicates the pooled SMD from the meta-analysis. The shaded regions correspond to the pseudo–95% confidence limits, within which studies are expected to lie in the absence of publication bias or small-study effects.
Fermentation 11 00593 g016
Table 1. Study characteristics.
Study IDAnimal and Experimental DesignIntervention Details (Including Dosage)Comparator (Control)Outcomes
Bayat et al. [44]4 Finnish Ayrshire dairy cows; multiparous; fitted with rumen cannulas; 53 ± 7 DIM; ~711 kg BW; housed in individual tie stalls; milked twice daily; allocated in a 4 × 4 Latin square design; four 42-day periods (23 d adaptation, 5 d sampling, 14 d washout); diet fed as TMR.Camelina oil (60 g/kg DM, 6% of DM), replacing concentrate; provided 4× daily. Compared with two live yeast strains (0.5 g/d, 1010 cfu/d) directly into the rumen.Basal TMR (50:50 forage:concentrate, grass silage-based); no added Camelina oil or yeast; nutrient and energy requirements met.Intake (DM, OM, CP, fiber, starch, FAs); digestibility (OM, CP, NDF, ADF, starch); fermentation (pH, ammonia-N, VFA); gas emissions (methane, CO2); N balance; microbial populations (qPCR); milk production and composition (yield, ECM, fat, protein, lactose); milk FAs (SFA, MUFA, PUFA, CLA); efficiency metrics (milk N/N intake, CH4 intensity, energy use).
Christodoulou et al. [32]48 Chios ewes, 2–4 yrs, 55 ± 6.5 kg, 67 ± 8 DIM; 4 groups (n = 12); 60-day RCT; groups housed, individually fed.Camelina seed in concentrate at 6%, 11%, and 16% of DM; partially replaced soybean meal and maize; offered 2× daily after milking; concentrate intake 1.5 kg/ewe/day.Standard concentrate without Camelina; all diets isonitrogenous and comparable in energy.Milk: ↓ fat (decrease) (CSS16), ↑ increase in total solids (CSS11), no effect on yield, protein, lactose, SNF, SCC, FCM, ECM. FA: ↓ SFA (C14:0, C16:0), ↑ PUFA (ALA, CLA), ↑ MUFA, ↓ ω6/ω3, ↓ atherogenic and thrombogenic indices, ↑ health index. Blood FA: ↓ C14:0, C15:0, C16:0, ↑ C18:2 n-6, ↑ ALA. Plasma: ↑ SOD (CSS16), ↑ CAT (CSS11, CSS16), ↑ MDA (CSS11), ↑ PC (CSS16), ↑ FRAP (CSS16), ↑ ABTS (CSS6, CSS11). Milk oxidative: ↑ SOD, CAT, GSH-Px, ABTS, FRAP (CSS16), ↓ MDA, PC (CSS16).
Halmemies-Beauchet-Filleau et al. [45]5 Finnish Ayrshire cows; tie stall; 5 × 5 Latin square, 21-d periods; 115 ± 5 DIM; avg. milk yield 33.5 kg/d; red clover silage-based; 12 kg/d concentrate + ad lib silage.Camelina oil (2.9%) or expeller (20% concentrate, 350 g lipid/d); diets isonitrogenous/isoenergetic.Control with no added lipid; also included rapeseed/sunflower oil; all diets isonitrogenous.Milk yield/composition unaffected; FA profile: ↓ SFA (12:0, 14:0, 16:0), ↑ MUFA, PUFA, CLA; ↑ trans-11 18:1, cis-9, trans-11 CLA with CE vs. CO; intake, digestibility, plasma mostly unaffected; lower milk 18:3n-3 in CE than CO; CE ↑ trans FA intermediates (incomplete biohydrogenation).
Halmemies-Beauchet-Filleau et al. [46]8 Finnish Ayrshire cows, multiparous, mid-lactation (91 ± 16.5 DIM); individual tie stalls; 4 × 4 Latin square; 21-d periods; 4 rumen-cannulated.Camelina oil 0, 2, 4, 6% of concentrate DM in expeller-cereal base; 12 kg/d concentrate; ad libitum grass/red clover silage (1:1 DM).Basal diet without oil; all diets isoenergetic and contained Camelina expeller.Milk yield, ECM, fat/protein/lactose yield; rumen pH, ammonia-N, VFA, protozoa; digestibility (DM, OM, NDF, fat, N); plasma NEFA, glucose, insulin, BHB, acetic acid; sensory score (1–5); detailed milk FA profile (CLA, trans FA, PUFA, SFA); FA secretion in milk.
Hurtaud and Peyraud [47]6 Holstein cows; double 3 × 3 Latin square; lactating; individually housed; 3 × 4-week periods; 12 experimental units.Camelina seed (630 g/d) or meal (2 kg/d); both ~240 g PUFA/day; corn silage-based diet.Corn silage + high-energy concentrate + soybean meal; isoenergetic/isonitrogenous.Milk: fat %, protein %, lactose %, FCM, CLA, FA profile (trans-10 C18:1, cis-9, trans-11 CLA). Rumen: pH, acetate, propionate, butyrate, C2:C3. Plasma: glucose, NEFA, glycerol, urea, α-amino N. Butter: churning, hardness, spreadability. DMI, energy/protein balance, short-/medium-chain FA.
Lawrence et al. [48]42 heifers (33 Holstein, 9 Brown Swiss), ~145 d old, ~172 kg; 3 groups (13, 13, 12); pens (6/pen, straw bedding); 12-wk feeding after 2-wk adaptation; randomized block.10% Camelina meal (cold-pressed); 60% grass hay + 40% concentrate; isonitrogenous, limit-fed 2.65% BW.10% DDGS and 10% linseed meal; all diets isonitrogenous, energy matched.DMI, ADG, gain:feed, body weights/length, BCS, frame, rumen (pH, NH3-N, VFA), blood (glucose, cholesterol, triglycerides, PUN), hormones (IGF-1, insulin, T3, T4), total-tract digestibility (DM, OM, CP, NDF, ADF).
Ponnampalam et al. [49]160 sheep (80 Composite, 80 Merino); Composite (~4 mo), Merino (~15 mo); 20 pens (10/group); 8–10 wks; 2 × 3 factorial.Camelina hay (CAMH), Camelina meal (CAMM) pellets; full pelleted diets, ad libitum; 2-wk adaptation; ≥150 g/d LWG.Control pellet (CONT) with conventional summer feeds; similar ME (10–11 MJ/kg DM), CP (14–15%); isocaloric/isonitrogenous.Final LWG: Composites: 17.6–20.3 kg, Merinos: 10.7–12.9 kg; Dressing %: Composites (CAMH: 48.1%), Merinos (CAMM: 45.8%); hot carcass weight: CAMH/CAMM ~5% ↑ vs. CONT in Composites; carcass fat (GR): unaffected; methane (g CH4/kg DMI): lower CAMH/CAMM; profit/lamb higher with CAMH/CAMM.
Salas et al. [50]24 Simmental beef heifers (initial BW ≈ 295 kg), pens (3/pen), 4 × 4 replicated Latin square; 28-d periods × 4 (112 d); competitive feeding (12.5 m2 pens).Camelina expeller (CE) replacing canola meal (CM) at 0%, 3%, 6%, and 9% of diet DM; 90:10 concentrate:straw TMR; isoenergetic (2.8 Mcal ME/kg DM), isonitrogenous (13% CP); CE: 0%, 2.7%, 5.4%, 8.1% (concentrate).Diet with 15.8% canola meal, 0% CE; isoenergetic/isonitrogenous.DMI, OM, CP, NDF intake: no significant effect; digestibility: DM, OM, CP, NDF unaffected; feeding behavior: ↑ intake of long particles (p = 0.015), ↓ sorting in 6CE/9CE; chewing activity: no sig. differences; ruminating/chewing ↑ numerically.
Table 2. Risk of bias (RoB) assessment.
Study IDRoB Tool UsedOverall Risk of Bias
Bayat et al. [44]SYRCLE’s RoB ToolModerate
Christodoulou et al. [32]SYRCLE’s RoB ToolLow
Halmemies-Beauchet-Filleau, Kokkonen [45]SYRCLE’s RoB ToolModerate
Halmemies-Beauchet-Filleau et al. [46]SYRCLE’s RoB ToolModerate
Hurtaud and Peyraud [47]SYRCLE’s RoB ToolModerate
Lawrence et al. [48]SYRCLE’s RoB ToolModerate
Ponnampalam et al. [49]SYRCLE’s RoB ToolModerate
Salas et al. [50]SYRCLE’s RoB ToolModerate
Disclaimer/Publisher’s Note: The statements, opinions and data contained in all publications are solely those of the individual author(s) and contributor(s) and not of MDPI and/or the editor(s). MDPI and/or the editor(s) disclaim responsibility for any injury to people or property resulting from any ideas, methods, instructions or products referred to in the content.