Article

Fermentation Strategies to Improve Argentinian Kefir Quality: Impact of Double Fermentation on Physicochemical, Microbial, and Functional Properties

by
Raúl Ricardo Gamba
1,
Andrea Ibáñez
1,
Sofía Sampaolesi
2,
Pablo Mobili
3 and
Marina Alejandra Golowczyc
3,*
1
Cátedra de Microbiología, Departamento de Ciencias Biológicas, Facultad de Ciencias Exactas, Universidad Nacional de La Plata, 47 y 115, La Plata 1900, Argentina
2
Centro de Investigación y Desarrollo en Ciencias Químicas e Ingeniería (CINDECA, CONICET-CICPBA-UNLP), Facultad de Ciencias Exactas, UNLP, 47 y 115, La Plata 1900, Argentina
3
Centro de Investigación y Desarrollo en Ciencia y Tecnología de los Alimentos (CIDCA, CONICET-CICPBA-UNLP), Facultad de Ciencias Exactas, UNLP, 47 y 116, La Plata 1900, Argentina
*
Author to whom correspondence should be addressed.
Fermentation 2025, 11(10), 584; https://doi.org/10.3390/fermentation11100584 (registering DOI)
Submission received: 31 August 2025 / Revised: 27 September 2025 / Accepted: 2 October 2025 / Published: 11 October 2025
(This article belongs to the Special Issue Traditional and Innovative Fermented Dairy Products)

Abstract

This present study investigated the microbial dynamics, physicochemical and functional properties, and sensory characteristics of kefir produced by two different approaches: traditional kefir obtained directly from grains and kefir manufactured through a double-fermentation process in cow milk. For the first fermentation, kefir grains were inoculated in milk at different levels (1%, 3%, and 5% w/v) and incubated at 30 °C for 24 h. The lowest inoculation level promoted the greatest increase in grain biomass, whereas higher inoculation levels produced more pronounced pH decreases. All products maintained stable pH values during refrigerated storage at 4 °C for 15 days. Products derived from initial fermentations with 1% and 3% inoculum were subsequently used in a second fermentation step at two inoculation levels (1% and 10% v/v) to produce double-fermentation kefir products. These products exhibited higher counts of lactic acid bacteria and reduced yeast populations compared with traditional grain kefir. After 15 days of storage, all kefir samples maintained more than 108 CFU/mL of lactic acid bacteria, more than 107 CFU/mL of acetic acid bacteria, and around 105 CFU/mL of yeasts. Protein content was comparable among all kefir products and unfermented milk. The product obtained with 1% grains followed by 10% v/v inoculation showed enhanced biofilm formation that increased during storage and displayed the strongest antimicrobial activity, and was therefore selected for sensory evaluation, where it achieved favorable acceptance by regular kefir consumers.

Graphical Abstract

1. Introduction

Kefir is a traditional fermented dairy product that has gained global recognition as a probiotic food for its potential health benefits [1]. This fermented milk beverage is characterized by its diverse and unique symbiotic microbial community, consisting of lactic acid bacteria (LAB), yeasts, and acetic acid bacteria (AAB), which collectively contribute to its distinctive flavor, texture, and functional properties [2,3,4,5]. Traditionally, kefir is produced through a single-stage fermentation process, where kefir grains are directly inoculated into milk and allowed to ferment [6]. Recent studies have investigated sequential double-fermentation (also known as backslopping), an emerging technique in which a starter culture derived from grain-fermented kefir is applied in a secondary fermentation step [7,8]. This approach has shown potential for enhancing microbial stability, fermentation consistency, and industrial scalability. Through modification of the microbial ecology, double-fermentation can yield kefir with distinct biochemical, functional, and sensory profiles compared to traditional methods [8,9]. It may also promote the production of bioactive metabolites, optimize acidification kinetics, and improve storage stability [7,10]. However, the full impact of this technique on kefir’s microbial composition and functional attributes remains an area of current investigation. In Argentina, kefir production remains limited to artisanal practices, as industrial-scale manufacturing has not yet been established. Nevertheless, research and consumer interest are rapidly increasing, largely attributed to its documented functional and health-promoting properties.
The microbial ecology of kefir is a key determinant of its functional properties, with LAB and yeasts playing synergistic roles in fermentation and health benefits [1]. The fermentation process in kefir is primarily determined by microbial metabolism, leading to acidification, lactose consumption, and the production of bioactive compounds [7]. Studies have demonstrated that double-fermented kefirs often reach lower pH and higher titratable acidity compared to traditional kefir, attributed to controlled LAB activity [8,11]. For example, Garofalo et al. [7] observed that traditional kefir exhibited a slower decline in °Brix values, reflecting residual sugar metabolism by yeasts, whereas double-fermented kefirs showed more predictable sugar utilization patterns. Solanki et al. [12] reported that fortified sweetened traditional kefir maintained stable pH levels during storage. While traditional kefir harbors a diverse microbiota, including high yeast populations [5,13], double-fermented kefir may exhibit a modified microbial structure due to the sequential inoculation process [8]. Recent studies suggest that this approach can enhance LAB dominance while maintaining essential yeast interactions, leading to improved probiotic viability and metabolic activity [14,15]. Additionally, research indicates that double-fermentation can influence microbial resilience during storage, with LAB counts remaining above the threshold required for probiotic efficacy (>8 log CFU/mL) [12,16]. However, the impact of this method on yeast diversity, a critical factor in kefir flavor and functional complexity, requires further investigation [17].
Kefir antimicrobial properties are attributed to organic acids, bacteriocins, and other bioactive metabolites produced during fermentation [1]. Recent research indicates that double-fermented kefir exhibits a shift in microbial composition that depends on fermentation times [18], and it may trigger diverse inhibitory effects against foodborne pathogens due to changes in microbial interactions. Furthermore, sequential fermentation has been shown to improve biofilm formation, a critical factor for probiotic survival in the gastrointestinal tract, by promotion of synergistic relationships between LAB and yeasts [19]. This is supported by studies demonstrating that microbial cross-talk in kefir, such as that between Kluyveromyces marxianus and Lactobacillus spp., strengthens biofilm matrices and enhances probiotic colonization [14].
Despite differences in microbial composition, both traditional and double-fermented kefir products receive high sensory acceptability scores, suggesting that controlled fermentation does not compromise consumer appeal [7,10]. However, industrial adoption of sequential fermentation requires further optimization to replicate the complex flavor profiles of traditional kefir while ensuring scalability [11]. We hypothesize that double-fermented kefir products present at least comparable or better characteristics than traditional kefir, while enabling more efficient production processes. This study evaluates double-fermentation kefir production, comparing their physicochemical, microbial, and functional properties with traditional kefir using grains. Integrating microbiological analysis, FTIR spectroscopy, and functional assays, this work provides new insights into how sequential fermentation modifies kefir microbial system and bioactive potential.

2. Materials and Methods

2.1. Kefir Grains and Kefir Production

Kefir grains CIDCA AGK1 [20] were kindly provided by Professor Graciela De Antoni, from National University of La Plata (Argentina). The grains were preserved at −80 °C in UHT whole cow milk (Yatasto, Bs. As., Argentina; milk composition of each 100 mL: -calories 57.5 kcal, -carbohydrates (lactose) 4.7 g, -proteins 2.9 g, -fat 3 g) and activated for three successive passages in whole milk (10% w/v) at 30 °C for 24 h [21]. The media were replaced three or four times a week by fresh medium. Activated grains were used for each of the assays.
Grains were inoculated in sterile glass jars at 5%w/v (traditional kefir, G5), 3%w/v (G3) or 1%w/v (G1) in whole cow milk and incubated at 30 °C for 24 h. After fermentation, the grains were removed by filtration with a sieve of 1-mm2 mesh size, and the filtrate was designated as kefir product or first fermentation products. Recovered grains were available for further fermentations. First fermentation products originating from 1% and 3% grain (G1 and G3) were inoculated at 1% and 10%v/v into sterile glass jars containing fresh milk to produce double-fermentation kefir products: G1.F1, G1.F10, G3.F1, G3.F10, that were analyzed immediately after fermentation and during refrigerated storage at 4 °C for 15 days (Figure 1).
Different fractions of each of the kefir products were separated and used for microbial counts, measurement of pH, °Brix, titratable acidity, and FTIR analysis; the remaining parts were centrifuged, filtered through membranes of 0.22 μm pore size (Sartorius®, Göttingen, Germany), and stored at –80 °C until use. These cell-free supernatants (CFS) were used for quantification of sugar and protein contents and for antimicrobial assays.

2.2. Bacterial and Fungal Strains

Escherichia coli strain 125/99, Salmonella enterica subspecies enterica serovar Enteritidis strain 101, Listeria monocytogenes ATCC7644, and Candida albicans ATCC MYA-2876 from the CIDCA collection (La Plata, Argentina) were used. The strains were kept at −80 °C. Bacteria and yeast were activated in nutrient broth (Biokar Diagnostics, Beauvais, France) or YPD broth (Biokar Diagnostics) by incubation at 37 °C for 24 h, respectively. A suspension of each pathogen was prepared from an overnight culture for antimicrobial assays described in Section 2.9 and Section 2.10.

2.3. Determination of Grain Biomass, pH, °Brix and Titratable Acidity

Kefir grains grown in cow milk were incubated at 30 °C for 24 h for each fermentation (G1, G3 and G5, see Figure 1). Kefir grains were washed with sterile water, dried with tissue paper, and weighed on an analytical balance model A200S (Sartorius®).
The pH readings of the fermented products were made with a pH meter instrument (Altronix®, Taiwan). The °Brix readings of the fermented products were carried out with a refractometer (Pocket PAL-J™, Atago, Japan).
For the quantification of total titratable acidity, a volume of 10 mL of each kefir product (added with 2–3 drops of phenolphthalein 1% w/v in ethanol) was mixed with 90 mL of distilled water, stirred with a magnetic stirrer and then titrated with 0.1 N NaOH. The results were expressed as grams of lactic acid per 100 mL.
All the assays were performed in triplicate. Grain biomass was only measured in G1, G3 and G5, whereas pH, °Brix and total titratable acidity were measured in G5 and in double-fermentation kefir products.

2.4. Determination of Protein Concentration

Protein quantification was carried out using the bicinchoninic acid (BCA) assay as described by Lu et al. [22]. A standard calibration curve using bovine serum albumin (BSA, Sigma-Aldrich®, Kankakee, IL, USA) was prepared by adding 0.1 mL of standard protein solutions (0, 25, 125, 250, 500, 750, 1000, 1500, and 2000 μg/mL) into nine separate test tubes. Each tube received 1 mL of BCA working reagent, followed by vortexing for 5 min and incubation at 60 °C for 10 min. The tube with no protein was the blank control. Absorbance was measured at 562 nm by using a UV/visible spectrometer model Lambda35 (Perkin Elmer, Waltham, MA, USA) after cooling the reaction mixes in ice bath, and a standard curve was generated using protein concentration versus absorbance. Traditional kefir using grains (G5) and double-fermentation kefir products, fresh and stored, were diluted 1:50 and 1:100 and analyzed using the same procedure. Protein concentrations were determined by interpolating sample absorbance values with the standard curve. All measurements were performed in triplicate, and results were expressed as mean protein concentration (μg/mL).

2.5. Determination of Sugar Concentration

To analyze sugar content in kefir samples we used dinitrosalicylic acid (DNS) method [21,23]. DNS reacts with the free carbonyl group of reducing sugars under alkaline conditions, forming 3-amino-5-nitrosalicylate, with a maximum absorption at 540 nm; the absorbance is directly proportional to the amount of reducing sugars. In our procedure, x mL standard or kefir sample, 2 mL of DNS reagent and (2 − x) mL H2O were added to a test tube, then mixed and incubated in a boiling water bath for 5 min. After cooling in ice bath, the absorbance of each sample was recorded at 540 nm against a reagent blank. Linear regression equation was obtained using a glucose standard solution.

2.6. Fourier Transform Infrared Spectroscopy (FTIR) Analysis

Approximately 5 µL of each sample were placed on the sample holder of an Attenuated Total Reflectance FTIR (ATR-FTIR) Thermo Nicolet iS10 spectrometer (Thermo Scientific, Waltham, MA, USA). Spectra were registered in the 4000–600 cm−1 range by co-adding 64 scans with 4 cm−1 spectral resolution, using OMNIC software (version 8.3, Thermo Scientific, MA, USA). At least 5 spectra were recorded for each sample.
Whenever necessary, residual contributions due to water, atmospheric water vapor and CO2 were eliminated by subtraction of the corresponding spectra from the registered sample spectra, in order to obtain a flat baseline.

2.7. Enumeration of Bacteria and Yeasts

One milliliter of each fermented product was diluted in 0.1% (w/v) peptone water. Bacteria and yeasts were enumerated by the surface spread technique [24]. Each diluted sample (100 μL) was spread in three different culture media. Lactic acid bacteria (LAB) were enumerated in MRS (De Man–Rogosa–Sharpe medium) agar (Difco®, Le Pont-de-Claix, France). Acetic acid bacteria (AAB) were enumerated in AAB agar formulated as 5%w/v glucose (Baker, CA, USA), 1%w/v yeast extract (Difco), 3%v/v ethanol, 0.03%w/v bromocresol green (Sigma-Aldrich, USA) and 2%w/v agar (Biokar Diagnostics). Yeasts were enumerated in yeast extract glucose chloramphenicol (YGC) agar with 0.01%w/v chloramphenicol (Dr. Ehrenstorfer GmbH®, Augsburg, Germany). After spreading, the AAB and YGC plates were incubated at 30 °C for 48 h, and the MRS plates were incubated in an anaerobic incubator at 30 °C for 72 h. Plates with 30 to 300 CFU were chosen to obtain mean colony-forming units.

2.8. Biofilm Production of Kefir

Biofilm production activity was monitored in static 96-well microtiter dishes following the method of Kubota et al. [25] with modifications as follows. Hydrophilic-treated wells (Costar 3595 96-well polystyrene microtiter dishes, Corning, NY, USA) were filled with kefir beverages (immediately after incubation for 24 h at 30 °C or stored at 4 °C) and incubated at 37 °C under aerobic conditions for 24 h. The supernatant was poured off and the biofilms were stained with 200 μL 0.1%w/v crystal violet in deionized water. The biofilms were incubated for 30 min at room temperature and then rinsed twice with deionized water. The dye in the cells was then remobilized in 200 μL 95%v/v ethanol, and the absorbance of the solution (600 nm) was determined by spectrophotometer (Spectra MAX 190; Molecular Devices, Sunnyvale, CA, USA). Values of A600 < 0.1 were considered as no formation of biofilms.

2.9. Measurement of Antimicrobial Activity

The inhibitory activity of CFS from fermented milks against E. coli strain 125/99, S. enterica subspecies enterica serovar Enteritidis strain 101, L. monocytogenes ATCC7644, and C. albicans ATCC MYA-2876 was tested [21]. The CFS from fermented milk after 24 h at 30 °C or after 14 d at 4 °C, obtained as indicated in Section 2.1, were serially diluted (from 100%v/v kefir to 25%v/v kefir) in nutrient broth. One hundred ninety microliters of each sample were inoculated with 10 μL of the pathogen overnight culture, uniformly mixed and incubated at 37 °C for 48 h. Pathogen growth was detected by plate counts. To determine bacteriostatic/bactericidal activity of the samples, aliquots of 100 μL of each sample were subcultured in nutrient agar (Britania, Argentina) dishes and counted after incubating at 37 °C for 24 h. Pathogens inoculated in unfermented milk were used as a control. Each test was performed in duplicate.

2.10. Co-Incubation of Traditional Kefir or Double-Fermentation Kefir Products with Bacterial Pathogens

In co-incubation experiments, each of the bacterial pathogens was inoculated in cow milk simultaneously with kefir grains or with first fermentation products. Overnight pathogen cultures (Escherichia coli 125/99, Salmonella enterica serovar Enteritidis 101, and Listeria monocytogenes ATCC 7644) were added to milk at a 1:100 dilution, yielding an initial inoculum of approximately 106 CFU/mL. Initial pathogen concentrations were verified by plate counts on nutrient agar. Milk was then inoculated with 5%w/v kefir grains or with 1 or 10% v/v of first fermentation products G1 or G3. Following inoculation, each product was incubated at 30 °C for 24 h to allow fermentation and subsequently stored at 4 °C for 15 days. Samples were collected at defined time points (3 h, 1 d, 8 d, and 15 d) and plated on nutrient agar. Plates were incubated at 37 °C for 24 h, and colonies were enumerated. Additional samples were plated on MRS agar, AAB agar, and YGC agar, as described previously, to monitor the dynamics of kefir-associated microorganisms when coincubated with the pathogens.

2.11. Sensory Analysis

To select the best overall sample for sensory analysis, data corresponding to 14 physicochemical, microbiological and functional parameters was represented in four spider web plots. Each axis of the plot was oriented so that higher (outer) values indicated better performance, allowing the shape and area of each resulting polygon to reflect the overall quality and balance of each fermentation method. The plots were separated by product condition (fresh vs. stored), making it possible to assess stability over time.
To ensure an objective selection of the best method, the data for each variable was first normalized, placing all parameters on a common scale. Following this, a relative weight was assigned to each of the 14 parameters based on its direct impact on the quality of the final product, including its organoleptic properties, safety, and functionality. For instance, physicochemical parameters like pH, total titratable acidity and °Brix, which influence taste and texture, were each given a relative weight of 0.06. A weight of 0.06 was also assigned to microbiological counts of LAB, AAB and yeasts, which are critical for product stability and functionality. Finally, functional and antimicrobial properties, such as the ability to form biofilms and to inhibit a range of pathogens, were considered most crucial for product safety and added value, receiving the highest weights of 0.08. The global score for each sample was then calculated by summing the product of the normalized value and the relative weight for each parameter. This calculation was performed for both the fresh product and the product after 15 days of storage. The fermentation method with the highest overall score was then selected for further sensory analysis.
The sensory panel comprised regular consumers of dairy products (yogurt/kefir), selected for their discriminatory ability and consumption experience [26]. The evaluations were carried out in compliance with the requirements of ISO standards related to sensory testing in the food industry [27,28,29]. Two tests were used to compare double-fermentation kefir G1.F10 and traditional kefir from grains G5, following Moretti et al. [30]. Samples (50 mL at 10 °C) were coded and presented randomly to panelists, with water for palate cleansing.
Similarity Test: A triangle test was conducted with 25 panelists, who identified the odd sample among three (two G1.F10 and one G5, or vice versa). Results were analyzed using Equation (1) according to Hough [31]:
1 LS% = [(1.5 · (x/n)–0.5) + 1.5 · Zβx√((n · x-x2)/n3)] ·100,
where the level of significance LS% = upper limit of the panelist’s percentage; x = number of correct answers; n = number of panelists; Zβ = 1.64 (value corresponding to one tail of the normal curve). Statistical parameters for similarity were α = 0.10; β = 0.05 with an estimated proportion of discriminators (Pd) of 30% [31].
Acceptability Test: Untrained panelists (n = 53) evaluated both kefirs (G1.F10 and G5) using a 9-point hedonic scale [30].

2.12. Statistical Analysis

The results of the independent assays are presented as mean ± standard deviation. Comparisons among replicates in every group were made using the Tukey test in the Statgraphics Plus 5.1® software. All the experiments were performed at least in duplicate.

3. Results and Discussion

3.1. Acidity, pH Stability, and °Brix Dynamics in Kefir Fermentation

During fermentation, the lactose from milk is partially transformed to acids (mainly lactic acid and acetic acid), causing a pH reduction and an increase in total titratable acids (TTA) in the fermented kefir. At the same time, the metabolization of lactose to volatile compounds such as acetic acid and ethanol, among others, is accompanied with a reduction in the °Brix. The pH and TTA values of the samples before and after fermentation are reported in Table 1. As expected, in all samples after fermentation there was a significant reduction in pH accompanied with the corresponding significant increase in TTA, in comparison with the starting milk (pH values of kefirs ranged from 4.12 ± 0.03 to 4.50 ± 0.04, while pH of milk was around 6.75 ± 0.06; TTA ranged from 0.85 ± 0.05 to 1.00 ± 0.05 g/100 mL for kefir versus 0.15 ± 0.01 g/100 mL in milk). In all cases, acidity attained the values demanded for kefir in the Codex Standard for Fermented Milk [32]. When G1 and G3 where compared with G5, inoculum percentage greatly influenced the fermentation process, since inoculum increase produced lower pH and higher acidity). Unexpectedly, G1 showed a greater biomass increase compared to G3 and G5 (Figure S1, Supplementary Material).
At the same time, significant differences were noted between traditional kefir using grains (G5) and double-fermentation kefir products. Double-fermentation kefir products from 10% v/v first fermentation inoculum exhibited lower pH (e.g., pH 4.12 ± 0.03 and 4.19 ± 0.04 in G1.F10 and G3.F10, respectively, vs. 4.32 ± 0.03 in G5) and higher acidity (1.00 ± 0.05 g/100 mL in G1.F10 vs.0.87 ± 0.06 g/100 mL in G5) compared to G5, in agreement with Elgarhy et al. [10], who noted minor pH differences between fresh traditional kefir and double-fermented kefir products.
As lactose fermentation by LAB led to acid production and a corresponding decrease in soluble solids, °Brix levels dropped from 12.2°B in fresh milk to 6.2°B in G5 and 6.7–6.4°B in double-fermentation kefir products within 24 h (Table 1). These findings are in agreement with Garofalo et al. [7], who reported similar results in lactose consumption and acidification using kefir from Bosnia and Herzegovina origin, suggesting that microbial metabolism leads to these changes. Sugar consumption was comparable across all cases.
Protein content was measured in G5, double-fermentation kefir products, and unfermented milk as control, and no significant differences were detected between the samples (Figure S2, Supplementary Material), confirming that double-fermentation does not compromise the nutritional quality of kefir. These findings are consistent with previous studies [8,10], which reported no significant differences in protein content between traditional kefir and double-fermentation kefir products. However, Garofalo et al. [7] observed an 11% higher protein content in double-fermentation kefir compared to traditional kefir.
Acidity increased and pH decreased during storage at 4 °C for 15 days, and these changes were more pronounced for double-fermentation kefir products from 10% v/v first fermentation inoculum (e.g., TTA from 1% to 1.21% and pH from 4.12 to 3.87 in G1.F10). This partially contrasts with Kim et al. [8], who reported that double-fermentation kefir products showed a stable pH, but not traditional kefir, highlighting that controlled fermentation minimizes post-fermentation biochemical changes. On the other hand, °Brix remained stable, indicating that residual sugars were not further metabolized (Table 1), in contrast to Elgarhy et al. [10], who observed greater °Brix variability in stored traditional kefir, possibly due to prolonged yeast activity.
The combined analysis of pH, acidity, and °Brix demonstrates that double-fermentation kefir products evaluated in the present study offer more predictable fermentation kinetics than traditional kefir (G5), with balanced acid production and sugar metabolism. These results, in agreement with Gul et al. [34] and Garofalo et al. [7], highlight the potential of double-fermentation methods for standardized kefir production while maintaining physicochemical characteristics. Further research should explore long-term storage effects on sugar stability in different kefir products.

3.2. Microbial Composition and Fermentation Dynamics

Our investigation into the microbial profiles of kefir revealed significant differences between traditional kefir using grains (G5) and double-fermentation kefir products (Table 2). The controlled fermentation process of G1.F1, G1.F10, G3.F1 and G3.F10 products resulted in consistently higher lactic acid bacteria (LAB) counts (9.04–9.31 log CFU/mL) compared to G5 (8.21 log CFU/mL), while demonstrating lower yeast populations (5.18–5.94 log CFU/mL versus 7.44 log CFU/mL in G5). Rosa et al. [1] emphasized the central role of LAB in developing kefir characteristic properties and health benefits. The differences observed between the microbial communities of kefir produced by different methods could result from the more controlled fermentation conditions of the processes using starter, which selectively favor LAB growth while naturally limiting yeast proliferation, in contrast to the more dynamic and variable ecosystem of traditional kefir using grains.
Elgarhy et al. [10] reported more modest differences between production methods (traditional vs. double-fermentation: LAB: 8.26 vs. 8.53 log CFU/mL; yeast: 4.14 vs. 4.56 log CFU/mL). Kim et al. [8] presented data aligning with our yeast count patterns (TK: 7.10 vs. starter: 5.22 log CFU/mL) but found comparable LAB levels across methods (9.02–9.73 log CFU/mL). These variations likely reflect differences in fermentation protocols, grain origin, microbial strains, and cultural conditions across studies.
Storage stability assessments revealed significant practical implications for industrial kefir production. During a 15-day refrigeration at 4 °C, both G5 and double-fermentation kefir products maintained stable AAB populations (G3.F1 even demonstrated a 1 log increase), and while most samples showed slight declines in LAB, in all cases LAB counts stood above 8 log CFU/mL. Most samples showed slight declines (less than 1 log CFU/mL) in yeast viability, except for G5 where yeasts greatly declined from 7.16 to 5.48 log CFU/mL. All samples comfortably met the microbial standards established by Codex Alimentarius [32], affirming their suitability for commercial distribution.
The scientific literature describes complex and variable storage behavior for kefir. While Elgarhy et al. [10] reported stable LAB with increasing yeast counts during storage, Kim et al. [8] observed no significant microbial changes in shorter-term storage (11 days). More manifest variations were informed by Grønnevik et al. [35], who found kefirs from commercial starter frequently failed to maintain adequate yeast counts. Our results, particularly the stability of selected double-fermentation formulations, support the conclusions of Kim et al. [11] regarding the importance of microbial stability for functional kefir products.

3.3. FTIR Analysis

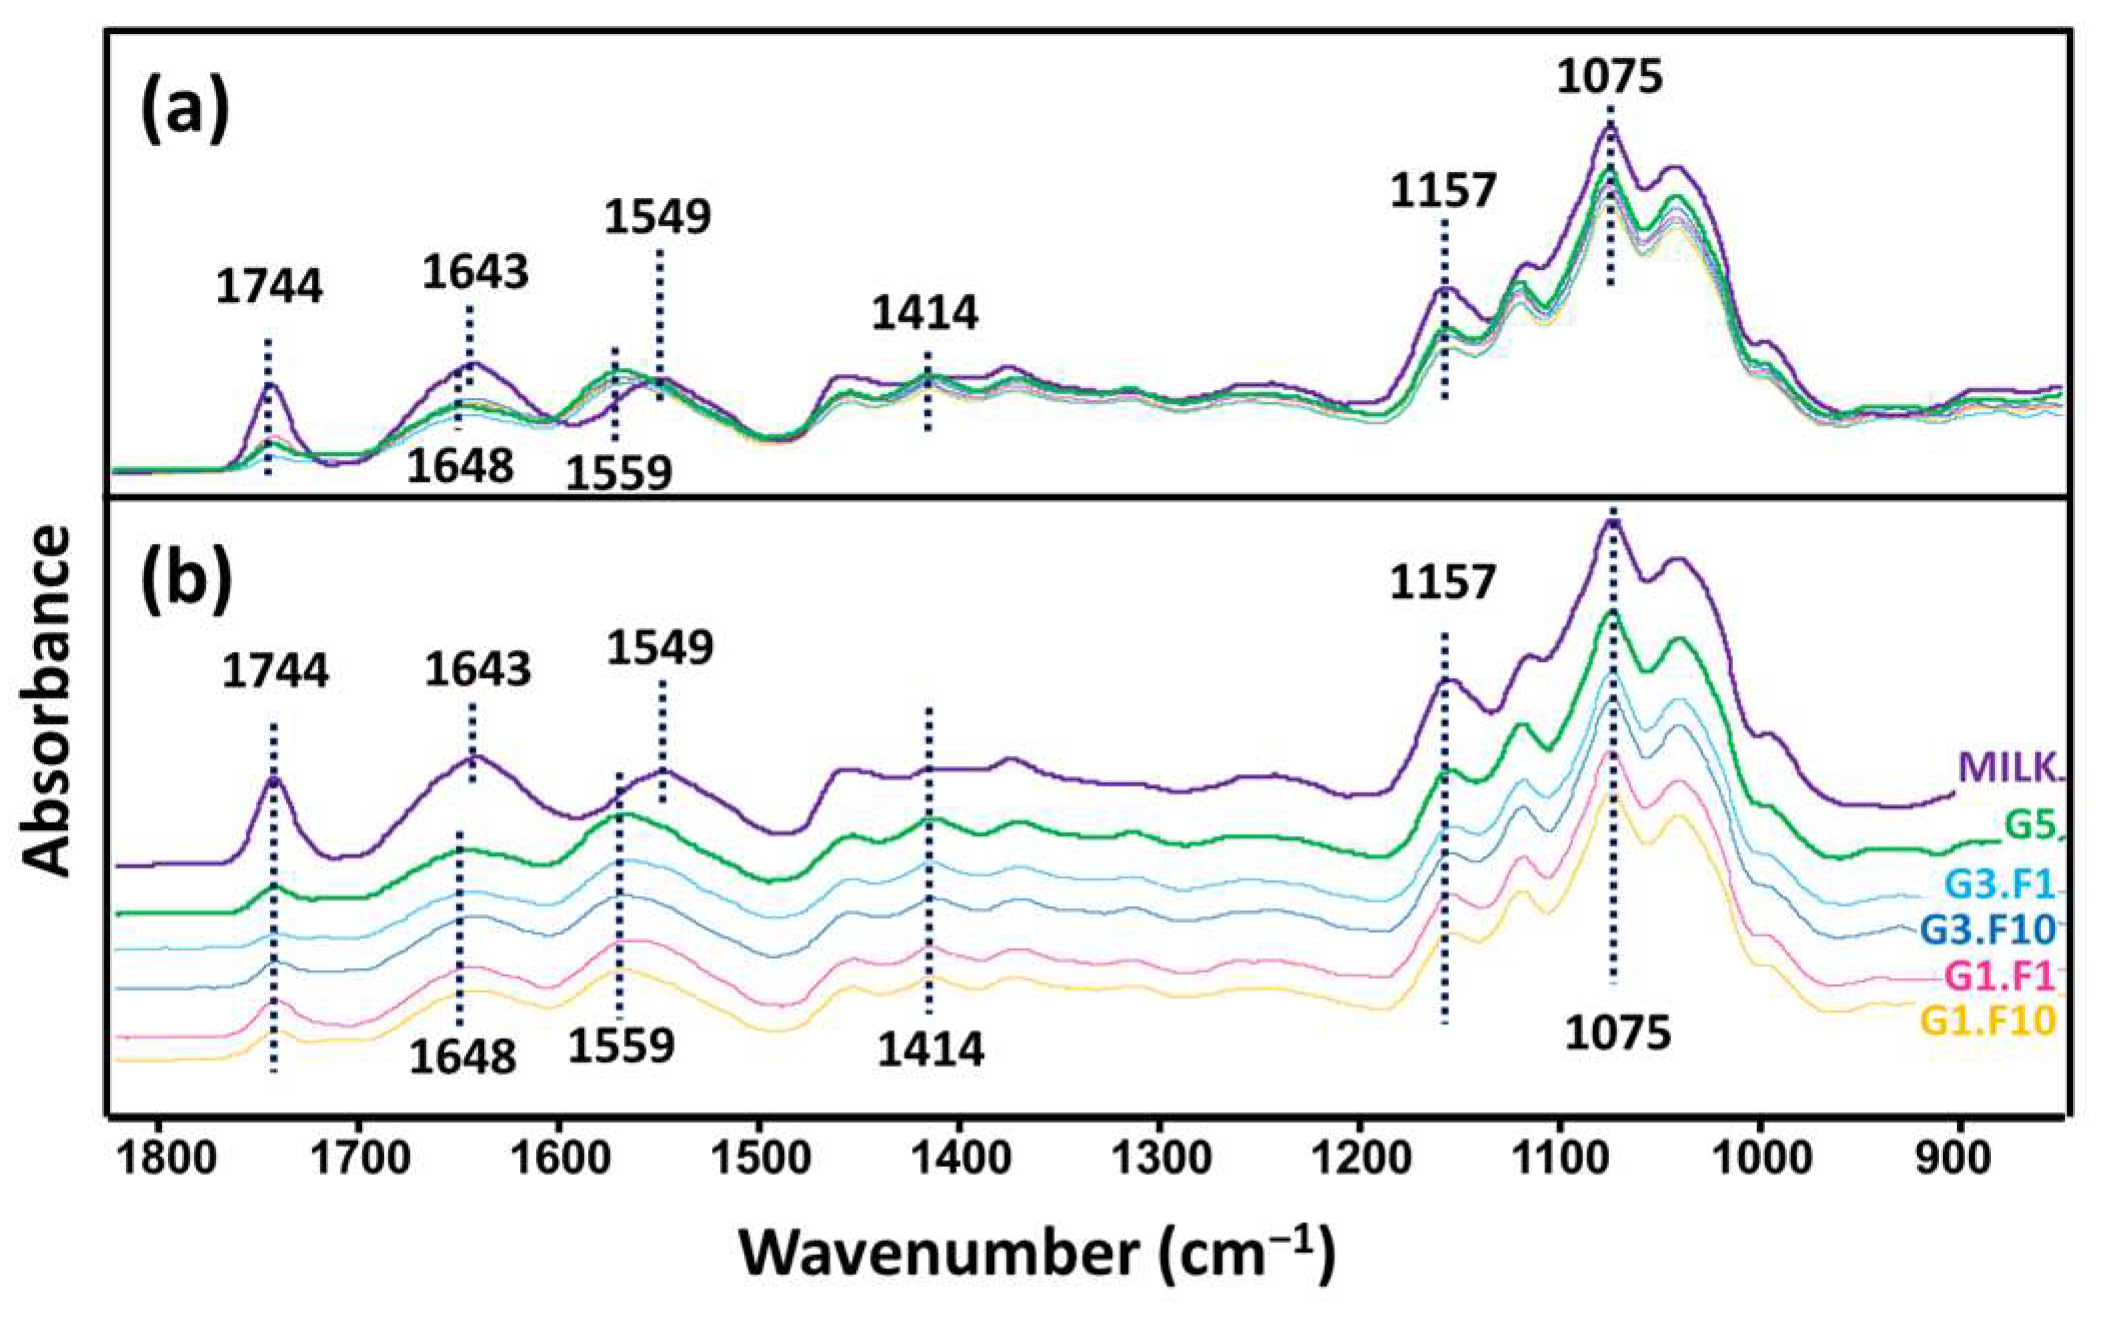
FTIR analysis provides insights into changes in protein structures, lipid profiles, and carbohydrate metabolism, offering valuable information about how fermentation influences kefir composition. In the present study, FTIR spectra were recorded for fresh milk and for the different fermented products, immediately after fermentation and after storage at 4 °C. In spite of the overall similar appearance, some differences were observed between the spectra of fresh milk and those of the different fermentation products (G5, G3.F1, G3.F10, G1.F1 and G1.F10) (Figure 2). The main differences appeared in the regions corresponding to the C=O stretching of carboxylic acids (1744 cm−1), the amide I and amide II bands of proteins (around 1640 and 1550 cm−1 respectively) and the bands of the fingerprint zone of sugars (several bands between 1170 and 1020 cm−1, related to the stretching of C-O bonds and the bending of C-OH groups), in particular in the peaks at 1157 and 1075 cm−1 assigned to lactose [36,37]. These changes in the FTIR spectra confirm the effectiveness of the fermentation process, indicating that the activity of the microorganisms produces a significant molecular alteration on the milk, as expected.
Both traditional kefir (G5) and the double-fermentation variants (G3.F1, G3.F10, G1.F1, G1.F10) showed FTIR spectra with highly similar band patterns when comparing the freshly fermented samples (1d) to those kept for 15 days at 4 °C (15d). This consistency suggests that the overall composition of the fermented milk remains largely unchanged over time (Figure S3, Supplementary Material), providing clear evidence of the molecular stability of the products during the refrigeration period.

3.4. Functional Properties: Biofilm Production and Antimicrobial Activity

Biofilm production is an important functional property, as it can enhance the survival of probiotic bacteria in the gastrointestinal tract (GIT) and improve their colonization [38]. Table 3 presents the biofilm formation for the different kefir products, immediately after a 24 h fermentation and during storage at 4 °C. Traditional kefir (G5) does not show significant changes over storage time, with only a modest rise between days 1 and 15. In contrast, double-fermentation kefir products showed a more pronounced ability to form biofilms. Among these, G1.F1 demonstrated the greatest increase, reaching the highest biofilm biomass after 15 days, while G3.F1 and G1.F10 also exhibited a pronounced biofilm development. The finding of an improved biofilm formation during storage in double-fermentation kefir products is supported by Wang et al. [39] and Han et al. [40], who reported a significant increase in biofilm formation after an extended fermentation period. Wang et al. [19] further explored kefir biofilm dynamics, demonstrating that Kluyveromyces marxianus G-Y4 enhances the growth and biofilm formation of Lacticaseibacillus paracasei GL1 and Lactobacillus helveticus SNA12. The study referenced above revealed that even dead cells of the K. marxianus, along with its cell wall polysaccharides, contribute significantly to the structural reinforcement of bacterial biofilms, highlighting the complex microbial interactions underlying this functional phenotype. Piermaria et al. [41] and Prado et al. [2] reported that biofilm formation enhances probiotic survival in the gut. In line with these findings, the increase in biofilm production observed in our study may contribute to improved functional properties.
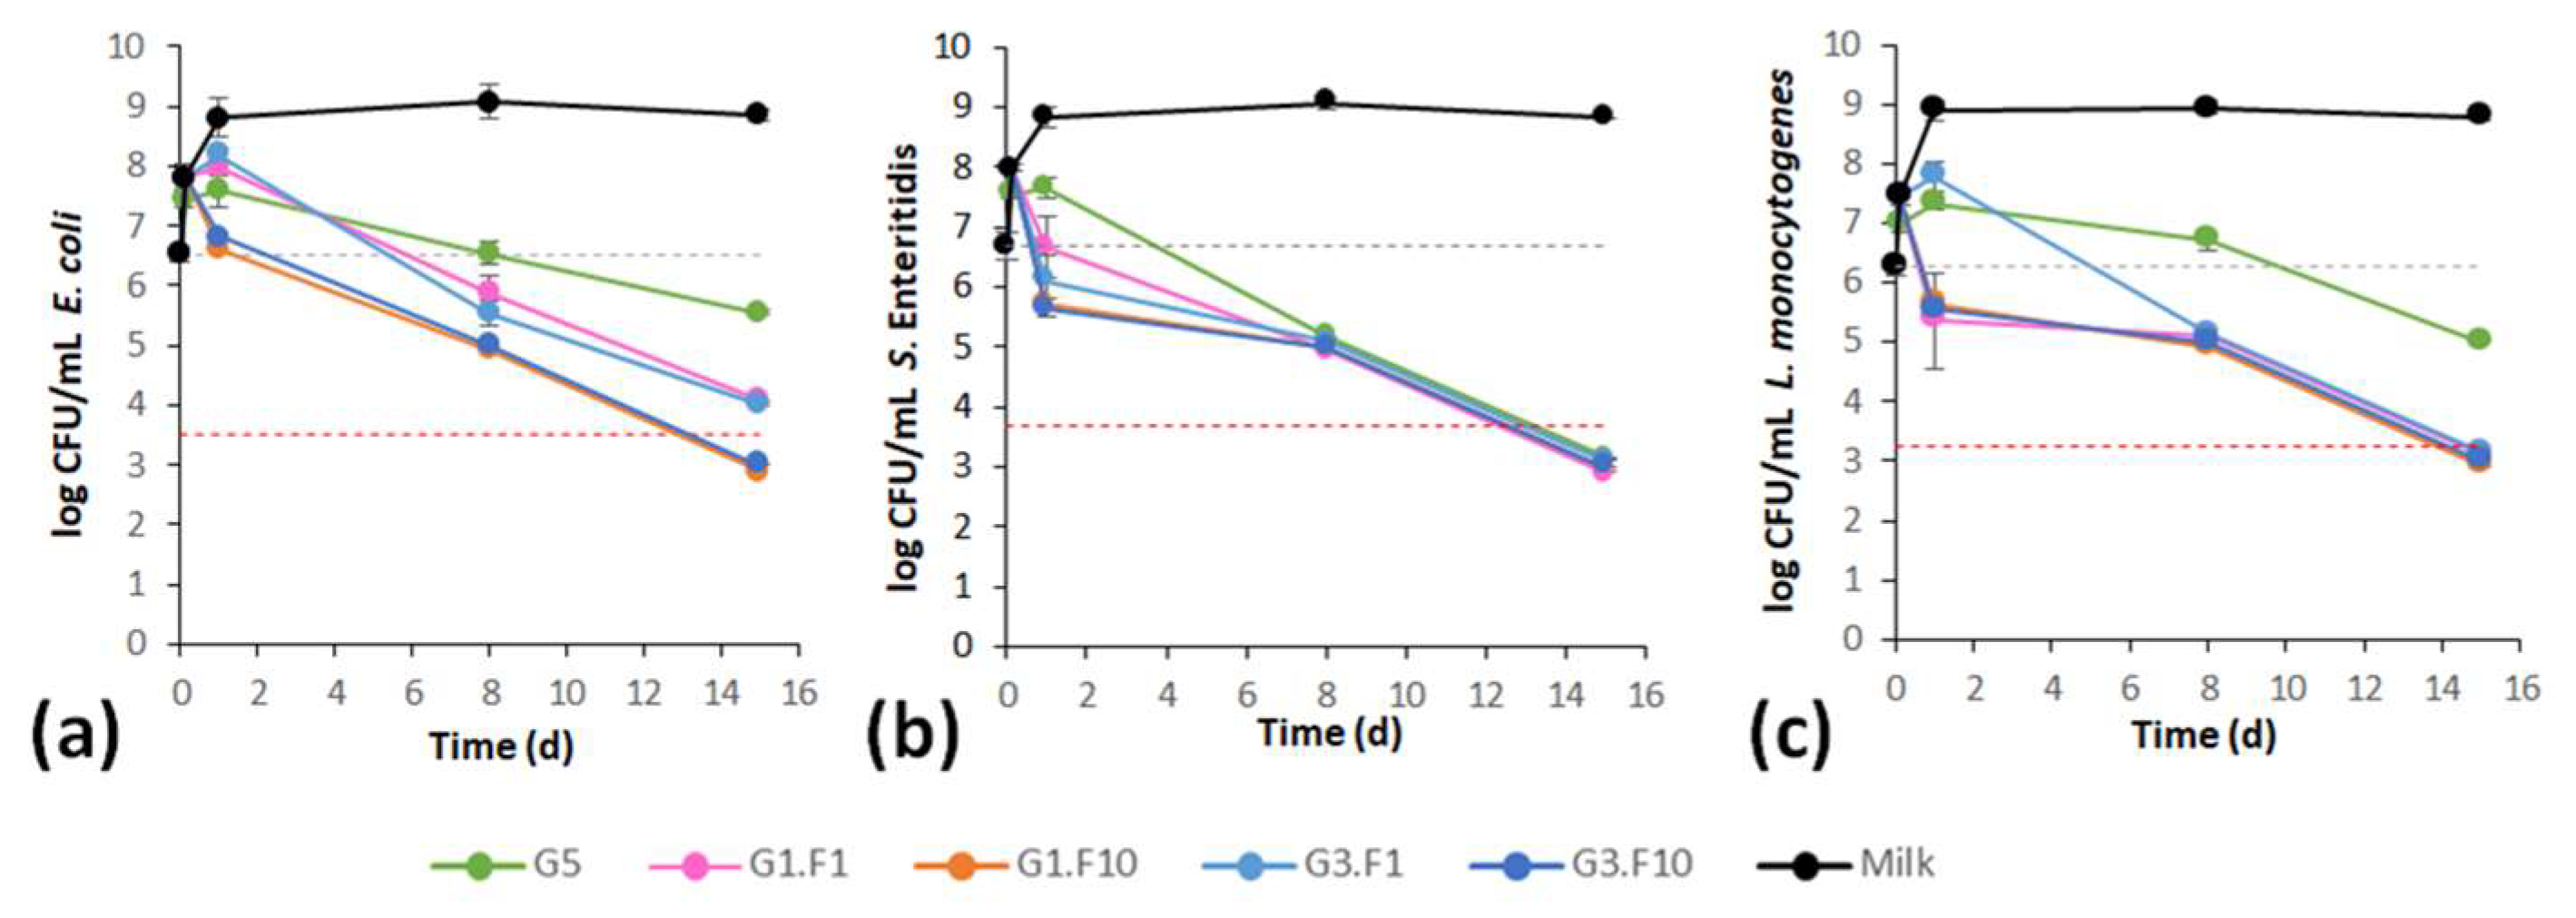
In co-incubation experiments (where pathogens and kefir products were simultaneously inoculated in milk), double-fermentation kefir products G1.F10 and G3.F10 showed the strongest inhibition of pathogens, while G5 remained less effective (Figure 3). After 15 days of storage, G1.F10 and G3.F10 caused a 3 log decrease in pathogen counts. At the same time, the dynamics of the main microbial groups of kefir (LAB, AAB and yeasts) were comparable to those of kefir without pathogens (Tables S1–S3, Supplementary Material).
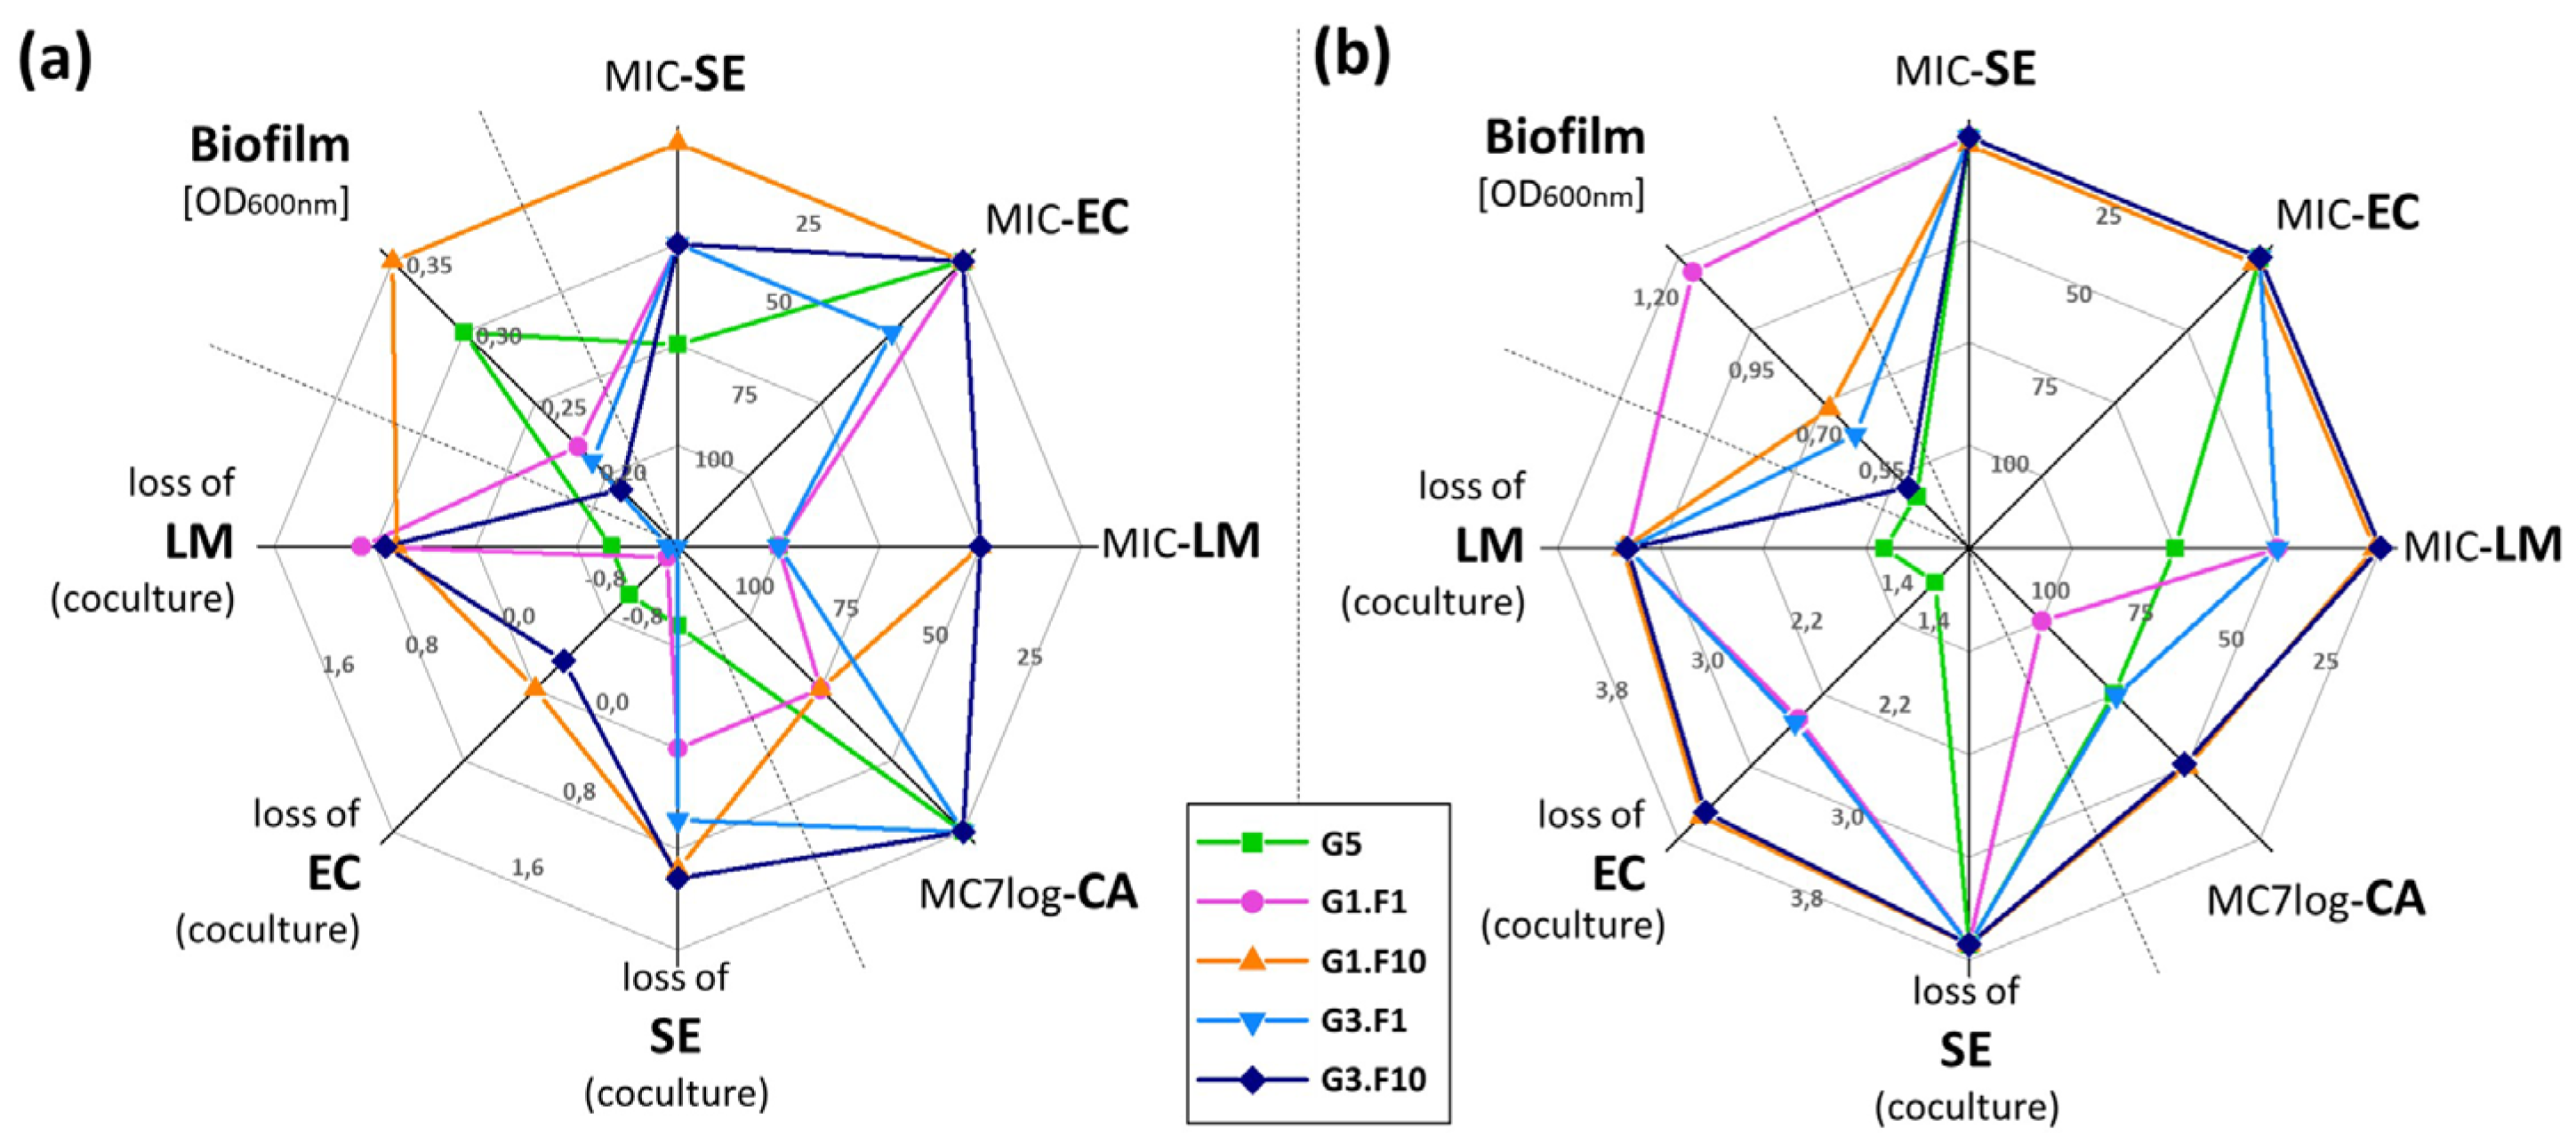
Antimicrobial inhibition assays using CFS of kefir demonstrated that the double-fermentation kefir product G1.F10 exhibited the highest antimicrobial activity against the evaluated foodborne pathogens, both in post fermentation time and after 15 days in cold storage (Figure 4). This effect is likely attributable to the increased lactic acid production resulting from the metabolic activity of lactic acid bacteria (LAB), as previously reported by several authors [1,2,3,6]. Stored kefir samples (Figure 4b) showed stronger antibacterial activity compared to post-fermentation product, consistent with the findings of Gul et al. [34], who attributed this effect primarily to the accumulation of organic acids and bacteriocins. Moreover, double-fermentation kefir products exhibited superior antibacterial activity compared to traditional kefir (G5), which may be attributed to their more standardized and stable microbial composition. In contrast, the yeast Candida albicans exhibited greater resistance to kefir CFS compared to the bacterial strains tested (Figure 4). Among the evaluated products, G5, G3.F10 and G1.F10 (stored for 15 days) showed the strongest inhibitory effect against C. albicans. Interestingly, E. coli exhibited high sensitivity to kefir CFS, in contrast to its greater resistance observed in the coincubation assay (Figure 3 and Figure 4). This discrepancy highlights the importance of using multiple assay types, as they are able to reveal different bacterial susceptibility patterns. These differences arise from the fundamentally different experimental designs: CFS assays assess the activity of concentrated antimicrobial metabolites against a relatively low pathogen inoculum, whereas co-incubation experiments assess the competitive interactions between the kefir microbiota and higher pathogen loads under fermentation-like conditions.

3.5. Global Analysis of Kefir Product Characteristics

In order to select the optimal fermentation method for sensory evaluation, the physicochemical, microbiological and functional data presented in the previous sections was condensed into four spider web plots, allowing the simultaneous visualization of multiple variables in a single view. In each plot, the axis corresponding to each of the variables was oriented so that outer values indicate a better performance, hence the area and shape of each polygon reflect the overall quality and balance of each fermented product. The calculation of weighted scores for each sample (Table S4, Supplementary Material) allowed an objective selection of the most promising fermentation method.
Figure 4 presents a comprehensive analysis of the functional properties evaluated both immediately after the post-fermentation time and following 15 days of storage at 4 °C. Double-fermentation kefir ptoducts G1.F10 and G3.F10 showed overall better functional properties than traditional kefir G5. Product G1.F10 demonstrated enhanced biofilm-forming capacity and stronger inhibitory activity against pathogenic bacteria in both the cell-free supernatant (CFS) and co-incubation assays (Figure 4a). Notably, after 15 days of refrigerated storage, both its biofilm-forming ability and antimicrobial effectiveness further increased (Figure 4b).
Figure 5 summarizes the physicochemical and microbiological characteristics of the kefir products. In the fresh product (Figure 5a), when taking into account the physicochemical properties (pH, TTA, °Brix), the best overall performance was shown by double-fermentation kefir products G1.F10 and G3.F10, while the traditional kefir G5 performed more poorly. On the other hand, when considering the microbial profile (LAB, AAB and yeast counts), G5 showed the best score (mainly due to a high yeast count that compensated for its much lower LAB count), followed by double-fermentation kefir products G1.F10 and G3.F10.
After 15 days of storage at 4 °C (Figure 5b), once again double-fermentation kefir products G1.F10 and G3.F10 showed the best performance with respect to the physicochemical parameters, and they were only behind G3.F1 in terms of microbiological properties. The initially high LAB counts in G1.F10 remained stable throughout the storage period, showing no significant decline. In contrast, traditional kefir G5 achieved lower scores than almost all double-fermentation kefir products, both in physicochemical and microbiological parameters, due in part to its significant reduction in yeast counts during storage.
Based on the weighted and normalized scores obtained for each sample, G1.F10 was identified as the most promising candidate for sensory analysis. This sample achieved the highest total score (1.556), with strong performances observed both immediately after fermentation (0.785) and after 15 days of refrigerated storage (0.772). These results indicate not only a superior initial quality but also an excellent stability over time. Compared to the other samples, G1.F10 consistently maintained high values across most of the evaluated parameters, suggesting a well-balanced product with optimal physicochemical, microbial, and functional characteristics. For these reasons, G1.F10 was considered the best choice for further organoleptic testing.

3.6. Sensory Evaluation

A panel of frequent kefir consumers conducted a sensory analysis comparing the traditional kefir (from grains, G5) and the double-fermented kefir product G1.F10.
Using a 9-point hedonic scale, 91% of the panelists rated both products as “acceptable” to “very acceptable” (scores of 6 to 9; Figure S4, Supplementary Material). However, a significant discriminative difference was detected between the two products. The Level of Significance (LS%) was 40.9%, which exceeded the 30% difference threshold (Pd = 30% [31]; p < 0.05) required to conclude that the products were perceptibly different.
These findings are consistent with those of Elgarhy et al. [10], who reported similarly high acceptability scores for double-fermented and traditional kefir (92.26 vs. 92.05) with both products showing a similar decline in acceptance during storage (86.00 vs. 85.00 at 14 days). Similarly, Kim et al. [8] found no sensory differences between fresh double-fermented and traditional kefir but noted superior maintenance of taste and texture in double-fermented kefir during 11 days of cold storage. Barukčić et al. [42] also reported slightly higher sensory scores for kefir produced from commercial starter compared to traditional kefir, confirming the sustained consumer appeal of the products obtained from starters.

4. Conclusions

While traditional kefir maintains certain ecological characteristics that may influence stability and sensory properties during storage, double-fermented kefir provides greater control over the fermentation profile and microbial consistency, optimizing probiotic viability and antimicrobial properties, resulting in a product with enhanced functional characteristics.
The present study validates double fermentation of Argentinian kefir as a viable technological method for kefir production, as it balances the microbial richness and bioactivity of traditional kefir with the reproducibility and stability required for industrial scale.
The product obtained using 1% grains followed by 10% inoculation (G1.F10 product) exhibited the most favorable microbial profile, the strongest antimicrobial activity, and was well accepted by regular kefir consumers. Moreover, this formulation demonstrated the greatest stability, with minimal loss of physicochemical and microbiological properties after 15 days of storage.
Further research is needed to explore long-term storage, metabolomic profiling, and in vivo validation. Additionally, it is essential to optimize starter culture compositions to preserve the microbial diversity of traditional kefir while achieving the standardization required by the modern food industry.

Supplementary Materials

The following supporting information can be downloaded at: https://www.mdpi.com/article/10.3390/fermentation11100584/s1. Figure S1: Biomass increase of grains inoculated in milk. Figure S2: Protein content of traditional kefir using grains (G5) and double-fermentation kefir products (G1.F1, G1.F10, G3.F1, G3.F10). Figure S3: ATR-FTIR spectra of traditional kefir using grains (G5) and double-fermentation kefir products (G1.F1; G1.F10; G3.F1 and G3.F10), fresh and stored. Figure S4: Acceptability of traditional kefir G5 and double-fermentation kefir product G1.F10. Table S1: Viable counts of lactic acid bacteria (LAB), yeast and acetic acid bacteria (AAB) in traditional kefir using grains (G5) and double-fermentation kefir products (G1.F1, G1.F10, G3.F1, G3.F10) co-incubated with E. coli 125/99. Table S2: Viable counts of lactic acid bacteria (LAB), yeast and acetic acid bacteria (AAB) in traditional kefir using grains (G5) and double-fermentation kefir products (G1.F1, G1.F10, G3.F1, G3.F10), co-incubated with Salmonella Enteritidis 101. Table S3: Viable counts of lactic acid bacteria (LAB), yeast and acetic acid bacteria (AAB) in traditional kefir using grains (G5) and double-fermentation kefir products (G1.F1, G1.F10, G3.F1, G3.F10), co-incubated with L. monocytogenes ATCC7644. Table S4: Relative weight assigned to physicochemical, microbial and functional parameters, and calculated weighted scores for traditional kefir using grains (G5) and double-fermentation kefir products (G3.F1, G3.F10, G1.F1, G1.F10).

Author Contributions

Conceptualization, R.R.G. and M.A.G.; methodology, R.R.G., A.I., S.S. and P.M.; investigation, R.R.G., P.M. and M.A.G.; writing—original draft preparation, R.R.G.; writing—review and editing, R.R.G., P.M. and M.A.G.; visualization, R.R.G. and P.M. All authors have read and agreed to the published version of the manuscript.

Funding

This research was funded by resources available at Cathedra of Microbiology, Faculty of Exact Sciences, Universidad Nacional de La Plata (UNLP), Argentina. Project number X853.

Institutional Review Board Statement

Sensory evaluation study involved kefir, a GRAS (Generally Recognized As Safe) traditional food. The protocol, designed as a quality assessment similar to standard industry practices, did not involve vulnerable populations, deceptive techniques, or novel substances. Therefore, in accordance with institutional guidelines for low-risk studies, formal ethics committee approval was not required.

Informed Consent Statement

Appropriate protocols were put in place to protect the rights and privacy of all participants during the execution, e.g., no coercion to participate, full disclosure of the study’s requirements and risks, and verbal consent of participants.

Data Availability Statement

The original contributions presented in this study are included in this article. Further inquiries should be directed to the corresponding author.

Acknowledgments

The authors are grateful to Graciela De Antoni for providing us the kefir grains. R.R.G., P.M., S.S. and M.A.G. are members of the Research Career of the Consejo Nacional de Investigaciones Científicas y Técnicas (CONICET), A.I. is a Master student at UNLP.

Conflicts of Interest

The authors declare no conflicts of interest.

Abbreviations

G1: starter produced with 1% w/v kefir grains inoculated in fresh whole cow milk.
G3: starter produced with 3% w/v kefir grains inoculated in fresh whole cow milk.
G5 (traditional kefir): kefir beverage produced with 5% w/v kefir grains inoculated in fresh whole cow milk.
G3.F1: one type of double-fermentation kefir generated when starters originating from 3% w/v grain fermentations were inoculated at 1% v/v into fresh milk.
G3.F10: one type of double-fermentation kefir generated when starters originating from 3% w/v grain fermentations were inoculated at 10% v/v into fresh milk.
G1.F1: one type of double-fermentation kefir generated when starters originating from 1% w/v grain fermentations were inoculated at 1% v/v into fresh milk.
G1.F10: one type of double-fermentation kefir generated when starters originating from 1% w/v grain fermentations were inoculated at 10% v/v into fresh milk.
CFU: colony forming unit
CFS: cell free supernatants
FTIR: Fourier Transform Infrared spectroscopy

References

  1. Rosa, D.D.; Dias, M.M.S.; Grześkowiak, Ł.M.; Reis, S.A.; Conceição, L.L.; Peluzio, M.D.C.G. Milk kefir: Nutritional, microbiological and health benefits. Nutr. Res. Rev. 2017, 30, 82–96. [Google Scholar] [CrossRef] [PubMed]
  2. Prado, M.R.; Blandón, L.M.; Vandenberghe, L.P.; Rodrigues, C.; Castro, G.R.; Thomaz-Soccol, V.; Soccol, C.R. Milk kefir: Composition, microbial cultures, biological activities, and related products. Front. Microbiol. 2015, 6, 1177. [Google Scholar] [CrossRef] [PubMed] [PubMed Central]
  3. Ganatsios, V.; Nigam, P.; Plessas, S.; Terpou, A. Kefir as a Functional Beverage Gaining Momentum towards Its Health Promoting Attributes. Beverages 2021, 7, 48. [Google Scholar] [CrossRef]
  4. Şanlier, N.; Gökcen, B.B.; Sezgin, A.C. Health benefits of fermented foods. Crit. Rev. Food Sci. Nutr. 2019, 59, 506–527. [Google Scholar] [CrossRef] [PubMed]
  5. Stroher, J.A.; Oliveira, W.d.C.; de Freitas, A.S.; Salazar, M.M.; da Silva, L.d.F.F.; Bresciani, L.; Flôres, S.H.; Malheiros, P.d.S. A Global Review of Geographical Diversity of Kefir Microbiome. Fermentation 2025, 11, 150. [Google Scholar] [CrossRef]
  6. Gamba, R.R.; Caro, C.A.; Martínez, O.L.; Moretti, A.F.; Giannuzzi, L.; De Antoni, G.L.; Peláez, A.L. Antifungal effect of kefir fermented milk and shelf-life improvement of corn arepas. Int. J. Food Microbiol. 2016, 235, 85–92. [Google Scholar] [CrossRef]
  7. Garofalo, C.; Ferrocino, I.; Reale, A.; Sabbatini, R.; Milanović, V.; Alkić-Subašić, M.; Boscaino, F.; Aquilanti, L.; Pasquini, M.; Trombetta, M.F.; et al. Study of kefir drinks produced by backslopping method using kefir grains from Bosnia and Herzegovina: Microbial dynamics and volatilome profile. Food Res. Int. 2020, 137, 109369. [Google Scholar] [CrossRef] [PubMed]
  8. Kim, D.H.; Jeong, D.; Song, K.Y.; Seo, K.H. Comparison of traditional and backslopping methods for kefir fermentation based on physicochemical and microbiological characteristics. LWT 2018, 97, 503–507. [Google Scholar] [CrossRef]
  9. Korsak, N.; Taminiau, B.; Leclercq, M.; Nezer, C.; Crevecoeur, S.; Ferauche, C.; Detry, E.; Delcenserie, V.; Daube, G. Short communication: Evaluation of the microbiota of kefir samples using metagenetic analysis targeting the 16S and 26S ribosomal DNA fragments. J. Dairy Sci. 2015, 98, 3684–3689. [Google Scholar] [CrossRef]
  10. Elgarhy, M.R.; Omar, M.M.; Abou Ayana, I.A.A.; Khalifa, S.A. Kefir Production From Cow’s And Buffalo’s Milk Under Egyptian Conditions. Zagazig J. Agric. Res. 2018, 45, 227–238. [Google Scholar] [CrossRef]
  11. Kim, D.H.; Jeong, D.; Kim, H.; Seo, K.H. Modern perspectives on the health benefits of kefir in next-generation sequencing era: Improvement of the host gut microbiota. Crit. Rev. Food Sci. Nutr. 2019, 59, 1782–1793. [Google Scholar] [CrossRef]
  12. Solanki, K.K.; Ghosh, B.C.; Kumawat, A. Shelf-life study of fortified sweetened milk kefir during storage. Pharma Innov. J. 2023, 12, 2514–2521. [Google Scholar]
  13. Özcan, T.; Sahin, S.; Akpinar-Bayizit, A.; Yilmaz-Ersan, L. Assessment of antioxidant capacity by method comparison and amino acid characterisation in buffalo milk kefir. Int. J. Dairy Technol. 2019, 72, 65–73. [Google Scholar] [CrossRef]
  14. González-Orozco, B.D.; Kosmerl, E.; Jiménez-Flores, R.; Alvarez, V.B. Enhanced probiotic potential of Lactobacillus kefiranofaciens OSU-BDGOA1 through co-culture with Kluyveromyces marxianus bdgo-ym6. Front. Microbiol. 2023, 14, 1236634. [Google Scholar] [CrossRef] [PubMed]
  15. Plessas, S.; Nouska, C.; Mantzourani, I.; Kourkoutas, Y.; Alexopoulos, A.; Bezirtzoglou, E. Microbiological Exploration of Different Types of Kefir Grains. Fermentation 2017, 3, 1. [Google Scholar] [CrossRef]
  16. Savastano, M.L.; Pati, S.; Bevilacqua, A.; Corbo, M.R.; Rizzuti, A.; Pischetsrieder, M.; Losito, I. Influence of the production technology on kefir characteristics: Evaluation of microbiological aspects and profiling of phosphopeptides by LC-ESIQTOF-MS/MS. Food Res. Int. 2020, 129, 108853. [Google Scholar] [CrossRef] [PubMed]
  17. Tamang, J.P.; Lama, S. Probiotic properties of yeasts in traditional fermented foods and beverages. J. Appl. Microbiol. 2022, 132, 3533–3542. [Google Scholar] [CrossRef]
  18. Laureys, D.; Leroy, F.; Vandamme, P.; De Vuyst, L. Backslopping Time, Rinsing of the Grains During Backslopping, and Incubation Temperature Influence the Water Kefir Fermentation Process. Front. Microbiol. 2022, 13, 871550. [Google Scholar] [CrossRef]
  19. Wang, X.; Zhang, X.; Wang, Y.; Tang, N.; Xiao, L.; Tian, J.; Rui, X.; Li, W. Yeast cell wall polysaccharides in Tibetan kefir grains are key substances promoting the formation of bacterial biofilm. Carbohydr. Polym. 2023, 300, 120247. [Google Scholar] [CrossRef]
  20. Garrote, G.L.; Abraham, A.G.; De Antoni, G.L. Chemical and microbiological characterisation of kefir grains. J. Dairy Res. 2001, 68, 639–652. [Google Scholar] [CrossRef]
  21. Gamba, R.R.; Yamamoto, S.; Abdel-Hamid, M.; Sasaki, T.; Michihata, T.; Koyanagi, T.; Enomoto, T. Chemical, Microbiological, and Functional Characterization of Kefir Produced from Cow’s Milk and Soy Milk. Int. J. Microbiol. 2020, 2020, 7019286. [Google Scholar] [CrossRef] [PubMed] [PubMed Central]
  22. Lu, Y.; Ma, Y.; Feng, Z.-M.; Yu, F.-J.; Liu, C.-Y.; Yi, Y.-S. Bicinchoninic Acid Method for Determination of Protein Content in Milk. Food Sci. 2010, 31, 151–154. [Google Scholar] [CrossRef]
  23. Başkan, K.S.; Tütem, E.; Akyüz, E.; Özen, S.; Apak, R. Spectrophotometric total reducing sugars assay based on cupric reduction. Talanta 2016, 147, 162–168. [Google Scholar] [CrossRef] [PubMed]
  24. Magalhães, K.T.; Pereira, M.G.V.; Dias, D.R.; Schwan, R.F. Microbial communities and chemical changes during fermentation of sugary Brazilian kefir. World J. Microbiol. Biotechnol. 2010, 26, 1241–1250. [Google Scholar] [CrossRef] [PubMed]
  25. Kubota, H.; Senda, S.; Nomura, N.; Tokuda, H.; Uchiyama, H. Biofilm formation by lactic acid bacteria and resistance to environmental stress. J. Biosci. Bioeng. 2008, 106, 381–386. [Google Scholar] [CrossRef]
  26. Vázquez, M.B.; Curia, A.; Hough, G. Sensory descriptive analysis, sensory acceptability and expectation studies on biscuits with reduced added salt and increased fiber. J. Sens. Stud. 2009, 24, 498–511. [Google Scholar] [CrossRef]
  27. ISO Standard No.6658; Sensory Analysis—Methodology—General Guidance. International Organization for Standardization:: Geneva, Switzerland, 2017.
  28. ISO Standard No. 8589; Sensory Analysis—General Guidance for the Design of Test Rooms. International Organization for Standardization: Geneva, Switzerland, 2007.
  29. ISO Standard No. 22935-2:2009; Milk and Milk Products—Sensory Analysis. ISO: Geneva, Switzerland, 2009.
  30. Moretti, A.F.; Gamba, R.R.; Costa, M.; De Antoni, G.; Peláez, Á.L. Protective Effect of Lyophilization on Fermentative, Microbiological and Sensory Properties of Kefir. Int. J. Biochem. Pharmacol. 2019, 1, 5–11. [Google Scholar] [CrossRef]
  31. Hough, G. Course: Sensory Food Assessment Workshop; CIDCA, Centro de Investigación en Criotecnología de Alimentos, Food Sensory Evaluation Department, Instituto Superior Experimental de Tecnología Alimentaria (ISETA): Nueve de Julio, Argentina, 2006; p. 108. [Google Scholar]
  32. FAO (Food and Agriculture Organization of the United Nations). Codex Standard for Fermented Milk, 2nd ed.; FAO: Rome, Italy, 2003; Volume 243. [Google Scholar]
  33. Código Alimentario Argentino (CAA). Capítulo VIII: Leche, Productos Lácteos y Derivados Grasos, Artículo 553 (Límites de Acidez). Ministerio de Agricultura, Ganadería y Pesca de la Nación, 2023. Available online: https://alimentosargentinos.magyp.gob.ar/contenido/marco/CAA/Capitulo_08.htm (accessed on 1 August 2025).
  34. Gul, O.; Mortas, M.; Atalar, I.; Dervisoglu, M.; Kahyaoglu, T. Manufacture and characterization of kefir made from cow and buffalo milk, using kefir grain and starter culture. J. Dairy Sci. 2015, 98, 1517–1525. [Google Scholar] [CrossRef]
  35. Grønnevik, H.; Falstad, M.; Narvhus, J.A. Microbiological and chemical properties of Norwegian kefir during storage. Int. Dairy J. 2011, 21, 601–606. [Google Scholar] [CrossRef]
  36. Alves, E.; Ntungwe, E.N.; Gregório, J.; Rodrigues, L.M.; Pereira-Leite, C.; Caleja, C.; Pereira, E.; Barros, L.; Aguilar-Vilas, M.V.; Rosado, C.; et al. Characterization of Kefir Produced in Household Conditions: Physicochemical and Nutritional Profile, and Storage Stability. Foods 2021, 10, 1057. [Google Scholar] [CrossRef]
  37. Nicolaou, N.; Xu, Y.; Goodacre, R. Fourier transform infrared spectroscopy and multivariate analysis for the detection and quantification of different milk species. J. Dairy Sci. 2010, 93, 5651–5660. [Google Scholar] [CrossRef]
  38. Ruas-Madiedo, P. Moreno, F.J., Sanz, L.M., Eds.; Biosynthesis and bioactivity of exopolysaccharides produced by probiotic bacteria. In Food Oligosaccharides; Wiley: Hoboken, NJ, USA, 2014; pp. 118–133. [Google Scholar] [CrossRef]
  39. Wang, J.; Zhao, X.; Tian, Z.; He, C.; Yang, Y.; Yang, Z. Characterization of Biofilm Formation by Lactobacillus plantarum WCFS1 and Its Influence on the Growth of Escherichia coli and Salmonella Typhimurium. LWT Food Sci. Technol. 2021, 136, 110331. [Google Scholar] [CrossRef]
  40. Han, X.; Yang, Z.; Jing, X.; Yu, P.; Zhang, Y.; Yi, H.; Zhang, L. Enhancement of Biofilm Formation and Antioxidant Activity of Lactobacillus plantarum Strains by Co-Culture with Yeast. Food Res. Int. 2018, 102, 559–564. [Google Scholar] [CrossRef]
  41. Piermaria, J.A.; Pinotti, A.; García, M.A.; Abraham, A.G. Films Based on Kefiran, an Exopolysaccharide Obtained from Kefir Grain: Development and Characterization. Food Hydrocoll. 2009, 23, 684–690. [Google Scholar] [CrossRef]
  42. Barukčić, I.; Gracin, L.; Režek Jambrak, A.; Božanić, R. Comparison of chemical, rheological and sensory properties of kefir produced by kefir grains and commercial kefir starter. Mljekarstvo 2017, 67, 169–176. [Google Scholar] [CrossRef]
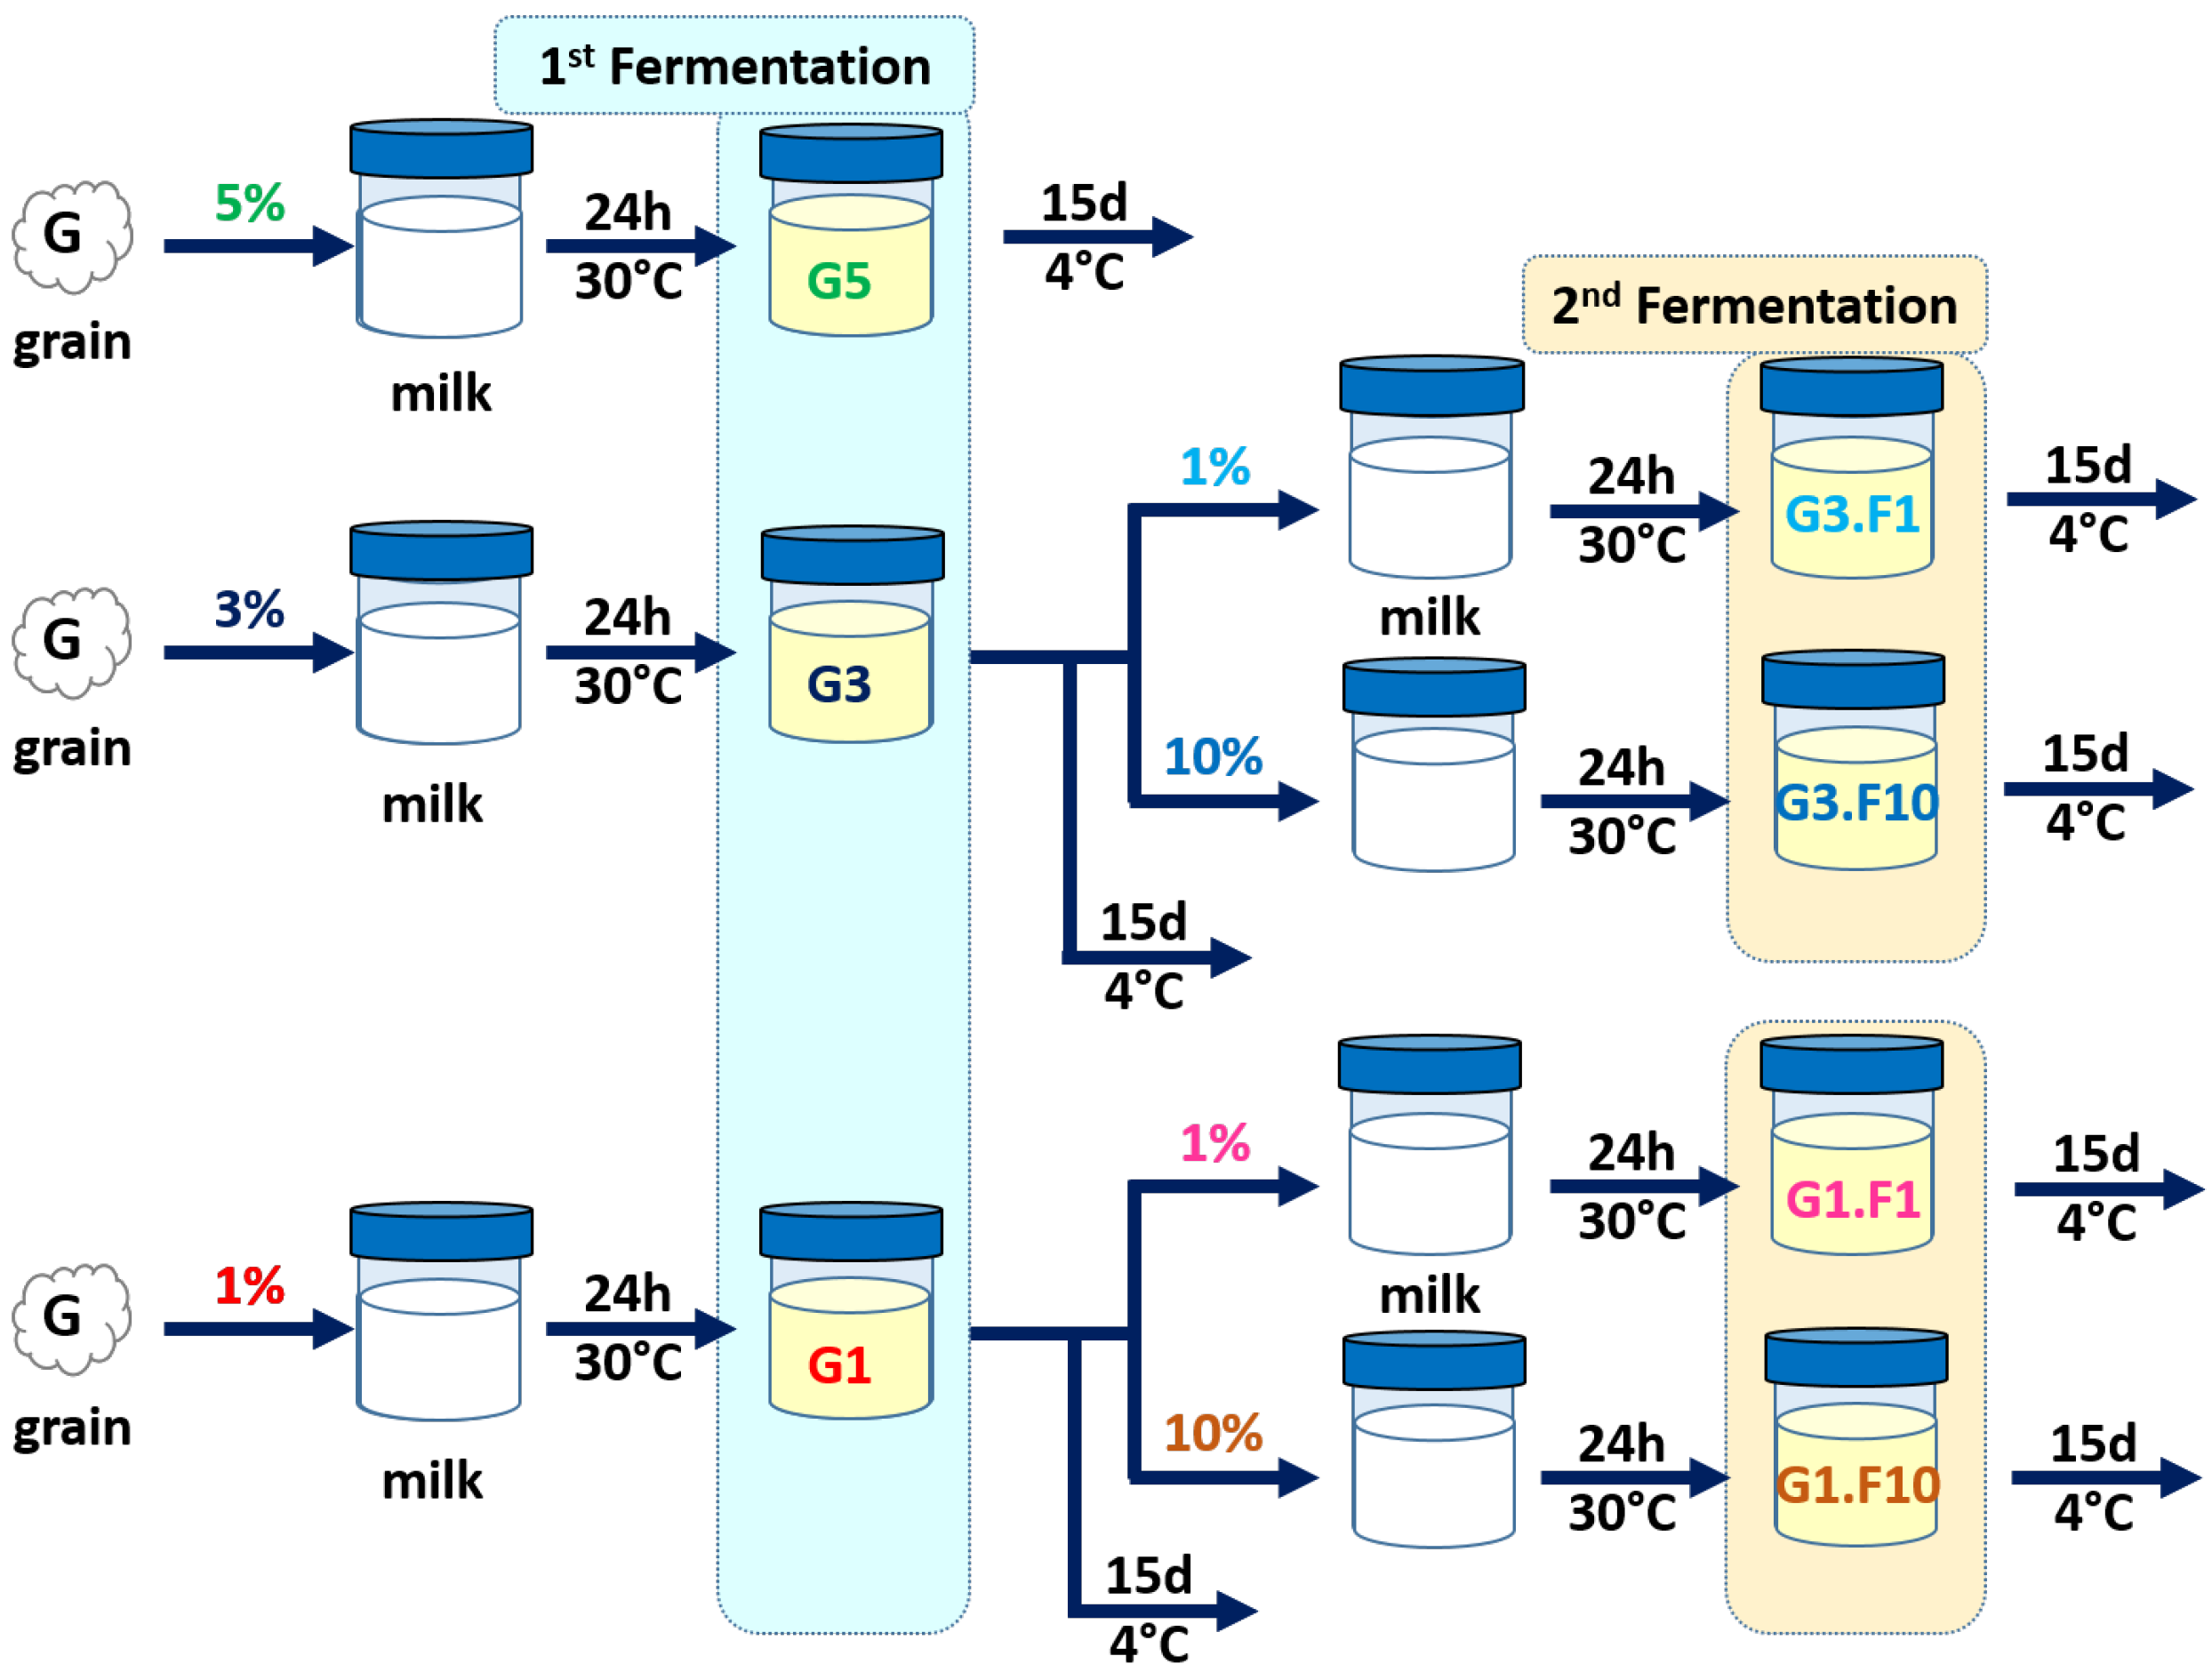
Figure 1. Schematic representation of the obtaining of the different kefir products used in the present study: traditional kefir using grains (G5) and double-fermentation kefir products (G3.F1, G3.F10, G1.F1, and G1.F10).
Fermentation 11 00584 g001
Figure 2. ATR-FTIR spectra of fresh milk, traditional kefir using grains (G5) and double-fermentation kefir products (G1.F1; G1.F10; G3.F1 and G3.F10) in the range 1820–850 cm−1. The spectra are shown superimposed (a) to highlight the differences in band intensity, and ‘stacked’ (b) to highlight the differences in band positions.
Fermentation 11 00584 g002
Figure 3. Viable counts of Escherichia coli 125/99 (a), Salmonella enterica serovar Enteritidis 101 (b), and Listeria monocytogenes ATCC 7644 (c) on nutrient agar after co-incubation with traditional kefir (G5) or double-fermentation kefir products (G1.F1, G1.F10, G3.F1, G3.F10). The milk control corresponds to pathogens grown in unfermented cow’s milk. The gray dashed line indicates the initial inoculum of each pathogen, while the red dashed line represents a 3-log decrease relative to the initial inoculum.
Fermentation 11 00584 g003
Figure 4. Functional properties of traditional kefir using grains (G5) and double-fermentation kefir products (G1.F1; G1.F10; G3.F1 and G3.F10), in post-fermentation time (a) and after 15 days at 4 °C (b). Biofilm: biofilm production capability (expressed as OD600nm). MIC: minimum concentration of kefir CFS (in % v/v) able to inhibit the growth of pathogens Salmonella Enteritidis strain 101 (MIC-SE), Escherichia coli strain 125/99 (MIC-EC) or Listeria monocytogenes ATCC7644 (MIC-LM); or to reduce yeast Candida albicans ATCC MYA-2876 counts below 7 log UFC/mL (MC7log-CA). Loss of pathogen (coculture): reduction in bacterial counts (in Δlog CFU/mL) when pathogens Salmonella Enteritidis (loss of SE), Escherichia coli (loss of EC) or Listeria monocytogenes (loss of LM) were co-incubated in milk with 5% w/v kefir grains (G5) or with 1 or 10% v/v of first fermentation products G1 or G3. The scales for each variable are presented on each axis, the more external the value the better kefir performance.
Fermentation 11 00584 g004
Figure 5. Physicochemical parameters (pH; total titratable acidity TTA; Brix degrees) and viable counts of main microbial groups (Yeast; Lactic Acid Bacteria LAB; Acetic Acid Bacteria AAB), in traditional kefir using grains (G5) and double-fermentation kefir products (G1.F1; G1.F10; G3.F1 and G3.F10), in post-fermentation time (a) and after 15 days at 4 °C (b). The scales for each variable are presented on each axis, the more external the value the better kefir performance.
Fermentation 11 00584 g005
Table 1. pH, °Brix, titratable acidity (TTA), and sugar remnants in traditional kefir using grains (G5) and double-fermentation kefir products (G3.F1, G3.F10, G1.F1, G1.F10).
Kefir ProductsTime (Days)pH°BrixTTA (%) 1Sugar Remnants (%)
G506.76 ± 0.06 ****12.2 ± 0.1 ***0.15 ± 0.01 ***** 2100.0 ± 1.6 **
14.43 ± 0.03 ***6.2 ± 0.1 *0.87 ± 0.06 *55.7 ± 1.4 *
84.31 ± 0.01 **6.2 ± 0.1 *0.95 ± 0.00 **53.3 ± 25.8 *
154.32 ± 0.01 **6.3 ± 0.1 *0.96 ± 0.01 **54.5 ± 10.7 *
G3.F106.74 ± 0.04 ****12.1 ± 0.2 ****0.15 ± 0.01 ***** 2100.0 ± 1.6 **
14.50 ± 0.04 ***6.4 ± 0.1 *0.83 ± 0.05 *59.7 ± 1.3 *
84.30 ± 0.02 **6.9 ± 0.1 **0.94 ± 0.01 **63.2 ± 6.9 *
154.27 ± 0.01 **7.0 ± 0.1 **0.93 ± 0.02 **70.3 ± 7.1 *
G3.F1006.75 ± 0.06 ****12.2 ± 0.1 ****0.15 ± 0.01 ***** 2100.0 ± 1.6 **
14.19 ± 0.04 **6.7 ± 0.1 **0.87 ± 0.02 *52.0 ± 23.3 *
83.90 ± 0.03 *6.6 ± 0.1 **1.02 ± 0.00 **51.8 ± 14.0 *
153.88 ± 0.03 *6.8 ± 0.1 **1.09 ± 0.01 ***52.8 ± 12.4 *
G1.F106.74 ± 0.05 ****12.2 ± 0.1 ****0.15 ± 0.01 ***** 2100.0 ± 1.6 **
14.43 ± 0.01 ***6.6 ± 0.1 **0.85 ± 0.05 *60.5 ±1 3.0 *
84.26 ± 0.03 **6.9 ± 0.1 **0.91 ± 0.01 **60.6 ± 6.4 *
154.21 ± 0.01 **7.1 ± 0.1 **0.95 ± 0.00 **58.5 ± 6.0 *
G1.F1006.76 ± 0.06 ****12.2 ± 0.2 ****0.15 ± 0.01 ***** 2100.0 ± 1.6 **
14.12 ± 0.03 **6.6 ± 0.1 **1.00 ± 0.05 **55.0 ± 14.5 *
83.94 ± 0.03 *6.6 ± 0.2 **1.09 ± 0.01 ***56.5 ± 21.2 *
153.87 ± 0.04 *6.8 ± 0.2 **1.21 ± 0.01 ****65.9 ± 10.5 *
1 Minimum acidity required for kefir is 0.6% [32]. 2 Acceptable acidity range for milk is 0.14–0.18% [33]. Time 0 corresponds to unfermented milk. Time 1 corresponds to the product after 24 h of fermentation at 30 °C. Times 8 and 15 correspond to the product after 8 or 15 days of storage at 4 °C, respectively. Different number of asterisks in rows indicate that the values are significantly different (p < 0.05).
Table 2. Viable counts [log(CFU/mL)] of lactic acid bacteria (LAB), yeast and acetic acid bacteria (AAB) in traditional kefir using grains (G5) and double-fermentation kefir products (G3.F1, G3.F10, G1.F1, G1.F10), in the post-fermentation time (day 1) and after 8 and 15 days of storage at 4 °C.
Kefir ProductsTime
(Days)
LAB 1Yeasts 2AAB
G518.21 ± 0.10 *7.16 ± 0.02 ***7.44 ± 0.06 *
88.11 ± 0.01 *5.98 ± 0.10 **7.44 ± 0.30 *
158.10 ± 0.10 *5.48 ± 0.00 *7.48 ± 0.00 *
G3.F119.04 ± 0.14 **5.86 ± 0.15 **7.76 ± 0.03 *
89.15 ± 0.17 **5.54 ± 0.18 **7.63 ± 0.04 *
158.60 ± 0.16 *4.95 ± 0.00 *8.35 ± 0.38 **
G3.F1019.31 ± 0.06 ***5.70 ± 0.19 **7.24 ± 0.09 *
89.11 ± 0.19 **5.94 ± 0.05 **7.35 ± 0.21 *
158.24 ± 0.55 *5.70 ± 0.06 **7.60 ± 0.24 *
G1.F1
19.04 ± 0.08 **5.18 ± 0.49 *7.74 ± 0.06 *
89.10 ± 0.02 **5.35 ± 0.07 *7.65 ± 0.07 *
158.40 ± 0.12 *4.92 ± 0.09 *7.60 ± 0.00 *
G1.F10
19.15 ± 0.05 **5.94 ± 0.09 **7.40 ± 0.26 *
89.01 ± 0.08 **5.65 ± 0.07 **7.57 ± 0.11 *
158.80 ± 0.23 **5.24 ± 0.09 *7.10 ± 0.12 *
1 Minimum LAB level of 7 log CFU/mL required for kefir according Codex [32]. 2 Minimum yeast level of 4 log CFU/mL required for kefir according Codex [32]. Different number of asterisks in the row indicate that the values are significantly different (p < 0.05).
Table 3. Biofilm biomass (measured by absorbance at 600 nm) of traditional kefir using grains (G5) and double-fermentation kefir products (G1.F1, G1.F10, G3.F1, G3.F10) in the post-fermentation time (day 1) and after 8 and 15 days of storage at 4 °C. Mean absorbance is shown (n = 3).
Kefir ProductsTime (Days)A600nm
G510.30 ± 0.12 *
80.44 ± 0.11 *
150.48 ± 0.06 *
G3.F110.21 ± 0.11 *
80.50 ± 0.18 *
150.69 ± 0.15 **
G3.F1010.19 ± 0.10 *
80.36 ± 0.18 *
150.51 ± 0.17 *
G1.F110.22 ± 0.10 *
80.72 ± 0.32 **
151.25 ± 0.20 ***
G1.F1010.35 ± 0.15 *
80.47 ± 0.15 *
150.78 ± 0.14 **
Different number of asterisks in the row indicate that the values are significantly different (p < 0.05).
Disclaimer/Publisher’s Note: The statements, opinions and data contained in all publications are solely those of the individual author(s) and contributor(s) and not of MDPI and/or the editor(s). MDPI and/or the editor(s) disclaim responsibility for any injury to people or property resulting from any ideas, methods, instructions or products referred to in the content.