Article

Boosting Probiotic Biomass of Lactobacillus acidophilus CCFM137 Through pH-Stat Morphological Control and Medium Optimization

1
State Key Laboratory of Food Science and Resources, Jiangnan University, 1800 Lihu Road, Wuxi 214122, China
2
School of Food Science and Technology, Jiangnan University, 1800 Lihu Road, Wuxi 214122, China
3
Food Biotechnology Institute of Jiangnan University, 89 Dingxing Road, Yangzhou 225004, China
4
National Engineering Research Center for Functional Food, Jiangnan University, 1800 Lihu Road, Wuxi 214122, China
*
Author to whom correspondence should be addressed.
Fermentation 2025, 11(10), 564; https://doi.org/10.3390/fermentation11100564
Submission received: 29 August 2025 / Revised: 25 September 2025 / Accepted: 28 September 2025 / Published: 30 September 2025
(This article belongs to the Section Probiotic Strains and Fermentation)

Abstract

The fermentation performance of Lactobacillus acidophilus is constrained by factors such as low cell density and fastidious nutritional and environmental requirements, which greatly limit its industrial-scale applications. This study aimed to develop an efficient fermentation condition for L. acidophilus CCFM137 through systematic optimization of both culture medium and environmental parameters, thereby enabling high-yield industrial-scale production of this strain. An optimized medium was developed, consisting of glucose (30 g/L), YEP FM503 (35 g/L), sodium acetate (5 g/L), ammonium citrate (2 g/L), K2HPO4 (2 g/L), MgSO4·7H2O (0.1 g/L), MnSO4·H2O (0.05 g/L), L-cysteine hydrochloride (0.5 g/L), and Tween 80 (1 mL/L), to achieve a viable cell count of 1.95 × 10⁹ CFU/mL, representing a 9.42-fold increase over that of standard MRS broth. Subsequent pH-stat fermentation trials in a 100 L fermenter using the optimized medium revealed morphological and growth characteristics of the strain in variable pH-stat environments. Optimal performance was observed under pH-stat 4.5 rather than the more commonly used 5.7, achieving maximum viable cell counts of 3.37 × 10⁹ CFU/mL, accompanied by a transformation of cell morphology toward shorter rod-shaped structures, as well as an increase in substrate utilization rate, cell recovery rate and lyophilization survival rate. The fermentation performance and cellular morphology of L. acidophilus CCFM137 were enhanced by both nutrient composition and pH environment. These results showed that this strategy has potential for application in high cell density fermentation of L. acidophilus CCFM137.

1. Introduction

Lactobacillus acidophilus is a well-known probiotic bacterium that predominantly colonizes the human colon [1]. Upon reaching adequate population levels, it exerts multiple health-promoting effects, including enhancement of intestinal homeostasis [2], modulation of immune responses [3], inhibition of carcinogenesis [4], alleviation of lactose intolerance [5], and mitigation of allergic reactions [6] and obesity [7]. Owing to these functional properties, L. acidophilus has been widely applied in the food, pharmaceutical, and other industrial sectors [8]. However, the industrial production of L. acidophilus is constrained by its fastidious growth requirements, including specific nutritional and environmental conditions [9]. Consequently, the development of efficient culture strategies to support its growth has become an important objective in probiotic research [10].
In microbial cultivation, the carbon source serves as a fundamental energy substrate for cellular growth and metabolism, playing an important role in enabling efficient fermentation processes [11]. Selecting an appropriate carbon source for L. acidophilus not only enhances fermentation performance but also improves cost effectiveness [10]. Although carbohydrates such as glucose [12], lactose [13], and fructose [14] have been shown to positively influence the growth and acid production of L. acidophilus, it remains unclear which carbon source is most suitable for its rapid growth. Therefore, one of the primary objectives of this study was to identify and evaluate an optimal carbon source to support the efficient and upscaling of fermentation of L. acidophilus.
It is well established that L. acidophilus exhibits fastidious nutritional requirements, largely due to its limited proteolytic capacity, which complicates its cultivation [15]. For example, Qiao et al. [16] reported that compounds such as alanine, glutamic acid, glutamine, guanine, nicotinic acid, thiamine, and manganese enhanced the growth of L. acidophilus LA-5 under acidic conditions. Senz et al. [17] evaluated several nitrogen sources for cultivating L. acidophilus NCFM and achieved a viable cell count of 1.02 × 10⁹ CFU/mL using MRS broth with added tryptone No. 3. However, the use of multiple nitrogen sources increases both complexity and cost, rendering such strategies unsuitable for large-scale applications. Therefore, there is a need to select a nutritionally comprehensive and cost-effective nitrogen source to simplify the culture medium formulation while meeting the nutritional requirements for the growth of L. acidophilus.
pH plays a critical regulatory role in the metabolic activity and nutrient utilization patterns of lactic acid bacteria [18], making its control essential for achieving high cell density fermentation of L. acidophilus [19]. For instance, Cui et al. [20] reported that when L. acidophilus CCFM137 was cultured under pH-stat control at pH 7.0, the final viable cell count reached only 3.10 × 10⁸ CFU/mL, whereas Su et al. [10] demonstrated that L. acidophilus IMAU81186 attained a markedly higher concentration of 5.50 × 10⁹ CFU/mL at pH 5.5. Collectively, these findings suggest that lower pH conditions may positively influence the fermentation performance of L. acidophilus. However, the exact optimal pH parameter has not been systematically established, necessitating further investigation to define the culture conditions for maximizing the viable cell count.
Studies have indicated a strong correlation between the fermentation performance of L. acidophilus and its morphological characteristics. Specifically, shorter cell forms have been associated with higher viable cell counts in the fermentation broth [17]. Rhee et al. [21] demonstrated that reducing the environmental pH could significantly shorten the cellular morphology of L. delbrueckii subsp. bulgaricus. However, there are currently few reports on the relationship between pH and the cell morphology and viable cell count of L. acidophilus. Thus, a systematic investigation of the effect of pH on the morphology of L. acidophilus cells is necessary.
In this study, L. acidophilus CCFM137, which is difficult to cultivate in MRS broth, was used as the research subject. The culture medium was initially optimized based on conventional MRS broth, followed by high cell density fermentation in a 100 L fermenter under constant pH conditions to identify the optimal pH environment and derive an effective culture condition for L. acidophilus CCFM137.

2. Materials and Methods

2.1. Bacterial Strain

L. acidophilus CCFM137 was provided by the Culture Collections of Food Microbiology (CCFM) of Jiangnan University (Wuxi, China). The strain was stored as frozen stock cultures at −80 °C in a DW-88L3889 freezer (Qingdao Haier Special Electric Freezer Co., Ltd., Qingdao, China). For activation, the frozen stock culture was thawed at 4 °C, streaked on De Man, Rogosa, Sharpe (MRS) agar plates and incubated in an anaerobic workstation (HYQX-Ill, Shanghai Yuejin Medical Instruments Co., Ltd., Shanghai, China) at 37 °C for 48 h under a gas mixture of 85% N2, 10% H2, and 5% CO2. A pure single colony of L. acidophilus CCFM137 was transferred to MRS broth and cultured at 37 °C for 16 h. Working cultures were prepared by performing two successive pre-cultures, each inoculated at 5% (v/v) into fresh MRS broth and cultured at 37 °C for 12 h.

2.2. Growth Media

MRS broth was prepared according to De Man et al. [22] and used for the cultivation of L. acidophilus CCFM137. The medium contained: 20 g/L glucose, 10 g/L soy peptone, 10 g/L beef extract, 5 g/L yeast extract, 5 g/L sodium acetate, 2 g/L ammonium citrate, 2 g/L K2HPO4, 1 mL/L Tween 80, 0.1 g/L MgSO4·7H2O, and 0.05 g/L MnSO4·H2O. The medium was dissolved in deionized water, and the pH was adjusted to 7.5 ± 0.1 using 2 mol/L NaOH solution with an OHAUS ST3100 digital pH meter (Aux Instrument Co., Ltd., Changzhou, Jiangsu, China) and then autoclaved. All the reagents for the MRS broth were purchased from Sinopharm Chemical Reagent Co. Ltd. (Shanghai, China). The medium was sterilized in an YXQ-LS-70A autoclave (Shanghai Boxun Industrial Co., Ltd., Shanghai, China) at 121 °C for 15 min. For solid culture, MRS agar was prepared by adding 15 g/L agar to the broth before sterilization.

2.3. Species Identification Method

PCR reactions were performed in a T100 thermal cycler (Bio RAD, Hercules, CA, USA) using 27F (5′-AGAGTTTGATCCTGGCTCAG-3′) and 1492R (5′-GGTTACCTTGTTACGACTT-3′) as primers [23]. The preparation of the DNA template involved the following steps: 1 mL of L. acidophilus CCFM137 fermentation broth was transferred into a centrifuge tube and centrifuged at 10,000× g for 2 min in a TG16A-WS centrifuge (Shanghai Lu Xiangyi Centrifuge Instrument Co., Ltd., Shanghai, China), the supernatant was discarded, and 1 mL of sterile water was added; the above steps were repeated. The sample was heated at 95 °C for 10 min after thorough mixing using a MS3DS25 vortex mixer (IKA Werke GmbH and Co., Staufen, Germany) and then centrifuged at 10,000× g for 2 min, and the resulting supernatant was used as the DNA template. The 50 µL PCR reaction system consisted of the following components: 1 µL DNA template, 0.5 µL 27F, 0.5 µL 1492R, 0.5 µL Taq enzyme, 5 µL Taq buffer, 5 µL dNTP, and 37.5 µL double distilled water. The PCR program comprised an initial denaturation step at 94 °C for 10 min, followed by 30 cycles of amplification, with denaturation at 95 °C for 30 s, annealing at 55 °C for 30 s, and extension at 72 °C for 42 s; then, the final steps were full extension at 72 °C for 2 min and cooling at 12 °C for 10 min. DNA sequencing was performed by GENEWIZ, Inc. (Suzhou, China). The resulting DNA sequences were subjected to homology matching using the BLAST tool (version 2.16.0) in the NCBI database (https://www.ncbi.nlm.nih.gov/ (accessed on 29 June 2024)).

2.4. Growth Curve

L. acidophilus CCFM137 working culture was inoculated in MRS broth and optimized medium with 5% (v/v) inoculum amounts, and the optical density at 600 nm (OD600nm) and pH of the broth were measured at two-hour intervals to determine its growth curve. Prior to optical density measurement, fermentation broth was diluted with deionized water to achieve an OD600nm value within the S23A UV spectrophotometer’s (Shanghai Lengguang Technology Co., Ltd., Shanghai, China) linear range (0.2–0.8) to ensure accuracy. The difference in optical density (ΔOD600nm) was calculated by subtracting the initial optical density from the optical density of fermentation broth after fermentation.

2.5. Component Screening and Adjustment of Culture Medium

For the carbon source screening, glucose (20 g/L) in the MRS broth was replaced with one of the following alternative carbon sources, each at a concentration of 20 g/L: lactose, sucrose, maltose, fructose, soluble starch, xylose, or arabinose (Sinopharm Chemical Reagent Co., Ltd., Shanghai, China), while the remaining components of the MRS medium were maintained unchanged. After 12 h of fermentation at 37 °C, the optimal carbon source was selected based on optical density (ΔOD600nm) and viable cell count. The optimal concentration (10–50 g/L) of the selected carbon source was subsequently determined by evaluating its effects on viable cell density and utilization rate.
Following carbon source optimization, the nitrogen component of the MRS broth was substituted with one of the following nitrogen sources, each at a concentration of 25 g/L: soya peptone, fishmeal peptone, yeast extract, beef extract, yeast peptone, tryptone (Sinopharm Chemical Reagent Co., Ltd., Shanghai, China); yeast extract powder (YEP; including FM503, FM985, FM803, and FM860 from Angel Yeast Co., Ltd., Yichang, China); industrial peptone, reagent peptone, F403-1 peptone, or F403-2 peptone (Nantong Donghai Longsheng Biological Products Co., Ltd., Nantong, China). Cultures were incubated for 12 h at 37 °C. The optimal nitrogen source was selected based on optical density (ΔOD600nm) and viable cell count. Its concentration (10–50 g/L) was further optimized by assessing the resulting viable cell count and utilization rate.
Varying amounts of L-cysteine hydrochloride (0–5 g/L) and Tween 80 (0–2 mL/L) were added to the culture medium to improve the fermentation performance of L. acidophilus CCFM137 after adjusting the nitrogen sources.

2.6. Optimization of High Cell Density Fermentation Process

After optimizing the culture medium (30 g/L glucose, 35 g/L YEP FM503, 5 g/L sodium acetate, 2 g/L ammonium citrate, 2 g/L K2HPO4, 1 mL/L Tween 80, 0.5 g/L L-cysteine hydrochloride, 0.1 g/L MgSO4·7H2O, and 0.05 g/L MnSO4·H2O), high cell density fermentation of L. acidophilus CCFM137 was performed in a 100 L pilot-scale fermenter (HSS3000-100L, Huisen Bioengineering Equipment Co., Ltd., Zhenjiang, China). A 5% (v/v) fermentation broth inoculum, prepared using the buffered salt method, was used. The optimized culture medium in the fermentation tank was composed entirely of commercially available food-grade raw materials and did not contain buffer salts that regulate pH, i.e., sodium acetate, ammonium citrate, or K2HPO4. The pH during fermentation was automatically monitored and regulated by the fermentation system, which maintained a constant pH by replenishing a 2 mol/L NaOH solution. Before starting the fermentation process, the fermenter chambers were flushed with sterile nitrogen to create an anaerobic environment. The fermentation process was conducted at a stirring rate of 40 r/min and the temperature was maintained at 37 °C for 10 h.
After fermentation, the broth was centrifuged at 8000× g in a sterile GC105 centrifuge (Shanghai Zhang Quan Centrifuge Technology Co., Ltd., Shanghai, China) to collect the bacterial sludge. The obtained sludge was mixed with a lyoprotectant and stirred moderately using a Eurostar 40 mechanical stirrer (IKA Werke GmbH and Co., Staufen, Germany) to form a homogeneous emulsion. The lyoprotectant, which consisted of reconstituted skim milk (200 g/L), an oligosaccharide solution (inulin 110 g/L, fructooligosaccharide 110 g/L, xylooligosaccharide 110 g/L), and L-cysteine hydrochloride solution (25.5 g/L) [24], was sterilized at 108 °C for 20 min and stored at 4 °C overnight in a vertical refrigerator (SC-320D, Qingdao Haier Special Electric Freezer Co., Ltd., Qingdao, China) before use. The bacterial sludge and three lyoprotectants were homogeneously mixed in a mass ratio of 1:3:3:0.2 in a sterile environment. The emulsion was then lyophilized using an LGJ-100G freeze-dryer (Beijing Sihuan Qihang Technology Co., Ltd., Beijing, China) to obtain a lyophilized powder.

2.7. Viable Cell Count Method

Samples (fermentation broth, emulsion, and lyophilized powder) were serially diluted with 0.85% (w/v) sterile saline. Subsequently, 1 mL of dilution was aseptically transferred to a sterile petri dish, mixed with molten MRS agar (cooled to 40 °C), and allowed to solidify. After incubation in an anaerobic workstation at 37 °C for 48 h, colony-forming units (CFU) were enumerated. The cell recovery rate (R1) after centrifugation was calculated using Equation (1), where A1 and V1 represent the viable cell count (CFU/mL) and total volume of the fermentation broth (mL), respectively, and A2 and V2 denote those of the pre-lyophilized emulsion.
R1 = (A2V2)/(A1V1) × 100%
The survival rate (R2) of the bacterial cells after lyophilization was calculated using Equation (2), where A2 and V2 represent the viable cell count (CFU/mL) and total volume (mL) of the pre-lyophilized emulsion, A3 represents the viable cell count of the lyophilized powder (CFU/g), and M represents the total mass of the lyophilized powder (g).
R2 = (A3M)/(A2V2) × 100%

2.8. Cell Morphology Observation

To observe the cellular morphology of L. acidophilus, Gram staining was performed according to the method described by Rahayu and Setiadi [25] with some modifications. The procedure was as follows: a drop of L. acidophilus fermentation broth was spread evenly on the slide and air-dried. Drops of crystal violet dye were then applied for staining. After 2 min, the excess dye was washed away with water. The stained area was decolorized using 95% (v/v) alcohol, and the slides were immediately rinsed with water to remove excess alcohol. After decolorization, the slide was air-dried, and cedar oil (used as immersion oil for microscopy) was applied onto the corresponding area on the slide. The slides were then observed using a BA210 digital microscope (Motic China Group Co., Ltd., Xiamen, China) with a 10× eyepiece and a 100× objective to observe the cellular morphology of L. acidophilus CCFM137; the cell length in the images was measured using the Fiji-ImageJ graphics tool [26].

2.9. Determination of Amino Acid Nitrogen and Reducing Sugars

Amino acid nitrogen (mol/L) in the medium was determined with the formaldehyde titration method [27]. The quantity of reducing sugars (g/L) in the medium was determined using the 3,5-dinitrosalicylic acid (DNS) method [28]. The substrate utilization rate (R3) in the medium was determined using Equation (3), where C0 represents the initial substrate concentration in the medium and C1 represents the residual substrate concentration in the medium after fermentation.
R3 = (C0C1)/C0 × 100%

2.10. Statistical Analysis

All data represent the mean of three independent experiments and are expressed as mean ± standard deviation (SD). All statistical analyses were performed using SPSS software (version 20; IBM Corp., Armonk, NY, USA). Data were considered statistically significant when p < 0.05.

3. Results and Discussion

3.1. Species Identification

Based on DNA sequence alignment, the culture CCFM137 was identified as L. acidophilus, showing the highest sequence similarity (98.3%) to L. acidophilus C4 (Accession No. CP142373; E-value = 0).

3.2. Growth in MRS Broth

DeMan, Rogosa, Sharpe (MRS) is the standard laboratory medium widely used for the isolation and cultivation of lactic acid bacteria, including L. acidophilus. As illustrated in Figure 1, the change in cell density demonstrated that L. acidophilus CCFM137 was in the latent phase from 0 h to 2 h, in the logarithmic phase between 2 h and 12 h, and entered the stationary phase after 12 h (Figure 1A). The viable cell count at 12 h was 2.07 ± 0.31 × 10⁸ CFU/mL in the MRS broth. Microscopic examination revealed that, upon entering the stable phase, the cell morphology of L. acidophilus CCFM137 in MRS broth predominantly exhibited a long rod or chain-like form. The low viable cell count suggested that this medium is not optimal for high cell density fermentation in large volumes, and the longer cell morphology (10.43 ± 4.42 µm) suggested that L. acidophilus CCFM137 had insufficient cell division (Figure 1B), which could be a factor in the low viable cell count. Some studies have indicated that when nutrients such as vitamins [29] and nucleotides [30] are lacking in the culture medium, Lactobacillus species exhibit abnormal filamentous cell morphology, and these nutrients are often provided by nitrogen sources during fermentation. Therefore, screening and supplying the key raw materials in the medium might represent a crucial step in achieving a short rod-like morphology and high viable cell count.

3.3. Effects of Different Carbon Sources on the Growth of L. acidophilus CCFM137

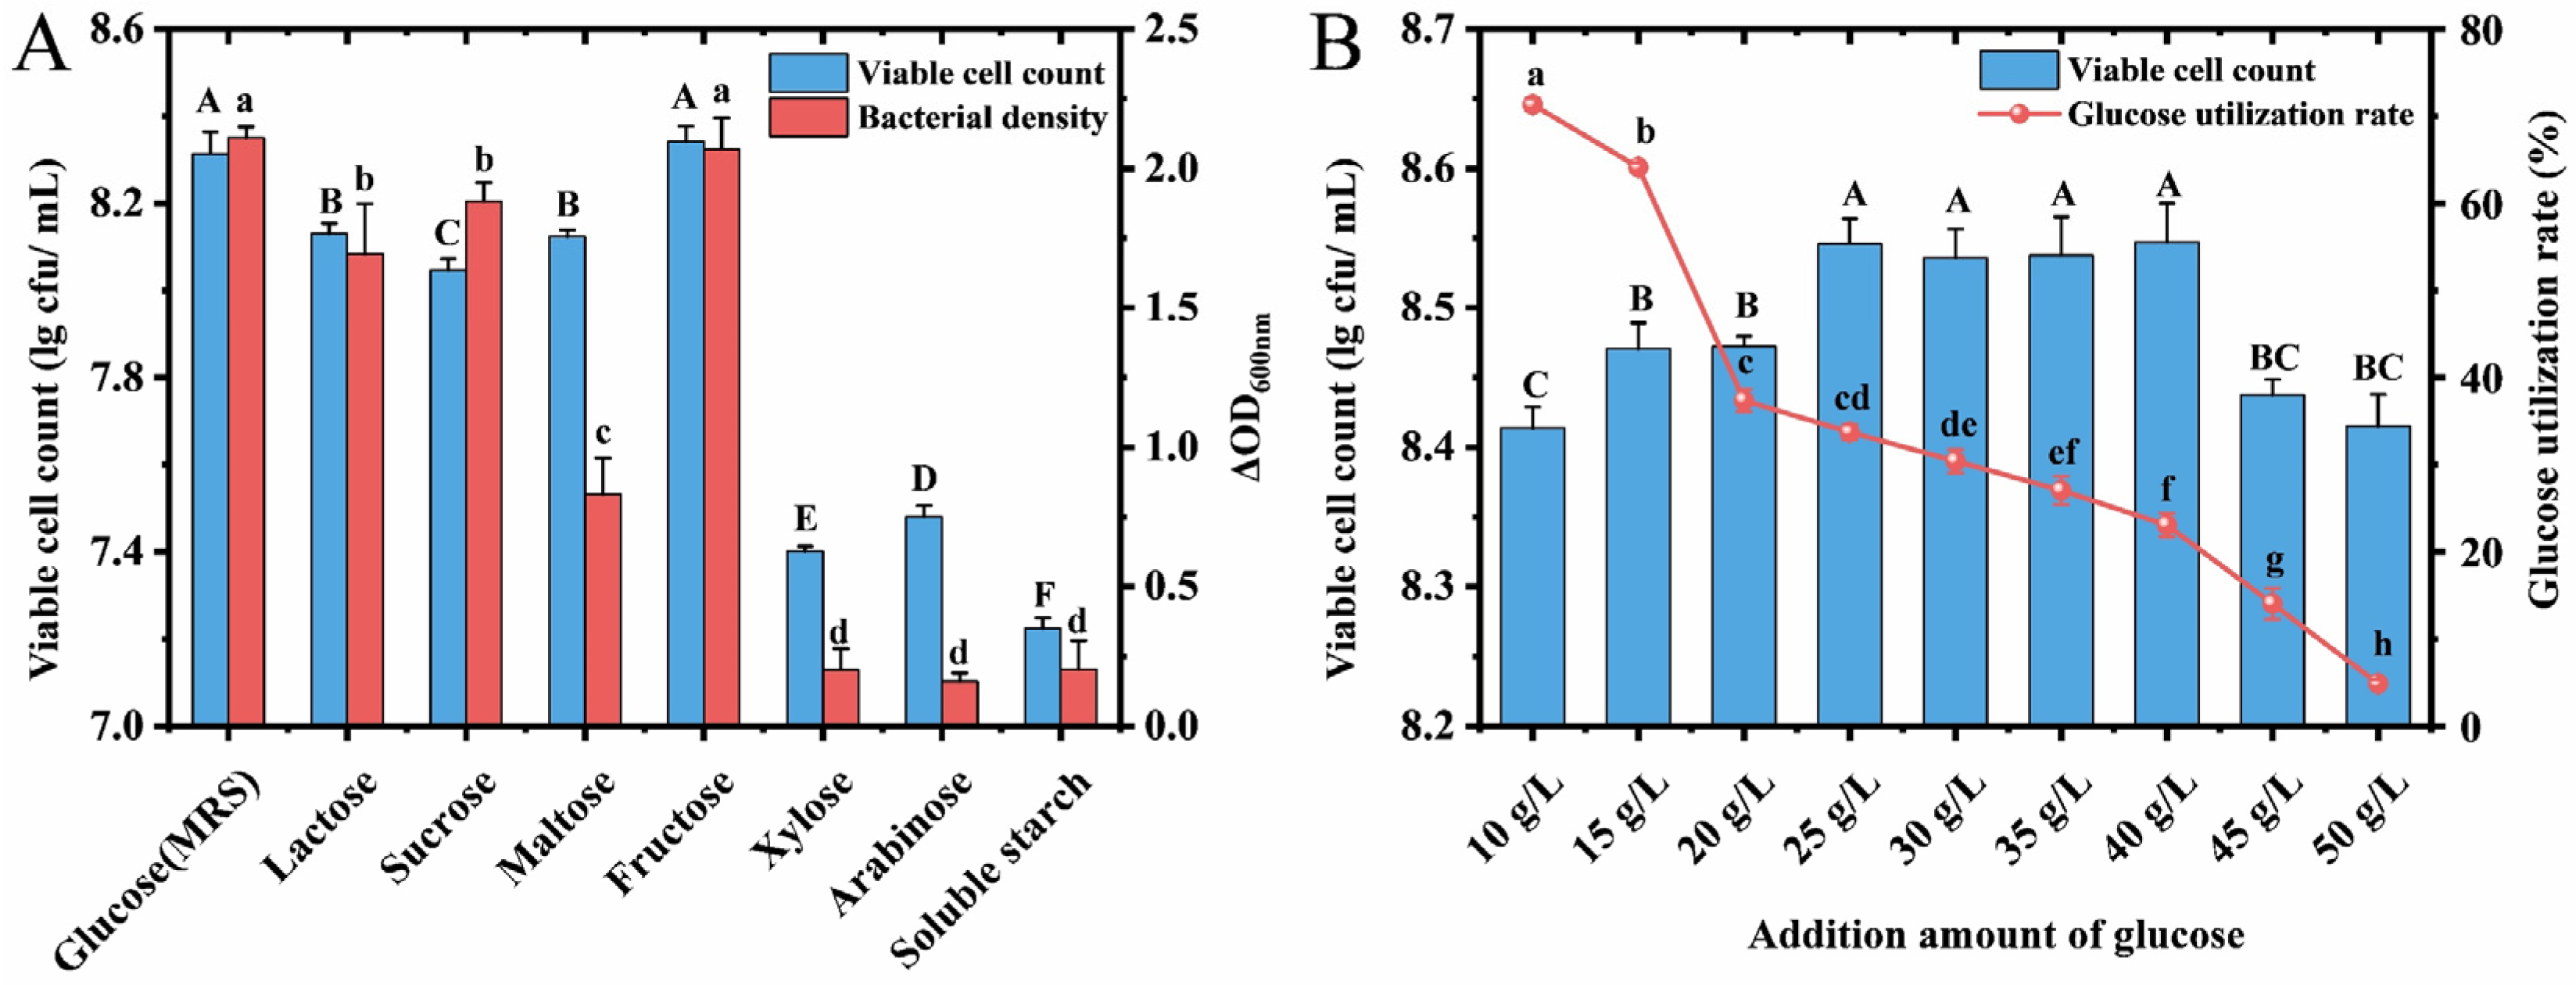
The growth performance of L. acidophilus CCFM137 exhibited notable differences across eight carbon sources (glucose (MRS), lactose, sucrose, maltose, fructose, xylose, arabinose, and soluble starch) (Figure 2A). In terms of viable cell count, fructose demonstrated a growth-promoting effect that was comparable to that of glucose, and the final viable cell count at the end of fermentation was 2.20 ± 0.17 × 10⁸ CFU/mL, with no significant difference observed between the two (p > 0.05). Growth performance was significantly (p < 0.05) reduced on lactose, sucrose, and maltose (1.1–1.4 × 10⁸ CFU/mL). Additionally, the poorest growth of L. acidophilus CCFM137 was observed on xylose, arabinose, and soluble starch, indicating a deficient capacity for the efficient utilization of such carbohydrates. In practice, given that fructose is a more expensive substrate than glucose and that the culture effect was not significantly (p > 0.05) higher than that observed with glucose, glucose was selected as the optimal carbon source for L. acidophilus CCFM137.
The carbon source represents the most fundamental and critical component within culture medium, serving as the primary energy substrate for bacterial growth and metabolic processes. Specifically, glucose has been consistently identified as the preferred carbohydrate source for lactic acid bacteria [22,31]. Goderska et al. [12] observed the superior efficacy of glucose over other carbon sources in cultivating L. acidophilus DSM 20079 and DSM 20242. Karim et al. [14] and Shalini et al. [32] found that fructose was highly effective in promoting the growth and acid production of L. acidophilus. These conclusions are in general agreement with the results of this experiment and may be attributed to the monosaccharide nature of glucose and fructose, which enables them to enter the EMP pathway more efficiently without requiring preprocessing. However, certain studies have demonstrated that lactose [13] and sucrose [33] can also offer certain benefits in the cultivation of lactic acid bacteria. Additionally, despite the reported superior growth-promoting effects of stachyose [10] and whey powder [34] over glucose, their industrial application remains impractical due to cost prohibitions and supply limitations for high cell density fermentation.
The effect of the amount of glucose added on the growth of L. acidophilus CCFM137 is shown in Figure 2B. With regard to the viable cell count, a superior fermentation effect was attained when glucose was introduced at a concentration of 25–40 g/L. However, the utilization of glucose decreased gradually with increasing concentrations, and the number of viable bacteria was significantly reduced when glucose was added at a concentration of ≤20 g/L or ≥45 g/L (p < 0.05). Variations in fermentation performance due to glucose concentration changes arise from two mechanisms. First, insufficient glucose concentrations reduce the metabolic efficiency of lactic acid biosynthesis [35]. Second, excessive concentrations induce elevated osmotic stress, leading to limited cellular growth [36]. Su et al. [10] determined through response surface experiments that the optimal glucose addition amount for L. acidophilus IMAU81186 was 30.18 g/L, which is also within the range of this experiment. Accordingly, in order to avoid an insufficient carbon source at 25 g/L due to continuous optimization, 30 g/L was selected as the optimal amount to be added.

3.4. Effects of Different Nitrogen Sources on the Growth of L. acidophilus CCFM137

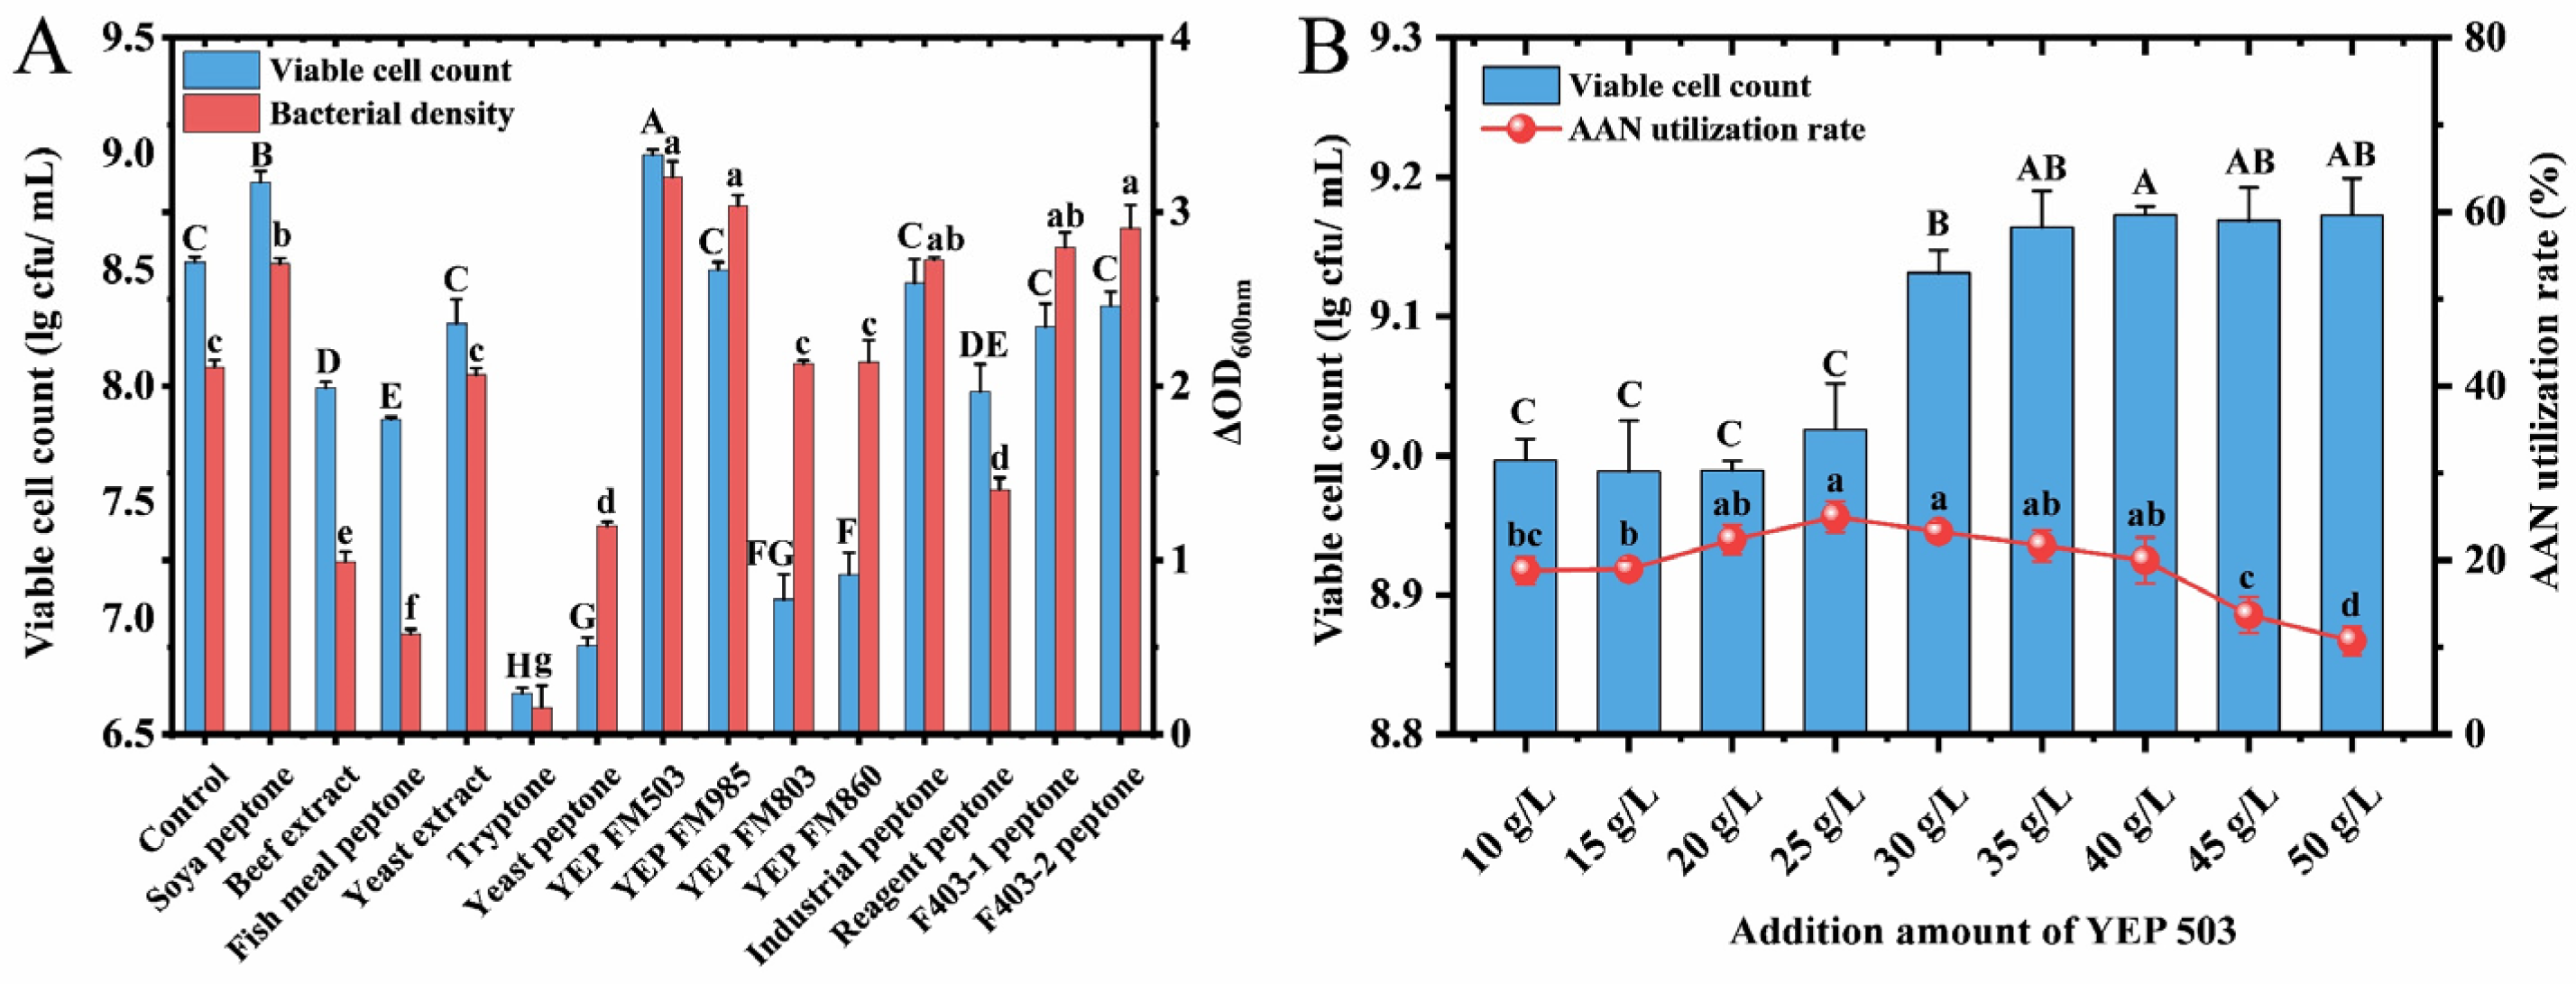
Fourteen kinds of organic nitrogen sources with potential for industrial production were used for the cultivation of L. acidophilus CCFM137, and adjusted MRS (30 g/L glucose) was used as the control group. The results of this experiment are illustrated in Figure 3A. In terms of viable cell count, YEP FM503 demonstrated the most pronounced growth-promoting effect, with a viable cell count of 9.90 ± 0.53 × 10⁸ CFU/mL at the end of fermentation. This value was significantly higher than that of the control group (3.44 ± 0.16 × 10⁸ CFU/mL) and on other nitrogen sources (p < 0.05). Furthermore, the number of viable cells when soybean peptone was used as the nitrogen source was 7.60 ± 0.78 × 10⁸ CFU/mL, which is slightly lower than that of YEP FM503. However, the final viable cell count was only in the range of 1–3 × 10⁸ CFU/mL when yeast extract, YEP FM985, industrial peptone, peptone F403-1, or peptone F403-2 were used as the nitrogen sources. Moreover, the viable cell counts for beef extract, fish meal peptones, YEP FM803, YEP FM860, and reagent peptone as nitrogen sources were all below 1 × 10⁸ CFU/mL, and the viable cell count for tryptone and yeast peptone as nitrogen sources were below 1 × 10⁷ CFU/mL. In conclusion, YEP FM503 was identified as the optimal nitrogen source for L. acidophilus CCFM137. Figure 3B illustrates the effect of varying quantities of YEP FM503 on the proliferation of L. acidophilus CCFM137. The highest number of viable cells was observed when the quantity of the additive ranged from 30 g/L to 50 g/L, with no statistically significant difference (p > 0.05) in these groups. However, to ensure an adequate raw material and prevent waste of raw materials in high density fermentation, the optimal addition of FM503 was selected as 35 g/L.
Different nitrogen sources exhibit distinct effects on promoting the growth of L. acidophilus CCFM137. Chen et al. [34] found that YEP was more effective than casein hydrolysate, peptone, and fish meal in culturing L. acidophilus. This phenomenon can be attributed to the greater diversity of nutrients and higher abundance of readily absorbable low-molecular-weight peptides in yeast extract compared to non-fortified peptone [37,38]. These nutrients provide a spectrum of growth-critical constituents for L. acidophilus, including proteins, peptides, free amino acids, nucleotides, and vitamins [15,16]. The provision of these nutrients circumvents de novo synthesis requirements for key metabolites, thereby accelerating L. acidophilus proliferation.

3.5. Effect of L-Cysteine Hydrochloride and Tween 80 on the Growth of L. acidophilus CCFM137

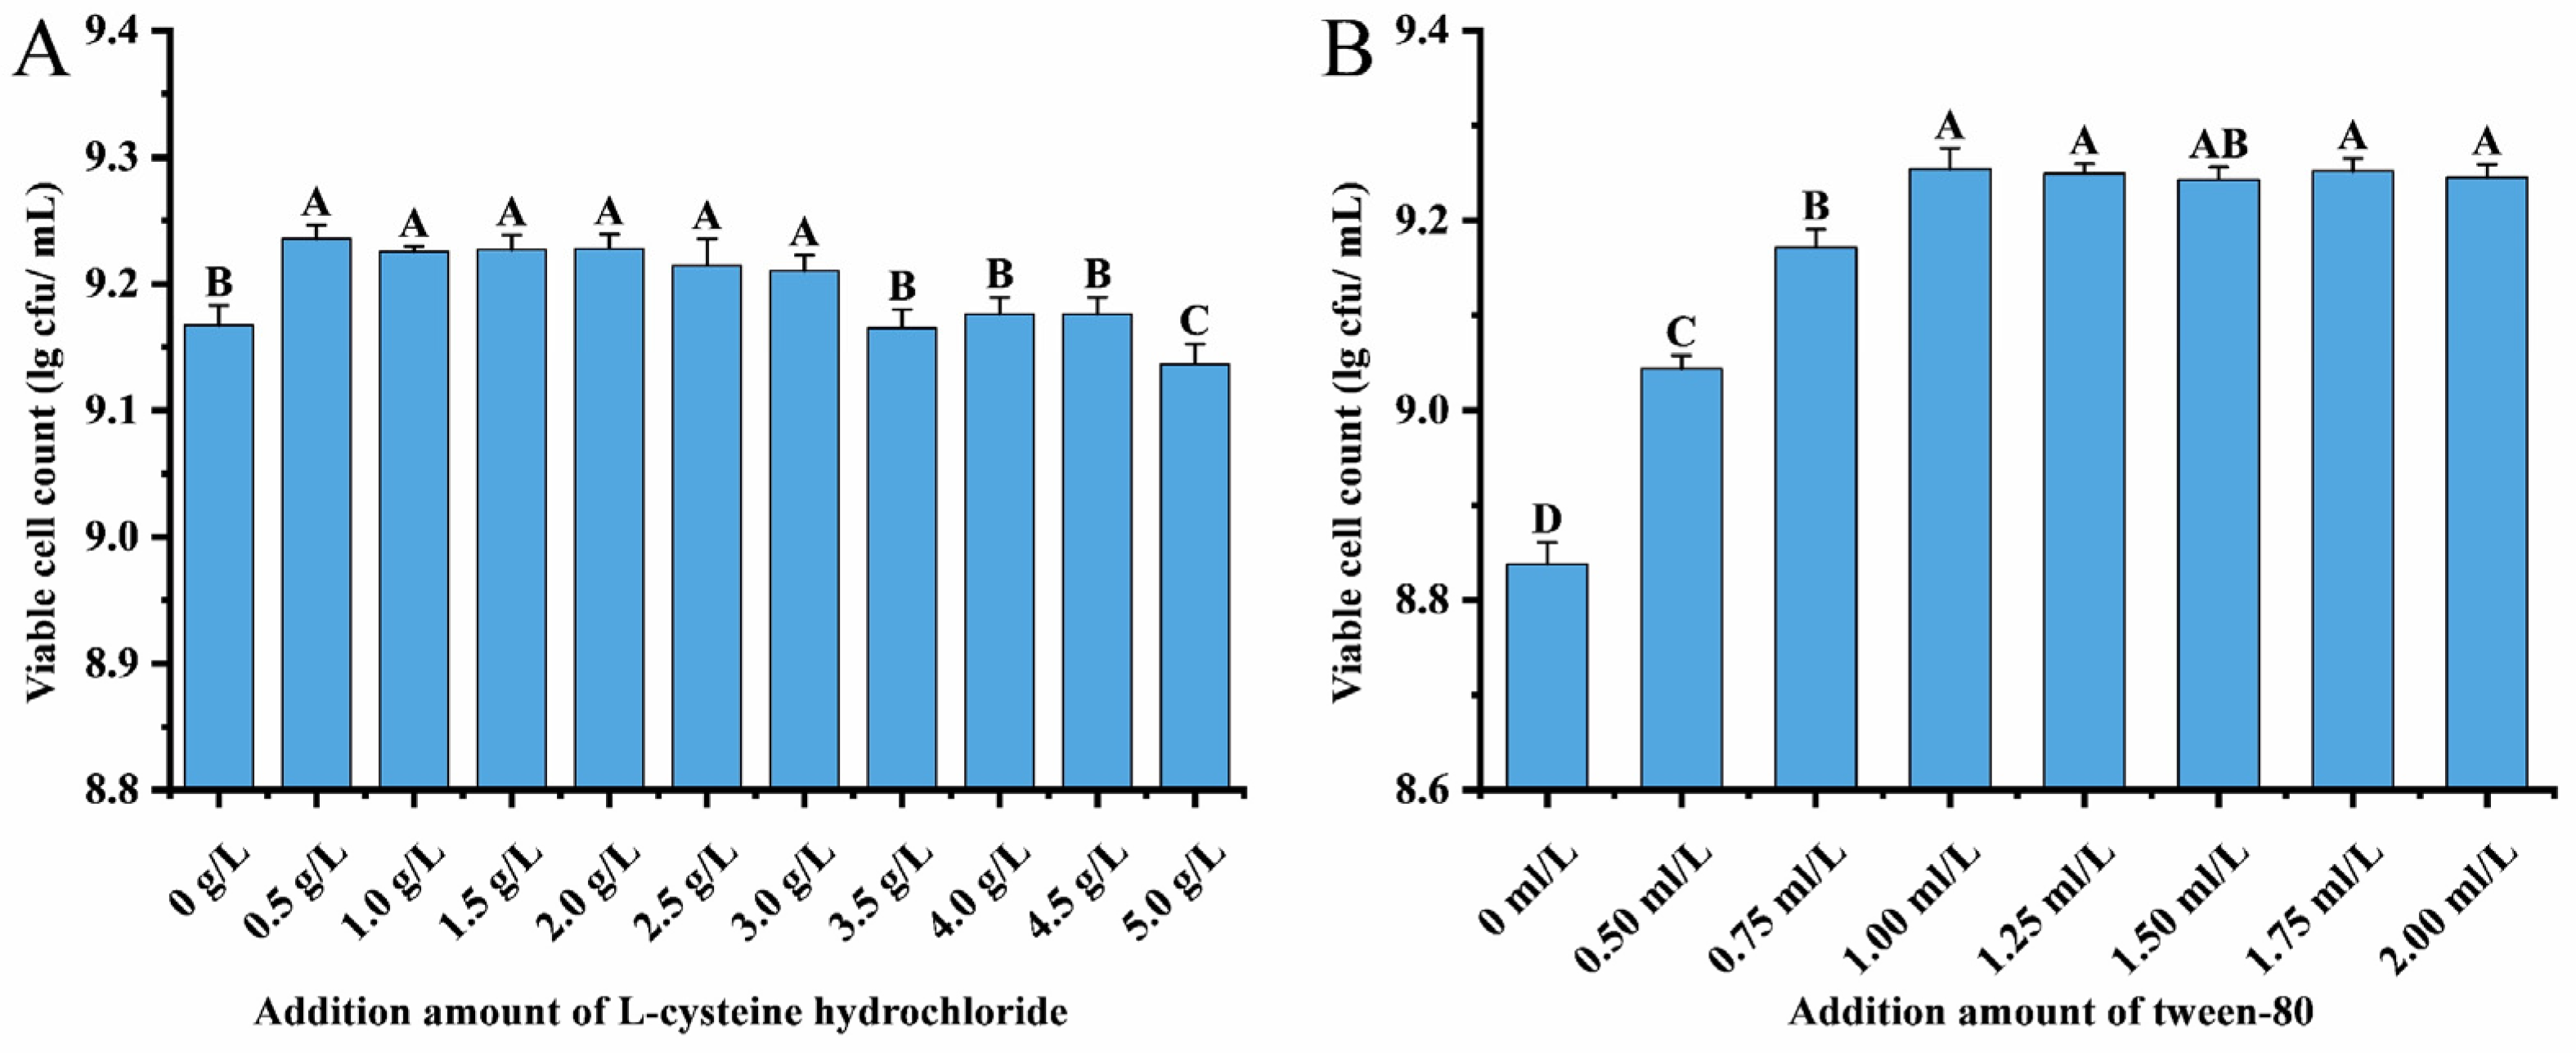
Figure 4A demonstrates the effect of L-cysteine hydrochloride on the growth of L. acidophilus CCFM137, with the viable cell count reaching its highest point when the concentration of L-cysteine hydrochloride was between 0.5 and 3.0 g/L. Consequently, 0.5 g/L L-cysteine hydrochloride was effective enough to promote growth. As demonstrated in Figure 4B, the incorporation of Tween 80 exhibited a substantial impact on the proliferation of L. acidophilus CCFM137. However, this effect was not significant when the added quantity exceeded 1.0 mL/L. Consequently, the addition of 1.0 mL/L of Tween 80 was the most effective amount for promoting growth.
Previous research showed that the addition of L-cysteine to bacterial culture media enhanced its cellular antioxidant capacity and accelerated carbon source metabolism, thereby promoting the growth of lactic acid bacteria [39,40]. Dave et al. [41] reported that the incorporation of 500 mg of L-cysteine hydrochloride resulted in a significant enhancement of the survival rate of L. acidophilus within yogurt environments. The unsaturated fatty acids present in Tween substances are vital for the growth of most lactic acid bacteria [42,43] and are frequently incorporated into lactic acid bacteria culture medium as a source of unsaturated fatty acids and emulsifiers. Liu et al. [44] demonstrated that Tween 80 significantly increases the biomass and exopolysaccharide (EPS) yield of L. acidophilus ATCC during high cell density fermentation. However, our experimental results revealed that the growth-promoting effect of these two nutrients was more limited, and only low levels of addition are required to fulfil the growth requirements of L. acidophilus CCFM137.

3.6. Effects of Optimized Medium on Growth Properties and Cell Morphology

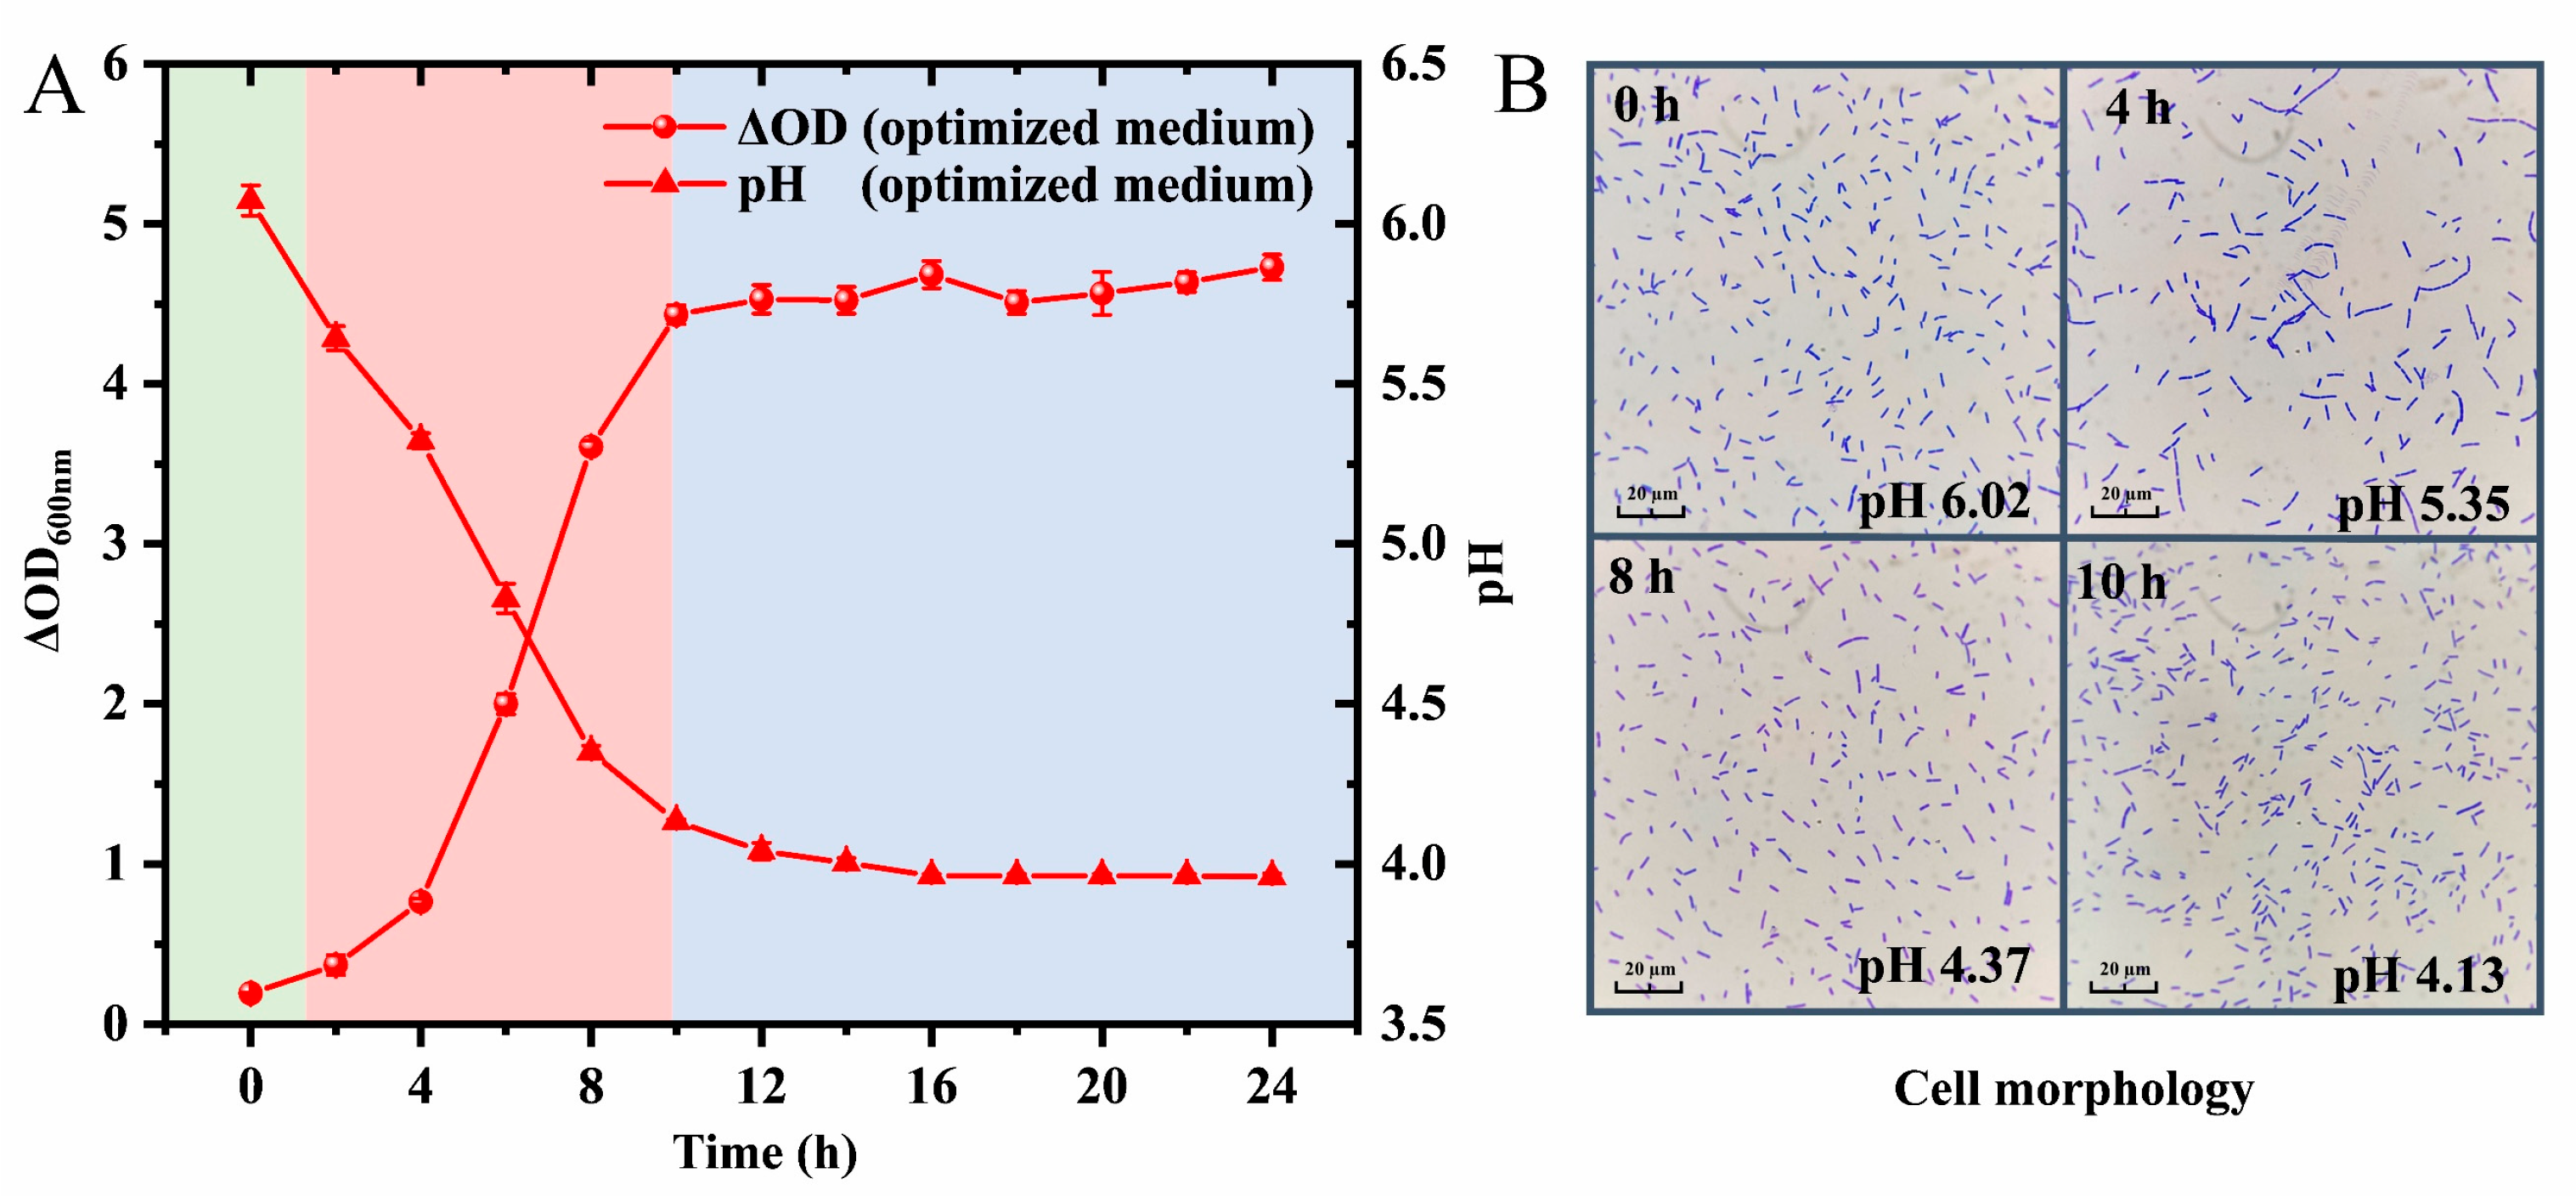
Based on the results of the above experiments, the composition of the optimized medium was derived as 30 g/L glucose, 35 g/L YEP FM503, 5 g/L sodium acetate, 2 g/L ammonium citrate, 2 g/L K2HPO4, 1 mL/L Tween 80, 0.5 g/L L-cysteine hydrochloride, 0.1 g/L MgSO4·7H2O, and 0.05 g/L MnSO4·H2O, with the initial pH adjusted to 7.5 before autoclaving. L. acidophilus CCFM137 was cultivated in multiple serial passages at 37 °C, with an inoculum volume of 5% (v/v). The results indicated that the viable cell count of L. acidophilus CCFM137 in the optimized medium reached 1.95 ± 0.17 × 10⁹ CFU/mL, which was 9.42 times greater than that observed in MRS broth. The utilization rate of the carbon source reached 58.56 ± 1.36%, the utilization rate of amino acid nitrogen was 21.28 ± 0.93%, the rate of pH decrease was faster (Figure 5A), and the length of the cells was shorter (2.76 ± 0.55 µm) (Figure 5B). From the perspective of viable cell count and cell morphology, L. acidophilus CCFM137 exhibited superior fermentation performance in the optimized medium compared to MRS broth, thereby fulfilling the prerequisites for high cell density fermentation.

3.7. Effect of Different pH-Stat Environments on Fermentation Performance

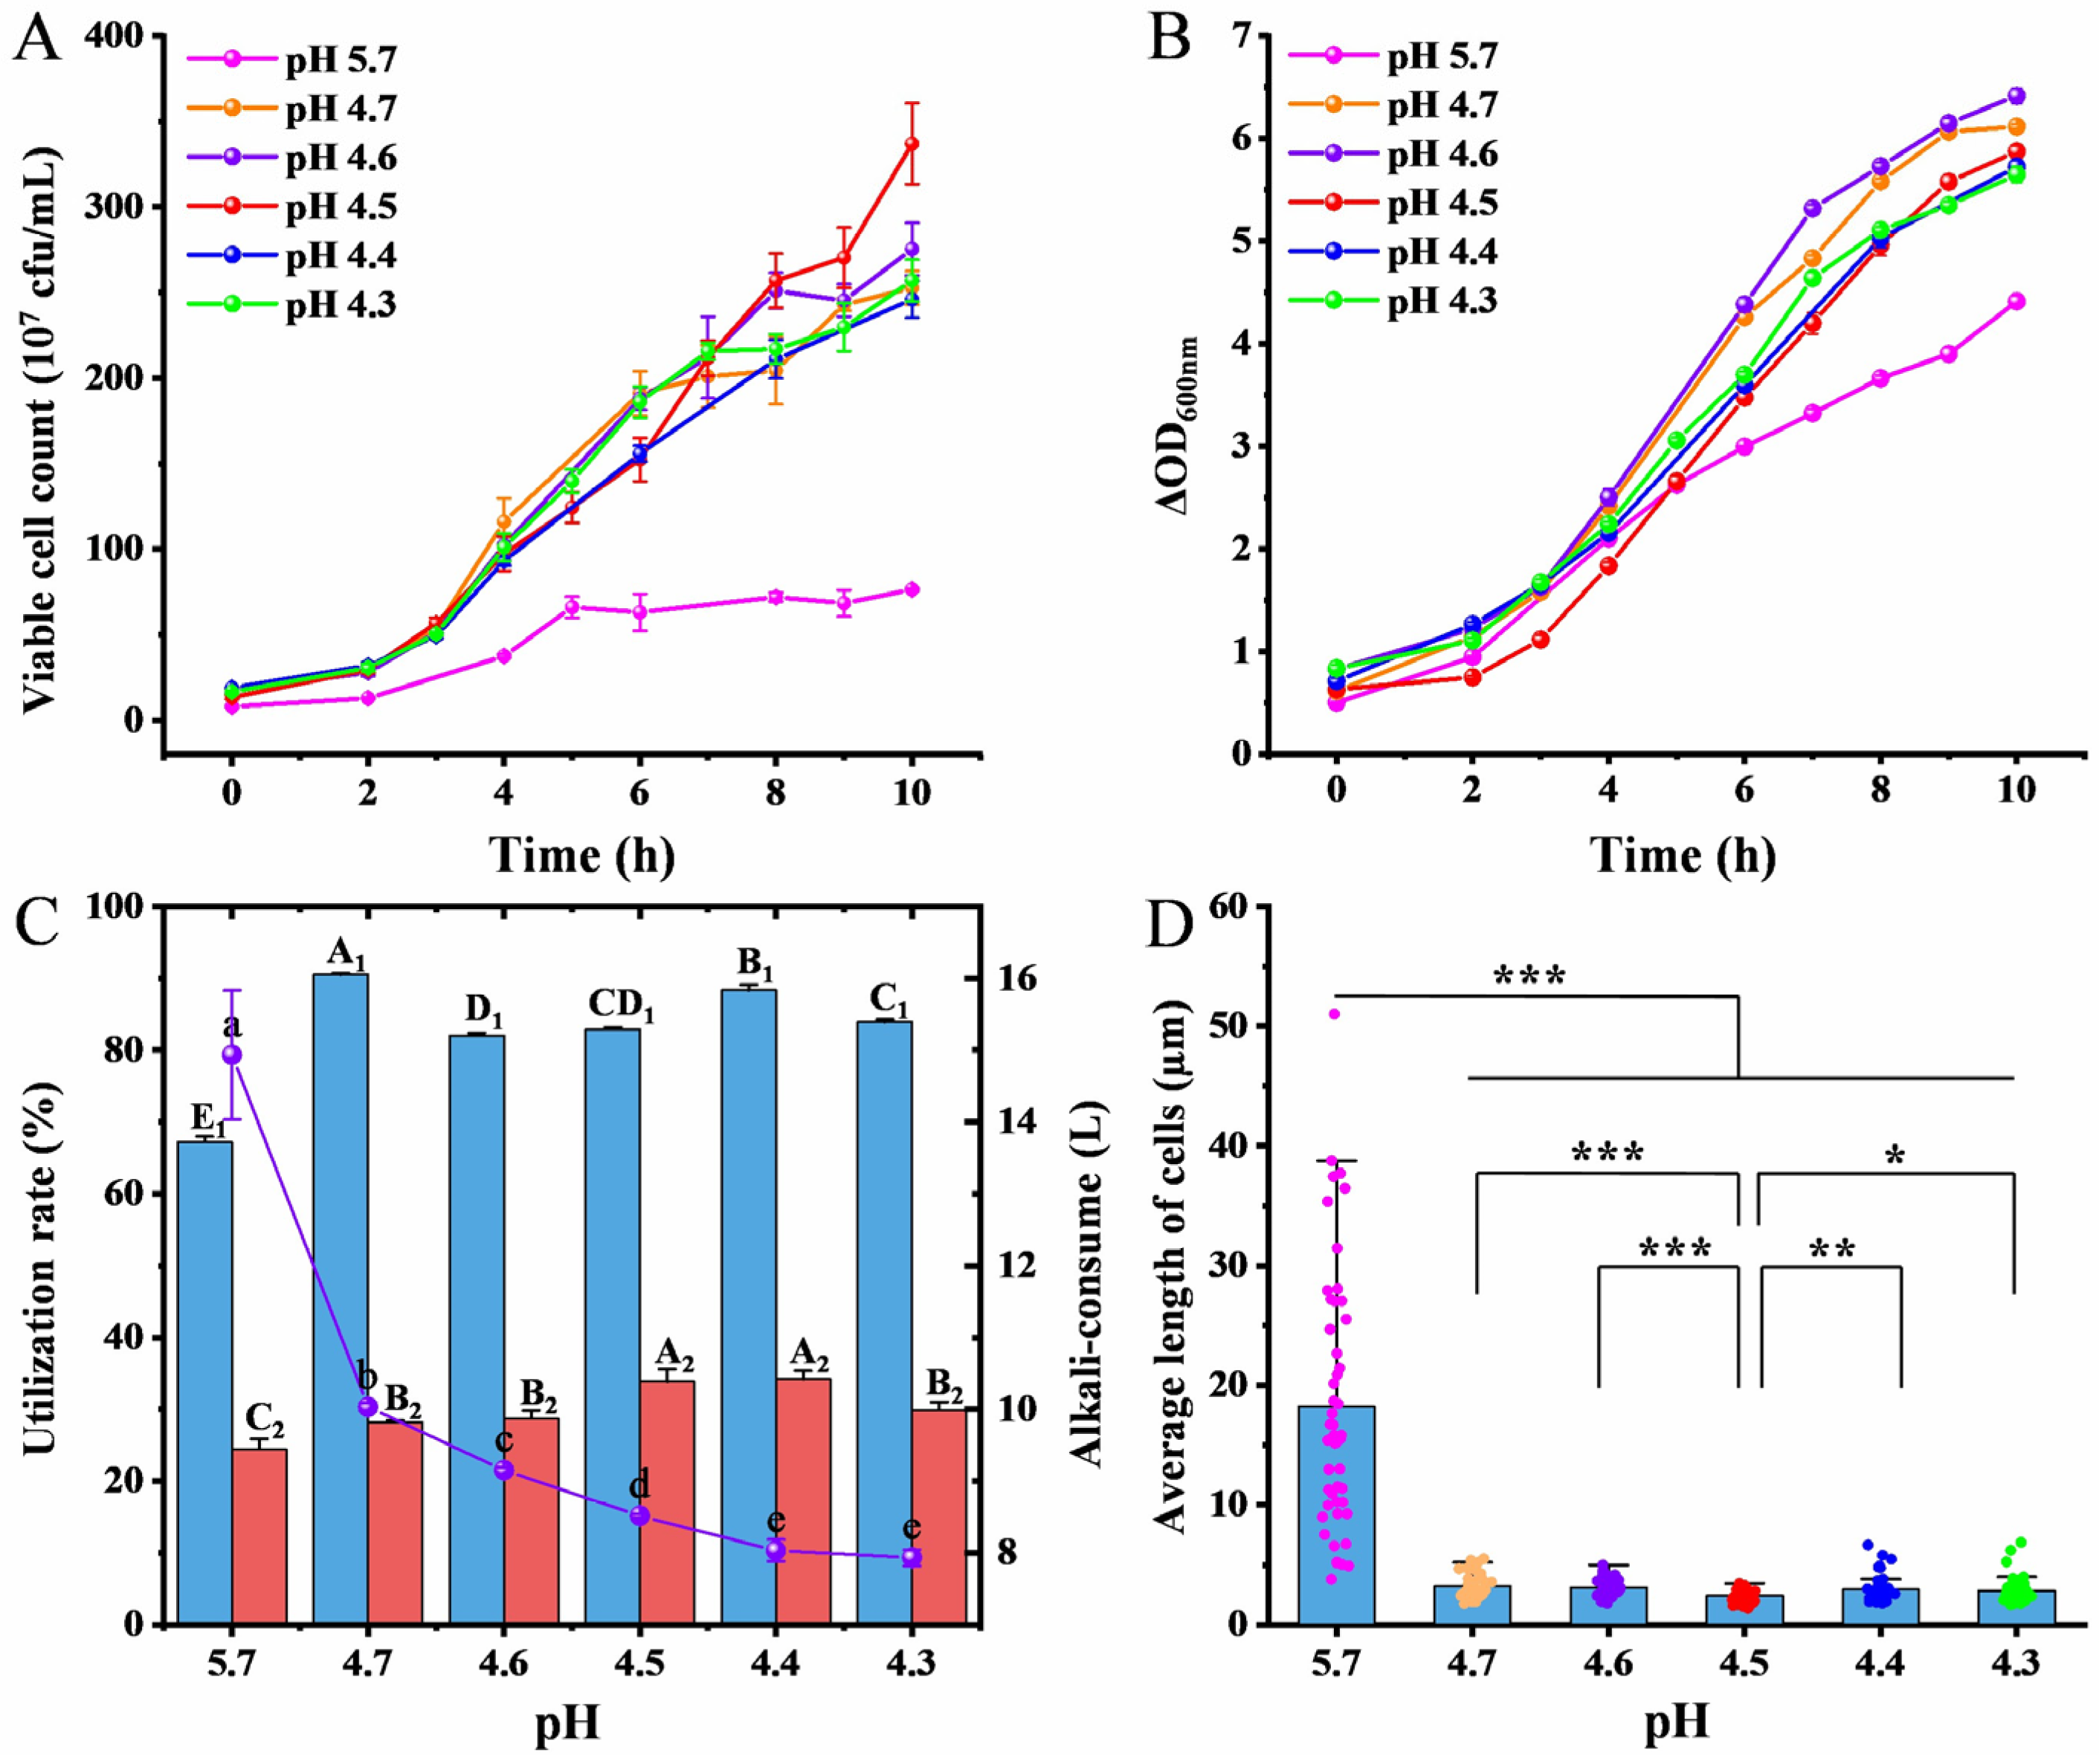
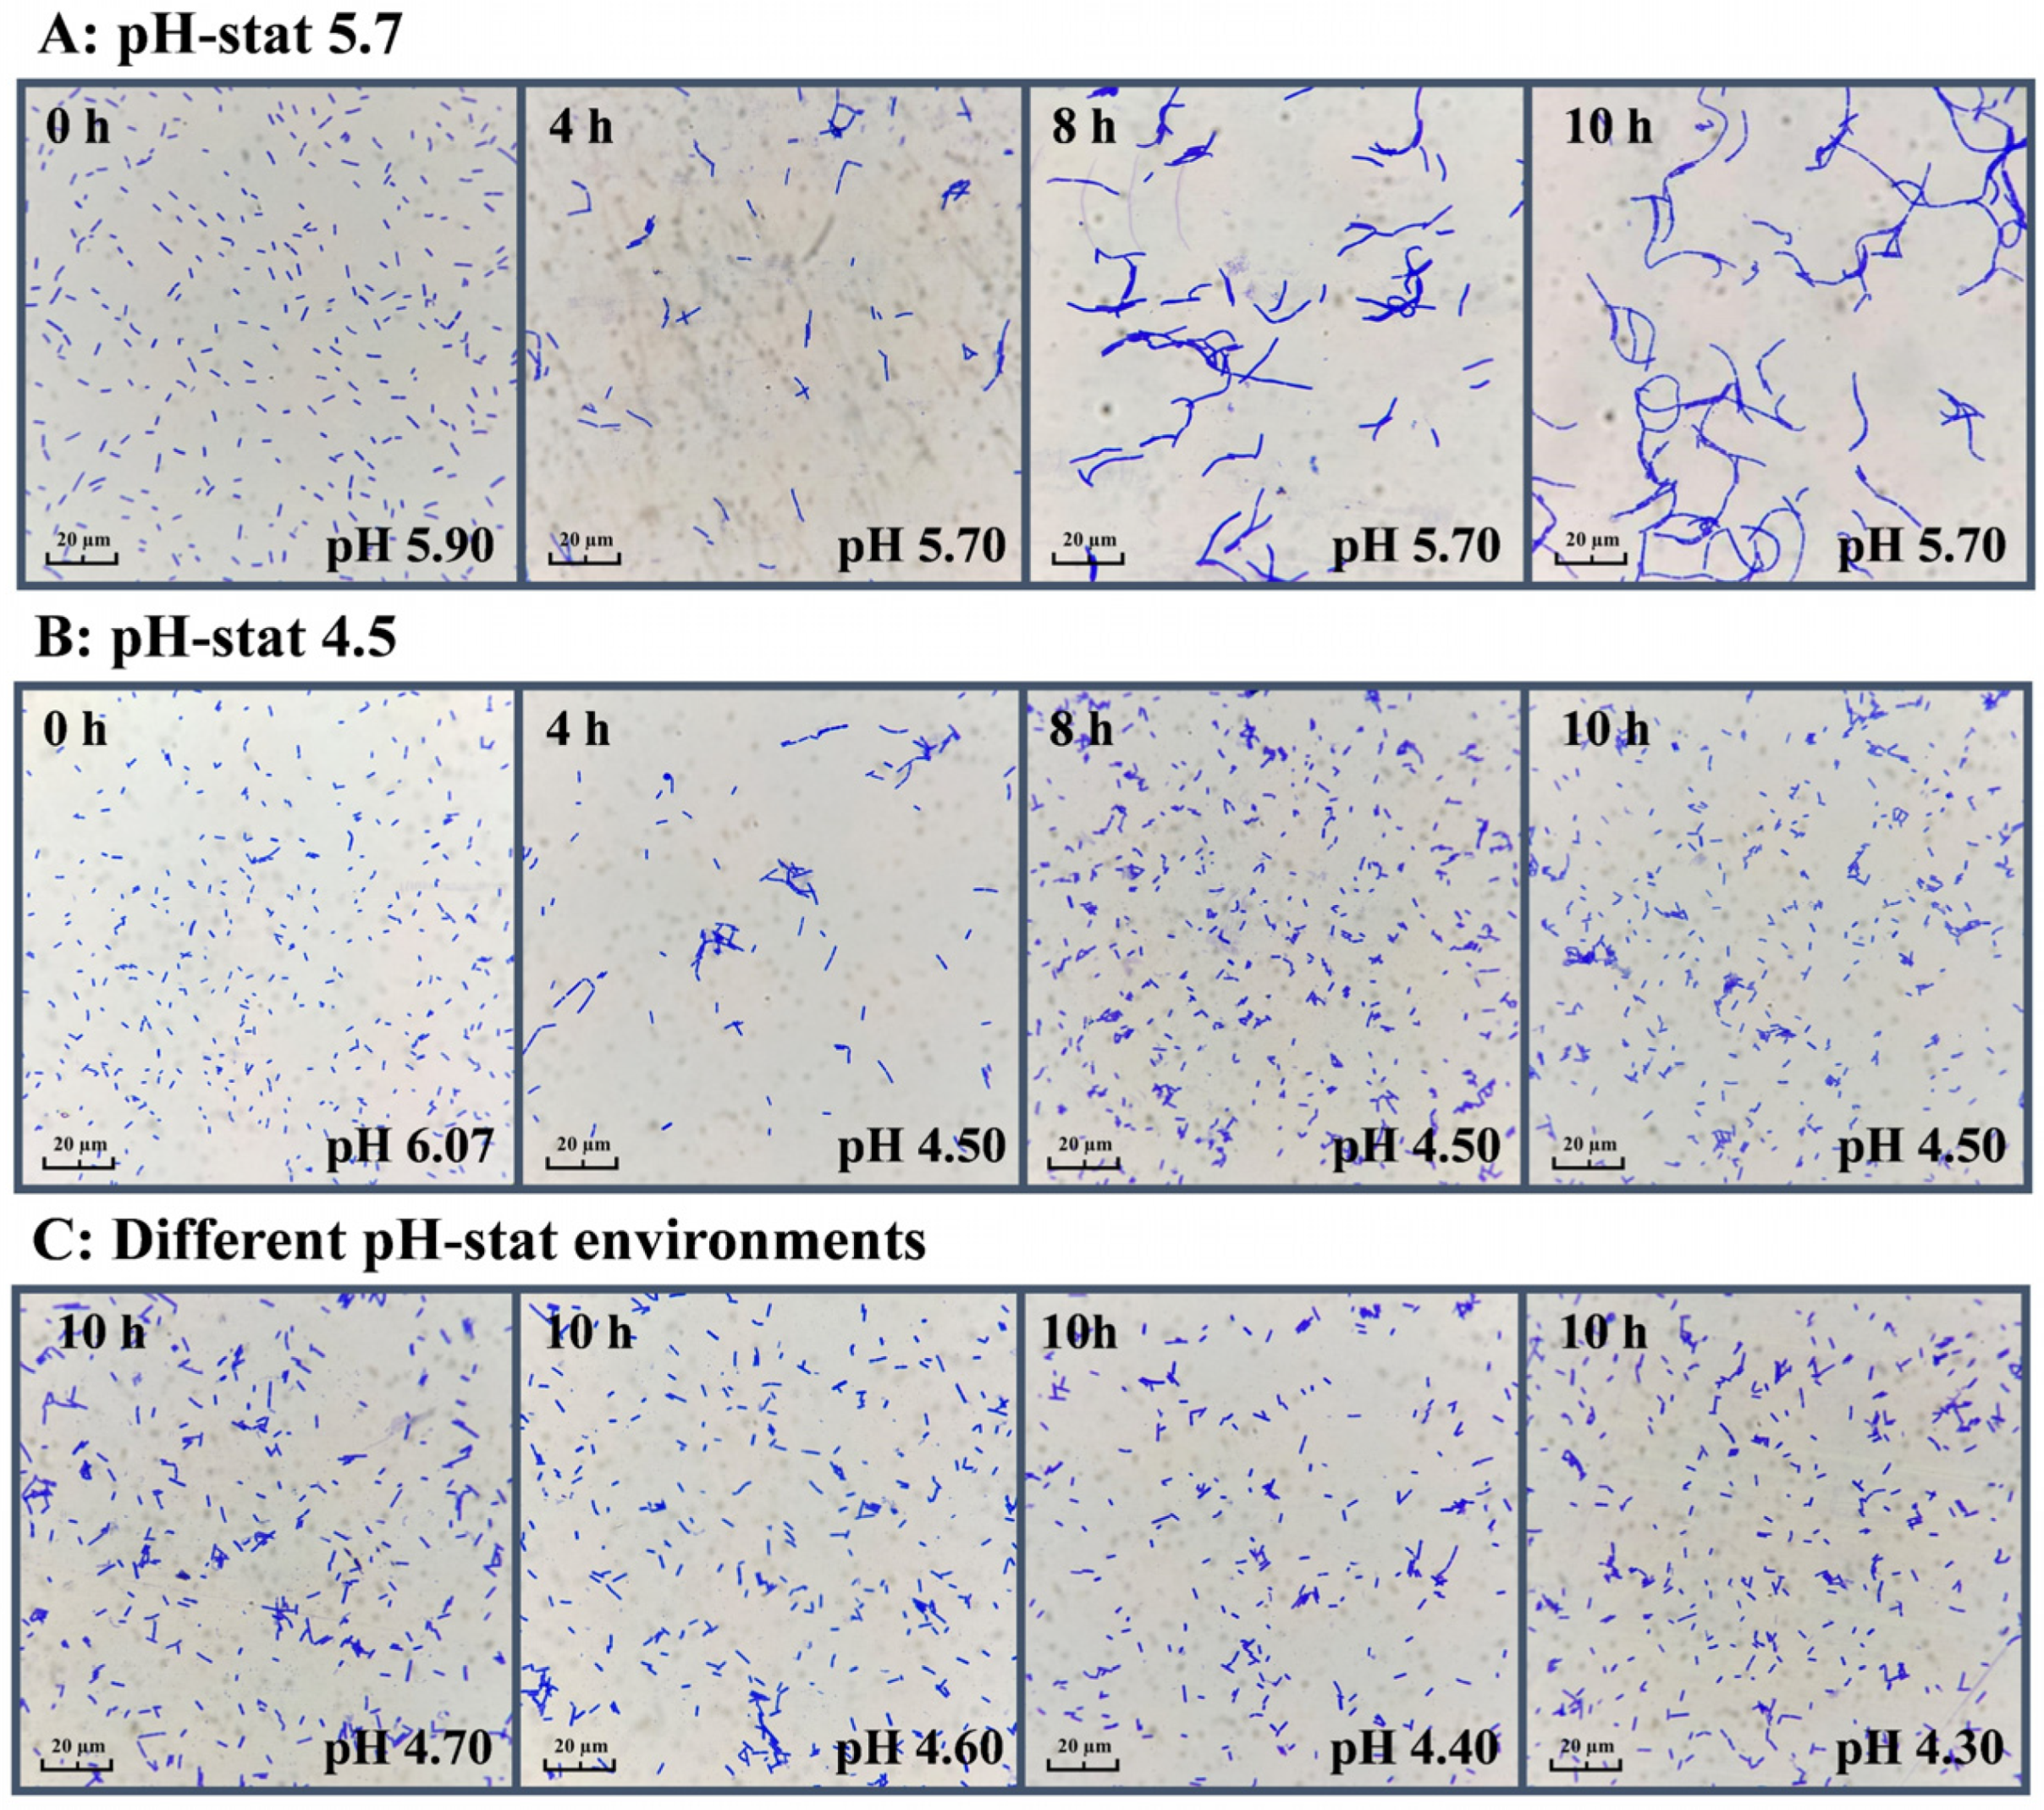
In order to determine the condition of high cell density fermentation in the large-volume system, the pH-stat fermentation of L. acidophilus CCFM137 was conducted in a 100 L pilot-scale fermenter using optimized medium for 10 h. In general, L. acidophilus pH-stat fermentation is conducted within a pH range of 5.0–6.5 [45,46]. Therefore, the pilot fermentation was executed using the median value of pH 5.7. As demonstrated in Figure 6A, the viable cell count obtained after fermentation at pH-stat 5.7 was merely 7.63 ± 0.06 × 10⁸ CFU/mL. After 5 h of fermentation, the growth of viable cells ceased, but the cell density continued to increase (Figure 6B). Microscopic examination revealed that individual cells exhibited a tendency to form a long rod-like or chain-like form instead of adequate division (Figure 7A), with a cell length of 18.24 ± 10.72 µm. Additionally, the utilization rate of reducing sugars and amino acid nitrogen was found to be at a low level (Figure 6C). As demonstrated in the preceding experiments, the growth curve of L. acidophilus CCFM137 in the optimized medium containing buffer salt exhibited a significant acceleration in growth rate between 4 h and 10 h, corresponding to a pH range of 4.1–5.3 (Figure 5A). Microscopic examination revealed a decrease in cell length as the pH of the medium decreased gradually during fermentation (Figure 5B). This result suggested that L. acidophilus may achieve a better fermentation performance within a lower pH range.
Therefore, the constant pH environment in the fermenter was adjusted to 4.7 for the subsequent experiments, and the results showed that the viable cell count of the fermentation broth under this condition reached 2.53 ± 0.10 × 10⁹ CFU/mL, and the cell morphology (3.20 ± 0.96 µm) was significantly shorter than that at pH-stat 5.7. This result indicated that lowering the pH to enhance the fermentation performance was feasible. The pH level gradually decreased from a value of 4.7 to 4.3 in the ensuing fermentation, and the viable cell count of the fermentation broth demonstrated a proclivity for both an increase and a subsequent decrease. Optimal fermentation performance was observed at pH 4.5, with a viable cell count of 3.37 ± 0.24 × 10⁹ CFU/mL and cell length of 2.44 ± 0.53 µm, significantly better than other groups. In comparison with fermentation conducted at pH-stat 5.7, L. acidophilus CCFM137 exhibited higher substrate utilization, less consumption of alkaline solution (Figure 6C), and shorter cell morphology (Figure 6D) in the low pH range from 4.3 to 4.7.
Under the conventional pH-stat condition of 5.7, L. acidophilus CCFM137 exhibited suboptimal fermentation performance, which was associated with elongated cell morphology. This morphological alteration results in two distinct fermentation performances between cell density and viable cell count. In contrast, when the environmental pH was reduced to 4.5, a marked improvement in fermentation performance was observed. This finding is consistent with previous studies. Rhee and Pack [21] demonstrated that the cell morphology of L. delbrueckii subsp. bulgaricus NLS-4 exhibited a discernible trend of gradual shortening as the pH decreased. This was attributed to the poor synthesis of autolytic enzymes that promote cell division under alkaline or weakly acidic conditions. Similarly, a study on L. reuteri revealed that variables such as temperature, initial pH, and oxygen levels exert a substantial influence on the cell morphology of L. reuteri DSM 17938, with higher initial pH leading to larger cells [47]. In addition, because chromosome segregation and cell division are uncoupled in bacteria, unfavorable growth conditions affect the assembly of complex protein rings involved in septum formation during cell division, which may result in cells appearing as chains or long rods [48]. In conclusion, reducing the pH of the fermentation environment may prove to be an effective solution to improve the fermentation performance of L. acidophilus.

3.8. Effect of Different pH-Stat Environments on Cell Recovery and Lyophilization

The bacterial sludge obtained through centrifugation of fermentation broth cultured at pH-stat 5.7 manifested as a highly fluid paste (Figure 8C), with a total weight of 3.72 ± 0.13 kg (Figure 8A). This environment yielded suboptimal performance, with an inferior cell recovery rate (63.13 ± 3.46%) and lyophilization survival rate (45.75 ± 10.23%), indicative of substantial bacterial loss and mortality. However, the bacterial sludge collected within the pH range of 4.3–4.7 was drier than the samples obtained at pH-stat 5.7 (Figure 8C), but with a total mass of approximately 1 kg (Figure 8A). Notably, both cell recovery rate and lyophilization survival rate showed marked improvement across these more acidic conditions. Specifically, a maximal cell recovery rate of 79.16 ± 8.12% and 84.49 ± 3.9% was achieved at pH-stat 4.5 and 4.4, respectively, and the lyophilization survival rate of the emulsion prepared from the sludge reached 77.83 ± 8.07% and 84.07 ± 7.25%, respectively, which was higher than that in other pH environments (Figure 8B).
These experimental results indicated that cells harvested from lower pH conditions exhibited significantly improved recovery efficiency and lyophilization survival rates. This enhancement is likely attributable to their shortened cellular morphology, which may confer greater resistance to environmental stresses. These findings are consistent with previous studies. Senz et al. [17] reported that optimizing the sterilization protocol of the culture medium resulted in shorter cell morphology in L. acidophilus NCFM and a concomitant increase in lyophilization survival. Similarly, Silva et al. [49] observed that L. delbrueckii subsp. bulgaricus harvested at pH 4.5 exhibited superior lyophilization tolerance compared to cultures collected at pH 6.5. Furthermore, Cui et al. [50] demonstrated that cultivating L. casei FJSWX3-L3 under lower pH conditions reduced the production of surface-exposed substances, thereby contributing to enhanced post-lyophilization viability. Collectively, these results substantiate that controlling fermentation at reduced pH levels is an effective strategy to improve both cell recovery and lyophilization survival in probiotic bacteria.

4. Conclusions

This study established an effective fermentation strategy to address the poor growth of L. acidophilus CCFM137 in conventional MRS broth. An optimized culture medium was developed for the strain by determining the optimal types and concentrations of raw materials. When combined with pH-stat fermentation under weakly acidic conditions (pH-stat 4.5), this strategy markedly enhanced cell division and viable cell count. These optimizations resulted not only in beneficial morphological changes but also an enhanced tolerance of lyophilization. This demonstrates the critical effects of nutritional composition and environmental conditions in promoting high cell density fermentation of L. acidophilus. The proposed approach offers a scalable and industrially applicable solution for the large-scale production of L. acidophilus. Future work should focus on elucidating the mechanistic basis of pH-induced morphological changes and further evaluating the economic feasibility of this process in industrial-scale bioreactors.

Author Contributions

Conceptualization, F.H. and H.Z.; Investigation, S.-Q.Y.; Methodology, F.H.; Project administration, F.H.; Writing—original draft, S.-Q.Y.; Writing—review and editing, Y.-Y.S., R.Y., R.L. and F.H. All authors have read and agreed to the published version of the manuscript.

Funding

This research was funded by the National Natural Science Foundation of China, grant number 31972971.

Institutional Review Board Statement

Not applicable.

Informed Consent Statement

Not applicable.

Data Availability Statement

The raw data supporting the conclusions of this article will be made available by the authors on request.

Acknowledgments

The authors are grateful to Feng Hang for his careful guidance and enthusiastic assistance of colleagues, which contributed greatly to the smooth conduct of this study.

Conflicts of Interest

This research was performed without any commercial or financial relationships that could be construed as potential conflicts of interest.

Correction Statement

This article has been republished with a minor correction to the Institutional Review Board Statement and Informed Consent Statement. This change does not affect the scientific content of the article.

References

  1. Jin, X.F.; Yu, F.Q.B.; Yan, J.; Allison, M.W.; Veronika, D.; Meng, X.R.; Katherine, S.P. Culturing of A Complex Gut Microbial Community in Mucin-Hydrogel Carriers Reveals Strain- and Gene-Associated Spatial Organization. Nat. Commun. 2023, 14, 3510. [Google Scholar] [CrossRef]
  2. Wang, M.X.; Chen, Y.X.; Wang, Y.Y.; Li, Y.; Zhang, X.J.; Zheng, H.; Ma, F.L.; Ma, C.H.; Lu, B.Y.; Xie, Z.H.; et al. Beneficial changes of gut microbiota and metabolism in weaned rats with Lactobacillus acidophilus NCFM and Bifidobacterium lactis Bi-07 supplementation. J. Funct. Foods 2018, 48, 252–265. [Google Scholar] [CrossRef]
  3. Zhuo, Q.; Yu, B.H.; Zhou, J.; Zhang, J.Y.; Zhang, R.L.; Xie, J.; Wang, Q.L.; Zhao, S.L. Lysates of Lactobacillus acidophilus combined with CTLA-4-blocking antibodies enhance antitumor immunity in a mouse colon cancer model. Sci. Rep. 2019, 9, 20128. [Google Scholar] [CrossRef]
  4. Lau, H.C.-H.; Zhang, X.; Ji, F.F.; Lin, Y.F.; Liang, W.; Li, Q.; Chen, D.Y.; Fong, W.; Kang, X.; Liu, W.X.; et al. Lactobacillus acidophilus suppresses non-alcoholic fatty liver disease-associated hepatocellular carcinoma through producing valeric acid. EBioMedicine 2024, 100, 104952. [Google Scholar] [CrossRef]
  5. Masoumi, S.J.; Mehrabani, D.; Saberifiroozi, M.; Fattahi, M.R.; Moradi, F.; Najafi, M. The effect of yogurt fortified with Lactobacillus acidophilus and Bifidobacterium sp. probiotic in patients with lactose intolerance. Food Sci. Nutr. 2021, 9, 1704–1711. [Google Scholar] [CrossRef] [PubMed]
  6. Yang, A.S.; Liao, Y.R.; Zhu, J.R.; Zhang, J.; Wu, Z.H.; Li, X.; Tong, P.; Chen, H.; Wang, S.; Liu, Z. Screening of anti-allergy Lactobacillus and its effect on allergic reactions in BALB/c mice sensitized by soybean protein. J. Funct. Foods 2021, 87, 104858. [Google Scholar]
  7. Kim, H.R.; Seo, E.S.; Oh, S.Y.; Seo, M.Y.; Byun, K.H.; Kim, B.-Y. Anti-obesity effects of multi-strain probiotics in mice with high-carbohydrate diet-induced obesity and the underlying molecular mechanisms. Nutrients 2022, 14, 5173. [Google Scholar] [CrossRef]
  8. Schmitt, J.D.; De Faria, L.O.; Simes, M.; Kottwitz, L.B.M. Evaluation of the Probiotic Profile of the Lactobacillus acidophilus Used in Pharmaceutical and Food Applications. Acta Sci. Health Sci. 2018, 40, e36664. [Google Scholar]
  9. Huang, Z.; Zhou, X.Y.; Stanton, C.; Ross, R.P.; Zhao, J.X.; Zhang, H.; Yang, B. Comparative genomics and specific functional characteristics analysis of Lactobacillus acidophilus. Microorganisms 2021, 9, 1992. [Google Scholar] [CrossRef]
  10. Su, X.; Menghe, B.L.G.; Zhang, H.P.; Liu, W.J. In Vitro Evaluation of Intestinal Transport and High-Density Fermentation of Lactobacillus acidophilus. Metabolites 2023, 13, 1077. [Google Scholar] [CrossRef]
  11. Zhang, Y.; Dai, X.; Jin, H.; Man, C.; Jiang, Y. The effect of optimized carbon source on the synthesis and composition of exopolysaccharides produced by Lactobacillus paracasei. J. Dairy Sci. 2021, 104, 4023–4032. [Google Scholar] [CrossRef] [PubMed]
  12. Goderska, K.; Nowak, J.; Czarnecki, Z. Comparison of growth of Lactobacillus acidophilus and Bifidobacterium bifidum species in media supplemented with selected saccharides including prebiotics. Acta Sci. Pol. Technol. Aliment. 2008, 7, 5–20. [Google Scholar]
  13. Zang, J.; Wang, T.; Piotr, D.; Zhao, H.; Zhang, B. Increasing lactose concentration is a strategy to improve the proliferation of Lactobacillus helveticus in milk. Food Sci. Nutr. 2021, 9, 1050–1060. [Google Scholar] [CrossRef]
  14. Karim, G.; Darhabi, H.K.; Habibollah, M. The effect of fructose, prolin, initial doses and different temperatures on the growth and metabolism of Lactobacillus acidophilus La5. J. Anim. Vet. Adv. 2009, 8, 2432–2437. [Google Scholar]
  15. Tatsuo, M.; Yoshiaki, D.; Motoyuki, Y.; Takeshi, S.; Takashi, Y. Multiple nutritional requirements of lactobacilli: Genetic lesions affecting amino acid biosynthetic pathways. J. Bacteriol. 1981, 148, 64–71. [Google Scholar] [CrossRef]
  16. Qiao, Y.L.; Yin, B.S.; Zhou, W.; Wang, M.-J.; Chang, Z.; Zhou, J.P.; Yue, M.X.; Chen, J.X.; Liu, F.; Feng, Z. Strategies for enhancing acid resistance of Lactobacillus acidophilus through analyzing nutrient consumption patterns. J. Sci. Food Agric. 2024, 104, 5982–5990. [Google Scholar] [CrossRef]
  17. Senz, M.; Lengerich, B.V.; Bader, J.; Ståhl, U. Control of Cell Morphology of Probiotic Lactobacillus acidophilus for Enhanced Cell Stability During Industrial Processing. Int. J. Food Microbiol. 2015, 192, 34–42. [Google Scholar] [CrossRef]
  18. Zhang, Z.C.; Yin, B.S.; Liu, F.; Zhou, W.; Wang, M.-J.; Chang, Z.; Zhou, J.P.; Yue, M.X.; Chen, J.X.; Feng, Z. Effect of The Initial ph of The Culture Medium on The Nutrient Consumption Pattern of Bifidobacterium animalis subsp. lactis Bb12 and The Improvement of Acid Resistance By Purine and Pyrimidine Compounds. J. Appl. Microbiol. 2024, 135, lxae02. [Google Scholar] [CrossRef]
  19. Chang, C.-Y.; Liew, S.L. Growth Medium Optimization for Biomass Production of a Probiotic Bacterium, Lactobacillus rhamnosus ATCC 7469. J. Food Biochem. 2012, 37, 536–543. [Google Scholar] [CrossRef]
  20. Cui, S.M.; Zhao, J.X.; Liu, X.M.; Chen, Y.Q.; Zhang, H.; Chen, W. Maximum-Biomass Prediction of Homofermentative Lactobacillus. J. Biosci. Bioeng. 2016, 122, 52–57. [Google Scholar] [CrossRef] [PubMed]
  21. Rhee, S.K.; Pack, M.Y. Effect of Environmental ph on Chain Length of Lactobacillus bulgaricus. J. Bacteriol. 1980, 144, 865–868. [Google Scholar] [CrossRef] [PubMed]
  22. De, M.J.C.; Rogosa, M.; Elisabeth, S.M. A medium for the cultivation of Lactobacilli. J. Appl. Bacteriol. 1960, 23, 130–135. [Google Scholar] [CrossRef]
  23. Mao, B.Y.; Li, D.Y.; Zhao, J.X.; Liu, X.M.; Gu, Z.B.; Chen, Y.Q.; Zhang, H.; Chen, W. In Vitro Fermentation of Lactulose by Human Gut Bacteria. J. Agric. Food Chem. 2014, 62, 10970–10977. [Google Scholar] [CrossRef]
  24. Fan, X.; Shi, Y.Y.; Li, R.; Yang, R.; Yang, X.; Feng, H.; Zhang, H.; Chen, W. Preliminary Study on The Effect of Pre-Freezing Methods on Lyophilization Quality and Storage Stability of Probiotics. Dry. Technol. 2024, 42, 1480–1492. [Google Scholar] [CrossRef]
  25. Rahayu, H.M.; Setiadi, A.E. Isolation and Characterization of Indigenous Lactic Acid Bacteria from Pakatikng Rape, Dayak’s Traditional Fermented Food. J. Penelit. Pendidik. IPA (JPPIPA) 2023, 9, 920–925. [Google Scholar] [CrossRef]
  26. Chen, S.W.; Niu, H.Y.; Wu, Y.F.; Sun, J.L.; Han, X.; Zhang, L.W. Influence of Lactic Acid on Cell Cycle Progressions in Lactobacillus bulgaricus During Batch Culture. Appl. Biochem. Biotechnol. 2020, 193, 912–927. [Google Scholar] [CrossRef]
  27. Schaan, K.; Hughes, P. A comparison of free amino nitrogen and yeast-assimilable nitrogen measurement methods for use in alcoholic fermentation of whey. J. Dairy Sci. 2024, 107, 6592–6601. [Google Scholar] [CrossRef]
  28. Zohri, A.A.; Abdelazim, M.; Ibrahim, S. 2-Aminoethanaminium 2-(ethoxycarbonyl)-4,6-dinitrophenolate as a greener route in reducing sugar quantification. MethodsX 2018, 5, 609–612. [Google Scholar] [CrossRef] [PubMed]
  29. Kusaka, I.; Kitahara, K. Effect of several vitamins on the cell division and the growth of Lactdbacillus delbrueckii. J. Vitaminol. 1962, 8, 115–120. [Google Scholar] [CrossRef]
  30. Jeener, H.; Jeener, R. Cytological study of Thermobacterium acidophilus R26 cultured in absence of deoxyribonucleosides or uracil. Exp. Cell Res. 1952, 3, 675–680. [Google Scholar] [CrossRef]
  31. Mary, B. The Classification of Lactobacilli by means of Physiological Tests. J. Gen. Microbiol. 1953, 9, 234–248. [Google Scholar] [CrossRef]
  32. Shalini, S.; Mital, B.K.; Shweta, G. Effect of casitone and fructose on the growth of Lactobacillus acidophilus and its survival during storage. Int. J. Food Microbiol. 1994, 21, 271–276. [Google Scholar] [CrossRef]
  33. Yang, S.; Hou, M.; Tan, W.; Chen, Y.; Li, H.; Song, J.; Wang, X.; Ren, J.; Gao, Z. Lactic acid bacteria sequential fermentation improves viable counts and quality of fermented apple juice via generating two logarithmic phases. Food Chem. 2025, 464, 141635. [Google Scholar] [CrossRef]
  34. Chen, H.; Niu, J.; Qin, T.; Ma, Q.; Wang, L.; Shu, G. Optimization of the medium for Lactobacillus acidophilus by Plackett-Burman and steepest ascent experiment. Acta Sci. Pol. Technol. Aliment. 2015, 14, 227–232. [Google Scholar] [CrossRef] [PubMed]
  35. Hassan, S.S.; Roslinda, B.A.M.; Atim, A.; Jikan, S.S.; Mohd Fuzi, S.F.Z. Effects of Different Carbon Sources for High Level Lactic Acid Production by Lactobacillus casei. Appl. Mech. Mater. 2015, 695, 220–223. [Google Scholar] [CrossRef]
  36. Sionek, B.; Szydowska, A.; Trzskowska, M.; Kooyn-Krajewska, D. The Impact of Physicochemical Conditions on Lactic Acid Bacteria Survival in Food Products. Fermentation 2024, 10, 298. [Google Scholar] [CrossRef]
  37. Bircher, L.; Sourabié, A.M.; Paurevic, M.; Hochuli, J.; Geirnaert, A.; Navas, C.; Drogue, B.; Lacroix, C. Faecalibacterium duncaniae A2-165 growth is strongly promoted by yeast extract and vitamin B5 in cGMP medium. Microb. Biotechnol. 2024, 17, e14374. [Google Scholar] [CrossRef] [PubMed]
  38. Li, W.; Zhang, Y.; Li, H.; Zhang, C.; Zhang, J.; Uddin, J.; Liu, X. Effect of soybean oligopeptide on the growth and metabolism of Lactobacillus acidophilus JCM 1132. RSC Adv. 2020, 10, 16737–16748. [Google Scholar] [CrossRef]
  39. Rosario, I.S.; María Teresa, J.-M.; Emma, M.L.; Enrique, P.; Aurelio, L.M. Growth and viability of Lactobacillus acidophilus NRRL B-4495, Lactobacillus casei NRRL B-1922 and Lactobacillus plantarum NRRL B-4496 in milk supplemented with cysteine, ascorbic acid and tocopherols. Int. Dairy J. 2019, 97, 15–24. [Google Scholar] [CrossRef]
  40. Li, Y.; Yan, Y.; Chen, J.; Zhang, Z.; Hu, W. Enhancement effect of l-cysteine on lactic acid fermentation production. Biotechnol. J. 2023, 18, e2300110. [Google Scholar] [CrossRef]
  41. Dave, R.I.; Shah, N.P. Ingredient supplementation effects on viability of probiotic bacteria in yogurt. J. Dairy Sci. 1998, 81, 2804–2816. [Google Scholar] [CrossRef]
  42. Partanen, L.; Marttinen, N.; Alatossava, T. Fats and fatty acids as growth factors for Lactobacillus delbrueckii. Syst. Appl. Microbiol. 2001, 24, 500–506. [Google Scholar] [CrossRef]
  43. Elvina, P.; Chaitali, D.; Trung Kien, T.; Oliver, A.H.J.; Bee, K.M. Morphological and ultrastructural changes in Lactobacillus plantarum B21 as an indicator of nutrient stress. LWT 2018, 92, 556–563. [Google Scholar] [CrossRef]
  44. Liu, Q.; Huang, X.; Yang, D.; Si, T.; Pan, S.; Yang, F. Yield improvement of exopolysaccharides by screening of the Lactobacillus acidophilus ATCC and optimization of the fermentation and extraction conditions. EXCLI J. 2016, 15, 119–133. [Google Scholar] [CrossRef] [PubMed]
  45. Matthew, B.; Sue, P.; Julian, R.M.; Eshwar, M. The Life History of Lactobacillus acidophilusas A Probiotic: A Tale of Revisionary Taxonomy, Misidentification and Commercial Success. FEMS Microbiol. Lett. 2013, 349, 77–87. [Google Scholar] [CrossRef] [PubMed]
  46. Hamid, M.; Saima, Y.; Ikram ul, H. Production of Probiotic Mozzarella Cheese by Incorporating Locally Isolated Lactobacillus acidophilus. Ann. Microbiol. 2020, 70, 240–251. [Google Scholar] [CrossRef]
  47. Rao, N.S.; Lundberg, L.; Palmkron, S.B.; Håkansson, S.; Bergenståhl, B.; Carlquist, M. Flow Cytometric Analysis Reveals Culture Condition Dependent Variations in Phenotypic Heterogeneity of Limosilactobacillus reuteri. Sci. Rep. 2021, 11, 23567. [Google Scholar] [CrossRef]
  48. Weart, R.B.; Lee, A.; Chien, A.-C.; Haeusser, D.P.; Hill, N.S.; Levin, P.A. A Metabolic Sensor Governing Cell Size in Bacteria. Cell 2007, 130, 335–347. [Google Scholar] [CrossRef]
  49. Silva, J.; Carvalho, A.S.; Ferreira, R.; Vitorino, R.; Amado, F.; Domingues, P.; Teixeira, P.; Gibbs, P. Effect of The pH of Growth on The Survival of Lactobacillus delbrueckii subsp. bulgaricus to Stress Conditions During Spray-Drying. J. Appl. Microbiol. 2005, 98, 775–782. [Google Scholar] [CrossRef]
  50. Cui, S.M.; Pan, Z.F.; Wu, S.; Mao, B.Y.; Tang, X.; Zhang, Q.X.; Zhang, H.; Zhao, J.X. Improvement of The Lyophilization Survival Rate of Lactobacillus casei Via Regulation of its Surface Substances. Foods 2022, 11, 3468. [Google Scholar] [CrossRef]
Figure 1. Growth curve (A) and cell morphology (B) of L. acidophilus CCFM137 in MRS broth.
Fermentation 11 00564 g001
Figure 2. (A) Effects of different carbon sources on the growth of L. acidophilus CCFM137 (blue bars represent logarithm of viable cell count, red bars represent ΔOD600nm, different uppercase letters and lowercase letters represent significant differences in viable cell counts and ΔOD600nm, respectively (p < 0.05)). (B) Effects of different amounts of glucose on the growth of L. acidophilus CCFM137 (blue bars represent logarithm of viable cell count, red line represents glucose utilization rate; different uppercase letters and lowercase letters represent significant differences in viable cell counts and glucose utilization rate, respectively (p < 0.05)).
Fermentation 11 00564 g002
Figure 3. (A) Effects of different nitrogen sources on the growth of L. acidophilus CCFM137 (blue bars represent logarithm of viable cell count; red bars represent ΔOD600nm; different uppercase letters and lowercase letters represent significant differences in viable cell counts and ΔOD600nm, respectively (p < 0.05)). (B) Effects of different amounts of YEP FM503 on the growth of L. acidophilus CCFM137 (blue bars represent logarithm of viable cell count; red line represents the utilization rate of amino acid nitrogen; different uppercase letters and lowercase letters represent significant differences in viable cell counts and AAN utilization rate, respectively (p < 0.05)).
Fermentation 11 00564 g003
Figure 4. Effect of L-cysteine hydrochloride (A) and Tween 80 (B) on the growth of L. acidophilus CCFM137. Different uppercase letters represent significant differences in viable cell counts (p < 0.05).
Fermentation 11 00564 g004
Figure 5. Growth curve (A) and cell morphology (B) of L. acidophilus CCFM137 in optimized medium.
Fermentation 11 00564 g005
Figure 6. Effect of different pH-stat environments on fermentation performance of L. acidophilus CCFM137. (A) Growth curve of viable cell count. (B) Growth curve of optical density. (C) Substrate consumption rate and alkali consumption (blue bars represent the utilization rate of glucose, red bars represent the utilization rate of amino acid nitrogen, purple line represents the consumption of alkali solution, different uppercase letters represent significant differences in utilization rate of glucose (group 1) and AAN (group 2) (p < 0.05), different lowercase letters represent significant differences in alkali consumption (p < 0.05)). (D) Average length of cells (Asterisks indicate a significant difference between two groups in cell length, * (p < 0.05); ** (p < 0.01); *** (p < 0.001)).
Fermentation 11 00564 g006
Figure 7. Cell morphology of L. acidophilus CCFM137 in different pH environments.
Fermentation 11 00564 g007
Figure 8. Effect of different pH-stat environments on cell recovery and lyophilization of L. acidophilus CCFM137. (A) Total mass of bacterial sludge (different uppercase letters represent significant differences in total mass of bacterial sludge (p < 0.05). (B) Cell recovery and lyophilization survival rate (blue bars represent the recovery rate after centrifugation; red bars represent the survival rate after lyophilization; different uppercase letters and lowercase letters represent significant differences in recovery rate and lyophilization survival rate, respectively (p < 0.05)). (C) Form of bacterial sludge.
Fermentation 11 00564 g008
Disclaimer/Publisher’s Note: The statements, opinions and data contained in all publications are solely those of the individual author(s) and contributor(s) and not of MDPI and/or the editor(s). MDPI and/or the editor(s) disclaim responsibility for any injury to people or property resulting from any ideas, methods, instructions or products referred to in the content.