Article

Carbon Dioxide Micro-Nano Bubbles Aeration Improves Carbon Fixation Efficiency for Succinic Acid Synthesis by Escherichia coli

1
College of Biotechnology and Pharmaceutical Engineering, Nanjing Tech University, Nanjing 211800, China
2
State Key Laboratory of Materials-Oriented Chemical Engineering, Nanjing Tech University, Nanjing 211800, China
*
Author to whom correspondence should be addressed.
Fermentation 2025, 11(1), 31; https://doi.org/10.3390/fermentation11010031
Submission received: 17 December 2024 / Revised: 11 January 2025 / Accepted: 13 January 2025 / Published: 14 January 2025
(This article belongs to the Section Fermentation Process Design)

Abstract

:
The low solubility of CO2 in water leads to massive CO2 emission and extremely low CO2 utilization in succinic acid (SA) biosynthesis. To enhance microbial CO2 utilization, micro-nano bubbles (MNBs) were induced in SA biosynthesis by E. coli Suc260 in this study. The results showed that MNB aeration decreased CO2 emissions and increased CO2 solubility in the medium significantly. The CO2 utilization of MNB aeration was 129.69% higher than that of bubble aeration in atmospheric fermentation. However, MNBs showed a significant inhibitory effect on bacterial growth in the pressurized environment, although a two-stage aerobic–anaerobic fermentation strategy weakened the inhibition. The biofilm-enhanced strain E. coli Suc260-CsgA showed a strong tolerance to MNBs. In pressurized fermentation with MNB aeration, the actual CO2 utilization of E. coli Suc260-CsgA was 30.63% at 0.18 MPa, which was a 6.49-times improvement. The CO2 requirement for SA synthesis decreased by 83.4%, and the fugitive emission of CO2 was successfully controlled. The activities of key enzymes within the SA synthesis pathway were also maintained or enhanced in the fermentation process with MNB aeration. These results indicated that the biofilm-enhanced strain and CO2-MNBs could improve carbon fixation efficiency in microbial carbon sequestration.

1. Introduction

Third-generation biorefining technologies, which convert CO2 into fuels and chemicals, are gaining increasing attention in carbon emission reduction [1]. Succinic acid (SA) is a key platform compound, vital for creating bio-based products such as biodegradable plastics (PBSs), polyester polyols, and green alternatives to petrochemicals [2]. Anaerobic fermentation for SA production presents a more effective biological approach [3]. Zhang et al. [4] reported that the CO2 fixation rate of microbial anaerobic synthesis of SA was increased 188 times as compared with microalgae. Phosphoenolpyruvate (PEP) carboxylase plays a crucial and rate-determining role in SA production; with its function being influenced and controlled by CO2 levels, increased CO2 concentration can enhance phosphoenolpyruvate carboxylase (PPC) activity [5]. The presence of CO2 suppresses the conversion of oxaloacetic acid (OAA) and malate into pyruvate, enhancing carbon flux through the C4 pathway and ultimately boosting the production of SA [6]. In conclusion, CO2 concentration level and supply capacity are limiting factors affecting the synthesis efficiency of SA [7,8].
The preferred fermentation temperatures for most succinate-producing bacteria are around 37 °C [9]. The solubility of CO2 in water at 37 °C is only 0.563 L·L−1, which is about 35.87% lower than that at 20 °C, leading to rapid CO2 emission and limiting microbial carbon sequestration. The CO2 utilization of SA production only remained below 3% due to the rapid release of CO2 in the form of bubbles [10]. The substantial release of CO2 leads to secondary emissions of greenhouse gas during the SA fermentation process, diminishing the carbon fixation efficiency of microorganisms. On the other hand, HCO3 and CO32− can be directly utilized by microorganisms for SA production. Therefore, carbonates and bicarbonates are widely used as CO2 supplements to ensure the rapid synthesis of bio-based SA [11], which increases fermentation costs and inhibition to bacteria due to ion accumulation [12,13]. Therefore, an extracellular supply of CO2 is regarded as a bottleneck influencing CO2 utilization in the manufacturing of bio-SA [8].
In recent years, research has sought to enhance CO2 supply and solubility. Increasing CO2 partial pressure directly enhanced the gas transport rate and solubility. The specific growth rate of M. succiniciproducens at 101.3 kPa (the dissolved CO2 concentration was 23.0 mM) was 1.43 times greater than at 37.98 kPa (only 8.74 mM CO2 was dissolved), with the SA yield of glucose increasing from 0.389 g·g−1 to 0.460 g·g−1 [13], whereas high CO2 pressures may adversely affect microbial physiology, potentially altering membrane permeability and enzymatic activities [14]. Cao et al. [15] reported that the ability of A. succinogenes 130 Z to synthesize SA was inhibited when the fermenter pressure was increased above 0.4 bar (relative pressure). Additionally, forced circulation and high-speed stirring could also enhance CO2 supply. Wu et al. [16] developed a self-inducing agitator, which employed hollow blades actuated by magnetic forces to effectively introduce and disperse CO2, enhancing its solubility and bioavailability. The CO2 requirement for SA synthesis with a self-inducing agitator decreased by 90% compared with the conventional agitator [17]. However, fast agitation and forced gas recycling demand more energy for effective mass transfer.
Macro-bubbles (MaBs) (diameters > 100 μm), due to their greater dimensions, experience a more substantial buoyant force, leading to their rapid ascent and subsequent bursting at the surface [18]. Micro-nano bubbles (MNBs) are tiny bubbles with diameters ranging from tens of nanometers to tens of micrometers which possess large surface areas, high zeta potentials, long-term stability, and slow transport velocities [19]. Their retention time in water ranges from hours to days [20], which facilitates the enhancement of CO2 solubility and mitigates CO2 emissions [21]. Recent research revealed that CO2-MNBs significantly promoted gas transfer in water compared to traditional bubbles [22]. In recent years, MNBs have emerged as a versatile technology in biorefining, owing to their unique physicochemical properties. In decarbonization, MNBs enhanced the removal of CO2 from biogas, thereby increasing purity and energy efficiency for biogas utilization [20,21]. In wastewater treatment, MNBs facilitated contaminant removal through advanced oxidation processes and improved pathogen inactivation, resulting in superior effluent quality [18]. In addition, MNBs promoted the physiological activity of plants by producing exogenous reactive oxygen species and increasing the bulk mobility of water molecules, which could promote rapid seed germination time and growth [23].
However, some studies demonstrated that the rupture of CO2-MNBs generated free radicals [24] that were capable of damaging a wide range of macromolecules, including DNA, RNA, proteins, and lipids, which could subsequently affect cell viability [25].
A biofilm is a structural aggregate formed by microorganisms, such as bacteria, on solid surfaces or gas–liquid interfaces. These aggregates form a protective three-dimensional structure by secreting extracellular polymers (EPSs) [26,27]. Fermentation within the biofilm enhances the secretion of extracellular substances, which could improve the resistances of the strain to adversity and the effects of external stresses, such as low pH, high osmotic pressure, and so on [28,29]. Therefore, biofilm might have the potential to resist MNBs.
Aiming to enhance CO2 utilization and reduce reliance on carbonates as CO2 supplements in biosynthesis of SA, this study employed CO2-MNBs as the sole carbon source for E. coli in anaerobic SA production. The effects of CO2-MNBs on cell growth, product synthesis, CO2 utilization, and enzymatic activities were discussed. The study also investigated the contribution of two-stage fermentation and biofilm-enhanced strains to SA production in a pressurized fermentation system to improve the microbial resilience of CO2-MNBs.

2. Materials and Methods

2.1. Strains and Media

E. coli Suc260 is a derivate of E. coli BER208 (China Center for Type Culture Collection, CCTCC NO: M 2012351), which was screened for its ability to produce succinic acid [30]. The recombinant E. coli Suc260-CsgA strain, featuring enhanced biofilm formation, was developed by inserting the CsgA gene into a plasmid vector and transforming E. coli Suc260. As shown in Figure S1, the intact biofilm of E. coli Suc260-CsgA was observed after crystal violet staining and washing, but E. coli Suc260 did not form biofilm. All strains were stored in 30% (v·v−1) glycerol tubes at −80 °C. The strains were cultured in solid agar medium at 37 °C for 18 h and then stored at 4 °C for later use. These strains were applied to fermentations for SA production in this study.
The inoculum activation medium was LB medium (per liter): 10 g tryptone, 5 g yeast extract, and 10 g NaCl. If a solid culture medium is required, an additional 20 g agar powder should be added.
Secondary seed medium (per liter): 0.12 g betaine, 3.5 g KH2PO4, 6.54 g K2HPO4·3H2O, 3.5 g (NH4)2HPO4, 0.25 g MgSO4·7H2O, 15 mg CaCl2·2H2O, 1.6 g FeCl3·6H2O, 0.2 g CoCl2·2H2O, 0.1 g CuCl2·2H2O, 0.2 g ZnCl2·4H2O, 0.2 g Na2MoO4·2H2O, and 0.05 g H3BO3.
Fermentation medium (per liter): 0.12 g betaine, 2.6 g (NH4)2HPO4, 0.15 g KCl, 0.87 g NH4H2PO4, 0.37 g MgSO4·7H2O, 2.4 g FeCl3·6H2O, 0.3 g CoCl2·2H2O, 0.15 g CuCl2·2H2O, 0.15 g ZnCl2·4H2O, 0.5 g Na2MoO4·2H2O, 0.5 g MnCl2·4H2O, 0.075 g H3BO3, and 0.1 g ampicillin sodium.
All the above media were sterilized at 115 °C for 20 min. Glucose was separately sterilized and added to the media. All final concentrations of glucose were 40 g·L−1.

2.2. MNB Generator and CO2 Pressurized Fermentation System

A tubular metallic membrane with 500 nm pores (with a length of 50 mm and a diameter of 6 mm; Nanjing Membrane Materials Industrial Technology Research Institute, Nanjing, China) was affixed to the base of a stainless-steel conduit, which functioned as a MNB generator (Figure S2). This assembly was inserted in a 5 L fermenter (T&J Bio-engineering Co. Ltd., Shanghai, China). CO2 gas was channeled from a high-pressure cylinder through a pressure reduction valve (set at 0.25 MPa) and an automatic pressure control device (including a gas flow regulator and flow accumulator; XNE-VPA-010V Shanghai SinoHiBio Co., Ltd., Shanghai, China) into the MNB generator. Then, CO2 ultimately passed through the membrane pores, generating MNBs within the aqueous medium.
The pressurized fermentation system was designed. CO2 was aerated to medium in the fermenter through the MNB generator or inlet tube. When the exhaust port of the fermenter was closed, the fermenter pressure was increased. Once the pressure reached a certain value, the CO2 inlet velocity was adjusted to maintain a constant pressure inside the fermenter. When the exhaust port was opened, the pressure decreased to 0.1 MPa (absolute pressure), and the system was returned to the atmospheric fermentation mode.

2.3. The Emission Regularity of CO2-MNBs in a Simulated Fermentation System

In this study, the effect of fermenter pressure (absolute pressure) on the dissolution and emission of CO2-MNBs in the simulated fermentation system was investigated. In this case, the fermenter only contained the medium without microorganisms. The process was operated at 37 °C and 100 rpm, and the total volume of simulated fermentation medium was 3 L; the space volume above the broth in the fermenter was 2.45 L. Firstly, CO2 was supplied by bubble aeration at 375 mL·min−1 for 20 min. The exhaust port was closed when the original air in the fermenter was displaced by CO2. Then, the inlet velocity was set at 313 mL·min−1, the fermenter pressure increased and was kept at a certain pressure, and the different aeration methods were compared in this process. The effects of the inlet velocity of CO2 with different aeration methods were also discussed when the fermenter pressure was controlled at the set value.

2.4. Anaerobic Fermentation for Succinic Acid Production

The activated E. coli cultures (2% v·v−1) were inoculated into a conical flask containing 300 mL of secondary seed medium and cultured aerobically at 37 °C and 180 rpm. After culturing for 18 h, when OD550 ≥ 4, the E. coli cultures (10% v·v−1) were inoculated into the fermenter. The broth volume was 3 L, and the initial glucose concentration was 40 g·L−1. Anaerobic fermentation was conducted at 100 rpm and 37 °C, while the pH was kept at 6.8 by adding KOH solution (4 mol·L−1). CO2 was supplied in the entire fermentation process. When the residual glucose concentration was less than 0.5 g·L−1, the fermentation was completed. The present study primarily encompassed four batch fermentation modes as follows.
Atmospheric fermentation with bubble aeration (AFB): CO2 was supplied to the fermenter using a traditional bubble aeration method at about 150 mL·min−1. CO2 went through a conventional inlet tube connecting the gas distributor, and millimeter-scale bubbles were formed under the shearing action of the stirring. The exhaust pipe was kept open.
Atmospheric fermentation with MNB aeration (AFM): CO2 was supplied to the fermenter using the MNB generator. The other operations were the same as for AFB.
Pressurized fermentation with bubble aeration (PFB): CO2 was supplied to the fermenter using traditional bubble aeration at about 200 mL·min−1. All exhaust ports of the fermenter were closed, and the absolute pressure in the fermenter was raised to 0.18 MPa (absolute pressure) and kept constant by adjusting the inlet velocity of CO2.
Pressurized fermentation with MNB aeration (PFM): CO2 was supplied to the fermenter using the MNB generator. The other operations were the same as for PFB.

2.5. Analytical Methods

2.5.1. Determination of Biomass Concentration and Soluble Component Concentrations

During fermentation, samples were collected periodically from the broth for analysis. The biomass concentration of E. coli in the broth was estimated by measuring the absorbance of E. coli with respect to blank reagent (unused fermentation medium) at 550 nm (OD550) using a UV/Vis spectrophotometer (UV-1200; Hottie, Shanghai, China). The level of glucose was measured using a biosensor analyzer (SS-M-20; Sensep, Nanjing, China). The levels of soluble organic compounds, including SA, formic acid, and acetic acid, were quantified using high-performance liquid chromatography (U3000; Thermo Fisher, Shanghai, China) as reported in [31].

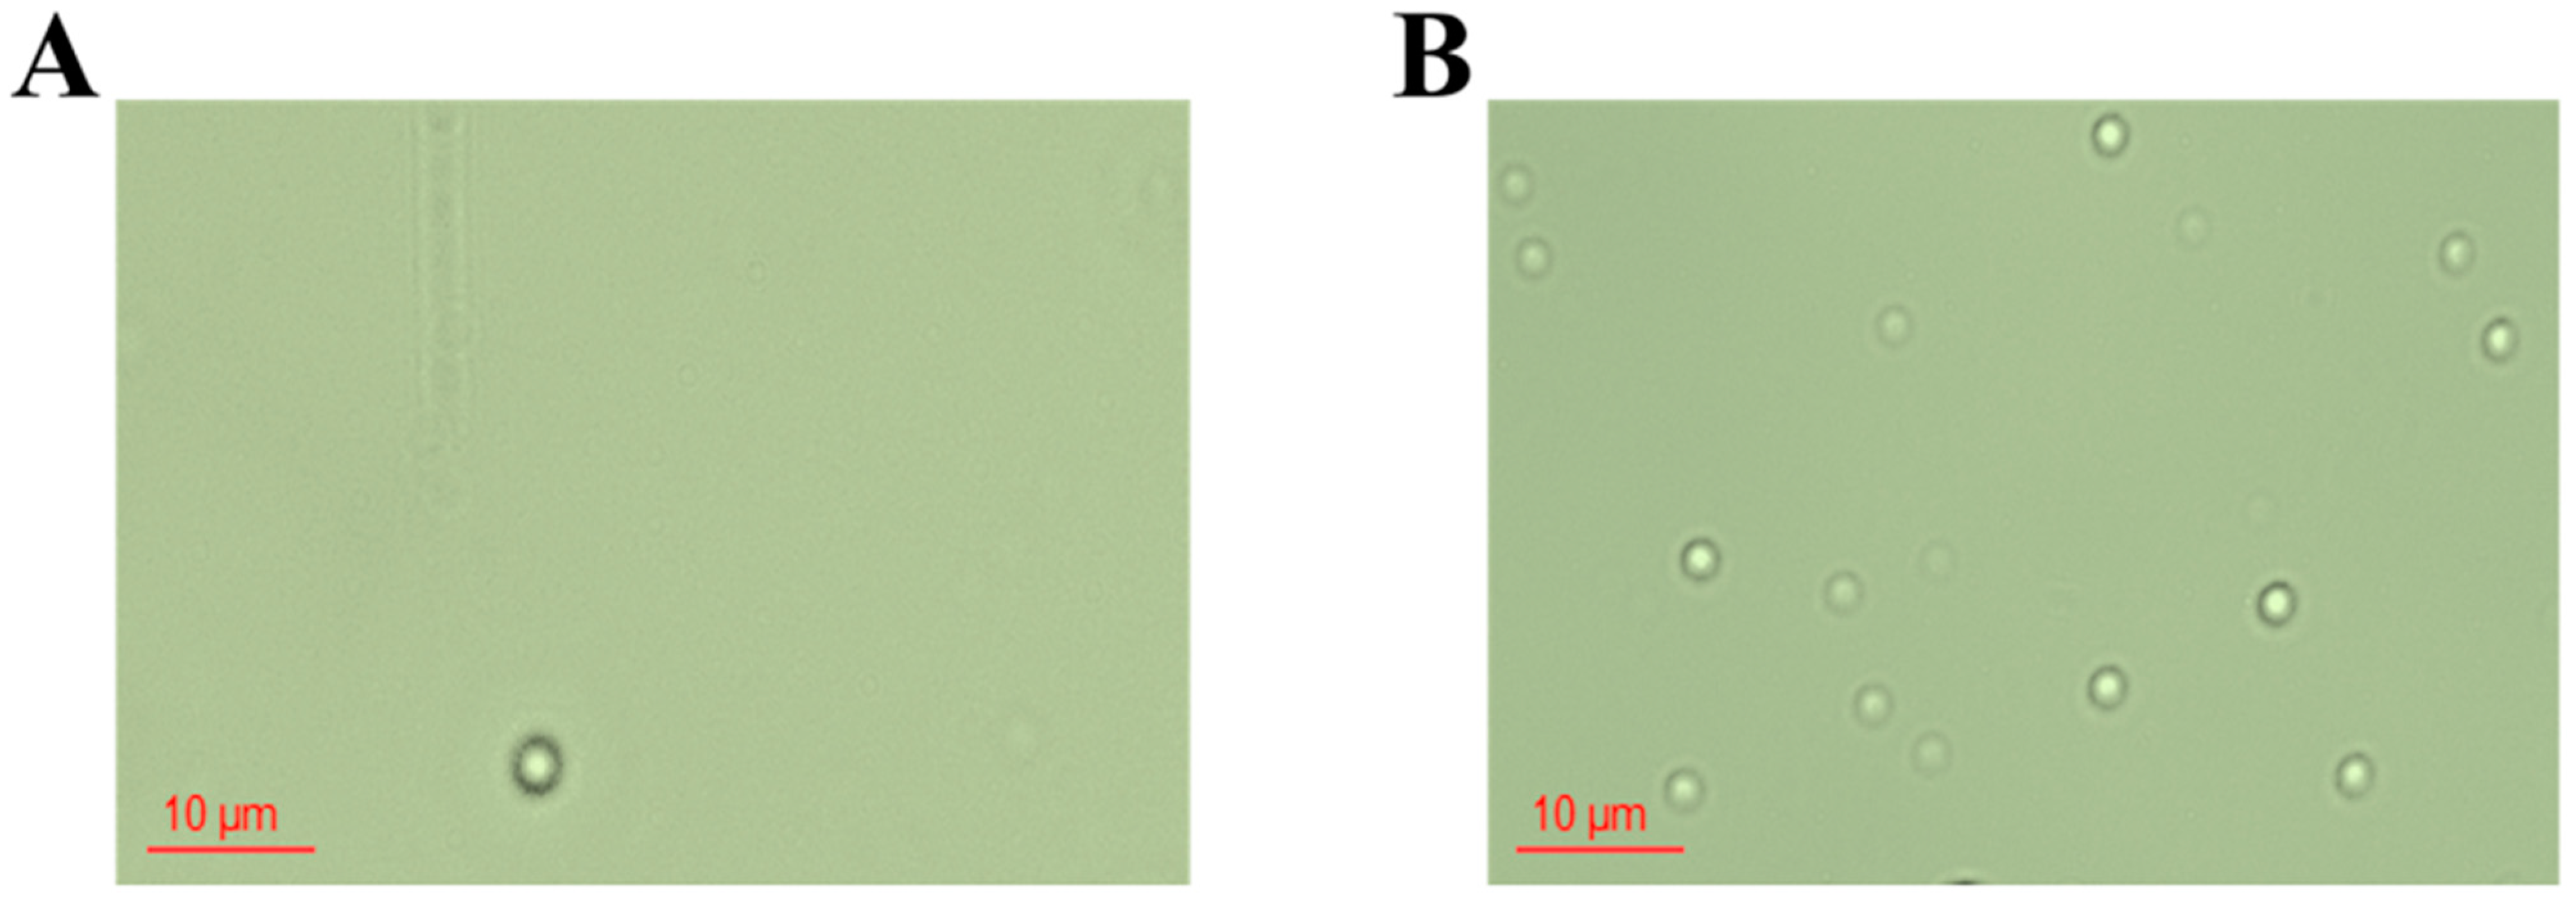
2.5.2. MNB Observation and Counting

A 50 μL sample from the simulated fermentation system was observed under a microscope (DM750; Leica, Wetzlar, Germany) to photograph MNBs. Image J software (Wayne Rasband, v1.54g) was then utilized to count the bubbles and calculate their average diameter within a field of view measuring 1.1086 × 10⁻⁴ cm2.

2.5.3. Key Enzyme Activity Assay

To prepare the cell extract, 10 mL of fermentation broth was periodically taken from the fermenter, and cells were harvested by centrifuging at 12,000 rpm and 4 °C for 10 min. After centrifugation, the supernatant was decanted and the cell precipitate was washed twice with Tris-HCl (pH 7.0) and stored at −80 °C. The washed cell precipitate was re-suspended in cell extraction solution, and the supernatant was placed in an ice bath for ultrasonic treatment for 4–5 min. The supernatant was then centrifuged at 12,000 rpm and 4 °C for 10 min. Then, the supernatant was transferred to another centrifuge tube to be measured.
Key enzyme activities in SA production, such as pyruvate kinase (PK), malate dehydrogenase (MDH), and phosphoenolpyruvate carboxykinase (PCK), were determined using the respective assay kits (G0811F, G0820F, and G0830F; Suzhou Grace Biotechnology Co., Ltd., Suzhou, China) reported in references [32,33,34]. Enzyme activities were calculated by monitoring the change in UV absorbance at 340 nm, which reflected NADH consumption, and converting it to activity units. A quantity of 1 U of enzyme activity is defined as the amount of enzyme necessary to catalyze the conversion of 1 nmol of substrate per min into products. Specific activity was defined as units per milligram of protein. The crude protein concentration was determined by the Bradford method [35].
Carbonic anhydrase (CA) activity was assayed with modifications to the methods described in [36], involving the measurement of pH changes due to enzyme-catalyzed CO2 conversion to bicarbonate, indicated by bromothymol blue. Activity was determined by the time required for solution color change, which was inversely proportional to the enzyme concentration and expressed as unit enzyme activity per milliliter. The CA enzyme activity (UCA) calculation formula is expressed in Equation (1):
U C A = ( t 0 t ) / t
where t0 (uncatalyzed reaction time) and t (catalyzed reaction time) are recorded as the time (s) of color change of the solution in control buffer and in the presence of enzymes, respectively.

2.6. Data Analysis

In the simulated pressurized fermentation system with a constant inlet velocity and the exhaust port kept closed, partial CO2 was released from the system at a constant pressure due to gas leakage of the glass fermenter, so the supplemental inlet velocity required to maintain a constant pressure in the fermenter was the CO2 emission rate.
The CO2 content in the medium in the simulated fermentation system was expressed using Equation (2):
C L = ( V 1 V 2 V 3 ) / V b
where CL is the CO2 content per liter of medium (L·L−1), V1 is the volume of CO2 introduced during the whole process (L), V2 is the volume of leaking CO2 gas in the whole process (L), and V3 is the volume of CO2 gas in the headspace of the fermenter. The CO2 gas volumes in the pressurized system were converted to standard atmospheric pressure values for calculation purposes. Vb is the volume of medium in the simulation system (3 L).
In the atmospheric pressure fermentation mode, the calculation of CO2 utilization (η1) was expressed using Equation (3):
η 1 = n 2 / ( n 1 n 3 )
where η1 is the CO2 utilization (%) in the atmospheric pressure system, n1 is the total amount of CO2 introduced during the fermentation process (mol), and n2 is the amount of CO2 consumed for the synthesis of SA (mol); the amount of CO2 consumed can be calculated from the production of SA, since CO2 is used as the sole donor in this fermentation system. n3 (mol) is the amount of CO2 in the ullage of the fermenter (2.45 L).
In the pressurized fermentation mode, the CO2 utilization was expressed using Equation (4):
η 2 = n 2 / ( n 1 n 3 n 4 )
where η2 is the actual CO2 utilization (%) in the pressurized fermentation mode and n4 is the total amount of leaking CO2 gas (mol). The CO2 volumes in the pressurized system were converted to standard atmospheric pressure values for calculation purposes.

2.7. Statistical Analysis

The results of the experiment were analyzed statistically. The significance of the experimental results was confirmed by analysis of variance (ANOVA) via SAS Version 16.0 (SPSS Inc., Chicago, IL, USA). The treatment effect in this experiment was considered significant at p < 0.05.

3. Results and Discussion

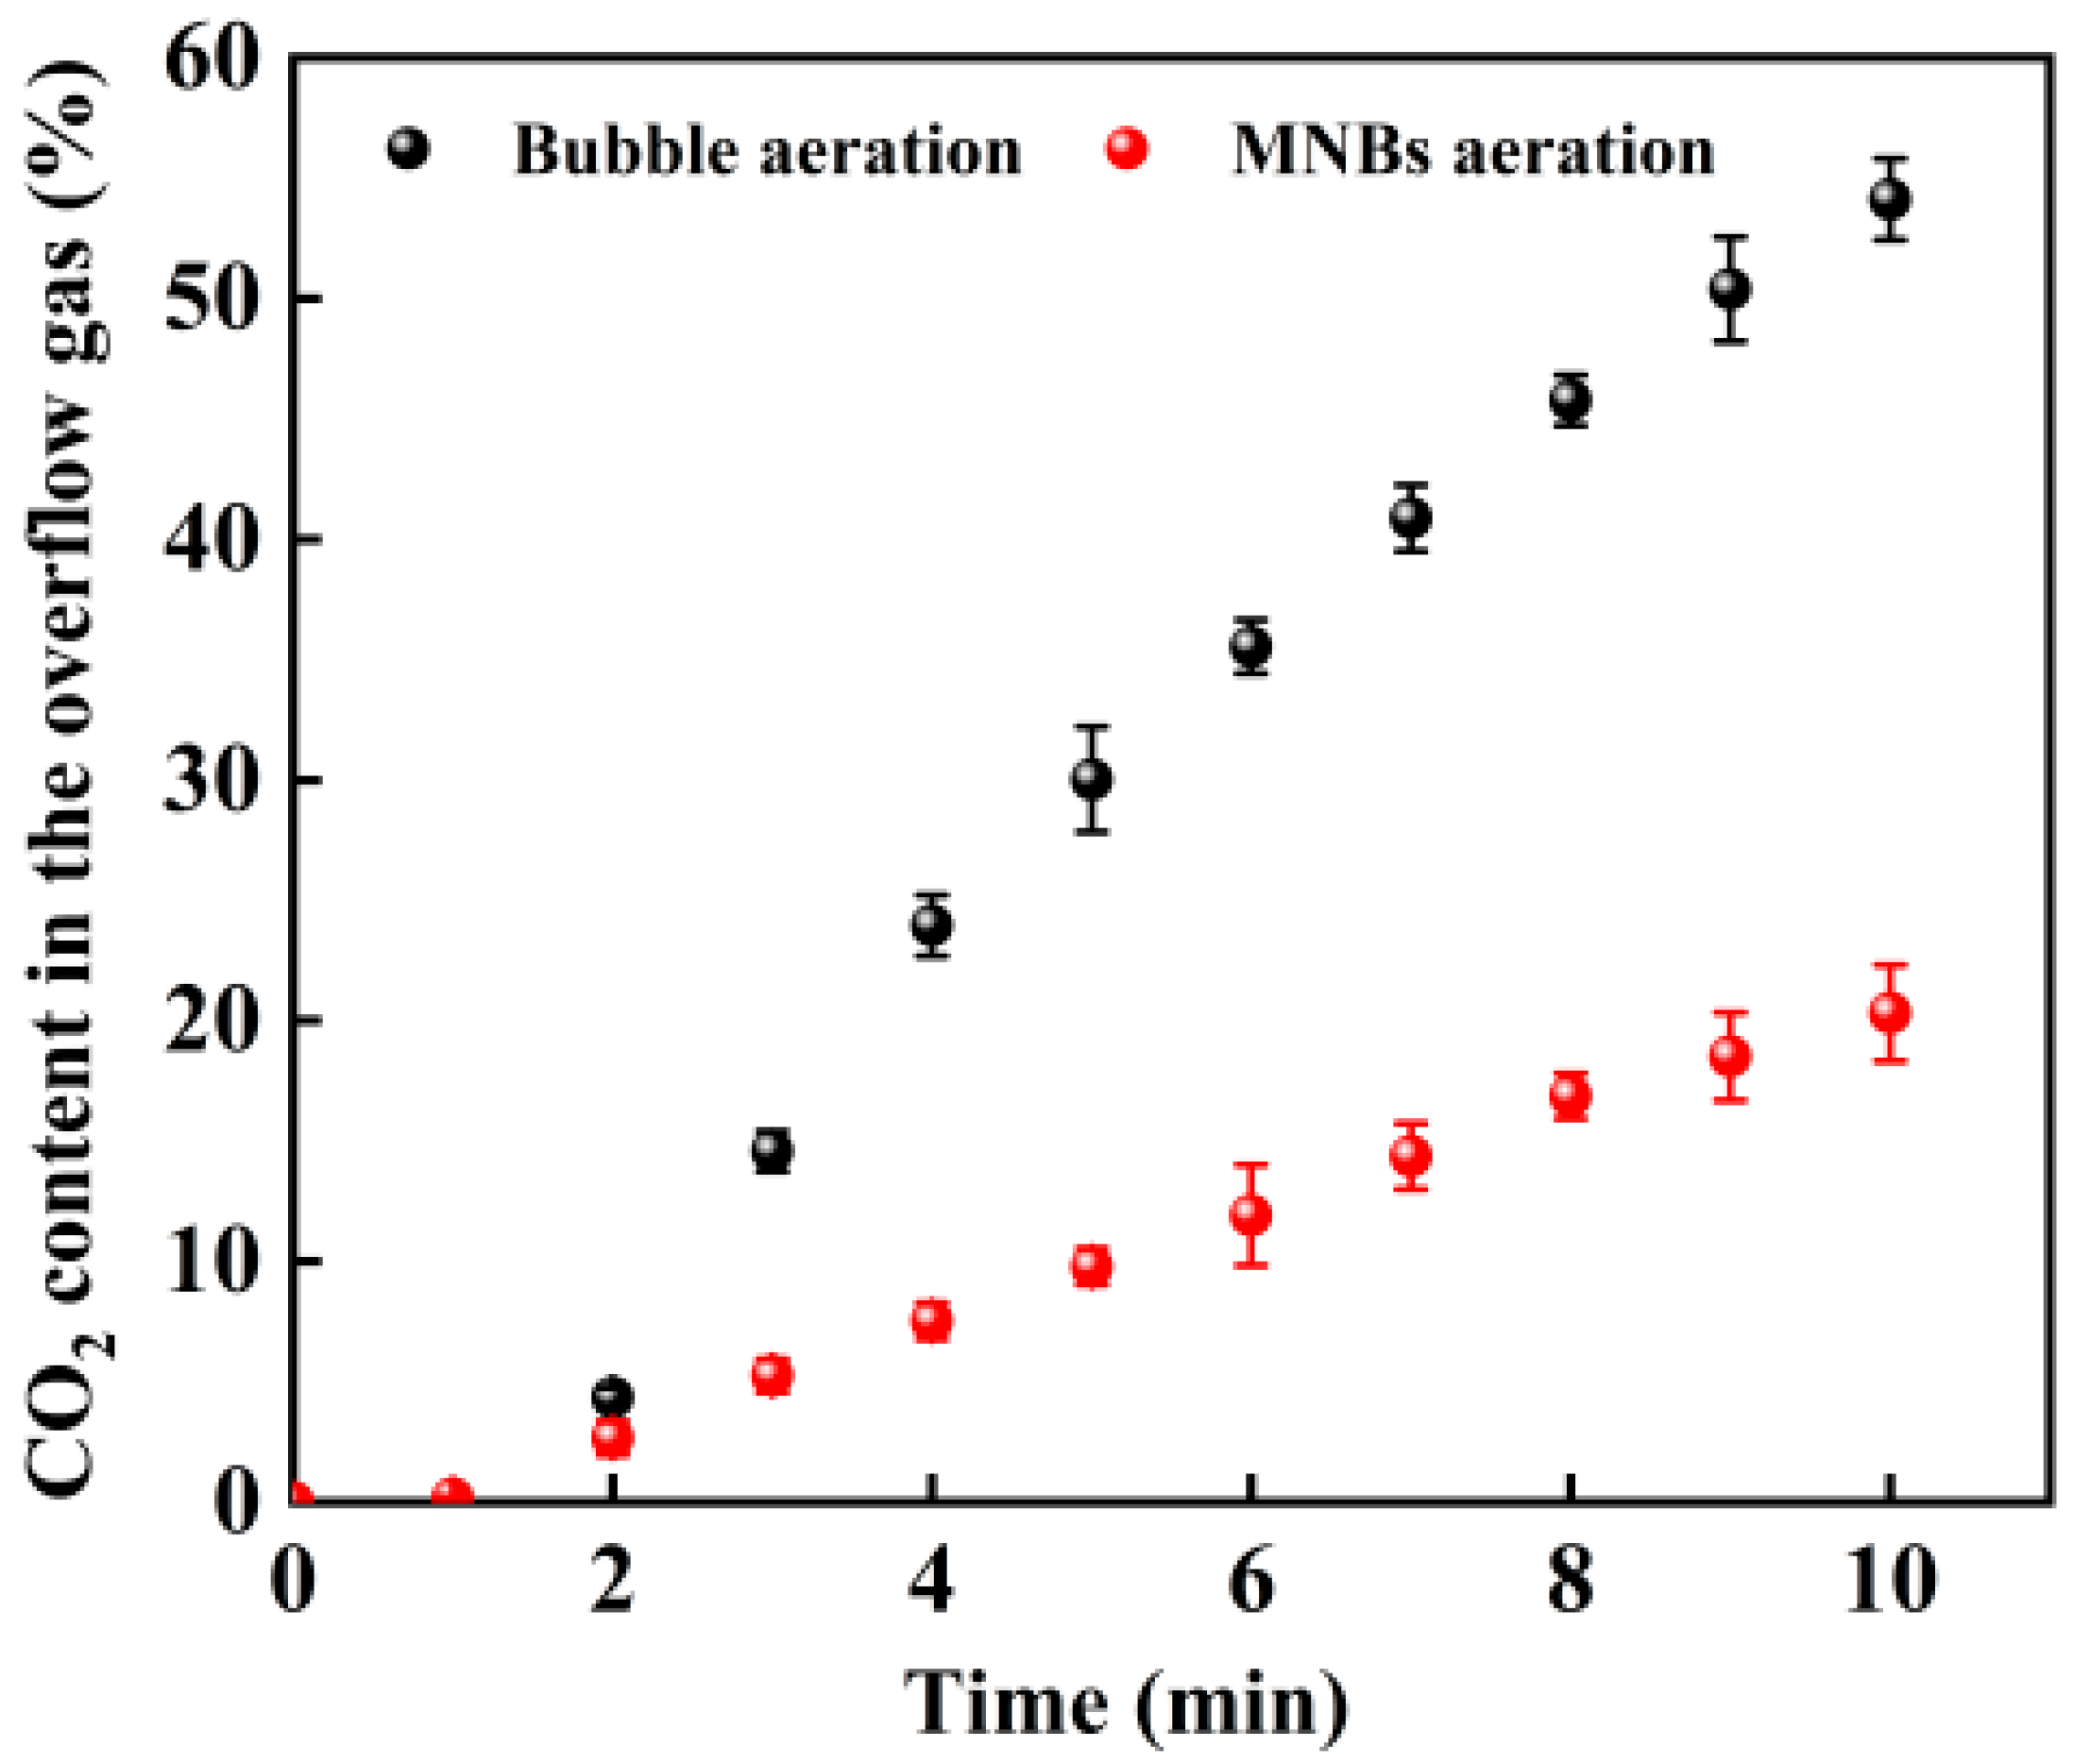
3.1. Comparison of Bubble Aeration and MNB Aeration for CO2 Release in the Simulated Atmospheric Fermentation System

The ventilated rate of CO2 was controlled at 200 mL·min−1 (0.067 vvm) in the simulated fermentation system for 10 min at 0.1 MPa. The changes in CO2 concentration in the emission gas with different aeration methods are shown in Figure 1.
With increasing time, the CO2 emission rate under bubble aeration gradually increased and was significantly higher than that under MNB aeration. The CO2 concentration in the escaped gas of bubble aeration was 166.5% higher than that of MNB aeration at the 10th min. This indicated that MNBs had an obvious slow-release effect on CO2 emission, which could effectively delay the residence time of CO2 in water and increase the solubility of CO2 in water. The effects of the two aeration methods on the quantity and morphology of MNBs were observed (Figure 2). The number of CO2-MNBs produced by MNB aeration was significantly higher than that produced by bubble aeration because of the long-term stability of MNBs in water and thus increased the residence time of CO2 in the medium.

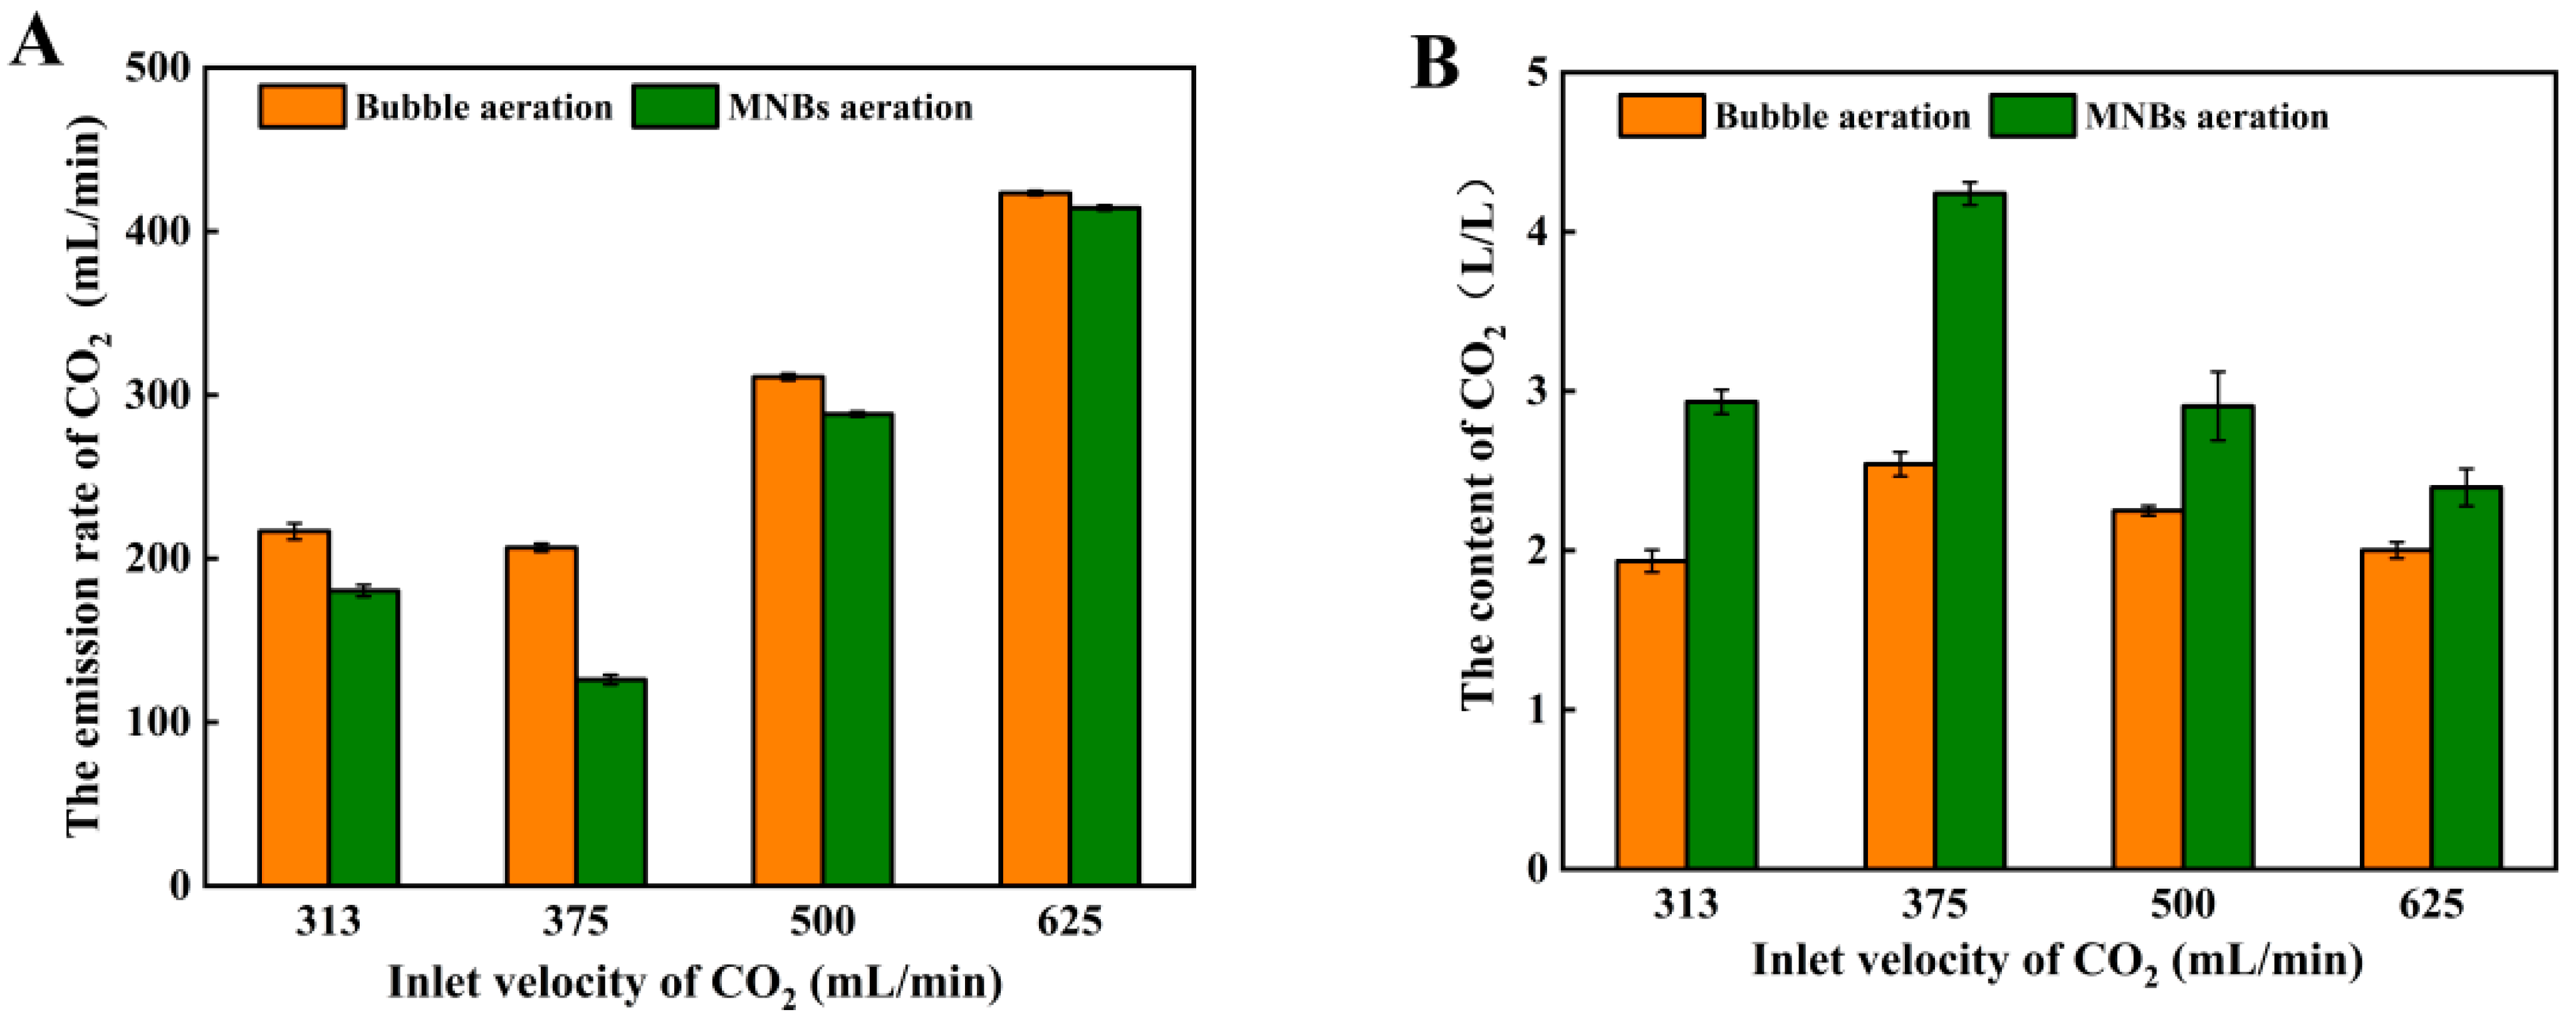
3.2. Effect of Pressure and Inlet Velocity on CO2 Release in the Pressurized Simulated Fermentation System

When bacteria consume CO2, HCO3 and CO32− can be converted into dissolved CO2, which also depends on the partial pressure of the system [37]. It is well known that increasing pressure can significantly improve the solubility of CO2 in liquid phase [38]. The effects of pressure on CO2 release with different aeration methods were discussed. The ventilated rate of CO2 was controlled at 313 mL·min−1 in the simulated fermentation system for 10 min.
With the increase in pressure, the emission rate of CO2 in the simulated fermentation system increased gradually. Under the same pressure, the CO2 emission rate of MNB aeration was always lower than that of bubble aeration (Figure 3A). At 0.14 MPa, MNB aeration reduced CO2 release by 60.16% compared to bubble aeration, and at 0.18 MPa, the reduction was 17.39%. Regardless of the pressure, the CO2 concentration in the medium with MNB aeration exceeded that of the bubble aeration methods, with the improvement becoming more significant at higher pressures. At 0.18 MPa, the CO2 content achieved 2.14 L·L−1 (Figure 3B), which was 36.31% higher than that under bubble aeration and 2.80 times the solubility of CO2 in water at 0.1 MPa (0.563 L·L−1, 37 °C).
Microscopic images of the CO2-MNBs in water under different fermenter pressures were compared. The number of CO2-MNBs in the water increased with increasing pressure under the different aeration methods. However, many bubbles aggregated in the bubble aeration mode and small bubbles fused together to form larger bubbles (Figure 4A), which accelerated CO2 emissions. Compared with bubble aeration, MNB aeration produced a larger number of CO2-MNBs with smaller sizes; they were evenly distributed in the medium (Figure 4B) and had better stability. It was conducive to slow down the emission rate of CO2 bubbles in the water. Due to the pressure resistance of the glass fermenter, the operation pressure was controlled at 0.18 MPa in subsequent experiments.
CO2 release at various inlet velocities with different aeration methods was also compared at 0.18 MPa. It was observed that CO2 emission under bubble aeration was higher than that under MNB aeration (Figure 5A) and that the opposite was the case for the CO2 content in the respective media (Figure 5B). When the inlet velocity was 375 mL·min−1, the CO2 emission rate of MNB aeration reached a minimum value of 126 mL·min−1 and the maximum content of CO2 in the medium was 4.24 L·L−1. However, further increasing the inlet velocity aggravated CO2 emission; the difference between these aeration methods was not significant.
The data presented in Table S1 demonstrated that the maximum number of MNBs observed in the microscope field of view was 455 ± 1 × 10⁴ bubbles·cm−2 when the inlet velocity of CO2 was 375 mL·min−1. The MNB number decreased obviously with the increase in the inlet velocity, and the average diameter of MNBs also increased in this process. Too high an inlet velocity reduced the contact time between the gas and water phases, which was unfavorable to CO2 dissolution. The collisions between MNBs were also aggravated at higher velocities, where tiny bubbles might merge into larger bubbles, thereby accelerating CO2 emission. Consequently, the inlet velocity of 375 mL·min−1 was selected for subsequent pressurized fermentations.

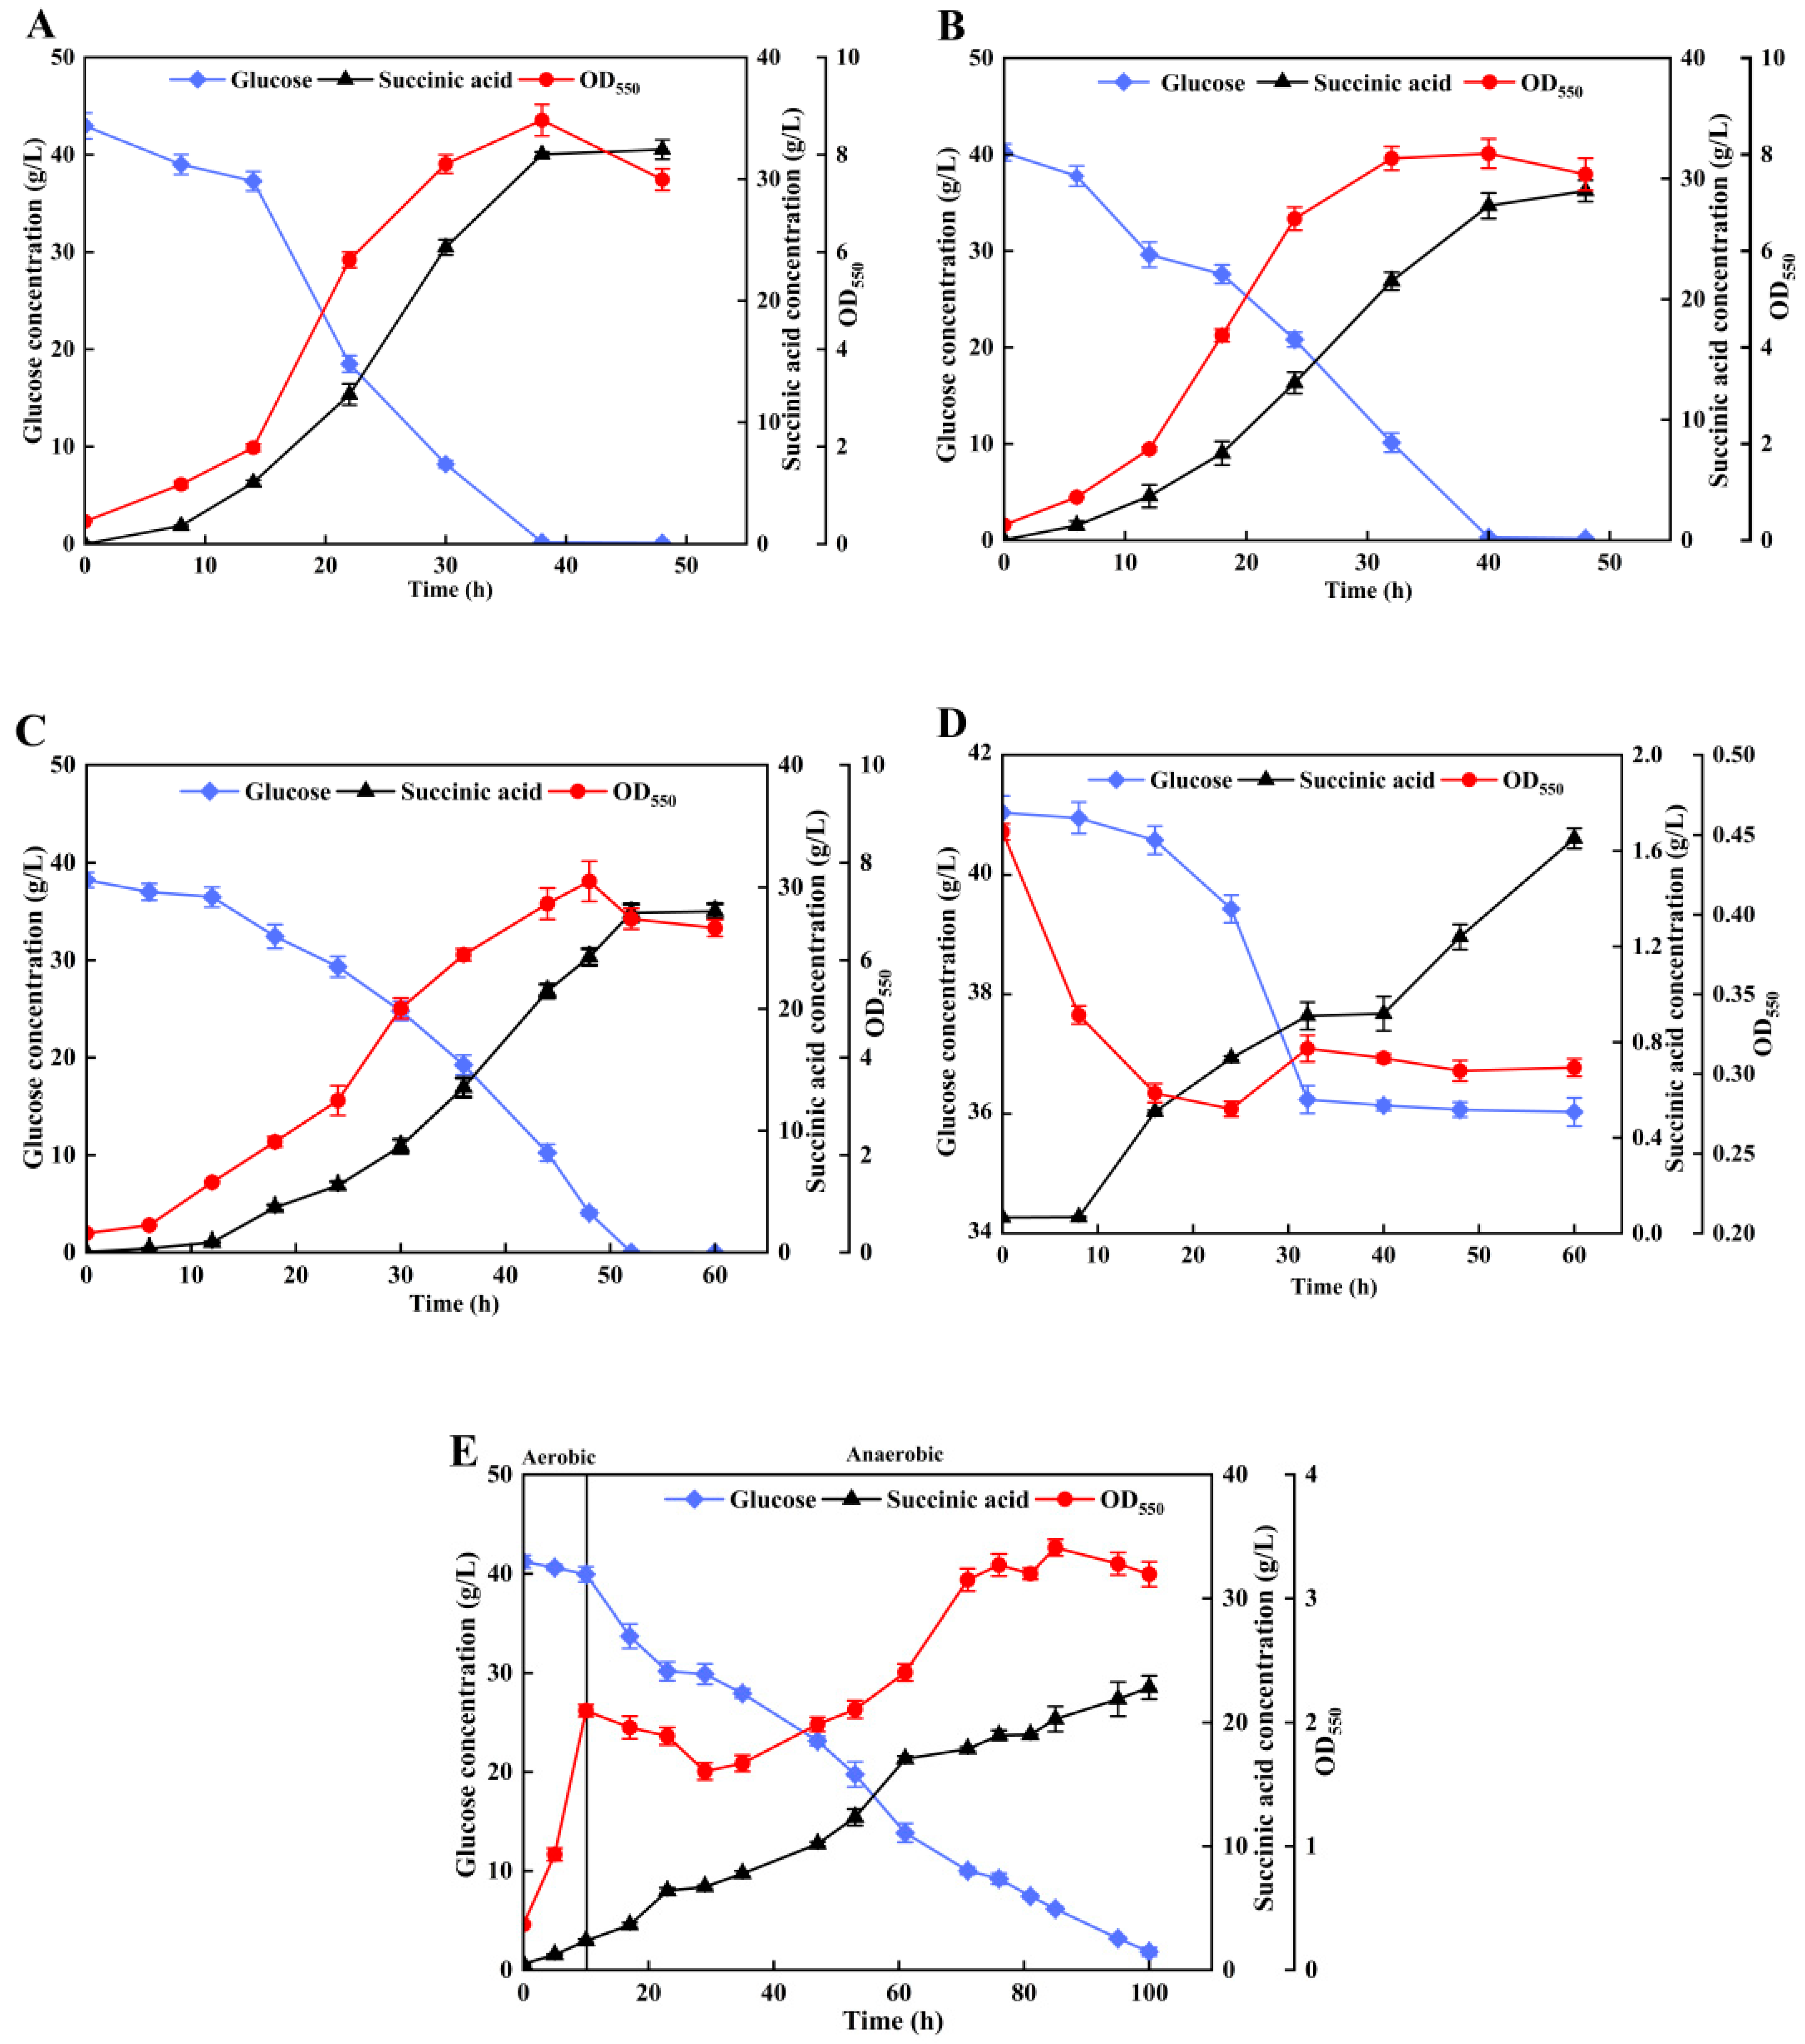
3.3. Effects of MNBs on Anaerobic Synthesis of SA by Escherichia coli

In the biosynthesis of SA, CO2 serves as a central direct substrate and exerts a significant influence on the regulation of metabolic flux and product quality distribution [39]. The previous results indicated that MNBs could significantly reduce the emission of CO2 in the medium. The fermentation processes of anaerobic synthesis of SA by E. coli Suc260 with different CO2 supply methods are shown in Figure 6. The results of SA production and CO2 utilization are compared in Table 1.
Within 48 h, 40 g·L−1 glucose was consumed and the SA yield was 0.852 g·g−1 in the AFB mode, but the CO2 utilization was only 4.85%. When bubble aeration was replaced by MNB aeration at atmospheric pressure, this process showed a slight decrease in SA production (Table 1) and an 8.6% decrease in biomass compared with AFB (Figure 6A,B). But the supply of extracellular CO2 was enhanced by MNB aeration; the CO2 utilization of the AFM mode (11.14%) was 129.69% higher than that of the AFB mode.
Increasing the partial pressure of CO2 could enhance the supply of extracellular CO2 for an increase in gas solubility. In the PFB mode, the biomass decreased by 12.5% (Figure 6C); the pressurized environment might have exerted a slight inhibition on the growth of the strain. SA productivity also reduced from 0.66 g·L−1·h−1 to 0.54 g·L−1·h−1, but the SA yield was similar to that of the AFB mode, and CO2 utilization increased to 14.50%.
However, when CO2 was supplied via MNB aeration, as illustrated in Figure 6D, the biomass in the PFM system ultimately declined after inoculation, which resulted in the consumption of only 3 g·L−1 glucose after 60 h, with the OD550 decreasing from 0.452 to 0.302. SA production stagnated under the PFM mode. Guo et al. reported that MNBs had an inhibitory effect on the growth of Sinomicrobium oceani WH-15 when the MNB concentration in water exceeded 20% [40]. With a greater number of CO2-MNBs distributed in the medium at higher pressure, pressurization would promote the dissolution of CO2-MNBs. Toyohisa et al. reported that hydroxyl radicals were generated during the rupture of CO2-MNBs [24]. Therefore, more hydroxyl radicals will be produced under the PFM mode than the AFM mode when MNB aeration is used for CO2 supply. This might lead to a serious inhibitory effect on E. coli Suc260.

3.4. Reducing Inhibition of SA Production by MNBs Using a Two-Stage Aerobic–Anaerobic Fermentation Strategy

During the initial phase of fermentation, cell growth enters a lag period in which the cells are particularly susceptible to extrinsic perturbations from the growth environment, potentially inhibiting their proliferation. Oxygen is critical to the physiology and metabolism of E. coli, affecting cellular processes under both aerobic and anaerobic conditions. In the aerobic phase, E. coli consumes oxygen to boost metabolic efficiency and growth, resulting in optimal cell proliferation and a dense cell population [41]. A two-stage fermentation strategy (TSF) facilitates a smooth transition to the anaerobic phase, minimizes the lag phase, and enhances the synthesis of SA [42]. Thus, this strategy might increase the MNB tolerance of cells and improve fermentation efficiency.
In the TSF process, aerobic culture with bubble aeration led to a rapid increase in biomass (OD550 = 2.095) in 10 h (Figure 6E), with 1.29 g·L−1 glucose consumed. Then, the MNB generator aerated CO2 for the anaerobic fermentation; the pressure was also raised and controlled at 0.18 MPa. The biomass decreased immediately and returned to growth after 10 h, and the maximum OD550 was 3.4. Finally, almost all the glucose was consumed and 22.83 g·L−1 of SA was produced in the end. Although SA yield and productivity decreased, the CO2 utilization improved by 189.28% compared with the AFB mode. These results indicated that the TSF mode weakened the negative effect of MNBs on E. coli Suc260, but SA production did not fully recover.

3.5. Synthesis of SA by Biofilm-Enhanced Strains with CO2 MNB Supply

Amyloid fibrin (curli) proteins, integral components of bacterial biofilms, are instrumental in significantly enhancing bacterial adhesion, colonization, and stress resistance [43]. The synthesis of curli proteins activates the endogenous extracellular polysaccharide matrix synthesis pathway, thereby facilitating biofilm formation [44]. CsgA, the primary structural subunit of amyloid fibrin, was genetically introduced, resulting in a pronounced enhancement of biofilm-forming capabilities. The resulting biofilms exhibited superior thickness and compactness compared to the progenitor strain, effectively augmenting resilience against adverse environmental conditions [45]. The SA-producing strain E. coli Suc260-CsgA engineered in the previous work was used for SA production in this study (Figure 7 and Table 2).
Glucose was completely consumed within 53 h in all fermentation modes. When the pressure was increased to 0.18 MPa in the PFB mode, the OD550 increased to 8.84 at 48 h (Figure 7B) and the SA yield improved to 0.865 g·g−1. This result indicated that pressurization did not negatively affect the production capacity of E. coli Suc260-CsgA, which was consistent with that reported by Amulya et al. [46]. CO2 utilization was also increased by 247.19% in the PFB mode.
Furthermore, pressurized fermentation with MNB aeration was not weakened; the yield of SA achieved was 0.873 g·g−1. Although the biomass (Figure 7C) decreased by 19.32% and 22.51% compared to the AFB and PFB modes (Figure 7A,B), CO2 utilization (30.63%) increased 6.49 times and 1.16 times, respectively. The CO2 requirement for SA synthesis was reduced from 7.34 g·g−1 (AFB mode) to 1.22 g·g−1 (PFM mode). In comparison, Jiang et al. achieved high-level SA production (101.3 g·L−1) using E. coli AFP111 through a fed-batch strategy, utilizing over 2854 g of CO2 [17]. This required more than 9.4 g of CO2 per 1 g of SA, which was 7.7 times higher than the CO2 requirement in the PFM mode of this study. This suggested that CO2 utilization of the biofilm-enhanced strain could be improved significantly by CO2-MNBs, which would be favorable for carbon emission reduction in production. No carbonates or bicarbonates were added in this SA synthesis process, and the SA yield was slightly above that of the control (0.85 g·g−1; K2CO3 and CO2 were both used as CO2 donors in the AFB mode; Figure S3). An additional increase in substrate concentration was investigated in pressurized fermentation with MNB aeration (Figure S4). After 120 h of fermentation, 80 g/L of glucose was completely consumed, the yield of SA was 0.90 g·g−1, and CO2 utilization remained at 30.64%. Although the productivity (0.48 g·L−1·h−1) decreased compared with the low substrate concentration (0.57 g·L−1·h−1), the biofilm-enhanced strain still showed satisfactory production performance under high-substrate-concentration conditions, which indicated that CO2-MNBs could be completely substituted for carbonate or bicarbonate in SA biosynthesis.

3.6. Metabolic Analysis of SA Synthesis with Different CO2 Supply Methods

Cellular metabolic reactions are catalyzed by specific enzymes, with enzymatic activity indicative of reaction velocity. The influences of CO2 supply methods were also discussed in this work. The activities of key enzymes of E. coli in SA synthesis are shown in Table 3.
PCK facilitates the forward reaction for SA production in E. coli, as well as its own gluconeogenic reverse reaction [47]. The biofilm-enhanced strain Suc260-CsgA demonstrated superior SA production performance in all pressurized fermentation modes; the PCK activities were similar to those of the Suc260 strain in the AFB mode. Particularly, the MNB aeration led to a remarkable 35.64 times increase in the PCK activity of E. coli Suc260-CsgA compared to E. coli Suc260.
MDH plays a crucial role in both the TCA cycle and the noncyclic anaplerotic pathway; it facilitates the reversible conversion between malate and OAA, accompanied by a reduction in NAD+ to NADH or the oxidation of NADH to NAD+ [48]. The MDH activities of E. coli Suc260-CsgA were all higher than those of E. coli Suc260 under the three different CO2 supply modes examined in this work. Its MDH activity was 29.91 times higher than that of E. coli Suc260 in the PFM mode. NAD+ and NADH levels in E. coli increase with the increase in MDH activities, which could enhance SA production [49].
PK is a crucial regulatory enzyme in glycolysis, pivotally influencing ATP production. As a significant precursor initiating the TCA cycle, augmented pyruvate synthesis escalates the conversion to acetyl coenzyme A, thereby amplifying SA synthesis within the cycle [50]. In the AFB mode, the enzyme activities of Suc260 and Suc260-CsgA exhibited comparable trends. However, increasing the pressure severely inhibited the growth of E. coli Suc260 in the PFB mode; its PK activity was reduced by 36.02%, and it further decreased by 94.75% when CO2 was supplied by MNBs. In contrast, E. coli Suc260-CsgA exhibited excellent tolerance in the PFM mode; the PK activity decreased by only 13.62% compared to the AFB mode.
CA reversibly catalyzes the conversion of CO2 to HCO3 [51]. Enhancing the properties of CA increases the ability to capture CO2, which facilitates carboxylation reactions and OAA synthesis by PCK, so it would lead to higher SA production [52]. A positive correlation was observed between the activity of CA and the actual CO2 utilization (Table 3). The CA activities of E. coli Suc260 and E. coli Suc260-CsgA were increased by 65.49% and 63.11% in the PFB mode compared with the AFB mode. Even in the PFM mode, the CA activity of E. coli Suc260-CsgA was 3.18 times and 0.54 times higher than that in the other fermentation modes. This indicated that increasing CO2 dissolution in the medium could improve the effective extracellular supply of CO2, which would enhance the activity of CA and promote the synthesis of SA. It should be noted that the CA activity of E. coli Suc260 was almost completely deactivated because cells were greatly inhibited by MNBs in the PFM mode.
In conclusion, the impacts of CO2 supply methods on the key enzymes in the SA synthesis pathway demonstrated that the biofilm-enhanced strain adapted well to MNBs and took advantage of increasing CO2 solubility, such that SA production efficiency was maintained under MNB aeration supply.

4. Conclusions

This study presents a novel approach to enhance the extracellular supply of CO2 during bio-SA production. MNB aeration not only prolonged the residence time of CO2 in the medium but also increased its solubility. Although MNBs had an inhibitory effect on E. coli growth, the biofilm-enhanced strain showed strong tolerance to CO2 MNBs in the pressurized fermentation. SA production performance remained stable without the addition of carbonate or bicarbonate in the fermentation process. The actual CO2 utilization of E. coli Suc260-CsgA in the PFM mode was 30.63%, which was 6.49 times higher than in the AFB mode. The CO2 requirement for SA synthesis decreased by 83.4%, which also indicated that CO2 fugitive emission in microbial carbon sequestration was successfully controlled.

Supplementary Materials

The following supporting information can be downloaded at: https://www.mdpi.com/article/10.3390/fermentation11010031/s1, Figure S1: Crystalline violet staining of E. coli after formation of biofilm. (A) Negative control. (B) E.coli Suc260. (C) E.coli Suc260-CsgA; Figure S2: MNB generator device; Table S1: Effect of inlet velocity on the number and mean diameter of MNBs under MNB aeration; Figure S3: Succinic acid production during batch fermentation by biofilm-enhanced strain E. coli Suc260-CsgA in the AFB mode. (pH was kept at 6.8 by adding 2 mol·L−1 KOH and 2 mol·L−1 K2CO3 solution; CO2 and K2CO3 were used as CO2 donors in this process.); Figure S4: Succinic acid production during batch fermentation by biofilm-enhanced strain E. coli Suc260-CsgA in the PFM mode. (The initial glucose concentration was 80 g·L−1, and 4 mol·L−1 KOH was added to achieve an appropriate pH adjustment).

Author Contributions

H.W.: Conceptualization, Funding acquisition, Methodology, Project administration, Resources, Writing—review and editing. Y.C.: Conceptualization, Data curation, Investigation, Writing—original draft. Q.H. and J.L.: Data curation, Investigation. L.W.: Data curation, Investigation. Y.P.: Data curation, Investigation. A.X.: Resources, Methodology. W.Z.: Resources, Writing—review. M.J.: Resources, Supervision. All authors have read and agreed to the published version of the manuscript.

Funding

This work was supported by the National Natural Science Foundation of China (grant number 22278222).

Data Availability Statement

The original contributions presented in the study are included in the article and Supplementary Materials; further inquiries can be directed to the corresponding author.

Conflicts of Interest

The authors declare no conflicts of interest.

References

  1. Liu, Z.; Wang, K.; Chen, Y.; Tan, T.; Nielsen, J.H. Third-generation biorefineries as the means to produce fuels and chemicals from CO2. Nat. Catal. 2020, 3, 274–288. [Google Scholar] [CrossRef]
  2. Erickson, B.; Nelson, J.E.; Winters, P.C. Perspective on opportunities in industrial biotechnology in renewable chemicals. Biotechnol. J. 2012, 7, 176–185. [Google Scholar] [CrossRef] [PubMed]
  3. Yu, J.; Zhu, L.; Xia, S.; Li, H.; Tang, Y.; Liang, X.; Chen, T.; Tang, Y. Combinatorial optimization of CO2 transport and fixation to improve succinate production by promoter engineering. Biotechnol. Bioeng. 2016, 113, 1531–1541. [Google Scholar] [CrossRef] [PubMed]
  4. Zhang, Q.; Nurhayati; Cheng, C.-L.; Nagarajan, D.; Chang, J.S.; Hu, J.; Lee, D.-J. Carbon capture and utilization of fermentation CO2: Integrated ethanol fermentation and succinic acid production as an efficient platform. Appl. Energy 2017, 206, 364–371. [Google Scholar] [CrossRef]
  5. Zou, W.; Zhu, L.; Li, H.; Tang, Y. Significance of CO2 donor on the production of succinic acid by Actinobacillus succinogenes ATCC 55618. Microb. Cell Factories 2011, 10, 87. [Google Scholar] [CrossRef]
  6. McKinlay, J.B.; Vieille, C. 13C-metabolic flux analysis of Actinobacillus succinogenes fermentative metabolism at different NaHCO3 and H2 concentrations. Metab. Eng. 2008, 10, 55–68. [Google Scholar] [CrossRef]
  7. Amulya, K.; Mohan, S.V. Green hydrogen based succinic acid and biopolymer production in a biorefinery: Adding value to CO2 from acidogenic fermentation. Chem. Eng. J. 2022, 429, 132163. [Google Scholar] [CrossRef]
  8. Jin, T.; Wang, Y.; Yao, S.; Hu, C.; Ma, T.; Xia, W. Bioconversion of carbon dioxide to succinate by Citrobacter. Chem. Eng. J. 2023, 452, 139668. [Google Scholar] [CrossRef]
  9. Yang, Y.; Zhao, J.; Zhou, Y.; Xu, S.; Ren, X.; Wei, Q. Progress on production of succinic acid by Actinobacillus succinogenes-New opportunities for cheap biomass and waste gas utilization. J. Clean. Prod. 2024, 434, 140005. [Google Scholar] [CrossRef]
  10. Xi, Y.; Chen, K.; Li, J.; Fang, X.; Zheng, X.; Sui, S.; Jiang, M.; Wei, P. Optimization of culture conditions in CO2 fixation for succinic acid production using Actinobacillus succinogenes. J. Ind. Microbiol. Biotechnol. 2011, 38, 1605–1612. [Google Scholar] [CrossRef] [PubMed]
  11. Nghiem, N.P.; Senske, G.E. Capture of carbon dioxide from ethanol fermentation by liquid absorption for use in biological production of succinic acid. Appl. Biochem. Biotechnol. 2015, 175, 2104–2113. [Google Scholar] [CrossRef]
  12. Pateraki, C.; Patsalou, M.; Vlysidis, A.; Kopsahelis, N.; Webb, C.; Koutinas, A.A.; Koutinas, M. Actinobacillus succinogenes: Advances on succinic acid production and prospects for development of integrated biorefineries. Biochem. Eng. J. 2016, 112, 285–303. [Google Scholar] [CrossRef]
  13. Song, H.; Lee, J.W.; Choi, S.J.; You, J.K.; Hong, W.H.; Lee, S.Y. Effects of dissolved CO2 levels on the growth of Mannheimia succiniciproducens and succinic acid production. Biotechnol. Bioeng. 2007, 98, 1296–1304. [Google Scholar] [CrossRef] [PubMed]
  14. Mota, M.J.; Lopes, R.P.; Simões, M.M.Q.; Delgadillo, I.; Saraiva, J.A. Effect of high pressure on paracoccus denitrificans growth and polyhydroxyalkanoates production from glycerol. Appl. Biochem. Biotechnol. 2019, 188, 810–823. [Google Scholar] [CrossRef]
  15. Cao, W.; Wang, Y.; Luo, J.; Yin, J.; Xing, J.; Wan, Y. Effectively converting carbon dioxide into succinic acid under mild pressure with Actinobacillus succinogenes by an integrated fermentation and membrane separation process. Bioresour. Technol. 2018, 266, 26–33. [Google Scholar] [CrossRef]
  16. Wu, H.; Li, Q.; Li, Z.; Ye, Q. Succinic acid production and CO2 fixation using a metabolically engineered Escherichia coli in a bioreactor equipped with a self-inducing agitator. Bioresour. Technol. 2012, 107, 376–384. [Google Scholar] [CrossRef]
  17. Jiang, M.; Liu, S.; Ma, J.; Chen, K.; Yu, L.; Yue, F.; Xu, B.; Wei, P. Effect of growth phase feeding strategies on succinate production by metabolically engineered Escherichia coli. Appl. Environ. Microbiol. 2010, 76, 1298–1300. [Google Scholar] [CrossRef] [PubMed]
  18. Seridou, P.; Kalogerakis, N. Disinfection applications of ozone micro-and nanobubbles. Environ. Sci. Nano 2021, 8, 3493–3510. [Google Scholar] [CrossRef]
  19. Sun, L.; Zhang, F.; Guo, X.; Qiao, Z.; Zhu, Y.; Jin, N.; Cui, Y.; Yang, W. Research progress on bulk nanobubbles. Particuology 2022, 60, 99–106. [Google Scholar] [CrossRef]
  20. Li, M.; Zhu, Z.; Zhou, M.; Jie, X.; Wang, L.; Kang, G.; Cao, Y. Removal of CO2 from biogas by membrane contactor using PTFE hollow fibers with smaller diameter. J. Membr. Sci. 2021, 627, 119232. [Google Scholar] [CrossRef]
  21. Wu, H.; Liao, J.; Chen, X.; Ren, X.; Zhou, J.; Jiang, M. Decarbonization of simulated biogas with microchannel mixer by pressurized water scrubbing. J. Clean. Prod. 2024, 457, 142230. [Google Scholar] [CrossRef]
  22. Cerrón-Calle, G.A.; Magdaleno, A.L.; Graf, J.C.; Apul, O.G.; Garcia-Segura, S. Elucidating CO2 nanobubble interfacial reactivity and impacts on water chemistry. J. Colloid Interface Sci. 2022, 607, 720–728. [Google Scholar] [CrossRef] [PubMed]
  23. Abdella, A.A.K.; Xiaonan, S.; Likun, H.; Leidy, M.; Weihua, Q.; Taha, M.; Wen, Z. Influences of Air, Oxygen, Nitrogen, and Carbon Dioxide Nanobubbles on Seed Germination and Plant Growth. J. Agric. Food Chem. 2018, 66, 5117–5124. [Google Scholar] [CrossRef]
  24. Toyohisa, F.; Hiromi, K.; Zhenyao, H.; Yali, Z.; Hirofumi, M.; Josiane, P.; Gjergj, D.; Chunlin, H.; Yuezou, W. Free radical degradation in aqueous solution by blowing hydrogen and carbon dioxide nanobubbles. Sci. Rep. 2021, 11, 3068. [Google Scholar] [CrossRef]
  25. Zhang, Z.; Wang, S.; Cheng, L.; Ma, H.; Gao, X.; Brennan, C.S.; Yan, J. Micro-nano-bubble technology and its applications in food industry: A critical review. Food Rev. Int. 2023, 39, 4213–4235. [Google Scholar] [CrossRef]
  26. Flemming, H.-C.; Wingender, J.; Szewzyk, U.; Steinberg, P.; Rice, S.A.; Kjelleberg, S. Biofilms: An emergent form of bacterial life. Nat. Rev. Microbiol. 2016, 14, 563–575. [Google Scholar] [CrossRef]
  27. Ahmad, R.M.; Kuldeep, G.; Manabendra, M. Microbial biofilm: Formation, architecture, antibiotic resistance, and control strategies. Braz. J. Microbiol. 2021, 52, 1701–1718. [Google Scholar] [CrossRef]
  28. Zhuang, W.; Yang, J.; Wu, J.; Liu, D.; Zhou, J.; Chen, Y.; Ying, H. Extracellular polymer substances and the heterogeneity of Clostridium acetobutylicum biofilm induced tolerance to acetic acid and butanol. RSC Adv. 2016, 6, 33695–33704. [Google Scholar] [CrossRef]
  29. Gong, C.; He, Y.; Tang, Y.; Hu, R.; Lv, Y.; Zhang, Q.; Tardy, B.L.; Richardson, J.J.; He, Q.; Guo, J.; et al. Biofilms in plant-based fermented foods: Formation mechanisms, benefits and drawbacks on quality and safety, and functionalization strategies. Trends Food Sci. Technol. 2021, 116, 940–953. [Google Scholar] [CrossRef]
  30. Jiang, M.; Wan, Q.; Zhang, C.; Liang, L.; Cheng, X.; Gou, D.; Liu, R.; Ma, J. Strain Capable of Producing Succinic Acid, Method for Producing Succinic Acid and Application Thereof. C.N.102864113A, 9 January 2013. (In Chinese). [Google Scholar]
  31. Wu, M.; Zhang, W.; Ji, Y.; Yi, X.; Ma, J.; Wu, H.; Jiang, M. Coupled CO2 fixation from ethylene oxide off-gas with bio-based succinic acid production by engineered recombinant Escherichia coli. Biochem. Eng. J. 2017, 117, 1–6. [Google Scholar] [CrossRef]
  32. Chen, Y.; Wang, Y.; Chen, H.; Xiang, J.; Zhang, Y.; Wang, Z.; Zhu, D.; Zhang, Y. Brassinosteroids mediate endogenous phytohormone metabolism to alleviate high temperature injury at panicle initiation stage in rice. Rice Sci. 2023, 30, 70–86. [Google Scholar] [CrossRef]
  33. Gao, W.; Zhang, Y.; Ye, R.; Qi, X.; Chen, L.; Liu, X.; Tang, L.; Chen, L.; Chen, H.; Fan, Z. Discovery of novel triazolothiadiazines as fungicidal leads targeting pyruvate kinase. J. Agric. Food Chem. 2022, 70, 1047–1057. [Google Scholar] [CrossRef] [PubMed]
  34. Li, Y.; Fan, K.; Shen, J.; Wang, Y.; Jeyaraj, A.; Hu, S.; Chen, X.; Ding, Z.; Li, X. Glycine-induced phosphorylation plays a pivotal role in energy metabolism in roots and amino acid metabolism in leaves of tea plant. Foods 2023, 12, 334. [Google Scholar] [CrossRef] [PubMed]
  35. Ma, J.; Wu, M.; Zhang, C.; He, A.; Kong, X.; Li, G.; Wei, C.; Jiang, M. Coupled ARTP and ALE strategy to improve anaerobic cell growth and succinic acid production by Escherichia coli. J. Chem. Technol. Biotechnol. 2016, 91, 711–717. [Google Scholar] [CrossRef]
  36. Capasso, C.; De Luca, V.; Carginale, V.; Cannio, R.; Rossi, M. Biochemical properties of a novel and highly thermostable bacterial α-carbonic anhydrase from Sulfurihydrogenibium yellowstonense YO3AOP1. J. Enzym. Inhib. Med. Chem. 2012, 27, 892–897. [Google Scholar] [CrossRef] [PubMed]
  37. Lu, S.; Eiteman, M.A.; Altman, E. Effect of CO2 on succinate production in dual-phase Escherichia coli fermentations. J. Biotechnol. 2009, 143, 213–223. [Google Scholar] [CrossRef] [PubMed]
  38. Kasiri, S.; Ulrich, A.C.; Prasad, V. Optimization of CO2 fixation by Chlorella kessleri cultivated in a closed raceway photo-bioreactor. Bioresour. Technol. 2015, 194, 144–155. [Google Scholar] [CrossRef] [PubMed]
  39. Tan, J.P.; Luthfi, A.A.I.; Manaf, S.F.A.; Wu, T.Y.; Jahim, J.M. Incorporation of CO2 during the production of succinic acid from sustainable oil palm frond juice. J. CO2 Util. 2018, 26, 595–601. [Google Scholar] [CrossRef]
  40. Guo, J.; Wang, X.; Li, T.; Gao, M.; Hu, J.; Li, J. Effect of micro-nanobubbles with different gas sources on the growth and metabolism of chemoautotrophic microorganisms. Process Biochem. 2023, 126, 117–124. [Google Scholar] [CrossRef]
  41. Vemuri, G.N.; Eiteman, M.A.; Altman, E. Succinate production in dual-phase Escherichia coli fermentations depends on the time of transition from aerobic to anaerobic conditions. J. Ind. Microbiol. Biotechnol. 2002, 28, 325–332. [Google Scholar] [CrossRef]
  42. Li, Q.; Huang, B.; He, Q.; Lu, J.; Li, X.; Li, Z.; Wu, H.; Ye, Q. Production of succinate from simply purified crude glycerol by engineered Escherichia coli using two-stage fermentation. Bioresour. Bioprocess. 2018, 5, 41. [Google Scholar] [CrossRef]
  43. Hammer, N.D.; Schmidt, J.C.; Chapman, M.R. The curli nucleator protein, CsgB, contains an amyloidogenic domain that directs CsgA polymerization. Proc. Natl. Acad. Sci. USA 2007, 104, 12494–12499. [Google Scholar] [CrossRef]
  44. Sheng, H.; Xue, Y.; Zhao, W.; Hovde, C.J.; Minnich, S.A. Escherichia coli O157:H7 curli fimbriae promotes biofilm formation, epithelial cell invasion, and persistence in cattle. Microorganisms 2020, 8, 580. [Google Scholar] [CrossRef] [PubMed]
  45. Sobieszczańska, B.; Pawłowska, B.; Duda-Madej, A.; Pawlik, K.; Wiśniewski, J.; Grzegrzołka, J.; Turniak, M.; Walczuk, U.; Gamian, A. Effect of amyloid curli fibrils and curli CsgA monomers from Escherichia coli on in vitro model of intestinal epithelial barrier stimulated with cytokines. Int. J. Med. Microbiol. 2019, 309, 274–282. [Google Scholar] [CrossRef]
  46. Amulya, K.; Kopperi, H.; Mohan, S.V. Tunable production of succinic acid at elevated pressures of CO2 in a high pressure gas fermentation reactor. Bioresour. Technol. 2020, 309, 123327. [Google Scholar] [CrossRef] [PubMed]
  47. Tan, Z.; Zhu, X.; Chen, J.; Li, Q.; Zhang, X. Activating phosphoenolpyruvate carboxylase and phosphoenolpyruvate carboxykinase in combination for improvement of succinate production. Appl. Environ. Microbiol. 2013, 79, 4838–4844. [Google Scholar] [CrossRef]
  48. Park, S.J.; Cotter, P.A.; Gunsalus, R.P. Regulation of malate dehydrogenase (mdh) gene expression in Escherichia coli in response to oxygen, carbon, and heme availability. J. Bacteriol. 1995, 177, 6652–6656. [Google Scholar] [CrossRef] [PubMed]
  49. Liang, L.; Liu, R.; Ma, J.; Chen, K.; Jiang, M.; Wei, P. Increased production of succinic acid in Escherichia coli by overexpression of malate dehydrogenase. Biotechnol. Lett. 2011, 33, 2439–2444. [Google Scholar] [CrossRef] [PubMed]
  50. Hong, S.H.; Lee, S.Y. Metabolic flux analysis for succinic acid production by recombinant Escherichia coli with amplified malic enzyme activity. Biotechnol. Bioeng. 2001, 74, 89–95. [Google Scholar] [CrossRef] [PubMed]
  51. Razzak, A.; Lee, D.W.; Lee, J.; Hwang, I. Overexpression and Purification of Gracilariopsis chorda Carbonic Anhydrase (GcCAα3) in Nicotiana benthamiana, and its immobilization and use in CO2 Hydration Reactions. Front. Plant Sci. 2020, 11, 563721. [Google Scholar] [CrossRef] [PubMed]
  52. Wang, D.; Li, Q.; Li, W.; Xing, J.; Su, Z. Improvement of succinate production by overexpression of a cyanobacterial carbonic anhydrase in Escherichia coli. Enzym. Microb. Technol. 2009, 45, 491–497. [Google Scholar] [CrossRef]
Figure 1. CO2 concentrations in emission gas under different aeration methods.
Fermentation 11 00031 g001
Figure 2. Microscopic images of CO2 MNBs under bubble aeration (A) and MNB aeration (B).
Fermentation 11 00031 g002
Figure 3. The effects of pressure on CO2 release with different aeration methods. (A) The emission rates of CO2. (B) The CO2 contents in the media.
Fermentation 11 00031 g003
Figure 4. Microscopic images of CO2 bubbles under different fermenter pressures with bubble aeration (A) and MNB aeration (B).
Fermentation 11 00031 g004
Figure 5. The effects of inlet velocity on CO2 release with different aeration methods. (A) The emission rates of CO2. (B) The CO2 contents in the media.
Fermentation 11 00031 g005
Figure 6. Succinic acid production during batch fermentation by E. coli Suc260 with different CO2 supply methods: (A) AFB, (B) AFM, (C) PFB, (D) PFM, and (E) TSF.
Fermentation 11 00031 g006
Figure 7. Succinic acid production during batch fermentation by biofilm-enhanced strain E. coli Suc260-CsgA with different CO2 supply methods: (A) AFB, (B) PFB, and (C) PFM.
Fermentation 11 00031 g007
Table 1. Effects of CO2 supply methods on SA production by E. coli Suc260.
CO2 Supply
Methods
SA
(g·L−1)
SA Yield
(g·g−1)
CO2 Utilization
(%)
Productivity
(g·(L·h)−1)
AFB32.43 ± 0.790.852 ± 0.024.85 ± 0.00120.68 ± 0.02
AFM28.98 ± 0.880.832 ± 0.0311.14 ± 0.00200.60 ± 0.02
PFB27.89 ± 0.720.863 ± 0.0214.50 ± 0.00370.54 ± 0.01
PFM1.65 ± 0.04///
TSF22.83 ± 0.950.657 ± 0.0314.03 ± 0.00030.23 ± 0.01
The experimental results were based on three replicates. According to Duncan’s multivariate range test, the numerical differences between traits in the same column were not significant (p < 0.05).
Table 2. Effects of CO2 supply methods on SA production by E. coli Suc260-CsgA.
CO2 Supply
Methods
SA
(g·L−1)
SA Yield
(g·g−1)
CO2 Utilization
(%)
Productivity
(g·(L·h)−1)
AFB30.59 ± 0.720.846 ± 0.024.09 ± 0.00120.58 ± 0.01
PFB28.72 ± 0.800.865 ± 0.0314.20 ± 0.00390.55 ± 0.02
PFM30.40 ± 0.680.873 ± 0.0230.63 ± 0.00180.57 ± 0.02
The results were based on three repeats. Duncan’s test showed no significant numerical differences between traits in the same column (p < 0.05).
Table 3. Effects of CO2 supply methods on the activities of key enzymes in the synthesis of SA.
CO2 Supply
Methods
StrainPCK
(U·mg−1)
MDH
(U·mg−1)
PK
(U·mg−1)
CA
(U·mL−1)
AFBE. coli Suc26010.33 ± 0.1010.9 ± 0.3422.17 ± 2.070.98 ± 0.05
E. coli Suc260-CsgA10.56 ± 0.1012.93 ± 0.0929.59 ± 0.630.76 ± 0.08
PFBE. coli Suc2608.86 ± 0.118.75 ± 0.1218.72 ± 1.642.84 ± 0.14
E. coli Suc260-CsgA9.71 ± 0.1611.65 ± 0.3429.26 ± 0.742.06 ± 0.09
PFME. coli Suc2600.25 ± 0.090.35 ± 0.041.34 ± 0.960.02 ± 0.01
E. coli Suc260-CsgA9.16 ± 0.2510.82 ± 0.1525.56 ± 1.553.18 ± 0.10
PCK: phosphoenolpyruvate carboxykinase; MDH: malate dehydrogenase; PK: pyruvate kinase; CA: carbonic anhydrase. The enzyme activity results were based on three replicates. According to Duncan’s multiple range test, numerical values for characters in the same column did not differ greatly from p < 0.05.
Disclaimer/Publisher’s Note: The statements, opinions and data contained in all publications are solely those of the individual author(s) and contributor(s) and not of MDPI and/or the editor(s). MDPI and/or the editor(s) disclaim responsibility for any injury to people or property resulting from any ideas, methods, instructions or products referred to in the content.

