Article

The Effects of Substrates and Sonication Methods on the Antioxidant Activity of Kefir Postbiotics

by
Gerardo Chávez-Alzaga
1,
Raúl Alberto Reyes-Villagrana
2,*,
Gerardo Pavel Espino-Solis
3,
Martha María Arévalos-Sánchez
1,
Ana Luisa Rentería-Monterrubio
1,
Rogelio Sánchez-Vega
1,
Eduardo Santellano-Estrada
1,
Norma Angélica Bolivar-Jacobo
1,
Juan Manuel Tirado-Gallegos
1 and
América Chávez-Martínez
1,*
1
Facultad de Zootécnica y Ecología, Universidad Autónoma de Chihuahua, Periférico Francisco R. Almada, Km 1, Chihuahua 31453, Mexico
2
Consejo Nacional de Ciencia y Tecnología, Av. Insurgentes Sur 1582, Col. Crédito Constructor, Col. Benito Juárez, Ciudad de México 03940, Mexico
3
Circuito Universitario, Facultad de Medicina y Ciencias Biomédicas, Universidad Autónoma de Chihuahua, Campus II, Chihuahua 31109, Mexico
*
Authors to whom correspondence should be addressed.
Fermentation 2024, 10(9), 492; https://doi.org/10.3390/fermentation10090492
Submission received: 30 August 2024 / Revised: 11 September 2024 / Accepted: 13 September 2024 / Published: 23 September 2024

Abstract

:
Sonoporation stimulates cell growth as it improves the permeability of the membrane and increases the uptake of impermeable molecules in the extracellular matrix. We evaluated the effects of substrates (whey, whole, and skim milk) and ultrasonic treatments (ultrasonication and thermosonication) on the antioxidant activity (AA) of water-soluble kefir postbiotics (WSKPs). The samples were evaluated in terms of antioxidant activity (ABTS, DPPH, FRAP, and ORAC), water-soluble protein content, proteolysis (SDS-PAGE profiles), and cell membrane permeability. The levels of AA in all WSKPs depended on the substrate and method of obtaining them. However, the WSKPs from whey had higher antioxidant activity with DPPH (11.11 mg TE/100 mL), ABTS (12.77 mg TE/100 mL), and FRAP (5.18 mg TE/100 mL). Also, the WSKPs from whey had the highest values for water-soluble protein (1.45–1.32 mg/mL) and proteolysis degree and the lowest percentage of dead cells (11.4–28%). These results suggest that the production of WSKPs from whey might add value to whey production. Furthermore, WSKPs have potential as a functional ingredient in the production of beverages or foods with antioxidant activity.

1. Introduction

According to the Food and Agriculture Organization of the United Nations (FAO) and the World Health Organization (WHO) [1], probiotics are live bacteria that provide health benefits to the host who consumes them in sufficient quantities. In the same vein, Zepeda-Hernández et al. [2] define postbiotics as substances that probiotics produce and release. Postbiotics do not contain live microorganisms but include any substance released or produced due to its metabolism that directly or indirectly exerts a beneficial effect on the host [3]. Moreover, postbiotics have numerous advantages over probiotics, making them appealing for enhancing gut health and overall wellbeing since all the molecules produced during the fermentation process contribute to the efficiency of the use of probiotics.
In contrast to probiotics, which harbor live microorganisms, postbiotics are nonviable, safer, and easier to dose and standardize in comparison to probiotics, which renders more consistent and predictable effects [3]. Additionally, people experiencing digestive distress due to probiotic supplementation may have a higher tolerance to postbiotics as they do not introduce additional bacteria into the gut ecosystem [4] and do not affect gut microbiota [5]. They also boast a longer shelf life and greater stability during storage and transportation [6]; this inherent stability makes them safer for individuals with compromised immune systems, mitigating the risk of bacterial translocation or infection [7]. Additionally, they easily attach to the sites of action and are simple to obtain, standardize, transport, and store [5]. Notably, they are nonpathogenic and nontoxic and display a superior resistance to hydrolysis [8]. These characteristics make postbiotics a viable substitute to conventional dairy products with added probiotics since there is a trend toward eliminating milk from diets due to a combination of health concerns, ethical considerations, environmental impacts, and the growing availability and popularity of plant-based alternatives [9,10,11,12,13,14,15].
The production of postbiotics involves several steps. The first step is lactic acid bacteria (LAB) fermentation of the substrate and culture [16,17]; during this phase, it is important to keep the pH close to neutral to enhance peptide production [17]. The second step is probiotic strain inactivation through thermal methods like pasteurization, sterilization, and ohmic heating or nonthermal methods like pulsed electric fields, ultrasound, irradiation, and supercritical carbon dioxide treatment [18]. The third step is the obtention of supernatants free of postbiotics or cells by the centrifugation or filtration of inactive ferments. The final step is the combination of extracted postbiotics with other ingredients to create application-ready forms, such as liquids, powders, or food products [16,18]. Postbiotics in liquid matrices may be concentrated by spray-drying or freeze-drying for easy handling and storage [17]; however, it increases production costs.
High-intensity ultrasound (HIU) can be used after fermentation to inactivate LAB and before it to improve stability, reduce processing times, and enhance quality [19]. Some authors suggest that the combination of ultrasound with moderate heat (between 37 and 75 °C), known as ultra-thermosonication or thermosonication (TS), enhances its effectiveness. Both HIU and TS increase the permeability of the membrane because of damage to the cell wall due to the formation of numerous temporary pores, a process known as sonoporation [20,21]. Sonoporation has proven to be very helpful in fermentation processes as it increases biomass and product yields and improves cell viability, which is important for keeping the fermentation process productive; additionally, it is cost-effective, which lowers the overall production cost and makes it suitable for use in both small- and large-scale fermentation operations [22]. Dahroud et al. [23] attributed these benefits to improved nutrient intake and waste ejection.
Kefir is a fermented milk beverage with strong in vitro and in vivo antioxidant activity. Kefir removes free radicals, lowers the activity of glutathione peroxidase, and stops linoleic acid peroxidation due to the high content of phenolic compounds [24]. These results indicate that postbiotics produced in kefir fermentation may be promising functional ingredients with significant antioxidant properties. However, the antioxidant activity of postbiotics can be affected by the type of culture and substrate and the method of obtaining them; kefirs elaborated with grains showed higher antioxidant activity than those fermented with a starter culture [25]. Meanwhile, kefir made with a combination of cow’s milk and soybeans showed better antioxidant activity than that made only with cow’s milk [26], and kefir made with goat’s milk had higher total antioxidant activity than that made with cow’s milk [27]. Thus, the objective of this study was to investigate the antioxidant activity of water-soluble kefir postbiotics (WSKPs) obtained with different substrates (whole milk, skim milk, and whey) and methods of obtaining them (HIU and TS).

2. Materials and Methods

2.1. Bacterial Culture Preparation

A freeze-dried DVS (direct vat set) starter kefir culture, XPL-1 Chr Hansen® (Hørsholm, Denmark) (1% weight/volume), was inoculated in 200 mL of each substrate. The available substrates were UHT whole milk LALA®, Grupo Lala. Torreón, Coahuila, México), UHT skimmed milk (LALA®, Grupo Lala. Torreón, Coahuila, México), and whey (from cheddar cheese production, W). Five strains comprise the XPL-1 culture: Lactococcus lactis subsp. cremoris, Lactococcus lactis subsp. lactis biovar diacetylactis, Lactococcus lactis subsp. lactis, Leuconostoc, and Streptococcus thermophilus. The substrates were chosen as the growth medium based on the results of a previous study [28].

2.2. Ultrasonic Treatments

The ultrasonic treatments (HIU and TS) were applied after the inoculation as follows: One flask of each substrate (WM, SM, and W) was subjected to HIU, the other to thermosound (TS), and the last one did not receive any ultrasonic treatment (C, control). The HIU was administered using a 1.3 cm diameter probe ultrasonic processor (20 kHz, GEX750, Sonic, Newtown, CT, USA) for 3 min at around 25 °C. The HIU had a frequency of 20 kHz, an amplitude of 30%, and a power of 750 watts. The. TS was performed in an ultrasonic bath (Elmasonic S 15 H, Elma Schmidbauer GmbH, Singen, Germany) with a frequency of 37 kHz, at 60 °C for 30 min. After this, the fermentation was carried out for 12 h at 25 °C in aerobiosis.

2.3. Postbiotics Obtention

The fermented substrates were centrifuged (Centrifuge 5810 R, Eppendorf®, Framingham, MA, USA) at 20,000× g for 20 min at 4 °C. The supernatant was then recovered and filtered (WhatmanTM No. 1, GE Healthcare, Hatfield, UK) to obtain WSKPs. The WSKPs were stored at 10 °C until further analyses. Treatments were conducted in triplicate using a completely randomized design.

2.4. Hydrogen Potential Determination

The pH was determined with a potentiometer (Thermo ScientificTM, OrionTM, Versa Star ProTM, Vantaa, Finland) that was previously calibrated. Readings were made in 20 mL of each sample in triplicate.

2.5. Antioxidant Activity (AA)

The AA by the ABTS (2,2-azinobis {3-ethylbenzothiazolino}-6-sulfonic acid) technique was conducted as described by Thaipong et al. [29]. The 7.4 mM ABTS stock solution was prepared by dissolving 38.8 mg of crystallized ammonium salt of ABTS in 10 mL of distilled water. On the other hand, a 2.6 mM potassium persulfate solution was prepared by dissolving 6.6 milligrams (mg) of the compound in 10 mL of distilled water. The ABTS free solution radical was prepared by mixing these two solutions and the subsequent incubation in the absence of light at room temperature for 12 h. The ABTS free radical working solution was then diluted by mixing 1 mL in 60 mL of methanol to obtain an absorbance of 1.1 ± 0.021 at 734 nm; this last was the ABTS working solution. The absorbance measurements were carried out in a 96-well microplate (3591, COSTAR®, Corning, NY, USA), placing 280 µL of the ABTS working solution and 10 µL of sample (or standard: Trolox) or 10 µL of distilled water (blank) using a spectrophotometric plate reader (Multiskan go, Thermo Scientific, Vantaa, Finland). Measurements were performed in triplicate. A standard curve was prepared with different concentrations (0.1 to 1.0 mM) of Trolox (6-hydroxy-2,5,7,8-tetramethylchroman-2-carboxylic acid), and a regression equation (y = −1.0467x + 1.0323, R2 = 0.9758) was used to calculate the antioxidant activity, expressed as mg of Trolox equivalents per 100 mL (mg TE/100 mL). The Trolox calibration curve was generated by dissolving 31.3 mg of Trolox (6-hydroxy-2,5,7,8-tetramethylchroman-2-carboxylic acid) in 10 mL of methanol.
The AA assay using the DPPH (2,2-Diphenyl-1-Picrylhydrazyl) technique was conducted as described by Thaipong et al. [29], with minor adjustments. Firstly, a 0.6 mM concentration solution of DPPH in 100 mL of methanol was prepared. A working solution was made by combining 75 mL of the stock solution with 99 mL of methanol in a corresponding well of a microplate (3591, COSTAR®, Corning, NY, USA) to obtain an absorbance of 1.1 ± 0.02 at 515 nm. Also, in a microplate, 10 µL of the sample (or standard: Trolox), or 10 µL of distilled water (Blank), and 280 µL of the DPPH working solution were added. The absorbance was then measured at 515 nm using a spectrophotometric plate reader (Multiskan go, Thermo Scientific, Vantaa, Finland). Measurements were performed in triplicate. A standard curve was made with different concentrations (0.1 to 1.0 mM) of Trolox (6-hydroxy-2,5,7,8-tetramethylchroman-2-carboxylic acid), and the regression equation (y = −0.83715x + 1.0209, R2 = 0.9602) obtained was used to calculate the antioxidant activity, expressed as mg of Trolox equivalents per 100 mL (mg TE/100 mL).
Ferric Reducing Antioxidant Power Assay (FRAP) determination was performed using an FRAP commercial kit (Sigma-Aldrich, St. Louis, MO, USA) following the manufacturer’s instructions. To begin, 152 µL of FRAP assay, 19 µL of FeCl3, and 19 µL of FRAP Probe were mixed to make enough reaction mix for everyone. At the same time, a standard curve was made by diluting the 2 mM ferrous standard to different concentrations (4, 8, 12, 16, and 20 mM). Then, 190 µL of the reaction mix was placed into wells that matched them in a 96-well microplate (3591, COSTAR®, Corning, NY, USA). Each well had 10 µL of the standards, positive control, and test samples already in it. To make a background control mix (without the FRAP probe), 171 µL of Frap assay buffer and 19 µL of FeCl3 were mixed. To make a positive control, 4 µL of the FRAP positive control was mixed with 6 µL of FRAP assay buffer. Reactions were incubated at 37 °C for 60 min and then the absorbance was read at 594 nm in a spectrophotometric plate reader (Multiskan go, Thermo Scientific, Vantaa, Finland). Measurements were performed in triplicate. A standard curve (y = 0.0616276x + 0.0390683, R2 = 0.992) was used to calculate ferrous ammonium sulfate amount and the antioxidant activity was expressed as mM ferrous equivalent (mM Fe2+ equivalents) and was determined using the following formula:
S a m p l e   m M   F e r r o u s   e q u i v a l e n t = B × D V
where B is the ferrous ammonium sulfate amount from the standard curve (nmol), D is the sample dilution factor, and V is the sample volume added into the reaction well (µL).
The AA by oxygen radical absorption capacity (ORAC) methodology was carried out according to Thaipong et al. [29], with slight modifications. Samples and standards were prepared in phosphate buffer (10 mM, pH 7.4). The substrate was fluorescein (10 mM), and the peroxyl radical was prepared using 2,2′-azobis (2-amidino-propane) dihydrochloride (AAPH, 240 mM). All solutions were made fresh for each run. The fluorescence measurements (Ex. 485 nm, Em. 520 nm) were taken every 90 s for a total of 120 min in a spectrophotometric plate reader (Multiskan go, Thermo Scientific, Vantaa, Finland). A background signal was determined with three cycles before adding the AAPH. A standard curve was prepared with different concentrations (0.1 to 1.0 mM) of Trolox (6-hydroxy-2,5,7,8-tetramethylchroman-2-carboxylic acid), and a regression equation (y = 4.1586x + 69.847, R2 = 0.9657) was used to calculate the antioxidant activity, expressed as mg of Trolox equivalents per 100 mL (mg TE/100 mL).

2.6. Total Water-Soluble Protein Content

Total protein content was determined according to Bradford (1976), with slight modifications [30]. Hence, 0.1 mL of the sample and 1 mL of Bradford’s reagent were mixed and left to react in the dark for 45 min. Then, 10 µL of sample, 10 µL of distilled water and 280 µL of the Bradford working solution were placed in a microplate (3591, COSTAR®, Corning, NY, USA) and the absorbance was read at 595 nm in a spectrophotometer (Multiskan go, Thermo Scientific, Vantaa, Finland). Measurements were performed in triplicate. The protein content was determined by measuring the absorbance and inputting the values into the equation derived from the calibration curve (y = 1.8912x + 0.0365, R2 = 0.99), with the result given in mg/mL of BSA.

2.7. Proteolysis Assessment

The protein profiles of WSKPs were analyzed using sodium dodecyl sulfate-polyacrylamide gel electrophoresis (SDS-PAGE) according to Ong and Shah (2009) [31].

2.8. Cell Membrane Permeability

The test utilized an LIVE/DEAD® BacLightTM bacterial viability kit provided by Thermo Fisher Scientific. This kit consists of propidium iodide (PI) and SYTO9, which are used to selectively dye cells based on their membrane integrity. The samples were obtained using an Attune NxT flow cytometer equipped with blue, red, violet, and yellow lasers manufactured by Thermo Fisher Scientific in Waltham, MA, USA. A fluorescence minus one (FMO) control was used to determine the limits of fluorescence and develop populations and gating techniques. The gates were established based on the forward and side scatter properties. Each sample was captured at a flow rate of 500 μL/min, with a total of 100,000 events recorded. The data were analyzed using the FlowJo software version 10.
To make the samples, 1 mL of each treatment was centrifuged at 10,000× g (Eppendorf Centrifuge 5430 R, Hamburg, Germany) for 3 min. The sediment was then resuspended in 1 mL of a 0.85% NaCl solution, and the mixture was left to sit at room temperature for 60 min with short shakes every 15 min. This procedure was repeated twice. To obtain a positive and negative control from the bacterial culture, 1 mL was centrifuged at 10,000× g for 3 min. The living cells were then mixed with 1 mL of 0.85% NaCl solution, and the dead cells were mixed with 1 mL of 70% isopropyl alcohol. The mixture was then left to sit at room temperature for 1 h, with quick shakes every 15 min. After that, they were centrifuged (10,000× g, 3 min), and the pellets from both controls were rinsed with 1 mL of a 0.85% NaCl solution and centrifuged (10,000× g, 3 min). Subsequently, the pellets were reconstituted in a 1 mL solution of 0.85% sodium chloride. Next, to stain the cells, 977 µL of 0.85% NaCl was placed in a flow cytometry analysis tube. The tube was then filled with 10 µL of the bacterial suspension made in the previous step, 1.5 µL of 3.34 mM SYTO 9 Nucleic Acid Stain (Component A), and 1.5 µL of 30 mM propidium iodide (Component B). The tubes were placed in a dark environment at room temperature and left undisturbed for 15 min. Subsequently, a volume of 10 μL of the microsphere suspension was introduced to the labeled cell sample. The mixture was well combined and subjected to flow cytometry analysis using the conditions previously mentioned. The microsphere solution (Component C) was fully resuspended and subsequently subjected to sonication in a water bath for a duration of 10 min. To obtain a precise measurement of the samples, the volume was adjusted to 1000 μL.

2.9. Statistical Analysis

Variables were analyzed with an analysis of variance (ANOVA) using the GLM procedure with the comparison of Tukey means using the statistical program SAS® 9.1.3. Statistically significant differences were established with a significance level of 0.05. A completely randomized design with destructive samples was employed, by the following model:
Yijk = µ + Si + Mj + SMij + Ɛijk
where Yijk = the response variable measured in the k-th repetition within the i-th substrate in the j-th method, µ = the overall mean of the variable of interest, Si = the effect of the i-th substrate, Mj = the effect of the j-th method, SMij = the effect of the interaction between the i-th substrate and the j-th method, and Ɛijk = the random error of the k-th repetition within the i-th substrate in the j-th method.

3. Results

3.1. Potential of Hydrogen (pH)

Differences between the methods of obtaining whole milk postbiotics (p < 0.05) were observed; the lowest pH was observed in the whole milk subjected to HIU (4.48 ± 0.06) and the highest in the whole milk subjected to TS (5.08 ± 0.01) (Figure 1). Skim milk had a significant difference (p < 0.05) in pH between skim milk treated with TS (5.17 ± 0.004), control skim milk (4.58 ± 0.08), and skim milk treated with HIU (4.57 ± 0.10). Finally, whey had no significant difference (p > 0.05) among methods of obtaining postbiotics. In summary, whole milk HIU had the lowest pH (4.48 ± 0.06) (p < 0.05), and skim milk TS had the highest (5.17 ± 0.004).

3.2. Antioxidant Activity

3.2.1. ABTS Assay

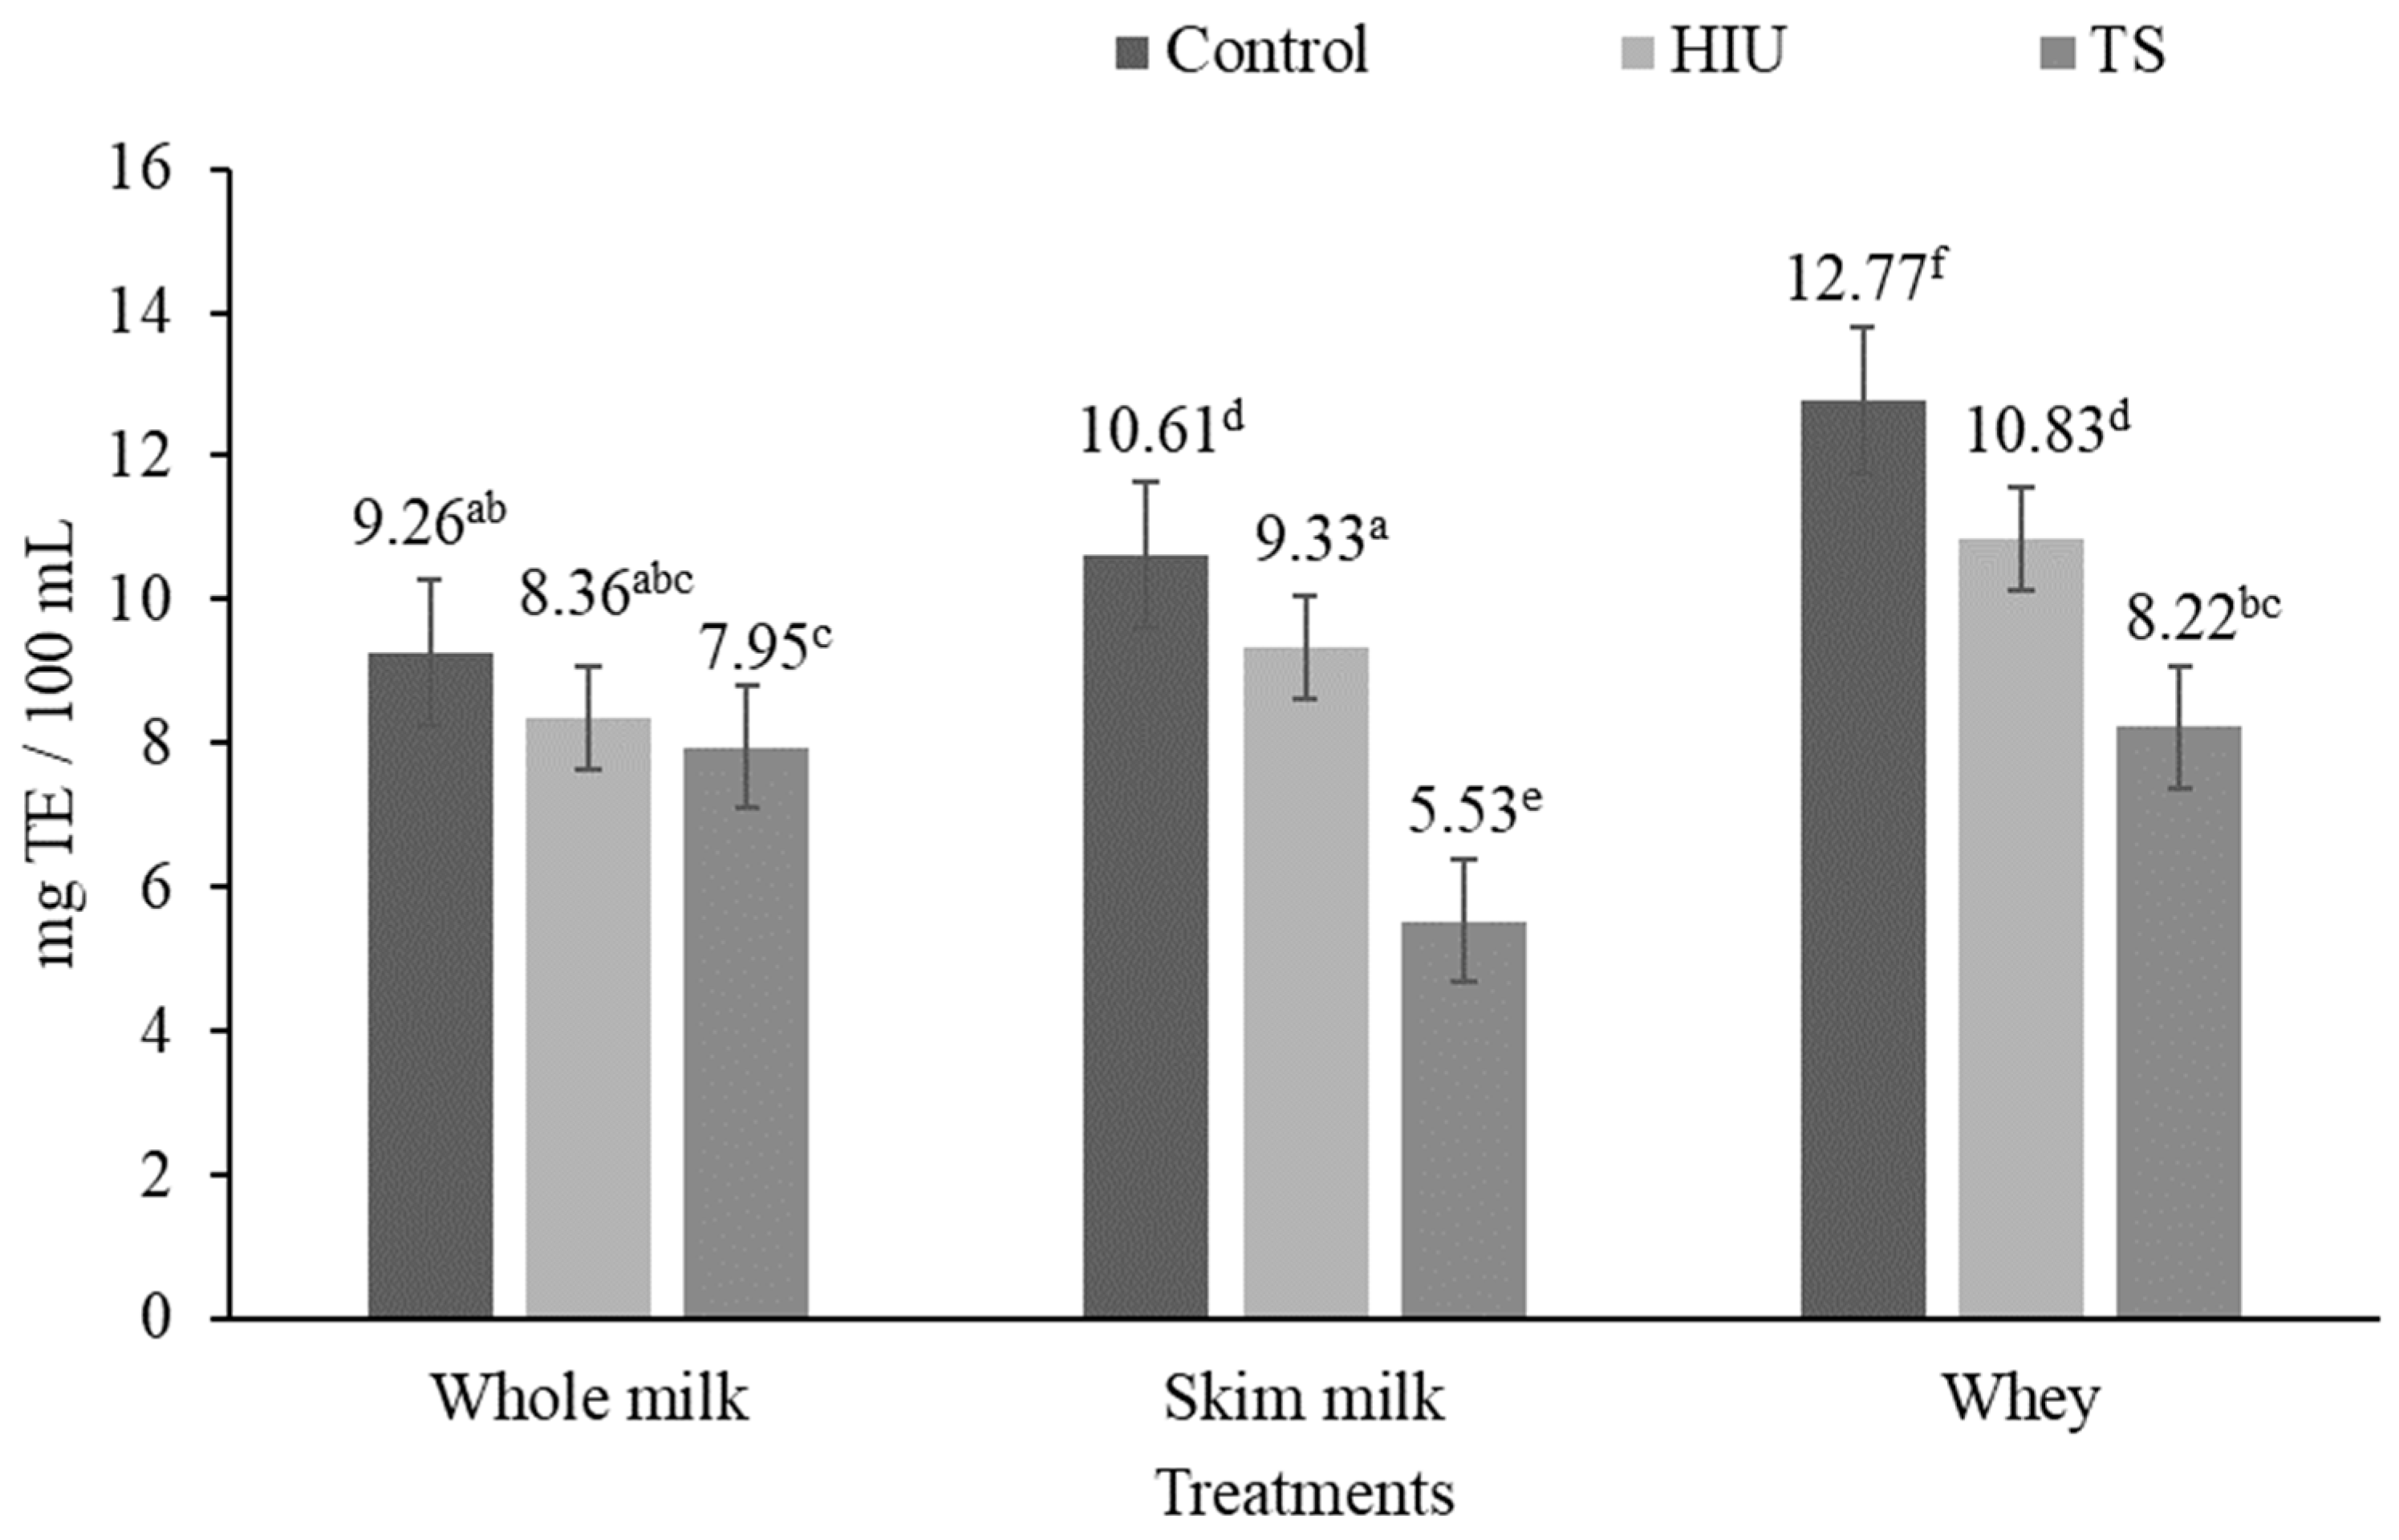
The whole milk with TS presented the lowest (p < 0.05) AA (7.95 ± 0.01), while the C and HIU treatments (9.26 ± 0.004 and 8.36 ± 0.02, respectively) were statistically equal (p > 0.05). In the skim milk, all the treatments were different (p < 0.05); the C had the highest activity (10.61 ± 0.02), followed by HIU (9.33 ± 0.02) and TS (5.53 ± 0.03). The whey treatments were different (p < 0.05); the C had a higher value (12.77 ± 0.03) than US (10.83 ± 0.03) and TS (8.22 ± 0.05). The C in all the substrates showed greater AA (p < 0.05); only whole milk, C, and HIU treatments were not different (p > 0.05). All TS treatments showed the lowest AA (p < 0.05). In summary, whey without treatment (C) presented the highest (p < 0.05) AA (12.77 ± 0.03) and skim milk TS (5.53 ± 0.03) the lowest (p < 0.05) (Figure 2).

3.2.2. DPPH Assay

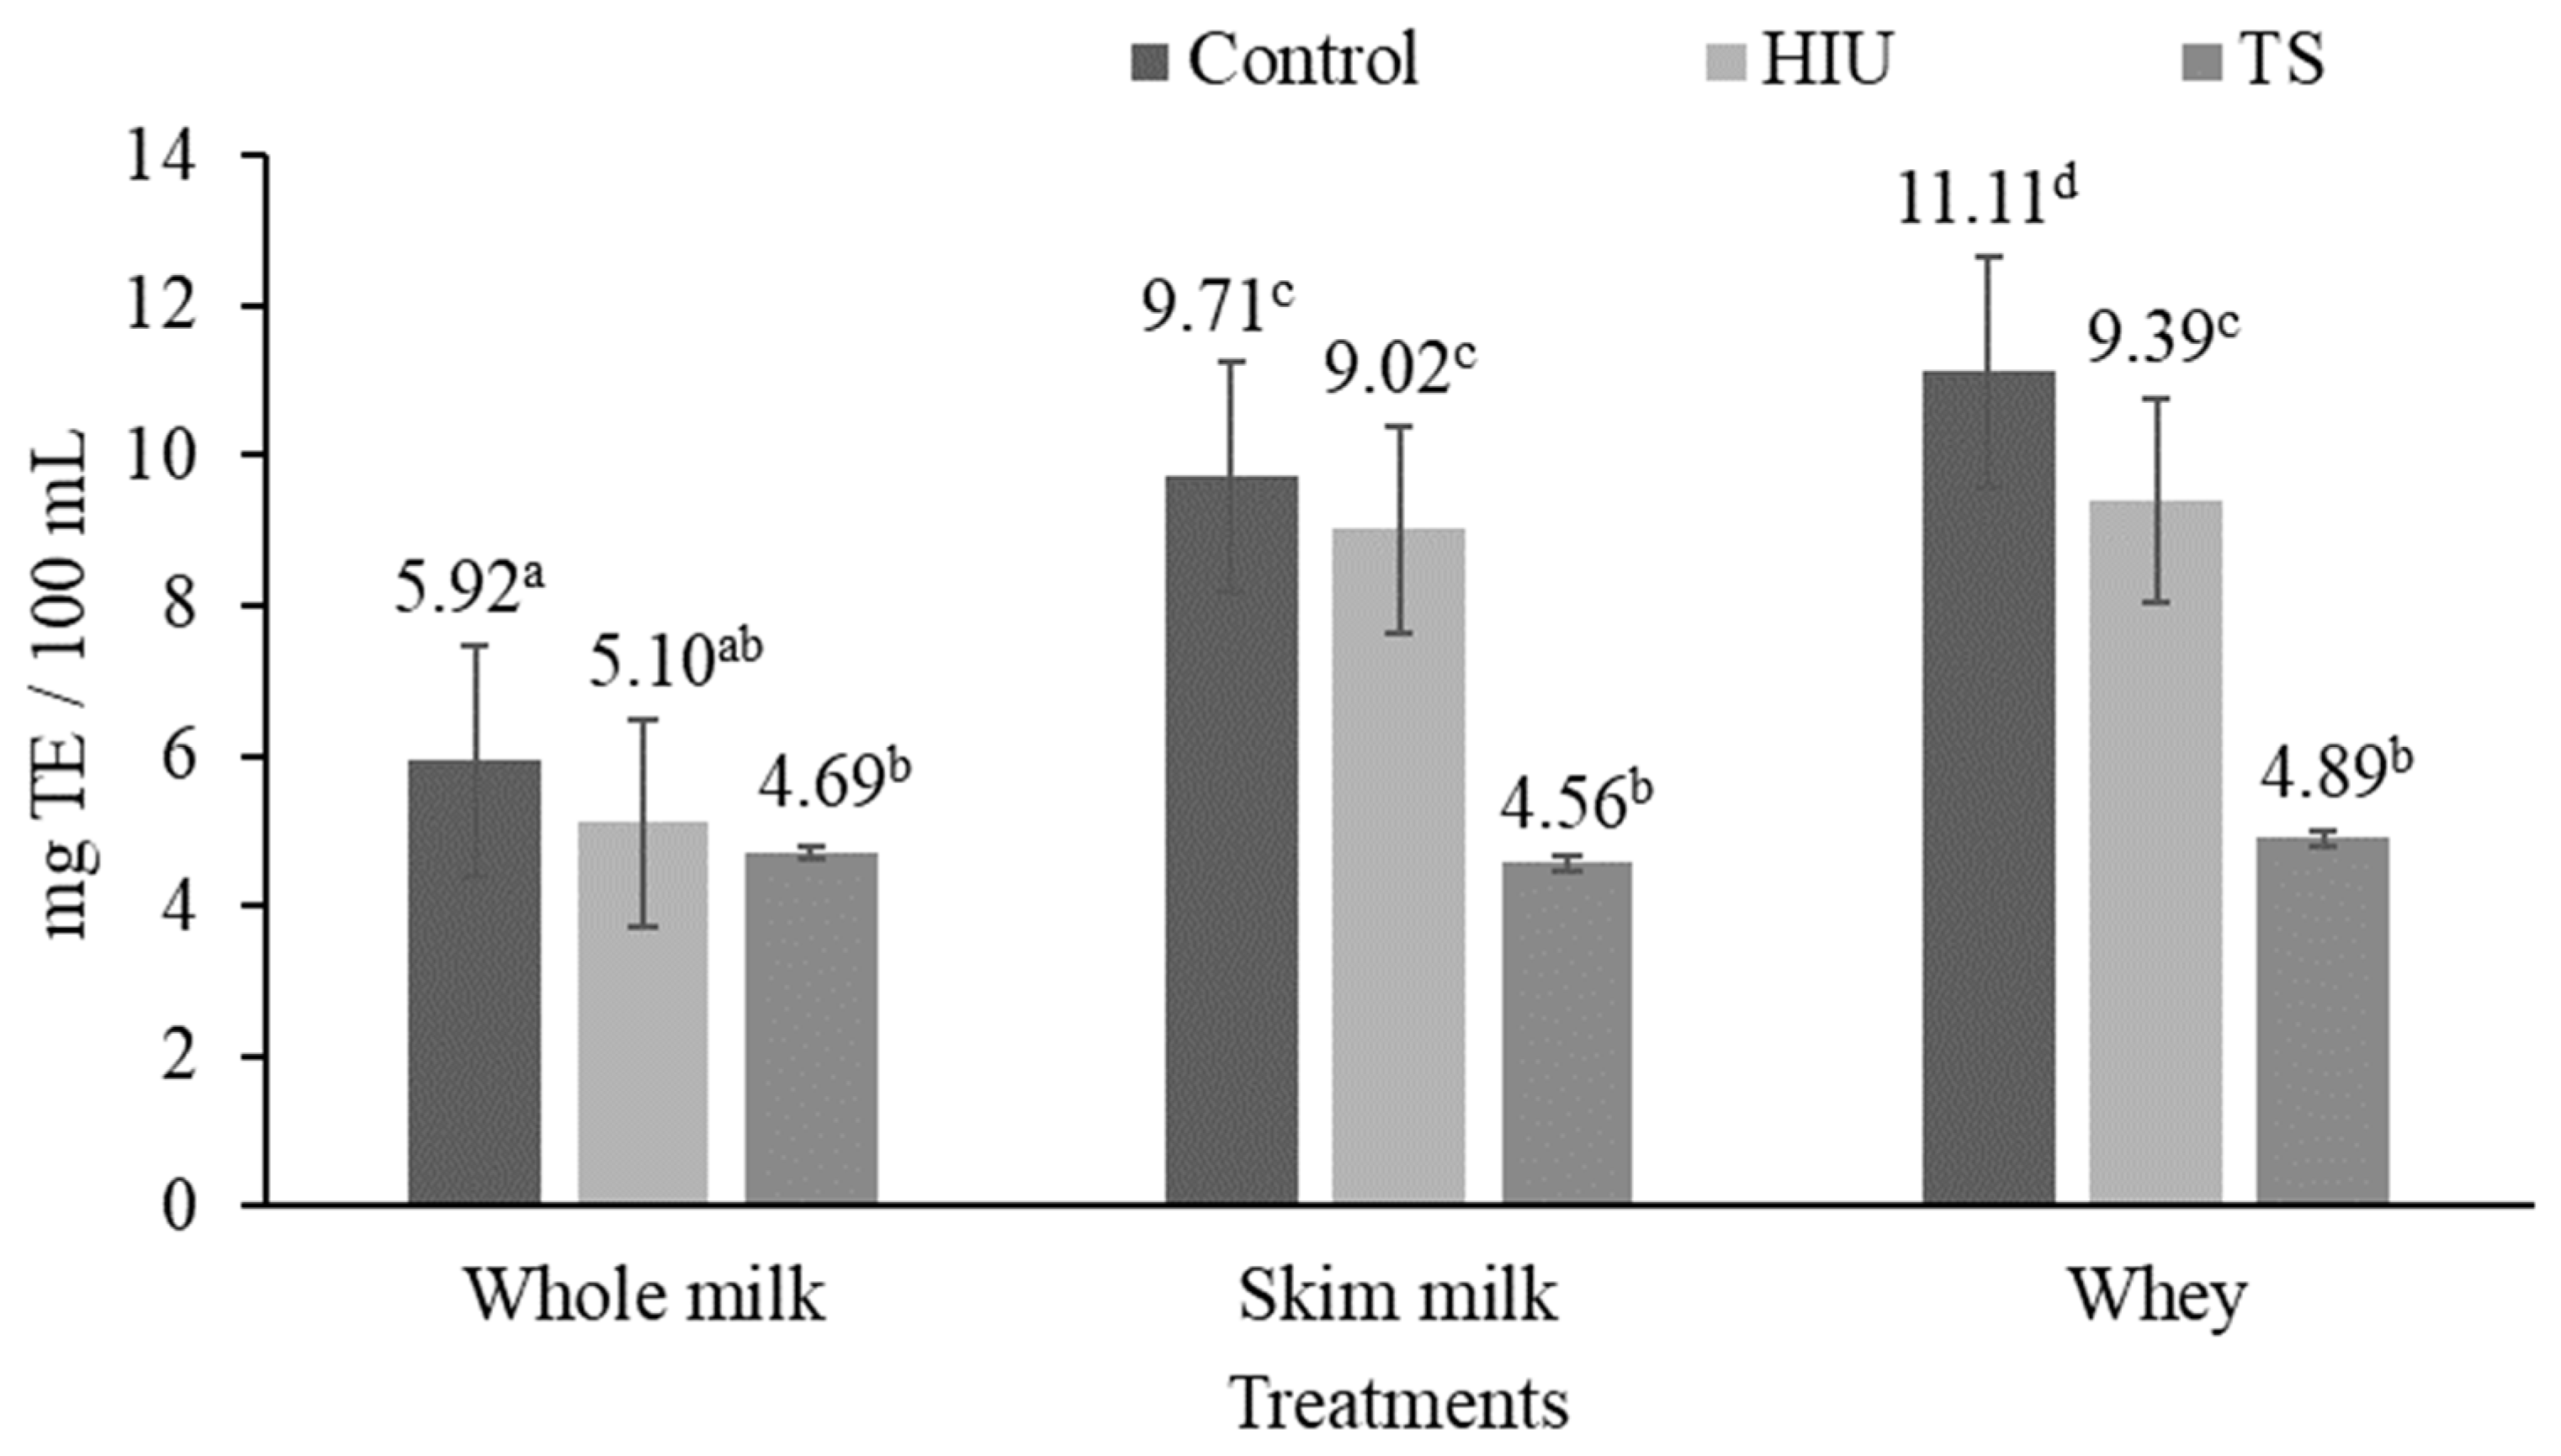
DPPH had similar results; whey without any treatment (C) presented the highest AA (p < 0.05) (11.11 ± 0.49). In whole milk, there were differences (p < 0.05) between C (5.92 ± 0.35) and TS (4.69 ± 0.38), and it was the lowest between substrates. By treatments, TS presented the lowest AA in whole milk (4.69 ± 0.38), skim milk (4.56 ± 0.43), and whey (4.89 ± 0.23) without showing differences between them (p > 0.05). Finally, AA by the HIU treatment did not show differences between skim milk and whey (p > 0.05) (Figure 3).

3.2.3. FRAP Assay

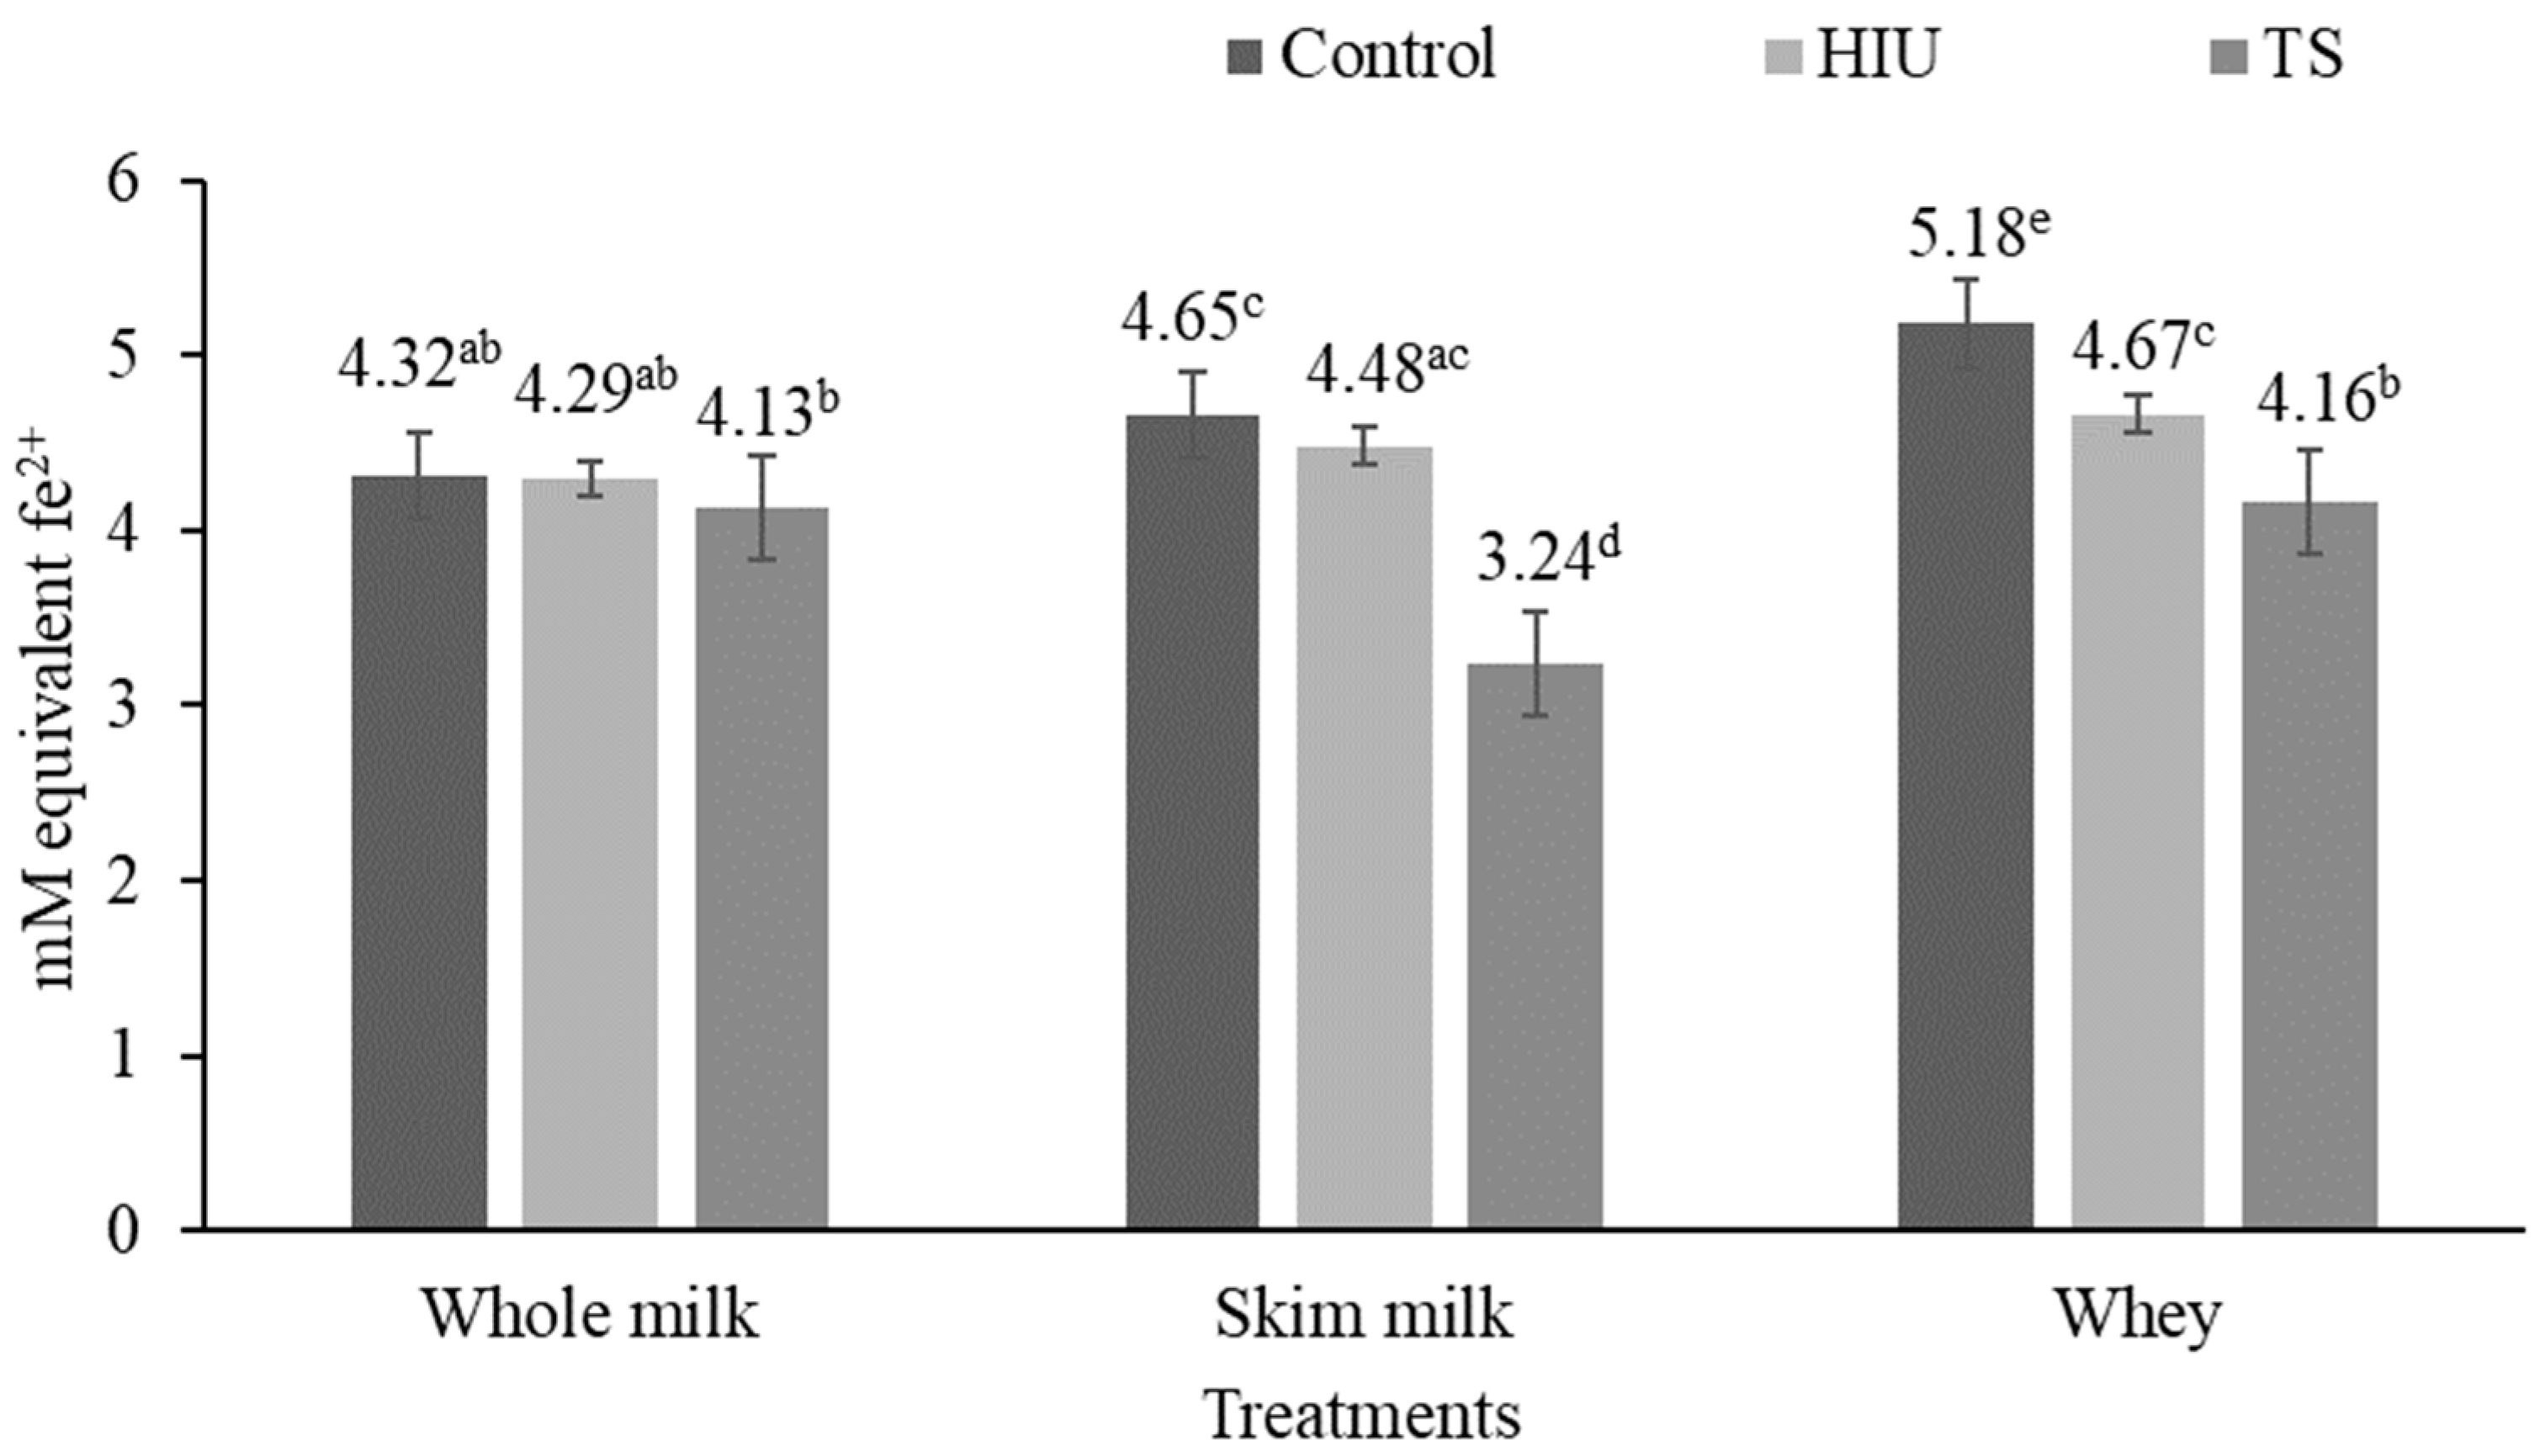
The whey presented higher AA than the other substrates with differences (p < 0.05) between treatments; C (5.18 ± 0.007) obtained the highest AA, followed by the HIU (4.67 ± 0.02) and TS (4.16 ± 0.09). On the other hand, for skim milk, the lowest AA (p < 0.05) was observed in TS (3.24 ± 0.05), and HIU (4.48 ± 0.05) did not show a difference (p > 0.05) with C (4.65 ± 0.02). Finally, whole milk did not show a difference (p > 0.05) between treatments (Figure 4). All results presented the same trend as in the ABTS (Figure 2).

3.2.4. ORAC Assay

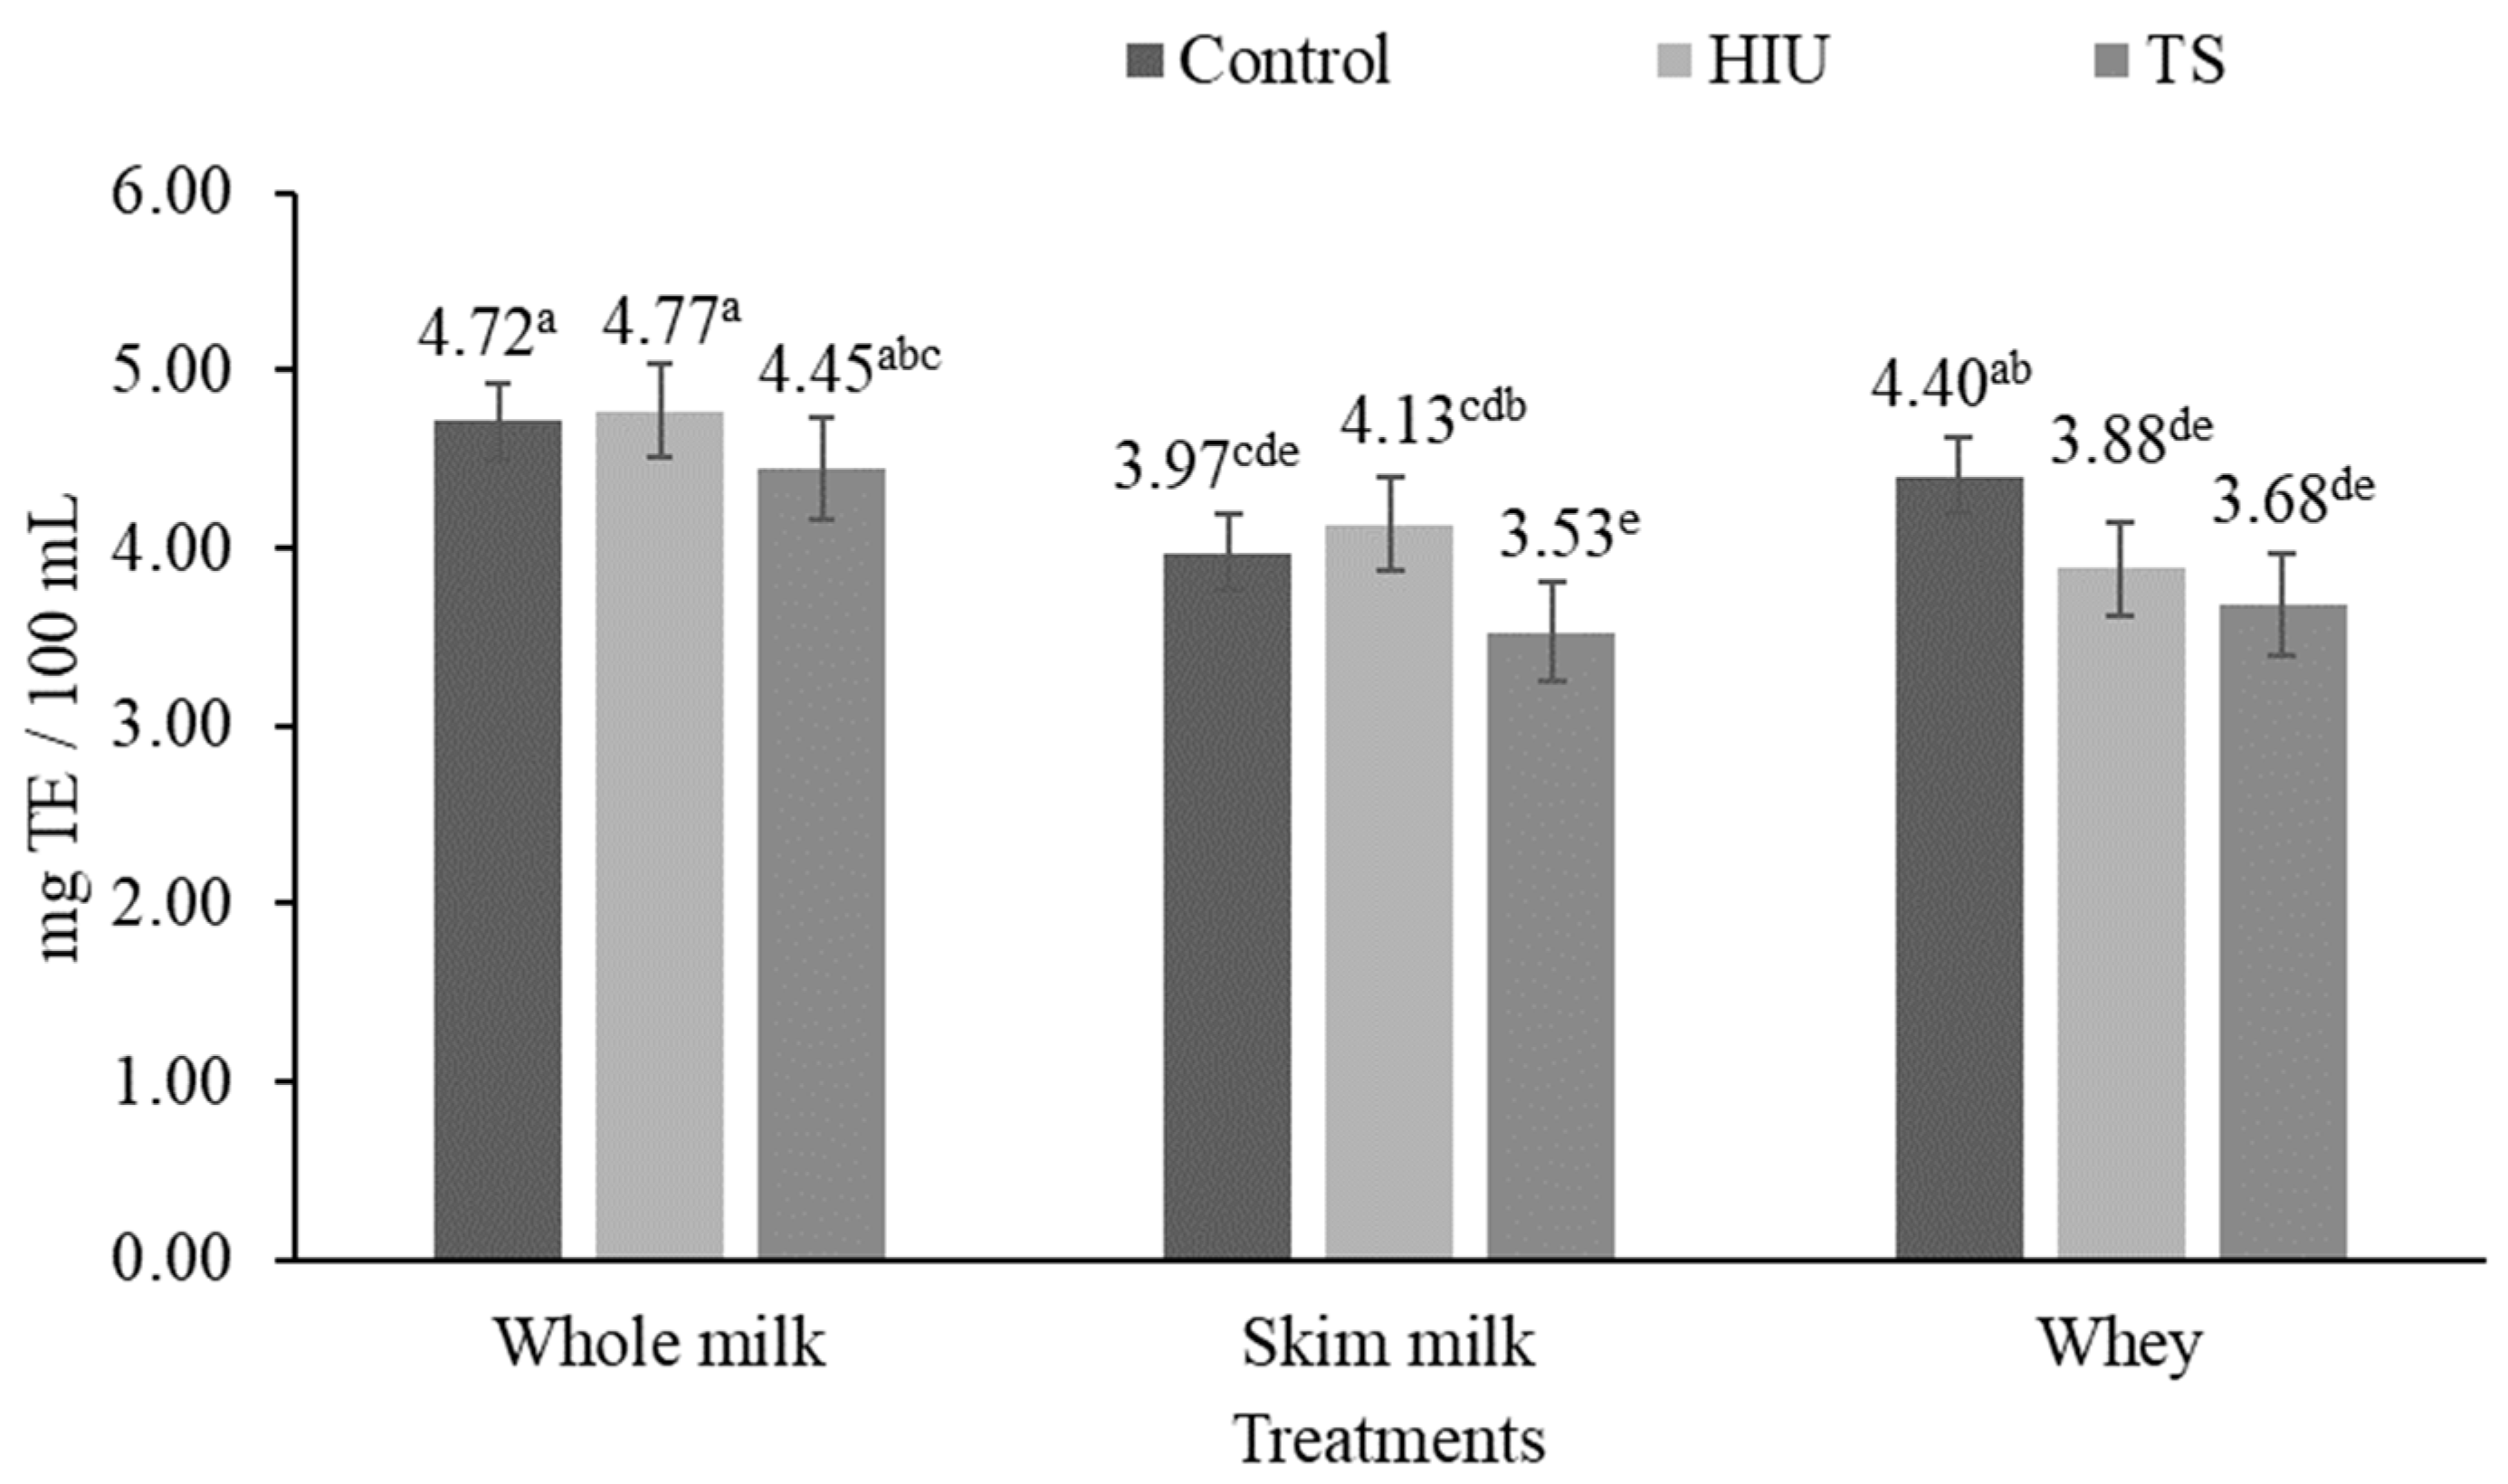
The whole milk did not present differences (p > 0.05) in AA among treatments. In skim milk, TS (3.53 ± 0.20) had the lowest AA (p < 0.05) and HIU the highest AA (4.13 ± 0.08), but the C (3.97 ± 0.07) was not different from HIU and TS (p > 0.05). In whey, C treatment presented the highest AA (p < 0.05) (4.40 ± 0.18) and TS the lowest (3.68 ± 0.27). In conclusion, the lowest AA was found in skim milk TS (3.53 ± 0.20), whey TS (3.68 ± 0.27), whey HIU (3.88 ± 0.15), and skim milk C (3.97 ± 0.07), the same ones that showed no differences between them (p > 0.05) (Figure 5).

3.3. Total Water-Soluble Protein Content

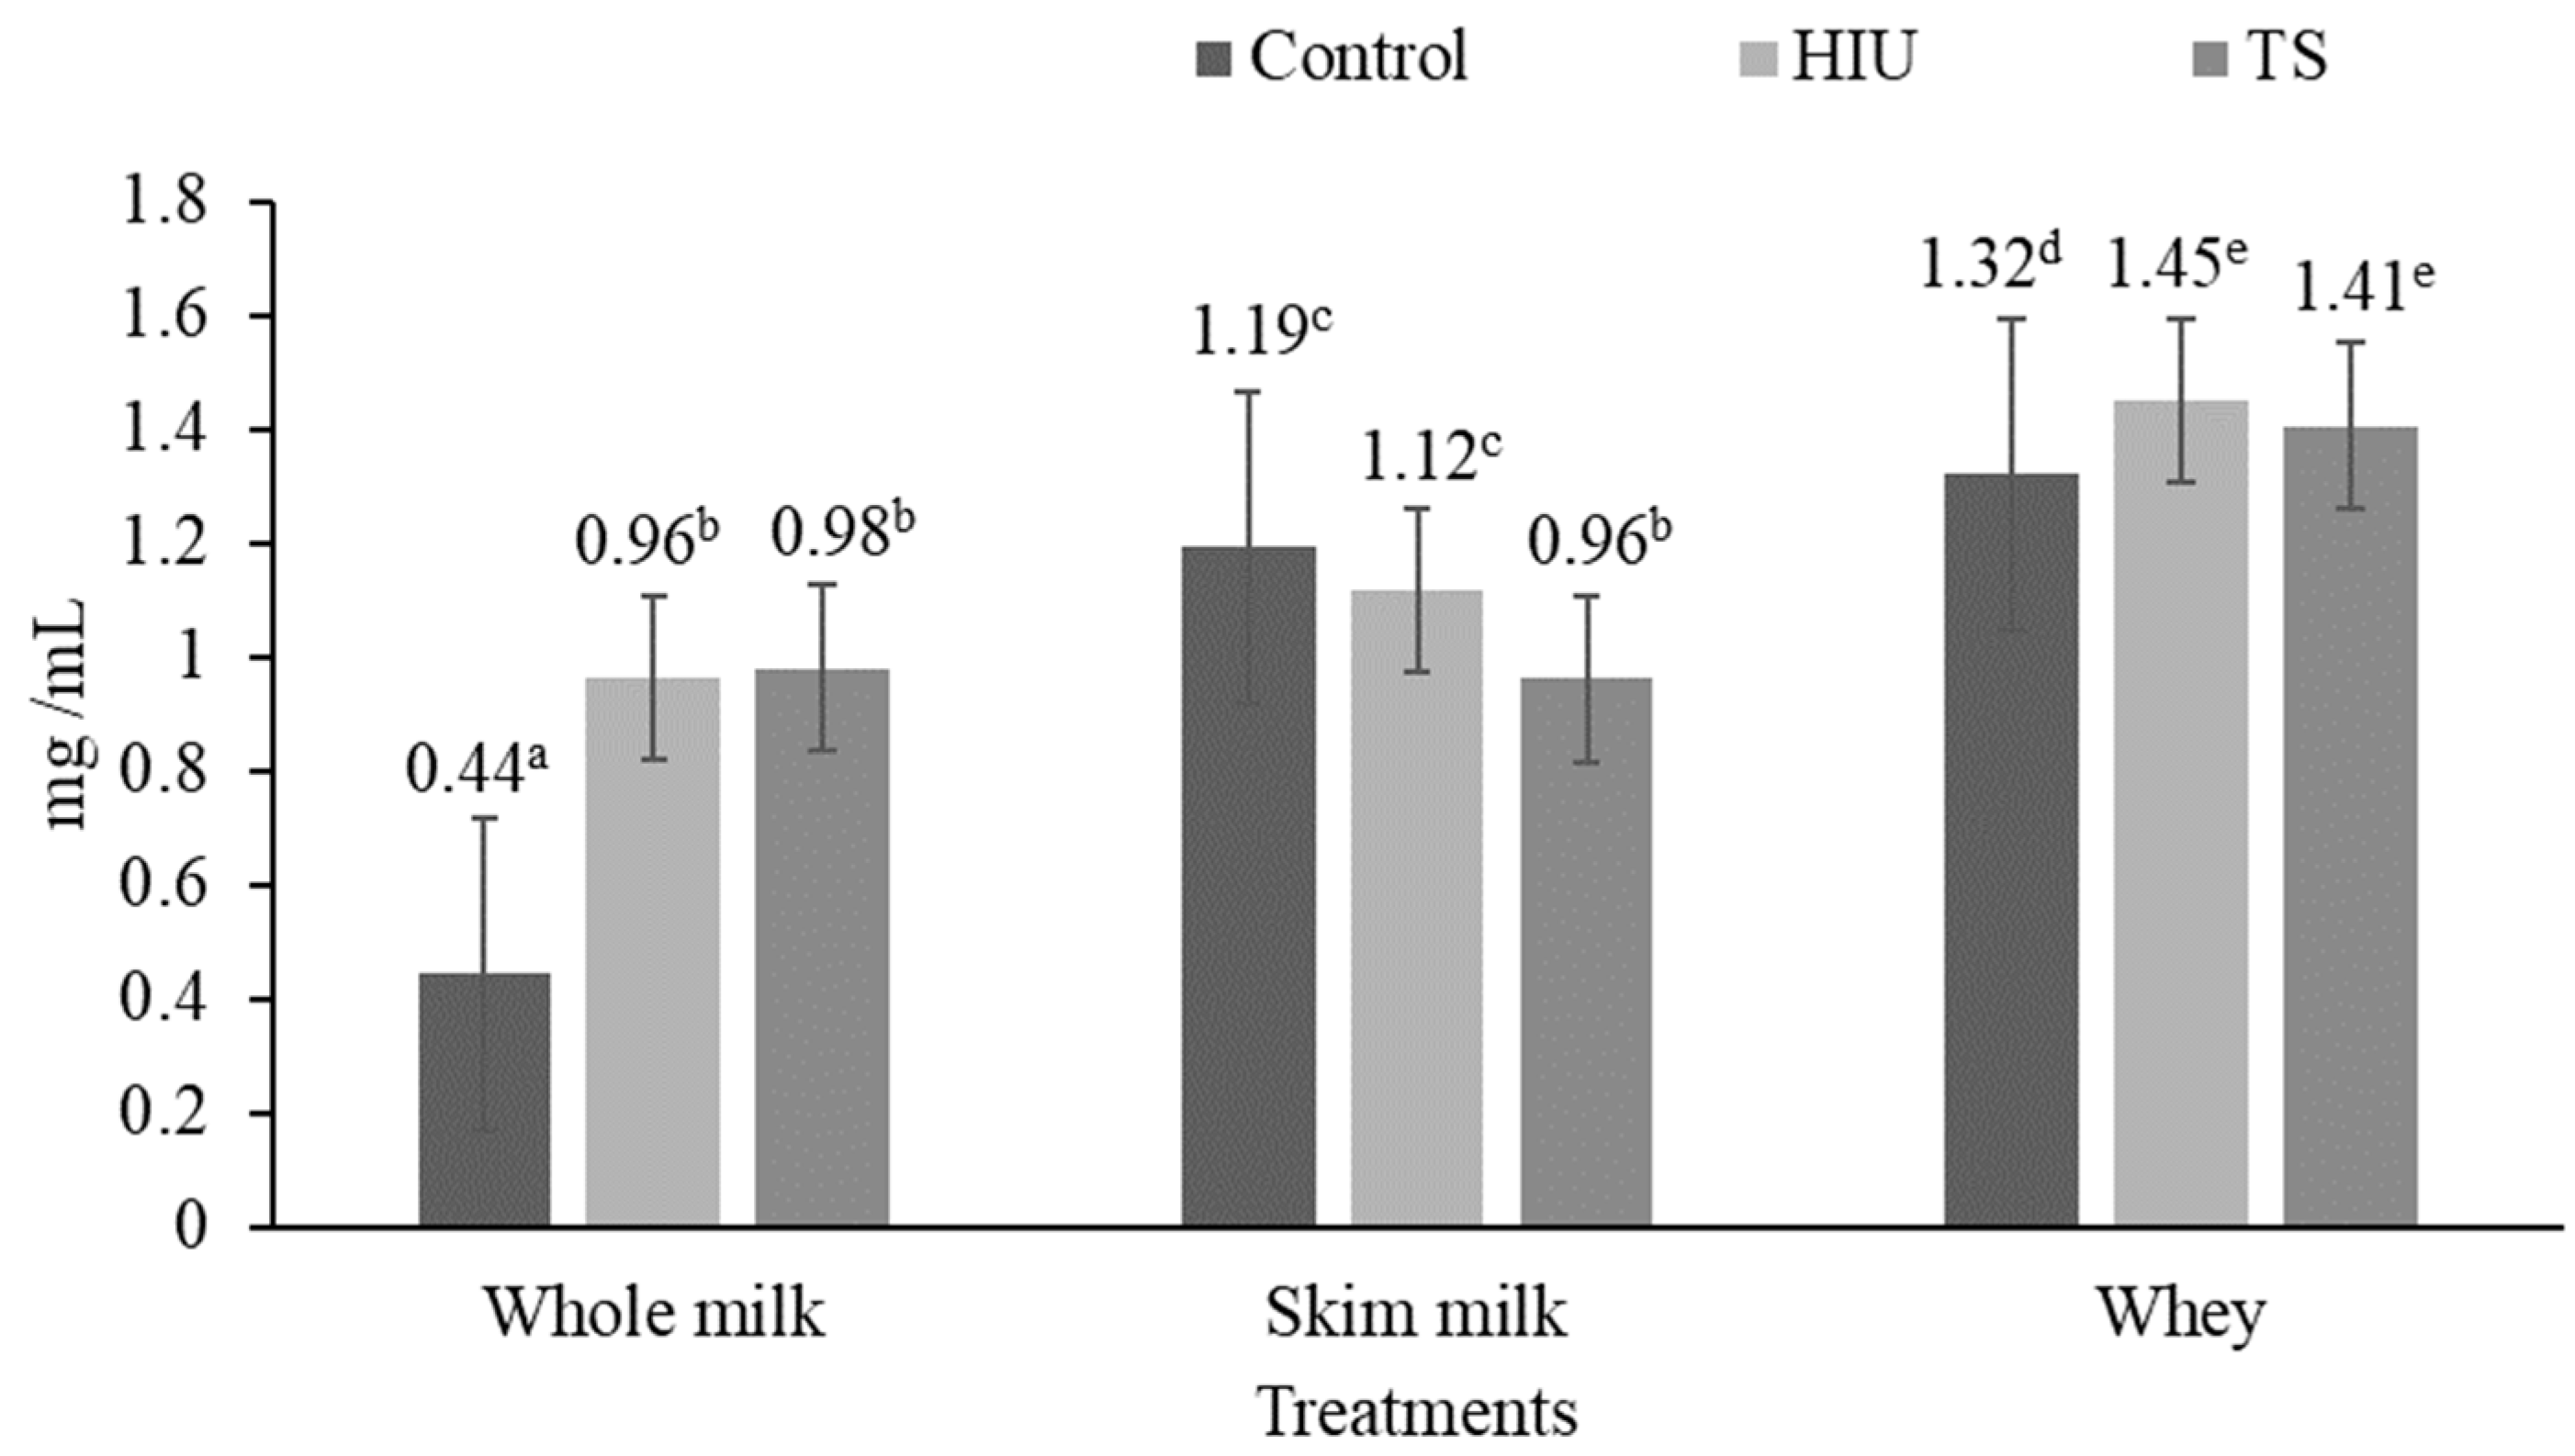
Figure 6 shows the total protein content. In the case of whole milk, HIU (0.96 ± 0.02) and TS (0.98 ± 0.01) presented the highest protein content, although these were equal (p > 0.05), and C had the lowest (0.44 ± 0.004) (p < 0.05). For skim milk, C (1.19 ± 0.02) and HIU (1.12 ± 0.02) had the highest protein content and were statistically equal (p > 0.05), and TS had the lowest (0.96 ± 0.03) (p < 0.05). For whey, HIU and TS (1.45 ± 0.03 and 1.41 ± 0.05, respectively) were not different (p > 0.05) and showed the greatest concentration of protein compared to C (1.32 ± 0.03 (p < 0.05). All C treatments were statistically different (p < 0.05); whey had the highest protein concentration (1.32 ± 0.03), followed by skim milk (1.19 ± 0.02) and whole milk (0.44 ± 0.004). The HIU treatments exhibit the same behavior as C. And for the TS, whole milk and skim milk (0.98 ± 0.01 and 0.96 ± 0.03, respectively) were not different (p > 0.05) and had the lowest (p < 0.05) protein concentration compared to whey (1.41 ± 0.05).

3.4. Proteolysis

The SDS-PAGE profiles displayed different patterns of proteolysis for WSKPs of all treatments (Figure 7). Proteolytic degradation was predominantly observed in WSKPs treatments made from whey substrate, followed by WSKPs from thermosonicated whole or skim milk.

3.5. Cell Membrane Permeability

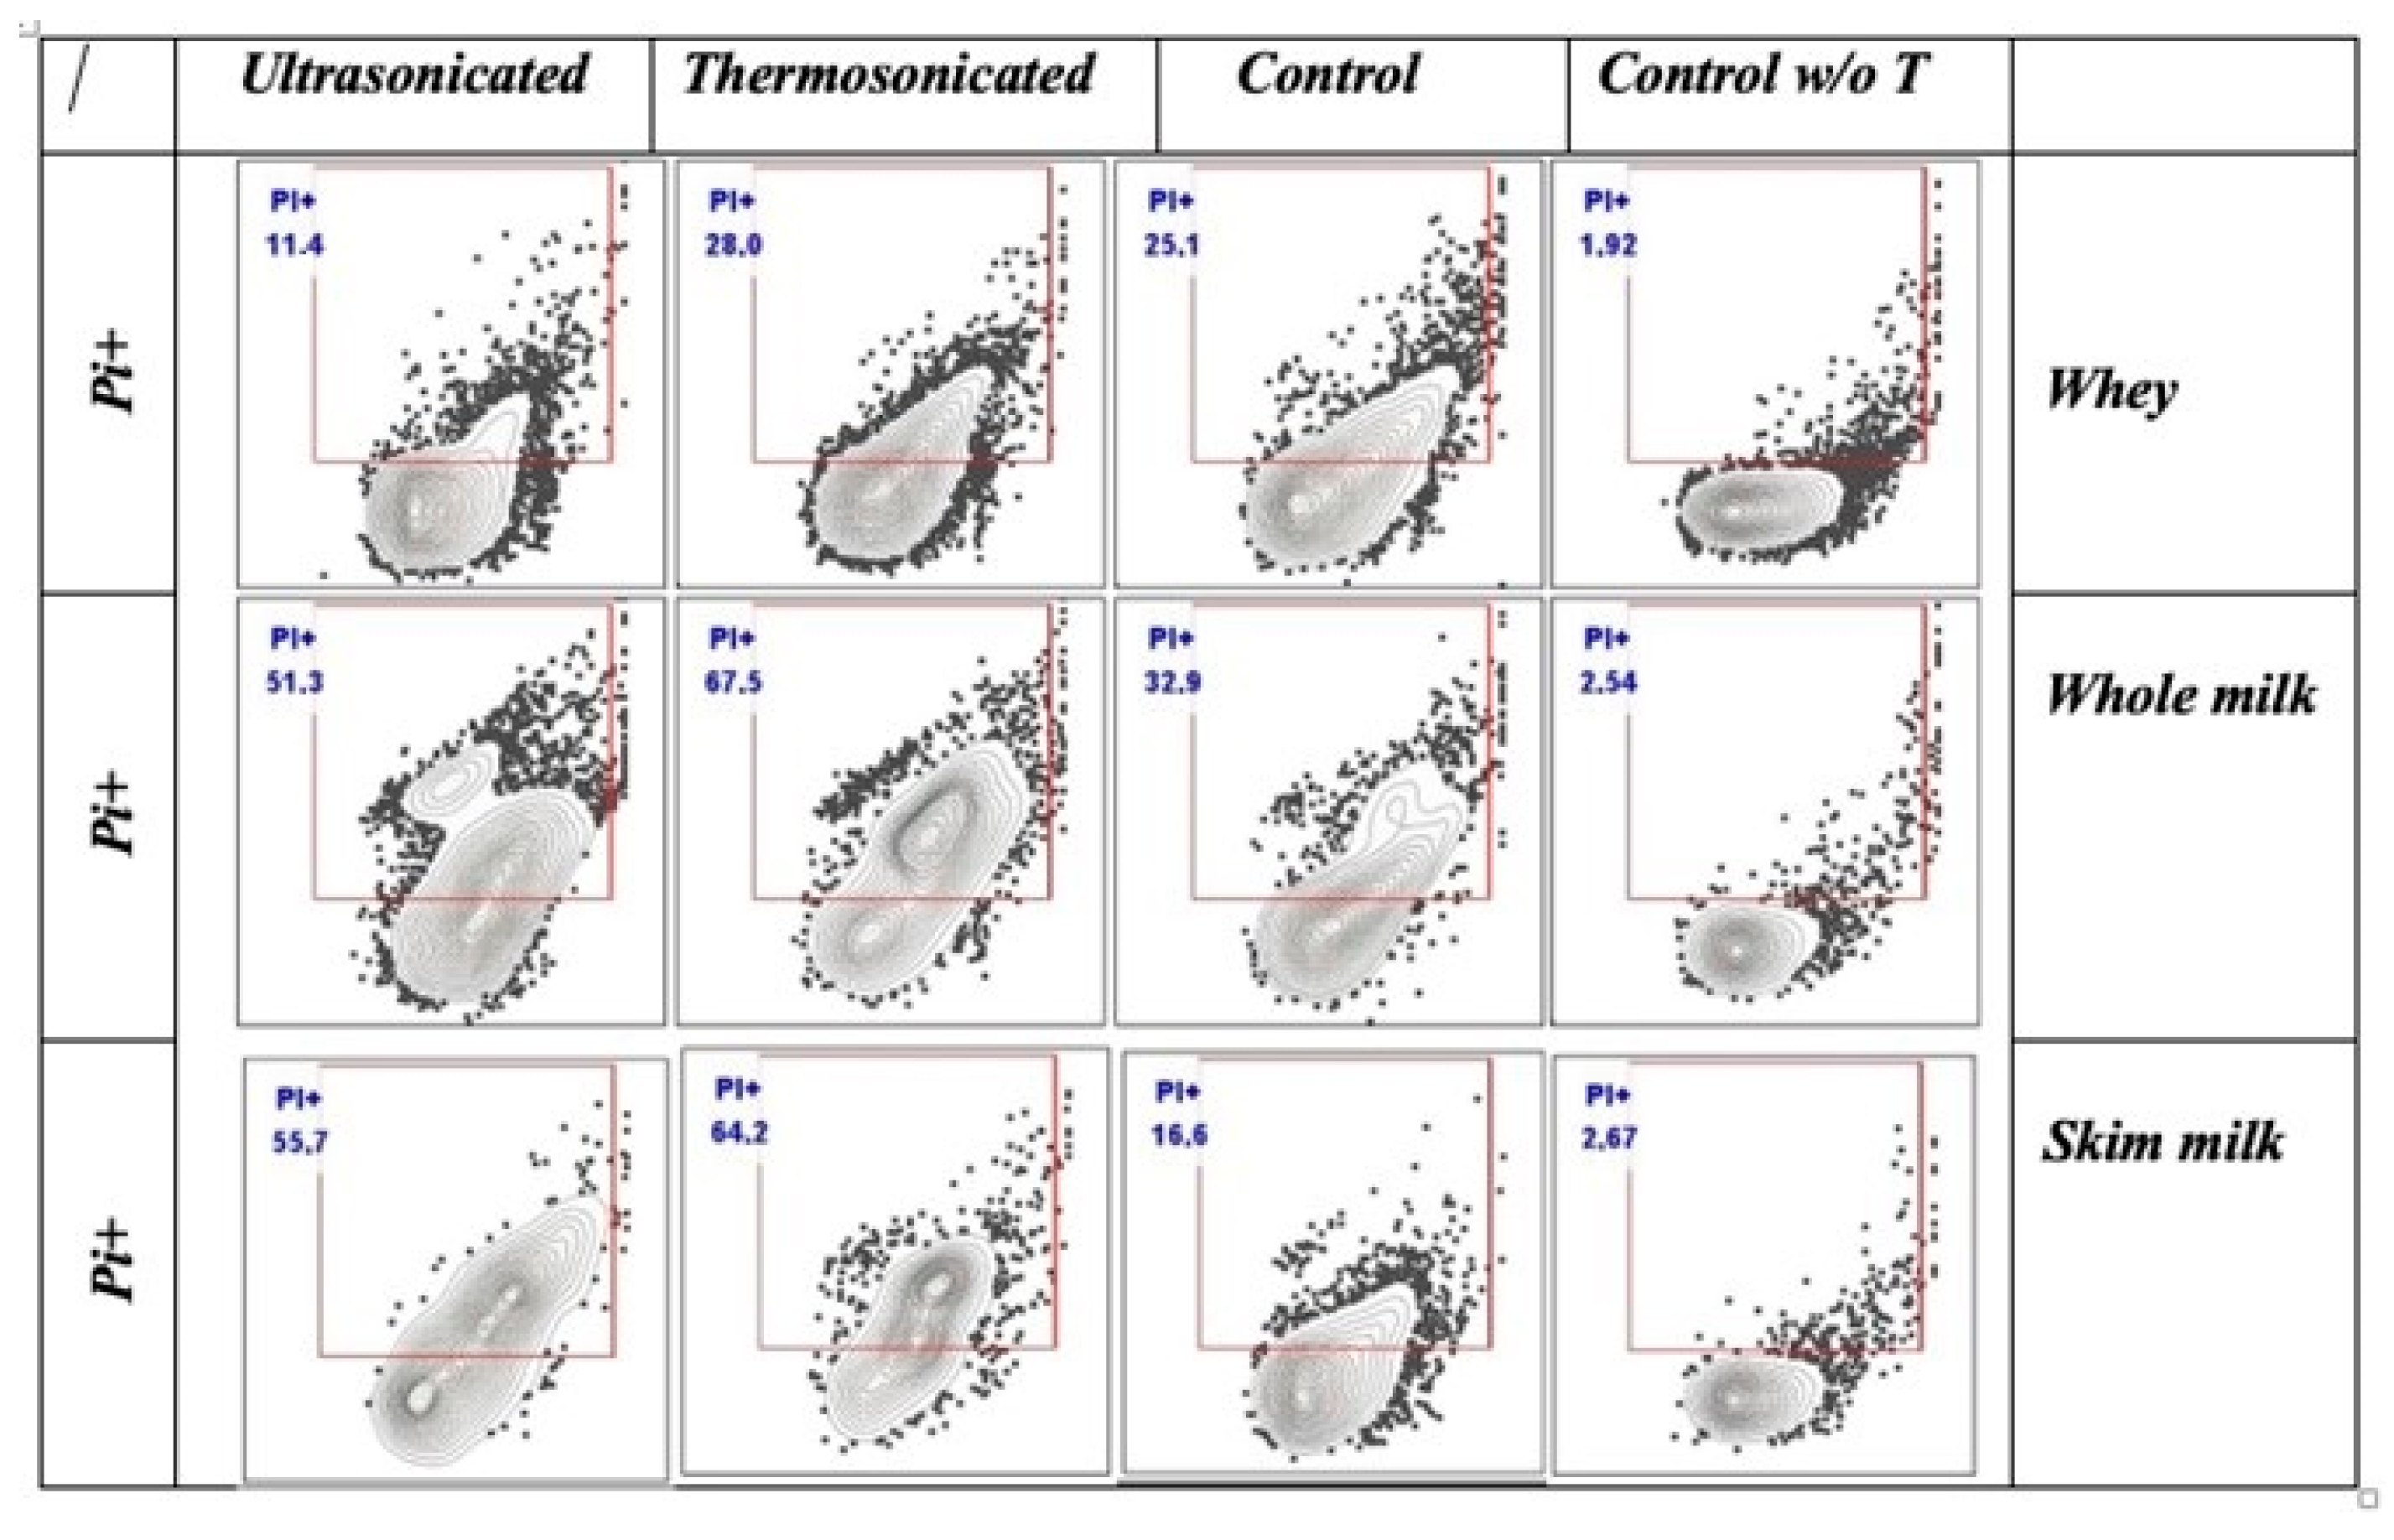
The effect of ultrasonication and thermosonication treatments on cell membrane integrity was expressed as a percentage of dead cells (Figure 8). The TS whey had the highest percentage of dead cells (28%), while the HIU had the lowest (11.4%). The highest percentage of dead cells in whole milk was also observed in the TS (67.5%); although this percentage was more than double that observed using whey as a substrate, the C had the lowest percentage of dead cells (32.9%). For skim milk, the highest percentage of dead cells was observed in the TS (64.2%) and the lowest in the C (16.6%).

4. Discussion

4.1. Potential of Hydrogen (pH)

It can be implied that sonication reduces fermentation times by accelerating lactose consumption through extracellular β-galactosidase accumulation, which is released by sonoporation [32]. However, enhanced lactose hydrolysis upon HIUS or TS before fermentation depended on the type of bacteria [32,33], since these have a variable degree of trans-galactosylation activities and survival rates [32]. Likewise, thermosonicated treatments can also affect the enzyme activity since it reaches a temperature around 60 °C and β-galactosidase starts inactivating at temperatures above 40 °C and inactivates totally above 55 °C [34]. This could explain why the higher pH levels were seen in the thermosonicated treatments. Furthermore, the highest pHs for WSKP from whole and skimmed milk were observed in thermosonicated treatments. This could be because these treatments showed the highest percentages of death cells, which leads to a reduction in the production of the β-galactosidase. Lastly, β-galactosidase activity is lower in UHT skim milk compared to UHT whole milk [35], and three of the five strains that make up the kefir culture are homofermentative.

4.2. Antioxidant Activity

The DPPH methodology’s results were similar to those of the ABTS methodology. Various assays can be used to determine the antioxidant activity of foods. ABTS (2,2′-azino-bis ethylbenzothiazoline-6-sulfonic acid), DPPH (2,2-diphenyl-1-picrylhydrazyl) and FRAP (ferric reducing antioxidant power) are examples of proton radical scavenging assays. The ABTS assay is very sensitive; it detects a wide variety of antioxidant compounds, and it can be employed in both hydrophilic and lipophilic systems, which makes it suitable for a variety of samples. The DPPH method is deemed more reproducible and simpler; however, it is only recommended in hydrophilic samples; hence, it is less versatile than ABTS. In contrast to ABTS, the FRAP test detects the reduction of ferric (Fe3+) to ferrous (Fe2+) ions; however, it is less sensitive to hydrophobic antioxidants. Lastly, the ORAC is a common technique for assessing antioxidant activity; it measures the absorption capacity of oxygen radicals.
It is often used in conjunction with other assays, such as DPPH and FRAP, to obtain a more comprehensive assessment of the antioxidant activity of a particular food [36,37]. As observed in Figure 2, Figure 3 and Figure 4, WSKPs obtained from whey substrate showed the highest AA, and specifically, WSKP from whey without any treatment presented greater AA than HIU and TS.
The high antioxidant potential of milk is given mostly by proteins [38]. However, β-lactoglobulin, a major soluble protein, accounts for approximately 10 to 15% of total milk proteins and contributes approximately 50% of total activity, which is attributed to its high content of sulfur-containing amino acids. In addition, AA in whey protein is due to the content of histidine and other hydrophobic amino acids. However, protein content, degree of protein hydrolysis, and denaturation also play an important role, since peptides with AA area are released during whey protein hydrolysis [39]. The above could explain the higher AA observed in the WSKP from whey, since these treatments presented a higher concentration of soluble proteins (Figure 6) and a greater presence of β-lactoglobulin (Figure 2). Yilmaz-Ersan et al. [17] investigated the AA of kefir elaborate with either grain or commercial starter cultures and reported that AA was greater in the kefir made with commercial starter culture. The ABTS assay showed that the AA of kefir made with a starter culture was below 5 mg TE/100 mL after 8 h of fermentation [17]. The WSKP obtained from whey or skim milk and using HIU or without any treatment showed AA higher than this value; specifically, WSKP from whey presented values between 9.39 and 11.11 mg TE/100 mL. However, the AA analyzed by the ABTS method had higher values (~15 mg TE/100 mL) at the end of the fermentation than those obtained in this study (5.53–12.77 mg TE/100 mL) [17]. Finally, with the FRAP assay, the values were similar, ~6 mg TE/100 mL vs. 5.18, respectively.
In skim milk, the control treatment showed the highest AA by DPPH, ABTS, and FRAP assays; nevertheless, this treatment had the highest percentage of dead cells. On the other hand, the TS had the best survival rate (Figure 2) but the lowest AA. Another study by Gagnon et al. [40] found, in milk fermented with Bifidobacterium longum subsp. longum, that the antioxidant bioaccessibility was higher in the milk that had the lowest survival rate in the upper gastrointestinal tract. Conversely, the milk with the highest survival rate had the lowest antioxidant bioavailability. The above suggests that the antioxidant activity, in this treatment, comes mainly from the substrate. Skim milk contains the enzyme superoxide dismutase (SOD), which catalyzes the removal of superoxide free radicals (02). In cow’s milk, SOD is exclusively present in the skim milk fraction, with a concentration of 0.15 mg to 2.4 mg/L [41]. In addition, thermosonication can provoke changes in the antioxidant capacity of milk by inducing the formation of free radicals, which can oxidize milk components, potentially reducing the overall antioxidant activity [42,43]. In addition, thermosonication can cause protein denaturation, which in turn alters their structure and functional properties. This can affect the ability of proteins to act as antioxidants since their structural integrity is essential to maintaining their antioxidant capacity. Thermosonication can also cause a slight decrease in soluble proteins as the frequency and duration of thermosonication increase, leading to changes in antioxidant capacity [42,43,44].
The results show that WSKPs from whole milk, skimmed milk, and whey present antioxidant activity. However, it is difficult to compare these results with those obtained in other investigations due to the wide range of techniques used to evaluate and report AA.

4.3. Total Water-Soluble Protein Content

Bovine milk contains two predominant proteinaceous components: casein and whey. Caseins are primarily made up of s1-, s2-, β-, and κ-caseins; all of them represent about 80%. Around 80% of milk proteins are soluble; they are made up of β-lactoglobulin, α-lactalbumin, serum albumin, immunoglobulins, lactoferrin, and other smaller parts [45]. In general, WSKPs from skim milk had a higher content of soluble proteins compared to WSKPs from whole milk; this could be associated with the interaction between fat globules in whole milk and the proteins, especially caseins, which form less soluble complexes. When fat is removed to produce skimmed milk, this interaction is reduced, resulting in a greater proportion of proteins remaining in the soluble phase [46].
Additionally, skimmed milk tends to contain a higher concentration of whey proteins (relative to caseins) than whole milk. Whey protein is naturally more soluble than casein protein. Defatting does not change the protein content of whey; the relative amount of soluble protein in skimmed milk is maintained or even increased [47]. Furthermore, the content of β-lactoglobulin has been found to be higher in the ultracentrifugation supernatants of skim milk than in those of whole milk [46]. In addition, WSKPs from whey presented a higher concentration of soluble proteins than WSKPs from skim milk. There are more soluble proteins in liquid whey than in skimmed milk. This is because it has more whey proteins, mostly β-lactoglobulin and α-lactalbumin. After all, the less soluble caseins are taken out when cheese is made [46]. In addition, whey is usually processed under conditions that preserve the solubility of its proteins better than skimmed milk. Also, HIU did not affect the solubility of whey proteins; this result is consistent with previous studies [48,49].

4.4. Proteolysis

The SDS profiles can be separated into two areas. Area A corresponds to high-molecular-weight components (50–250 kDa) such as proteose-peptone (86 kDa), immunoglobulins (150 kDa), and bovine serum albumin (BSA, 66–68 kDa), while Area B corresponds to 10–40 kDa, containing the most important milk proteins, including α-, β-, and κ-caseins, β-lactoglobulin (14–17 kDa), and α-lactalbumin (12–13 kDa) [50,51]. The SDS-PAGE analysis shows that chemical bonds were made between whey and casein proteins in all three whey treatments (TS, HIU, and C). Some of these complexes are soluble under experimental conditions and are characterized by the high-molecular-weight fractions in Area A. These complexes were not detected in the whole or skim milk, indicating that the casein micelle did not disaggregate. However, the WSKP from whole and skim milk TS showed bands in the range of 23 to 30 kDa, where α-, β-, and κ-caseins are located, although bands presented in WSKP from skim milk TS were more pronounced. This suggests that when thermosonication was applied, skim milk was more susceptible to casein micelle disruption than whole milk.
Studies found that after UHT treatment, whey protein hydrolysis was about 20% higher in skim milk than in whole milk. Also, the concentration of β-lactoglobulin was higher in the skim milk supernatant at the start of storage than in those from whole milk [46,52]. The same was observed in the WSKPs obtained from the control treatments of whole and skim milk. Meanwhile, WSKPs from whey showed a pronounced band corresponding to a molecular weight of approximately 25 kDa. This could correspond to the presence of albumin, indicating that all WSKPs from whey were rich in albumin. Similar results were observed in whey protein isolate (2% w/v) when applying HIU (30% amplitude, 5 s/5 s for 6 min) [49]. Finally, all the WSKPs treatments had bands in the 3–15 kDa range. These bands are made up of small peptides, β-lactoglobulin, and α-lactalbumin. However, the bands were stronger in the WSKPs from whey (TS, HIU, and C). This finding can be attributed to the higher content of water-soluble proteins in these treatments (Figure 6).
Additionally, enzymes such as aminopeptidases, proteinases, and peptidases are produced by kefir culture microorganisms [53]. These enzymes may play a part in the creation of small and intermediate peptides because of the primary hydrolysis of chymosin residues [54]. According to the results, it can be concluded that thermosonication has a proteolytic effect in whole and skim milk but not in whey. Since there was no evident change in the protein bands after HIU and TS, this suggests that the primary structure and molecular weight of proteins found in WSKP remained unchanged. In a previous study where whey protein isolate was treated for up to 40 min at 600 W of sonication power, similar results were reported [55]. Cheese-making heat and culture-released proteases may cause whey proteolysis.

4.5. Cell Membrane Permeability

The observed results show that treatment and substrate affect dead cell percentage. The highest percentages of dead cells were observed in TS that used whey or whole milk as a substrate. This can be attributed to the irreversible damage caused by the ultrasonoporation. The changes in the chemical bonds and cell membrane protein structure also favor membrane permeability.
Likewise, it was observed that when using whey as a substrate in the control and ultrasonicated treatments, the percentage of dead cells was lower than those observed when using whole or skim milk as a substrate. The survival of microorganisms that are part of the kefir culture, as well as their concentration and produced metabolites, differ depending on the source of carbon and energy (substrate used) available for fermentation [56,57].
Compared to whole or skim milk, whey contains a high concentration of easily metabolizable nutrients, particularly lactose, amino acids, peptides, and soluble proteins that are readily available for microbial consumption and growth. And, unlike whole milk, whey does not contain significant amounts of fat or casein, which can sometimes inhibit microbial growth or obstruct the fermentation process. In addition, some nutrients in whole and skim milk may be bound to more complex structures. Meanwhile, whole and skim milk presented the highest percentage of dead cells in the thermosonicated treatments. These treatments showed the highest degree of proteolysis compared to their respective control treatments (Figure 7). The above suggests that thermosonication caused greater cellular damage and a greater degree of proteolysis.
Finally, the kefir culture consisted of Lactococcus lactis subsp. cremoris, Lactococcus lactis subsp. lactis biovar diacetylactis, Lactococcus lactis subsp. lactis, Leuconostoc, and Streptococcus thermophilus. The effect of HIU or TS on these microorganisms has been demonstrated to be different, which may have influenced the results. Ultrasounds can interfere with bacterial metabolisms, and lactic acid bacteria could tolerate them at different intensities [58]. Lactococcus lactis spp. cremoris and Lactococcus lactis spp. lactis are less affected by ultrasound than Lactobacillus acidophilus and Lactobacillus casei [59], indicating that these bacteria do not receive as much damage from ultrasound. Whether or not ultrasound affects bacteria will depend on the sonication condition, type of substrate used, and microorganism characteristics [58]. Meanwhile, the effect of thermosonication is different for all microorganisms because the microbial inactivation is also influenced by their type, shape, or diameter [60].

5. Conclusions

This study aimed to investigate the effects of HIUS and thermosonication in three different substrates (whole and skim milk and whey) on the antioxidant activity of WSKP. In general, WSKP’s antioxidant activity was directly affected by the type of substrate and method of obtaining it. The WSKP obtained using whey as a substrate and without any treatment presented the greatest antioxidant activity. Likewise, the treatments that used whey as a substrate presented the highest protein concentrations, the lowest percentages of cell death, and the highest degrees of proteolysis, but without observing differences between treatments. This may be due to whey’s high degree of hydrolysis, which is caused by residual bacterial enzymes from the cheese-making cultures. These enzymes, through their activity, provide a highly bioavailable substrate for the growth of the strains in the kefir culture. Therefore, whey and kefir culture are potential candidates to produce postbiotics with antioxidant activity, which can afford protection against proton-free radicals.

Author Contributions

Conceptualization, A.C.-M. and R.A.R.-V.; data curation, E.S.-E.; formal analysis, G.C.-A., G.P.E.-S., M.M.A.-S. and N.A.B.-J.; funding acquisition, A.C.-M.; investigation, G.C.-A., N.A.B.-J. and M.M.A.-S.; methodology, A.C.-M., M.M.A.-S., G.P.E.-S. and R.A.R.-V.; project administration, A.C.-M.; supervision, A.C.-M., R.A.R.-V., R.S.-V., J.M.T.-G. and A.L.R.-M.; writing—original draft, G.C.-A.; writing—review and editing, A.C.-M., A.L.R.-M., R.S.-V., J.M.T.-G. and G.P.E.-S. All authors have read and agreed to the published version of the manuscript.

Funding

This research received no external funding.

Institutional Review Board Statement

Not applicable.

Informed Consent Statement

Not applicable.

Data Availability Statement

The data presented in this study are available on request from the corresponding author.

Acknowledgments

The authors acknowledge that the Universidad Autónoma de Chihuahua supported this investigation. The Science and Technology National Council of Mexico (CONACYT) provided a graduate study scholarship for Gerardo Chavez-Alzaga.

Conflicts of Interest

The authors declare no conflicts of interest.

References

  1. FAO/WHO. Evaluation of Health and Nutritional Properties of Probiotics in Food Including Powder Milk with Live Lactic Acid Bacteria; FAO/WHO: Cordoba, Argentina, 2001. [Google Scholar]
  2. Zepeda-Hernández, A.; Garcia-Amezquita, L.E.; Requena, T.; García-Cayuela, T. Probióticos y prebióticos en productos lácteos y su efecto sobre la diabetes tipo 2. Alimentaria 2021, 526, 98–105. Available online: http://hdl.handle.net/10261/263844 (accessed on 15 May 2024).
  3. Żółkiewicz, J.; Marzec, A.; Ruszczyński, M.; Feleszko, W. Postbiotics: A step beyond pre-and probiotics. Nutrients 2020, 12, 2189. [Google Scholar] [CrossRef] [PubMed]
  4. Salminen, S.; Collado, M.C.; Endo, A.; Hill, C.; Lebeer, S.; Quigley, E.M.; Vinderola, G. The International Scientific Association of Probiotics and Prebiotics (ISAPP) consensus statement on the definition and scope of postbiotics. Nat. Rev. Gastroenterol. Hepatol. 2021, 18, 649–667. [Google Scholar] [CrossRef]
  5. Bolivar-Jacobo, N.A.; Reyes-Villagrana, R.A.; Chávez-Martínez, A. Relación entre probióticos-postbióticos y sus principales efectos bioactivos. Tecnociencia Chihuah. 2021, 15, 124–139. [Google Scholar] [CrossRef]
  6. Wegh, C.A.; Geerlings, S.Y.; Knol, J.; Roeselers, G.; Belzer, C. Postbiotics and their potential applications in early life nutrition and beyond. Int. J. Mol. Sci. 2019, 20, 4673. [Google Scholar] [CrossRef] [PubMed]
  7. Aguilar-Toalá, J.E.; Garcia-Varela, R.; Garcia, H.S.; Mata-Haro, V.; González-Córdova, A.F.; Vallejo-Cordoba, B.; Hernández-Mendoza, A. Postbiotics: An evolving term within the functional foods field. Trends Food Sci. Technol. 2018, 75, 105–114. [Google Scholar] [CrossRef]
  8. Malashree, L.; Angadi, V.; Yadav, K.S.; Prabha, R. “Postbiotics”: One Step Ahead of Probiotics. Int. J. Curr. Microbiol. Appl. Sci. 2019, 8, 2049–2053. [Google Scholar] [CrossRef]
  9. Feng, H.; Luo, N.; Xiong, X.; Wu, Y. Prevalence of food allergy in the Chinese population: A systematic review and meta-analysis of population-based studies. Allergy Asthma Proc. 2023, 44, 315–325. [Google Scholar] [CrossRef]
  10. Hayes, E.; Wallace, D.; O’Donnell, C.; Greene, D.; Hennessy, D.; O’Shea, N.; Tobin, J.T.; Fenelon, M.A. Trend analysis and prediction of seasonal changes in milk composition from a pasture-based dairy research herd. JDS 2023, 106, 2326–2337. [Google Scholar] [CrossRef]
  11. Ait-Lhaj, F.; Elhamri, H.; Ait-Lhaj, Z.; Malisch, R.; Kypke, K.; Kabriti, M.; El Hajjaji, S.; Bellaouchou, A. First WHO/UNEP survey of the current concentrations of persistent organic pollutants in human milk in Morocco. Food Addit. Contam. Part A Chem. Anal. Control Expo. Risk Assess. 2023, 40, 282–293. [Google Scholar] [CrossRef]
  12. Müller, A.C.; Herter, J.; Huber, R.; Storz, M.A. Potential renal acid load of non-dairy plant-based milk alternatives. Int. J. Food Prop. 2023, 26, 2128–2136. [Google Scholar] [CrossRef]
  13. Çakir-Biçer, N.; Baş, D.; Seçkiner, S.; Kahriman, M.; Baş, M. Evaluation of Consumers’ Perceptions and Purchase Decisions Regarding Plant-Based Milk Alternatives in Turkey. IDUHeS 2023, 6, 82–102. [Google Scholar] [CrossRef]
  14. Pointke, M.; Albrecht, E.; Geburt, K.; Gerken, M.; Traulsen, I.; Pawelzik, E. A Comparative Analysis of Plant-Based Milk Alternatives Part 1: Composition, Sensory, and Nutritional Value. Sustainability 2022, 14, 7996. [Google Scholar] [CrossRef]
  15. Antunes, I.C.; Bexiga, R.; Pinto, C.; Roseiro, L.C.; Quaresma, M.A.G. Cow’s Milk in Human Nutrition and the Emergence of Plant-Based Milk Alternatives. Foods 2022, 12, 99. [Google Scholar] [CrossRef] [PubMed]
  16. da Silva-Vale, A.; de Melo-Pereira, G.V.; de Oliveira, A.C.; de Carvalho-Neto, D.P.; Herrmann, L.W.; Karp, S.G.; Soccol, V.T.; Soccol, C.R. Production, Formulation, and Application of Postbiotics in the Treatment of Skin Conditions. Fermentation 2023, 9, 264. [Google Scholar] [CrossRef]
  17. Dunand, E.; Burns, P.; Binetti, A.; Bergamini, C.; Peralta, G.H.; Forzani, L.; Reinheimer, J.; Vinderola, G. Postbiotics produced at laboratory and industrial level as potential functional food ingredients with the capacity to protect mice against Salmonella infection. J. Appl. Microbiol. 2019, 127, 282–295. [Google Scholar] [CrossRef]
  18. Pimentel, T.C.; Cruz, A.G.; Pereira, E.A.; Costa, W.K.A.; Rocha, R.T.S.; Pedrosa, G.R.; Alves, C.S.; Alvarenga, J.M.; Ortiz, V.; Sant’Ana, A.S.; et al. Postbiotics: An overview of concepts, inactivation technologies, health effects, and driver trends. Trends Food Sci. Technol. 2023, 132, 103–116. [Google Scholar] [CrossRef]
  19. Encinas-Vazquez, I.A.; Carrillo-Pérez, E.; Mártin-García, A.R.; Del-Toro-Sánchez, C.L.; Márquez-Ríos, E.; Bastarrachea, L.J.; Rodríguez-Figueroa, J.C. Effects of High-Intensity Ultrasound Pretreatment on the Exopolysaccharide Concentration and Biomass Increase in Cheese Whey Kefir. Processes 2023, 11, 1905. [Google Scholar] [CrossRef]
  20. Abdullah, N.; Chin, N.L. Application of Thermosonication Treatment in Processing and Production of High Quality and Safe-to-Drink Fruit Juices. Agric. Agric. Sci. Procedia 2014, 2, 320–327. [Google Scholar] [CrossRef]
  21. Anaya-Esparza, L.M.; Velázquez-Estrada, R.M.; Roig, A.X.; García-Galindo, H.S.; Sayago-Ayerdi, S.G.; Montalvo-González, E. Thermosonication: An alternative processing for fruit and vegetable juices. Trends Food Sci. Technol. 2017, 61, 26–37. [Google Scholar] [CrossRef]
  22. Nguyen, T.M.P.; Lee, Y.K.; Zhou, W. Stimulating fermentative activities of bifidobacteria in milk by high-intensity ultrasound. Int. Dairy J. 2009, 19, 410–416. [Google Scholar] [CrossRef]
  23. Dahroud, B.D.; Mokarram, R.R.; Khiabani, M.S.; Hamishehkar, H.; Bialvaei, A.Z.; Yousefi, M.; Kafil, H.S. Low intensity ultrasound increases the fermentation efficiency of Lactobacillus casei subsp. casei ATTC 39392. Int. J. Biol. Macromol. 2016, 86, 462–467. [Google Scholar] [CrossRef]
  24. Liu, J.; Lin, Y.; Chen, M.; Chen, L.; Lin, C. Antioxidative Activities of Kefir. Anim. Biosci. 2005, 18, 567–573. [Google Scholar] [CrossRef]
  25. Yilmaz-Ersan, L.; Ozcan, T.; Akpinar-Bayizit, A.; Sahin, S. Comparison of antioxidant capacity of cow and ewe milk kefirs. JDS 2018, 101, 3788–3798. [Google Scholar] [CrossRef]
  26. Kesenkaş, H.; Dinkci, N.; Seçkin, A.K.; Kinik, Ö.; Gönç, S. Antioxidant Properties of Kefir Produced from Different Cow and Soymilk Mixtures. JAS 2011, 17, 253–259. [Google Scholar] [CrossRef]
  27. Satir, G.; Guzel-Seydim, Z. Influence of Kefir fermentation on the bioactive substances of different breed goat milks. LWT Food Sci. Technol. 2015, 63, 852–858. [Google Scholar] [CrossRef]
  28. Bolívar-Jacobo, N.A.; Reyes-Villagrana, R.A.; Espino-Solís, G.P.; Rentería-Monterrubio, A.L.; Arévalos-Sánchez, M.M.; Sánchez-Vega, R.; Santellano-Estrada, E.; Chávez-Flores, D.; Chávez-Martínez, A. The Effects of a High-Intensity Ultrasound on the Fermentative Activity and Kinetic Growth of Lactobacillus acidophilus and Lactobacillus helveticus. Fermentation 2023, 9, 356. [Google Scholar] [CrossRef]
  29. Thaipong, K.; Boonprakob, U.; Crosby, K.; Cisneros-Zevallos, L.; Hawkins Byrne, D. Comparison of ABTS, DPPH, FRAP, and ORAC assays for estimating antioxidant activity from guava fruit extracts. J. Food Compos. Anal. 2006, 19, 669–675. [Google Scholar] [CrossRef]
  30. Bradford, M.M. A Rapid and Sensitive Method for the Quantitation of Microgram Quantities of Protein Utilizing the Principle of Protein-Dye Binding. Anal. Biochem. 1976, 72, 248–254. [Google Scholar] [CrossRef]
  31. Ong, L.; Shah, N.P. Probiotic cheddar cheese: Influence of ripening temperatures on proteolysis and sensory characteristics of cheddar cheeses. J. Food Sci. 2009, 74, 182–191. [Google Scholar] [CrossRef]
  32. Nguyen, T.M.P.; Lee, Y.K.; Zhou, W. Effect of high-intensity ultrasound on carbohydrate metabolism of bifidobacteria in milk fermentation. Food Chem. 2012, 130, 866–874. [Google Scholar] [CrossRef]
  33. Wang, D.; Sakakibara, M. Lactose hydrolysis and β-galactosidase activity in sonicated fermentation with Lactobacillus strains. Ultrason. Sonochem. 1997, 4, 255–261. [Google Scholar] [CrossRef] [PubMed]
  34. Popescu, L.; Viorica, B.; Rodica, S. Effect of Temperature, pH and Amount of Enzyme Used in the Lactose Hydrolysis of Milk. FNS J. 2021, 12, 1243–1254. [Google Scholar] [CrossRef]
  35. Bosso, A.; Morioka, L.R.; Santos, L.F.; Suguimoto, H.H. Lactose Hydrolysis Potential and Thermal Stability of Commercial β-Galactosidase in UHT and Skimmed Milk. FS&T J. 2016, 36, 159–165. [Google Scholar] [CrossRef]
  36. Carvalho, J.R.B.; Meireles, A.N.; Marques, S.S.; Gregório, B.J.R.; Ramos, I.I.; Silva, E.M.P.; Barreiros, L.; Segundo, M.A. Exploiting Kinetic Features of ORAC Assay for Evaluation of Radical Scavenging Capacity. Antioxidants 2023, 12, 505. [Google Scholar] [CrossRef]
  37. Amorati, R.; Valgimigli, L. Advantages and limitations of common testing methods for antioxidants. Free Radic. Res. 2015, 49, 633–649. [Google Scholar] [CrossRef]
  38. Grażyna, C.; Hanna, C.; Adam, A.; Magdalena, B.M. Natural antioxidants in milk and dairy products. Int. J. Dairy Technol. 2017, 70, 165–178. [Google Scholar] [CrossRef]
  39. Bielecka, M.; Cichosz, G.; Czeczot, H. Antioxidant, antimicrobial and anticarcinogenic activities of bovine milk proteins and their hydrolysates-a review. Int. Dairy J. 2022, 127, 105208. [Google Scholar] [CrossRef]
  40. Gagnon, M.; Savard, P.; Rivière, A.; LaPointe, G.; Roy, D. Bioaccessible antioxidants in milk fermented by Bifidobacterium longum subsp. longum strains. Biomed Res. Int. 2015, 2015, 169381. [Google Scholar] [CrossRef]
  41. Khan, I.T.; Nadeem, M.; Imran, M.; Ullah, R.; Ajmal, M.; Jaspal, M.H. Antioxidant properties of Milk and dairy products: A comprehensive review of the current knowledge. Lipids Health Dis. 2019, 18, 41. [Google Scholar] [CrossRef]
  42. Dhiny, A.D.; Jariyah, J.; Wicaksono, L.A.; Priyanto, A.D.; Safitri, S.; Esfandiar, W.N. Effect of frequency and duration of thermosonication on the physical, chemical and microbiological quality of cow’s milk. J. Pangan Agroindustri 2023, 11, 136–146. [Google Scholar] [CrossRef]
  43. Seung-Yong, L.; Benner, L.C.; Clark, S. Neither thermosonication nor cold sonication is better than pasteurization for milk shelf life. J. Dairy Sci. 2019, 102, 3965–3977. [Google Scholar] [CrossRef]
  44. Ragab, E.S.; Lu, J.; Pang, X.Y.; Nassar, K.S.; Yang, B.Y.; Zhang, S.W.; Lv, J.P. Effect of thermosonication process on physicochemical properties and microbial load of goat’s milk. J. Food Sci. Technol. 2019, 56, 5309–5316. [Google Scholar] [CrossRef] [PubMed]
  45. Lacroix, M.; Bos, C.; Léonil, J.; Airinei, G.; Luengo, C.; Daré, S.; Benamouzig, R.; Fouillet, H.; Fauquant, J.; Tomé, D.; et al. Compared with casein or total milk protein, digestion of milk soluble proteins is too rapid to sustain the anabolic postprandial amino acid requirement. AJCN 2006, 84, 1070–1079. [Google Scholar] [CrossRef]
  46. García-Risco, M.R.; Ramos, M.; López-Fandiño, R. Proteolysis, protein distribution and stability of UHT milk during storage at room temperature. J. Sci. Food Agric. 1999, 79, 1171–1178. [Google Scholar] [CrossRef]
  47. Yang, B.; Zhang, S.; Pang, X. Separation of serum proteins and micellar casein from skim goat milk by pilot-scale 0.05-μm pore-sized ceramic membrane at 50 °C. J. Food Process Eng. 2020, 43, 13334. [Google Scholar] [CrossRef]
  48. Zhao, X.; Fan, X.X.; Shao, X.Q.; Cheng, M.; Wang, C.F.; Jiang, H.; Zhang, X.N.; Yuan, C.Z. Modifying the physicochemical properties, solubility and foaming capacity of milk proteins by ultrasound-assisted alkaline pH-shifting treatment. Ultrason. Sonochem. 2022, 88, 106089. [Google Scholar] [CrossRef]
  49. Zhao, R.; Fu, W.; Li, D.; Dong, C.; Bao, Z.; Wang, C. Structure and functionality of whey protein, pea protein, and mixed whey and pea proteins treated by pH shift or high-intensity ultrasound. JDS 2024, 107, 726–741. [Google Scholar] [CrossRef]
  50. Jovanovic, S.; Barac, M.; Macej, O.; Vucic, T.; Lacnjevac, C. SDS-PAGE Analysis of Soluble Proteins in Reconstituted Milk Exposed to Different Heat Treatments. Sensors 2007, 7, 371–383. [Google Scholar] [CrossRef]
  51. Hong, Z.H.; Xiao, N.; Li, L.; Li, Y.; Xie, X.A. Glycation of whey protein isolate and emulsions prepared by conjugates. J. Food Eng. 2022, 316, 110852. [Google Scholar] [CrossRef]
  52. Pellegrino, L. Influence of fat content on some heat-induced changes in milk and cream. Neth. Milk Dairy J. 1994, 48, 71–80. Available online: https://api.core.ac.uk/oai/oai:air.unimi.it:2434/197487 (accessed on 1 May 2024).
  53. Yukalo, V.; Krupa, O. Proteolytic systems of lactic acid microorganisms: A review. Ukr. Food J. 2017, 6, 417–432. [Google Scholar] [CrossRef]
  54. Ardö, Y.; McSweeney, P.L.H.; Magboul, A.A.A.; Upadhyay, V.K.; Fox, P.F. Chapter 18-Biochemistry of Cheese Ripening: Proteolysis. In Cheese (Fourth Edition): Chemistry, Physics and Microbiology; Academic Press: Cambridge, MA, USA, 2017; pp. 445–482. [Google Scholar] [CrossRef]
  55. Meng, Y.Y.; Liang, Z.Q.; Zhang, C.Y.; Hao, S.Q.; Han, H.Y.; Du, P.; Li, A.L.; Shao, H.; Li, C.; Liu, L.B. Ultrasonic modification of whey protein isolate: Implications for the structural and functional properties. Lebensm. Wiss. Technol. 2021, 152, 112272. [Google Scholar] [CrossRef]
  56. Hsieh, H.H.; Wang, S.Y.; Chen, T.L.; Huang, Y.L.; Chen, M.J. Effects of cow’s and goat’s milk as fermentation media on the microbial ecology of sugary kefir grains. Int. J. Food Microbiol. 2012, 157, 73–81. [Google Scholar] [CrossRef] [PubMed]
  57. Fiorda, F.A.; Pereira, G.V.; Thomaz-Soccol, V.; Medeiros, A.B.; Rakshit, S.K.; Soccol, C.R. Development of kefir-based probiotic beverages with DNA protection and antioxidant activities using soybean hydrolyzed extract, colostrum and honey. Lwt-Food Sci. Technol. 2016, 68, 690–697. [Google Scholar] [CrossRef]
  58. Khadem, H.; Tirtouil, A.M.; Drabo, M.S.; Boubakeur, B. Ultrasound conditioning of Streptococcus thermophilus CNRZ 447: Growth, biofilm formation, exopolysaccharide production, and cell membrane permeability. Biotechnologia 2020, 101, 159–165. [Google Scholar] [CrossRef]
  59. Tabatabaie, F.; Mortazavi, A. Studying the Effects of Ultrasound Shock on Cell Wall Permeability and Survival of Some LAB in Milk. World Appl. Sci. J. 2008, 3, 119–121. [Google Scholar] [CrossRef]
  60. Ramteke, S.P.; Desale, R.J.; Kankhare, D.H.; Fulpagare, Y.G. Thermosonication Technology in the Dairy Industry: A Review. IJARBS 2020, 7, 82–89. [Google Scholar]
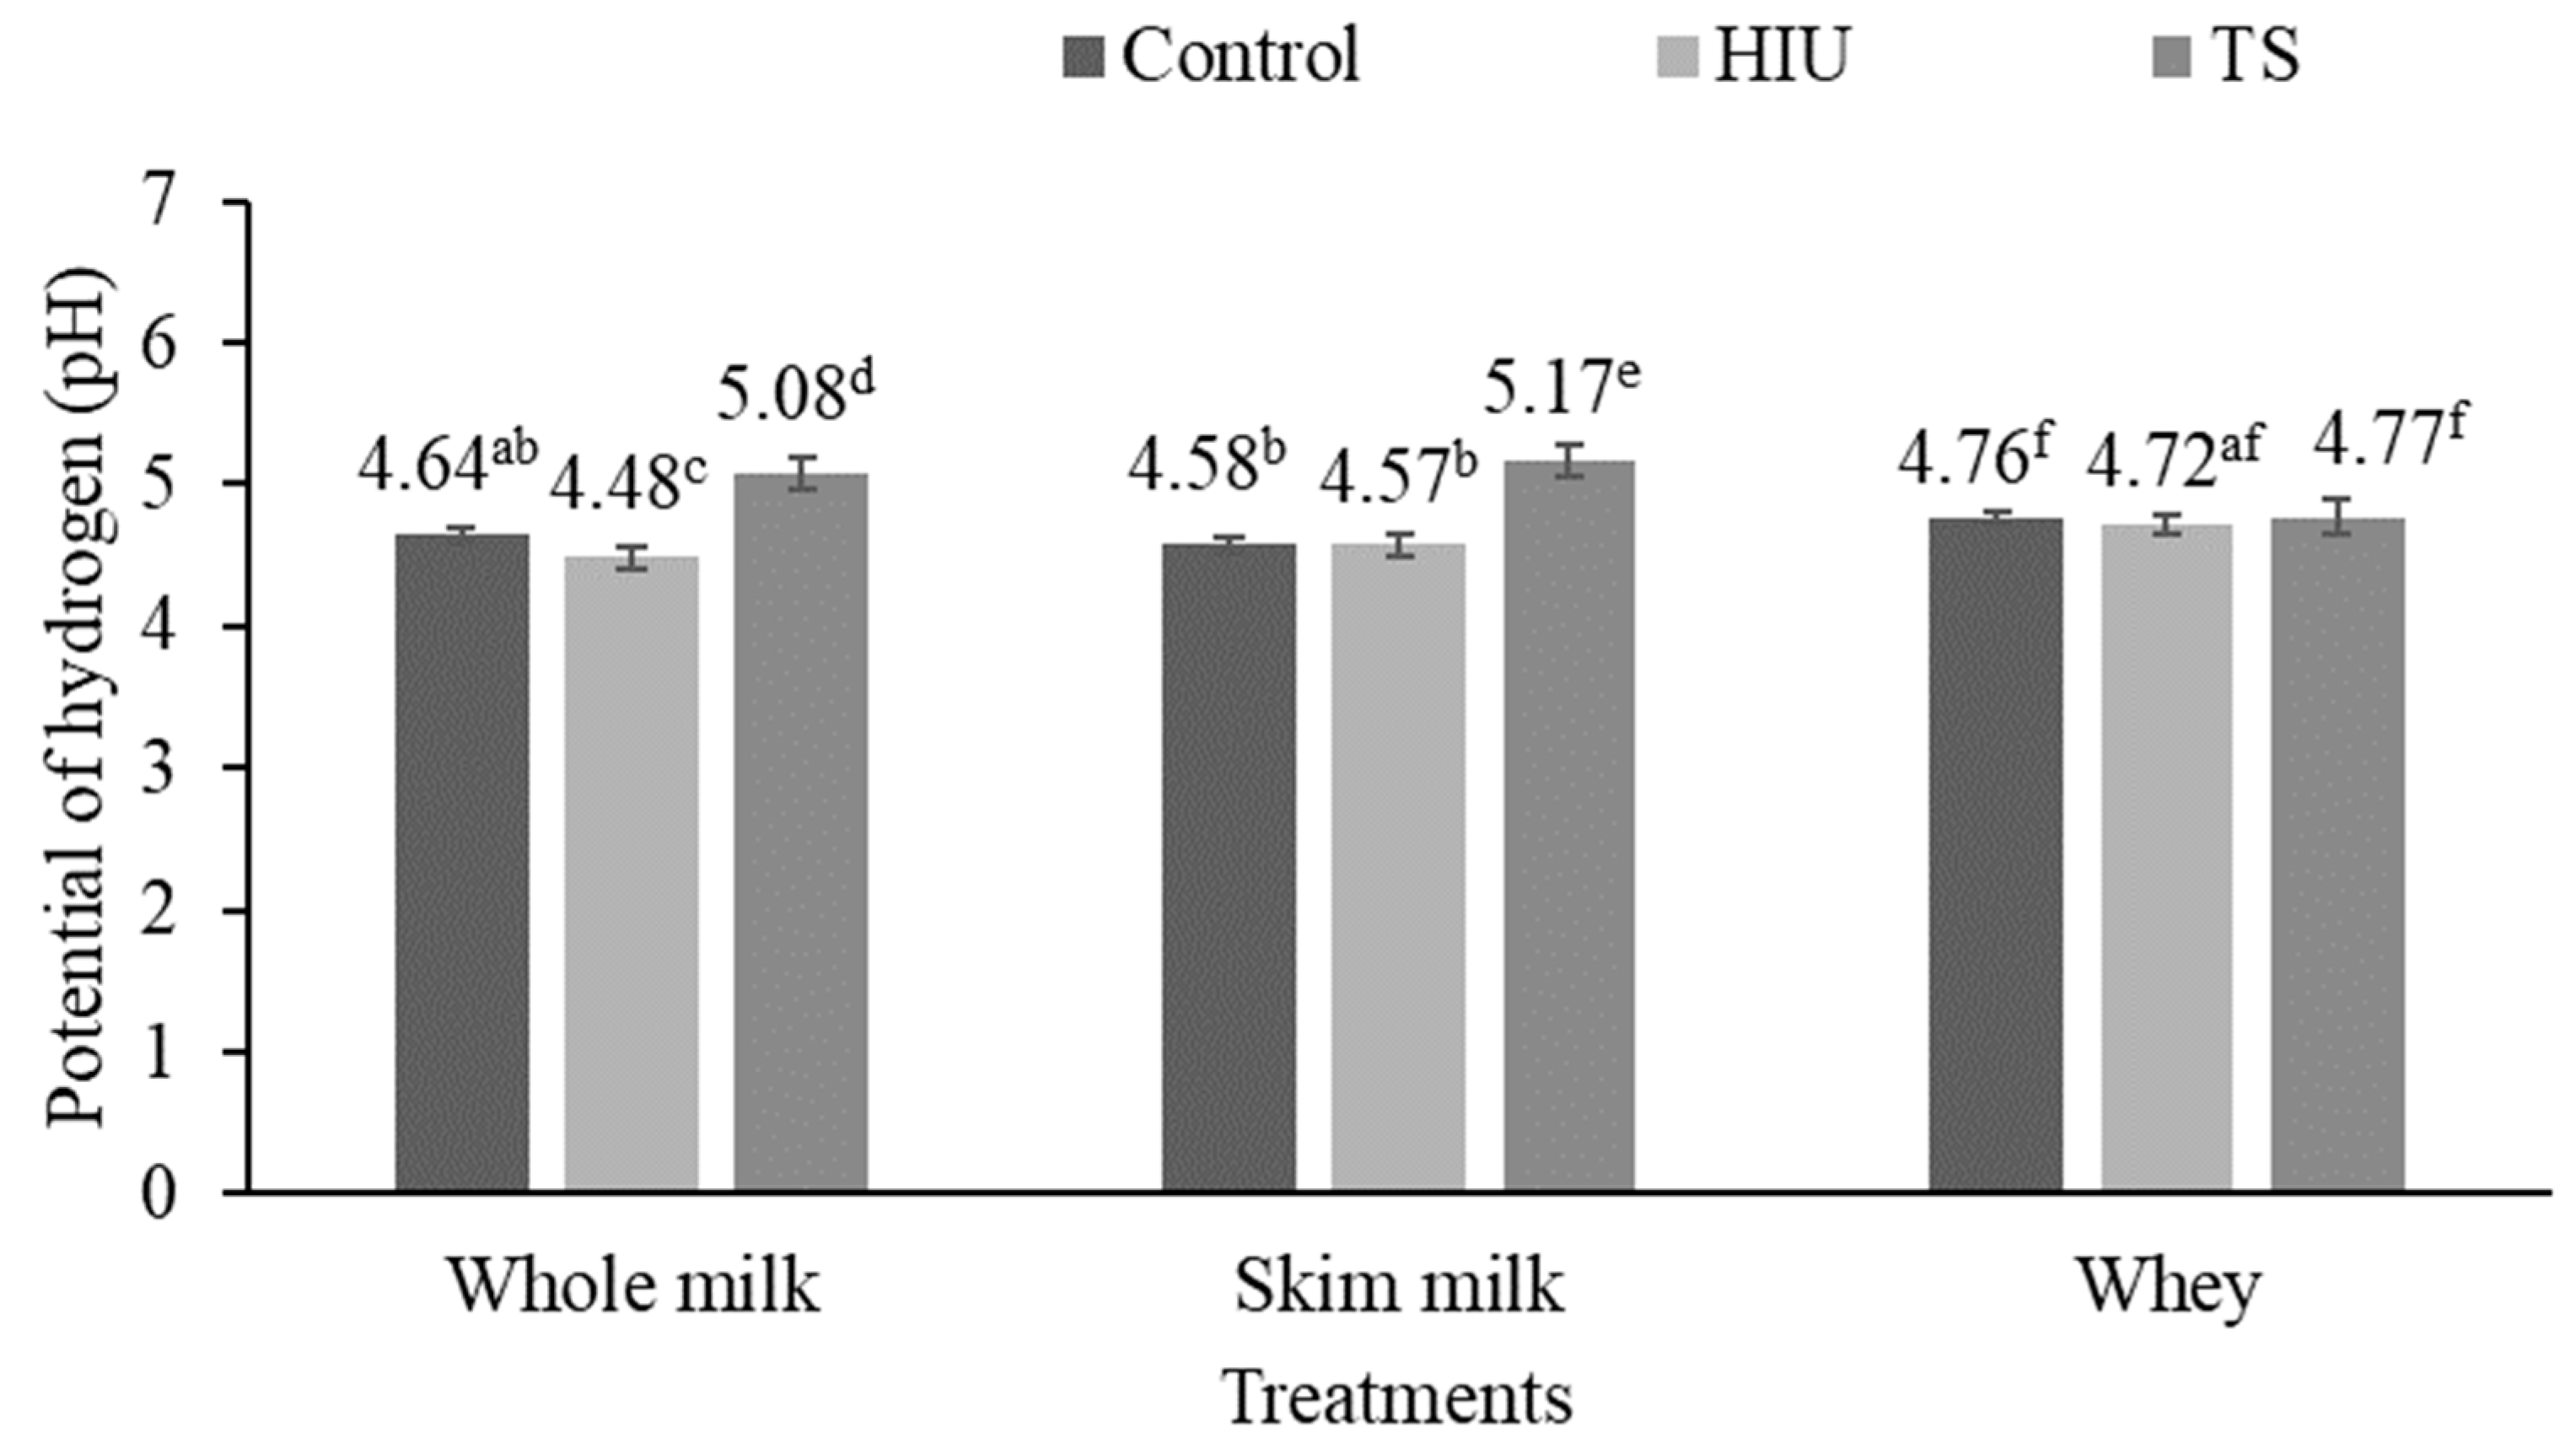
Figure 1. Potential of hydrogen (pH) (mean ± standard deviation) of water-soluble kefir postbiotics. HIU = high-intensity ultrasound (frequency of 20 kHz, amplitude of 30%, for 3 min at ~25 °C), TS = thermosonication (frequency of 37 kHz, for 30 min at ~60 °C) a,b,c,d,e,f = different letters among columns show significant difference (p < 0.05) among treatments.
Fermentation 10 00492 g001
Figure 2. Antioxidant activity by ABTS method (mean ± standard deviation) of water-soluble kefir postbiotics. HIU = high-intensity ultrasound (frequency of 20 kHz, amplitude of 30%, for 3 min at ~25 °C), TS = thermosonication (frequency of 37 kHz, for 30 min at ~60 °C). a,b,c,d,e,f = different letters among columns show significant differences (p < 0.05) among treatments.
Fermentation 10 00492 g002
Figure 3. Antioxidant activity by DPPH method (mean ± standard deviation) of water-soluble kefir postbiotics. HIU = high-intensity ultrasound (frequency of 20 kHz, amplitude of 30%, for 3 min at ~25 °C), TS = thermosonication (frequency of 37 kHz, for 30 min at ~60 °C). a,b,c,d = different letters among columns show significant differences (p < 0.05) among treatments.
Fermentation 10 00492 g003
Figure 4. Antioxidant activity by FRAP method (mean ± standard deviation) of water-soluble kefir postbiotics. HIU = high-intensity ultrasound (frequency of 20 kHz, amplitude of 30%, for 3 min at ~25 °C), TS = thermosonication (frequency of 37 kHz, for 30 min at ~60 °C). a,b,c,d,e = different letters among columns show significant differences (p < 0.05) among treatments.
Fermentation 10 00492 g004
Figure 5. Antioxidant activity by ORAC method (mean ± standard deviation) of water-soluble kefir postbiotics. HIU = high-intensity ultrasound (frequency of 20 kHz, amplitude of 30%, for 3 min at ~25 °C), TS = thermosonication (frequency of 37 kHz, for 30 min at ~60 °C). a,b,c,d,e = different letters among columns show significant differences (p < 0.05) among treatments.
Fermentation 10 00492 g005
Figure 6. Total protein content (mean ± standard deviation) of water-soluble kefir postbiotics. HIU = high-intensity ultrasound (frequency of 20 kHz, amplitude of 30%, for 3 min at ~25 °C), TS = thermosonication (frequency of 37 kHz, for 30 min at ~60 °C). a,b,c,d,e = different letters among columns show significant differences (p < 0.05) among treatments.
Fermentation 10 00492 g006
Figure 7. SDS-PAGE of water-soluble kefir postbiotics. WMTS, whole milk thermosonicated; WMHIU, whole milk treated with high-intensity ultrasound; WMC, whole milk without any treatment (control); SMTS, skim milk thermosonicated; SMHIU, skim milk treated with high-intensity ultrasound; SMC, skim milk without any treatment (control); WTS, whey thermosonicated; WHIU, whey treated with high-intensity ultrasound; WC, whey without any treatment (control). 1 Frequency of 37 kHz, for 30 min at ~60 °C. 2 Frequency of 20 kHz, amplitude of 30%, for 3 min at ~25 °C.
Fermentation 10 00492 g007
Figure 8. Percentage of dead cells (PI+) of water-soluble kefir postbiotics (WSKP). HIU = high-intensity ultrasound (frequency of 20 kHz, amplitude of 30%, for 3 min at ~25 °C), TS = thermosonication (frequency of 37 kHz, for 30 min at ~60°C).
Fermentation 10 00492 g008
Disclaimer/Publisher’s Note: The statements, opinions and data contained in all publications are solely those of the individual author(s) and contributor(s) and not of MDPI and/or the editor(s). MDPI and/or the editor(s) disclaim responsibility for any injury to people or property resulting from any ideas, methods, instructions or products referred to in the content.