Article

Analysis of Composition, Antioxidation, and Immunoregulation for Exopolysaccharide Produced by Dellaglioa algida

School of Life Science and Technology, Harbin Institute of Technology, Harbin 150001, China
*
Author to whom correspondence should be addressed.
Fermentation 2024, 10(9), 491; https://doi.org/10.3390/fermentation10090491
Submission received: 30 June 2024 / Revised: 16 September 2024 / Accepted: 18 September 2024 / Published: 22 September 2024
(This article belongs to the Section Microbial Metabolism, Physiology & Genetics)

Abstract

:
Lactobacillus is a recognized probiotic and has been widely used in food and medicine. As a new type of low-temperature resistant Lactobacillus, the fermentation products of Dellaglioa algida have multiple physiological activities. This study focuses on the exopolysaccharide (EPS) produced by Dellaglioa algida. The composition of the EPS is analyzed by FTIR, UV, GPC, HPLC, NMR, and SEM, and its antioxidant and immune activities are explored. The experimental results show that the EPS is a polymer composed of nine monosaccharides such as rhamnose, glucose, and mannose, connected by α - and β -glycosidic bonds, with an average molecular weight of 2.163 × 10 4 Da. When the EPS concentration reaches 100 μg/mL, the scavenging activities of DPPH and ABTS+ are 60.0% and 51.2%, respectively. The EPS promotes the secretion of NO by regulating the iNOS/NO pathway, reduces oxidative damage, and reduces the secretion of inflammatory factors such as IL-6, IL-1 β , and TNF- α , and downregulates the mRNA expression of inflammatory factors, thereby alleviating the cell inflammation stimulated by the cold-resistant bacteria Pseudomonas fluorescens and Pseudomonas fragi. By virtue of these properties, the EPS produced by Dellaglioa algida fermentation has the potential to act as an antioxidant and immunomodulator.

1. Introduction

As a well-known bacterium recognized for its food safety properties, Lactobacillus and its metabolites have been widely studied [1,2,3,4,5]. Exopolysaccharides (EPSs), produced during the growth and metabolism of Lactobacillus, vary in structure and function across different species, contributing to their physiological diversity [6]. For example, the EPS of Lactobacillus delbrueckii OLL1073R-1 enhances the antiviral ability of pig intestinal epithelial cells [7]; Lactobacillus rhamnosus SHA113’s EPS shows anti-gastric-ulcer activity in mice [2]; Lactobacillus plantarum L-14’s EPS has anti-inflammatory effects in RAW264.7 cells [4]; Lactobacillus plantarum SN35N’s EPS inhibits influenza A and feline calicivirus [5]; and Lactobacillus plantarum LRCC5310’s EPS prevents rotavirus-induced diarrhea [8]. These findings highlight the diverse bioactivities and potential applications of Lactobacillus’s EPSs in food and medicine, warranting further investigation into their composition and bioactivity.
Conventional Lactobacillus species and their EPSs have been extensively studied over the past few decades. For example, the EPS from Lactobacillus plantarum EI6, isolated from the ocean, contains five monosaccharides and promotes wound healing [9]. Similarly, the acidic EPS (EPS-LP2) from Lactobacillus plantarum DMDL 9010 has antioxidant and immunomodulatory properties, reducing oxidative damage in RAW264.7 cells and inhibiting inflammatory factors [10]. However, these EPSs may not perform effectively in extreme conditions, such as low-temperature food and pharmaceutical storage [11,12]. In contrast, the EPS from psychrophilic bacteria can serve as bioprotectants, with a 97.91% survival rate for neutrophilic Escherichia coli at −80 °C and bioadsorption abilities [13]. Lactobacillus algidus, a psychrophilic species isolated from vacuum-frozen beef, has been renamed Dellaglioa algida (Del. algida) in 2020 [14]. It is the only psychrophilic Lactobacillus in its genus, thriving in cold environments [15]. Although recent studies have explored its gene sequencing, metabolism, and biofilm inhibition effects [14,15,16,17], the EPSs produced by Del. algida remain largely unstudied, including their composition, bioactivities, and potential relationships.
Research on EPSs from conventional Lactobacillus primarily focuses on their biological properties, such as antioxidation and immunoregulation in RAW264.7 cells, while the relationship between their composition and these effects remains unexplored. In contrast, studies on non-Lactobacillus EPSs have identified links between composition (e.g., monosaccharides and functional groups) and biological activities. For instance, the EPS of tea tree polysaccharides, rich in rhamnose and glucose, shows immunoregulatory and antioxidant effects [18], and the EPS from Bacillus licheniformis demonstrates antioxidation due to specific functional groups identified by FTIR [19]. However, such studies on Lactobacillus’s EPSs, particularly for the psychrophilic and high-potential Del. algida, are lacking.
Motivated by the above observations, the issue of biological activities consisting of the antioxidation and immunoregulation of the EPS produced by Del. algida is investigated in this paper, where its composition is analyzed in-depth to find the relation with biological activities. The Nuclear Magnetic Resonance spectroscopy (NMR), Fourier transform infrared spectroscopy (FTIR), ultraviolet spectroscopy (UV), scanning electron microscope (SEM), GPC (gel permeation chromatography), and high-performance liquid chromatography (HPLC) methods are utilized to analyze the composition of the EPS to predict its biological activities. To find the antioxidation activities of the EPS, experiments assessing the free radical scavenging of DPPH, ABTS+, hydroxyl, and superoxide anion are performed. Two kinds of cold-adapted pathogenic bacteria, i.e., Pseudomonas fluorescens (P. fluorescens) and Pseudomonas fragi (P. fragi) [20], are utilized to stimulate the RAW264.7 cells to evaluate the immunoregulation activity of the EPS. The analysis results of the antioxidation and immunoregulation effects of the EPS produced by Del. algida provided in this paper can be utilized as a reference for the production or transportation of foods and medicine in cold environments.

2. Materials and Methods

2.1. Strains and Culture Conditions

In this paper, the utilized strains consisted of Del. algida for the EPS production and P. fluorescens and P. fragi for stimulating RAW264.7 cells for the immunoregulation activity analysis, where the culture conditions were as below.
Del. algida was cultured in a de Mann–Rogosa–Sharpe (MRS) medium for 24 h under the stir-free condition to obtain a seed liquid, where the culture method was mainly from [16]. The activated seed liquid of Del. algida was inoculated into the liquid MRS culture medium with a bacterial load of 1% (v/v), and then they were activated twice at 20 °C for 24 h.
P. fluorescens and P. fragi were activated using a Tryptone Soy Broth (TSB) culture medium for 24 h to obtain their seed liquid via a shaker at 180 rpm/min under 28 °C. The activated seed liquid was inoculated into the TSB culture medium with an inoculation quantity of 1% (v/v), which was activated for 18 h at 28 °C for further experiments. The activated bacterial solution was centrifuged for 5 min at 4 °C under 8000× g, which was sterilely filtrated using a low-protein binding cellulose acetate filter with an aperture diameter of 0.22 μm to obtain cell-free supernatant (CFS).

2.2. Extraction and Purification of the EPS

The experimental method from [21,22] was used with considerable modifications. The strain stored at −80 °C was activated and further inoculated into 500 mL of MRS medium with a pH of 5.7 at an inoculation volume of 1%; then, it was cultured at 20 °C under 60 rpm for 24 h. The cultured fermentation broth was centrifuged at 5000× g for 20 min at 4 °C to remove the bacterial cells, where three volumes of pre-cooled 95% ethanol were added to the obtained CFS. After placing it overnight in a refrigerator at 4 °C, a polysaccharide precipitate was obtained by centrifuging at 9500× g for 60 min. The extract’s precipitate was dissolved in 100 mL of distilled water, where the same-volume trichloroacetic acid (TCA) of 10% was inserted. By continuously stirring for 4 h in an ice bath, the protein precipitate could be removed via centrifuging at 9500× g for 60 min at 4 °C. Then, pre-cooled 95% ethanol with a volume three times larger was added, and one could obtain the extract’s precipitation by centrifuging under the same conditions for 60 min. The extract was dissolved in water and put into a dialysis bag of 14,000∼8000 Da to dialyze for 48 h. The distilled water was replaced every 8 h, and then the crude EPS was obtained by freeze-drying.
To further remove nucleic acids and proteins, the extracted crude EPS was dissolved in 50 mM Tris-HCl and 10 mM MgSO4·7H2O until the final concentration was 5 mg/mL with a pH of 7.4–7.5. Then, the DNAse type-I was added until the final concentration was 2.5 μg/mL, and they were reacted at 37 °C for 6 h. After that, the protease extracted from Streptococcus with a final concentration of 50 μg/mL was used, which was kept at 37 °C for 18 h. The TCA with a final concentration of 12% was added; then, the solution was stirred at room temperature for 30 min and centrifuged at 4 °C and 10,000× g for 20 min to remove protein precipitates. The pH of CFS was adjusted to 4.0∼5.0 with 10 mM sodium hydroxide solution and put into a dialysis bag of 14,000∼8000 Da. Then, it was placed in multiple volumes of distilled water and dialyzed at 4 °C, where the deionized water was replaced every 8 to 12 h, and the total duration of the dialysis was three days. Then, after freeze-drying, one could obtain the freeze-dried powder of the EPS produced by Del. algida.

2.3. Composition Analysis of EPS

In this paper, for the composition analysis of the EPS produced by Del. algida, the average molecular weight and the monosaccharide components were determined; then, the EPS was analyzed via UV full-wavelength scanning, FTIR, and scanning electron microscope (SEM).

2.3.1. Average Molecular Weight Measurements

For the measurements of the average molecular weight of the EPS, the GPC method was utilized. The EPS lyophilized powder was dissolved in the deionized water, whose concentration was 1.00 mg/mL, the loading quantity was 40.0 μL, and the mobile phase was distilled water with a current flow of 1.00 mL/min.

2.3.2. Monosaccharide Components’ Analysis

The experimental method from [23,24], which is known as HPLC, was used. First, 5 mg of EPS sample (±0.05 mg) was added into a clean chromatography bottle, where 1 mL of 2 M trifluoroacetic acid (TFA) solution was inserted to be heated at 121 °C for 2 h. Then, nitrogen was blown through to dry, and methanol was supplemented for cleaning and blow drying, which was repeated 2–3 times. Sterile water was included to dissolve, which was further transferred to a chromatography bottle for testing. Then, an appropriate amount of supernatant was taken, and it was further spun to concentrate or blow-dry with nitrogen. The used HPLC system was a Thermo ICS5000 ion chromatography system (ICS5000, Thermo Fisher Scientific, Waltham, MA, USA) with an electrochemical detector for analyzing and detecting monosaccharide components, where a Dionex™ CarboPac™ PA20 (150 × 3.0 mm, 10 μm) liquid chromatography column was used. The injection volume was 5 μL, mobile phase A was 0.1 M NaOH, and mobile phase B was 0.1 M NaOH with 0.2 M NaAc. The flow rate was 0.5 mL/min, and the column temperature was 30 °C. The elution gradient was as follows: 0 min A/B (95:5 v/v, 30 min A/B (80:20 v/v), 30.1 min A/B (60:40 v/v), 45 min A/B (60:40 v/v), 45.1 min A/B (95:5 v/v), and 60 min A/B (95:5 v/v).

2.3.3. UV Full-Wavelength Scanning and FTIR Analysis

The extracted EPS of 1 mg was weighed and then dissolved in 1 mL of deionized water for analysis via full-wavelength scanning. Due to the existence of the end absorption of the UV–vis spectrophotometer (Hitachi, Tokyo, Japan), it was difficult to observe the absorption peak of the EPS. Thus, the wavebands of 260 nm and 280 nm were observed to find whether the absorption peak existed, and then to determine whether the extracted EPS contained nucleic acids and proteins.
The main structural groups of the EPS were characterized using FTIR [25], where an EPS sample of 2 mg and KBr of 20 mg were pressed into pieces. Then, the FTIR spectrum was analyzed within a frequency range of 4000∼400 cm−1.

2.3.4. Scanning Electron Microscope (SEM) Analysis

The EPS of 1 mg was weighed and then stuck on conductive tape for spray gold sealing after natural drying. Then, an SEM (Quanta GEG250, FEI, Hillsboro, OR, USA) was utilized to observe the microscopic morphology of the EPS samples.

2.3.5. NMR Analysis

1H and 13C NMR spectra of EPS were obtained on a Bruker AMX-600 MHz, Waltzbach, Germany spectrometer at 50 °C. The sample was exchanged with D2O twice, and after freeze-drying the EPS, it was dissolved in 700 μL of D2O for the 1H and 13C NMR spectral analysis.

2.4. Antioxidation Activities of EPS

In this paper, the antioxidation activities of the EPS were evaluated by its effects on eliminating free radicals, including ABTS+, DPPH, hydroxyl (HO·), and superoxide anion ( · O 2 ).

2.4.1. ABTS+ Free Radical Scavenging Assay

The experimental method from [26,27] was used. We mixed 0.2 mL of freshly prepared ABTS+ solution at a concentration of 7.4 mmol/L with 0.2 mL of 2.6 mmol/L K2S2O8 solution [24,25,26] and incubated in the dark at room temperature for 12 h to obtain the ABTS+ working solution. Then, we diluted it 50 times with methanol (A734nm = 0.7 ± 0.02), took 0.8 mL of the diluted ABTS+ working solution and mixed it with 0.2 mL of the sample (0–1000 mg/L), shook it for 10 seconds, and let it stand for 6 minutes. Then, we measured the absorbance at a wavelength of 734 nm, using ascorbic acid as a reference (0–1000 mg/L), with anhydrous ethanol and the ABTS+ working solution as the blank group. The radical scavenging assays of ABTS+ were computed by
α = [ 1 A 1 A 2 A 3 ] × 100 %
where α (%) represents the ABTS+ radical scavenging rate, A 1 is the absorbance of the sample, and A 2 and A 3 are the absorbance values of the blank.

2.4.2. DPPH Free Radical Scavenging Assay

The experimental method from [26,27,28] was used. We vigorously mixed the freshly prepared 0.002% methanol solution of DPPH (2 mL) with the sample (2 mL, 0–1000 mg/L) and stored it in the dark at 37 °C for 20 min [24,25]. Then, we used ascorbic acid as the reference (0–1000 mg/L), measured the absorbance (at 515 nm), and calculated the DPPH radical scavenging rate using the following equation:
β = [ 1 B 1 B 2 B 3 ] × 100 %
where β (%) represents the DPPH radical scavenging rate, B 1 is the absorbance of the sample, DPPH, B 2 is the absorbance of the sample and anhydrous ethanol, and B 3 is the absorbance of DPPH and anhydrous ethanol.

2.4.3. Hydroxyl (HO·) Radical Scavenging Assay

The experimental method from [26,28,29] was used. We added 50 μL of PBS (20 mM, pH 7.4), 25 μL of 1,10-phenanthroline (2.5 mM), 25 μL of FeSO4, and 25 μL of H2O2 (20 mM) sequentially into the corresponding wells of a 96-well plate and mixed thoroughly. Then, we added 100 μL of the polysaccharide solution or ascorbic acid solution at different concentrations: 0.2 mg/mL, 0.4 mg/mL, 0.6 mg/mL, 0.8 mg/mL, and 1.0 mg/mL. After mixing, we incubated at 37 °C for 1 h, with each concentration gradient performed in triplicate. After incubation, we measured the UV absorbance of the reaction solution at 536 nm. Then, the radical scavenging assays of HO· could be computed with the following:
γ = [ C C 1 C 2 C 1 ] × 100 %
where γ (%) represents the hydroxyl radical scavenging activity, C is the absorbance of the sample, C 1 is the absorbance of blank control 1, and C 2 is the absorbance of blank control 2. In the blank control 1, there was no polysaccharide solution or ascorbic acid solution added, which was replaced with the same volume of distilled water. In the blank control 2, there was no polysaccharide solution, ascorbic acid solution, or H2O2 solution added, which was replaced with the same volume of distilled water.

2.4.4. Superoxide Anion ( · O 2 ) Scavenging Assay

We added 50 μL of PBS (pH 8.0) and 25 μL of catechol (1.5 mM, dissolved in 10 mM HCl), mixed well, then added 100 μL of different concentrations of EPS solution and ascorbic acid solution [28,29], with concentration gradients of 0.02 mg/mL, 0.04 mg/mL, 0.06 mg/mL, 0.08 mg/mL, and 0.10 mg/mL. We mixed again and let it stand at room temperature for 30 min, then measured the absorbance at 325 nm UV. Each concentration gradient was tested in three parallel experiments. The radical scavenging assays of · O 2 could be computed by the following equation:
ϕ = [ 1 D D 2 D 3 ] × 100 %
where ϕ (%) represents the superoxide radical scavenging activity; D is the absorbance of the sample; D 1 stands for the absorbance of blank control 1; and D 2 refers to the absorbance of blank control 2. In the blank control 1, there was no EPS or ascorbic acid solution added, which was replaced with the same volume of distilled water. In the blank control 2, the EPS or ascorbic acid solution was added, while there was no catechol solution added, which was replaced with the same volume of distilled water.

2.5. Immunoregulation Activities of EPS

In this paper, the immunoregulation activities of the EPS produced by Del. algida were evaluated by the anti-inflammatory abilities of a widely utilized RAW264.7 cell inflammation model, which was stimulated by the CFS of cold-adapted pathogenic Pseudomonas, including P. fluorescens and P. fragi.

2.5.1. Inflammation Model of RAW264.7 Cells

The RAW264.7 cells with a logarithmic growth phase were utilized, where the cell concentration was adjusted to 1.0 × 10⁵ cells/mL. The cell suspension was inoculated into a 96-well flat-bottomed microplate with 100 μL per well, and it was cultured at the conditions of 37 °C and 5% CO2 atmosphere for 2 h while awaiting the adherence of the RAW264.7 cells [30].
After the adherence of the RAW264.7 cells, the CFS of Pseudomonas with a cell culture fluid was supplemented, including volumes of 0, 1, 2, 4, 8, and 10 μL, respectively, and they were cultured for 12 h. Then, 10 μL of CCK-8 was added in each well to incubate for 20 min, and absorbance was measured by a multifunctional microplate reader (Tecan, Männedorf, Switzerland) with a wavelength of 450 nm. The survival rate and the inhibition rate of cells were calculated, where the concentration with a survival rate of about 50% was utilized for further experiments.

2.5.2. The Effect of EPS on Cell Activity

After the adherence of the RAW264.7 cells (cf. Section 2.5.1), the EPS with a concentration of 5 mg/mL with the cell culture fluid was supplemented, including volumes of 0, 1, 2, 4, 8, and 16 μL, respectively, and they were cultured for 12 h. Then, 10 μL of CCK-8 was added in each well to incubate for 20 min, and absorbance was measured by a multifunctional microplate reader with a wavelength of 450 nm. The survival rate and the inhibition rate of cells were calculated, where the previous concentration with a survival rate of less than 100% was selected as the high-dose group, and the 0.5-time concentration of the high-dose group was selected as the low-dose group for further experiments.

2.5.3. Effects of EPS on NO Secretion of Inflammatory RAW264.7 Cells

After the adherence of the RAW264.7 cells (cf. Section 2.5.1, where a 24-well flat-bottomed microplate with 1000 μL per well was used instead of the 96-well one), 40 μL of the inactivated CFS of Pseudomonas, the EPS with final concentrations of 50 μg/mL and 100 μg/mL were included, respectively, then they were cultured for 12 h. The supernatant of the cell culture was obtained, and the content of NO (nitric oxide) was measured via the multifunctional microplate reader. The culture cells were incubated for 20 min in a cell culture chamber at 37 °C using 5 μM DAF-FM DA DAF-FM DA (3-Amino,4-aminomethyl-2′,7′-difluorescein, diacetat). After washing cells with PBS three times, the fluorescence intensity was recorded using an inverted fluorescence microscope (Olympus, Tokyo, Japan).

2.5.4. Effects of EPS on ROS Secretion of Inflammatory RAW264.7 Cells

The cells were treated with EPS and Pseudomonas CFS, then the culture medium containing the CFS of Pseudomonas and EPS was eliminated. Then, 10 μM of diluted 2′7′-diacetyl dichlorofluorescein in 100 μL was added, and it was incubated in the dark for 30 min at 37 °C. The cells were washed twice via a serum-free culture medium of cells to fully remove the excess probes. Under the conditions of an excitation wavelength of 502 nm and an emission wavelength of 530 nm, the fluorescence intensity was measured using a multiscan spectrum (BioTek Synergy2, Winooski, VT, USA), and the fluorescence intensity was recorded using a inverted fluorescence microscope. Then, the relative ROS (reactive oxygen species) levels of cells can be measured.

2.5.5. Effects of EPS on Cytokines Secretion of Inflammatory RAW264.7 Cells

After adherence of the RAW264.7 cells (cf. Section 2.5.1, where a 24-well microplate with 1000 μL per well is used instead of the 96-well one with 100 μL per well), the inactivated CFS of Pseudomonas of 40 μL, and the EPS with final concentrations of 50 μg/mL and 100 μg/mL are included, respectively, and they are cultured for 12 h. After centrifuging, the CFS of the culture supernatant of cells is obtained and they are stored at −80 °C for later experiments. Finally, the ELISA approach is adopted to measure the secretion of the cytokines including IL-6 (interleukin-6), TNF- α (tumor necrosis factor- α ), IL-1 β and iNOS (inducible nitric oxide synthase).

2.5.6. Effects of EPS on mRNA Expression of Inflammatory RAW264.7 Cells

After adherence of the RAW264.7 cells (cf. Section 2.5.1, where a 24-well microplate with 2 mL per well was used instead of the 96-well one with 100 μL per well), 80 μL of the inactivated CFS of Pseudomonas, the EPS with final concentrations of 50 μg/mL and 100 μg/mL were included, respectively, and they were cultured for 12 h. The culture solution was removed, and the cells were washed three times with PBS. The Trizol method was utilized, where a Trizol reagent was added in each well to extract the RNA of cells after shaking and digesting for 5 min. The extracted RNA was reverse-transcribed to cDNA. Then, the real-time PCR analysis by a real-time PCR system (QuantStudioTM 6Flex, Waltham, MA, USA), where the primers were designed from the NCBI and synthesized by Harbin Ruibiotech Co., Ltd., Harbin, China, and its sequences can be found in Table 1.

2.6. Data Analysis

The data obtained correspond to at least three independent trials and are presented as mean values with standard deviations, where the statistical significance with the consideration of p < 0.05 was analyzed via software including GraphPad Prism 7 and Origin 2018.

3. Results

3.1. Composition Analysis of EPS Produced by Del. algida

3.1.1. Average Molecular Weight of EPS

In this paper, the molecular weight of the EPS produced by Del. algida was measured via the GPC approach, where its map is shown in Figure 1. One can find that there existed two heteropolysaccharide components, and the average value of M w of the EPS was 2.163 × 10⁴ Da, which was within the range of heteropolysaccharides produced by the EPS.

3.1.2. Monosaccharide Components of EPS

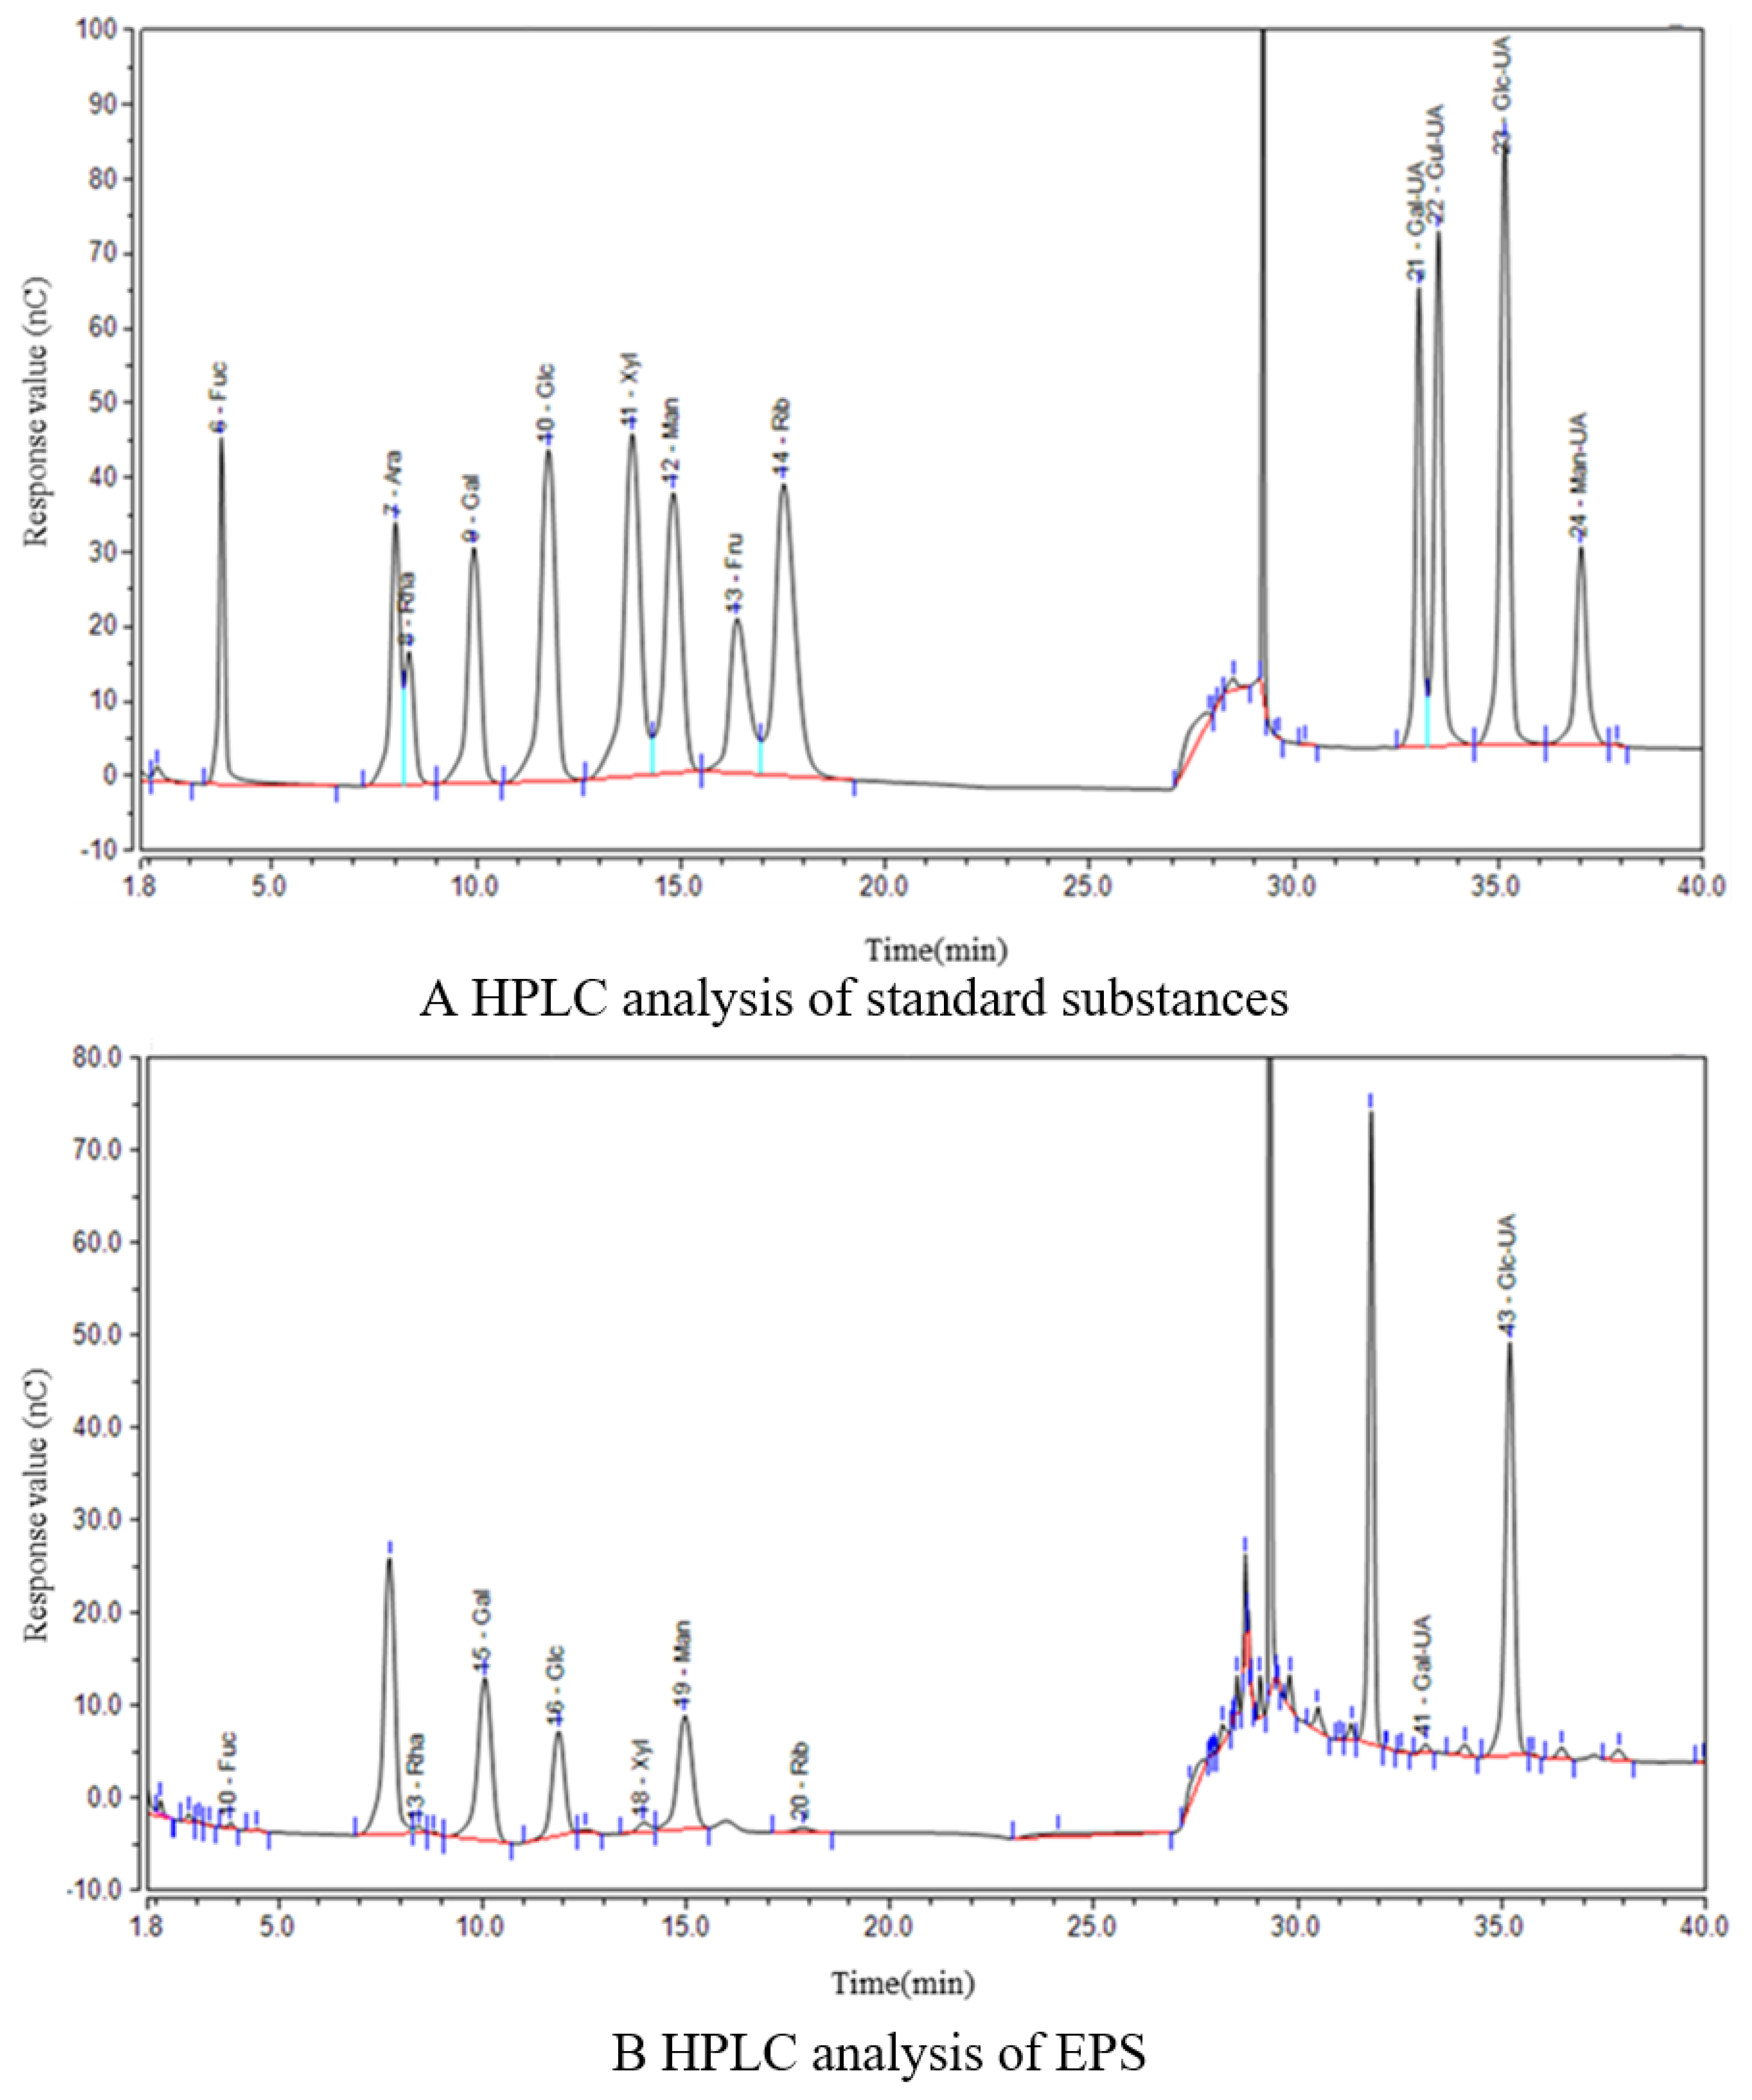
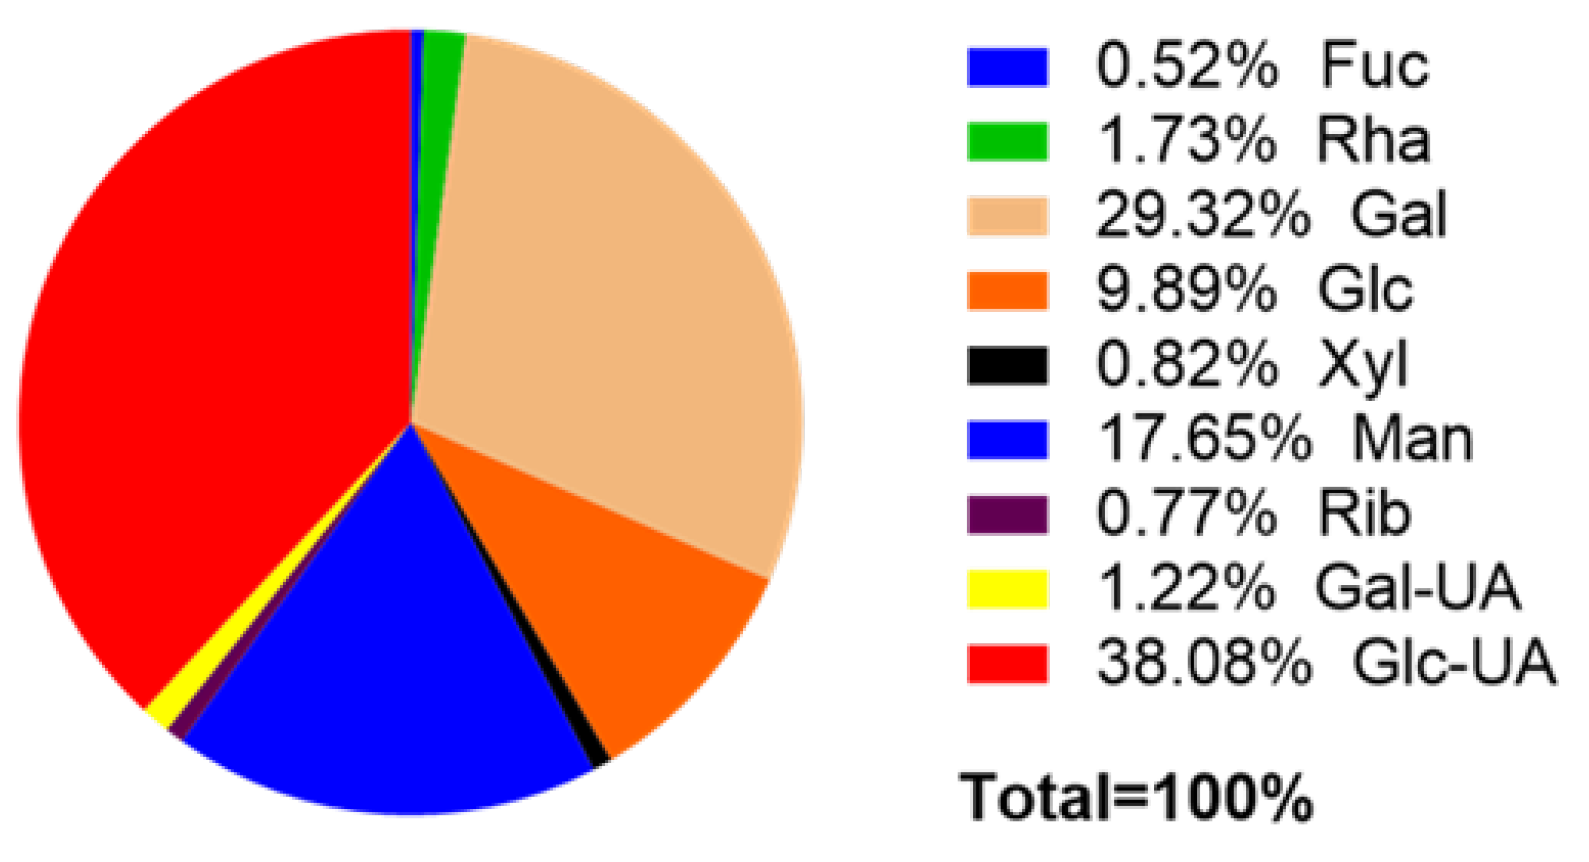
The monosaccharide components were measured via HPLC quantitative analysis, and the results are shown in Table 2. It can be seen that the EPS produced by Del. algida in this study was a heteropolysaccharide composed of nine monosaccharide components, including rhamnose, fucose, galactose, glucose, xylose, mannose, ribose, galacturonic acid, and glucural, where the percentage of each monosaccharide component is shown in Figure 2. The galactose and glucuronic acid components in the EPS represented the highest content, accounting for 29.32% and 38.08% of the monosaccharides, respectively. As shown in Figure 3, the EPS also contained a small amount of fucose and xylose, accounting for 0.52% and 0.82% of the monosaccharides, respectively, and the molar ratio of rhamnose and glucose was 0.18:1. Obviously, the monosaccharide components contained in EPS were relatively complex, indicating that the EPS is likely to have complex/novel structures and diverse physiological activities [31]. The EPS may have beneficial physiological effects such as anti-inflammation, and the monosaccharide content is related to its anti-inflammatory effect and requires to be developed and utilized in the future.

3.1.3. FTIR and UV Analysis of EPS

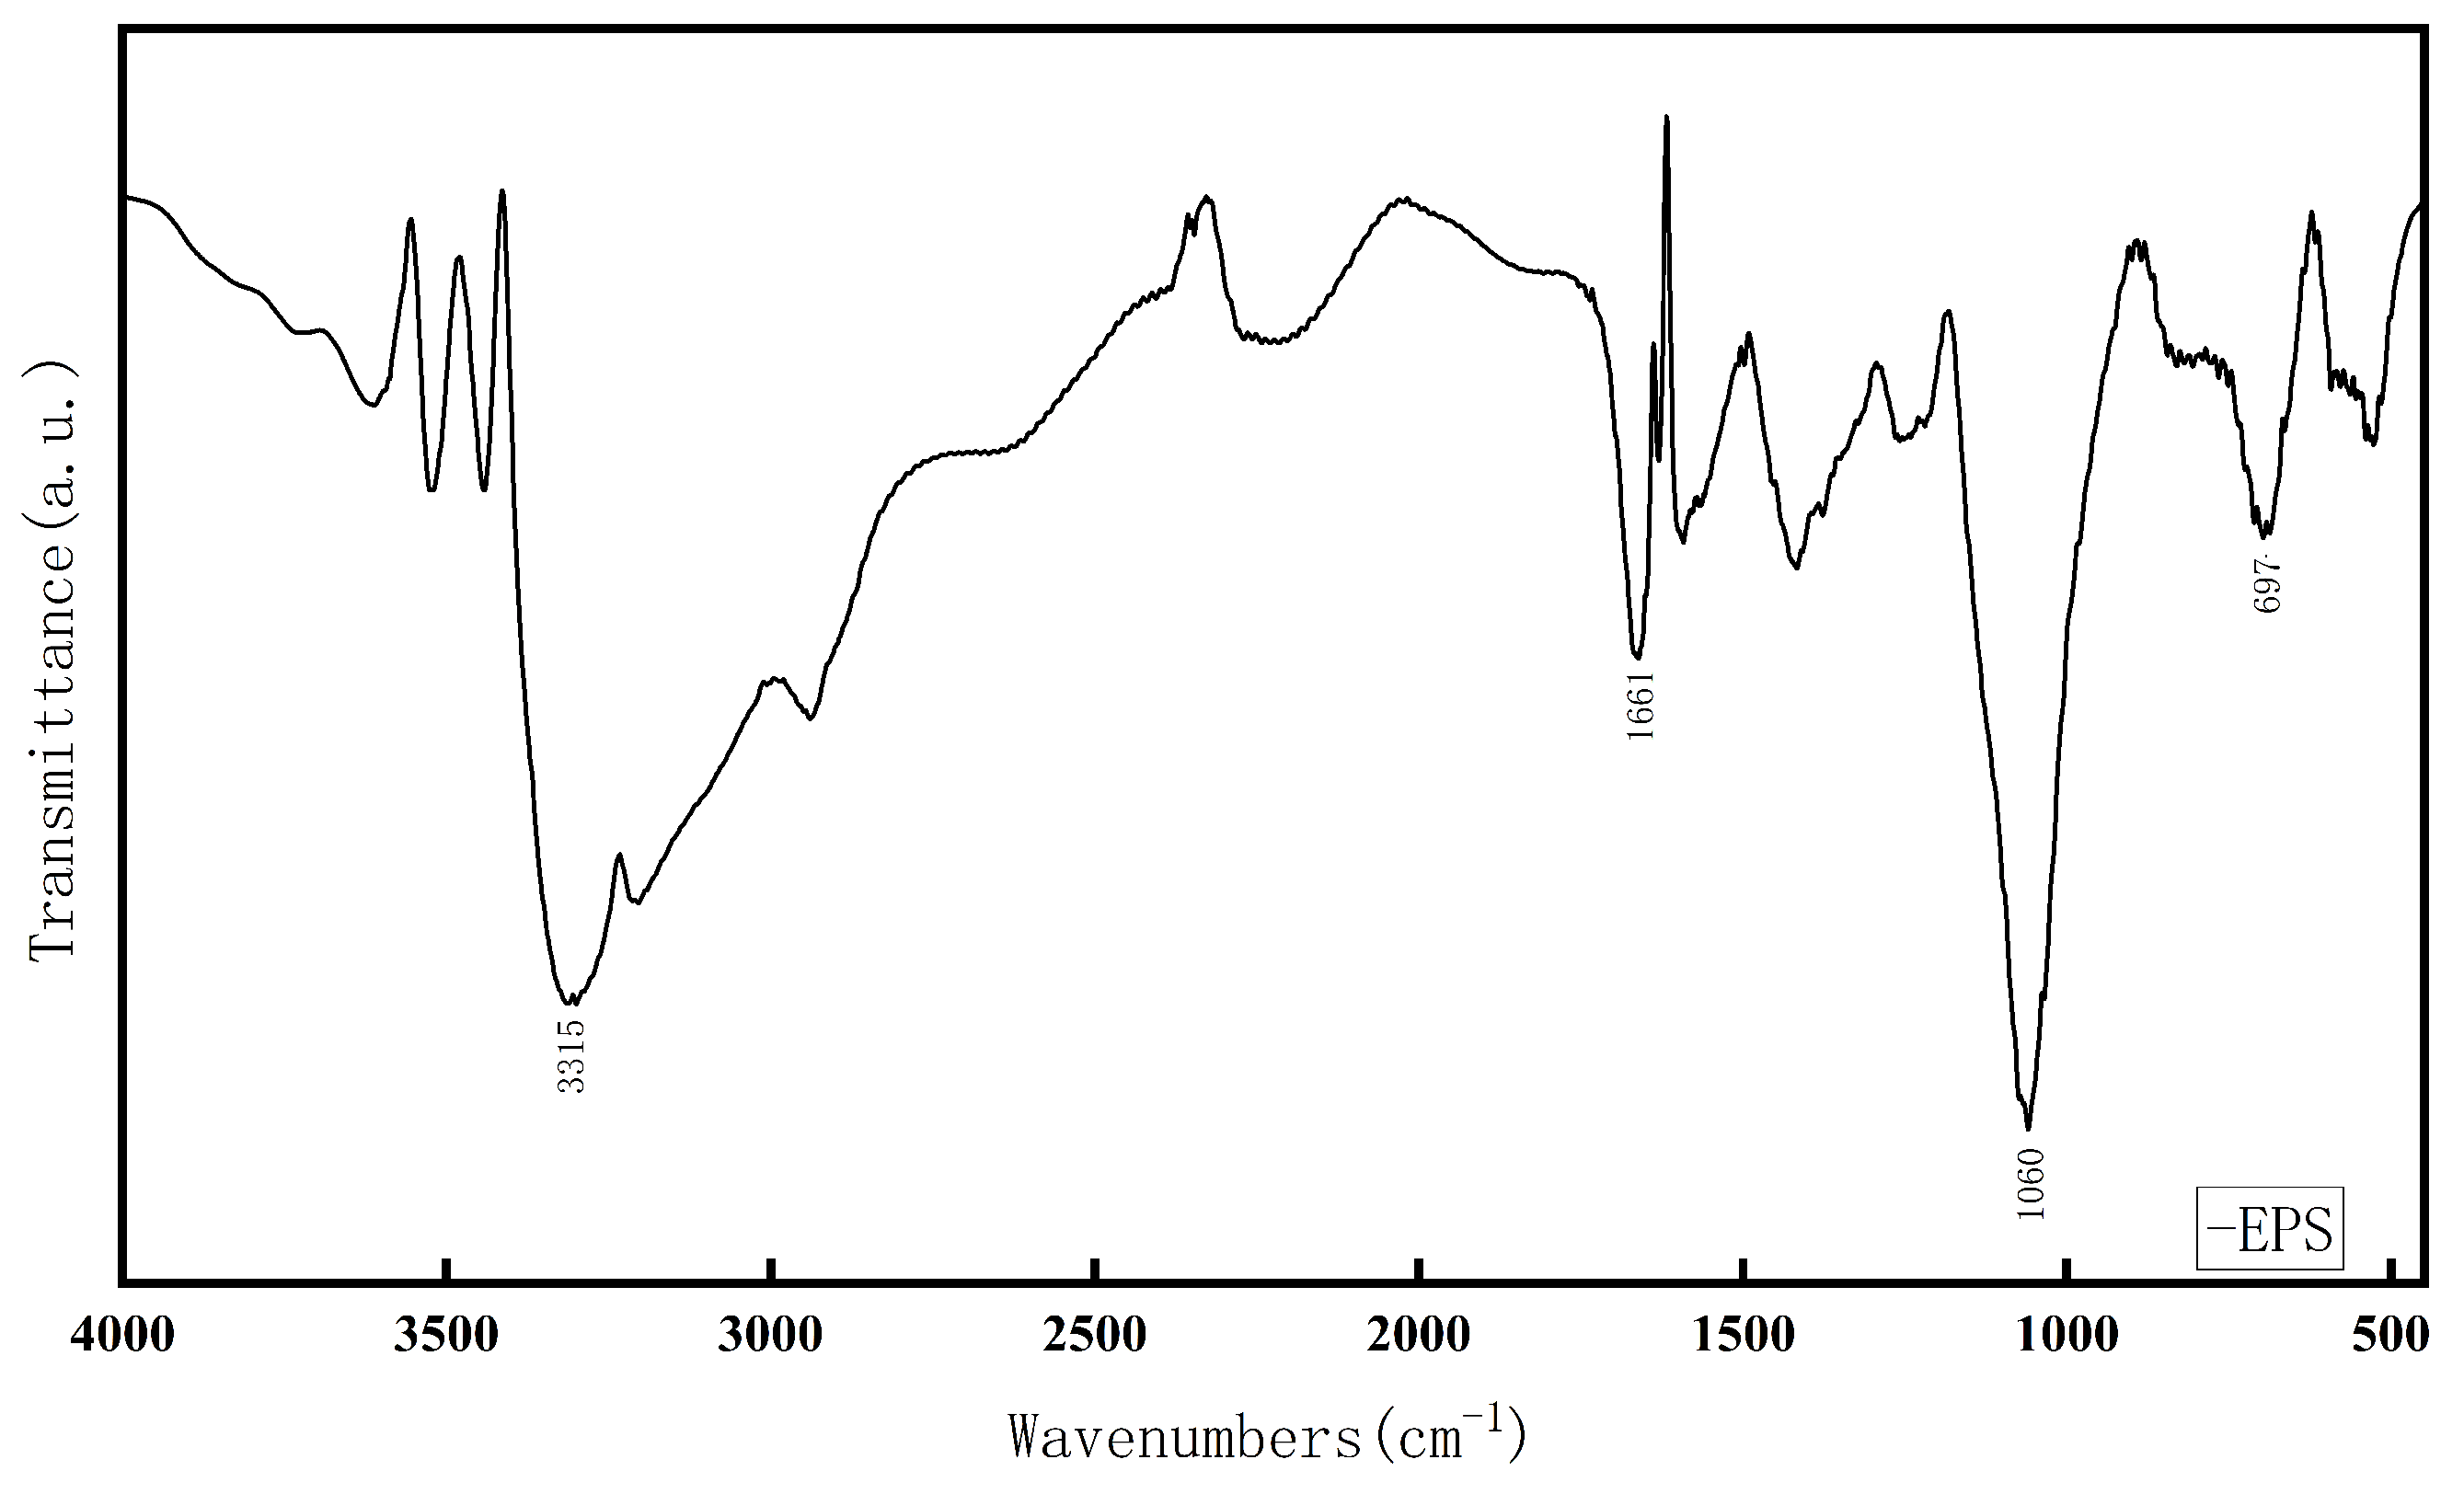
FTIR is an effective method for detecting the characteristic structure of biopolymers [32] and was used to detect the characteristic groups in the EPS to determine their kind. The Fourier transform infrared spectrum of the EPS in the range of 4000–400 cm−1 is shown in Figure 4; the sample had a relatively complex absorption peak in the wave-number range of 3500–1000 cm−1. In previous research, the characteristic absorption peak of hydroxyl was generally in the wave-number range of 3200–3600 cm−1. In this study, we found that EPS had an obvious absorption peak at 3315 cm−1, which was caused by C-H stretching. The existence of absorption peaks generated by vibration verified that the EPS produced by Del. algida was a glycan sample. In addition, there was a strong absorption peak at 1661 cm−1, which may be the stretching vibration absorption peak of the amide bond or peptide amine bond and also may be the bending vibration absorption peak of the C-N bond in proteins and peptides.
The absorption peaks in the wave-number fingerprint region below 1500 cm−1 are highly characteristic and can reflect the structural characteristics of different compounds. The EPS produced by Del. algida in this study had an absorption peak at 1060 cm−1 in the fingerprint area. Research has shown that the absorption peak of the polysaccharide at 1000–1200 cm−1 is generated by C-O-C or C-O stretching, and the absorption peak at that wave number is the C=O or C-O stretching absorption peak in the carboxyl group. The EPS had a strong absorption peak at 667 cm−1 in the fingerprint area, which should correspond to the C-O-C stretching absorption peak. The FTIR analysis results proved that the EPS produced by Del. algida contained most of the characteristic absorption peaks related to EPS [33].
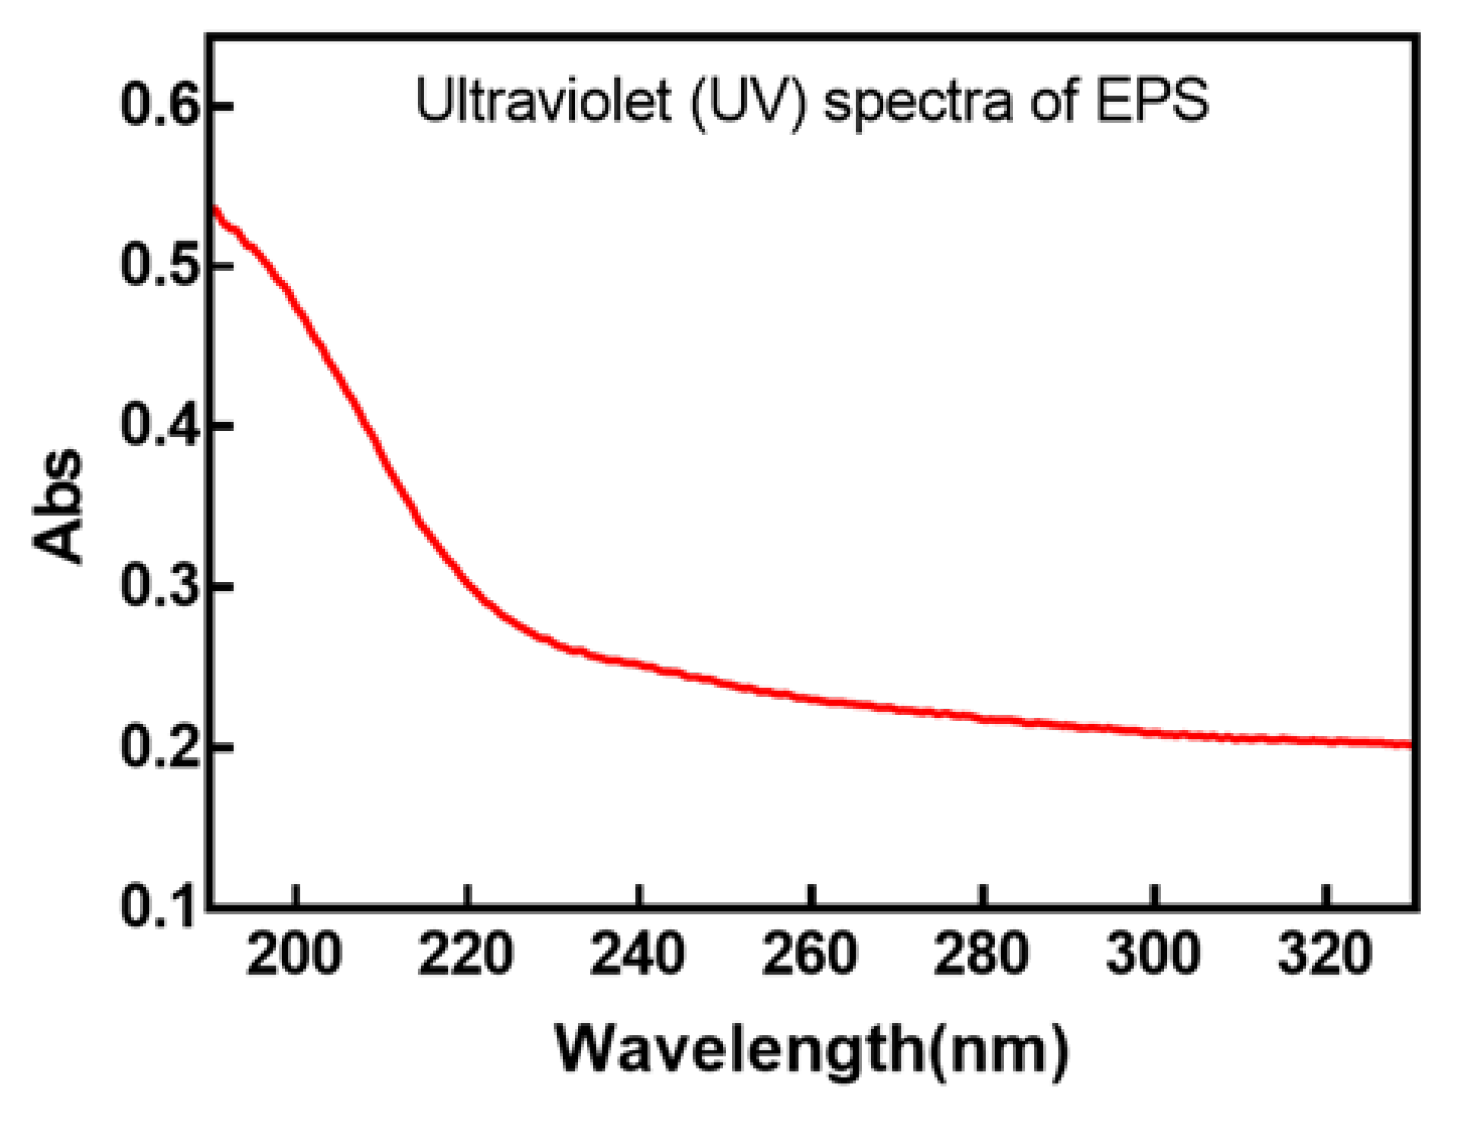
The 1 mg/mL EPS solution produced by Del. algida was analyzed by UV full-wavelength scanning in the range of 190–400 cm−1. From Figure 5, it can be seen that the extracted samples did not have absorption peaks at 260 nm and 280 nm, which indicated that there were no nucleic acids and proteins, and that the extraction of extracellular polysaccharides was better [34]. The main visual observation of the UV absorption of the sample at 260 nm and 280 nm highlighted the presence of a large number of nucleic acids and proteins within the sample. The UV scanning spectra at less than 200 nm showed the condition of the end absorption [35], and the results showed that there was no protein and nucleic acid and other impurities within the EPS, so subsequent experiments could be carried out.

3.1.4. SEM and NMR Analysis of EPS

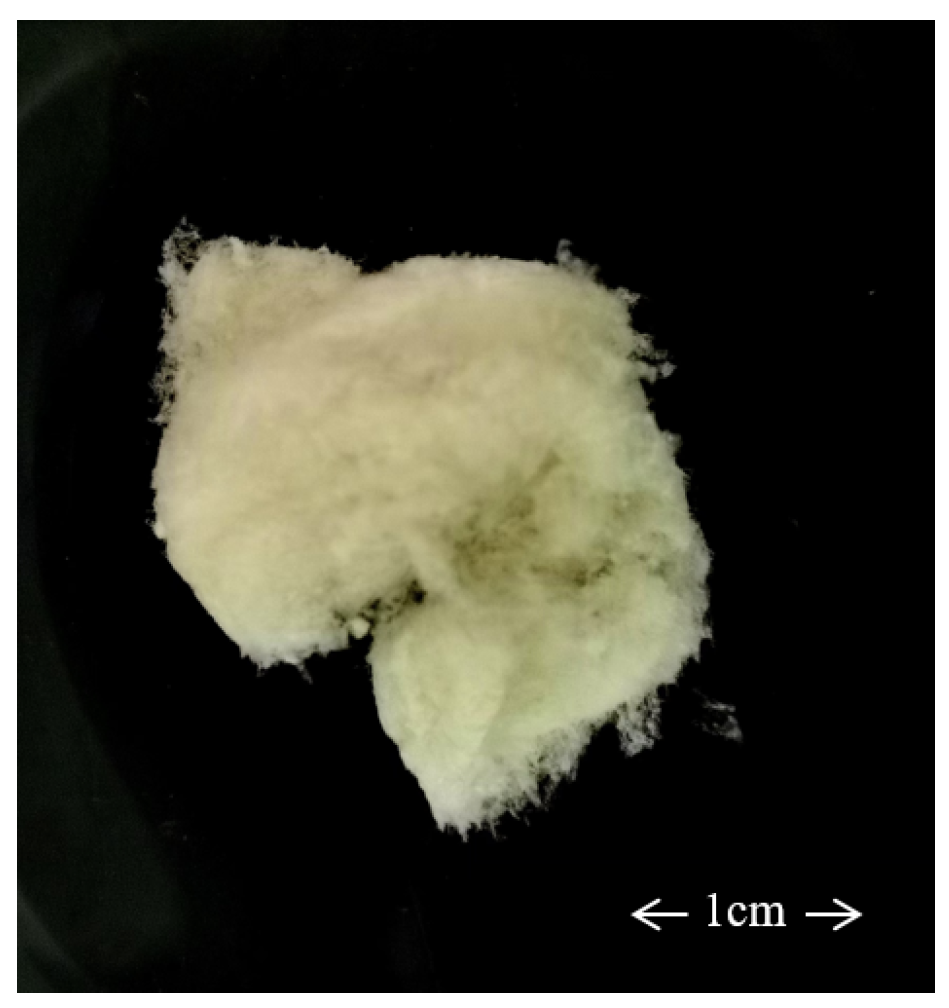
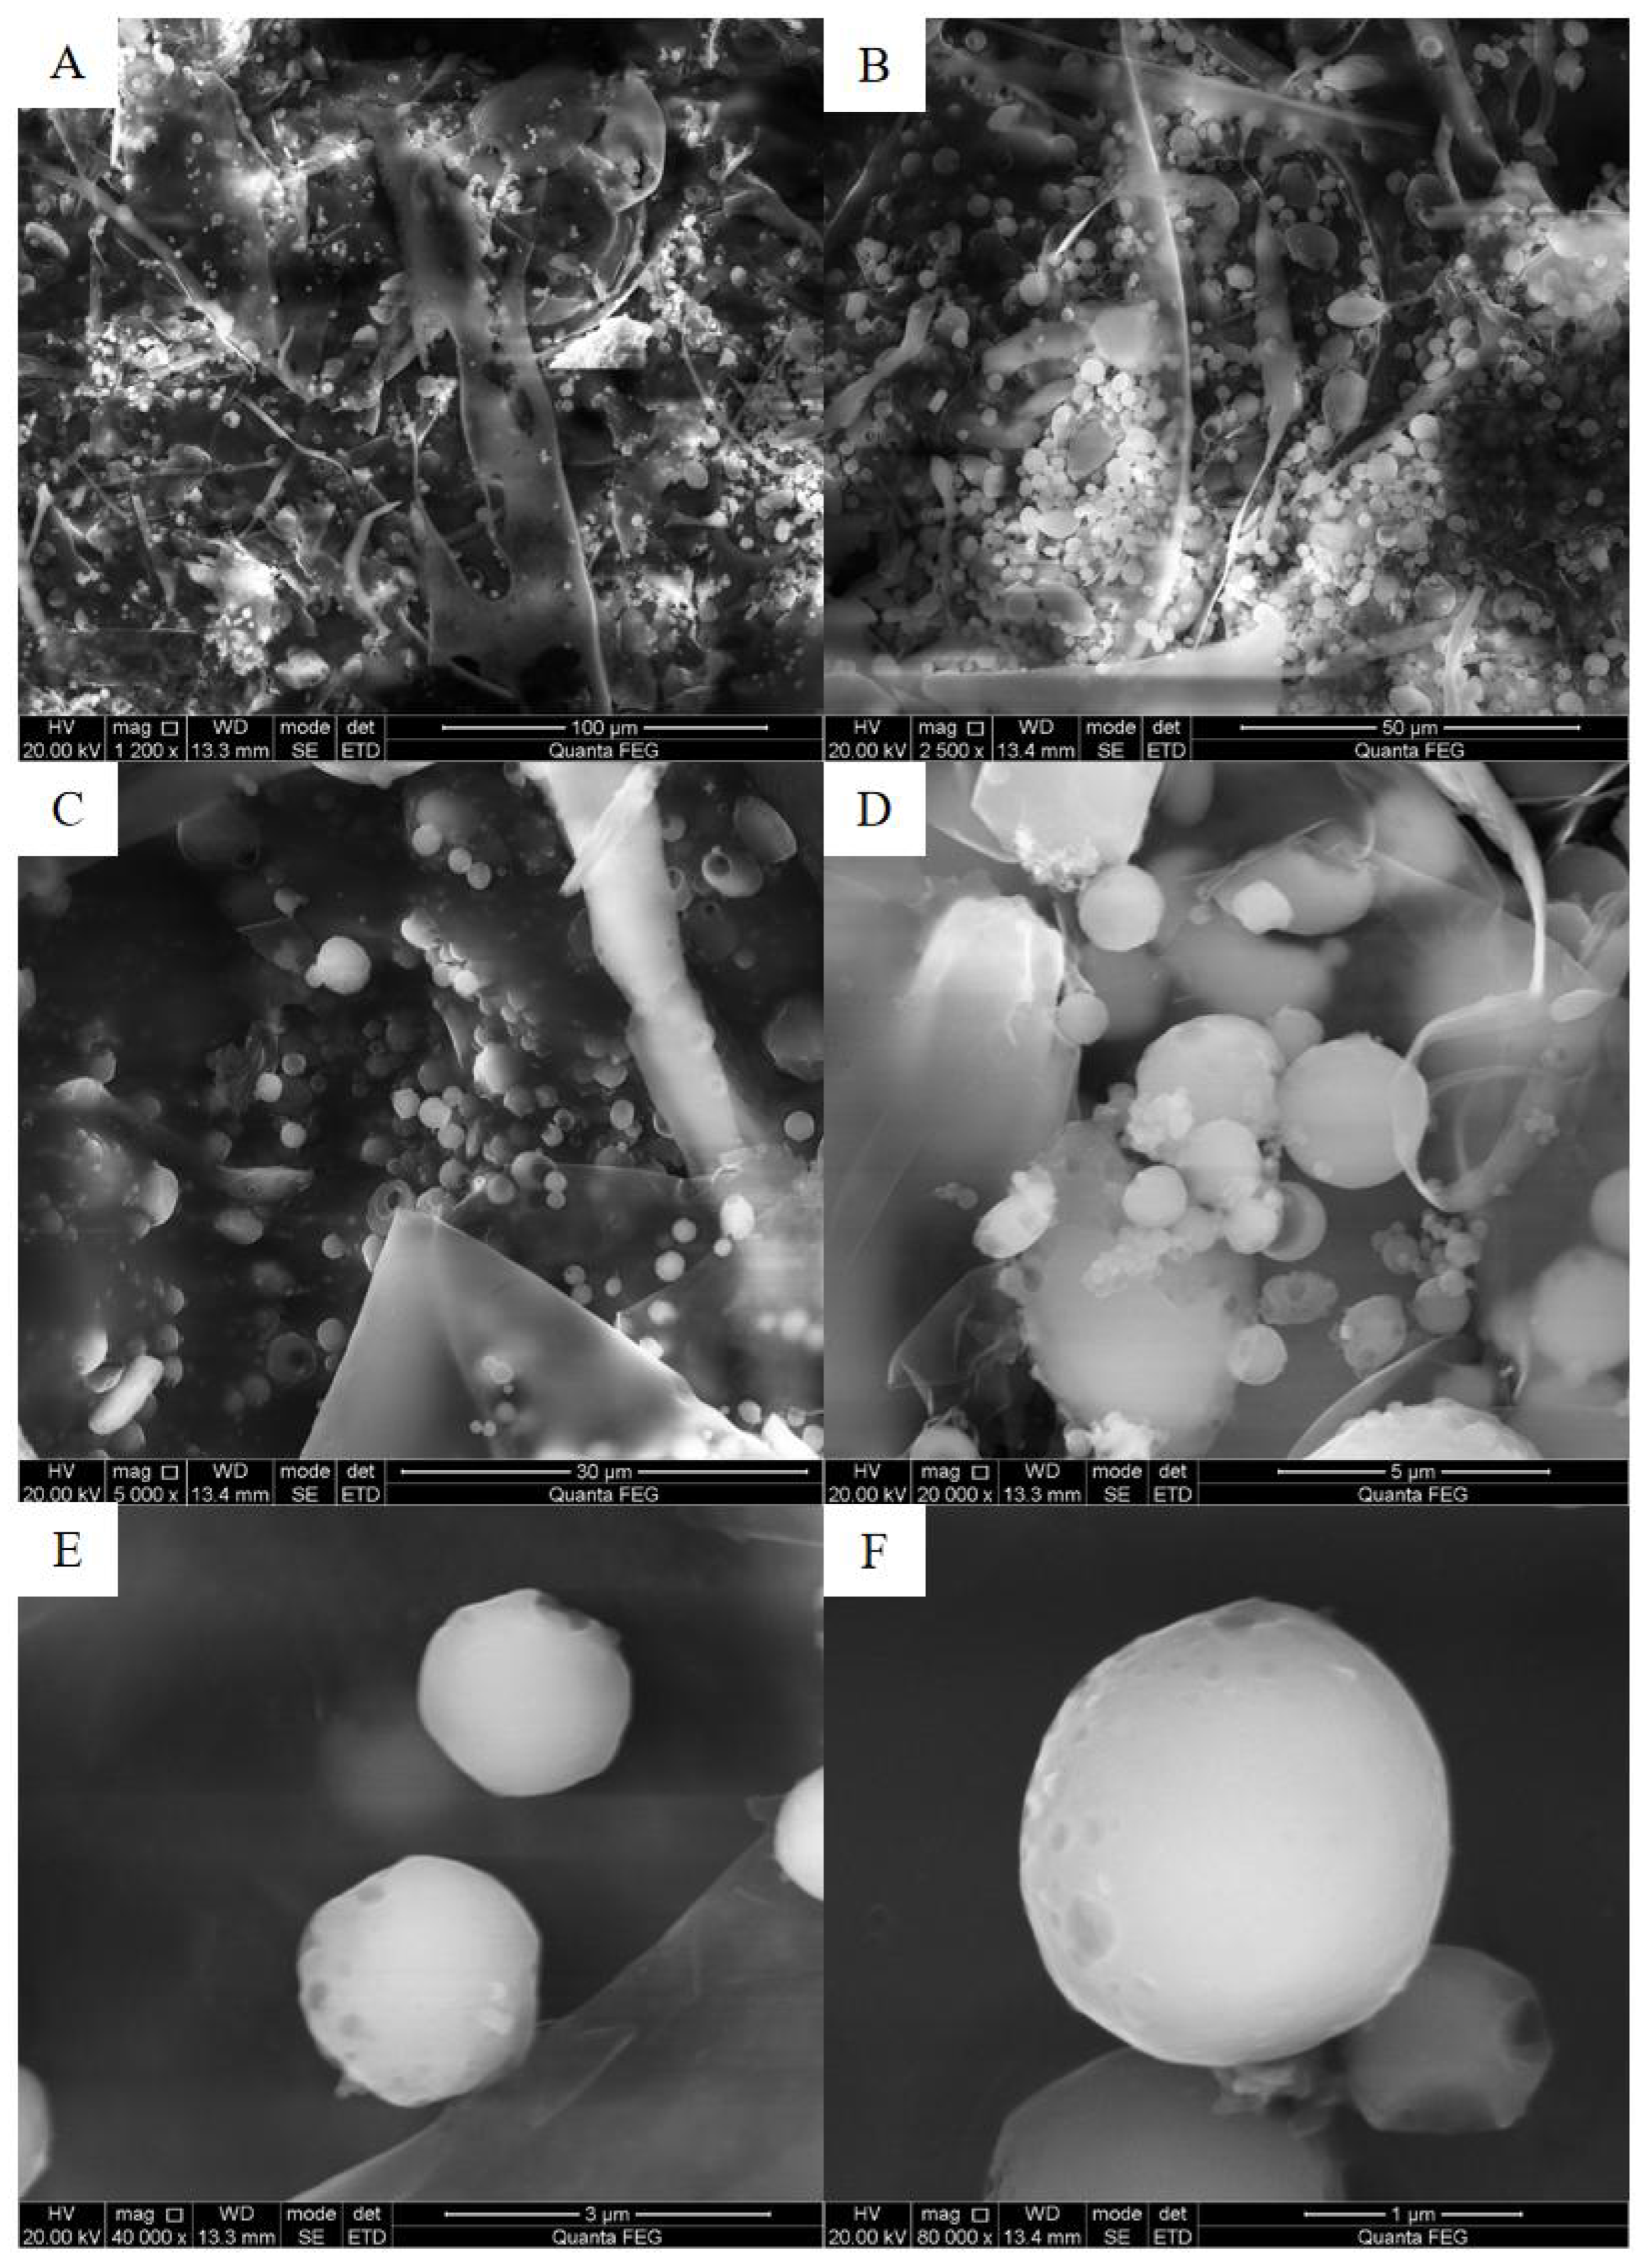
In Figure 6, it can be seen that the EPS extracted from the lyophilized Del. algida CFS appeared as a milky-white, cottonlike loose powder, with a light texture, low density, no noticeable odor, and it dissolved easily in water. Figure 7 shows the SEM observations of Del. Algida EPS at different magnifications. In Figure 7, the microstructure of EPS at different magnifications shows various irregular shapes, with most appearing as smooth, porous spheres. Additionally, there were compact rod-like, filamentous, and sheetlike structures, indicating that this EPS possessed characteristics of stabilizers, plasticizing film materials, thickeners, and adsorbents. Thus, the Del. algida CFS has the potential to be developed as a raw material for polymer materials.
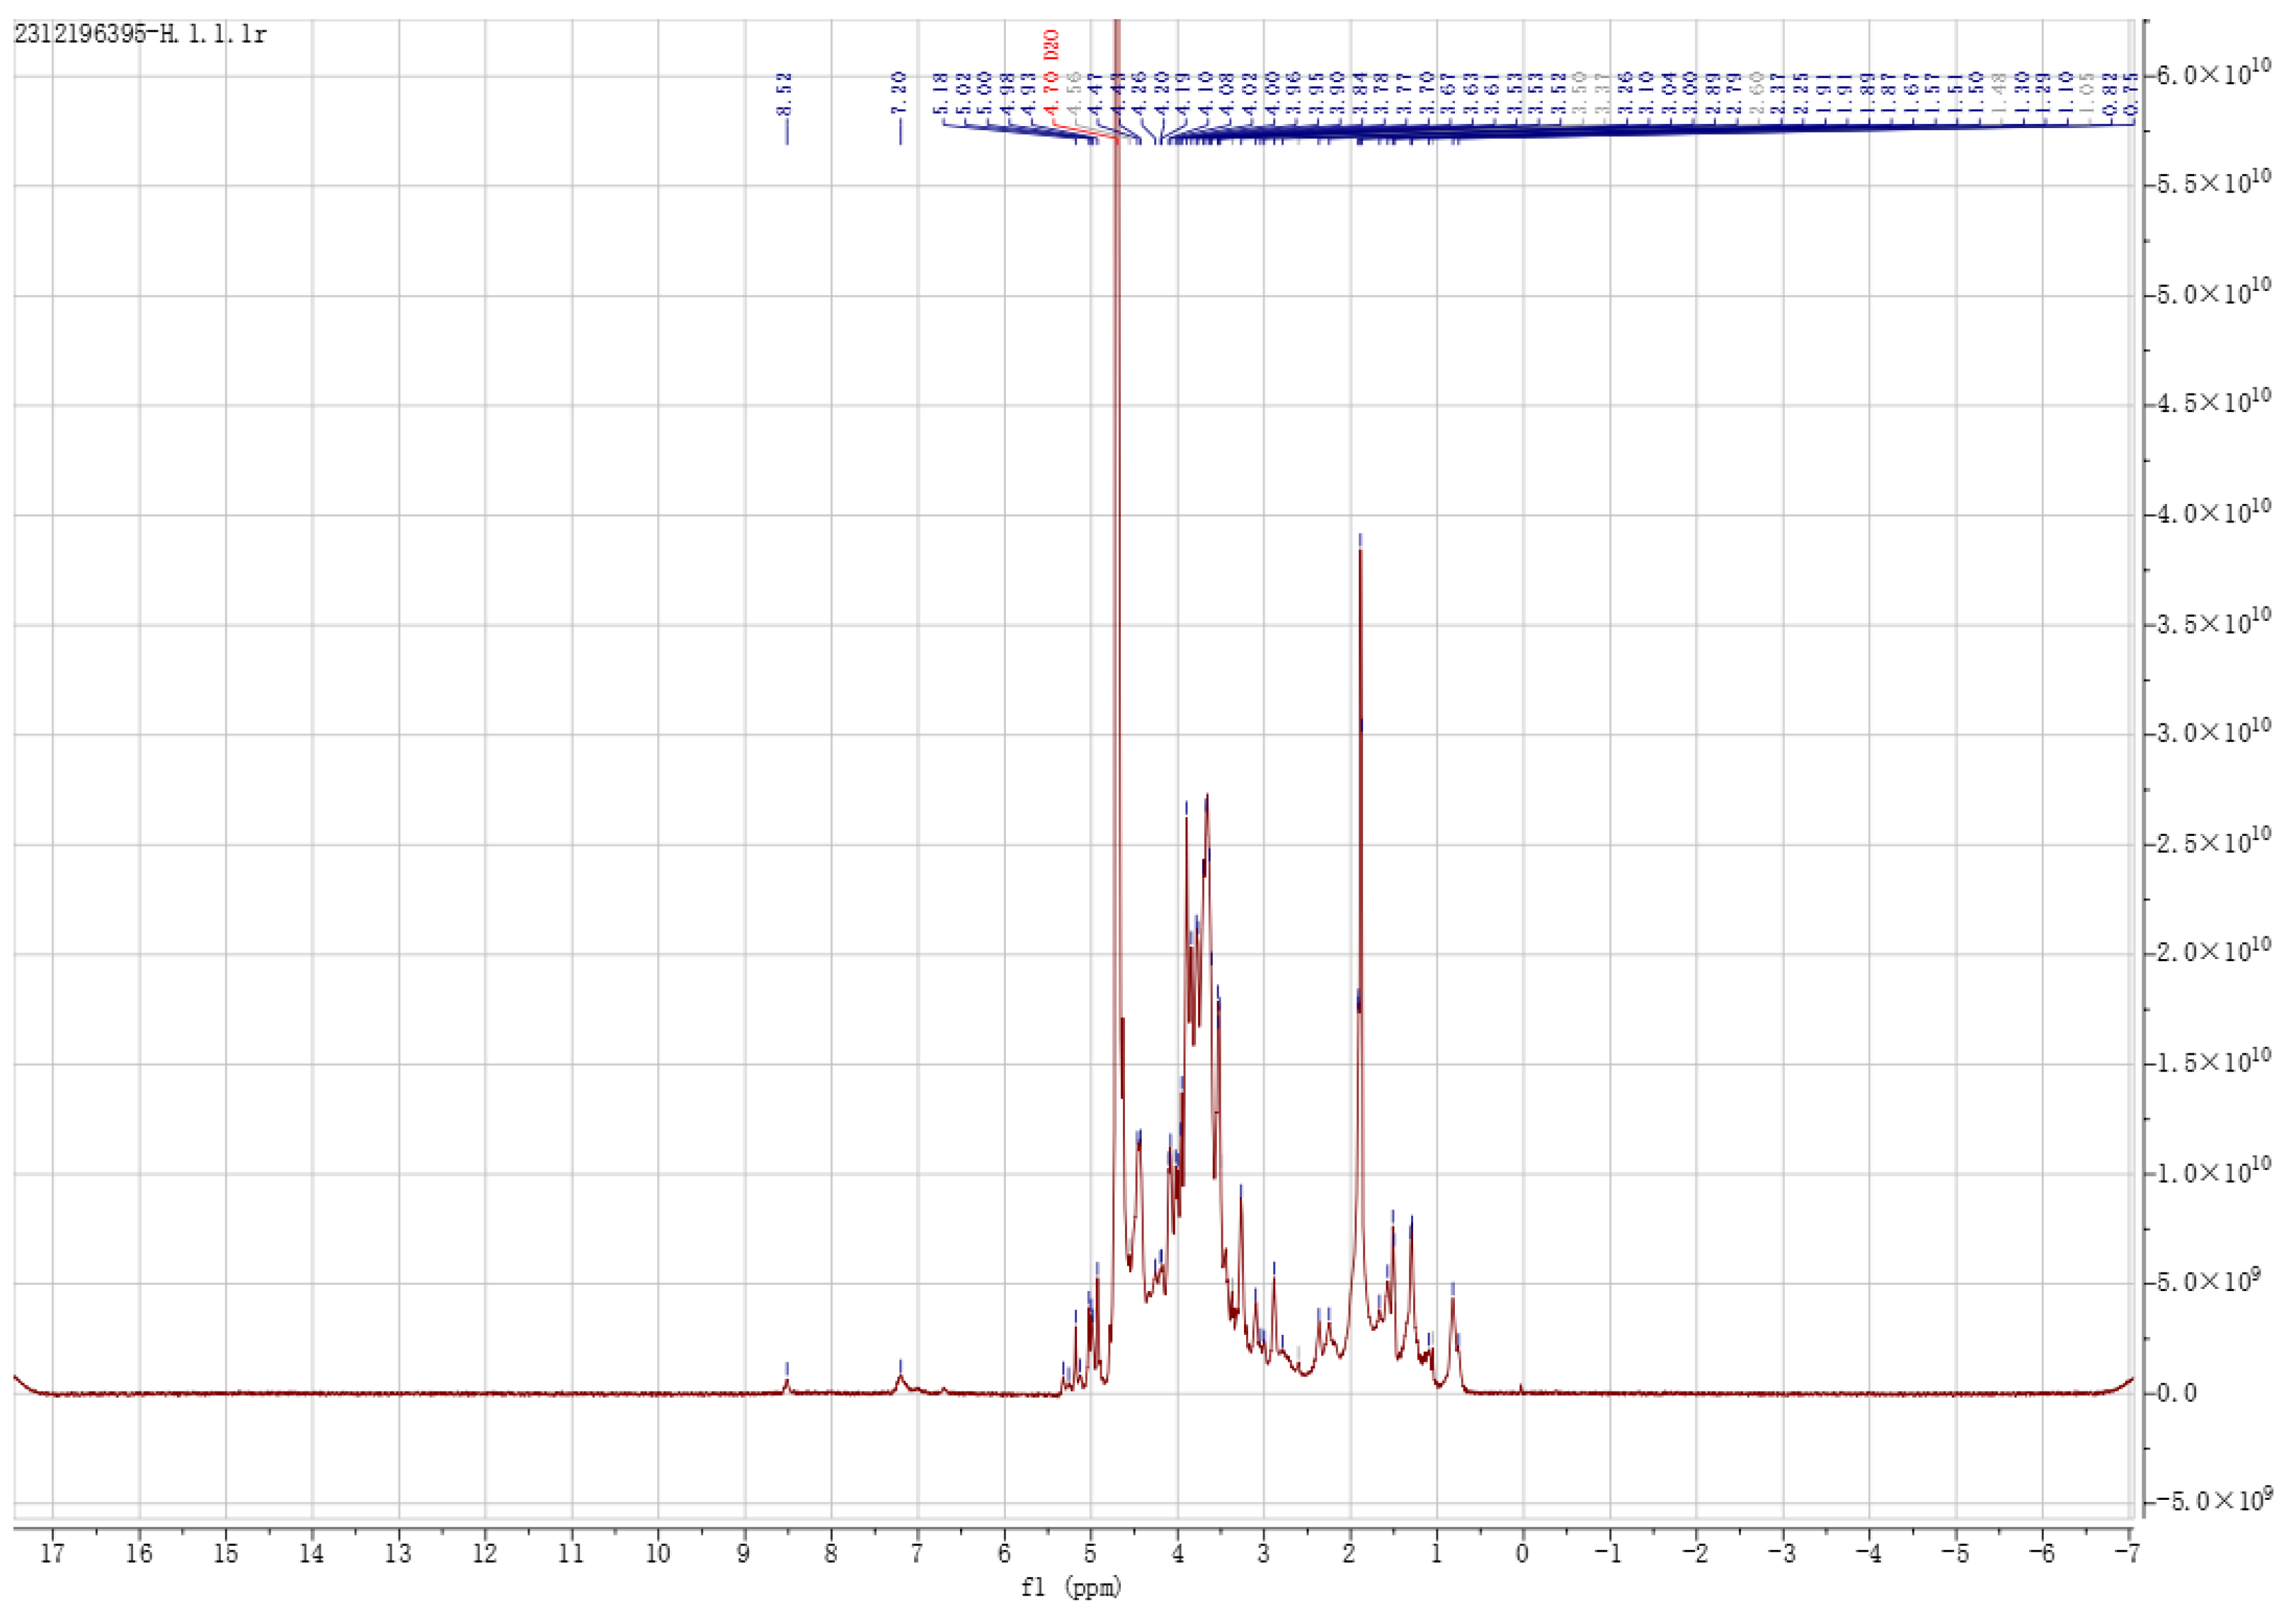
By combining NMR with techniques such as FTIR, UV, and HPLC, the main components of a compound can be identified and its structure analyzed to determine the elemental composition, making this method applicable to analyses in biology and materials science. In this section, NMR technology was used to analyze the glycosidic bond configurations of the monosaccharides in EPS. The 1H NMR spectrum of EPS is shown in Figure 8, which is primarily used to determine the glycosidic bond configuration of EPS molecules. The anomeric region ( δ 4.5–5.5 ppm) signals are commonly used to identify the anomeric configurations of sugar residues in polysaccharide molecules. Based on different anomeric forms, they can be classified as α - or β -structures. Typically, α -pyranose shows signals greater than δ 5.0 ppm, while β -pyranose rarely exceeds δ 5.0 ppm. In the anomeric region ( δ 4.5–5.5 ppm) of the 1H NMR spectrum of the EPS, three distinct signal variations were detected, indicating that the structure of the EPS mainly consisted of three monosaccharide residues and possibly contained both α - and β -glycosidic bonds. The absorption peak changes in the δ 3.34–4.33 ppm region were caused by H-2 to H-6. A large absorption peak at δ 1.2–1.4 ppm was likely due to the presence of CH2 groups and longer carbon chains.
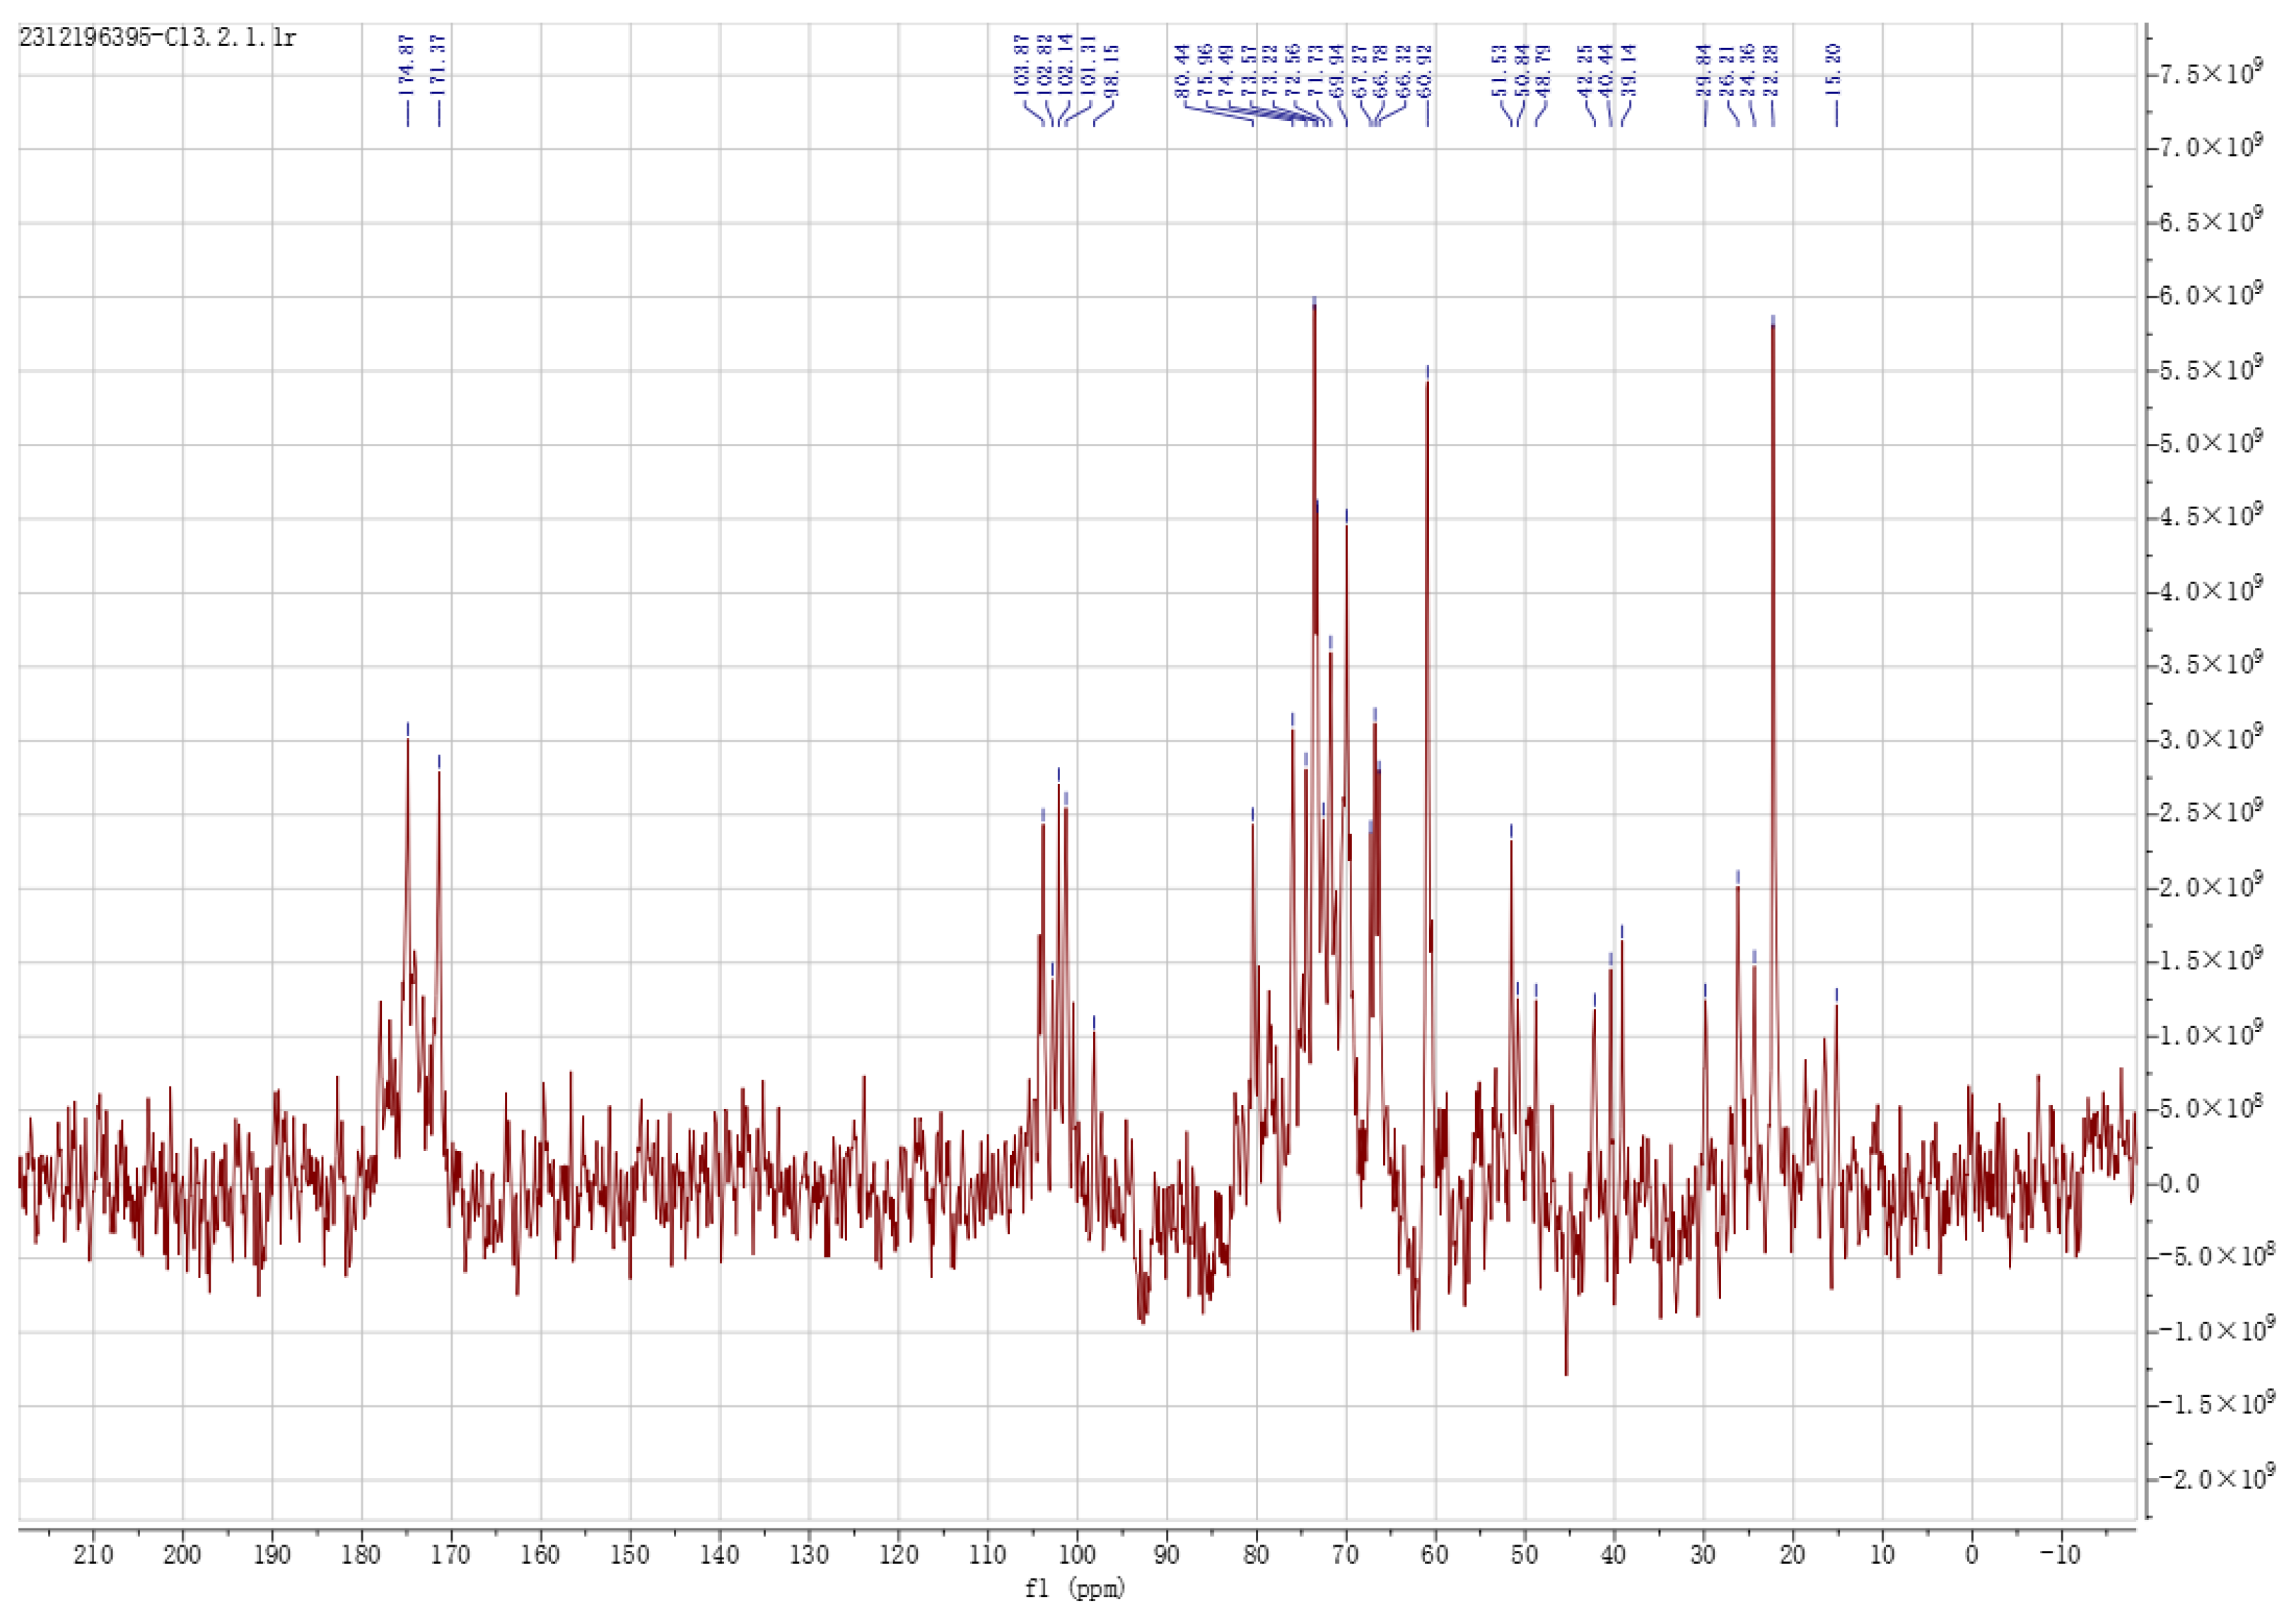
As shown in Figure 9, in the 13C NMR spectrum of the EPS, the type and configuration of glycosidic bonds in the EPS are usually analyzed based on the signals of anomeric carbons. Generally, the signals for C-2 to C-6 appear with chemical shifts in the δ 60–75 ppm range, while the anomeric proton signals for C-1 exhibit chemical shifts in the δ 97–105 ppm range. Chemical shifts in the δ 97–102 ppm range indicate α -glycosidic bonds, while shifts in the δ 102–105 ppm range correspond to β -glycosidic bonds. The absorption peak signals in the range of δ 60.92–80.44 ppm are primarily caused by C-2 to C-6. Multiple large absorption peaks appeared in the range of δ 98.15–103.87 ppm, where the peaks at δ 98.15 ppm and δ 101.31 ppm indicated the presence of two α -glycosidic bonds in the EPS structure, while the peaks at δ 102.14 ppm, δ 102.87 ppm, and δ 103.87 ppm indicated the presence of three β -glycosidic bonds. A strong signal peak at δ 174.87 ppm may have been due to the carboxyl group of uronic acid, which was consistent with the presence of uronic acid in the monosaccharide composition. The signal peaks at δ 22.28 ppm and δ 60.92 ppm corresponded to rhamnose and -OCH3 residues, aligning with the detection of rhamnose in the monosaccharide composition, further confirming the presence of rhamnose in the EPS. Therefore, the EPS may have good potential for immunoactivity.

3.2. Antioxidation Activities of EPS In Vitro

The existence of various redox reactions in living organisms yields certain harmful radicals such as ABTS+, DPPH, superoxide anion radicals, and hydroxyl radicals. Thus, experiments for the antioxidant activities of the EPS in vitro were carried out to determine if the EPS had the ability to scavenge such harmful radicals, which was a possible way to speculate their functions within the biological organism.
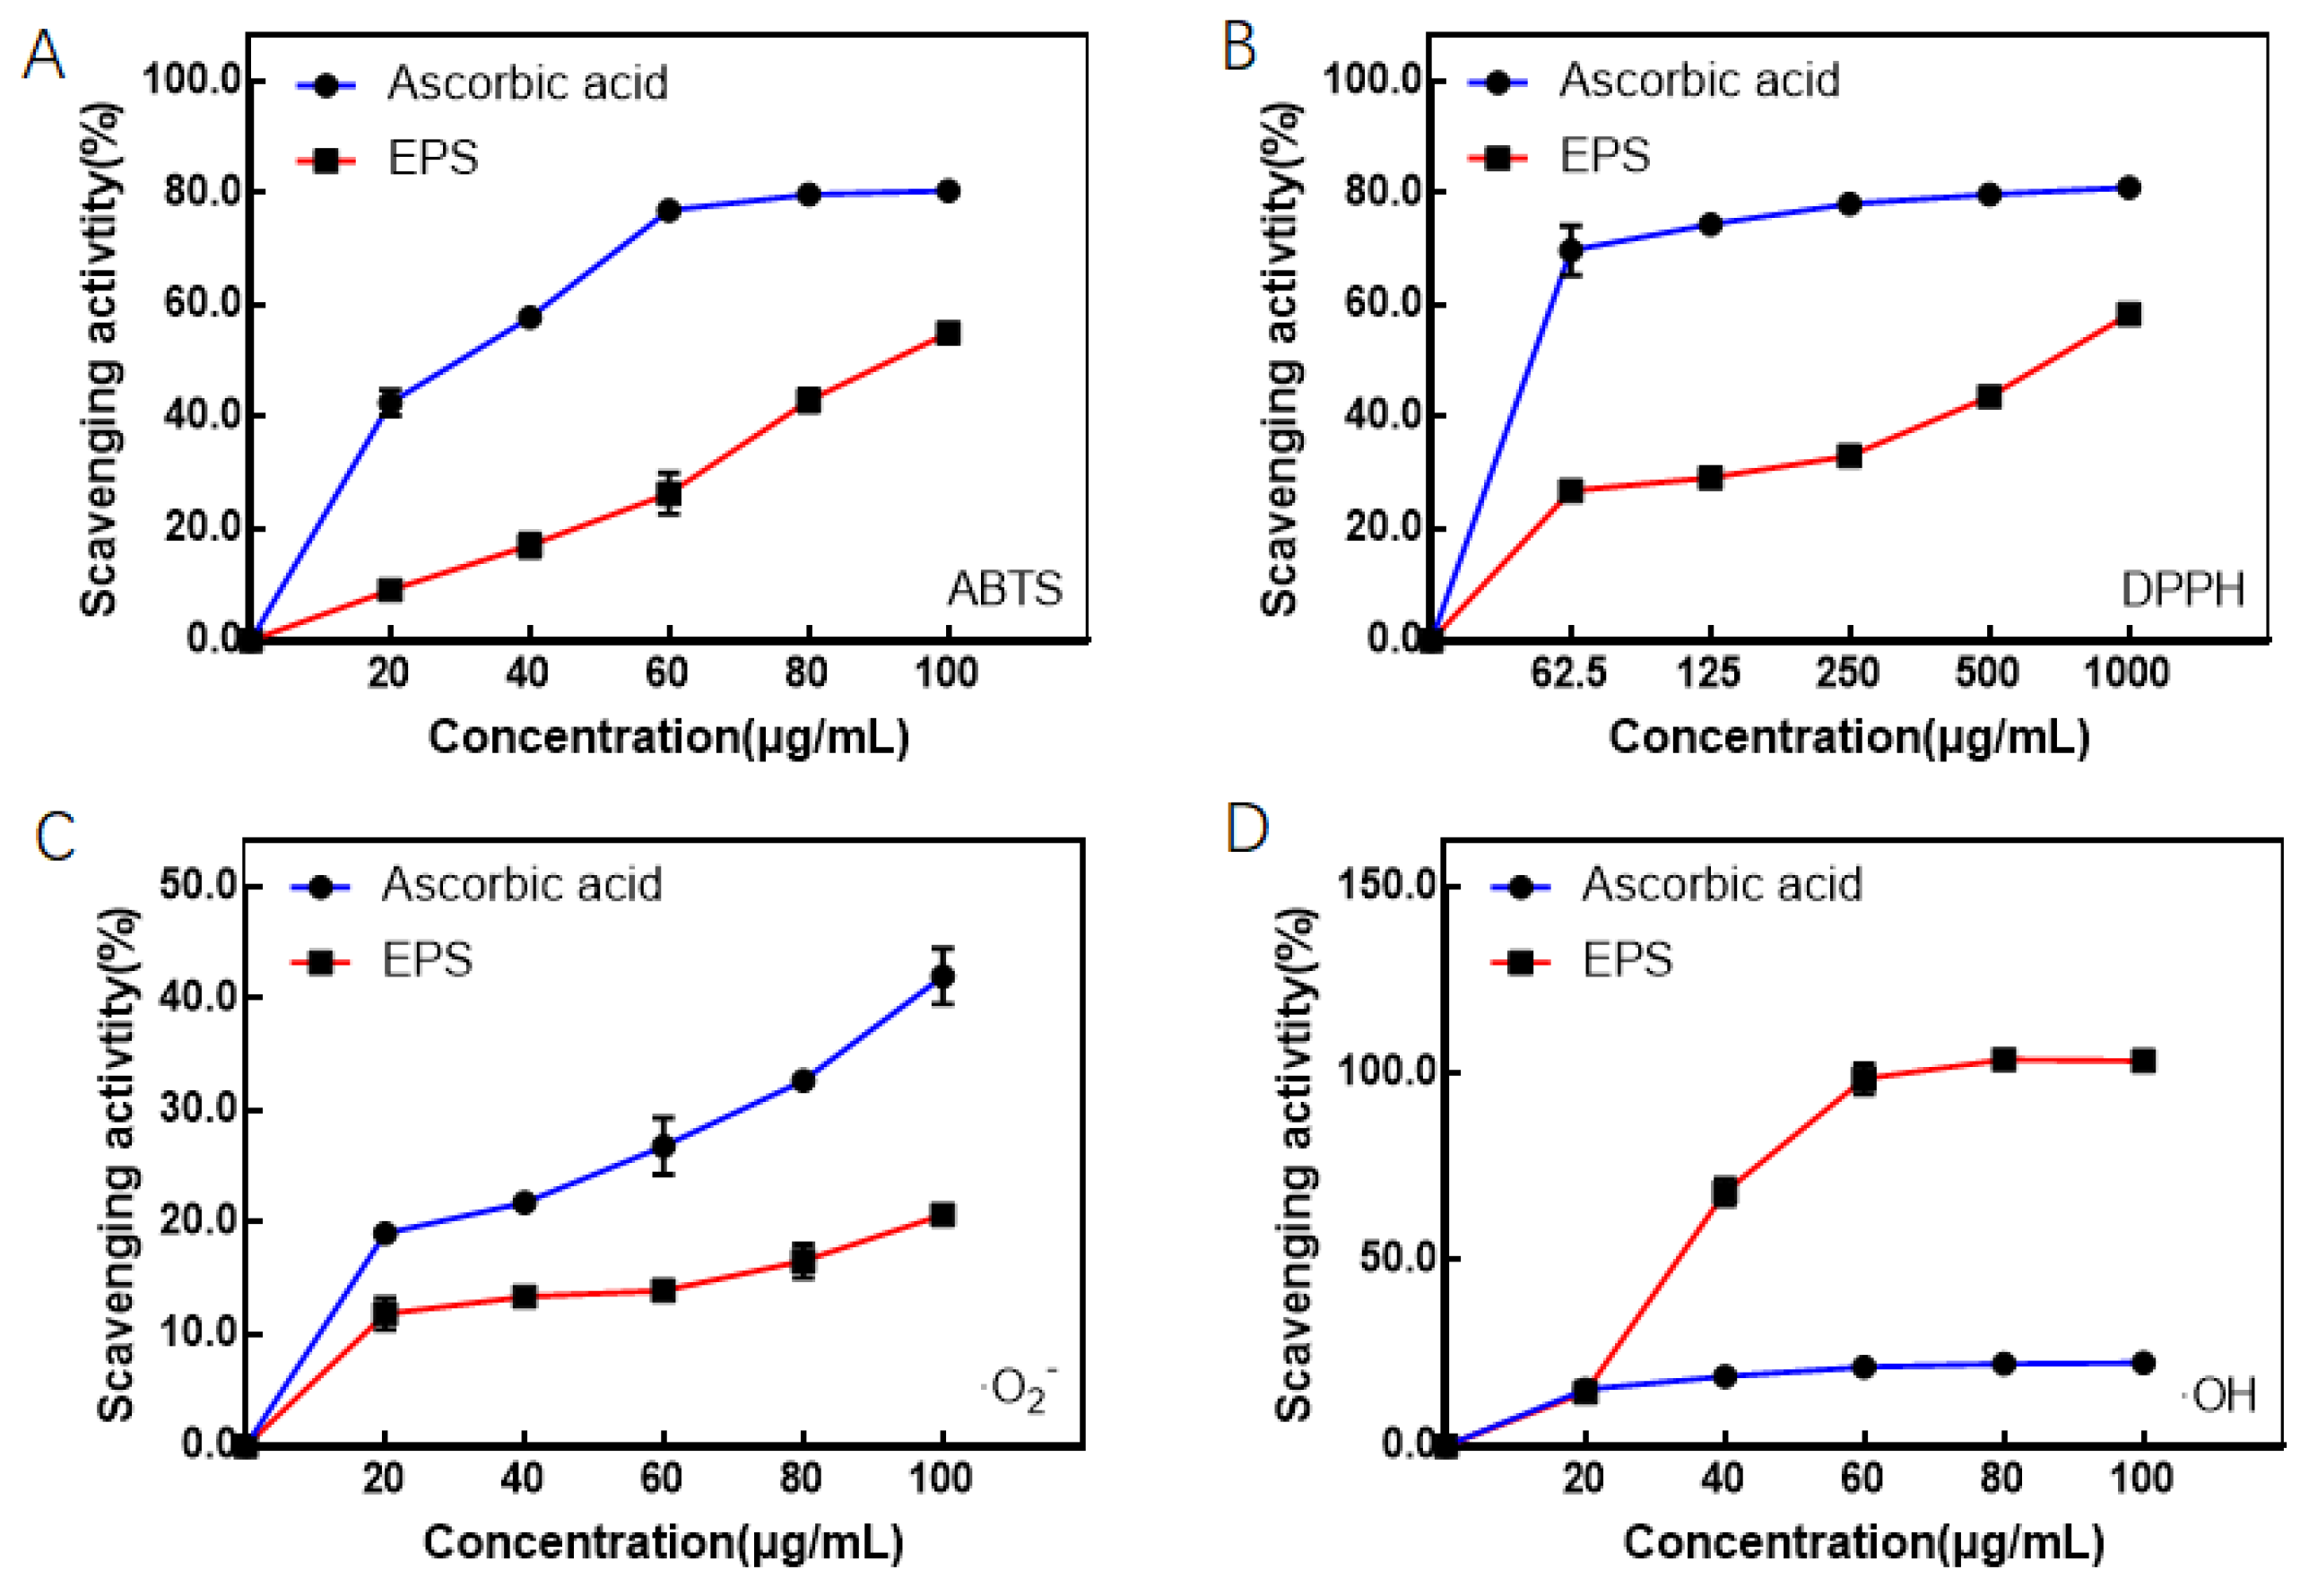
ABTS+ free radicals are the determination of the antioxidant activity of natural compounds using a common and convenient model, by measuring the ABTS+ radical scavenging ability in a comprehensive evaluation of the antioxidant activity of the EPS. As shown in Figure 10A, the EPS exhibited varying degrees of antioxidant activity in a dose-dependent manner at all concentrations.
DPPH is a nitrogen-centered radical that is stable in organic solvents and is purple when dissolved in ethanol, with a maximum absorption peak of 517 nm. When the single electron of DPPH is captured, its color becomes lighter and luminosity decreases, where the extent of the decrease in absorbance is proportional to the concentration of the EPS, corresponding to the antioxidant capacity of polysaccharide samples [36]. Figure 10B shows the DPPH radical scavenging activity of the EPS, where the scavenging activity of the EPS on DPPH showed a dose-dependent relationship, and the scavenging activity of EPS could be up to 60.0% when the concentration of EPS reached 10 mg/mL. As a positive control, ascorbic acid could almost scavenge more than 75.0% of DPPH at a concentration of 0.625 mg/mL.
Hydroxyl radical is a reactive oxygen radical with strong oxidability, which can damage organisms and be toxic to cells [37]. Figure 10D shows that both ascorbic acid and the EPS produced by Del. algida had a hydroxyl radical scavenging activity, where the antioxidant properties of the EPS differed greatly from ascorbic acid with the same concentration, and the hydroxyl radical scavenging activity of EPS at 1 mg/mL was similar to that of ascorbic acid at 0.2 mg/mL.
Figure 10C shows that both the ascorbic acid and the EPS produced by Del. algida had a scavenging activity against superoxide anion radicals, which increased with the concentration of ascorbic acid and EPS. The EPS had a greater difference in antioxidant activity than the same concentration of ascorbic acid, where the antioxidant activity of 0.1 mg/mL EPS was similar to the antioxidant activity of 0.02 mg/mL ascorbic acid.

3.3. Immunoregulation Activities of EPS Produced by Del. algida

3.3.1. Effects of Pseudomonas and EPS on Cell Activity

Figure 11A,B demonstrates the effect of different contents of P. fluorescens CFS on the survival and inhibition rate of RAW264.7 cells. From Figure 11A, when the concentration of CFS reached 0.01%, the survival rate decreased significantly as compared to the CK group. The supplement of P. fluorescens CFS had a significant inhibitory effect on the survival of RAW264.7 cells, where the inhibition rate reached 19.67%, as shown in Figure 11B. When the concentration further increased, the survival rate decreased more obviously. Specifically, at a concentration of 0.10%, the survival rate was only 55.77%, while the inhibition rate was as high as 67.89%, resulting in a large number of deaths in clusters of cells. When the concentration of CFS was 0.08%, the inhibition rate was up to 59.97%, thus 0.04% of P. fluorescens CFS was selected for the later experiments.
Figure 11C,D demonstrates the effect of P. fragi CFS on the survival and inhibition rate of RAW264.7 cells under various contents. From Figure 11C, when the concentration of the CFS reached 0.01%, the survival rate decreased significantly as compared to the CK group. Thus, the addition of P. fragi CFS had a significant inhibitory effect on the survival of RAW264.7 cells. As shown in Figure 11D, the inhibition rate reached a maximum of 20.06%, but it did not change significantly with a content of 0.02%. As the concentration further increased, the survival rate decreased more obviously. At the CFS concentration of 0.10%, the survival rate was only 14.66% while the inhibition rate was as high as 71.23%, yielding death in clusters of a large number of cells. When the CFS concentration was 0.04%, both survival rate and inhibition rate were around 50%. Therefore, the concentration of CFS of P. fragi was selected to be 0.04% for the later experiment.
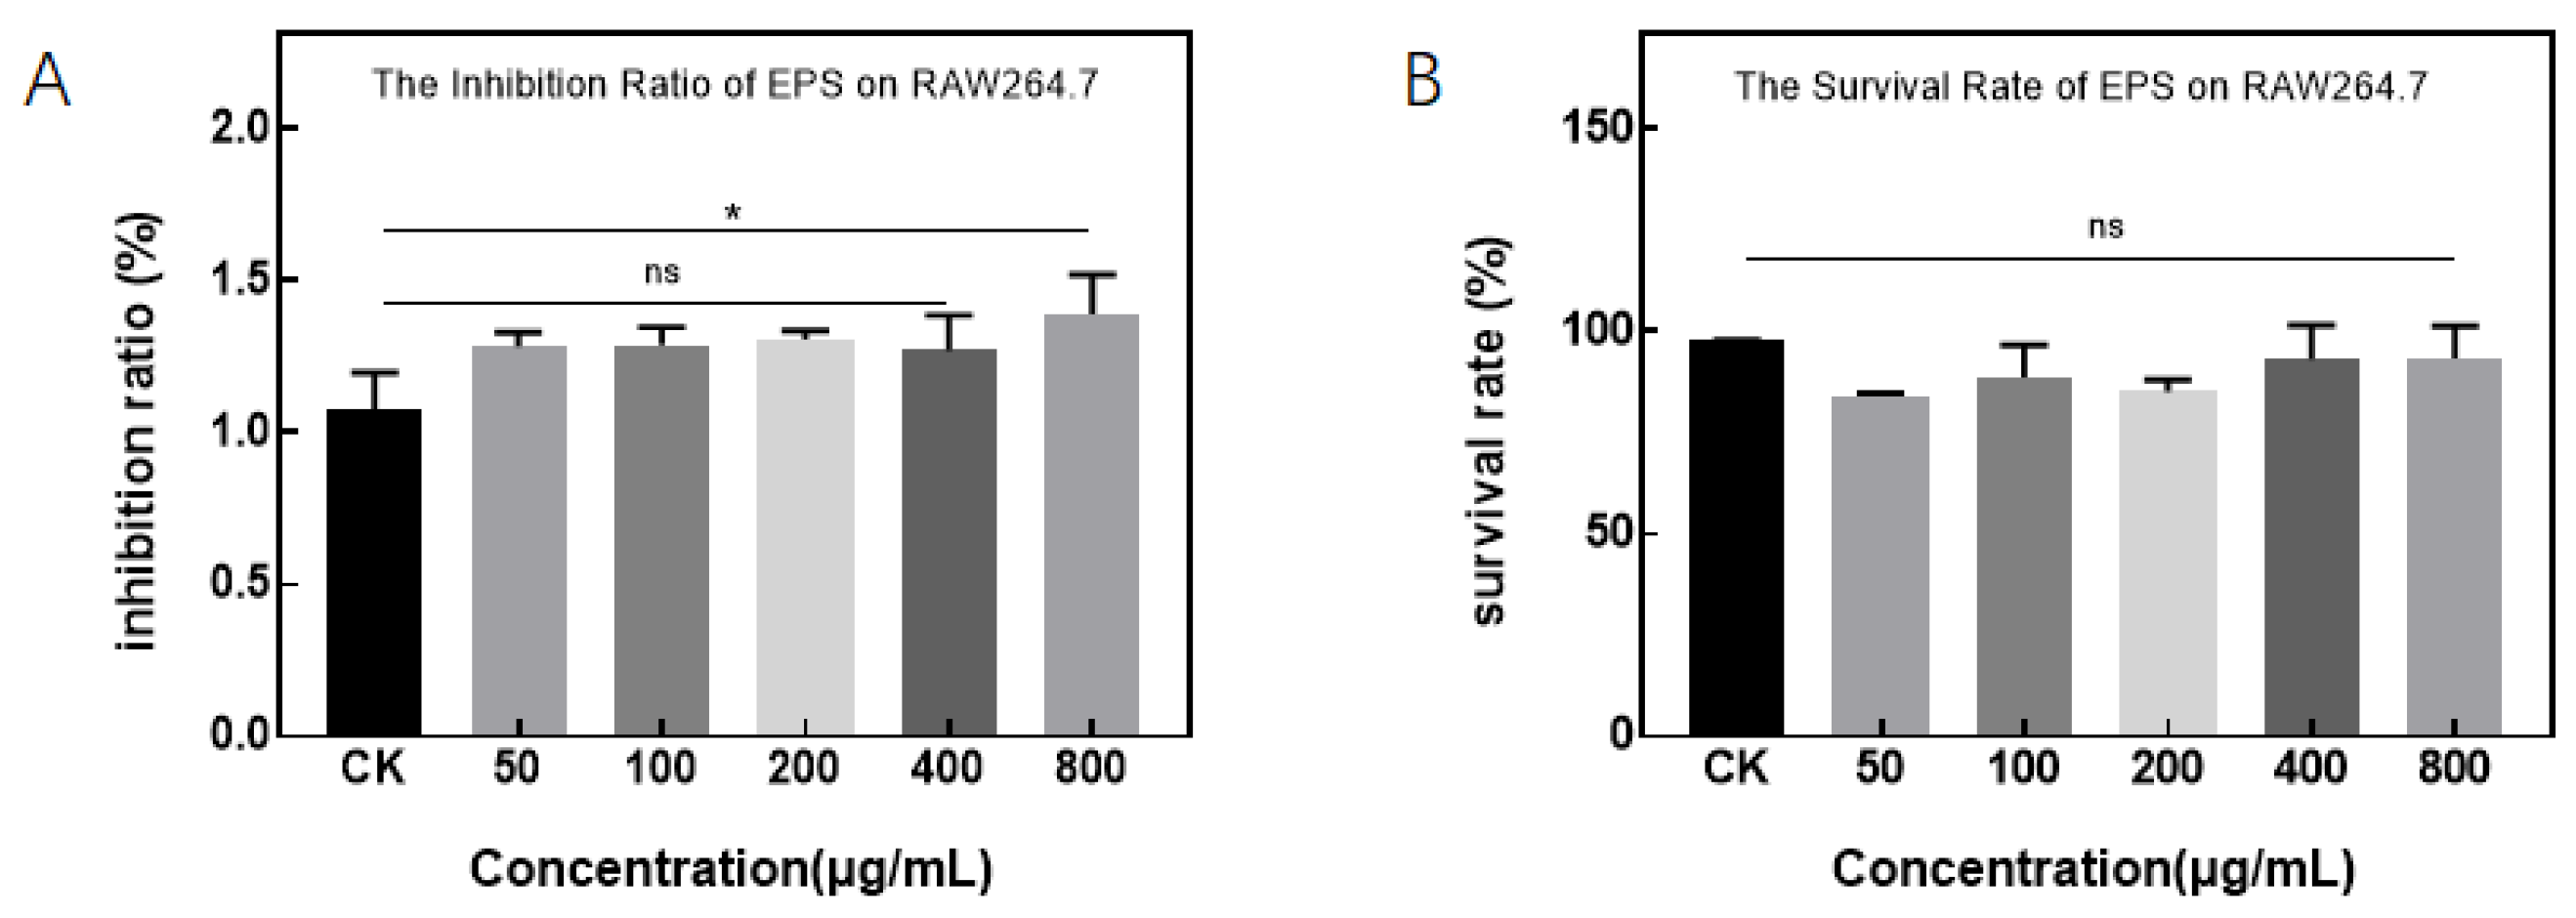
Figure 12 shows the effect of different concentrations of EPS produced by Del. algida on the survival and inhibition rate of RAW264.7 cells. From Figure 12A, when the EPS concentration was 50–800 μg/mL, there was no significant effect on cell survival. At an EPS concentration of 800 μg/mL, the inhibition rate of the cells increased significantly as compared to the CK group, as shown in Figure 12B. Such a phenomenon of a significant increase in the inhibition rate may be due to the osmotic pressure change of the cells caused by the high concentration of EPS, leading to the limitation of cell growth.

3.3.2. Effect of EPS on Inflammatory RAW264.7 Cells

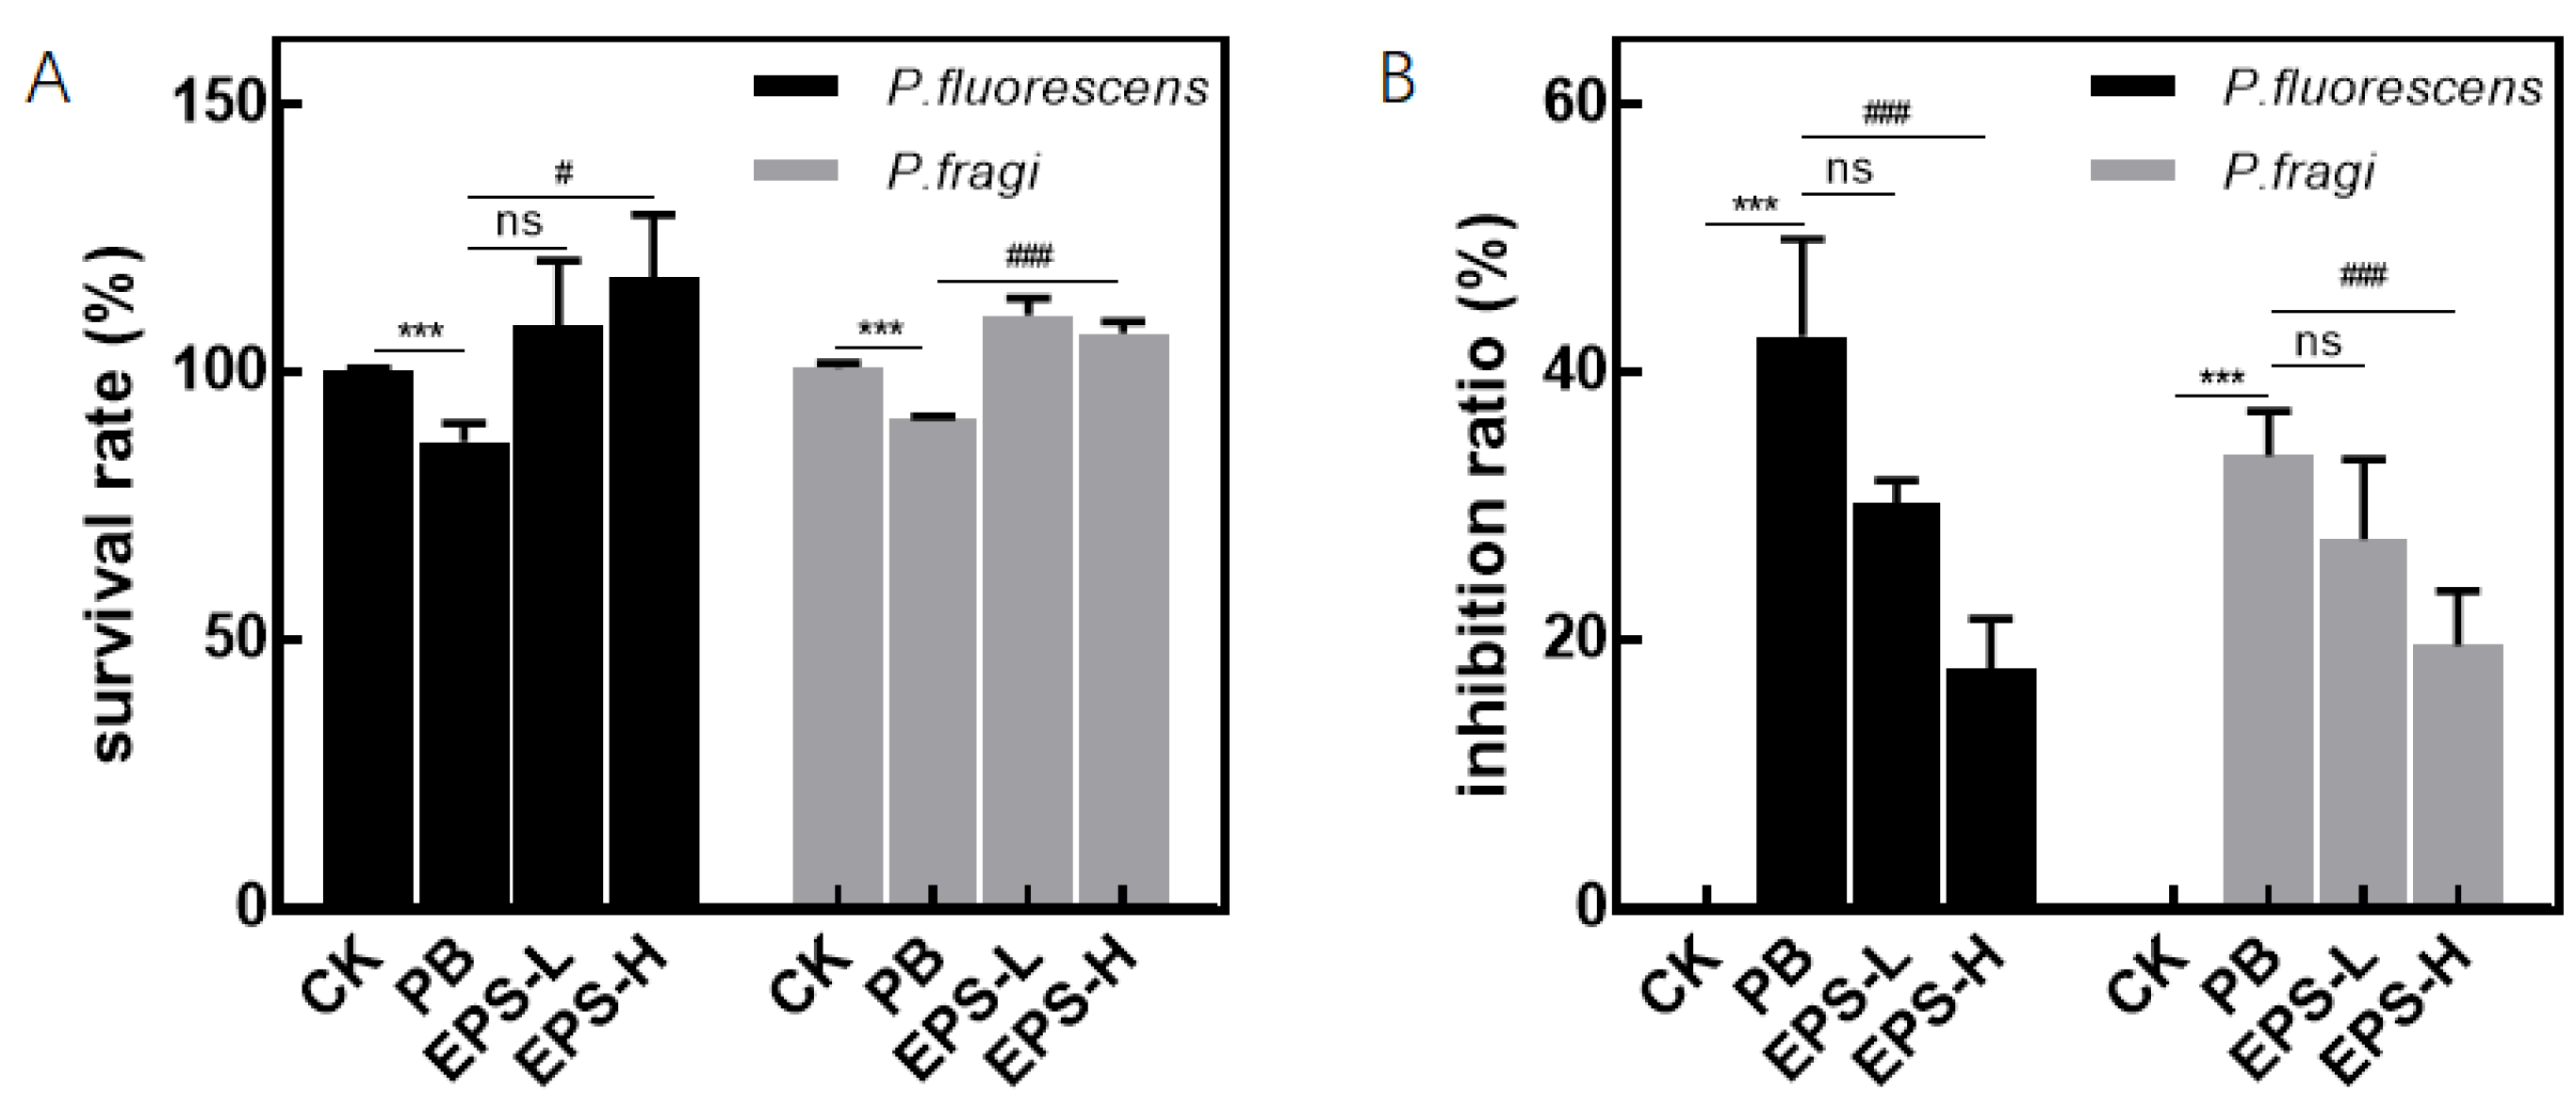
Figure 13 shows the effect of the EPS produced by Del. algida on the survival and inhibition rate of RAW264.7 cells infected with Pseudomonas CFS. As shown in Figure 13A, the survival rate of RAW264.7 cells significantly decreased after Pseudomonas CFS infection as compared to the CK group, and the results were consistent with the experimental results in Section 3.3.1. When P. fluorescens CFS was supplemented, the survival rate of EPS-L group had a tendency to increase but the result was not significant, while the EPS-L group had a significantly increased survival rate of cells after infection. When adding P. fragi CFS, both EPS-L and EPS-H groups showed a significant increase in the survival rate of infected cells. In Figure 13B, one can find a significant increase in the inhibition of cell activity after infection with the Pseudomonas CFS as compared to the CK group, which was also in agreement with the results in Section 3.3.1. When P. fluorescens CFS was added, the inhibition rate of the EPS-L group showed a decreasing trend, but the results were not significant, while the EPS-H group had a significantly reduced inhibition rate of the cells after infection. When P. fragi CFS was supplemented, both the EPS-L group and the EPS-H group showed a significant decrease in the inhibition rate of infected cell activity.

3.3.3. Effects of EPS on NO Secretion of Inflammatory RAW264.7 Cells

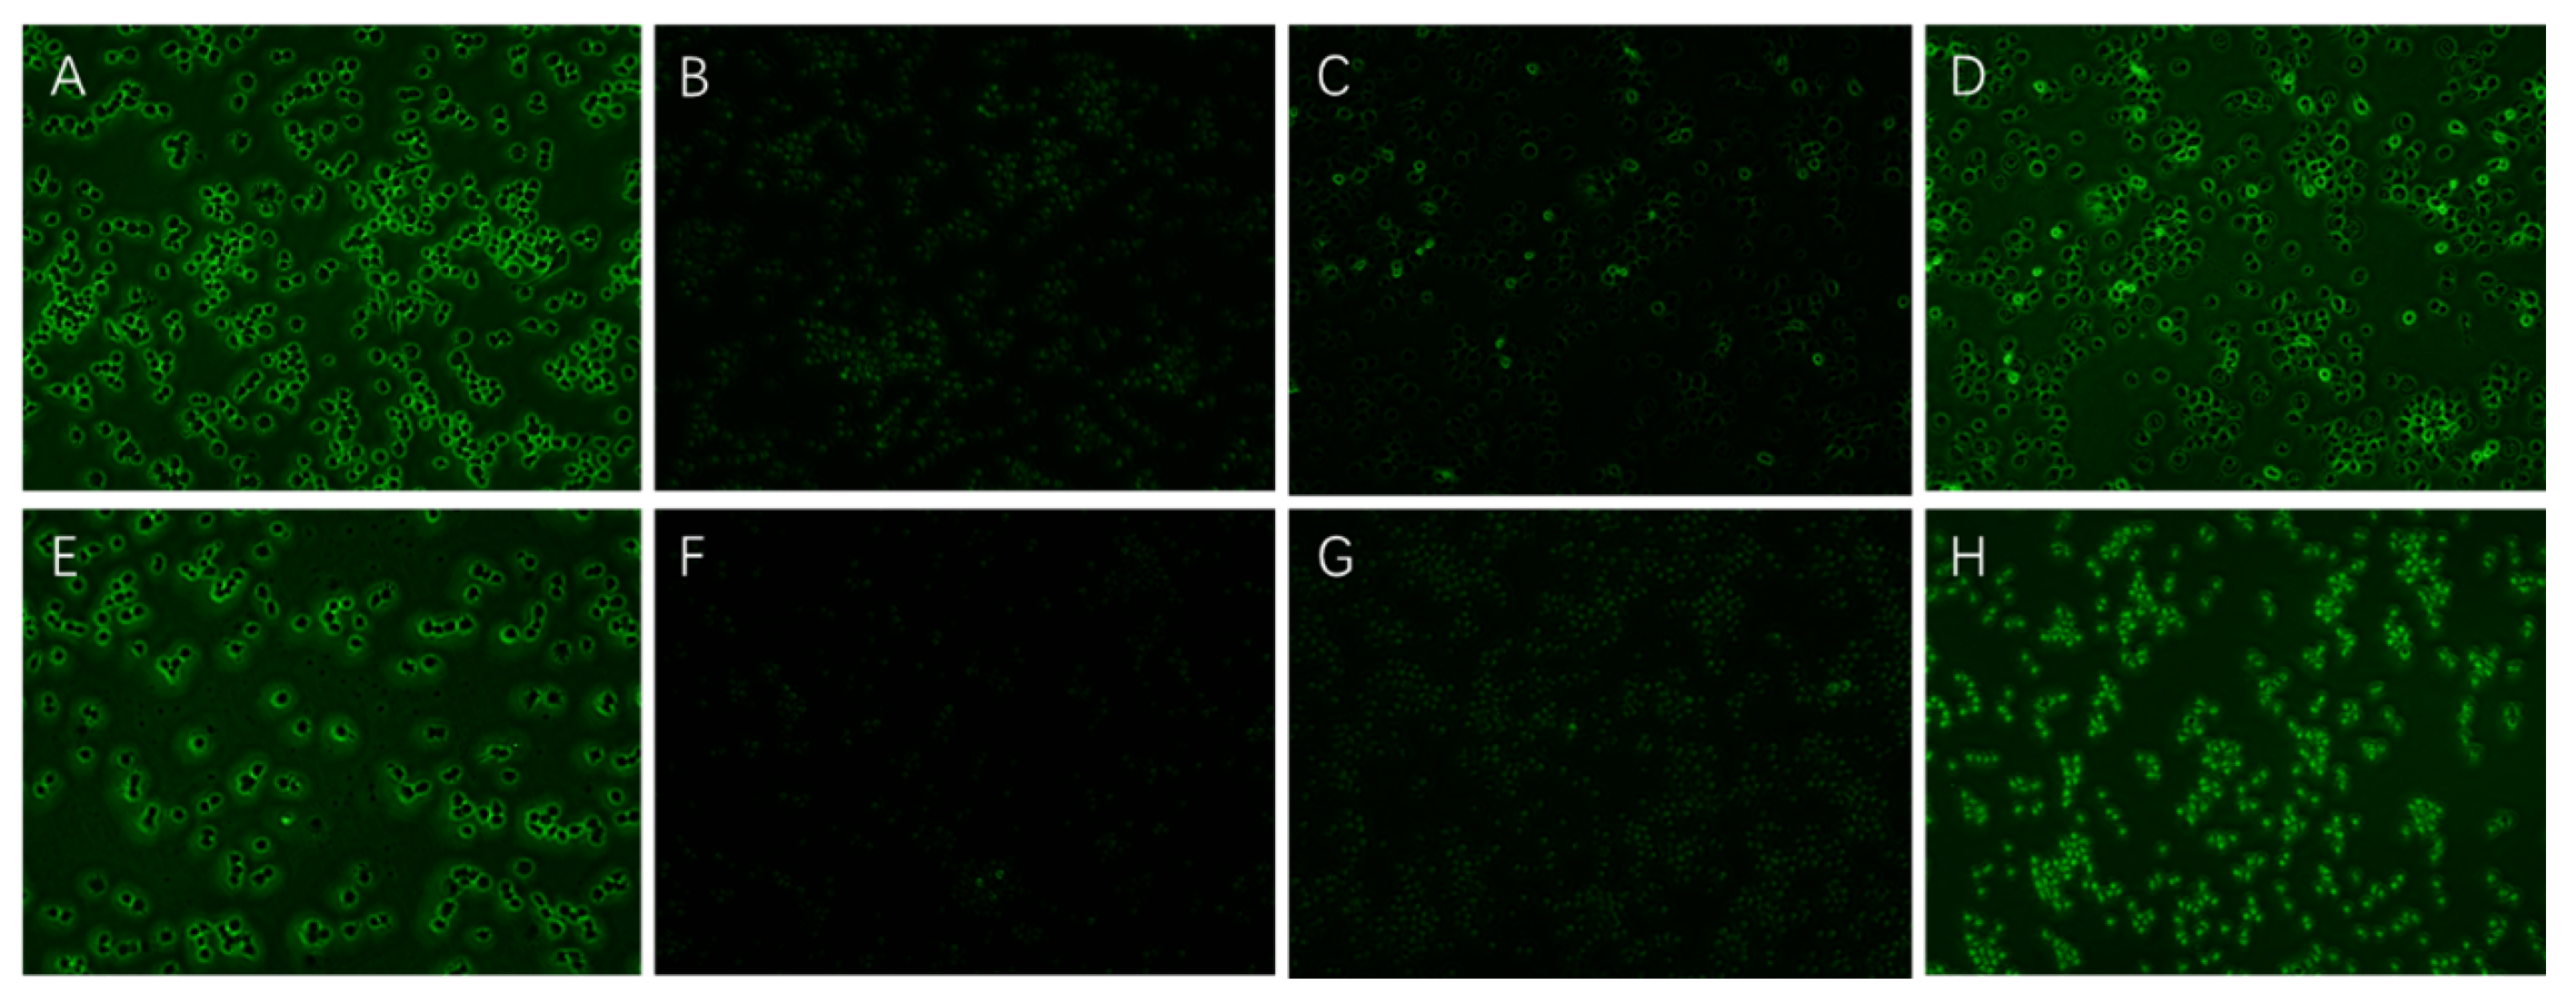
Fluorescence microscopy was used to determine the fluorescence intensity of the NO probe [38], and the results are shown in Figure 14 and Figure 15. Compared with the CK group, the NO secretion of the group stimulated by Pseudomonas CFS was significantly reduced, indicating that P. fluorescens and P. fragi would have the effect of decreasing the NO secretion ability of RAW264.7 cells. Both EPS-L and EPS-H groups were able to significantly promote the secretion of NO by RAW264.7 cells, and it was dose-dependent. However, after P. fragi stimulation by 0.02% EPS, the amount of NO increased without significance, which indicated that the 0.02% EPS was not enough to stimulate the cells to produce more NO.

3.3.4. Effects of EPS on ROS Secretion of Inflammatory RAW264.7 Cells

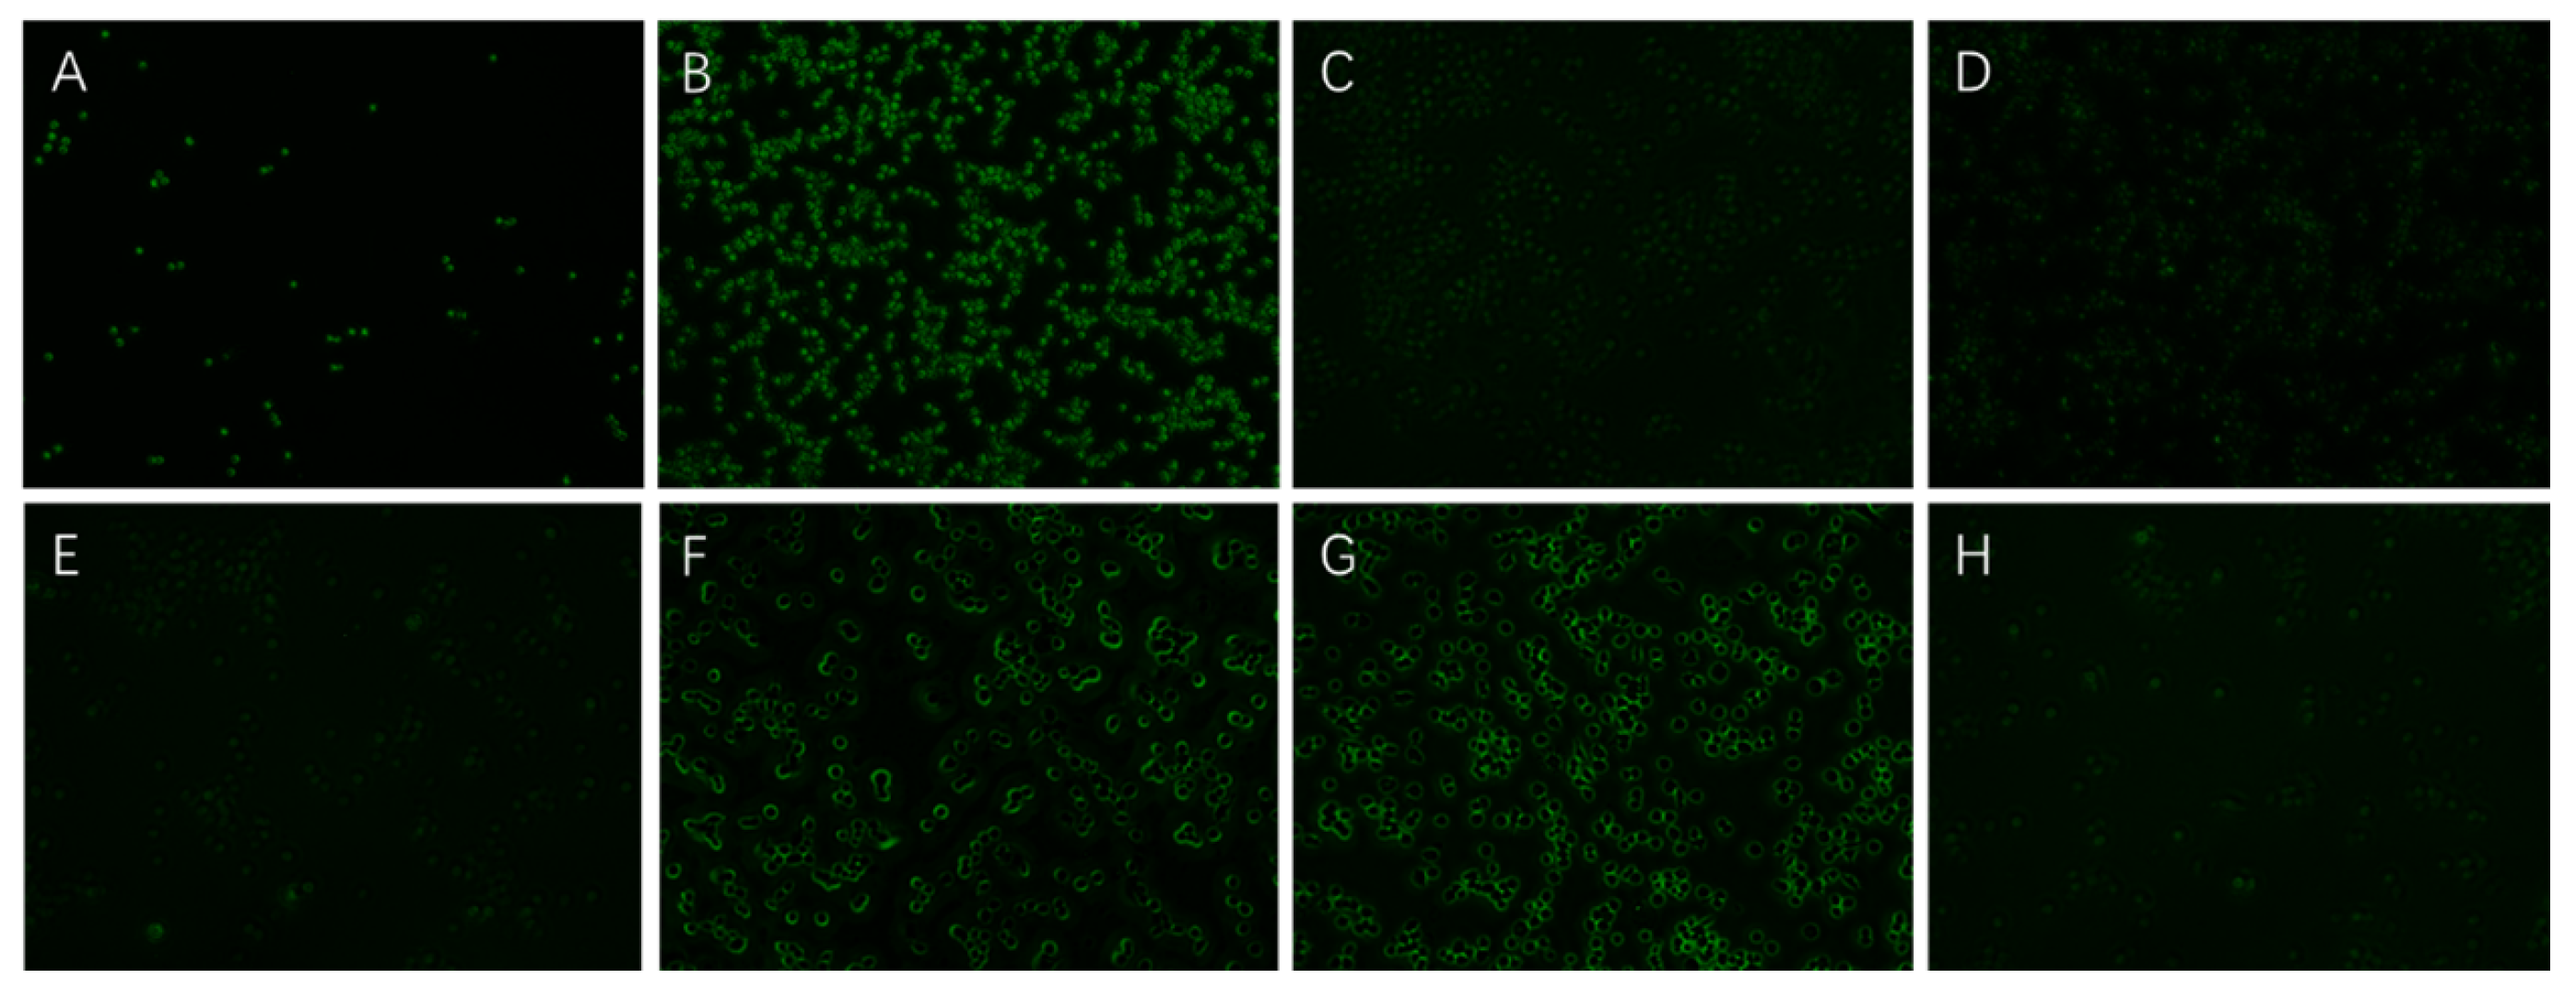
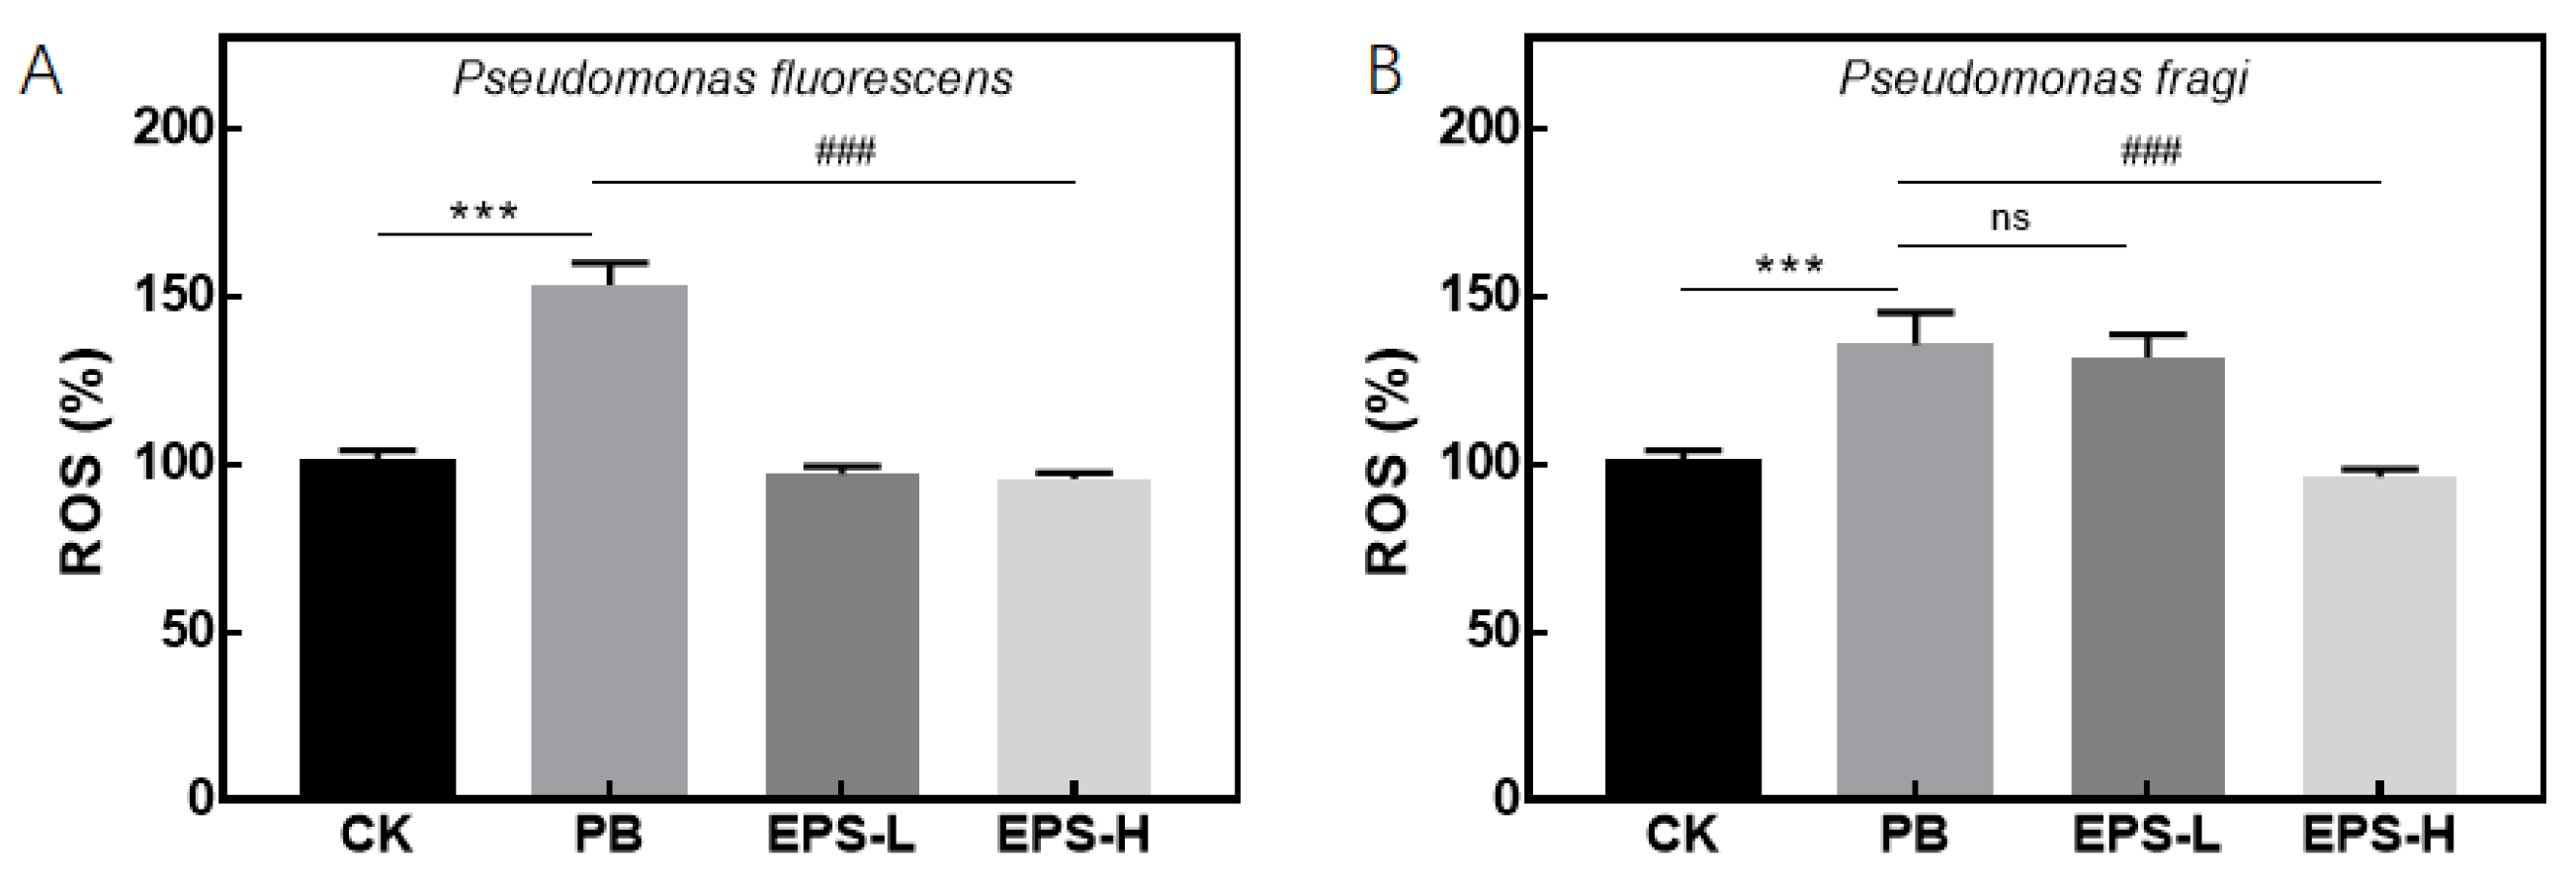
After the fluorescence microscopy observation, the amount of ROS produced by RAW264.7 cells after different concentrations of EPS treatment stimulated by Pseudomonas CFS was determined using an inverted fluorescence microscope. As shown in Figure 16 and Figure 17, the amount of ROS secreted by RAW264.7 cells after stimulation by Pseudomonas CFS obviously increased, which proved that the oxidative damage of cells was increased by the stimulation of Pseudomonas CFS. After the treatment with the EPS, the amount of ROS secreted by RAW264.7 cells decreased significantly, indicating that the EPS could reduce the oxidative damage of cells and had a certain antioxidant effect in the cell. However, after stimulation with P. fragi, the amount of ROS decreased after the 0.02% EPS treatment without significance.

3.3.5. Effects of EPS on Cytokines Secretion of Inflammatory RAW264.7 Cells

The cytokines secreted by RAW264.7 cells after stimulation by Pseudomonas fluorescence and P. fragi were measured to evaluate the role of the EPS in immunoregulation.
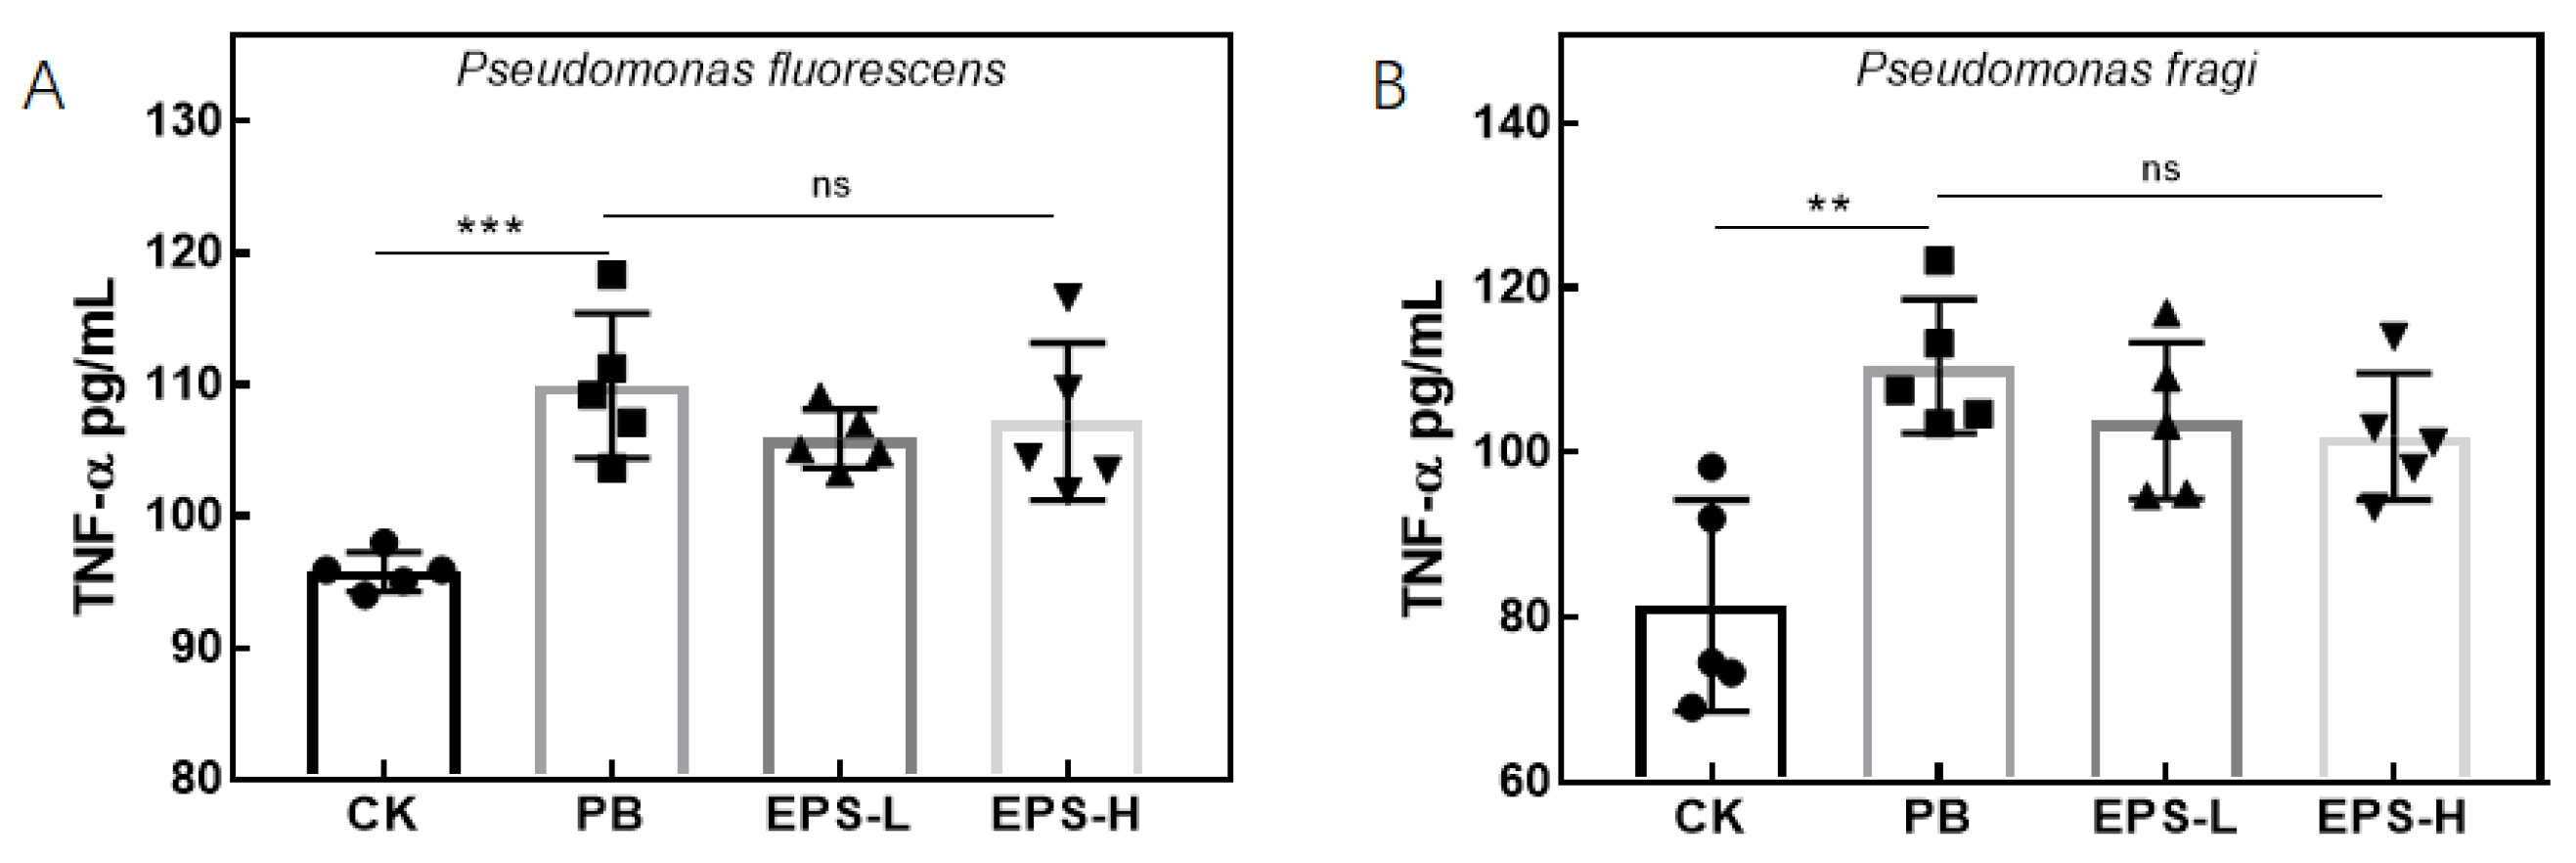
TNF- α is an important immunoregulation factor that mediates the immune response to bacterial infection [39]. Figure 18 shows the effect of different concentrations of EPS on the secretion of TNF- α by RAW264.7 cells stimulated by P. fluorescens and P. fragi. It can be seen that RAW264.7 cells stimulated by Pseudomonas secreted significantly higher amounts of TNF- α compared with the CK group; thus, P. fluorescens and P. fragi stimulated the RAW264.7 cells to produce more TNF- α . RAW264.7 cells stimulated by P. fluorescens and P. fragi with added EPS decreased in TNF- α , but the decreasing trend was not obvious.
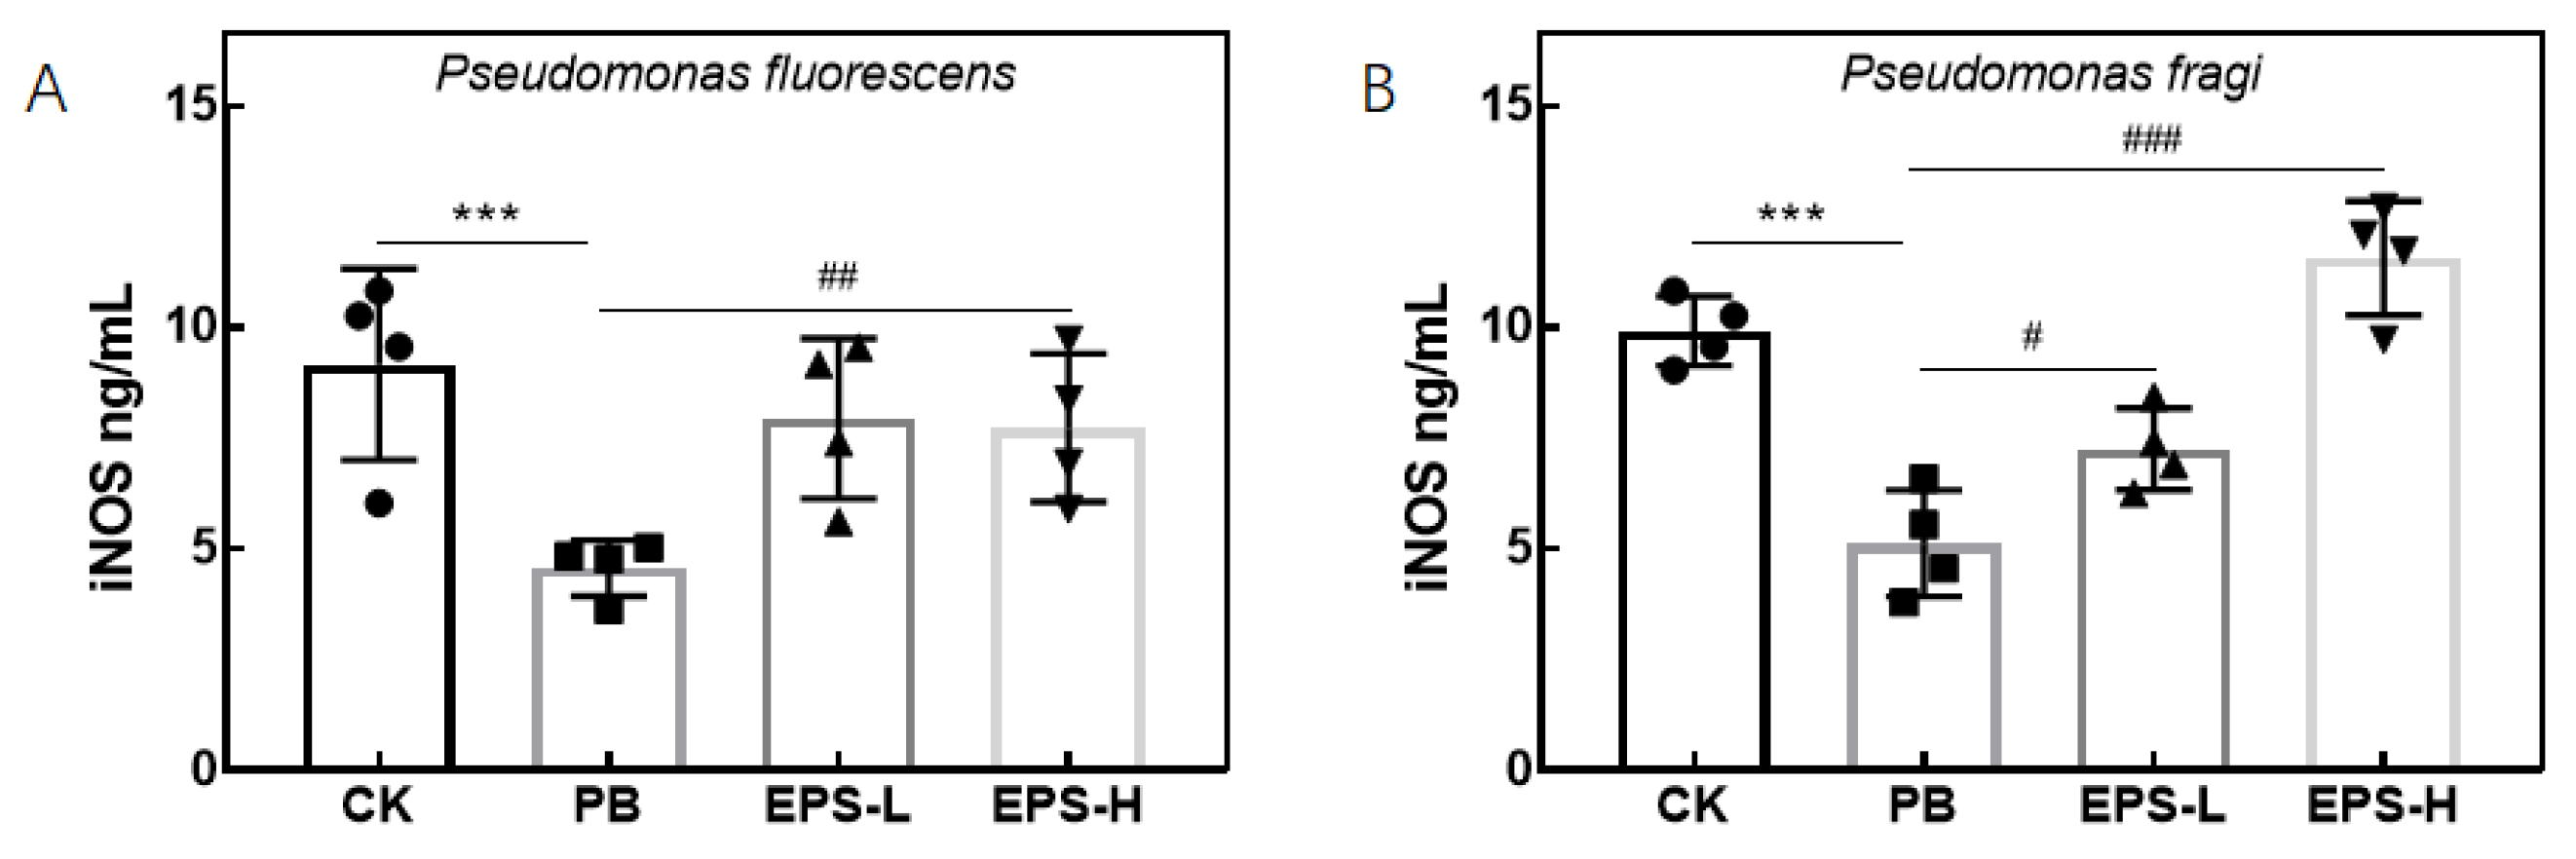
Figure 19 shows the effects of different concentrations of EPS on the iNOS of RAW264.7 cells stimulated with Pseudomonas. There was a significant decrease in the amount of iNOS secreted by RAW264.7 cells stimulated with P. fluorescens and P. fragi as compared to the CK group. Thus, the stimulated cells had reduced metabolic vitality and were no longer able to carry out immunoregulation through self-regulation of the iNOS/NO pathway. Also, the result confirmed that the reason for the decrease in NO production in the previous section may be due to the decrease in iNOS secretion. After the EPS treatment, the secretion of iNOS increased significantly.
Figure 20 shows the effect of different concentrations of EPS on the secretion of IL-6 by RAW264.7 cells stimulated by P. fluorescens and P. fragi. One can find that the secretion of IL-6 by RAW264.7 cells stimulated by Pseudomonas increased significantly compared with the CK group. Thus, Pseudomonas CFS led to an increase in the level of cellular IL-6, which had an effect on the immune system of RAW264.7 cells. The EPS-L group stimulated by P. fluorescens showed an increase in IL-6 without significance, while the EPS-H group showed a significant decrease in IL-6 secretion.
Figure 21 shows the effect of different concentrations of EPS on IL-1 β in RAW264.7 cells stimulated by P. fluorescens and P. fragi, where the secretion of IL-1 β in RAW264.7 cells increased significantly as compared to the CK group. Thus, P. fluorescens and P. fragi CFS led to the release of IL-1 β , resulting in the disruption of the immune system.

3.3.6. Effects of EPS on mRNA Expression of Inflammatory RAW264.7 Cells

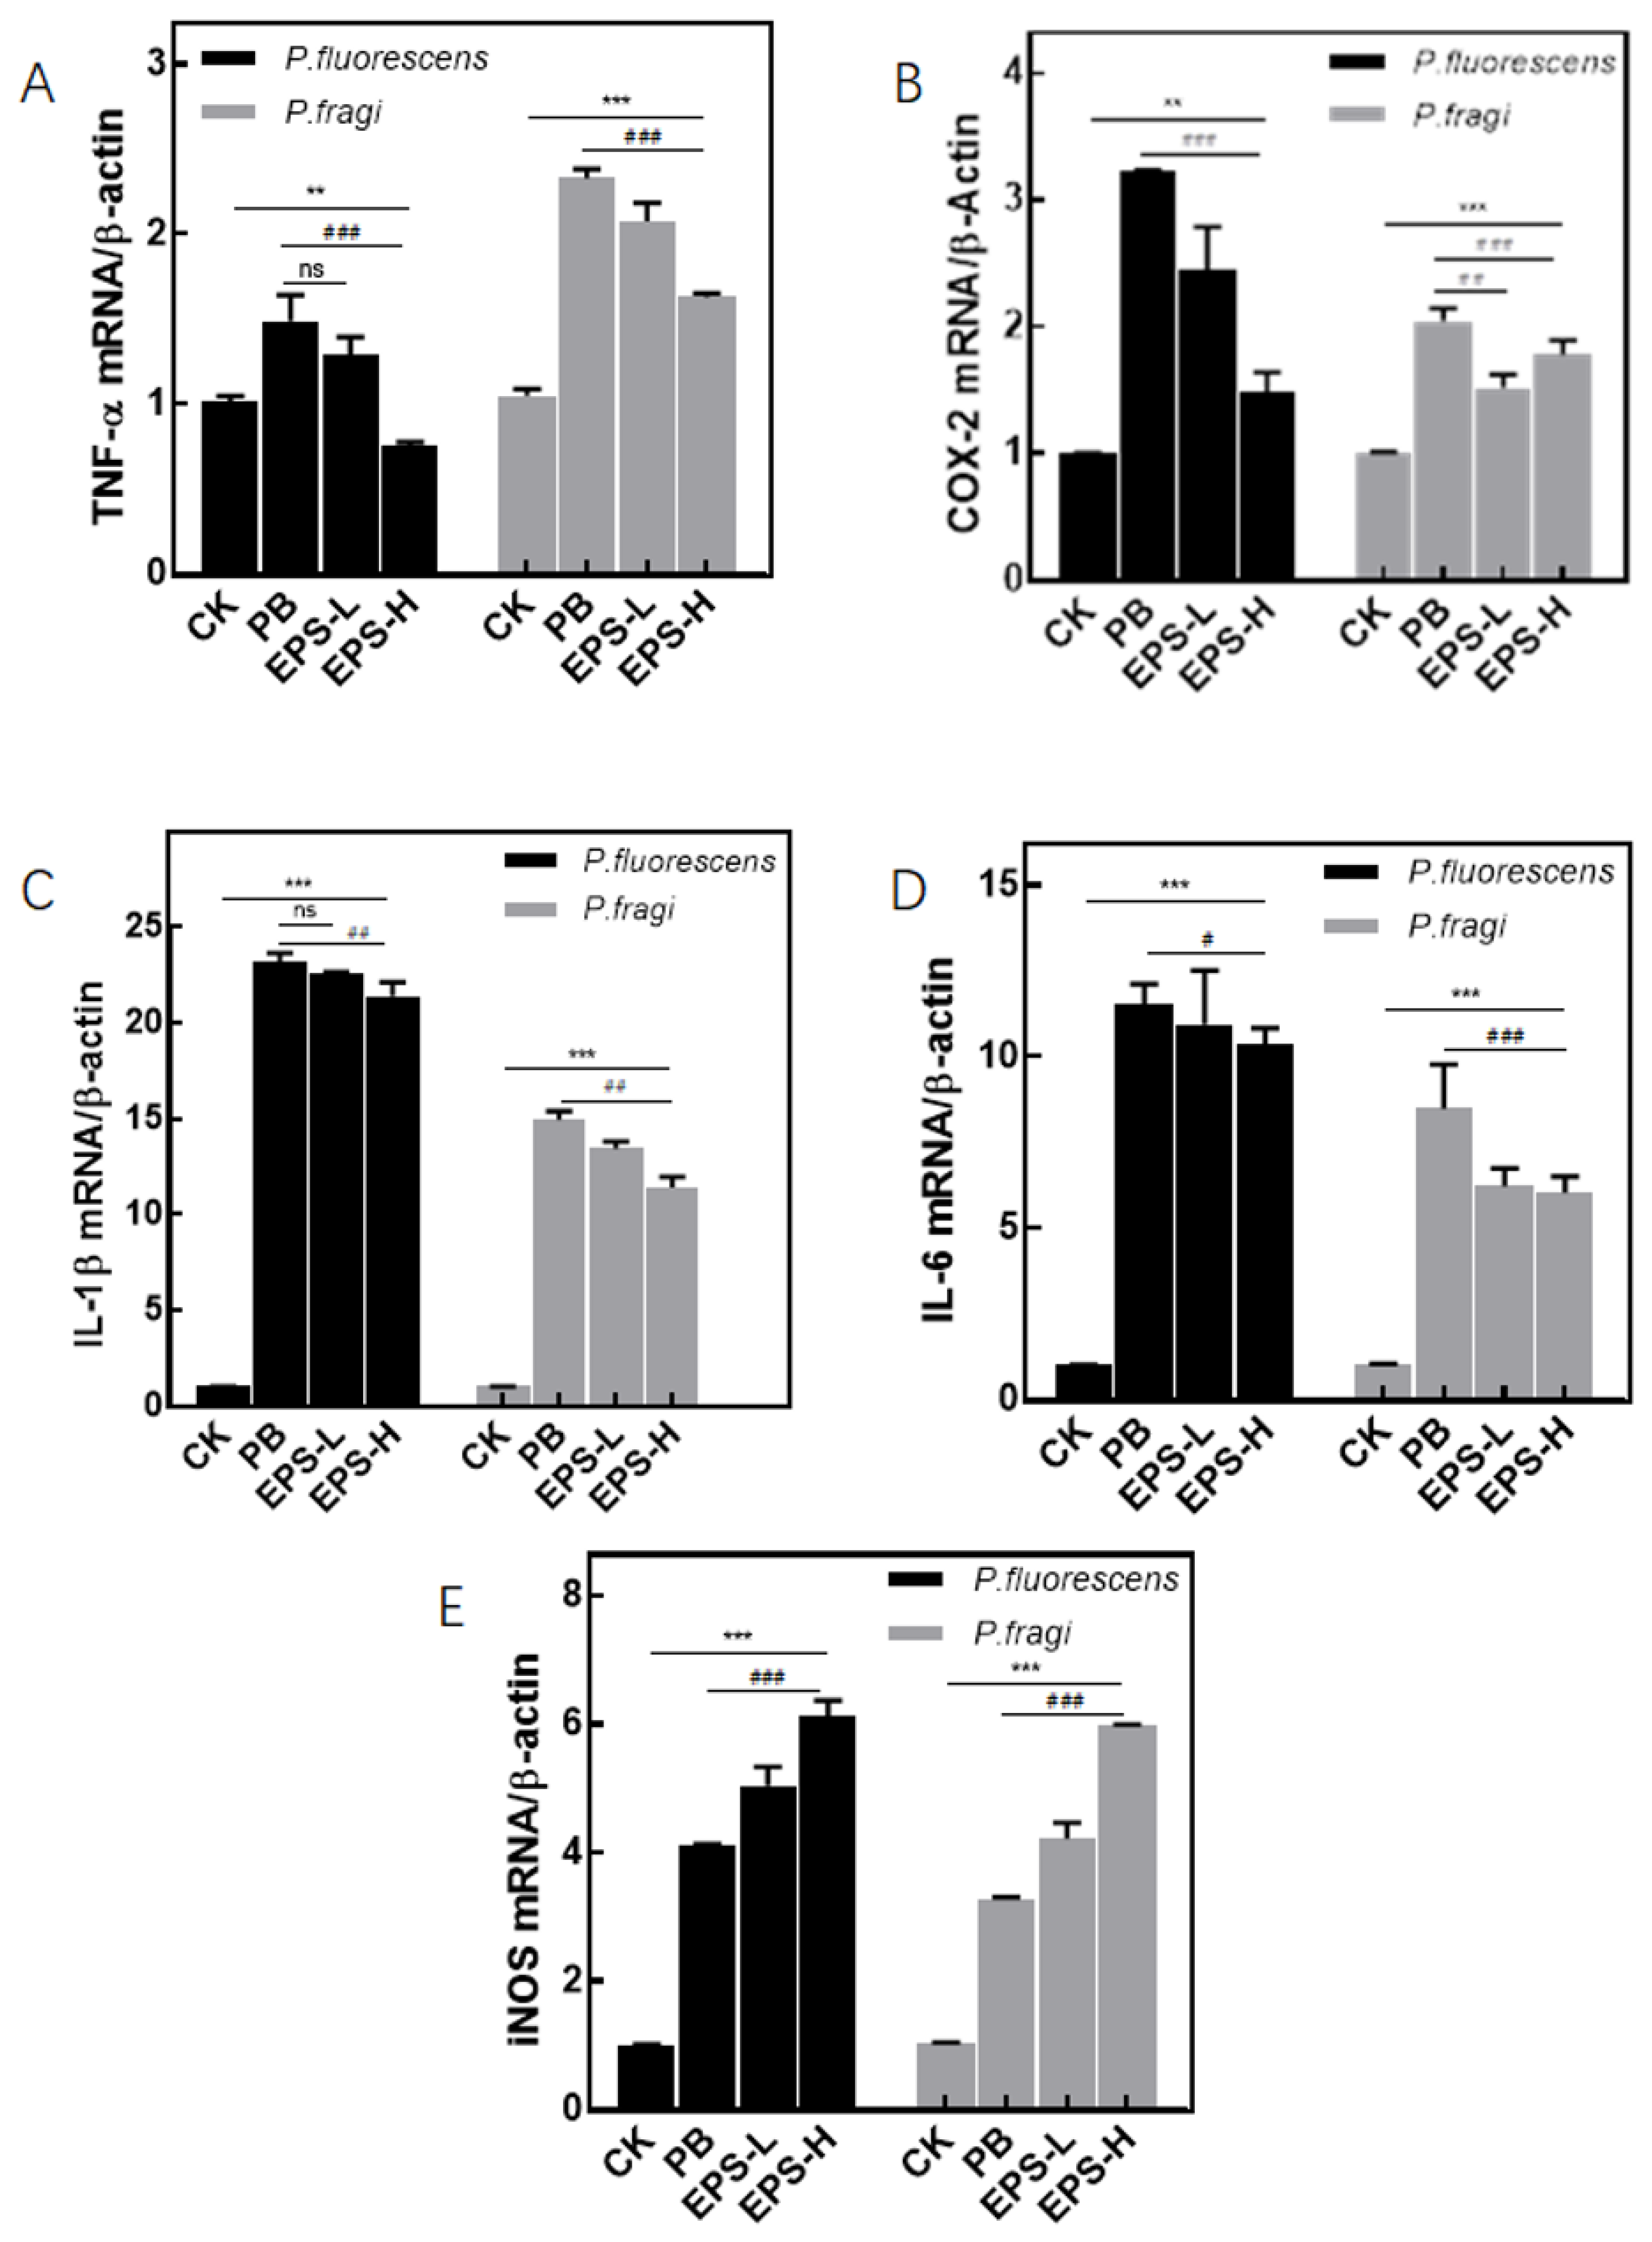
To further discuss the immunoregulation effects of the EPS on RAW264.7 cells stimulated by Pseudomonas CFS, the mRNA expression of TNF- α , COX-2 (cyclooxygenase-2), IL-1 β , IL-6, and iNOS, which are involved in immunoregulation, was measured in this study.
Figure 22A shows the effect of different concentrations of EPS on the mRNA expression of TNF- α in RAW264.7 cells stimulated by P. fluorescens and P. fragi CFS. The expression of TNF- α in stimulated RAW264.7 cells increased significantly as compared to the CK group, while it decreased significantly after the treatment of different concentrations of EPS. Thus, the EPS can play an immunoregulation role on cells by regulating the expression of TNF- α to reduce the secretion of TNF- α . Figure 22B shows the mRNA expression of COX-2 in RAW264.7 cells stimulated by the CFS of P. fluorescens and P. fragi at different concentrations of EPS. The expression of COX-2 in stimulated RAW264.7 cells increased significantly as compared to the CK group, while the expression decreased significantly after treatment with different concentrations of EPS.
Figure 22C shows the effect of different concentrations of EPS on the mRNA expression of IL-1 β in RAW264.7 cells stimulated by the CFS of P. fluorescens and P. fragi. It can be seen that the expression of IL-1 β in treated RAW264.7 cells increased significantly as compared to the CK group, while it decreased significantly after the treatment with different concentrations of EPS. Thus, the EPS can play an immunoregulation role on cells by regulating the expression of IL-1 β to reduce the secretion of IL-1 β . Figure 22D shows the effect of different concentrations of EPS on the mRNA expression of IL-6 in RAW264.7 cells stimulated by P. fluorescens and P. fragi. The expression of IL-6 in treated RAW264.7 cells increased significantly as compared to the CK group, while the expression decreased significantly after the treatment with different concentrations of EPS.
Figure 22E shows the mRNA expression of iNOS in RAW264.7 cells stimulated by the CFS of P. fluorescens and P. fragi at various concentrations of EPS. It can be seen that the expression of iNOS in stimulated RAW264.7 cells significantly decreased as compared to the CK group, while the expression significantly increased with the EPS treatment at different concentrations.

4. Discussion

Non-single polysaccharides may potentially generate a more diverse range of functional activities. Specifically, polysaccharides isolated by [40] from Lactobacillus in Chinese sauerkraut were measured using HPLC, which revealed the presence of four distinct absorption peaks. The molecular weights of the three main heteropolysaccharides were 6.4 × 10⁵ Da, 2.0 × 10⁵ Da, and 1.4 × 10⁴ Da, respectively, while there also existed a little polysaccharide with the possible properties of antioxidation and anti-inflammation. The molecular weight of the EPS produced by Del. algida is quite significant in finding relations between its composition and functional activity. Although the components of the EPS are influenced by different types of bacteria and growth environments, the molecular weight of the EPS is commonly within the range of 1.0 × 10 4 Da to 6.0 × 10 6 Da [41,42]. Therefore, the in-depth exploration of the EPS produced by Del. algida in this study not only provides a direction for the isolation of new types of active polysaccharides but also likely offers references for exploring the physiological activities and functional effects of polysaccharide-like substances.
The diversity of monosaccharide components commonly results in polysaccharides having different physical/chemical properties and physiological activities [18,19,43]. In recent studies, Ref. [44] found that the polysaccharide produced by Lactobacillus plantarum KX041, which was composed of rhamnose and glucose, had antioxidant effects. Also, Ref. [40] found that the polysaccharide EPS-NA produced by Lactobacillus coryneformis NA-3 was composed of α -rhamnose, α -mannose, α -galactose, and α -glucose, which had the ability to scavenge hydroxyl and superoxide radicals and to inhibit the formation and dispersion of Bacillus cereus and Salmonella typhimurium biofilms; Ref. [45] found that the monosaccharide component of the EPS produced by Lactobacillus reuteri had percentage relations following galactose > rhamnose > glucose, where the percentage of monosaccharide component was related to the anti-inflammatory activity of the EPS. The galactose content of the EPS enhanced its anti-inflammatory effect on macrophages, while the existence of rhamnose and the ratio of rhamnose to glucose components may be important indicators that polysaccharides have antioxidant and anti-inflammatory properties.
The EPS extracted from the Del. algida CFS exhibited a microstructure extremely similar to that of the EPS from Leuconostoc lactis L2 [46] and Lactobacillus plantarum KF5 [43], as reported in published studies, though not identical. The main reason for these differences is that psychrophilic bacteria have a more active metabolism. Although Del. algida, Leuconostoc lactis L2, and Lactobacillus plantarum KF5 all belong to the Lactobacillus genus, the differences in strains lead to variations in metabolic pathways and products. Furthermore, different morphologies can greatly influence functionality. For example, spherical EPSs are more suitable as adsorbents, sheetlike EPSs can be used as plasticizers, and fibrous EPSs have potential as stabilizers and thickeners.
The antioxidant properties of the EPS produced by Del. algida are very significant for living organisms [36,37,47]. The EPS produced by Del. algida had different scavenging activities for various free radicals, indicating that it did have a certain extent of antioxidant properties, but it was quite small as compared to the ascorbic acid under the same concentration. The antioxidant ability of ascorbic acid was 10 times that of the EPS, which may be due to the existing enolized hydroxyl groups of high reducing properties within ascorbic acid instead of ordinary hydroxyl groups [48]. Although the antioxidant activity of the EPS produced by Del. algida was not completely superior to that of ascorbic acid, it can still be utilized as one of the natural sources of safe antioxidants.
In this paper, the immunoregulation activities of the EPS produced by Del. algida were evaluated by the anti-inflammatory abilities of a widely utilized the RAW264.7 cell inflammation model, which was stimulated by cold-adapted pathogenic Pseudomonas, including P. fluorescens and P. fragi. Pseudomonas is a small gram-negative bacterium that can secrete a number of different toxins [49,50]. Pseudomonas exotoxin (PE) binds to cell surface receptors, leading to the ingestion of the toxin into the cell and inhibiting protein synthesis [50,51]. For humans, PE is an exogenous protein expressed by Pseudomonas and is highly immunogenic. Therefore, it is necessary to examine relevant inflammatory factors to understand the regulatory mechanisms of the immunogenicity of Pseudomonas.
NO is a key factor in immunoregulation [52], not only as a virulence factor to kill invading bacteria or viruses and other pathogens but also as an important signaling molecule to guide the apoptosis of cancer cells. Therefore, NO plays an important role in the immunoregulation of the body, and it is also an important indicator of whether the cells are undergoing immunoregulation [53]. From the above results, it is suggested that EPS can stimulate the secretion of NO by RAW264.7 cells, improve the immunoregulation activity of macrophages, and increase the sensitivity of the macrophage immune response. Reactive oxygen species (ROS) are important indicators of cellular oxidative damage [54]. Studies have shown that an increase in ROS levels within the body can lead to excessive oxidative stress, which induces and triggers inflammation, resulting in the production of more free radicals. This causes further oxidative stress, creating a vicious cycle that leads to irreversible damage to the body [55]. The 0.02% EPS could not reduce the secretion of ROS by RAW264.7 cells and alleviate the oxidative damage of cells [56]. Macrophages play the most important role in immunity as a front line of defense for the immune system since they have the ability to remove foreign pathogens, phagocytose certain cellular debris and detritus, and release immune factors for the immune response [57]. RAW264.7, as a mouse monocyte-macrophage, can simulate the front-line immune defense by releasing cytokines in response to stimuli from invading external substances [58].
Based on the above observation, the EPS reduces oxidative damage to the cells by the release of NO to decrease cellular inflammation, which ultimately leads to a decrease in the pro-inflammatory factor TNF- α in the RAW264.7 cells. iNOS, i.e., inducible nitric oxide synthase, not only assists RAW264.7 cells in fighting against foreign pathogens in immunoregulation but is also an important messenger molecule, which is activated and plays a role in inducing the production of large amounts of NO after cells are stimulated or damaged [59]. The EPS may increase the sensitivity of RAW264.7 cells to immunoregulation through the iNOS/NO pathway and enhance the ability of RAW264.7 cells to respond to immunity; thus, it can regulate the immune activity of RAW264.7 cells [60]. IL-6 is also an important factor in immunoregulation, which is a key part of the body acting on a variety of cells. It not only participates in the inflammatory response but also assumes an important role in information transmission [61]. IL-6 can be activated by TNF- α , and the increase in IL-6 content is interrelated with inflammation, infection, and even the occurrence of tumors in the organism [39]. The 0.02% EPS was not able to reduce the amount of IL-6 secreted by RAW264.7 cells and regulate the immune activity. IL-1 β is a pro-inflammatory factor that not only promotes inflammation but also induces the release of other pro-inflammatory factors, yielding the aggravation of the inflammatory process in the body [61,62]. The secretion of IL-1 β decreased significantly after the addition of EPS, which indicated that the EPS could inhibit the secretion of IL-1 β to regulate the immune system.
COX-2 is an inducible enzyme with quite low expression in the normal state [39,58,59]. However, when the body is stimulated by inflammation, the increase in its expression in the inflammatory cells means that the body cells produce tissue damage [61]. The EPS could act as an immunomodulator by down-regulating the expression of COX-2. The EPS could play an immunoregulation role in RAW264.7 cells by regulating the expression of IL-6 to reduce the secretion of IL-6.
As an inducible nitric oxide synthase, the mRNA expression of iNOS is crucial for interpreting whether an EPS increases NO secretion for immunoregulation through the iNOS/NO pathway [62,63,64]. Therefore, this study measured the expression level of iNOS to determine whether the increase in cellular NO secretion was related to the iNOS/NO pathway, thereby further analyzing and predicting the possible mechanisms through which EPS exerts its anti-inflammatory effects. The EPS increased the iNOS expression by up-regulating the expression of iNOS, regulating the iNOS/NO pathway, and promoting the secretion of NO to play a role in immunoregulation.
Overall, the secretion of TNF- α , IL-6, and IL-1 β of RAW264.7 cells stimulated by P. fluorescens and P. fragi CFS increased, which indicated that P. fluorescens and P. fragi would lead to the secretion of more pro-inflammatory factors. The authors of [65] verified that the immunomodulatory effects of the EPS from flocculating bacteria were derived from cytokines such as TNF- α secreted by the mouse intestine. The secretion of iNOS was reduced, which would affect the ability of cells to secrete NO, as well as lead to the disruption of the immune system and the generation of inflammatory reactions. After EPS intervention, the secretion of TNF- α , IL-6, and IL-1 β in RAW264.7 cells was reduced, while it was not significant for TNF- α . Hence, the EPS inhibited the secretion of inflammatory factors by RAW264.7 cells after stimulation by P. fluorescens and P. fragi, increased the secretion of iNOS, and promoted the secretion of NO, which further played a role in immunoregulation.

5. Conclusions

This study conducted a preliminary characterization of the EPS produced by a newly discovered psychrophilic Lactobacillus, namely, Del. algida, and investigated its antioxidant and immunomodulatory activities. The current results indicated that the EPS of Del. algida had a complex structure with a large molecular weight, consisting of nine monosaccharides linked by α - and β -glycosidic bonds, and exhibited an irregular microscopic appearance. It showed strong antioxidant capabilities, effectively scavenging free radicals in vitro, including DPPH, ABTS+, hydroxyl radicals, and superoxide anions. Additionally, the EPS exerted immunomodulatory effects by regulating the NO pathway, reducing oxidative damage, and decreasing the secretion of inflammatory factors, thereby alleviating inflammation in cells stimulated by psychrophilic pathogens (such as P. fluorescens and P. fragi). In conclusion, the EPS of Del. algida holds potential as an antioxidant and immunomodulator, providing valuable insights for the application of probiotic fermentation products.

Author Contributions

Conceptualization, Y.S. and T.W.; methodology, Y.S. and T.W.; software, Y.S. and T.M.; validation, Y.S. and J.G.; formal analysis, Y.S., T.M. and Z.W.; investigation, Y.S.; resources, J.S.; data curation, J.S. and Z.F.; writing—original draft preparation, Y.S.; writing—review and editing, Y.S.; visualization, Y.S.; supervision, J.S.; project administration, J.S.; funding acquisition, J.S. All authors have read and agreed to the published version of the manuscript.

Funding

This work was supported by Heilongjiang Touyan Team under Grant HITTY-20190034.

Institutional Review Board Statement

Not applicable.

Informed Consent Statement

Not applicable.

Data Availability Statement

The raw data supporting the conclusions of this article will be made available by the authors on request.

Conflicts of Interest

The authors declare no conflicts of interest.

References

  1. Mouafo, H.T.; Sokamte, A.T.; Manet, L.; Mbarga, A.J.M.; Nadezdha, S.; Devappa, S.; Mbawala, A. Biofilm inhibition, antibacterial and antiadhesive properties of a novel biosurfactant from Lactobacillus paracasei N2 against multi-antibiotics-resistant pathogens isolated from braised fish. Fermentation 2023, 9, 646. [Google Scholar] [CrossRef]
  2. Yang, R.; Li, J.; Jiang, C.; Shi, J. Preventive and therapeutic effects of an exopolysaccharide produced by Lacticaseibacillus rhamnosus on alcoholic gastric ulcers. Int. J. Biol. Macromol. 2023, 235, 123845. [Google Scholar] [CrossRef] [PubMed]
  3. Kang, H.; Hwang, J.W.; Lee, S.G. Bacillus subtilis Fermentation Augments the Anti-Inflammatory and Skin Moisture Improvement Activities of Tetragonia tetragonoides through the Upregulation of Antioxidant Components. Fermentation 2023, 9, 800. [Google Scholar] [CrossRef]
  4. Kwon, M.; Lee, J.; Park, S.; Kwon, O.H.; Seo, J.; Roh, S. Exopolysaccharide isolated from Lactobacillus plantarum L-14 has anti-inflammatory effects via the Toll-like receptor 4 pathway in LPS-induced RAW 264.7 cells. Int. J. Mol. Sci. 2020, 21, 9283. [Google Scholar] [CrossRef]
  5. Noda, M.; Danshiitsoodol, N.; Sakaguchi, T.; Kanno, K.; Sugiyama, M. Exopolysaccharide produced by plant-derived Lactobacillus plantarum SN35N exhibits antiviral activity. Biol. Pharm. Bull. 2021, 44, 1886–1890. [Google Scholar] [CrossRef]
  6. Kavitake, D.; Devi, P.B.; Delattre, C.; Reddy, G.B.; Shetty, P.H. Exopolysaccharides produced by Enterococcus genus—An overview. Int. J. Biol. Macromol. 2023, 226, 111–120. [Google Scholar] [CrossRef]
  7. Kanmani, P.; Albarracin, L.; Kobayashi, H.; Iida, H.; Komatsu, R.; Kober, A.H.; Ikeda-Ohtsubo, W.; Suda, Y.; Aso, H.; Makino, S.; et al. Exopolysaccharides from Lactobacillus delbrueckii OLL1073R-1 modulate innate antiviral immune response in porcine intestinal epithelial cells. Mol. Immunol. 2018, 93, 253–265. [Google Scholar] [CrossRef]
  8. Kim, K.; Lee, G.; Thanh, H.D.; Kim, J.H.; Konkit, M.; Yoon, S.; Park, M.; Yang, S.; Park, E.; Kim, W. Exopolysaccharide from Lactobacillus plantarum LRCC5310 offers protection against rotavirus-induced diarrhea and regulates inflammatory response. J. Dairy Sci. 2018, 101, 5702–5712. [Google Scholar] [CrossRef]
  9. Zaghloul, E.H.; Ibrahim, M.I. Production and characterization of exopolysaccharide from newly isolated marine probiotic Lactiplantibacillus plantarum EI6 with in vitro wound healing activity. Front. Microbiol. 2022, 13, 903363. [Google Scholar] [CrossRef]
  10. Huang, Y.Y.; Wu, J.M.; Wu, W.T.; Lin, J.W.; Liang, Y.T.; Hong, Z.Z.; Jia, X.Z.; Liu, D.M. Structural, antioxidant, and immunomodulatory activities of an acidic exopolysaccharide from Lactiplantibacillus plantarum DMDL 9010. Front. Nutr. 2022, 9, 1073071. [Google Scholar] [CrossRef]
  11. Tyutkov, N.; Zhernyakova, A.; Birchenko, A.; Eminova, E.; Nadtochii, L.; Baranenko, D. Probiotics viability in frozen food products. Food Biosci. 2022, 50, 101996. [Google Scholar] [CrossRef]
  12. López-Ortega, M.A.; Chavarría-Hernández, N.; del Rocío López-Cuellar, M.; Rodríguez-Hernández, A.I. A review of extracellular polysaccharides from extreme niches: An emerging natural source for the biotechnology. From the adverse to diverse! Int. J. Biol. Macromol. 2021, 177, 559–577. [Google Scholar] [CrossRef]
  13. Kumar, A.; Mukhia, S.; Kumar, R. Production, characterisation, and application of exopolysaccharide extracted from a glacier bacterium Mucilaginibacter sp. ERMR7: 07. Process Biochem. 2022, 113, 27–36. [Google Scholar] [CrossRef]
  14. Zheng, J.; Wittouck, S.; Salvetti, E.; Franz, C.M.; Harris, H.M.; Mattarelli, P.; O’toole, P.W.; Pot, B.; Vandamme, P.; Walter, J.; et al. A taxonomic note on the genus Lactobacillus: Description of 23 novel genera, emended description of the genus Lactobacillus Beijerinck 1901, and union of Lactobacillaceae and Leuconostocaceae. Int. J. Syst. Evol. Microbiol. 2020, 70, 2782–2858. [Google Scholar] [CrossRef]
  15. Kato, Y.; Sakala, R.; Hayashidani, H.; Kiuchi, A.; Kaneuchi, C.; Ogawa, M. Lactobacillus algidus sp. nov., a psychrophilic lactic acid bacterium isolated from vacuum-packaged refrigerated beef. Int. J. Syst. Evol. Microbiol. 2000, 50, 1143–1149. [Google Scholar] [CrossRef]
  16. Säde, E.; Johansson, P.; Heinonen, T.; Hultman, J.; Björkroth, J. Growth and metabolic characteristics of fastidious meat-derived Lactobacillus algidus strains. Int. J. Food Microbiol. 2020, 313, 108379. [Google Scholar] [CrossRef] [PubMed]
  17. Sun, Y.; Liu, S.; Zhan, Z.; Wei, T.; Ma, T.; Sun, J.; Song, J. Antibacterial Mechanism of Dellaglioa algida against Pseudomonas fluorescens and Pseudomonas fragi. Fermentation 2022, 8, 298. [Google Scholar] [CrossRef]
  18. Zhao, H.; Li, J.; Zhang, J.; Wang, X.; Hao, L.; Jia, L. Purification, in vitro antioxidant and in vivo anti-aging activities of exopolysaccharides by Agrocybe cylindracea. Int. J. Biol. Macromol. 2017, 102, 351–357. [Google Scholar] [CrossRef]
  19. Khalid, N.; Asgher, M.; Hussain, F.; Iqbal, J. Exopolysaccharides production from marine Bacillus strains and their antioxidant and bio-flocculant capacities. Arch. Microbiol. 2022, 204, 250. [Google Scholar] [CrossRef]
  20. McSharry, S.; Koolman, L.; Whyte, P.; Bolton, D. The microbiology of beef from carcass chilling through primal storage to retail steaks. Curr. Res. Food Sci. 2021, 4, 150–162. [Google Scholar] [CrossRef]
  21. Prado Acosta, M.; Valdman, E.; Leite, S.; Battaglini, F.; Ruzal, S.M. Biosorption of copper by Paenibacillus polymyxa cells and their exopolysaccharide. World J. Microbiol. Biotechnol. 2005, 21, 1157–1163. [Google Scholar] [CrossRef]
  22. Krishnamurthy, M.; Uthaya, C.J.; Thangavel, M.; Annadurai, V.; Rajendran, R.; Gurusamy, A. Optimization, compositional analysis, and characterization of exopolysaccharides produced by multi-metal resistant Bacillus cereus KMS3-1. Carbohydr. Polym. 2020, 227, 115369. [Google Scholar] [CrossRef] [PubMed]
  23. Wang, L.; Zhang, B.; Xiao, J.; Huang, Q.; Li, C.; Fu, X. Physicochemical, functional, and biological properties of water-soluble polysaccharides from Rosa roxburghii Tratt fruit. Food Chem. 2018, 249, 127–135. [Google Scholar] [CrossRef] [PubMed]
  24. Salvador, L.D.; Suganuma, T.; Kitahara, K.; Tanoue, H.; Ichiki, M. Monosaccharide composition of sweetpotato fiber and cell wall polysaccharides from sweetpotato, cassava, and potato analyzed by the high-performance anion exchange chromatography with pulsed amperometric detection method. J. Agric. Food Chem. 2000, 48, 3448–3454. [Google Scholar] [CrossRef]
  25. Xu, X.; Peng, Q.; Zhang, Y.; Tian, D.; Zhang, P.; Huang, Y.; Ma, L.; Qiao, Y.; Shi, B. A novel exopolysaccharide produced by Lactobacillus coryniformis NA-3 exhibits antioxidant and biofilm-inhibiting properties in vitro. Food Nutr. Res. 2020, 64. [Google Scholar] [CrossRef]
  26. Kiani, H.S.; Ahmad, W.; Nawaz, S.; Farah, M.A.; Ali, A. Optimized extraction of polyphenols from unconventional edible plants: LC-MS/MS profiling of polyphenols, biological functions, molecular docking, and pharmacokinetics study. Molecules 2023, 28, 6703. [Google Scholar] [CrossRef]
  27. Rumpf, J.; Burger, R.; Schulze, M. Statistical evaluation of DPPH, ABTS, FRAP, and Folin-Ciocalteu assays to assess the antioxidant capacity of lignins. Int. J. Biol. Macromol. 2023, 233, 123470. [Google Scholar] [CrossRef]
  28. Ganesan, P.; Kumar, C.S.; Bhaskar, N. Antioxidant properties of methanol extract and its solvent fractions obtained from selected Indian red seaweeds. Bioresour. Technol. 2008, 99, 2717–2723. [Google Scholar] [CrossRef]
  29. Liu, J.; Luo, J.; Ye, H.; Sun, Y.; Lu, Z.; Zeng, X. Production, characterization and antioxidant activities in vitro of exopolysaccharides from endophytic bacterium Paenibacillus polymyxa EJS-3. Carbohydr. Polym. 2009, 78, 275–281. [Google Scholar] [CrossRef]
  30. Lee, H.J.; Park, J.; Lee, G.J.; Oh, J.M.; Kim, T.i. Polyethylenimine-functionalized cationic barley β-glucan derivatives for macrophage RAW264. 7 cell-targeted gene delivery systems. Carbohydr. Polym. 2019, 226, 115324. [Google Scholar] [CrossRef]
  31. Lu, Y.; Han, S.; Zhang, S.; Wang, K.; Lv, L.; McClements, D.J.; Xiao, H.; Berglund, B.; Yao, M.; Li, L. The role of probiotic exopolysaccharides in adhesion to mucin in different gastrointestinal conditions. Curr. Res. Food Sci. 2022, 5, 581–589. [Google Scholar] [CrossRef] [PubMed]
  32. Puxeu, M.; Andorra, I.; De Lamo-Castellví, S.; Ferrer-Gallego, R. Determination of nutrient supplementation by means of ATR-FTIR spectroscopy during wine fermentation. Fermentation 2019, 5, 58. [Google Scholar] [CrossRef]
  33. Zhou, K.; Zeng, Y.; Yang, M.; Chen, S.; He, L.; Ao, X.; Zou, L.; Liu, S. Production, purification and structural study of an exopolysaccharide from Lactobacillus plantarum BC-25. Carbohydr. Polym. 2016, 144, 205–214. [Google Scholar] [CrossRef]
  34. Liao, Y.; Gao, M.; Wang, Y.; Liu, X.; Zhong, C.; Jia, S. Structural characterization and immunomodulatory activity of exopolysaccharide from Aureobasidium pullulans CGMCC 23063. Carbohydr. Polym. 2022, 288, 119366. [Google Scholar] [CrossRef]
  35. Zhou, Y.; Cui, Y.; Qu, X. Exopolysaccharides of lactic acid bacteria: Structure, bioactivity and associations: A review. Carbohydr. Polym. 2019, 207, 317–332. [Google Scholar] [CrossRef]
  36. Baliyan, S.; Mukherjee, R.; Priyadarshini, A.; Vibhuti, A.; Gupta, A.; Pandey, R.P.; Chang, C.M. Determination of antioxidants by DPPH radical scavenging activity and quantitative phytochemical analysis of Ficus religiosa. Molecules 2022, 27, 1326. [Google Scholar] [CrossRef]
  37. Xie, J.; Zhang, C.; Waite, T.D. Hydroxyl radicals in anodic oxidation systems: Generation, identification and quantification. Water Res. 2022, 217, 118425. [Google Scholar] [CrossRef]
  38. Chang, Z.Q.; Lee, J.S.; Hwang, M.H.; Hong, J.H.; Jung, H.K.; Lee, S.P.; Park, S.C. A novel β-glucan produced by Paenibacillus polymyxa JB115 induces nitric oxide production in RAW264.7 macrophages. J. Vet. Sci. 2009, 10, 165–167. [Google Scholar] [CrossRef]
  39. Saito, Y.; Kuramitsu, Y.; Arai, H.; Kato, Y.; Fujimoto, M.; Ita, M.; Hayatsu, Y.; Shinozaki, F.; Nakamura, K. A signaling pathway by a new synthetic lipid A analog, ONO-4007, in RAW264. 7 cells. Anti-Cancer Drugs 2002, 13, 1069–1075. [Google Scholar] [CrossRef]
  40. Rohman, A.; Riyanto, S.; Sasi, A.M.; Yusof, F.M. The use of FTIR spectroscopy in combination with chemometrics for the authentication of red fruit (Pandanus conoideus Lam) oil from sunflower and palm oils. Food Biosci. 2014, 7, 64–70. [Google Scholar] [CrossRef]
  41. Kaur, N.; Dey, P. Bacterial exopolysaccharides as emerging bioactive macromolecules: From fundamentals to applications. Res. Microbiol. 2023, 174, 104024. [Google Scholar] [CrossRef] [PubMed]
  42. Chen, R.; Xu, J.; Wu, W.; Wen, Y.; Lu, S.; El-Seedi, H.R.; Zhao, C. Structure–immunomodulatory activity relationships of dietary polysaccharides. Curr. Res. Food Sci. 2022, 5, 1330–1341. [Google Scholar] [CrossRef] [PubMed]
  43. Shao, L.; Wu, Z.; Zhang, H.; Chen, W.; Ai, L.; Guo, B. Partial characterization and immunostimulatory activity of exopolysaccharides from Lactobacillus rhamnosus KF5. Carbohydr. Polym. 2014, 107, 51–56. [Google Scholar] [CrossRef]
  44. Zhang, J.; Wang, P.; Tan, C.; Zhao, Y.; Zhu, Y.; Bai, J.; Xiao, X.; Zhang, L.; Teng, D.; Tian, J.; et al. Effects of L. plantarum dy-1 fermentation time on the characteristic structure and antioxidant activity of barley β-glucan in vitro. Curr. Res. Food Sci. 2022, 5, 125–130. [Google Scholar] [CrossRef] [PubMed]
  45. Chen, Y.C.; Wu, Y.J.; Hu, C.Y. Monosaccharide composition influence and immunomodulatory effects of probiotic exopolysaccharides. Int. J. Biol. Macromol. 2019, 133, 575–582. [Google Scholar] [CrossRef]
  46. Zhao, D.; Jiang, J.; Du, R.; Guo, S.; Ping, W.; Ling, H.; Ge, J. Purification and characterization of an exopolysaccharide from Leuconostoc lactis L2. Int. J. Biol. Macromol. 2019, 139, 1224–1231. [Google Scholar] [CrossRef]
  47. Sridhar, K.; Charles, A.L. In vitro antioxidant activity of Kyoho grape extracts in DPPH and ABTS assays: Estimation methods for EC50 using advanced statistical programs. Food Chem. 2019, 275, 41–49. [Google Scholar] [CrossRef]
  48. Takei, T.; Kato, K.; Meguro, A.; Chikazawa, M. Infrared spectra of geminal and novel triple hydroxyl groups on silica surface. Colloids Surf. A Physicochem. Eng. Asp. 1999, 150, 77–84. [Google Scholar] [CrossRef]
  49. Khatri, S.; Sazinas, P.; Strube, M.; Ding, L.; Dubey, S.; Shivay, Y.; Sharma, S.; Jelsbak, L. Pseudomonas is a key player in conferring disease suppressiveness in organic farming. Plant Soil 2023, 1–20. [Google Scholar] [CrossRef]
  50. Housden, N.G.; Webby, M.N.; Lowe, E.D.; El-Baba, T.J.; Kaminska, R.; Redfield, C.; Robinson, C.V.; Kleanthous, C. Toxin import through the antibiotic efflux channel TolC. Nat. Commun. 2021, 12, 4625. [Google Scholar] [CrossRef]
  51. Ahmed, N.; Khalid, H.; Mushtaq, M.; Basha, S.; Rabaan, A.A.; Garout, M.; Halwani, M.A.; Al Mutair, A.; Alhumaid, S.; Al Alawi, Z.; et al. The molecular characterization of virulence determinants and antibiotic resistance patterns in human bacterial uropathogens. Antibiotics 2022, 11, 516. [Google Scholar] [CrossRef] [PubMed]
  52. Wang, L.L.; Sheng Du, R.; Li, J.; Cai, Z.J.; Han, L.; Mao, Y.; Zhou, Y.Y.; Yu, Q.L.; Chen, L.H. The potential mediation of nitric oxide in the activation of mitochondrion-dependent apoptosis and yak meat tenderness during postmortem aging. Food Biosci. 2021, 42, 101131. [Google Scholar] [CrossRef]
  53. Xiu, L.; Sheng, S.; Hu, Z.; Liu, Y.; Li, J.; Zhang, H.; Liang, Y.; Du, R.; Wang, X. Exopolysaccharides from Lactobacillus kiferi as adjuvant enhanced the immuno-protective against Staphylococcus aureus infection. Int. J. Biol. Macromol. 2020, 161, 10–23. [Google Scholar] [CrossRef] [PubMed]
  54. Zhang, X.; Sun, X.; Wu, C.; Chen, J.; Yuan, J.; Pang, Q.; Wang, Z. Heme oxygenase-1 induction by methylene blue protects RAW264.7 cells from hydrogen peroxide-induced injury. Biochem. Pharmacol. 2018, 148, 265–277. [Google Scholar] [CrossRef]
  55. Liang, Y.; Zha, S.; Tentaku, M.; Okimura, T.; Jiang, Z.; Ueno, M.; Hirasaka, K.; Yamaguchi, K.; Oda, T. Suppressive effects of sulfated polysaccharide ascophyllan isolated from Ascophyllum nodosum on the production of NO and ROS in LPS-stimulated RAW264.7 cells. Biosci. Biotechnol. Biochem. 2021, 85, 882–889. [Google Scholar] [CrossRef]
  56. Yamamoto, N.; Shoji, M.; Hoshigami, H.; Watanabe, K.; Takatsuzu, T.; Yasuda, S.; Igoshi, K.; Kinoshita, H. Antioxidant capacity of soymilk yogurt and exopolysaccharides produced by lactic acid bacteria. Biosci. Microbiota Food Health 2019, 38, 97–104. [Google Scholar] [CrossRef]
  57. Yang, F.; Li, X.; Yang, Y.; Ayivi-Tosuh, S.M.; Wang, F.; Li, H.; Wang, G. A polysaccharide isolated from the fruits of Physalis alkekengi L. induces RAW264. 7 macrophages activation via TLR2 and TLR4-mediated MAPK and NF-κB signaling pathways. Int. J. Biol. Macromol. 2019, 140, 895–906. [Google Scholar] [CrossRef]
  58. Yamamoto, M.; Handa, N.; Nakamura, A.; Takahashi, H.; Kuda, T. In vitro antioxidant, anti-glycation, and bile acid-lowering capacity of peanut milk fermented with Lactiplantibacillus plantarum Kinko-SU4. Curr. Res. Food Sci. 2022, 5, 992–997. [Google Scholar] [CrossRef]
  59. Lee, H.A.; Song, B.R.; Kim, H.R.; Kim, J.E.; Yun, W.B.; Park, J.J.; Lee, M.L.; Choi, J.Y.; Lee, H.S.; Hwang, D.Y. Butanol extracts of Asparagus cochinchinensis fermented with Weissella cibaria inhibit iNOS-mediated COX-2 induction pathway and inflammatory cytokines in LPS-stimulated RAW264. 7 macrophage cells. Exp. Ther. Med. 2017, 14, 4986–4994. [Google Scholar] [CrossRef]
  60. Jiang, M.; Wang, H.; Liu, Z.; Lin, L.; Wang, L.; Xie, M.; Li, D.; Zhang, J.; Zhang, R. Endoplasmic reticulum stress-dependent activation of iNOS/NO-NF-κB signaling and NLRP3 inflammasome contributes to endothelial inflammation and apoptosis associated with microgravity. FASEB J. 2020, 34, 10835–10849. [Google Scholar] [CrossRef]
  61. Deng, X.; Liu, Q.; Fu, Y.; Luo, X.; Hu, M.; Ma, F.; Wang, Q.; Lai, X.; Zhou, L. Effects of Lycium barbarum polysaccharides with different molecular weights on function of RAW264. 7 macrophages. Food Agric. Immunol. 2018, 29, 808–820. [Google Scholar] [CrossRef]
  62. Wu, J.; Zhang, Y.; Ye, L.; Wang, C. The anti-cancer effects and mechanisms of lactic acid bacteria exopolysaccharides in vitro: A review. Carbohydr. Polym. 2021, 253, 117308. [Google Scholar] [CrossRef] [PubMed]
  63. Moon, S.W.; Ahn, C.B.; Oh, Y.; Je, J.Y. Lotus (Nelumbo nucifera) seed protein isolate exerts anti-inflammatory and antioxidant effects in LPS-stimulated RAW264. 7 macrophages via inhibiting NF-κB and MAPK pathways, and upregulating catalase activity. Int. J. Biol. Macromol. 2019, 134, 791–797. [Google Scholar] [CrossRef] [PubMed]
  64. Chen, X.; Yuan, L.; Du, J.; Zhang, C.; Sun, H. The polysaccharide from the roots of Actinidia eriantha activates RAW264. 7 macrophages via regulating microRNA expression. Int. J. Biol. Macromol. 2019, 132, 203–212. [Google Scholar] [CrossRef]
  65. Ma, H.; Mueed, A.; Liu, D.; Ali, A.; Wang, T.; Ibrahim, M.; Su, L.; Wang, Q. Polysaccharides of Floccularia luteovirens regulate intestinal immune response, and oxidative stress activity through MAPK/Nrf2/Keap1 signaling pathway in immunosuppressive mice. Int. J. Biol. Macromol. 2024, 277, 134140. [Google Scholar] [CrossRef]
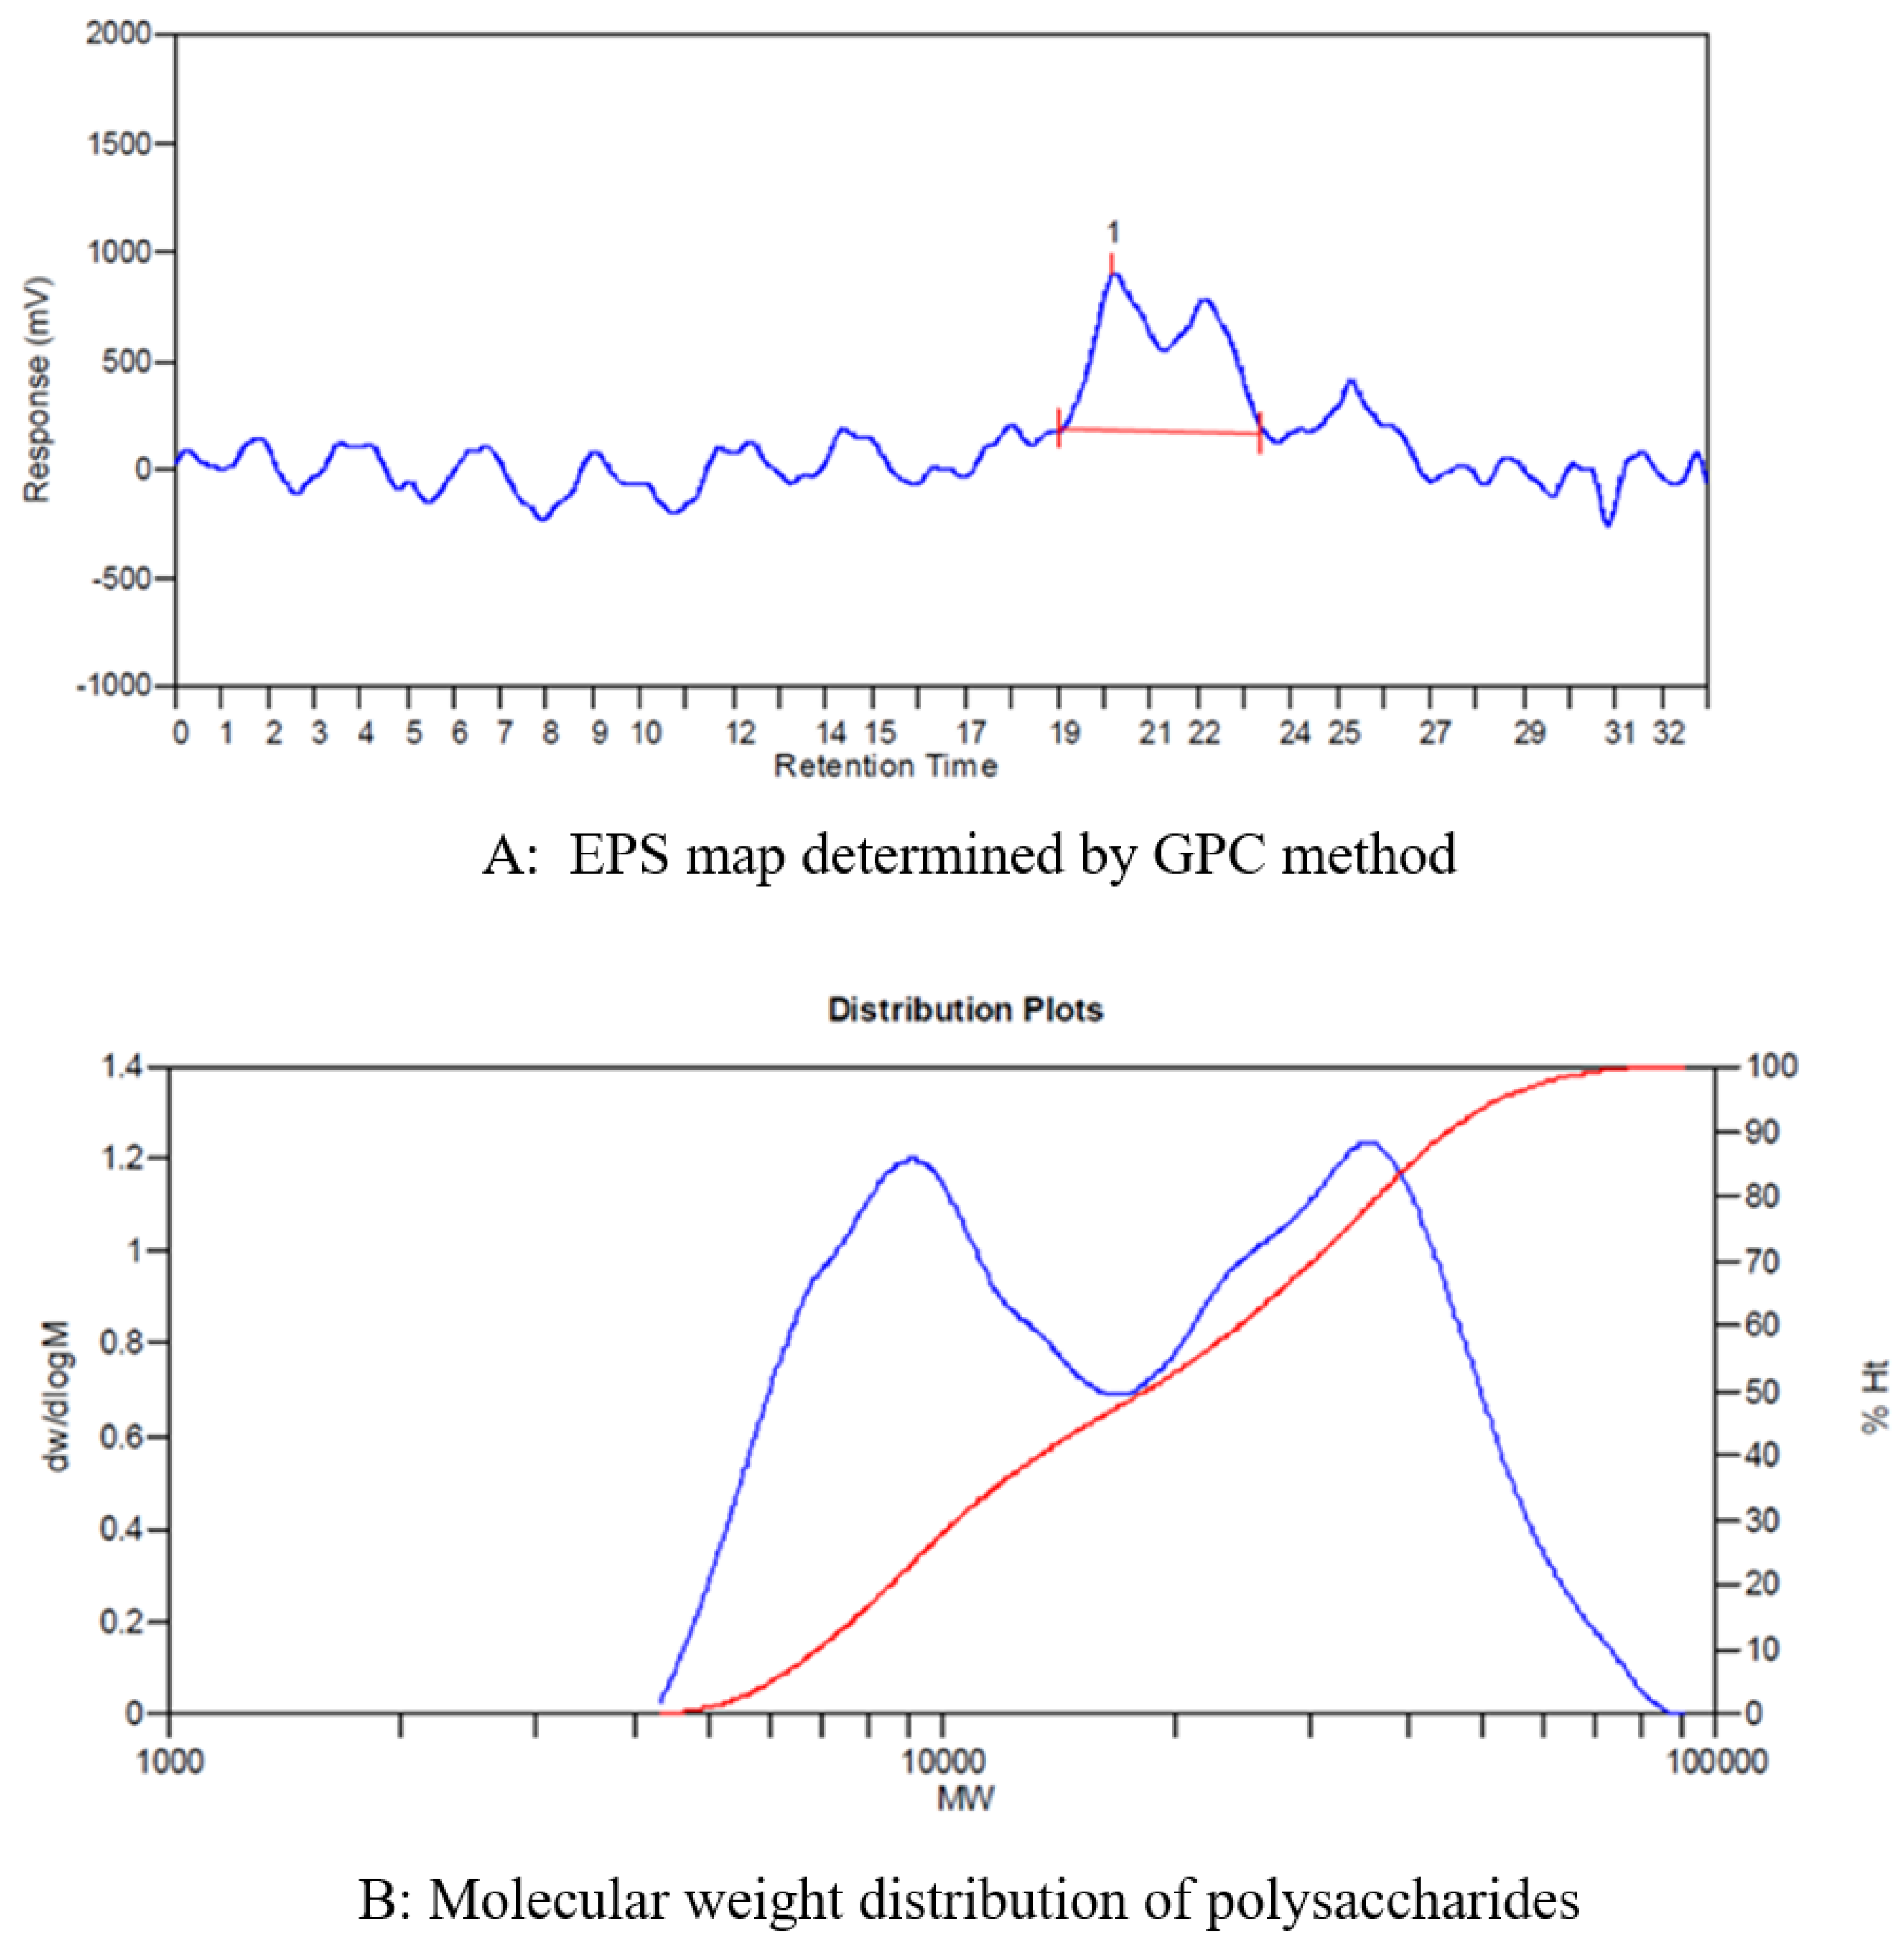
Figure 1. Molecular weight analysis of the EPS produced by Del. algida.
Fermentation 10 00491 g001
Figure 2. Analysis of monosaccharide composition of the EPS produced by Del. algida.
Fermentation 10 00491 g002
Figure 3. Pie chart of monosaccharide percentages of the EPS produced by Del. algida.
Fermentation 10 00491 g003
Figure 4. FTIR analysis of the EPS produced by Del. algida.
Fermentation 10 00491 g004
Figure 5. Ultraviolet full-wavelength scanning of EPS produced by Del. algida.
Fermentation 10 00491 g005
Figure 6. Appearance of lyophilized EPS produced by Del. algida.
Fermentation 10 00491 g006
Figure 7. SEM observations of EPS produced by Del. algida at different multiples, where subfigures (AF) stand for the SEM images at 1200-, 2500-, 5000-, 20,000-, 40,000-, and 80,000-time magnifications, respectively.
Fermentation 10 00491 g007
Figure 8. 1H NMR spectra of EPS produced by Del. algida.
Fermentation 10 00491 g008
Figure 9. 13C NMR spectra of EPS produced by Del. algida.
Fermentation 10 00491 g009
Figure 10. Antioxidant capacity of the EPS produced by Del. algida in vitro, where subfigures (AD) are the scavenging capacity of ABTS+, DPPH, superoxide anion, and hydroxyl.
Fermentation 10 00491 g010
Figure 11. Effects of Pseudomonas on the survival rate and inhibition rate of RAW264.7 cells, where subfigures (A,B) are the effects of P. fluorescens on the survival rate and inhibition rate, respectively, while subfigures (C,D) are the effects of P. fragi on the survival rate and inhibition rate, respectively. * p < 0.05, ***  p < 0.001 , #  p < 0.05 , ##  p < 0.01 , ###  p < 0.001 , ns: p > 0.05 , where * represents the significant difference compared with the blank CK group and # represents the significant difference compared with the 0.01% group.
Fermentation 10 00491 g011
Figure 12. Effects of different concentrations of EPS on the survival rate and inhibition rate of RAW264.7 cells, where subfigures (A,B) show the effects of different concentrations of EPS on the survival rate and inhibition rate of RAW264.7 cells, respectively. * p < 0.05 , ns: p > 0.05 .
Fermentation 10 00491 g012
Figure 13. Effects of EPS on the survival rate and inhibition rate of RAW264.7 cells stimulated by Pseudomonas, where subfigures (A,B) are the survival rate and inhibition rate, respectively. The CK, PB, EPS-L, and EPS-H groups stand for blank group, Pseudomonas CFS treatment group, low-dose group, and high-dose group, respectively. *** p < 0.001 , #  p < 0.05 , ### p < 0.001 , ns: p > 0.05 , where * represents the significant difference compared with the blank CK group, and # represents the significant difference compared with the 0.01% group.
Fermentation 10 00491 g013
Figure 14. Effects of EPS on the secretion of NO by inflammatory RAW264.7 cells stimulated by Pseudomonas (400×), where subfigures (AD) are the CK, PB, EPS-L and EPS-H groups, respectively, stimulated by P. fluorescens, and subfigures (EH) are the CK, PB, EPS-L and EPS-H groups, respectively, stimulated by P. fragi.
Fermentation 10 00491 g014
Figure 15. Effects of EPS on NO content of inflammatory RAW264.7 cells stimulated by Pseudomonas, where subfigures (A,B) refer to P. fluorescens and P. fragi. The CK, PB, EPS-L, and EPS-H groups stand for the blank group, Pseudomonas CFS treatment group, low-dose group, and high-dose group, respectively. * p < 0.05 , ## p < 0.01 , ### p < 0.001 , ns: p > 0.05 , where * represents the significant difference compared with the blank CK group, and # represents the significant difference compared with the PB group.
Fermentation 10 00491 g015
Figure 16. Effects of EPS on ROS secretion of inflammatory cells stimulated by Pseudomonas (400×), where subfigures (AD) are the CK, PB, EPS-L and EPS-H groups, respectively, stimulated by P. fluorescens, and subfigures (EH) are the CK, PB, EPS-L and EPS-H groups, respectively, stimulated by P. fragi.
Fermentation 10 00491 g016
Figure 17. Percentage of ROS secreted by EPS in inflammatory RAW264.7 cells stimulated by Pseudomonas, where subfigures (A,B) stand for using P. fluorescens CFS and P. fragi CFS, respectively. The CK, PB, EPS-L, and EPS-H groups stand for the blank group, Pseudomonas CFS treatment group, low-dose group, and high-dose group, respectively. *** p < 0.001 , ### p < 0.001 , ns: p > 0.05 , where * represents the significant difference compared with the blank CK group, and # represents the significant difference compared with the PB group.
Fermentation 10 00491 g017
Figure 18. Effects of different concentrations of EPS on the secretion of TNF- α by RAW264.7 cells stimulated by Pseudomonas, where subfigures (A,B) stand for using P. fluorescens CFS and P. fragi CFS, respectively. The CK, PB, EPS-L, and EPS-H groups stand for the blank group, Pseudomonas CFS treatment group, low-dose group, and high-dose group, respectively. *** p < 0.001 , ** p < 0.01 , ns: p > 0.05 , where * represents the significant difference compared with the blank CK group.
Fermentation 10 00491 g018
Figure 19. The effect of the EPS at different concentrations on the secretion of iNOS by RAW264.7 cells stimulated by Pseudomonas, where subfigures (A,B) stand for using P. fluorescens CFS and P. fragi CFS, respectively. The CK, PB, EPS-L, and EPS-H groups stand for the blank group, Pseudomonas CFS treatment group, low-dose group, and high-dose group, respectively. *** p < 0.001 , # p < 0.05 , ## p < 0.01 , ### p < 0.001 , where * represents the significant difference compared with the blank CK group, and # represents the significant difference compared with the PB group.
Fermentation 10 00491 g019
Figure 20. Effects of different concentrations of EPS on IL-6 secretion of RAW264.7 cells stimulated by Pseudomonas, where subfigures (A,B) stand for using P. fluorescens CFS and P. fragi CFS, respectively. The CK, PB, EPS-L, and EPS-H groups stand for the blank group, Pseudomonas CFS treatment group, low-dose group, and high-dose group, respectively. *** p < 0.001 , # p < 0.05 , ## p < 0.01 , ### p < 0.001 , ns: p > 0.05 , where * represents the significant difference compared with the blank CK group, and # represents the significant difference compared with the PB group.
Fermentation 10 00491 g020
Figure 21. Effects of different concentrations of EPS on IL-1 β secretion of RAW264.7 cells stimulated by Pseudomonas, where subfigures (A,B) stand for using P. fluorescens CFS and P. fragi CFS, respectively. The CK, PB, EPS-L, and EPS-H groups stand for the blank group, Pseudomonas CFS treatment group, low-dose group, and high-dose group, respectively. * p < 0.05 , ** p < 0.01 , # p < 0.05 , ## p < 0.01 , where * represents the significant difference compared with the blank CK group and # represents the significant difference compared with the PB group.
Fermentation 10 00491 g021
Figure 22. Effects of different concentrations of EPS on mRNA expression of inflammatory factors in RAW264.7 cells stimulated by P. fluorescens and P. fragi, where subfigures (AE) stand for TNF- α , COX-2, IL-1 β , IL-6, and iNOS, respectively. The CK, PB, EPS-L, and EPS-H groups stand for the blank group, Pseudomonas CFS treatment group, low-dose group, and high-dose group, respectively. ** p < 0.01 , *** p < 0.001 , # p < 0.01 , ## p < 0.01 , ### p < 0.001 , ns: p > 0.05 , where * represents the significant difference compared with CK in the blank group and # represents the significant difference compared with the PB group.
Fermentation 10 00491 g022
Table 1. Primer sequence.
Primer NamePrimer Sequence (5’ to 3’)
COX-2-FTGAGTACCGCAAACGCTTCT
COX-2-RCAGCCATTTCCTTCTCTCCTGTT
iNOS-FTCTAGTGAAGCAAAGCCCAACA
iNOS-RCCTCACATACTGTGGACGGG
TNF- α -FGATCGGTCCCCAAAGGGATG
TNF- α -RCCACTTGGTGGTTTGTGAGTG
IL-6-FTGGTCTTCTGGAGTACCATAGC
IL-6-RTGTGACTCCAGCTTATCTCTTGG
IL-1 β -FTGCCACCTTTTGACAGTGATG
IL-1 β -RTGATGTGCTGCTGCGAGATT
β -actin-FCACTGTCGAGTCGCGTCC
β -actin-RTCATCCATGGCGAACTGGTG
Table 2. The monosaccharide content of the EPS produced by Del. algida.
MonosaccharideContent (μg/mg)MonosaccharideContent (μg/mg)
Fuc1.0316Fru0
Ara0Rib1.5462
Rha3.4620Gal-UA2.4371
Gal58.6263Gul-UA0
Glc19.7670Glc-UA76.1418
Xyl1.6417Man-UA0
Man35.2810
Disclaimer/Publisher’s Note: The statements, opinions and data contained in all publications are solely those of the individual author(s) and contributor(s) and not of MDPI and/or the editor(s). MDPI and/or the editor(s) disclaim responsibility for any injury to people or property resulting from any ideas, methods, instructions or products referred to in the content.