Abstract
Methane is the second most important greenhouse gas. Natural methane emissions represent 35–50% of the global emissions budget. They are identified, measured and categorized, but, in stark contrast to anthropogenic emissions, research on their mitigation is largely absent. To explain this, 18 problems are identified and presented. This includes problems related to the emission characteristics, technological and economic challenges, as well as problems resulting from a missing framework. Consequently, strategies, methods and solutions to solve or circumvent the identified problems are proposed. The framework covers definitions for methane source categorization and for categories of emission types and mitigation approaches. Business cases for methane mitigation are discussed and promising mitigation technologies briefly assessed. The importance to get started with methane mitigation in the different areas is highlighted and avenues for doing so are presented.
1. Introduction
Methane is considered as the second most important greenhouse gas (GHG) [1]; methane accounts for 16.5% of current radiative forcing and CO2 for 65.9% [2]. The relevance of methane increases further when regarding greenhouse warming potential GWP20 instead of the commonly used GWP100, i.e., taking 20 years instead of 100 years as the time horizon for the assessment of the impacts. In GWP20, the global annual anthropogenic methane emissions of 29.7 Pg CO2-eq. [3] come close to the annual 37.1 Pg CO2 emissions from fossil fuels [4]. There are ongoing discussions in life cycle assessment (LCA) to divide climate change impacts into two categories represented by GWP20 and GWP100 since GWP20 better represents fast climate changes which are even more disastrous since time for adaptation for both nature and humankind are lacking [5].
Moreover, current atmospheric methane concentrations are in the range of 1850 ppb [6,7,8], which is 2.6 times the pre-industrial level [2,3]. For comparison, CO2 emissions rose nearly 1.5-fold [2,3]. The high methane concentrations are mainly caused by anthropogenic emissions (354 ± 45 Tg CH4 year−1 [3]) such as cattle breeding, rice cultivation, extraction of fossil raw materials and biodegradable waste management [3], whereas natural emissions (202 ± 35 Tg CH4 year−1 [3]) remain unchanged [9,10]. Anthropogenic and natural emissions are increasingly studied, measured and reported, but large uncertainties persist [11,12,13,14,15]. Recent research point to largely underestimated methane emissions from oil and gas production questioning also the lower GHG emission factor of natural gas [16]. Furthermore, models predict a strong increase of natural emissions such as from permafrost [17,18,19].
Mitigation and abatement strategies for methane focus on preventing anthropogenic methane emissions. Consequently, natural methane emissions representing 35–50% of global annual methane emissions [13] are currently largely neglected for climate protection purposes. This is a highly significant amount when considering the Representative Concentration Pathways (RCP) of CH4 by the IPCC. Here, the lowest emission scenario RCP 2.6 calls for an anthropogenic methane emission reduction of up to ~142 Tg CH4 year−1 in 2100 [20], which is equivalent to 41% of current anthropogenic methane emissions. Reduction of natural methane emissions could broaden the base for emission reduction and thus reduce this percentage value or—with constant effort for anthropogenic emissions—could allow achieving a higher reduction of total methane emissions. A cost curve (absolute emission reductions of a mitigation measure against costs for this measure) integrating both would allow identifying the most cost-effective ones, irrespective of the nature of the emissions. Since recent climate change research clearly states that “it is time to panic” [21], methane emissions continue to rise [22] and methane is a GHG particularly driving short-term climate change, new ways of dealing with emissions, specifically with methane, have to be explored to increase the chances of success.
This paper aims to explore why natural methane emissions are not yet considered in mitigation and how it would be possible to strengthen the field of natural methane emission reduction. Therefore, this paper is structured into two parts. The first part (Section 2) identifies and structures current problems acting as barriers for natural methane emission mitigation. The problems are numbered consecutively. Then, the second part (Section 3) takes up these problems and discusses possibilities how to strengthen the field of natural methane mitigation research in order to solve, reduce or circumvent the existing problems.
2. Barriers for Natural Methane Emissions Mitigation
2.1. Differences between Anthropogenic and Natural Methane Emissions
Natural methane emissions are estimated based on top-down approaches, in which estimates are numerically derived from observed atmospheric concentrations [23], at 194–296 Tg CH4 per year [24]. However, anthropogenic methane emissions are the main cause for rising methane concentrations in the atmosphere [13] and scenarios of anthropogenic methane emissions largely vary depending on the underlying assumptions (Figure 1). While there are numerous ideas and technologies and research is aimed to limit the anthropogenic methane emissions, the natural methane emissions are often not considered as a possibility to lessen the rise of air methane levels. Therefore, in the following, differences between anthropogenic and natural methane emissions are analyzed to identify barriers for mitigating natural methane emissions. Some of the identified problems apply to other GHG, too.
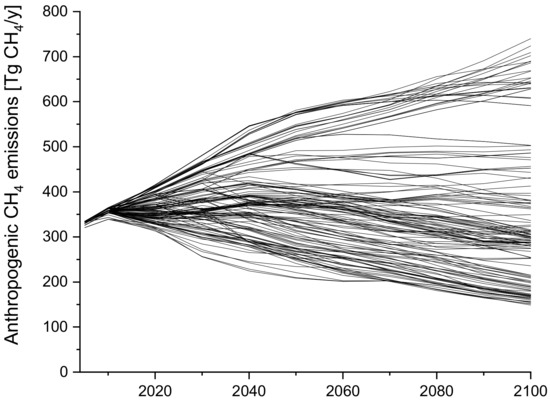
Figure 1.
Anthropogenic methane emissions of IMAGE 2.4 and MESSAGE V.4 scenarios. Underlying data from the AR5 Scenario Database (v. 1.0.2) available at https://tntcat.iiasa.ac.at/AR5DB/ [20].
The identified problems are numbered to be able to discuss and propose solutions for the individual problems in the second part of the paper.
In emission inventorying, scenarios and discussions, anthropogenic GHG emission sources are often classified into the categories energy, agriculture, waste management and industry [25,26,27]. Because natural GHG emissions are often excluded in these reports, a uniform categorization for them is missing. To overcome this, we distinguish as emission sources natural water bodies and natural land as well as geologic sources based on the literature [3,9,28,29]. These are presented in Figure 2.
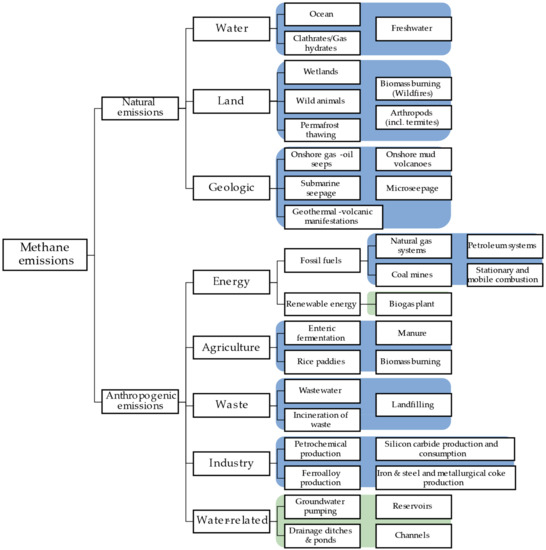
Figure 2.
Categorization of methane emission sources. Blue indicates commonly used categories in literature, while green indicates new categories defined in the second part of this paper. Note that there are also other categorization approaches but the presented one focusing on sources seems particularly appropriate as a base for mitigation strategies.
Another common methane categorization method uses the three main emission origins: biogenic, thermogenic and pyrogenic [3,13]. Whereas pyrogenic processes involve methane generation by incomplete combustion of biomass, thermogenic methane is formed over geological timescales in the Earth’s crust due to the breakdown of organic matter under elevated temperatures [13]. About 70% of the global methane emissions are produced biologically through methanogens [15] and thus makes up the biogenic category.
Here, δ13C measurements can help to identify and assign the emissions to the three categories as these show rather similar ratios of 13C to 12C, resulting from the fractionation of 13C in relation to 12C in physical, chemical and biochemical processes and also reflect the isotopic signature of the carbon source. The δ13C are expressed in per mill as a deviation from a standard: the isotopic signature of carbonate of a belemnite of the Pee Dee Formation, U.S.A., abbreviated V-PDB with V for Vienna. Typical values range between −70‰ and −55‰ for materials of biogenic origin, −55‰ and −25‰ for thermogenic and −25‰ and −15‰ for pyrogenic origin [13]. Isotopic measurements provide the unique identification of source/sink characteristics [30,31,32], but a large overlap in isotopic signatures at process level hinders a precisely determination of methane sources and their changes [33].
Differences in δ2H (deuterium relative to protium 1H) isotopic signatures can help to differentiate further. A common approach combining δ13C and δ2H measurements, the CD diagram, is displayed in Figure 3.
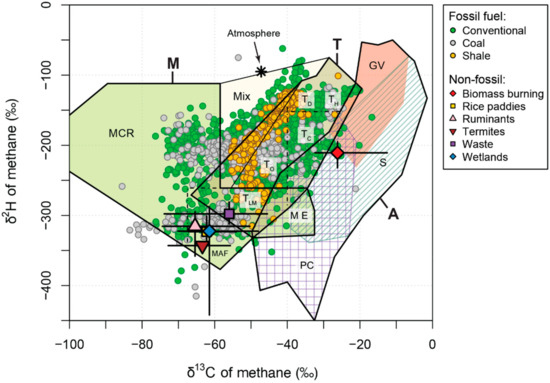
Figure 3.
Plot of δ13C(CH4) against δ2H(CH4) showing a possibility to categorize methane emissions according to the emission pathway. M, microbial; T, thermogenic; A, abiotic; MCR, microbial CO2 reduction; MAF, microbial acetate fermentation; ME, microbial in evaporitic environment; TO, thermogenic with oil; TC, thermogenic with condensate; TD, dry thermogenic; TH, thermogenic with high-temperature CO2–CH4 equilibration; TLM, thermogenic low maturity; GV, geothermal-volcanic systems; S, serpentinized ultramafic rocks; PC, Precambrian crystalline shields. Illustration and abbreviation explanation directly taken from [37], licensed under CC BY 3.0. Available at https://www.earth-syst-sci-data.net/9/639/2017/essd-9-639-2017.pdf. Reproduced with permission from [37]. Copernicus Publication, 2017 under CC BY 3.0.
A further isotopic information that can be exploited is the 14C concentration. The isotope 14C is rather steadily produced by the interaction of cosmic radiation with atmospheric nitrogen. As 14C decays with a half-life of ~5730 years [34] and dead organic materials stop incorporating 14C, the 14C concentration is used for so-called radiocarbon dating but can be also used to differentiate among methane sources [35]: 14C has completely decayed in fossil (thermogenic) methane, whereas biogenic and pyrogenic methane sources typically processing recent carbon sources have 14C levels similar to the atmospheric CO2 [36].
A large share of anthropogenic methane emissions stems from livestock (enteric fermentation and manure), rice paddies, natural gas and petroleum systems, coal mines, landfills, wastewater and waste incineration [38] and there are numerous studies on reducing these emissions [39]. Depending on the source, different ideas, concepts and technologies are followed to achieve lower emissions. For natural gas and petroleum systems, myriad technological solutions exist for cutting emissions, ranging from improved components [25] to devices to detect leakages [40]. There is a rich literature on experiments to improve rumen efficiency and hinder methane production from livestock [41]. Emissions from rice paddies can effectively be reduced by mid-season drainage [42]. In wastewater treatment plants, landfills and biogas plants, methane produced from wastewater, solid waste and manure, respectively, may be utilized. This prevents the majority of the produced gas from being released into the atmosphere. In all these areas, there is a lot of ongoing research [43]. For natural methane emissions, this is different. Whereas the major sources of methane emissions seem to be identified, emission mitigation is largely absent. There are multiple reasons for this.
One reason and probably the most important one is the size of the area over which the methane is emitted. Methane emissions from industrial and energy sources mostly stem from small and well-defined areas such as smokestacks, pipes and vents. Note that diffuse emissions are also known from industry, first from transshipment and mobile combustion [44] and second from open coal mines or plants such as coke oven batteries, sinter plants or refineries if emissions are not efficiently captured or leakages occur [45,46]. Even a large share of agricultural emissions stems from small areas since animals are often held in stables and their manure is collected in big tanks. Emissions from landfills, wastewater or rice paddies originate from larger but still well-defined areas. In contrast, natural methane sources typically arise from (1) large areas of emission and are therefore (2) often diffuse emissions, (3) harder to pinpoint to an exact location and (4) partly inaccessible. Examples here are the methane emissions from geological sources, where the methane travels through a large water column before reaching the atmosphere. In addition, large natural emitters such as wetlands emit methane over large areas, even compared to rice paddies. Combining emission areas with methane emissions allows calculating average methane fluxes (a flux is a specific methane flow, for example, per time and area of emission) per source (cf. Table 1 with a non-exhaustive list of methane sources). The smaller the flux is, the lower is in general the concentration of methane in air near the source and the harder it is to capture the methane after the release (not accounting for factors such as wind speed, seasonality or size of the area and thus edge effects). To understand the order of magnitude of natural fluxes, Table 2 shows total, anthropogenic and natural methane fluxes for selected countries [47]. It becomes evident that methane fluxes for specific natural areal sources are in a similar range as the annual fluxes of the countries accounting for all sources in that country. For some countries, the natural areal source fluxes are even significantly higher. Note that these approximated natural methane flux data should only be understood as an oversimplified average and should not be used when discussing the detailed characteristics of methane mitigation strategies, since most sources show a high spatial variability.

Table 1.
Measured and globally averaged fluxes of selected methane sources.
Table 2.
Annual methane fluxes from different countries, calculated using country-specific emission data from [47].
Interestingly, most global flows in Table 1 vary within one order of magnitude only, whereas underlying flux data and global emission areas are highly divergent. Oceans, for example, have an on average very low flux as they extend over two thirds of the Earth’s surface.
On the other side of the spectrum are mud volcanoes whose global flux is at least three orders larger than other methane sources. As emission source, mud volcanoes resemble more point sources, whereas, for example, wetlands are highly diffuse sources. It should be noted that mud volcanoes are typically submarine and the emitted methane needs to travel through the water column where it is partly oxidized [14] and emitted into the atmosphere over large areas as a diffuse emission.
2.2. Deficits in the Current Framework
2.2.1. Overlooked Emissions and Inconsistencies in Emission Categorization
The landscape of methane research comprises specialists in a certain source category, e.g., Giuseppe Etiope for geologic or David Bastviken for freshwater methane emissions, but also researchers addressing the entire breadth of emission sources but from a particular perspective such as emission modeling or inventorying. We observed that there is often a focus on large emitters at the risk of ignoring or not sufficiently accounting for the smaller ones. If not properly addressed, this may result in (1) overlooked emissions. Some examples are emissions from groundwater pumping with approximated 0.53 Tg CH4 per year [59] and from drainage ditches, ponds and reservoirs often used for agricultural irrigation [60,61,62]. Another is the recently discovered subglacial methane production and release through the ice sheet bed with meltwater [63]. In general, the amounts emitted from such overlooked sources are quite small compared to the total.
A further problem is (2) inconsistent source categorization, as already mentioned in the context of Figure 2. Inconsistencies there may result in double-counting or omitting emissions. Therefore, integrating thus far overlooked emissions into existing methane budgets or combining data from different methane budgets is problematic. In their “global methane budget 2000–2017”, Saunois et al. [38] mentioned these two problems by pointing to emissions not included in the global methane budget such as reservoirs, artificial ponds, canals, ditches and palm oil plantations and by discussing the difficulty of categorizing a methane source either as natural or anthropogenic emission taking reservoirs as an example.
Apart from differing categorization approaches, the current scientific literature is not streamlined when it comes to definitions about the type of emission source, which is discussed next.
2.2.2. Definitions of Point and Non-Point Source Emissions
Commonly used terms for emission categories are “non-point source emission”, “diffuse emission” and “fugitive emission”, and for emission sources “point source”, “non-point source”, “diffuse source”, and “area source”. The definitions discussed in the following can be found in the Supplementary Materials.
The United Nations [64] uses the terms “diffuse emission” and “non-point source emission” synonymously and neither the European Parliament [65] nor the United Nations [64] differentiates for diffuse emissions between anthropogenic and natural sources. The term “fugitive emission” in contrast is reserved for anthropogenic emissions [66] and especially for non-captured emissions, for example, from leakages [67] and thus unintentionally released emissions [68]. Even though some include in their definitions of fugitive emissions intentionally released emissions, for example the IPCC [27,66], the fact that an emission is called fugitive implies that the release occurred unintentionally. Intentionally emitted emissions can be called vented emissions [40]. The U.S. EPA [69] defines fugitive emissions in a technological context as follows: “Fugitive emissions consist of all air releases not released through a confined air stream and may include both point and diffuse sources”. This is used to create a simple categorization system for natural and anthropogenic emissions, which is displayed in Figure 4. To further elaborate on this definition, it is essential to define the terms “point source (PS)” and “diffuse source”.
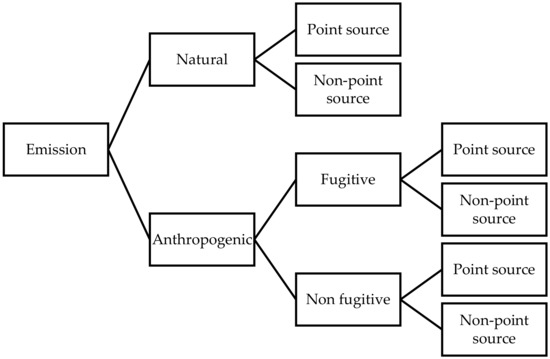
Figure 4.
Categorization system of methane emissions according to the definitions analyzed.
According to U.S. EPA, “A point source is a single, identifiable source of pollution, such as a pipe or a drain” [70], or in the context of a fugitive emission a leaky spot of a pipe. Barnes at al. [71] noted that point sources may consist of multiple emission points. The counterpart of the point source is a non-point source (NPS). The term is often used synonymously in the literature with other terms such as “diffuse source” or “area source” (e.g., in the definitions [70,72]) and “refer[s] to those inputs and impacts which occur over a wide area and […] are not easily attributed to a single source” [70]. This definition, when used with the point source definition from Barnes et al. [71], distinguishes the two source types not specifically by the existence of one or more emission sources (as U.S. EPA [70] does) but by the simplicity of identifying a single source, as well as by the—not further quantified—criterion of the area of emission.
These qualitative criteria result in a variety of approaches to define the emission types, but without a clear dividing line. For example, when does a point source becomes so large by surface that it turns into a non-point source? Conversely, at what point does a non-point source become so confined that it converts to a point source? Another vague differentiation results from the already cited point source definition of U.S. EPA [70]. There the question arises: When is it considered to be easy to assign the emissions to a single source and what exactly counts as a single source? Termites can be taken as an example here as there are typically several termite mounds in a certain area. According to the United Nations’ definition [64], diffuse emissions are released from “numerous small or distributed sources”. Termite mounds would thus be categorized as diffuse sources.
Similar problems occur in industrial complexes which could be either seen as an area source or as several point sources, depending on whether a micro- or macroscopic viewpoint is taken. However, compared to termite mounds, the emissions per point source are typically considerably larger. These differentiation problems result from (3) an unclear viewpoint and purpose of the categorization as well as from using only (4) qualitative thresholds. Such inconsistencies in source categorization may hinder correct categorization of an emission source and in the end a sound emission inventorying which is the base for any mitigation strategy.
Overall, the explained problems connected to vague definitions for methane emissions as well as the aforementioned overlooked emissions and inconsistent source categorization also contribute to a heterogeneous framework with negative impacts on research if it is not clear what is exactly meant. Besides, for mitigation of natural methane emissions, technological as well as economical barriers exist, as discussed next.
2.3. Technological Barriers
An often-mentioned barrier for methane emissions mitigation is that the (5) technologies necessary to prevent or capture non-point source methane emissions do not exist [73,74,75]. Whereas emissions from point sources with high methane concentrations, for example in the petroleum industry, can be easily dealt with by flaring [76] or even be captured, used and therefore valorized [25], these technologies are not applicable for areal sources. Certain anthropogenic emissions, for example from rice paddies or enteric fermentation, are therefore mitigated through interventions in the generation and/or release processes, in particular if the methane generation and/or release processes can be controlled, timed and pinpointed. However, as explained below in detail, this approach cannot be applied to most natural sources, since it is nearly impossible to temper with such large emission sources. Consequently, (6) preventing natural methane from being emitted is almost impossible. Additionally, such actions would likely raise ecological concerns as large scale experiments in nature with uncertain outcomes as in the case of geoengineering. Therefore, technologies that could reduce natural methane production are hardly examined in the current literature.
Another technological problem arises from the low methane concentrations typical for natural sources. Even if applicable, (7) current technologies cannot process these low-grade emissions efficiently, since they have not been designed for this specific problem. Here, lean combustion technologies can be named exemplarily, as they are used for low concentrated anthropogenic methane emissions (0.1–1 vol% CH4), but not for air capture or natural emissions [77,78]. Biofilters have similar concentrations as lower limit [79,80]. Moreover, in current literature, methane capturing is regarded as almost impossible [73,74,77]. The low concentrations, however, also gave the impression that it is not worthwhile to focus on these and to tackle the low hanging fruit, i.e., the highly concentrated streams first. We argue that scientists have not yet discovered the importance and potential of mitigating natural emissions with low concentrations, where this paper seeks to provide remedy.
In general, methane capturing is less discussed than CO2 capturing due to the (8) limiting physical properties of methane and the associated problems of its capturing. Methane (CH4) is completely non-polar and thus has very weak interactions with most materials and chemicals to the extent that adsorption or solvation processes used in CO2-capturing are seen as impractical for methane separation [74,81].
However, technological limits not only exist for methane mitigation technologies, but are also existent for methane detection technologies and global emission models. Here, highly sensitive sensors coupled with up-to-date algorithms, models and datasets are used to generate bottom-up estimates for anthropogenic as well as natural methane emissions [29,82]. However, current global bottom-up emission estimates rely heavily on assumptions and generalizations to be able to model methane emissions for every source, since detailed measurements and precise emission allocation on a global scale can only be performed with some degree of uncertainty [16,38]. This uncertainty can be seen in current global methane budgets [3,12,13,38], (9) where uncertainties of natural methane emissions typically range from 25% to 50%. For comparison, the reported uncertainties for anthropogenic bottom-up methane emissions range from 5% to 10% in the same literature. Since a variety of research builds on global emission model data, these uncertainties are passed on and therefore could result in inconclusive new research.
Another problem related to research arises when risking a glimpse into the future. Thus far, (10) research and researchers on this subject are scarce, which in turn hinders a fast development for the so highly needed technological progress, in order to decrease the above-mentioned uncertainty as well as to increase the chance of developing attractive technologies for methane mitigation in the next decades.
2.4. Economic Challenges
Related to technological barriers is the topic of economic challenges for applying methane mitigation technologies.
Methane emission mitigation such as the abatement of most other emissions is associated with costs. Whereas large progress has been made in the abatement of pollutant emissions to the air over the last decades, methane emission abatement as an emerging topic is rather unregulated, but at present there is an increasing number of methane related regulation [83]. Even more, clean air and GHG emission reduction policies are typically based on cost-effectiveness and cost-benefit analyses [84], making methane mitigation rather unattractive as long as, for example, low cost CO2 reduction measures are available.
For natural emissions, the situation is even worse as no emitter can be held responsible such that emission abatement costs would have to be paid by the community. Thus, (11) for natural methane emissions abatement the polluter-pays principle does not work.
Moreover, (12) low methane concentrations of or near natural methane emission sources result in high abatement costs, since the separation of low concentrated gases from a mixture increases the physical order and therefore reduces entropy. Following the principles of thermodynamics, this process must be energy intensive resulting in high energy costs. Additional costs will come from problems of energy and material transport to the location of abatement, which, in most cases, is a remote area, as described with Problem (4). Furthermore, the energy that could be gained from methane oxidation is small compared to the energy necessary for concentrating.
As explained above, (natural) methane mitigation is economically unattractive for private actors unless there are incentives. However, (13) incentive systems such as the EU Emission Trading System do not include credits for natural methane mitigation yet.
A result of the missing focus on methane reduction can be seen when searching the literature for GHG removal possibilities. While the literature is strongly concerned with CCU and carbon capture and storage (CCS), less publications exist on methane capturing and subsequent total oxidation or utilization. In fact, in CCS and CCU, carbon is synonymously used for carbon dioxide (e.g., in [85]) but instead should be used more broadly by including methane to acknowledge it as a potent GHG and promote the scientific discussion of methane capturing and utilization.
2.5. Environmental Damages Caused by Tempering with Natural Methane Emissions
As the term natural methane source implies, the methane emitting geo- and ecosystems or parts thereof have existed for a long time and hopefully will continue to exist, since, for example, wetlands play a crucial part in biodiversity, erosion protection and carbon sequestration [86]. Whereas industrial methane emissions can most often be cut or avoided by shutting-down the whole process, natural methane sources such as wetlands, wild animals or water-related sources (14) cannot be controlled or shut down without significant negative ecological effects. In fact, mitigation options, which intervene in biological processes change nature and violate SDGs, especially #14 (life below water) and #15 (life on land) [87]. Thus, even if emission prevention would be technically (and possibly also economically) feasible, ecological goals would narrow down the number of possible options further. Examples for ecologically questionable options can be found in the work of Stolaroff et al. [73], as well as in that of Lockley [88] commenting on Stolaroff et al. An example is “lake sealings”. There, nonbiodegradable foaming agents or impermeable covers trap methane bubbles before they can enter the atmosphere. In addition, “polytunnels” are proposed, which would cover soil with impermeable structures to allow plant growth but would concentrate methane. In addition, the more often heard approaches of clathrate extraction and drainage management are mentioned. The strong impacts on natural ecosystems are apparent. Therefore, new ways of reducing methane from natural sources have to be established.
In the second part of this article, the problems identified in the first part (cf. Table 3) are discussed from the perspective of how to deal with them and how to strengthen the field of natural methane emission reduction.
Table 3.
Summary of the identified problems.
2.6. Summary of the Identified Problems
3. Options to Strengthen the Field of Natural Methane Emission Reduction
Suggestions on how to solve the “Global Methane Challenge” have already been collected for the largest anthropogenic methane emissions [39,43,89,90]. Since this article focuses on natural methane emission mitigation and how to solve above identified problems, the authors intend to start with the list developed by the Global Methane Initiative [43] and to extend it to incorporate natural methane emissions. For better understanding, the identified approaches and problems are addressed in a meaningful but unsorted manner. For convenience of the reader, Figure 5 summarizes and anticipates the proposed methods, strategies and solutions to be developed in the following.
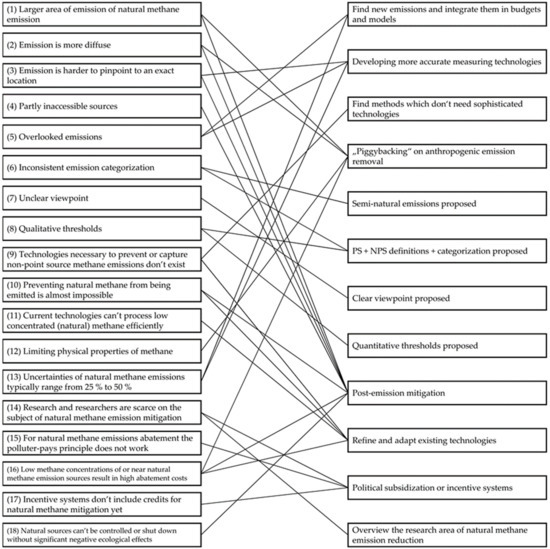
Figure 5.
Summary of the proposed approaches and solutions to strengthen the field of natural methane emission mitigation. PS, point sources; NPS, non-point sources.
3.1. Integrating Newly Identified Methane Sources into Common Categorization Frameworks
Saunois et al. [38] mentioned examples for newly identified anthropogenic sources not yet considered in the current emissions budget (cf. also Problem (5)). In addition, many minor natural emissions such as the newly identified subglacial emissions [63] are also neglected. By developing a broader glossary of emission types and sources, from which an all-encompassing categorization system can be derived, a uniform emissions budget can be developed. A suggestion of an improved categorization system can be found in Figure 2 in which added categories are colored in green. Methane emissions from different water-managing systems have been grouped into the new category “water-related”. Moreover, biogas plants, which emit a non-negligible amount of methane through leakages [91,92,93,94,95,96], are placed in a new subcategory in the anthropogenic energy sector.
An incorporation of all methane sources into the methane budget will help to spread awareness about these overlooked emission sources and thus will increase targeted research and tailor-made mitigation solutions, which then will raise the chances for natural methane emission reduction. As research on natural methane sources is still in its infancy, it is possible to identify further emission sources. A current approach is to use LiDAR technology from aircrafts and spacecrafts to measure methane sources with high resolution, but many problems still need to be solved [97].
Apart from identifying new methane sources and developing better measurements techniques, the categorization framework resulting from isotope measurements can also contribute to solve the Problem (5) of overlooked emissions as well as to enable more detailed emission inventorying. Howarth et al. [98], for example, recently used δ13C measurements to demonstrate that shale-gas and shale-oil production has a large impact on the currently rising methane levels that were before inconclusively explained with increasing biogenic methane emissions due to the decreasing δ13C values. This research therefore also helps reduce the uncertainty of natural methane emissions, as they have (partly) been seen as the reason for the changing δ13C level of atmospheric methane [98,99]. Isotopic measurements can be also helpful to identify sources at the regional level [31,100].
While searching for overlooked and unquantified emissions, these approaches will also help to reduce the uncertainty of emission inventories (Problem (13)), which is discussed in the following section.
3.2. Reducing the Uncertainty of Global Emission Inventories
Better emission inventories are important to direct research and for assessing management strategies. In fact, a lot of progress has been made in the last years which reduces Problem (13), high uncertainties of reported natural emissions. An example is advanced satellite measuring systems to detect methane emissions with a higher accuracy. Depending on the source, different approaches and technologies are used. GHGSat [101,102], for example, allows identifying small point sources and thus hitherto overlooked sources (Problem (5)). At area source level, the MethaneSAT system [103,104] comes into play. On a global scale, systems such as TROPOMI [105] are essential for reducing the uncertainties of global methane emission inventories (Problem (13)). For detection and evaluation of natural sources, MethaneSAT can be regarded as highly promising, due to its high detection threshold down to 2 ppb, combined with a field of view of 260 km needed for low concentrated and dispersed natural emissions [106]. A higher spatial resolution allows resolving diffuse emissions. Elder et al. [107], for example, surveyed 30,000 km2 in the arctic to identify natural methane hotspots and to describe them in relation to the distance from standing water, which is useful to pinpoint the largest natural methane emitters and therefore solving Problem (3) stating that emissions are hard to pinpoint. Moreover, such findings can be incorporated into arctic land models and thus improve reliability and reduce uncertainty of methane emissions and thereby contribute to solve Problem (13), the high uncertainties for natural methane emissions.
Further progress to reduce the uncertainty has been made with radioactive isotopic methane measurements. Hmiel et al. [35] measured 14C levels of 11,660-year-old atmospheric methane in an ice core. They found that natural CH4 emissions from geologic (14C-free) sources were highly overestimated in the literature and that current models therefore underestimated the amount of current anthropogenic methane emissions from fossil fuels by 33% over the upper uncertainty threshold [13,35]. When future inventories adapt the higher fossil fuel emissions, top-down models will have to adapt the amount of natural methane emissions as well, which could decrease the high uncertainty and help with Problem (13), due to now clearer emission inventories and improved inverse modeling approaches.
3.3. Mitigation of Natural Methane Emissions without Negatively Impacting Natural Ecosystems
Although the mitigation of natural methane emissions is thus far rarely addressed in research, several promising approaches already exist. The restoration of wetlands affected by human activity [86] can significantly reduce methane emissions, without further harming the ecosystem and therefore bypassing Problem (18). Another proposal is to increase herbivore density in permafrost regions [108]. Herbivores such as reindeers or bison compact the snow while grazing and moving in winter. Compacted snow insulates the soil less such that the soil temperatures decrease more strongly conserving the permafrost. First calculations show that, theoretically, 80% of current permafrost soils could remain until 2100 if this method is used intensively [108]. Since the herbivores are domestic species with greater populations before the arrival of humans, this process can be considered as some kind of restoration of nature.
Since nearly every intervention with natural methane production processes poses a threat to the ecosystem intervened in, capture of methane from the air is worthwhile to discuss.
In natural methane mitigation from air, Problems (1), (2), (12) and (16) come to mind, i.e., in particular the low concentrations and large areas in combination with the physical properties of methane. The example of solid waste landfills shows that mitigation of methane emissions over somewhat larger areas is possible [109]. Furthermore, technologies have been developed to deal with, for anthropogenic emissions, low methane concentrations, for example for coal mine methane emissions from ventilated air [25,110,111]. When “piggybacking” on this research and using the lessons learned from these topics, advancements in natural methane reduction cannot be ruled out.
3.4. Support from a Common Framework, Definitions and Terms
3.4.1. Differentiation into Natural, Anthropogenic and Semi-Natural Emissions
As outlined above, for some emissions sources, it is hard to classify them as either natural or anthropogenic. Saunois et al. [38], for example, acknowledged that water reservoirs are manmade and therefore could be considered as anthropogenic sources, but they argued also that the methane emission does not directly depend on human activity and therefore should be accounted as natural source. We therefore propose semi-natural emissions as a new category (Problem (6)) to emphasize on the human impact on such methane emissions, even if this comes at the prize of a higher complexity. The clear, theoretical dividing line can be drawn with the question: “Would the emission occur if humans did not exist?”, which is a highly philosophical question with an answer impossible to quantify. Some thought-provoking statements are given, and a first categorization approach is performed in Figure 6. Emissions resulting from global warming, for example, from thawing permafrost or destabilizing clathrates [112,113,114,115], belong to this new category. In addition, wetlands are impacted by climate change due to changes in temperature and precipitation regimes [116] and emissions such as microseepage can be the result of anthropogenic actions, e.g., enhanced oil recovery [117] or fracking [118]. Therefore, labeling them as semi-natural would give additional insight and portray the manmade climate impact more accurately.
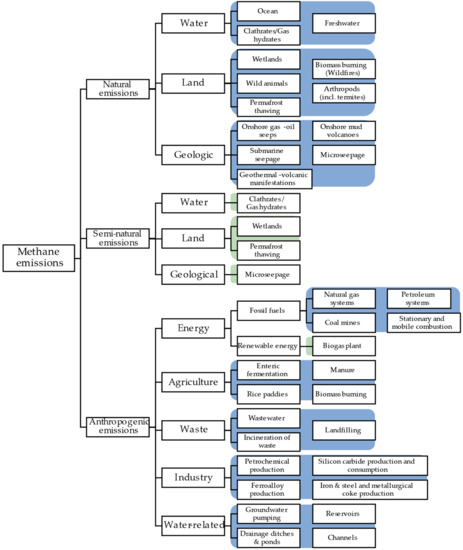
Figure 6.
Advancement from Figure 2: Incorporating the semi-natural emissions in the categorization framework. Blue indicates categories commonly used in literature, while green indicates added categories.
3.4.2. A Definition for “Point Source” and “Non-Point Source”
As described above, there are several definitions in use and no clear delineation between the two categories. A clear distinction would allow better streamlining emission statistics and, more importantly, defining a common ground for natural emission characterization to expand from.
Quantitative differences between point and non-point sources could be the area of emission, the change in pressure at release, the (possible) existence of a physical confinement, the methane flux or the feasibility/possibility of installing an emission capture system on top of the emission source. Recently, Duren et al. (2019) defined a point source as “a condensed surface feature or infrastructure component of less than 10 m in diameter that emits plumes of highly concentrated methane” and area sources as “combined effect of many small emitters distributed over a large area (typically 1−100 km across) that releases methane in a more diffuse fashion”
Since determining the exact spatial extension of emission sources can be complex, binary differences might be helpful. We therefore decided to leave out the extension and use instead the existence of a physical confinement (as in the definition in the United States Code [119]) as well as the stationary character of the source (as in the definitions [71,120,121]). Both characteristics are prerequisites to enable the installation of an emission capture system and thus can be used as semi-quantitative differences. The physical containment already implies a clear delineation between source and environment of the source, and the capture system emphasizes that the source has a very restricted size.
The definitions proposed and used in this article to categorize methane emissions are the following:
- A point source (PS) generates point source emissions and consists of a single or multiple, identifiable sources of pollution, which are so physically confined and stationary that the installation of a stationary capture system is justified.
- A non-point source (NPS), also called diffuse or area source, generates diffuse or non-point source emissions, which are distributed over a wide area and result from numerous small and/or distributed sources. Due to the large emission area and the possible non-stationary character of the emission sources, a simple stationary capture system cannot be installed.
Through defining an emission category as PS or NPS, relationships between the emission sources and respective mitigation options can be examined through the more detailed categorization approach. In addition, the datasets developed from the definitions can then be screened for not yet mitigated emissions. Moreover, this categorization enables a more streamlined and detailed global assessment of methane emissions and aims to build a foundation to discuss mitigation options, thereby supporting to solve Problem (6), the inconsistent emission categorization.
The proposed definitions contribute to solving Problems (6) and (8), whereas the problem of the perspective (Problem (7)) remains unsolved in spite of the more streamlined categorization. Termites can still be categorized as a single source or an area of emission. Therefore, we propose to always take the global perspective. Then, termites are an NPS because of the wide area of the small distributed emissions. For a more thorough explanation step, this article proposes a categorization into PS and NPS for the individual emission source of Figure 2 maintaining a global perspective to avoid Problem (7). Table 4 shows the application of the new categorization and cites literature, which use the specific terms in their studies to describe the respective source to show the current divergency resulting from different viewpoints and qualitative thresholds (Problems (7) and (8)).
Table 4.
Categorization into point and non-point sources, including literature using the terms for the specific category. Grey indicates it applies considering the global perspective, white indicates it does not apply considering the global perspective.
This article acknowledges the issues when performing such a categorization approach, such as overgeneralization and informs the reader in the Supplementary Materials if a classification is debatable. However, a first thorough approach has to be undertaken to classify methane emissions in PS and NPS to show the broad spectrum and the amount of NPS emissions. This allows for an evaluation of methods on how to reduce NPS emissions specifically in the context of natural methane emissions. Therefore, solving the Problems (6)−(8) is pursued. Details regarding the proposed categorization, the role of the perspectives in Table 4 and the interpretation of the PS/NPS definition can be found in the Supplementary Materials.
The proposed categorization approach shows that anthropogenic emissions are often PS emissions, and natural emissions are often NPS emissions. Some anthropogenic sources are umbrella terms and thus can be assigned to either PS or NPS. Since some sources cannot be clearly assigned to one category, we refrained from calculating a ratio of point to non-point global emissions.
3.5. New Mitigation Strategies for Natural Methane Emissions
Natural methane emission mitigation has to take the characteristics of natural emission sources into account (cf. Problems (1)−(4), (10) and (18) for the problem that natural emissions are typically unavoidable). To expand this topic, first, a short definition and categorization of methane mitigation techniques is given. Then, mitigation strategies for anthropogenic and natural emission are discussed and future strategies and potentials for further improvements are presented.
Inspired from CO2 capture from fossil fuel based power plants, which prominently uses pre-combustion, post-combustion and oxy-combustion to categorize technologies [137,138,139], we distinguish among three categories for natural methane mitigation techniques. The categories are referred to as pre-generation mitigation, in-situ mitigation and post-emission mitigation:
- Pre-generation mitigation refers to mitigating a substance through interfering in the generating processes resulting in the partial or the full prevention of the substance being generated.
- In-situ mitigation is the act of mitigating a not yet emitted but present substance near the temporal and geographic point of generation, thus partly or fully preventing the emission.
- Post-emission mitigation means removing an already emitted substance from the atmosphere. A local post-emission mitigation strategy revolves around mitigating the emitted substance near the geographical emission hotspot, where the substance concentration is relatively high, whereas a source-independent post-emission mitigation strategy reduces the emitted substance unrelated to the source using atmospheric concentrations.
The three categories are explained in the following. By applying the definitions to already existent anthropogenic methane emission reduction methods, solutions to Problems (9), (10) and (18) can be deducted for natural methane emissions.
3.5.1. Pre-Generation Mitigation
Pre-generation methane mitigation is likely the most widely applied mitigation strategy, since avoiding its generation is in general far easier and cost-effective than removal. Furthermore, methane slip represents an economic loss and there is always the risk that explosive mixtures might be generated. Consequently, a lot of research is dedicated on pre-generation methane mitigation, specifically for anthropogenic non-point sources, where mitigation after methane production proves particularly difficult. Pre-generation mitigation is therefore a candidate to solve Problems (1)–(3), (15) and (16), but, due to Problems (10) and (18), for natural emissions, pre-generation is challenging. Existing anthropogenic examples are fish to increase bioturbation in rice paddies [140], to feed cattle a specific diet [141] and to introduce air into landfills to omit anaerobic methane generation by converting organic materials aerobically [142]. It becomes obvious that most of the pre-generation mitigation strategies rely on biological mitigation methods to interrupt bacterial methane generation. This is mostly achieved by introducing oxygen to the anaerobic environment needed by methanogens.
3.5.2. In-Situ Mitigation
In-situ mitigation technologies are used if pre-generation mitigation is not possible or economically unattractive. Examples are the gas, oil or coal industry. Methane from coal mines can be extracted in high concentrations directly from the coal seam for energy generation [77,111]. Ventilation air from coal mines with methane concentrations between 0.1% and 1% can also be used for energy generation, if the combustion process is catalyzed [77,143] or additional fuel is used [111]. Total (catalytic) oxidation is a mature technology and is applied in coal mines, the gas and oil industry and vehicle exhausts [144]. Total oxidation of methane results in an approximately equal amount of CO2 and therefore in a tenfold GWP100 decrease (1 kg of methane with 28 CO2-eq. is oxidized to 2.75 kg CO2 and thus results in 2.75 kg CO2-eq.). The mitigation of fugitive emissions from leakages is another example for an in-situ mitigation. Leakage detection and removal is an often mentioned and quite simple method to efficiently lower anthropogenic methane emissions [25,40,93,145,146].
If non-inert waste is deposited in landfills, methanogenic bacteria produce over decades methane under anaerobic conditions which is, if no measures are taken, later emitted to the atmosphere. To prevent this, organic fractions of the waste need to be eliminated prior to disposal, for example, in waste incineration plants. Another option is to collect the gas generated with a drainage system in the landfill and oxidize or use it as landfill gas and possibly upgrade it to biomethane [147]. Oxidation can be achieved by flaring but also by more elaborated techniques such as photocatalytic oxidation [75,148,149,150] which is still on a lab scale. Examples for in-situ mitigation are thus the collection and technical oxidation of landfill gas but the oxidation by methanotrophs in biotic covers of the landfill [109]. Methane emissions from soils can be reduced by supporting aeration of the soil and by creating a favorable growth environment for methanotrophs, for example, by adding biochar, but also other materials such as sand, slag, sludge, compost or wood pellets [151].
Most of the discussed in-situ mitigation options have one common trait: they are used for confined emissions. Since mitigation technologies for point sources can generally be more efficient than for non-confined emissions [152,153], they are commonly used for removing already existent methane gas. However, a large part of the natural methane emissions stem from NPS (cf. Problem (1) and Table 4) requiring other approaches explained next.
3.5.3. Post-Emission Mitigation
For methane, as for CO2 emissions, research focused so far on pre- and in-situ mitigation. There are multiple reasons for this. First and foremost, capturing already released methane is technologically more challenging (Problem (11)) due to the lower concentration of the methane in the atmosphere (Problem (16)) but also due to the unconfinement of the methane source (Problems (1) and (2)). Therefore, capturing and removal technologies must be more sophisticated and thus are more expensive (Problem (16)). As cost-effective mitigation plays an important role, in-situ or pre-generation mitigation is preferred. In addition, since post-emission mitigation removes all methane from the treated air, the intended removal of methane from a specific source is only possible with the local variant, when the technology is applied near the initial source, where the concentration is slightly higher. Therefore, applying a local post-emission mitigation strategy instead of a source-independent post-emission mitigation strategy, could be more effective.
The discussed mitigation strategies, pre-generation, in-situ or post-emission mitigation are depicted in Figure 7 with exemplary mitigation options from the literature or practice. The general structure of Figure 7 is similar to that of Figure 2 and thus leaves out semi-natural emissions for reasons of simplicity. The emission sources are categorized into PS and NPS emissions according to Table 4 to improve readability and to point out differences for mitigation strategies between the source types, as well as between natural and anthropogenic methane emissions.
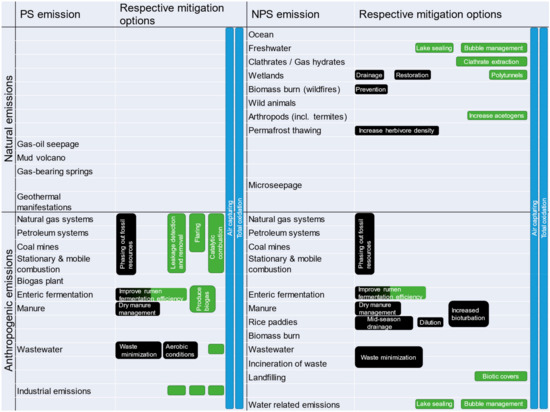
Figure 7.
Mitigation options for natural and anthropogenic methane emission sources, categorized by PS and NPS. Black indicates pre-generation mitigation, green indicates in-situ mitigation, and blue indicates post-emission mitigation.
From the visualization in Figure 7, it becomes clear that there are few mitigation options for natural emissions and that no large-scale approach is already available. For anthropogenic sources, many different approaches are already applied. It should be emphasized that some mitigation options can be applied for several emission sources and that for PS emissions there are more in-situ approaches than for NPS emissions, for which pre-generation approaches predominate. Due to the broad spectrum of mitigation strategies, this fact can easily be overlooked. The reason for this is that methane of several point sources such as in the natural gas and petroleum industry cannot be mitigated before generation, because the methane is already present. Exactly the opposite is true for the right-hand side of Figure 7. There, the large area over which methane is emitted makes any pre-generation mitigation options attractive.
Conclusively, it can be said that anthropogenic emissions can theoretically be avoided more efficiently due to the higher degree of stationarity and confinement. For natural emissions, none of the PS emissions can be reduced with similar mitigation efforts, since they emit methane underwater and in other inaccessible geographic areas. Therefore, natural emissions are mostly seen as non-abatable, which is especially true for non-point sources, underlining Problems (10) and (11). Nevertheless, the emission reduction potential for natural emissions is enormous due to the vast amounts of currently not mitigated methane emissions and should be realized to reduce the rise of atmospheric methane concentrations. To mitigate these emissions, a pre-generation mitigation strategy cannot be applied, with few exceptions, due to the wide area which would have to be controlled in order to temper with the biogenic methane generation processes. In-situ mitigation is also not applicable in most cases due to the large areas and ecological side-effects. Consequently, post-emission mitigation is the only broadly applicable possibility to approach a generalized natural methane emission reduction strategy aiming to solve or avoid Problems (1)–(4), (10), (16), (18). Indeed, if there are for certain applications favorable pre- or in-situ-mitigation options or will be developed, these should be used or tested.
3.6. Future Research in Mitigation of Natural Methane Emissions
As shown above, post-emission methane is the most promising mitigation option for natural methane emissions. To make post-emission mitigation economically attractive, revenues need to be generated, for example from valorization of the captured methane, or by payments for a climate protection service delivered to the public, for example from a carbon tax with payments for negative emissions or by including natural methane emissions in the EU Emissions Trading System (EU ETS) (cf. also [154] for an overview of taxing and emission trading mechanisms worldwide). Although the prices of carbon allowances in the EU never exceeded 30 €/ton of CO2, three-digit prices in the near and mid term and up to four-digit prices in the long term are possible in certain model scenarios [20]. When accounting for the 28 times higher GWP100 of methane and assuming a price of 100 € per ton of CO2, one ton of methane removed by total oxidation would result in 2525 € (8125 €/t CH4 for GWP20), when subtracting the allowance for the released CO2. In post-emission mitigation, both anthropogenic and natural methane would be removed from the atmosphere.
Captured methane could be concentrated and used as a substitute for natural gas or converted to chemicals for further valorization. Possible methods could be methane air capturing [155], similar to direct air capture for CO2, or the use of microbial fuel cells [156,157,158]. However, air capturing of low methane concentrations remains technologically challenging and no large-scale technology for the removal of non-point source emissions exists yet (Problem (9)). Another approach is the total oxidation of atmospheric methane to CO2 reducing net GWP100 by 90% (see above). This is a mature research topic, already applied for low-concentrated anthropogenic methane sources. Catalytic combustion can currently convert down to ~0.1 vol% methane to CO2 but temperatures around 350–400 °C are needed to reach acceptable conversion rates [78]. Catalysts need to be optimized for lower methane concentrations and temperatures. Methane-oxidizing bacteria work at ambient temperatures [80,159] but “high-affinity methanotrophs” for lower methane concentrations need to be identified [80,160]. Another candidate is photocatalytic oxidation working at ambient temperatures [148] and with low methane concentrations, e.g., 250 ppm [150]. However, upscaling might be challenging. Therefore, more research on the presented options in Figure 8 and completely new approaches are needed. Their large-scale application requires technologies with low environmental impacts over their life cycles which requires the use of widely available, cheap and non-toxic raw materials for their production. Depending on the emission source, different technologies will probably be applied to satisfy the constraints determined by the respective methane source. For highly diffuse sources such as wetlands or permafrost, low-maintenance biofilters with passive aeration containing high-affinity methanotrophs could be applied [80]. Depending on the ambient temperature, the setup would need extensive heating to ensure microbiological activity, which, as discussed with Problem (16), would result in unbearable energy costs. In addition, non-biological catalytical systems, which could oxidize low-concentrated methane under ambient temperature, would be beneficial for a post-mitigation approach. Unfortunately, current research is far from developing such a catalyst [78]. Methane emissions from water could be mitigated by employing large-scale sealings, but this would interfere with Problem (18). Onshore geological methane emissions, as one of the few point sources, could be trapped, using similar gas upgrading technologies as used in biogas plants, when finding ways of safely building capture units on top of methane emission spots like mud volcanoes. Offshore geological PS methane emissions would have to be captured under water, which will complicate the process even more. Methane emissions from wild animals and arthropods will probably never be mitigatable with post-emission techniques because of the spatial variability due to moving emitters. Natural biomass burning can only be addressed by wildfire management. Due to the unpredictability and very restraining constraints, a stationary post-emission approach does not seem possible.
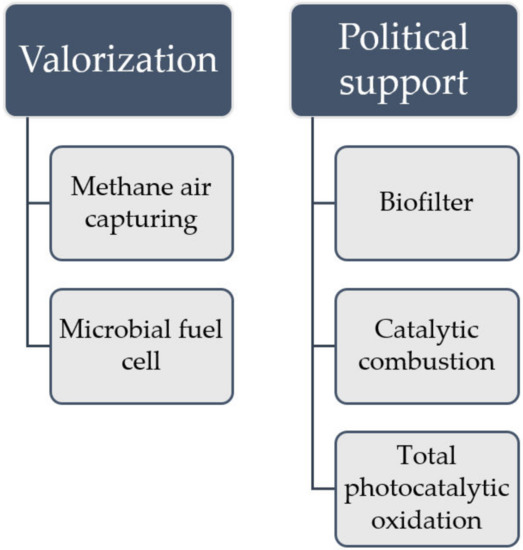
Figure 8.
Potential post-emission methane reduction technologies sorted after the two main economic strategies valorization and direct payments, e.g., from a negative carbon tax.
To advance, the importance of these topics has to be promoted and supported by policies, which is discussed next.
3.7. Promoting the Mid-Term Relevance of Methane Reductions
The large and increasing role methane plays in climate change, in particular on a shorter timescale, makes emission reductions imperative. Promoting the importance of methane reductions is a policy topic. There is a need for incentives and possibly subsidies for climate friendly activities and for enforcing climate protection through policies [161]. Political support may pave the way for new strategies of climate change mitigation and hence new areas of research. Similar strategies as for CO2 emission reduction could be followed for methane emission reduction, to solve Problem (15) and therefore make mitigation of natural methane emissions attractive as a business model. Inspired by the policy instruments discussed by the IPCC [161], instruments such as a carbon tax, emission trading or payments for negative methane emissions could solve Problem (17). Post-emission mitigation via total oxidation methods needs payments for the service provided to humanity. In addition, costs need to be cut, for example by access to larger amounts of renewable energy at low prices, thus also partially solving Problem (17). Finally, there is need for financial support for research and development and those bringing the new technologies to market (Problem (14)). Since research policy is a topic on its own, we do not go into details. Research is urging policymakers not to rely on estimated net economic impacts computed by integrated assessment models (IAMs), but instead “forcefully” implement mitigation policies anyway in order to have an impact as soon as possible [162]. Note that economic assessments are useful, but a decision for or against a mitigation strategy is a political decision, which then would also aid by solving Problems (15) and (17). However, even when stopping all methane emissions at once, the IPCC [3] calculated that it would take 50 years to reach pre-industrial levels, which once again underlines the importance of a fast-paced plan for large scale methane emission removal.
3.8. Stimulate Researchers to Work on Natural Methane Emission Reduction
Most of the identified problems (cf. Table 3) are discussed above in detail with the exception of Problem (14), according to which research and researchers on natural methane mitigation are scarce. We hope that this overview is shedding light in a structured manner on this largely neglected field and the sketching of open questions will stimulate further research and researchers to discover and work on this research field, wherefore this article on its own will help to solve Problem (14).
4. Conclusions
This article clarifies the questions why natural methane emissions are currently not mitigated and proposes approaches, methods and solutions to circumvent or solve these problems. Overall, 18 problems are identified, which represent barriers to natural methane emission removal. Several problems (Problems (1), (2), (12) and (16)) are unsolvable and thus have to be circumvented. Identified approaches for natural methane emissions build on approaches for anthropogenic methane emission reduction and typically make use of post-emission mitigation methods. Structural and communicational problems are identified (Problems (5)−(8)). Among these are categorization and definition problems. Here, possible solutions can be identified, such as proposing clear and quantitative definitions for point sources and non-point sources, as well as clear communication of the perspective taken. A new categorization system for emission sources is proposed, which includes recently identified emission sources. Moreover, a new emission category of semi-natural emissions is proposed to resolve said problems. Technological Problems (9)−(13) are found to be circumventable by either making use of non-technological solutions such as wetland restoration or increasing herbivore density, or to be even solvable by developing more accurate measuring and detection technologies, which also helps solve Problem (5), the overlooked emissions. Technological improvements necessary for an adaptation to natural methane mitigation are described. An analysis of currently used and proposed methane mitigation technologies reveals that post-emission mitigation are currently the most promising approach for natural methane emission (Problems (1)−(4), (10) and (18)). As post-emission mitigation per se does not generate (sufficient) revenues (Problems (15)−(17)), there is a need for policy support including incentives and subsidies for climate mitigation services, for example, from a negative carbon tax or inclusion in emission trading systems. However, what is most important is to raise awareness for the topic of natural methane emission reduction (Problem (14)).
5. Outlook
Ongoing research on total oxidation of methane such as catalytic combustion, biologic or photocatalytic degradation will make further advancements towards natural emission mitigation likely. Future research could define the conditions for large-scale applications for natural non-point source emissions. There is also a need for optimizing the existent methane removal technologies for natural methane emission removal. Progress currently made in the identification of further methane sources need to be refined and included in emission inventories and model output used for IAMs. Finally, policy should provide a favorable framework by incorporating methane into the existing CO2-reduction incentives.
Supplementary Materials
The following are available online at https://www.mdpi.com/2311-5629/6/2/24/s1, Collection of emission definitions, detailed information about the PS/NPS categorization in Table 4
Author Contributions
Conceptualization, J.J.; methodology, J.J.; validation, M.H.; writing—original draft preparation, J.J.; writing—review and editing, M.H.; visualization, J.J.; and supervision, M.H. All authors have read and agreed to the published version of the manuscript.
Funding
This research received no external funding.
Acknowledgments
We would like to thank the anonymous reviewers, whose feedback substantially improved this manuscript.
Conflicts of Interest
The authors declare no conflict of interest.
References
- UNEP. Climate Change 2007. The Physical Science Basis; Contribution of Working Group I to the Fourth Assessment Report of the Intergovernmental Panel on Climate, Change, 1st ed.; Solomon, S., Ed.; UNEP: New York, NY, USA, 2007; ISBN 9780521880091. [Google Scholar]
- NOAA ESRL. The NOAA Annual Greenhouse Gas Index (AGGI). Available online: https://www.esrl.noaa.gov/gmd/aggi/aggi.html (accessed on 2 August 2019).
- IPCC. Climate Change 2013. The Physical Science Basis; Working Group I Contribution to the Fifth Assessment Report of the Intergovernmental Panel on Climate Change (IPCC); Stocker, T., Ed.; Cambridge University Press: New York, NY, USA, 2014; ISBN 9781107661820. [Google Scholar]
- Muntean, M.; Guittardi, D.; Schaaf, E.; Crippa, M.; Solazzo, E.; Olivier, J.G.J.; Vignati, E. Fossil CO2 Emissions of All World Countries. 2018. Available online: http://publications.jrc.ec.europa.eu/repository/bitstream/JRC113738/kjna29433enn.pdf (accessed on 16 October 2019).
- Rosenbaum, R.K.; Hauschild, M.Z.; Boulay, A.M.; Fantke, P.; Laurent, A.; Núñez, M.; Vieira, M. Life cycle impact assessment. In Life Cycle Assessment: Theory and Practice; Hauschild, M.Z., Rosenbaum, R.K., Olsen, S.I., Eds.; Springer International Publishing: Cham, Switzerland, 2018; pp. 167–270. ISBN 978-3-319-56475-3. [Google Scholar]
- Nisbet, E.G.; Manning, M.R.; Dlugokencky, E.J.; Fisher, R.E.; Lowry, D.; Michel, S.E.; Myhre, C.L.; Platt, S.M.; Allen, G.; Bousquet, P.; et al. Very strong atmospheric methane growth in the four years 2014–2017: Implications for the Paris Agreement. Glob. Biogeochem. Cycles 2019. [Google Scholar] [CrossRef]
- Umweltbundesamt. Atmosphärische Treibhausgas-Konzentrationen. Available online: https://www.umweltbundesamt.de/daten/klima/atmosphaerische-treibhausgas-konzentrationen (accessed on 13 June 2019).
- NOAA ESRL. Trends in Atmospheric Methane. Available online: https://www.esrl.noaa.gov/gmd/ccgg/trends_ch4/ (accessed on 13 June 2019).
- Ghosh, A.; Patra, P.K.; Ishijima, K.; Umezawa, T.; Ito, A.; Etheridge, D.M.; Sugawara, S.; Kawamura, K.; Miller, J.B.; Dlugokencky, E.J.; et al. Variations in global methane sources and sinks during 1910–2010. Atmos. Chem. Phys. 2015, 15, 2595–2612. [Google Scholar] [CrossRef]
- Turner, A.J.; Frankenberg, C.; Kort, E.A. Interpreting contemporary trends in atmospheric methane. Proc. Natl. Acad. Sci. USA 2019, 116, 2805–2813. [Google Scholar] [CrossRef]
- Etiope, G.; Ciotoli, G.; Schwietzke, S.; Schoell, M. Gridded maps of geological methane emissions and their isotopic signature. Earth Syst. Sci. Data 2019, 11, 1–22. [Google Scholar] [CrossRef]
- Kirschke, S.; Bousquet, P.; Ciais, P.; Saunois, M.; Canadell, J.G.; Dlugokencky, E.J.; Bergamaschi, P.; Bergmann, D.; Blake, D.R.; Bruhwiler, L.; et al. Three decades of global methane sources and sinks. Nat. Geosci. 2013, 6, 813. [Google Scholar] [CrossRef]
- Saunois, M.; Bousquet, P.; Poulter, B.; Peregon, A.; Ciais, P.; Canadell, J.G.; Dlugokencky, E.J.; Etiope, G.; Bastviken, D.; Houweling, S.; et al. The global methane budget 2000–2012. Earth Syst. Sci. Data 2016, 8, 697–751. [Google Scholar] [CrossRef]
- Weber, T.; Wiseman, N.A.; Kock, A. Global ocean methane emissions dominated by shallow coastal waters. Nat. Commun. 2019, 10, 4584. [Google Scholar] [CrossRef] [PubMed]
- Schimel, J. Playing scales in the methane cycle: From microbial ecology to the globe. Proc. Natl. Acad. Sci. USA 2004, 101, 12400–12401. [Google Scholar] [CrossRef]
- Pieprzyk, B.; Hilje, P.R. Influence of methane emissions on the GHG emissions of fossil fuels. Biofuels Bioprod. Bioref. 2019, 13, 535–551. [Google Scholar] [CrossRef]
- Denisov, S.N.; Eliseev, A.V.; Mokhov, I.I. Contribution of Natural and Anthropogenic Emissions of CO2 and CH4 to the Atmosphere from the Territory of Russia to Global Climate Changes in the Twenty-first Century. Dokl. Earth Sci. 2019, 488, 1066–1071. [Google Scholar] [CrossRef]
- Schneider von Deimling, T.; Grosse, G.; Strauss, J.; Schirrmeister, L.; Morgenstern, A.; Schaphoff, S.; Meinshausen, M.; Boike, J. Observation-based modelling of permafrost carbon fluxes with accounting for deep carbon deposits and thermokarst activity. Biogeosciences 2015, 12, 3469–3488. [Google Scholar] [CrossRef]
- Liu, L.; Wang, D.; Chen, S.; Yu, Z.; Xu, Y.; Li, Y.; Ge, Z.; Chen, Z. Methane emissions from estuarine coastal wetlands: Implications for global change effect. Soil Sci. Soc. Am. J. 2019, 83, 1368. [Google Scholar] [CrossRef]
- IPCC. AR5 Scenario Database (v1.02). Available online: https://tntcat.iiasa.ac.at/AR5DB/ (accessed on 24 June 2019).
- Pierrehumbert, R. There is no Plan B for dealing with the climate crisis. Bull. At. Sci. 2019, 75, 215–221. [Google Scholar] [CrossRef]
- UNEP. The Emissions Gap Report 2019; United Nations Environment Programme: Nairobi, Kenya, 2019; ISBN 978-92-807-3766-0. [Google Scholar]
- Cheewaphongphan, P.; Chatani, S.; Saigusa, N. Exploring gaps between bottom-up and top-down emission estimates based on uncertainties in multiple emission inventories: A case study on CH4 emissions in China. Sustainability 2019, 11, 2054. [Google Scholar] [CrossRef]
- Christensen, T.R.; Arora, V.K.; Gauss, M.; Höglund-Isaksson, L.; Parmentier, F.J.W. Tracing the climate signal: Mitigation of anthropogenic methane emissions can outweigh a large Arctic natural emission increase. Sci. Rep. 2019, 9, 1146. [Google Scholar] [CrossRef] [PubMed]
- Karakurt, I.; Aydin, G.; Aydiner, K. Sources and mitigation of methane emissions by sectors: A critical review. Renew. Energy 2012, 39, 40–48. [Google Scholar] [CrossRef]
- U.S. EPA. Inventory of U.S. Greenhouse Gas Emissions and Sinks: 1990–2015. 2017. Available online: https://www.epa.gov/sites/production/files/2017-02/documents/2017_complete_report.pdf (accessed on 1 April 2019).
- IPCC. 2006 IPCC Guidelines for National Greenhouse Gas Inventories; Eggleston, H.S., Ed.; Institute for Global Environmental Strategies: Hayama, Japan, 2006; ISBN 4-88788-032-4. [Google Scholar]
- U.S. EPA. Methane and Nitrous Oxide Emissions from Natural Sources; United States Environmental Protection Agency: Washington, DC, USA, 2010.
- Etiope, G.; Schwietzke, S.; Helmig, D.; Palmer, P. Global geological methane emissions: An update of top-down and bottom-up estimates. Elem. Sci. Anth. 2019, 7. [Google Scholar] [CrossRef]
- Tyler, S.C. 13 C/12 C ratios in atmospheric methane and some of its sources. In Stable Isotopes in Ecological Research; Springer: Berlin, Germany, 1989; pp. 395–409. [Google Scholar]
- Coffin, R.; Mueller, J. Carbon isotope forensics for methane source identification. Remediation 2020, 30, 55–62. [Google Scholar] [CrossRef]
- Lassey, K.R.; Allan, W.; Fletcher, S.E.M. Seasonal inter-relationships in atmospheric methane and companion δ 13 C values: Effects of sinks and sources. Tellus B Chem. Phys. Meteorol. 2011, 63, 287–301. [Google Scholar] [CrossRef]
- Turner, A.J.; Frankenberg, C.; Wennberg, P.O.; Jacob, D.J. Ambiguity in the causes for decadal trends in atmospheric methane and hydroxyl. Proc. Natl. Acad. Sci. USA 2017, 114, 5367–5372. [Google Scholar] [CrossRef]
- Godwin, H. Half-life of Radiocarbon. Nature 1962, 195, 984. [Google Scholar] [CrossRef]
- Hmiel, B.; Petrenko, V.V.; Dyonisius, M.N.; Buizert, C.; Smith, A.M.; Place, P.F.; Harth, C.; Beaudette, R.; Hua, Q.; Yang, B.; et al. Preindustrial 14CH4 indicates greater anthropogenic fossil CH4 emissions. Nature 2020, 578, 409–412. [Google Scholar] [CrossRef]
- Lassey, K.R.; Etheridge, D.M.; Lowe, D.C.; Smith, A.M.; Ferretti, D.F. Centennial evolution of the atmospheric methane budget: What do the carbon isotopes tell us? Atmos. Chem. Phys. 2007, 7, 2119–2139. [Google Scholar] [CrossRef]
- Sherwood, O.A.; Schwietzke, S.; Arling, V.A.; Etiope, G. Global inventory of gas geochemistry data from fossil fuel, microbial and burning sources, version 2017. Earth Syst. Sci. Data 2017, 9, 639–656. [Google Scholar] [CrossRef]
- Saunois, M.; Stavert, A.R.; Poulter, B.; Bousquet, P.; Canadell, J.G.; Jackson, R.B.; Raymond, P.A.; Dlugokencky, E.J.; Houweling, S.; Patra, P.K.; et al. The Global Methane Budget: 2000–2017. Earth Syst. Sci. Data 2019. [Google Scholar] [CrossRef]
- Kuo, J. Technological options for reducing Non-CO2 GHG emissions. In Handbook of Climate Change Mitigation; Chen, W.Y., Seiner, J., Suzuki, T., Lackner, M., Eds.; Springer: New York, NY, USA, 2012; pp. 1781–1819. ISBN 978-1-4419-7991-9. [Google Scholar]
- Fox, T.A.; Barchyn, T.E.; Risk, D.; Ravikumar, A.P.; Hugenholtz, C.H. A review of close-range and screening technologies for mitigating fugitive methane emissions in upstream oil and gas. Environ. Res. Lett. 2019, 14, 53002. [Google Scholar] [CrossRef]
- Cottle, D.J.; Nolan, J.V.; Wiedemann, S.G. Ruminant enteric methane mitigation: A review. Anim. Prod. Sci. 2011, 51, 491. [Google Scholar] [CrossRef]
- Misra, A.K.; Verma, M. Modeling the impact of mitigation options on methane abatement from rice fields. Mitig. Adapt. Strateg. Glob. Chang. 2014, 19, 927–945. [Google Scholar] [CrossRef]
- Global Methane Initiative. Ideas for Participation in the Global Methane Challenge. Available online: https://www.globalmethane.org/challenge/documents/GMC_Ideas.pdf (accessed on 9 April 2019).
- U.S. EPA. Greenhouse Gas Inventory Guidance—Direct Emissions from Mobile Combustion Sources. 2016. Available online: https://www.epa.gov/sites/production/files/2016-03/documents/mobileemissions_3_2016.pdf (accessed on 2 May 2019).
- Barthe, P.; Chaugny, M.; Roudier, S.; Sancho, L.D. Best Available Techniques (BAT) Reference Document for the Refining of Mineral Oil and Gas; European Commission: Brussel, Belgium, 2015. [Google Scholar]
- Remus, R. Best Available Techniques (BAT) Reference Document for Iron and Steel Production. Industrial Emissions Directive 2010/75/EU (Integrated Pollution Prevention and Control); Publications Office of the European Union: Luxembourg, 2013; ISBN 9789279264764. [Google Scholar]
- Janardanan, R.; Maksyutov, S.; Tsuruta, A.; Wang, F.; Tiwari, Y.K.; Valsala, V.; Ito, A.; Yoshida, Y.; Kaiser, J.W.; Janssens-Maenhout, G.; et al. Country-scale analysis of methane emissions with a high-resolution inverse model using gosat and surface observations. Remote Sens. 2020, 12, 375. [Google Scholar] [CrossRef]
- Ortiz-Llorente, M.J.; Alvarez-Cobelas, M. Comparison of biogenic methane emissions from unmanaged estuaries, lakes, oceans, rivers and wetlands. Atmos. Environ. 2012, 59, 328–337. [Google Scholar] [CrossRef]
- Eakins, B.W.; Sharman, G.F. Volumes of the World’s Oceans from ETOPO1. Available online: https://www.ngdc.noaa.gov/mgg/global/etopo1_ocean_volumes.html (accessed on 11 December 2019).
- Downing, J. Global abundance and size distribution of streams and rivers. IW 2012, 2, 229–236. [Google Scholar] [CrossRef]
- Messager, M.L.; Lehner, B.; Grill, G.; Nedeva, I.; Schmitt, O. Estimating the volume and age of water stored in global lakes using a geo-statistical approach: Estimating the volume and age of water stored in global lakes using a geo-statistical approach. Nat. Commun. 2016, 7, 13603. [Google Scholar] [CrossRef] [PubMed]
- Blais, A.M.; Lorrain, S.; Tremblay, A. Greenhouse gas fluxes (CO2, CH4 and N2O) in forests and wetlands of boreal, temperate and tropical regions. In Greenhouse Gas Emissions—Fluxes and Processes: Hydroelectric Reservoirs and Natural Environments; Tremblay, A., Ed.; Springer: Berlin/Heidelberg, Germany, 2005; pp. 87–127. ISBN 978-3-540-23455-5. [Google Scholar]
- Ellis, E.C.; Klein Goldewijk, K.; Siebert, S.; Lightman, D.; Ramankutty, N. Anthropogenic transformation of the biomes, 1700 to 2000. Glob. Ecol. Biogeogr. 2010, 19. [Google Scholar] [CrossRef]
- Wassmann, R.; Neue, H.U.; Alberto, M.C.; Lantin, R.S.; Bueno, C.; Llenaresas, D.; Arah, J.R.; Papen, H.; Seiler, W.; Rennenberg, H. Fluxes and pools of methane in wetland rice soils with varying organic inputs. Environ. Monit. Assess. 1996, 42, 163–173. [Google Scholar] [CrossRef]
- Statista. World Rice Acreage from 2010 to 2017 (In Million Hectares). Available online: https://www.statista.com/statistics/271969/world-rice-acreage-since-2008/ (accessed on 27 March 2020).
- St. Louis, V.; Kelly, C.A.; Duchemin, E.; Rudd, J.W.M.; Rosenberg, D.M. Reservoir surfaces as sources of greenhouse gases to the atmosphere: A global estimate. BioScience 2000, 50, 766. [Google Scholar] [CrossRef]
- Deemer, B.R.; Harrison, J.A.; Li, S.; Beaulieu, J.J.; DelSontro, T.; Barros, N.; Bezerra-Neto, J.F.; Powers, S.M.; dos Santos, M.A.; Vonk, J.A. Greenhouse gas emissions from reservoir water surfaces: A new global synthesis. BioScience 2016, 66, 949–964. [Google Scholar] [CrossRef]
- Lehner, B.; Reidy Liermann, C.; Revenga, C.; Vorosmarty, C.; Fekete, B.; Crouzet, P.; Doll, P.; Endejan, M.; Frenken, K.; Magome, J.; et al. Global Reservoir and Dam Database, Version 1 (GRanDv1): Reservoirs, Revision 01; NASA: Washington, DC, USA, 2011.
- Kulongoski, J.T.; McMahon, P.B. Methane emissions from groundwater pumping in the USA. npj Clim. Atmos. Sci. 2019, 2, 2225. [Google Scholar] [CrossRef]
- Schrier-Uijl, A.P.; Veraart, A.J.; Leffelaar, P.A.; Berendse, F.; Veenendaal, E.M. Release of CO2 and CH4 from lakes and drainage ditches in temperate wetlands. Biogeochemistry 2011, 102, 265–279. [Google Scholar] [CrossRef]
- Aguilera, E.; Vila-Traver, J.; Deemer, B.R.; Infante-Amate, J.; Guzmán, G.I.; González de Molina, M. Methane emissions from artificial waterbodies dominate the carbon footprint of irrigation: A study of transitions in the food-energy-water-climate nexus (Spain, 1900–2014). Environ. Sci. Technol. 2019, 53, 5091–5101. [Google Scholar] [CrossRef]
- Webb, J.R.; Leavitt, P.R.; Simpson, G.L.; Baulch, H.M.; Haig, H.A.; Hodder, K.R.; Finlay, K. Regulation of carbon dioxide and methane in small agricultural reservoirs: Optimizing potential for greenhouse gas uptake. Biogeosciences 2019, 16, 4211–4227. [Google Scholar] [CrossRef]
- Lamarche-Gagnon, G.; Wadham, J.L.; Lollar, B.S.; Arndt, S.; Fietzek, P.; Beaton, A.D.; Tedstone, A.J.; Telling, J.; Bagshaw, E.A.; Hawkings, J.R.; et al. Greenland melt drives continuous export of methane from the ice-sheet bed. Nature 2019, 565, 73–77. [Google Scholar] [CrossRef] [PubMed]
- United Nations. Glossary of Environment Statistics; Sudies in Methods Series F, No. 67. 1997. Available online: https://unstats.un.org/unsd/publication/seriesf/seriesf_67e.pdf (accessed on 26 March 2019).
- Amtsblatt der Europäischen Union. VERORDNUNG (EG) Nr. 166/2006. Off. J. Eur. Union 2006, 15, 212–228. [Google Scholar]
- IPCC. Revised 1996 Guidelines for National Greenhouse Gas Inventories: Reporting Instructions—Glossary; IPCC: Geneva, Switzerland, 1996. [Google Scholar]
- California Air Resources Board. Glossary. Available online: https://ww2.arb.ca.gov/about/glossary?f%5B0%5D=name%3AF#search_anchor (accessed on 8 April 2019).
- Benyahia, F. Proceedings of the 2nd Annual Gas Processing Symposium; Qatar, 10–14 January 2010; Elsevier Professional: Amsterdam, Netherlands, 2010; ISBN 978-0-444-53588-7. [Google Scholar]
- U.S. EPA. Methods for Estimating Fugitive Air Emissions of Radionuclides from Diffuse Sources at Doe Facilities. 2004. Available online: https://www.epa.gov/sites/production/files/2015-05/documents/final_report_9_04.pdf (accessed on 8 April 2019).
- U.S. EPA. Point and Nonpoint Sources of Water Pollution. Available online: https://www.epa.vic.gov.au/your-environment/water/protecting-victorias-waters/point-and-nonpoint-sources-of-water-pollution (accessed on 8 April 2019).
- Barnes, L.; Beckstead, G.; Beauregard, D.; Betterton, B.; Brochi, P.; Forbes, R.; Fredlund, A.; Hochhauser, M.; Huntley, R. EIIP Volume II: CH 1 Introduction to Stationary Point Source Emission Inventory Development; EPA: Washington, DC, USA, 2001. [Google Scholar]
- Mareddy, A.R.; Shah, A. Environmental Impact Assessment. Theory and Practice; Elsevier Science: Saint Louis, MO, USA, 2017; ISBN 9780128111390. [Google Scholar]
- Stolaroff, J.K.; Bhattacharyya, S.; Smith, C.A.; Bourcier, W.L.; Cameron-Smith, P.J.; Aines, R.D. Review of methane mitigation technologies with application to rapid release of methane from the Arctic. Environ. Sci. Technol. 2012, 46, 6455–6469. [Google Scholar] [CrossRef] [PubMed]
- Kim, J.; Maiti, A.; Lin, L.C.; Stolaroff, J.K.; Smit, B.; Aines, R.D. New materials for methane capture from dilute and medium-concentration sources. Nat. Commun. 2013, 4, 1694. [Google Scholar] [CrossRef]
- Chen, X.; Li, Y.; Pan, X.; Cortie, D.; Huang, X.; Yi, Z. Photocatalytic oxidation of methane over silver decorated zinc oxide nanocatalysts. Nat. Commun. 2016, 7, 12273. [Google Scholar] [CrossRef]
- IPCC. Climate Change 2014. Mitigation of Climate Change Working Group III Contribution to the Fifth Assessment Report of the Intergovernmental Panel on Climate Change (IPCC); Edenhofer, O., Ed.; Cambridge University Press: New York, NY, USA, 2014; ISBN 1107654815. [Google Scholar]
- Jiang, X.; Mira, D.; Cluff, D.L. The combustion mitigation of methane as a non-CO2 greenhouse gas. Prog. Energy Combust. Sci. 2018, 66, 176–199. [Google Scholar] [CrossRef]
- He, L.; Fan, Y.; Bellettre, J.; Yue, J.; Luo, L. A review on catalytic methane combustion at low temperatures: Catalysts, mechanisms, reaction conditions and reactor designs. Renew. Sustain. Energy Rev. 2020, 119, 109589. [Google Scholar] [CrossRef]
- Girard, M.; Ramirez, A.A.; Buelna, G.; Heitz, M. Biofiltration of methane at low concentrations representative of the piggery industry—Influence of the methane and nitrogen concentrations. Chem. Eng. J. 2011, 168, 151–158. [Google Scholar] [CrossRef]
- Yoon, S.; Carey, J.N.; Semrau, J.D. Feasibility of atmospheric methane removal using methanotrophic biotrickling filters. Appl. Microbiol. Biotechnol. 2009, 83, 949–956. [Google Scholar] [CrossRef]
- Chang, M.; Zhao, Y.; Liu, D.; Yang, J.; Li, J.; Zhong, C. Methane-trapping metal–organic frameworks with an aliphatic ligand for efficient CH 4 /N 2 separation. Sustain. Energy Fuels 2020, 4, 138–142. [Google Scholar] [CrossRef]
- Bridgham, S.D.; Cadillo-Quiroz, H.; Keller, J.K.; Zhuang, Q. Methane emissions from wetlands: Biogeochemical, microbial, and modeling perspectives from local to global scales. Glob. Chang. Biol. 2013, 19, 1325–1346. [Google Scholar] [CrossRef] [PubMed]
- IEA. Policies Database. Available online: https://www.iea.org/policies?topic=Methane&page=1 (accessed on 3 March 2020).
- Comes, T.; Doll, C.; Fröhling, M.; Hiete, M.; Ilsen, R.; Krail, M. Challenges for national clean air policy. Okologisches Wirtsch. 2010, 25. [Google Scholar] [CrossRef]
- European Commission. 100 Radical Innovation Breakthroughs for the Future; European Commission: Brussel, Belgium, 2019. [Google Scholar]
- Yang, H.; Tang, J.; Zhang, C.; Dai, Y.; Zhou, C.; Xu, P.; Perry, D.C.; Chen, X. Enhanced carbon uptake and reduced methane emissions in a newly restored wetland. J. Geophys. Res. Biogeosci. 2020. [Google Scholar] [CrossRef]
- UN General Assembly. Transforming our World: The 2030 Agenda for Sustainable Development. 2015. Available online: https://www.refworld.org/docid/57b6e3e44.html (accessed on 21 January 2020).
- Lockley, A. Comment on “Review of methane mitigation technologies with application to rapid release of methane from the Arctic”. Environ. Sci. Technol. 2012, 46, 13552–13553, Author Reply 13554. [Google Scholar] [CrossRef]
- Yusuf, R.O.; Noor, Z.Z.; Abba, A.H.; Hassan, M.A.A.; Din, M.F.M. Methane emission by sectors: A comprehensive review of emission sources and mitigation methods. Renew. Sustain. Energy Rev. 2012, 16, 5059–5070. [Google Scholar] [CrossRef]
- Hellstedt, C.; Cerruto, J.; Nilsson, M.; McCann, M. Nordic Initiatives to Abate Methane Emissions. A Cathalogue of Best Pratices; Nordic Council of Ministers: Copenhagen, Denmark, 2014; ISBN 978-92-893-3775-5. [Google Scholar]
- Baldé, H.; VanderZaag, A.C.; Burtt, S.D.; Wagner-Riddle, C.; Crolla, A.; Desjardins, R.L.; MacDonald, D.J. Methane emissions from digestate at an agricultural biogas plant. Bioresour. Technol. 2016, 216, 914–922. [Google Scholar] [CrossRef]
- Flesch, T.K.; Desjardins, R.L.; Worth, D. Fugitive methane emissions from an agricultural biodigester. Biomass Bioenergy 2011, 35, 3927–3935. [Google Scholar] [CrossRef]
- Fredenslund, A.M.; Hinge, J.; Holmgren, M.A.; Rasmussen, S.G.; Scheutz, C. On-site and ground-based remote sensing measurements of methane emissions from four biogas plants: A comparison study. Bioresour. Technol. 2018, 270, 88–95. [Google Scholar] [CrossRef]
- Groth, A.; Maurer, C.; Reiser, M.; Kranert, M. Determination of methane emission rates on a biogas plant using data from laser absorption spectrometry. Bioresour. Technol. 2015, 178, 359–361. [Google Scholar] [CrossRef]
- Hrad, M.; Piringer, M.; Huber-Humer, M. Determining methane emissions from biogas plants--Operational and meteorological aspects. Bioresour. Technol. 2015, 191, 234–243. [Google Scholar] [CrossRef]
- Reinelt, T.; Delre, A.; Westerkamp, T.; Holmgren, M.A.; Liebetrau, J.; Scheutz, C. Comparative use of different emission measurement approaches to determine methane emissions from a biogas plant. Waste Manag. 2017, 68, 173–185. [Google Scholar] [CrossRef] [PubMed]
- Riris, H.; Numata, K.; Wu, S.; Fahey, M.; Gonzalez, B.; Sun, X.; Mao, J.; Rodriguez, M. The challenges of measuring methane from space with a lidar. In Proceedings of the International Conference on Space Optics—ICSO 2018, Chania, Greece, 9–12 October 2018; Karafolas, N., Sodnik, Z., Cugny, B., Eds.; SPIE: Bellingham, WA, USA, 2018; p. 78, ISBN 9781510630772. [Google Scholar]
- Howarth, R.W. Ideas and perspectives: Is shale gas a major driver of recent increase in global atmospheric methane? Biogeosciences 2019, 16, 3033–3046. [Google Scholar] [CrossRef]
- Schaefer, H.; Mikaloff Fletcher, S.E.; Veidt, C.; Lassey, K.R.; Brailsford, G.W.; Bromley, T.M.; Dlugokencky, E.J.; Michel, S.E.; Miller, J.B.; Levin, I.; et al. A 21st-century shift from fossil-fuel to biogenic methane emissions indicated by 13CH4. Science 2016, 352, 80–84. [Google Scholar] [CrossRef] [PubMed]
- Xueref-Remy, I.; Zazzeri, G.; Bréon, F.M.; Vogel, F.; Ciais, P.; Lowry, D.; Nisbet, E.G. Anthropogenic methane plume detection from point sources in the Paris megacity area and characterization of their δ13C signature. Atmos. Environ. 2020, 222, 117055. [Google Scholar] [CrossRef]
- Germain, S.; Durak, B.; Gains, D.; Jervis, D.; McKeever, J.; Sloan, J.J. Quantifying industrial methane emissions from space with the GHGSat-D Satellite. In Proceedings of the American Geophysical Union, Fall Meeting 2017, New Orleans, LA, USA, 11–15 December 2017. A43N–08. [Google Scholar]
- Varon, D.J.; Jacob, D.J.; McKeever, J.; Jervis, D.; Durak, B.O.A.; Xia, Y.; Huang, Y. Quantifying methane point sources from fine-scale (GHGSat) satellite observations of atmospheric methane plumes. Atmos. Meas. Tech. Discuss. 2018, 11, 5673–5686. [Google Scholar] [CrossRef]
- Benmergui, J.S.; Wofsy, S.C.; Gautam, R.; Hamburg, S. MethaneSAT: A learning satellite for detecting and quantifying methane sources. In Proceedings of the American Geophysical Union, Fall Meeting 2018, New Washington, DC, USA, 10–14 December 2018. A43R–3442. [Google Scholar]
- Wofsy, S.C.; Hamburg, S. MethaneSAT—A new observing platform for high resolution measurements of methane and carbon dioxide. In Proceedings of the American Geophysical Union, Fall Meeting 2019, San Francisco, CA, USA, 9–13 December 2019. [Google Scholar]
- Langerock, B.; Sha, M.K.; Lambert, J.C.; Lorente, A.; Landgraf, J. TROPOMI Level 2 Methane Total Column. Available online: http://mpc-vdaf.tropomi.eu/index.php/methane (accessed on 12 December 2019).
- MethaneSAT. Available online: https://www.methanesat.org/fit-with-other-missions/ (accessed on 28 January 2020).
- Elder, C.D.; Thompson, D.R.; Thorpe, A.K.; Hanke, P.; Walter Anthony, K.M.; Miller, C.E. Airborne mapping reveals emergent power law of arctic methane emissions. Geophys. Res. Lett. 2020, 47. [Google Scholar] [CrossRef]
- Beer, C.; Zimov, N.; Olofsson, J.; Porada, P.; Zimov, S. Protection of Permafrost Soils from Thawing by Increasing Herbivore Density. Sci. Rep. 2020, 10, 405. [Google Scholar] [CrossRef]
- Hilger, H.; Humer, M. Biotic landfill cover treatments for mitigating methane emissions. Environ. Monit. Assess. 2003, 84, 71–84. [Google Scholar] [CrossRef]
- U.S. EPA. U.S. Surface Mines Emissions Assessment; EPA: Washington, DC, USA, 2005.
- Su, S.; Beath, A.; Guo, H.; Mallett, C. An assessment of mine methane mitigation and utilisation technologies. Prog. Energy Combust. Sci. 2005, 31, 123–170. [Google Scholar] [CrossRef]
- Farquharson, L.M.; Romanovsky, V.E.; Cable, W.L.; Walker, D.A.; Kokelj, S.; Nicolsky, D. Climate change drives widespread and rapid thermokarst development in very cold permafrost in the Canadian High Arctic. Geophys. Res. Lett. 2019. [Google Scholar] [CrossRef]
- Geng, M.S.; Christensen, J.H.; Christensen, T.R. Potential future methane emission hot spots in Greenland. Environ. Res. Lett. 2019, 14, 35001. [Google Scholar] [CrossRef]
- Knoblauch, C.; Beer, C.; Liebner, S.; Grigoriev, M.N.; Pfeiffer, E.M. Methane production as key to the greenhouse gas budget of thawing permafrost. Nat. Clim. Chang. 2018, 8, 309. [Google Scholar] [CrossRef]
- Ruppel, C.D.; Kessler, J.D. The interaction of climate change and methane hydrates. Rev. Geophys. 2017, 55, 126–168. [Google Scholar] [CrossRef]
- O’Connor, F.M.; Boucher, O.; Gedney, N.; Jones, C.D.; Folberth, G.A.; Coppell, R.; Friedlingstein, P.; Collins, W.J.; Chappellaz, J.; Ridley, J.; et al. Possible role of wetlands, permafrost, and methane hydrates in the methane cycle under future climate change: A review. Rev. Geophys. 2010, 48, L09502. [Google Scholar] [CrossRef]
- Klusman, R.W. Rate measurements and detection of gas microseepage to the atmosphere from an enhanced oil recovery/sequestration project, Rangely, Colorado, USA. Appl. Geochem. 2003, 18, 1825–1838. [Google Scholar] [CrossRef]
- Etiope, G. Natural Gas Seepage: The Earth’s Hydrocarbon Degassing; Springer: Cham, Switzerland, 2015; ISBN 9783319146003. [Google Scholar]
- United States Government. U.S. Code Title 33 Chapter 26 Subchapter V Section 1362 Definitions; United States Government Publishing Office: Washington, DC, USA, 2014.
- Cheremisinoff, N.P.; Rosenfeld, P.E. Chapter 4—Air pollution from wood treatment. In Best Practices in the Wood and Paper Industries, 1st ed.; Cheremisinoff, N.P., Rosenfeld, P., Eds.; Elsevier: Amsterdam, Netherlands, 2010; pp. 83–124. ISBN 978-0-08-096446-1. [Google Scholar]
- Bureau of Air Quality. Proposed State Implementation Plan Revision: Maintenance Plan and Comprehensive Inventory Pennsylvania Portion of the Philadelphia-Wilmington, PA-NJ-DE Nonattainment Area 1997 and 2006 Fine Particulate Matter National Ambient Air Quality Standards. Commonw. Pa. 2014, 44, 2739–2836. [Google Scholar]
- Walter, K.M.; Smith, L.C.; Chapin, F.S. Methane bubbling from northern lakes: Present and future contributions to the global methane budget. Philos. Trans. A Math. Phys. Eng. Sci. 2007, 365, 1657–1676. [Google Scholar] [CrossRef]
- Whalen, S.C.; Reeburgh, W.S.; Kizer, K.S. Methane consumption and emission by Taiga. Global Biogeochem. Cycles 1991, 5, 261–273. [Google Scholar] [CrossRef]
- Kumar, V.; Sachdev, S.; Kumar, S. A study on methane emissions and its mitigation strategies in present scenario. SJSMS 2017, 8. [Google Scholar] [CrossRef]
- Cusworth, D.H.; Jacob, D.J.; Varon, D.J.; Chan Miller, C.; Liu, X.; Chance, K.; Thorpe, A.K.; Duren, R.M.; Miller, C.E.; Thompson, D.R.; et al. Potential of next-generation imaging spectrometers to detect and quantify methane point sources from space. Atmos. Meas. Tech. 2019, 12, 5655–5668. [Google Scholar] [CrossRef]
- Lavoie, T.N.; Shepson, P.B.; Cambaliza, M.O.L.; Stirm, B.H.; Karion, A.; Sweeney, C.; Yacovitch, T.I.; Herndon, S.C.; Lan, X.; Lyon, D. Aircraft-Based Measurements of Point Source Methane Emissions in the Barnett Shale Basin. Environ. Sci. Technol. 2015, 49, 7904–7913. [Google Scholar] [CrossRef] [PubMed]
- Duren, R.M.; Thorpe, A.K.; Foster, K.T.; Rafiq, T.; Hopkins, F.M.; Yadav, V.; Bue, B.D.; Thompson, D.R.; Conley, S.; Colombi, N.K.; et al. California’s methane super-emitters. Nature 2019, 575, 180–184. [Google Scholar] [CrossRef] [PubMed]
- Suh, Y.J.; Rousseaux, P. An LCA of alternative wastewater sludge treatment scenarios. Resour. Conserv. Recycl. 2002, 35, 191–200. [Google Scholar] [CrossRef]
- McGinn, S.M.; Flesch, T.K.; Coates, T.W.; Charmley, E.; Chen, D.; Bai, M.; Bishop-Hurley, G. Evaluating dispersion modeling options to estimate methane emissions from grazing beef cattle. J. Environ. Qual. 2015, 44, 97–102. [Google Scholar] [CrossRef] [PubMed]
- Pratt, C.; Redding, M.; Hill, J.; Shilton, A.; Chung, M.; Guieysse, B. Good science for improving policy: Greenhouse gas emissions from agricultural manures. Anim. Prod. Sci. 2015, 55, 691. [Google Scholar] [CrossRef]
- McGinn, S.M. Measuring greenhouse gas emissions from point sources in agriculture. Can. J. Soil. Sci. 2006, 86, 355–371. [Google Scholar] [CrossRef]
- Rumburg, B.; Mount, G.H.; Yonge, D.; Lamb, B.; Westberg, H.; Neger, M.; Filipy, J.; Kincaid, R.; Johnson, K. Measurements and modeling of atmospheric flux of ammonia from an anaerobic dairy waste lagoon. Atmos. Environ. 2008, 42, 3380–3393. [Google Scholar] [CrossRef]
- Majumder, R.; Livesley, S.J.; Gregory, D.; Arndt, S.K. Biosolid stockpiles are a significant point source for greenhouse gas emissions. J. Environ. Manag. 2014, 143, 34–43. [Google Scholar] [CrossRef] [PubMed]
- Foster-Wittig, T.A.; Thoma, E.D.; Albertson, J.D. Estimation of point source fugitive emission rates from a single sensor time series: A conditionally-sampled Gaussian plume reconstruction. Atmos. Environ. 2015, 115, 101–109. [Google Scholar] [CrossRef]
- Aronica, S.; Bonanno, A.; Piazza, V.; Pignato, L.; Trapani, S. Estimation of biogas produced by the landfill of Palermo, applying a Gaussian model. Waste Manag. 2009, 29, 233–239. [Google Scholar] [CrossRef]
- Sánchez, C.; De La Fuente, M.D.M.; Narros, A.; Del Peso, I.; Rodríguez, E. Comparison of modeling with empirical calculation of diffuse and fugitive methane emissions in a Spanish landfill. J. Air Waste Manag. Assoc. 2019, 69, 362–372. [Google Scholar] [CrossRef] [PubMed]
- Kanniche, M.; Gros-Bonnivard, R.; Jaud, P.; Valle-Marcos, J.; Amann, J.M.; Bouallou, C. Pre-combustion, post-combustion and oxy-combustion in thermal power plant for CO2 capture. Appl. Therm. Eng. 2010, 30, 53–62. [Google Scholar] [CrossRef]
- Wilberforce, T.; Baroutaji, A.; Soudan, B.; Al-Alami, A.H.; Olabi, A.G. Outlook of carbon capture technology and challenges. Sci. Total Environ. 2019, 657, 56–72. [Google Scholar] [CrossRef] [PubMed]
- Bui, M.; Adjiman, C.S.; Bardow, A.; Anthony, E.J.; Boston, A.; Brown, S.; Fennell, P.S.; Fuss, S.; Galindo, A.; Hackett, L.A.; et al. Carbon capture and storage (CCS): The way forward. Energy Environ. Sci. 2018, 11, 1062–1176. [Google Scholar] [CrossRef]
- Oliveira Junior, E.S.; Temmink, R.J.M.; Buhler, B.F.; Souza, R.M.; Resende, N.; Spanings, T.; Muniz, C.C.; Lamers, L.P.M.; Kosten, S. Benthivorous fish bioturbation reduces methane emissions, but increases total greenhouse gas emissions. Freshw. Biol. 2019, 64, 197–207. [Google Scholar] [CrossRef]
- Grainger, C.; Beauchemin, K.A. Can enteric methane emissions from ruminants be lowered without lowering their production? Anim. Feed Sci. Technol. 2011, 166–167, 308–320. [Google Scholar] [CrossRef]
- Lou, X.F.; Nair, J. The impact of landfilling and composting on greenhouse gas emissions—A review. Bioresour. Technol. 2009, 100, 3792–3798. [Google Scholar] [CrossRef]
- Su, S.; Chen, H.; Teakle, P.; Xue, S. Characteristics of coal mine ventilation air flows. J. Environ. Manag. 2008, 86, 44–62. [Google Scholar] [CrossRef]
- Monai, M.; Montini, T.; Gorte, R.J.; Fornasiero, P. Catalytic Oxidation of Methane: Pd and Beyond. Eur. J. Inorg. Chem. 2018, 2018, 2884–2893. [Google Scholar] [CrossRef]
- Saunois, M.; Jackson, R.B.; Bousquet, P.; Poulter, B.; Canadell, J.G. The growing role of methane in anthropogenic climate change. Environ. Res. Lett. 2016, 11, 120207. [Google Scholar] [CrossRef]
- Bates, J. A strategy for reducing methane emissions. In Air Pollution in the 21st Century: Priority Issues and Policy, 1st ed.; Schneider, T., Ed.; Elsevier Textbooks: Amsterdam, Netherlands, 1999; pp. 245–264. ISBN 9780444827999. [Google Scholar]
- Lebrero, R.; Chandran, K. Biological conversion and revalorization of waste methane streams. Crit. Rev. Environ. Sci. Technol. 2017, 47, 2133–2157. [Google Scholar] [CrossRef]
- Tian, X.; Huang, S.; Wang, L.; Li, L.; Lou, Z.; Huang, S.; Zhou, Z. Mitigation of low methane content landfill gas through visible-near-infrared photocatalysis over Y2O3:Er 3+/Graphene/TiO2. Appl. Surf. Sci. 2018, 456, 854–860. [Google Scholar] [CrossRef]
- Li, Z.; Pan, X.; Yi, Z. Photocatalytic oxidation of methane over CuO-decorated ZnO nanocatalysts. J. Mater. Chem. A 2019, 7, 469–475. [Google Scholar] [CrossRef]
- Zhu, X.; Liang, X.; Wang, P.; Dai, Y.; Huang, B. Porous Ag-ZnO microspheres as efficient photocatalyst for methane and ethylene oxidation: Insight into the role of Ag particles. Appl. Surf. Sci. 2018, 456, 493–500. [Google Scholar] [CrossRef]
- Zhang, X.; Xia, J.; Pu, J.; Cai, C.; Tyson, G.W.; Yuan, Z.; Hu, S. Biochar-mediated anaerobic oxidation of methane. Environ. Sci. Technol. 2019, 53, 6660–6668. [Google Scholar] [CrossRef]
- Lackner, K.S. Practical constraints on atmospheric methane removal. Nat. Sustain. 2020. [Google Scholar] [CrossRef]
- House, K.Z.; Baclig, A.C.; Ranjan, M.; van Nierop, E.A.; Wilcox, J.; Herzog, H.J. Economic and energetic analysis of capturing CO2 from ambient air. Proc. Natl. Acad. Sci. USA 2011, 108, 20428–20433. [Google Scholar] [CrossRef]
- Carbon Tax Center. Where Carbon is Taxed. Available online: https://www.carbontax.org/where-carbon-is-taxed/ (accessed on 25 March 2020).
- Jackson, R.B.; Solomon, E.I.; Canadell, J.G.; Cargnello, M.; Field, C.B. Methane removal and atmospheric restoration. Nat. Sustain. 2019, 2, 436. [Google Scholar] [CrossRef]
- Logan, B.E.; Hamelers, B.; Rozendal, R.; Schröder, U.; Keller, J.; Freguia, S.; Aelterman, P.; Verstraete, W.; Rabaey, K. Microbial Fuel Cells: Methodology and Technology. Environ. Sci. Technol. 2006, 40, 5181–5192. [Google Scholar] [CrossRef]
- Rizzo, A.; Boano, F.; Revelli, R.; Ridolfi, L. Can microbial fuel cells be an effective mitigation strategy for methane emissions from paddy fields? Ecol. Eng. 2013, 60, 167–171. [Google Scholar] [CrossRef]
- Yu, L.; Yang, Z.; He, Q.; Zeng, R.J.; Bai, Y.; Zhou, S. Novel Gas Diffusion Cloth Bioanodes for High-Performance Methane-Powered Microbial Fuel Cells. Environ. Sci. Technol. 2019, 53, 530–538. [Google Scholar] [CrossRef] [PubMed]
- Gunasekera, S.S.; Hettiaratchi, J.P.; Bartholameuz, E.M.; Farrokhzadeh, H.; Irvine, E. A comparative evaluation of the performance of full-scale high-rate methane biofilter (HMBF) systems and flow-through laboratory columns. Environ. Sci. Pollut. Res. Int. 2018, 25, 35845–35854. [Google Scholar] [CrossRef] [PubMed]
- La, H.; Hettiaratchi, J.P.A.; Achari, G.; Dunfield, P.F. Biofiltration of methane. Bioresour. Technol. 2018, 268, 759–772. [Google Scholar] [CrossRef]
- IPCC. Climate Change 2014. Synthesis Report; Pachauri, R.K., Mayer, L., Eds.; Intergovernmental Panel on Climate Change: Geneva, Switzerland, 2015; ISBN 9291691437. [Google Scholar]
- Rosen, R.A.; Guenther, E. The economics of mitigating climate change: What can we know? Technol. Forecast. Soc. Chang. 2015, 91, 93–106. [Google Scholar] [CrossRef]
© 2020 by the authors. Licensee MDPI, Basel, Switzerland. This article is an open access article distributed under the terms and conditions of the Creative Commons Attribution (CC BY) license (http://creativecommons.org/licenses/by/4.0/).