Abstract
Viscose fibers were impregnated with different concentrations of diammonium hydrogen phosphate (DAHP), carbonized, activated, and tested as high-performance electrode materials for supercapacitors. The yield of these activated carbon fibers (ACFs) could be increased by a factor of 14 by using DAHP compared to ACF without impregnation. These specific activation procedures yielded a high specific surface area of more than 2700 m2·g−1 with a pore size distribution (PSD) suitable for use as a supercapacitor electrode. The electrode materials were implemented in symmetric supercapacitors using TEMA BF4 as electrolyte and cyclic voltammetry measurements showed high specific capacitances of up to 167 F·g−1. Furthermore, the devices showed high energy densities of up to 21.4 W·h·kg−1 and high-power densities of up to 8.7 kW·kg−1. The supercapacitors featured high capacity retention (96%) after 10,000 cycles. These results show that ACFs made of viscose fibers, previously impregnated with DAHP, can be used as high-performance electrodes in supercapacitors for energy storage applications.
1. Introduction
Global energy consumption has been accelerating at an alarming rate due to the rapid development of the global economy and the growing human population worldwide [1,2,3,4,5,6,7,8,9]. To meet the growing energy demands required to sustain current living standards while avoiding depletion and environmental pollution, there is a need for the development of high-performance, low-cost and environment-friendly energy resources. In order to be able to use these environmentally friendly and renewable sources of energy in the long term, new and effective energy storage systems must be developed [10]. Supercapacitors (also known as electrochemical capacitors or ultracapacitors) are a type of energy storage device that is attracting more and more attention because they can be charged and discharged very fast, have a very high power density (<10,000 W·kg−1), require little maintenance and have a long life of over 1 million charge and discharge cycles [1,2,11].
For the production of such supercapacitors, carbon materials are used as electrodes, since they are chemically and thermally stable and easy to process. In addition, their structural properties can be modified and optimized relatively easily. Activated carbons are very popular in this research area since they are characterized by a high specific surface area (1000–3000 m2·g−1) and a high pore volume (0.5–2 cm3·g−1) at a comparatively low cost (4.15 US$·kg−1) [1,2,3,4,5,6,7,8,9,12]. ACFs are an exciting alternative to classic granular and powdered activated carbons. These are known for their low electrical resistance along the fiber axis and good contact with the current collector [13]. By activation with CO2, micropores with a very narrow, adjustable PSD can be generated. However, the cost of such fibrous activated carbons is high compared to their powder counterparts. Therefore, research efforts in this area are currently limited. Impregnation agents may lower the production costs of this promising class of activated carbons, since the yield can be significantly increased during the carbonization of the precursor [14]. A promising impregnation agent is DAHP [15]. It is also known that the presence of phosphorus-containing structures has a positive effect on PSD and pore volume [16]. Although the effect of DAHP on the yield of cellulosic materials during carbonization is well described in the literature, its influence on the development of the pore structure during carbonization, and especially activation, is not systematically studied [14,17,18]. Here, we use viscose fibers as a precursor for ACFs. This bio-based material can be industrially produced in large quantities (about 5 million tons per year) and with constantly high quality [19]. Viscose fibers were treated with differently concentrated DAHP solutions, then carbonized and activated by CO2. The influence of DAHP impregnation on the yield after carbonization and activation was investigated. Furthermore, the influence on the PSD of ACFs was studied, as well as the chemical composition using energy-dispersive X-ray spectroscopy (EDX) and Raman spectroscopy. Finally, the produced ACFs were processed to electrodes for supercapacitors and characterized electrochemically by cyclic voltammetry (CV), galvanostatic discharge curves (GDC) and electrochemical impedance spectroscopy (EIS) to be able to establish a relationship between the DAHP concentrations used, the PSD and the suitability as an electrode material.
2. Materials and Methods
2.1. Acitvated Carbon Fiber Preparation
Viscose fibers (1.7 dtex, 38 mm) were dried for 24 h at 90 °C and subsequently impregnated for 15 min in different solutions of DAHP in deionized water. The concentrations used ranged from 0.0–75.7 mmol·L−1, which corresponds to 0.0–10.0% DAHP in distilled water. After spin-drying for 15 min, the impregnated fibers were stored in a drying cabinet at 90 °C for 24 h. Then, the fibers were carbonized in a chamber furnace (HTK8, Gero, Germany) under a nitrogen atmosphere with a heating rate of 1.0 °C·min−1 and heldisothermal for 20 min at 850 °C. Afterwards, the carbonized fibers were activated in a rotary kiln at 870 °C for 165 min in a CO2-flow of 80 L·h−1. To determine the yield of carbonization, the ratio of the carbonized fiber to the precursor was calculated. Similarly, the yield of activation was calculated from the ratio of activated material to carbonized material. The total yield was obtained by multiplying the two yields of the process steps with each other. The masses used were always determined after drying the material at 110 °C for 24 h.
2.2. Electrode Fabrication and Electrochemical Characterization
The ACFs were ground using a mortar mill (RM 200, Retsch GmbH, Haan, Germany). After adding 10% polytetrafluoroethylene (Sigma Aldrich, St. Louis, MO, USA) and 10% carbon black (Super P, Alfa Aesar, Haverhill, MA, USA), the ACFs were ground again for 15 min until a kneadable dough was obtained. This dough was rolled out by a sheet metal roller to a thickness of 90–100 µm and circular electrodes with a radius of 8 mm were punched out. These electrodes were dried in vacuo overnight at 110 °C.
The cells were assembled using a Swagelok®-type 2-electrode test cell with two symmetrical ACF electrodes as a counter and working electrode soaked with a 1 M triethylmethylammonium tetrafluoroborate (TEMA BF4, >98.0%, TCI Deutschland GmbH, Eschborn, Germany) solution in propylene carbonate (PC, 99.5%, Acros Organics N.V., Belgium) as an electrolyte with a separator (Celgard® 3401, Celgard, Charlotte, NC, USA) between them. A C-coated aluminum foil (z-flo 2651, Coveris Management GmbH, Vienna, Austria) was used as a current collector. All cells were assembled under nitrogen atmosphere avoiding moisture and oxygen.
CV, GDC, and EIS measurements were performed using a potentiostat (Vertex.One, Ivium Technologies BV, Eindhoven, The Netherlands). EIS measurements were carried out in the frequency range of 1 MHz to 10 mHz with 10 mV of AC voltage amplitude. The gravimetric capacitance CS was determined by CV and GDC using the following Equations (1) and (2)
The specific capacitance CS,CV of one electrode is determined by the integral of the positive part of the 5th CV curve, limited by the Vf and Vi of the cell voltage ΔV, scan rate v and the mass of the active material mE of one electrode. For the GDC measurements, CS,GDC is calculated using the current I, the discharge time t, mE and ΔV. Energy density ES and power density PS for the device were calculated employing Equations (3) and (4)
The cyclic stability measurement was carried out in a coin cell at 0.6 A·g−1 over 10,000 cycles between 0 and 1.4 V. The specific capacitance of the 5th discharge process, calculated according to Equation (2), was defined as 100% stability.
2.3. Structural Characterization
The obtained ACFs were analyzed by N2 isothermal adsorption (77 K) for their surface area and structures using an automatic volumetric sorption analyzer (Autosorb-iQ, Anton Paar QuantaTec Inc, Boynton Beach, FL, USA). Prior to the analysis, samples were degassed for 2 h at 350 °C. The Brunauer–Emmett–Teller (BET) method and non-local density functional theory (NLDFT) were used to calculate the specific surface area SBET and derive PSD, respectively [20,21]. The total pore volume Vtot was estimated to be equal to the liquid volume of adsorbate (N2) at a relative pressure of 0.99. Furthermore, structural and elemental characterization of the samples was performed using an Aramis Lab Raman spectroscopy system (HORIBA Scientific, Oberursel, Germany) at an excitation wavelength of 532 nm, and a windowless Ultim Max 100 EDX detector (Oxford Instruments, Oxford, UK) attached to a scanning Auger electron spectroscopy (SAES) microscope (JAMP-9500F, JEOL, Kyoto, Japan). The SAES system was also used to take scanning electron microscopy (SEM) images and features an ultrahigh vacuum chamber in the 10−10 hPa range which allows minimizing additional carbon contamination of the sample surfaces during exposure to the e-beam for exciting the characteristic x-ray photons. EDX measurements were performed in this study at an acceleration voltage of 5 kV.
3. Results and Discussion
Dried viscose fibers were impregnated, carbonized and activated with different concentrations of a DAHP solution. Figure 1a,b compares SEM micrographs of the carbonized fibers with (37.9 mmol·L−1) and without DHAP impregnation. Any influence of the impregnating agent was not observed. The surface features on the fiber were already present on the precursor and originate from the spinning process of the viscose [22]. After activation (Figure 1c,d), shrinkage of the fiber can be observed. In addition, a roughness of the fiber is visible, which is caused by the activation step (Figure 1d).
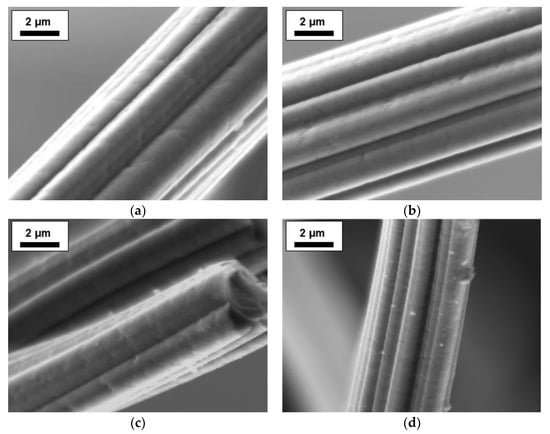
Figure 1.
SEM micrographs of the fibers: (a) fiber impregnated with distilled water only after carbonization; (b) fiber impregnated with 37.9 mmol·L−1 diammonium hydrogen phosphate (DAHP) after carbonization; (c,d) activated carbon fibers (ACF) impregnated with 37.9 mmol·L−1 DAHP.
For the chemical composition of the carbonized and activated fibers at different impregnation concentrations, the EDX spectra of the fibers were recorded and the results were summarized in Table 1 At least 30 EDX spectra were recorded per sample. The fibers without DAHP treatment showed a high carbon content of 98.54 at.% and oxygen content of 1.25 at.% after carbonization. After the activation step, the carbon content increased slightly to 98.74 at.%, while the oxygen content decreased to 1.01 at.%. For comparison, the carbon fiber (CF) CF38 was examined, as the applied impregnation concentration of 37.9 mmol·L−1 corresponds to half of the maximum concentration used. This fiber shows a decrease in carbon content from 97.12 at.% after the carbonization to 92.57 at.% after activation. In addition, the P content increases from 0.70 to 2.27 at.% and the O content from 2.81 to 3.24 at.% due to activation. It is assumed here that the phosphorus is, at least partially, present in the form of a phosphorus oxide after carbonization [16]. During the activation step with CO2, carbon is partially reacted off and pores are formed, while the amount of phosphorus and oxygen remains mainly unchanged. As a result of the activation, the relative content of C in the fiber composition decreases with increasing DAHP concentration from 98.74 at.% (ACF0) to 89.27 at.% (ACF76), while that of P and O increases. With increasing concentration of the impregnating solution, an increase in the P and O content in the CFs and ACFs can be observed.

Table 1.
DAHP concentrations of the impregnating solutions used and the composition, measured by EDX, of carbonized fibers (CFs) and ACFs. The EDX-derived values are arithmetic mean values and the corresponding confidence interval at a significance level of 0.05 from at least 30 EDX spectra per sample.
To investigate the structure of the carbonized and activated fibers, Raman spectra (Figure 2) were recorded. The spectra showed two characteristic bands around 1320 and 1583 cm−1, which are assigned to the so-called D and G bands of carbon, respectively. The D band originates from sp3-hybridized carbon atoms, while the G band correlates with the sp2-hybridized graphitic phase of the carbon [23,24]. Thus, the ratio of the relative intensities of ID and IG can obtain information on the disorder within the carbon fiber. The ID/IG ratio of the carbonized fiber was 1.10, while that of the activated fiber was 1.23. This increase in the ID/IG ratio indicates a higher disordered chemical structure of the carbon caused by the activation and the formation of the pores. The use of DAHP as an impregnation agent before carbonization did not affect the spectra. Overall, the graphitization level of the ACFs with ID/IG = 1.23 is significantly higher than that of commercially available activated carbons, which show an ID/IG value as high as 1.92 [25].
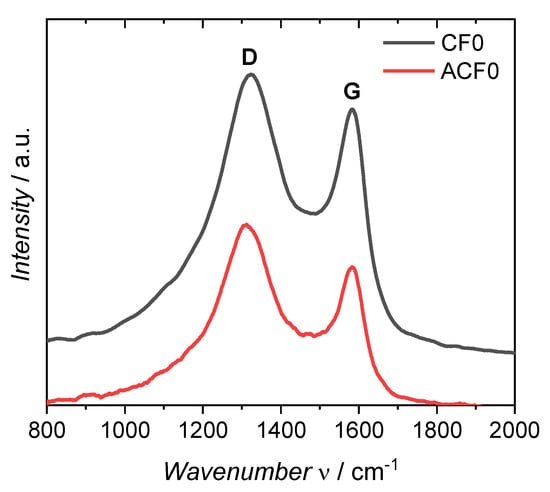
Figure 2.
Raman spectra of the not impregnated fiber after carbonization (CF0) and activation (ACF0).
Figure 3 and Table 2 show the impact of the DAHP concentration on the yield after carbonation, after activation, and the total yield. The ACF0 sample, which was treated with distilled water only, gave a yield of 19.5% after carbonization. The yield significantly increased by using even small amounts of DAHP. Even impregnation with a solution containing only 3.8 mmol·L−1 DAHP increased the carbonization yield to 27.1%. The use of higher concentrated impregnation solutions led to a further increase in the carbonization yield of up to 34.6%. The achieved increase in yield after carbonization is following the results observed by Zeng et al. By using a 75.7 mmol·L−1 DAHP solution, they were able to increase the yield from 17.3% to 32.9% when carbonizing a rayon-based fiber at 850 °C [15]. The increase in carbonization yield through the use of DAHP is due to the synergistic effect of P and N atoms [15,26]. The exact reaction mechanisms that lead to the increased yield can be found elsewhere [26].
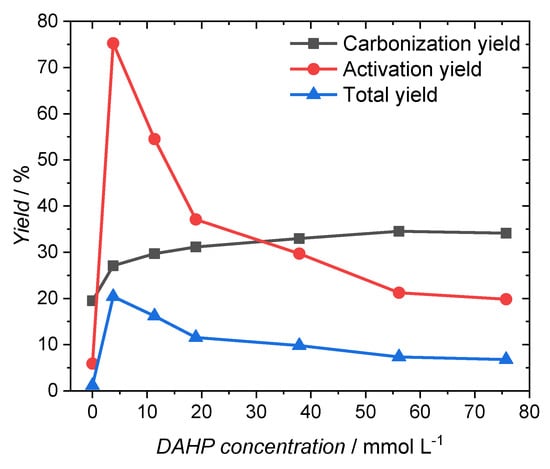
Figure 3.
Yield after carbonization, activation and after both processing steps.

Table 2.
Yield of carbonization, yield of the activation step, and total yield.
After the activation step, the activation yield rises sharply from 5.9% to 75.3% when a 3.8 mmol·L−1 DAHP solution is used. With a steady increase in the concentration of the impregnating solution, the yield decreased until a yield of 20.0% was achieved in this process step. The total yield resulting from the product of the carbonization yield and the yield of the activation step was 1.1% for the sample ACF0. Just like the yield of the activation step, the total yield increases strongly to 20.4% with the use of the 3.78 mmol·L−1 DAHP solution. With higher concentrations, the total yield decreases, but even at the highest impregnating concentration a total yield of 6.8% is achieved, which corresponds to a six-fold increase in the total yield of the sample without DAHP.
For structural characterization of ACFs, nitrogen adsorption isotherms were recorded at −196 °C (Figure 4a). The specific surface area (SBET) calculated from the adsorption isotherms (Table 3) decreased to 1250 m2·g−1 when a 3.8 mmol·L−1 DAHP solution was used, while the sample ACF0 has a SBET of 1932 m2·g−1. As the impregnate concentration was increased, SBET subsequently rises. The highest value for SBET of 2763 m2·g−1 is achieved with a DAHP concentration of 56.1 mmol·L−1. The total pore volumes (Vtot) show the same trend. The fiber treated with distilled water only shows a Vtot of 0.83 cm3·g−1 after activation, whereas treatment of the fiber with a 3.8 mmol·L−1 DAHP solution leads to a lower Vtot of 0.51 cm3·g−1. Here too, Vtot increases with the DAHP concentration of the impregnate until the maximum of 1.83 cm3·g−1 is reached at a DAHP concentration of 56.1 mmol·L−1.
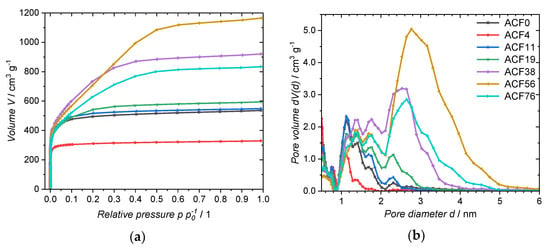
Figure 4.
(a) Nitrogen adsorption isotherm and (b) PSD of the ACFs.

Table 3.
Specific surface area (SBET), total pore volume (Vtot), dominat pore sizes (Ddom, taken from the pore size distribution (PSD)) and specific capacitance (CS, derived by cyclic voltammetry (CV) and galvanostatic discharge curves (GDC)) of the activated samples.
This trend also explains the behavior of the yields after activation, as described above. The activation yield of the ACF4 sample is high because the fiber is hardly activated, i.e., hardly any carbon is released to obtain a porous surface. At higher DAHP concentrations the carbon fiber is highly activated, and SBET and Vtot increase while the yield decreases. Nevertheless, with impregnation with a DAHP concentration of 11.4 mmol·L−1, a larger surface area can be achieved than is possible without DAHP, while, at the same time, the activation yield can be increased significantly from 5.9% to 54.5%.
Further, the PSD (Figure 4b) and dominant pore sizes Ddom of the ACFs were determined from the nitrogen adsorption isotherms (Table 3. ACF0 shows pores between 1–2 nm. When using a low-concentration DAHP solution (3.8 mmol·L−1) for impregnation, the pores with a diameter of 1.4 nm are not present. The sample ACF11 shows a similar PSD as its non-impregnated counterpart, but the pore volume is higher, resulting in a larger SBET. As the impregnate concentration is increased, the pore diameter and adsorbed pore volume increases, which enlarges Ddom. The maximum Vtot of 1.83 cm3·g−1 is finally reached with ACF56. This sample shows dominant pore sizes of 1.4 nm, 1.7 nm, and 2.8 nm. A further increase in the concentration to 75.7 mmol·L−1 results in a lower Vtot, but Ddom remains about the same.
The capacitances per mass of active material CS are summarized in Table 3.The values were calculated using CV at a scan rate of 10 mV·s−1 (Figure 5a), and by GDC at a specific current of 1.0 A·g−1 (Figure 5b). Traditionally, the specific capacitances of porous carbon materials are assumed to be directly proportional to SBET, with the pore volume accessible by nitrogen being assumed to be similar to that accessible by the electrolyte [27]. However, the electrolyte ions used, especially the cation TEMA+, are relatively large, with a ion size of 0.85 nm [28]. Therefore, pores with a pore diameter below 0.85 nm are not available for the formation of Helmholtz double layers, and thus do not contribute to CS [29].
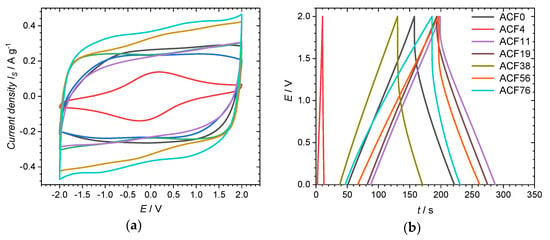
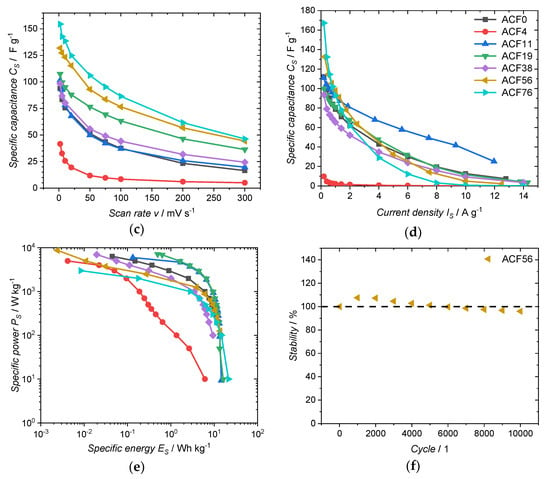
Figure 5.
Electrochemical measurements of ACFs: (a) CVs at a scan rate of 10 mV·s−1; (b) GDC at a specific current of 1.0 A·g−1; (c) CS,CV at different scan rates; (d) CS,GDC at different current densities; (e) Ragone plot, values calculated from GDC and (f) cyclic stability measurement.
The specific capacitance of the electrode from the ACF without impregnation, calculated from the CV ranging from −2 to 2 V, is 76 F·g−1 at a scan rate of 10 mV·s−1. The associated CV (Figure 5a) shows a quasi-rectangular, symmetrical shape typical of an electrochemical double-layer mechanism [30]. Like SBET, CS,CV decreases to 26 F·g−1 with the use of small amounts of DAHP (3.8 mmol·L−1). Here, CS,CV decreases in a disproportionately strong manner compared to SBET, since most of the pores of this sample have a diameter below 0.85 nm and are therefore not accessible for the electrolyte. As SBET and Davg increase with the use of higher concentrated DAHP solutions, CS,CV also increases. One outlier is sample ACF38, as the value for CS,CV of 80 F·g−1 (10 mV·s−1) is considered too low. The highest CS,CV of 139 F·g−1 is achieved with an impregnate concentration of 75.7 mmol·L−1. The variation in the scan rate (Figure 5c) confirms this trend with the DAHP concentration. Here, CS,CV up to 155 F·g−1 at 2 mV·s−1 could be achieved.
The specific capacitances CS,GDC calculated from the galvanostatic discharge curve (Figure 5b) show a similar trend (Table 3) to the specific capacitances calculated from the CVs. The CS,GDC of the electrode made from untreated fibers shows a value of 79 F·g−1 at a specific current of 1.0 A·g−1. It is noticeable here that the sample ACF38 has a relatively low specific capacitance of 65 F·g−1. The highest CS,GDC of 98 F·g−1 is achieved with the sample ACF56. As can be seen in Figure 5d, CS,GDC is strongly dependent on the specific current used. Thus, with the highest DAHP concentration used, the highest CS of 167 F·g−1 at 0.2 A·g−1 is achieved, while ACF0 has a specific capacitance of 112 F·g−1 for the same specific current. However, CS drops very rapidly testing the ACF76 sample with greater specific currents >2.0 A·g−1. With such a rapid discharge, ACF11 achieves a significantly better performance. Which DAHP content results in the highest specific capacity is, therefore, highly dependent on the specific current with which the supercapacitor is charged or discharged.
The energy and power densities of the ACFs can be seen in the Ragone-plot (Figure 5e). The energy and power densities were calculated per device. Per electrode, the values would be four times as high [31]. Very high energy densities of >20 W·h·kg−1 could be achieved. The highest energy density of 21.4 W·h·kg−1 was reached by sample ACF76. How excellent these high energy densities are becomes clear when they are compared with commercially available supercapacitors: here, 5–7 W·h·kg−1 are obtained [32]. Samples ACF11 and ACF19 have outstanding results: even at a high power density of 2000 W·kg−1, they still show an energy density of 6.6 W·h·kg−1.
The cyclic stability of the supercapacitor from sample ACF56 as representative is shown in Figure 5f. The capacitance, calculated from the 5th GDC, was defined as 100% stability. Initially, CS improves up to 108% after 2000 charge and discharge cycles. This increase is probably due to the improved wettability of the electrodes with the electrolyte [25,33]. After this initial increase, the specific capacitance decreases with further cycling, which can be attributed to an oxidation of the ACF or a decomposition of the electrolyte [31]. In addition, the presence of heteroatoms (see Table 1) can impair cyclic stability. Even after 10,000 cycles, the supercapacitor still reaches 96% of the initial specific capacitance, which proves the excellent cycle stability.
To better understand the electrochemical behavior of the samples, EIS spectra in the frequency range from 1 MHz to 10 mHz were recorded (Figure 6a). The measured data could be fitted to an equivalent circuit (Figure 6b). Here, R1 is mainly the resistance of the electrode [31]. CPE1 is the double-layer capacitance at the interface between electrode and electrolyte. A constant phase element, CPE1, was used to compensate for inhomogeneities in the system and the roughness of the electrodes [34]. R2 represents the charge-transfer resistance, while the Warburg impedance W0 stands for the contribution to the total impedance caused by diffusion processes [34]. A second constant phase element, CPE2, was used to compensate for any pseudo-capacitances [35]. Except for ACF4, all analyzed samples show a highly capacitive behavior, which is evident from the steep lines at low frequencies [36]. The Nyquist plots show a depressed semicircle in the high frequency region related to the faradaic charge–discharge resistance [37]. The larger the semicircle, the greater the corresponding resistance.
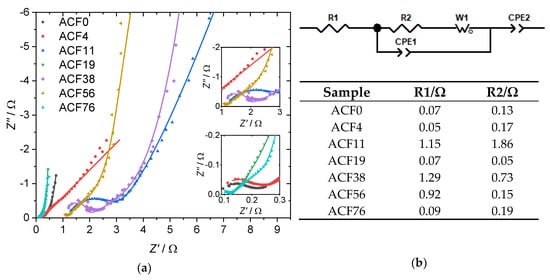
Figure 6.
(a) Nyquist plot of electrochemical impedance spectroscopy (EIS) with insets of magnifications at low Z′ and Z′′ values. The symbols represent the actual data measured; the lines indicate the fit to the equivalent circuit shown in (b), together with the fitted values for R1 and R2. Within one spectrum, the frequencies at which the points were recorded increase from left to right.
The fitted resistances R1 and R2 are shown in the table in Figure 6b. The samples ACF0, ACF4, ACF19 and ACF76 show very low values, with resistances of R1 < 0.1 Ω and R2 < 0.2 Ω, respectively. The very low resistance of R1 compared to granular ACs can be explained by the fact that the resistance along a fiber axis is very low [13,38]. The low charge-transfer resistance is due to the fact that, in ACFs, the pores are located directly on the fiber surface, which results in good accessibility for the electrolyte [13]. For example, Qi and coworkers found values of 4.64 and 3.63 ohms for R1 and R2, respectively, when they examined a commercially available activated carbon powder [39]. In comparison, the samples ACF11, ACF38 and ACF56 show high values for R1 and R2. This may be due to poor contact between the fibers themselves or between the fibers and the current collector. The highest resistance of R1 = 1.29 Ω is shown by the sample impregnated with a 37.9 mmol·L−1 DAHP solution. This high resistance can also explain the poor performance of the sample in the electrochemical analysis.
4. Conclusions
DAHP could considerably increase the yield during both the carbonization and activation of viscose fibers. At low concentrations (11.4 mmol·L−1), the total yield of ACFs increased 14-fold, with similar SBET, Vtot, and PSD. At higher DAHP concentrations, SBET increased from 1932 to 2763 m2·g−1, while Davg became larger and more accessible for the used electrolyte TEMA BF4. Thus, the specific capacitance increased significantly by up to 167 F·g−1. In addition, a high energy density of up to 21.4 W·h·kg−1 for the potential window of 2.0 V could be achieved for the entire supercapacitor. The observed cycle stability is 96% after 10,000 cycles. The fibrous geometry additionally ensures excellent conductivity of the electrodes, as shown by EIS. All in all, the use of DAHP-impregnated viscose fibers in a two-step process thus made it possible to produce high-performance electrodes for supercapacitors as energy storage devices, the costs of which could be greatly reduced by the substantial increase in yield.
Author Contributions
Conceptualization, S.B.; Methodology, S.B., A.L., C.U., D.S., M.A.H., S.S., A.W.H. and C.F.; Investigation, S.B., M.A.H., S.S. and A.L.; Resources, C.U., D.S. and A.W.H.; Data Curation, M.A.H., S.B.; Writing—Original Draft Preparation, S.B. and A.L.; Writing—Review and Editing, C.U., D.S., A.W.H.; S.S., M.A.H. and C.F.; Visualization, S.B. and A.L.; Supervision, D.S., A.W.H. and C.F.; Project Administration, D.S. and C.F.; Funding Acquisition, C.F. All authors have read and agreed to the published version of the manuscript.
Funding
The authors wish to thank the European Regional Development Fund (EFRE) and the province of Upper Austria for financial support of this study through the program IWB 2014-2020 (project BioCarb-K). Furthermore, we would like to thank the Open Access Funding by the University of Linz.
Conflicts of Interest
The authors declare no conflict of interest.
References
- Enock, T.K.; King’ondu, C.K.; Pogrebnoi, A.; Jande, Y.A.C. Status of Biomass Derived Carbon Materials for Supercapacitor Application. Int. J. Electrochem. 2017, 2017, 1–14. [Google Scholar] [CrossRef]
- Hao, L.; Li, X.; Zhi, L. Carbonaceous electrode materials for supercapacitors. Adv. Mater. 2013, 25, 3899–3904. [Google Scholar] [CrossRef] [PubMed]
- Sevilla, M.; Mokaya, R. Energy storage applications of activated carbons: Supercapacitors and hydrogen storage. Energy Environ. Sci. 2014, 7, 1250–1280. [Google Scholar] [CrossRef]
- Wang, H.; Yu, W.; Shi, J.; Mao, N.; Chen, S.; Liu, W. Biomass derived hierarchical porous carbons as high-performance anodes for sodium-ion batteries. Electrochim. Acta 2016, 188, 103–110. [Google Scholar] [CrossRef]
- Wang, J.; Kaskel, S. KOH activation of carbon-based materials for energy storage. J. Mater. Chem. 2012, 22, 23710. [Google Scholar] [CrossRef]
- Wang, Y.; Song, Y.; Xia, Y. Electrochemical capacitors: Mechanism, materials, systems, characterization and applications. Chem. Soc. Rev. 2016, 45, 5925–5950. [Google Scholar] [CrossRef]
- Yan, J.; Wang, Q.; Wei, T.; Fan, Z. Recent Advances in Design and Fabrication of Electrochemical Supercapacitors with High Energy Densities. Adv. Energy Mater. 2014, 4, 1300816. [Google Scholar] [CrossRef]
- Zhang, L.L.; Zhao, X.S. Carbon-based materials as supercapacitor electrodes. Chem. Soc. Rev. 2009, 38, 2520–2531. [Google Scholar] [CrossRef]
- Zhong, C.; Deng, Y.; Hu, W.; Qiao, J.; Zhang, L.; Zhang, J. A review of electrolyte materials and compositions for electrochemical supercapacitors. Chem. Soc. Rev. 2015, 44, 7484–7539. [Google Scholar] [CrossRef]
- Yee Liew, S.; Thielemans, W.; Freunberger, S.; Spirk, S. Polysaccharide Based Supercapacitors; Springer International Publishing: Cham, Switzerland, 2017. [Google Scholar]
- Murray, D.B.; Hayes, J.G. Cycle Testing of Supercapacitors for Long-Life Robust Applications. IEEE Trans. Power Electron. 2015, 30, 2505–2516. [Google Scholar] [CrossRef]
- Stavropoulos, G.G.; Zabaniotou, A.A. Minimizing activated carbons production cost. Fuel Process. Technol. 2009, 90, 952–957. [Google Scholar] [CrossRef]
- Pandolfo, A.G.; Hollenkamp, A.F. Carbon properties and their role in supercapacitors. J. Power Sources 2006, 157, 11–27. [Google Scholar] [CrossRef]
- Dumanlı, A.G.; Windle, A.H. Carbon fibres from cellulosic precursors: A review. J. Mater. Sci. 2012, 47, 4236–4250. [Google Scholar] [CrossRef]
- Zeng, F.; Pan, D.; Pan, N. Choosing the Impregnants by Thermogravimetric Analysis for Preparing Rayon-Based Carbon Fibers. J. Inorg. Organomet. Polym. 2005, 15, 261–267. [Google Scholar] [CrossRef]
- Li, Y.; Zhang, X.; Yang, R.; Li, G.; Hu, C. The role of H3PO4 in the preparation of activated carbon from NaOH-treated rice husk residue. RSC Adv. 2015, 5, 32626–32636. [Google Scholar] [CrossRef]
- Akita, K.; Kase, M. Determination of kinetic parameters for pyrolysis of cellulose and cellulose treated with ammonium phosphate by differential thermal analysis and thermal gravimetric analysis. J. Polym. Sci. A-1 Polym. Chem. 1967, 5, 833–848. [Google Scholar] [CrossRef]
- Hirata, T.; Nishimoto, T. DSC, DTA, and TG of cellulose untreated and treated with flame-retardants. Thermochim. Acta 1991, 193, 99–106. [Google Scholar] [CrossRef]
- Frank, E.; Steudle, L.M.; Ingildeev, D.; Spörl, J.M.; Buchmeiser, M.R. Carbon fibers: Precursor systems, processing, structure, and properties. Angew. Chem. Int. Ed. Engl. 2014, 53, 5262–5298. [Google Scholar] [CrossRef]
- Brunauer, S.; Emmett, P.H.; Teller, E. Adsorption of Gases in Multimolecular Layers. J. Am. Chem. Soc. 1938, 60, 309–319. [Google Scholar] [CrossRef]
- Landers, J.; Gor, G.Y.; Neimark, A.V. Density functional theory methods for characterization of porous materials. Colloids Surf. A: Physicochem. Eng. Asp. 2013, 437, 3–32. [Google Scholar] [CrossRef]
- Wheeler, E. The Manufacture of Artificial Silk with Special Reference to the Viscose Process; D. Van Nostrand Company: New York, NY, USA, 1928. [Google Scholar]
- Karacan, I.; Gül, A. Carbonization behavior of oxidized viscose rayon fibers in the presence of boric acid–phosphoric acid impregnation. J. Mater. Sci. 2014, 49, 7462–7475. [Google Scholar] [CrossRef]
- Ferrari, A.C.; Robertson, J. Interpretation of Raman spectra of disordered and amorphous carbon. Phys. Rev. B 2000, 61, 14095–14107. [Google Scholar] [CrossRef]
- Ranaweera, C.K.; Kahol, P.K.; Ghimire, M.; Mishra, S.R.; Gupta, R.K. Orange-Peel-Derived Carbon: Designing Sustainable and High-Performance Supercapacitor Electrodes. C J. Carbon Res. 2017, 3, 25. [Google Scholar] [CrossRef]
- Lewin, M.; Sello, S. Handbook of Fiber Science and Technology Volume 2. Functional Finishes; Part B; Marcel Dekker, Inc.: New York, NY, USA; Basel, Switzerland, 1984; ISBN 9780203752920. [Google Scholar]
- Simon, P.; Gogotsi, Y. Charge storage mechanism in nanoporous carbons and its consequence for electrical double layer capacitors. Proc. R. Soc. A 2010, 368, 3457–3467. [Google Scholar] [CrossRef]
- Yang, S.; Kim, I.-J.; Choi, I.-S.; Bae, M.-K.; Kim, H.-S. Influence of electrolytes (TEABF4 and TEMABF4) on electrochemical performance of graphite oxide derived from needle coke. J. Nanosci. Nanotechnol. 2013, 13, 3747–3751. [Google Scholar] [CrossRef]
- Simon, P.; Gogotsi, Y. Materials for electrochemical capacitors. Nat. Mater. 2008, 7, 845–854. [Google Scholar] [CrossRef]
- Wang, G.; Zhang, L.; Zhang, J. A review of electrode materials for electrochemical supercapacitors. Chem. Soc. Rev. 2012, 41, 797–828. [Google Scholar] [CrossRef]
- Supercapacitors. Materials, Systems, and Applications; Beguin, F., Frackowiak, E., Eds.; Wiley: Weinheim, Germany, 2013; ISBN 978-3-527-64668-5. [Google Scholar]
- Fic, K.; Lota, G.; Meller, M.; Frackowiak, E. Novel insight into neutral medium as electrolyte for high-voltage supercapacitors. Energy Environ. Sci. 2012, 5, 5842–5850. [Google Scholar] [CrossRef]
- Lee, J.H.; Park, N.; Kim, B.G.; Jung, D.S.; Im, K.; Hur, J.; Choi, J.W. Restacking-inhibited 3D reduced graphene oxide for high performance supercapacitor electrodes. ACS Nano 2013, 7, 9366–9374. [Google Scholar] [CrossRef]
- Sun, W.; Zheng, R.; Chen, X. Symmetric redox supercapacitor based on micro-fabrication with three-dimensional polypyrrole electrodes. J. Power Sources 2010, 195, 7120–7125. [Google Scholar] [CrossRef]
- Ates, M. Review study of electrochemical impedance spectroscopy and equivalent electrical circuits of conducting polymers on carbon surfaces. Prog. Org. Coat. 2011, 71, 1–10. [Google Scholar] [CrossRef]
- Pina, A.; Amaya, A.; Marcuzzo, J.; Rodrigues, A.; Baldan, M.; Tancredi, N.; Cuña, A. Supercapacitor Electrode Based on Activated Carbon Wool Felt. C J. Carbon Res. 2018, 4, 24. [Google Scholar] [CrossRef]
- Qi, F.; Xia, Z.; Sun, R.; Sun, X.; Xu, X.; Wei, W.; Wang, S.; Sun, G. Graphitization induced by KOH etching for the fabrication of hierarchical porous graphitic carbon sheets for high performance supercapacitors. J. Mater. Chem. A 2018, 6, 14170–14177. [Google Scholar] [CrossRef]
- Simon, P.; Burke, A.F. Nanostructured carbons: Double-layer capacitance and more. Electrochem. Soc. Interface 2008, 17, 38–43. [Google Scholar]
- Chen, X.Y.; Chen, C.; Zhang, Z.J.; Xie, D.H.; Deng, X.; Liu, J.W. Nitrogen-doped porous carbon for supercapacitor with long-term electrochemical stability. J. Power Sources 2013, 230, 50–58. [Google Scholar] [CrossRef]
© 2020 by the authors. Licensee MDPI, Basel, Switzerland. This article is an open access article distributed under the terms and conditions of the Creative Commons Attribution (CC BY) license (http://creativecommons.org/licenses/by/4.0/).