1. Introduction
Activated carbons (ACs) are produced by thermal treatment or a combination of chemical and thermal treatments of carbon-rich sources like lignite or, in the case of bio-mass based carbon, from lignocellulosic materials. Typical bio-based raw materials used in AC production are coconut shells, peat, and wood chips or saw dust [
1,
2]. Most of the raw materials used in the production of bio-chars and activated carbons can be considered as waste fractions from industrial or agricultural production [
3,
4,
5,
6]. According to Tadda et al. [
3], a number of properties are highly important if a feedstock is to be used as a source in the production of bio-chars and especially for activated carbons; some of these properties are presented in
Table 1.
The biomasses used in the present study, spruce and birch, fulfil the criteria presented in
Table 1, especially in the Nordic countries if waste fractions of wood such as thinnings and residues from wood harvesting are used.
In the production process, the organic material is first carbonized at temperatures of 673–973 K. In this process, most of the volatile components are released as pyrolysis gases in combination with pyrolytic oil, which is the breakdown product from cellulose, hemicellulose, and lignin [
7]. The product from the carbonization stage is a solid with high carbon content, typically in the range of 25–50% calculated on a mass basis, depending on the starting material and the process parameters used. The production and activation processes used for the production of bio-chars are described in the review paper of Thompson et al. and in the paper by Wang et al. [
8,
9]. According to the paper of Thompson, bio-chars can to some extent replace activated carbons as adsorbents. The bio-chars produced from agricultural waste are also proposed to be novel precursors in the production of activated carbons [
10].
In the second stage of physical activation, the carbons are activated to activated carbons using temperatures in the range of 973–1173 K in combination with activating agents. In the physical activation, gases like water (steam) or carbon dioxide (CO
2) are used as activators. Steam activation has an effect on the specific surface areas, pore volumes, and pore size distributions and might increase the O-content [
9]. A number of factors affect the properties of activated carbons produced by physical activation, among them, the biomass, activation time, and activation temperature used [
3].
From an economical point of view, the simplicity and rather low cost are the best advantages of physical activation. On the other hand, low yields are usually obtained using physical activation [
11,
12]. This can be an issue in industrial scale-up processes. The reason behind this lies in the carbonization and activation processes. Parameters such as activation time and temperature have a major impact on the yield. Higher temperature and longer activation time reduces the total yield. This can be explained simply: at higher carbonization temperatures, more volatile compounds are exiting the system, which leads to a lower yield of activated carbon. Furthermore, the activation time affects the yield of activated carbon by partially burning the carbon away because of the oxygen present in the steam. The longer the activation period is, the more time steam has to burn the organic compounds, which leads to low yields but rather high specific surface areas and pore volumes [
13,
14,
15].
An alternative activating method to produce activated carbons is chemical activation. In chemical activation, chemical agents, e.g., zinc chloride (ZnCl
2), KOH, NaOH, and H
3PO
4, can be used for activating carbon [
11,
12,
16,
17]. The procedure is rather simple: solutions containing the chemical activation agent are impregnated to the surface of the biomass, dried in an oven, and finally activated in the furnace at 673 to 873 K for 1 to 4 h under an inert atmosphere (nitrogen atmosphere). After the activation, the chemical activation agent is refluxed away with diluted mineral acid, filtered, and finally dried in an oven.
Chemical reactions that occur during the carbonization process are not well known. Only a few studies can be found from the literature about how the chemical activation occurs. Lillo-Ródenas et al. described the chemical reactions between carbon and alkaline metals (NaOH and KOH). According to them, the reactions produces metal, hydrogen, and metal carbonates. The following reaction can be described with Equations (1) and (2) [
12].
Compared to physical activation, the main advantages of using a chemical activation method are higher final carbon yields, a one-step process, generally lower activation temperatures, and an easier adjustment of porosity [
11,
18,
19,
20]. The main disadvantages of using chemical compounds are that they are not environmentally friendly substances and are corrosive towards the equipment used during research. An acid washing step is also needed in order to remove the chemical activating agent [
11,
21,
22].
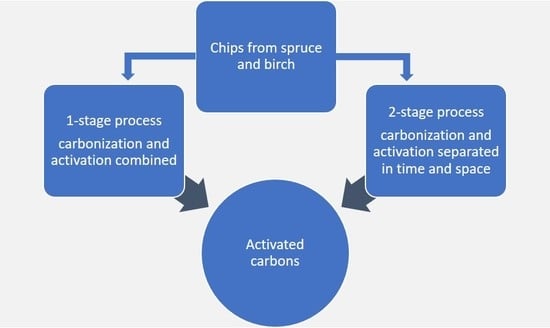
The carbonization and the activation stages can be performed in two different ways, in a two-stage process, where the carbonization and activation stages are separated in time, or in a one-stage process, where carbonization and activation are performed sequentially in the same reactor. In the two-stage process, the starting material is carbonized and the carbon is activated later into activated carbons, while the one-stage-process produces activated carbons as the only solid [
23].
Characteristic properties for the activated carbons are high carbon content, high specific surface areas, and a high level of porosity. The porous structures are divided according to pore diameter into micro pores with a diameter < 2 nm, meso pores with diameters in the size of 2–50 nm, and macro pores with diameters > 50 nm. The distribution of these pores, in combination with the specific surface area, is dependent on the starting materials and the process parameters used [
23,
24,
25].
In the present study, we present the results from a screening of the effects of using two different approaches in the production of activated carbons by physical activation. The study was performed in order to investigate the effects of different processes on the properties of the carbons. Two types of processes were used in the production of activated carbons. Wooden chips from spruce and birch were used as the starting materials in both cases. In one process, the chips were carbonized and the carbons formed were later activated by steam activation; in this process the carbonization and activation steps were separated in time and space. In the other process, the same chips were carbonized and activated in a simultaneous one-stage sequence. The prepared activated carbons from both processes were characterized with respect to total yield, carbon content, specific surface area, and pore size distributions. The novelty of this study indicates that the ACs porosity can be influenced by the process sequence and not only from the process parameters and the starting material pretreatments.
2. Materials and Methods
2.1. Biomass Used
In this research, two types of biomass were used: chips from spruce and birch were carbonized at Carbofex carbonization plant in Tampere, Finland. The carbons were dried in an oven, milled in a ceramic ball mill, and sieved to particle sizes less than 2 mm in order to minimize eventual fluctuations in the composition of individual particles. Finally, the carbons were steam activated for 2 and 4 h. These carbons were used for the two-stage process.
Wooden chips of spruce and birch used in the one-stage process were dried, milled, and sieved to particle sizes less than 2 mm. The sieved woods were carbonized and steam-activated in a one-stage process using activation times of 2 and 4 h.
About 10 g of each sample were placed into a fixed-bed steel reactor inserted into a tubular oven. The samples inside the reactor were supported on both sides by quartz wool. For the carbon samples, the temperature of the oven was raised from room-temperature to 1023 K over a 30 min period followed by a slow increase of 6 K min
−1 to 1073 K. For the wood samples, a 120 min increase from room temperature to 1073 K was applied. At 1073 K, the samples were steam-activated by feeding water into the reactor at a speed of 30 cm
3 h
−1 for 2 or 4 h. The reactor was flushed with an inert gas, nitrogen, during the whole process in order to avoid oxidation of the samples. The carbons produced were characterized by a number of methods including yield, total carbon content (TC), specific surface area, and pore size distribution. The samples were named according to
Table 2.
2.2. Calculation of Yields
The yield for each sample was calculated as:
Yield = mass of carbon/mass of feed * 100
For the pre-carbonized samples, the total yield was calculated.
Total yield = yield from activation * yield from carbonization process
According to the producer of the carbons, the yield from carbonization was 30% calculated on a dry mass basis.
2.3. Total Carbon
The percentage of total carbon present in each sample was measured using a Skalar Primacs MCS instrument (Skalar, Breda, The Netherlands). Dried samples were weighted in quartz crucibles, combusted at 1373 K in a pure oxygen atmosphere, and the formed CO2 was analyzed by an infra-red (IR) analyzer (Skalar, Breda, The Netherlands). Carbon content values were obtained by reading the signal of the IR analyzer from a calibration curve derived from known masses of a standard substance, citric acid. The total mass of carbon in each sample was calculated as a percent of the mass initially weighed. With the instrumental method used, the precision of the measurements is in the range of 5%. Standard deviation for parallel measurements (n = 5) was 1.5%.
2.4. Surface Areas and Pore Size Distributions
Specific surface areas (SSA) and pore distributions were determined from the adsorption-desorption isotherms using nitrogen as the adsorbate. Determinations were performed with Micromeritics ASAP 2020 instrument (Micromeritics Instrument, Norcross, GA, USA). Portions of each sample (100–200 mg) were degassed at low pressure (2 µm Hg) and at a temperature of 413 K for two hours in order to clean the surfaces and remove any gas adsorbed. Adsorption isotherms were obtained by immersing sample tubes in liquid nitrogen (77.15 K) to achieve constant temperature conditions. Gaseous nitrogen was added to the samples in small doses, and the resulting isotherms were obtained. Specific surface areas and total pore volumes were calculated from adsorption isotherms according to the BET (Brunauer–Emmett–Teller) method [
26], while the pore size distribution was calculated using the DFT (Density Functional Theory) [
27] algorithm assuming slit-formed pores [
28]. Total pore volumes for the BET method were calculated at a
P/
P0 ratio of 0.985 and in the case of the DTF calculation, as the total volume of pores measured at a
P/
P0 ratio of 0.985. The % distribution of pore volumes was calculated from the individual volumes of µ-pores, meso-pores, and macro-pores. With the instrumental setup used, micro-pores down to 1.5 nm in diameter could be measured, even if there might have been some contribution from smaller pores. The µ-pore areas and volumes were calculated by the t-plot algorithm and the surface areas at low
P/
P0 ratios were calculated as Langmuir surface areas. According to previous works, the SSAs were measured with a precision of ±5% [
29].
3. Results and Discussion
3.1. Yield and Total Carbon Content from the Activation and Carbonization-Activation Processes
According to the results presented in
Table 3, it appears that the total yields are higher for the two-stage process compared to the one-stage process. Obtained total yields are 18.8–13.2% (2 and 4 h activation) and 16.8–11.6% (2 and 4 h activation) for birch and spruce, respectively, in the two-stage process. In the one-stage process, corresponding yields are 10.4% and 5.5% for birch (for 2 and 4 h activation, respectively) and 15.2% and 11.5% for spruce (for 2 and 4 h activation, respectively). The pre-carbonization leads to rather high yields (62.6% and 43.9% for birch at 2 and 4 h, respectively, and 56.0% and 38.7% for spruce at 2 and 4 h, respectively) for the activation step because most of the volatile fractions have been removed in the carbonization, but the total yields are at the same level for both procedures. An exact value for the yield in an industrial production of bio-char is hard to determine, but 30% was used as a mean value as declared by the carbon supplier. As expected, longer steam activations lead to lower yields; this was more obvious for the one-stage process than the two-stage process. As expected, the total carbon content, in both raw materials, increased from initial 47 to 95% during the carbonization process. For both the one-stage and two-stage processes, physical activation with steam reduces the total carbon content. Approximately 5–10% lower values were obtained for the birch based sample depending on the length of the activation time. In the case of spruce based samples, only 1–2% lower carbon contents were obtained. Lower carbon values can be explained with the use of steam in the activation process. Steam partially oxidizes the carbon, creating a porous structure during the activation, resulting in a higher ash content but a lower carbon content.
3.2. Adsorption Isotherms, Specific Surface Area Pore Volumes, and Pore Size Distributions
The first two columns in
Table 4 represent the dried, milled, and sieved chips of spruce and birch. Results show a very low specific surface area, and the corresponding pore volume is close to or lower than the measuring limit of the method. For the raw materials, no porosity could be observed. The un-activated bio chars proved to have some porosity and specific surface areas of 140 m
2 g
−1 (spruce) and 190 m
2 g
−1 (birch). The morphology of the pores indicated mainly µ-pores.
According to the results presented in
Table 4, there were differences regarding the specific surface areas for the ACs produced in a one-stage process and the ones produced in a two-stage process. All ACs produced in the two-stage process were lower in specific surface areas compared to the ones produced in a one-stage process, the difference was independent on the activation times used, even if longer activation times in general produced higher specific surface-areas.
The difference in surface areas was even more pronounced using the Langmuir surfaces where surface areas were in the range of 600–950 m2 g−1 for the ACs produced in a two-stage process compared to surface areas of 900–1200 m2 g−1 for the ACs produced in the one-stage process.
Apparently, there was no significant difference in the pore volumes of the ACs calculated from BET, while the pore volumes calculated according to DFT were slightly higher for the ACs from the one-stage process. Pore volumes of micro-pores calculated using the t-plot algorithm were lower for the ACs produced in a one-stage process compared to the ones prepared in a two-stage process.
The external surface areas (t-plot calculations) were higher for the ACs produced in the one stage process. For samples made in the two-stage process, the external surface areas were in the range of 200–370 m
2 g
−1, and for samples made in the one-stage process, the external surface areas were in the range of 380–500 m
2 g
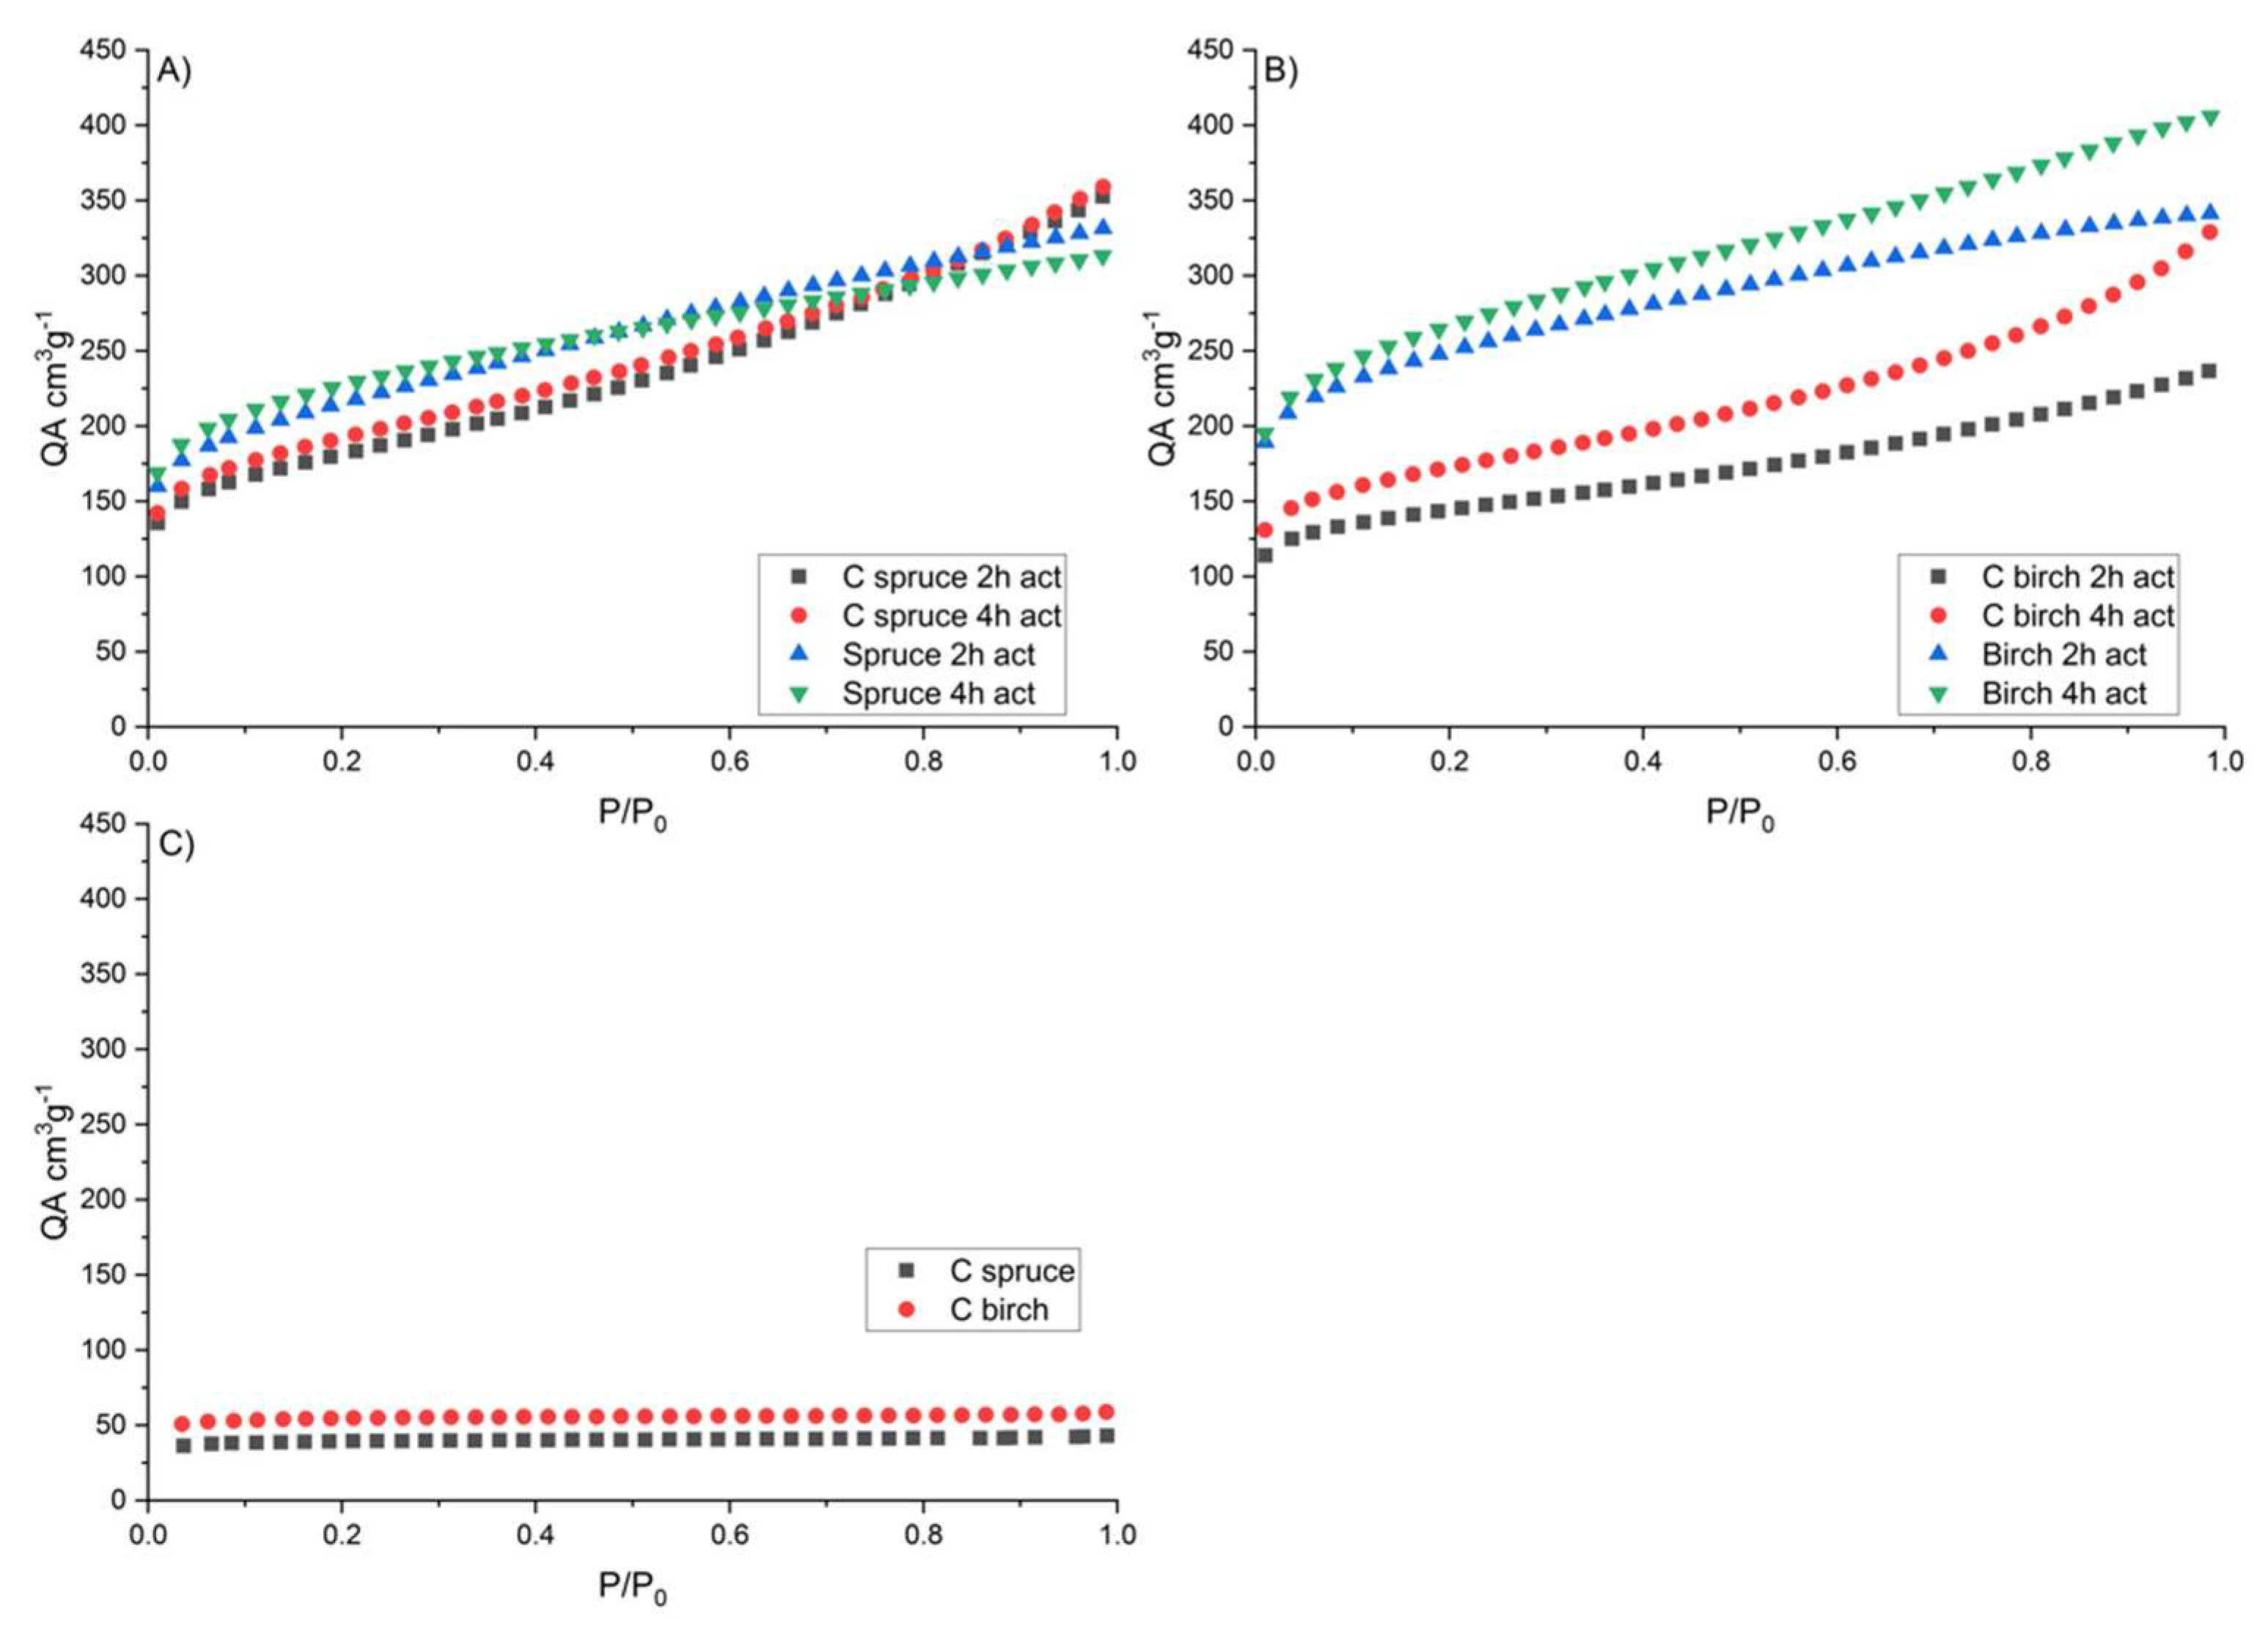
−1. This can indicate a higher occurrence of meso-pores for the ACs produced in the two-stage process, while the ACs from the one-stage process had a pore structure with more micro-pores. This observation is confirmed with the pore size distributions calculated with the DFT function and from the shapes of the isotherms presented in
Figure 1. Pore volumes in the samples carbonized without activation were low, and most of them were in the micro-pore region.
3.3. Adsorption Isotherms
The adsorption isotherms for the carbonized starting materials, two-stage and one-stage activated spruce and birch, are presented in
Figure 1A–C. The isotherms for the precursors of birch and spruce (
Figure 1C) both have low adsorption capacity, this is reflected in the SSA presented in
Table 4. There appears to be some difference in the shapes for the adsorption isotherms for the samples prepared in the one-stage and two-stage processes (
Figure 1A,B). This can also be seen as a difference in pore size distributions as presented in
Table 4. In particular, Type I and Type II shape isotherms can be noticed between the ACs prepared with different starting materials. The one-stage prepared, activated carbon follows a Type I isotherm indicating a more microporous carbon, while the two-stage AC presents a Type II adsorption isotherm more typical of meso-porous material. The raw carbon shows a Type I isotherm with a lower level of volume adsorbed. These results are similar to the DFT model as presented in
Table 4, where it is evident that there is a high micro-porosity of the carbonized biomass but a higher meso-porosity in the activated carbon prepared in the two-stage process (about 10% more).
The results of the different times used for the activation, 2 and 4 h, can be seen as changes in the specific surface areas in
Table 4. As one can expect, a longer activation time increases the SSA, this is evident for ACs prepared both in the one-stage and the two-stage processes. This can be seen more clearly in ACs produced from birch than spruce.
A longer activation time appears to increase both the total pore volumes (BET model) and the micro-pore-volumes (t-plot and DFT model) for all samples independent of the starting materials, except for one-stage activated birch. A longer activation time affects the pore-size distributions. Most likely, some micro-pores are changed to meso-pores at longer activations by modification of the structure, but there are no clear trends.
In
Table 4 it is also evident from the t-plot model that a predominant part of the surface area of the one-stage produced activated carbon derives from the micro-pore region with the holding time with steam increasing the meso-porosity, as known. Therefore, it seems that not only the process parameters but also the sequence in activation has an impact in the AC porosity.
According to the results, activated carbons produced in a one-stage and a two-stage process have different properties regarding specific surface areas, pore volumes, and pore size distributions. The reasons for the differences is speculative only but might be due to the carbonization reactions and the breakdown of the structures in the wood. Additionally, contact with air might change the properties of the surface of the bio-chars, making them less sensitive to the activating agent.
In the industrial production of the bio-chars, a continuous process was used, while the laboratory tests were performed in a fixed bed reactor in batch mode; the process parameters used might affect the properties of the ACs produced. Further tests using chemical activation with different activating agents could be performed to find out if the differences are related to the properties of the precursors used, to the activating process itself, or to the activating agent.
4. Conclusions
It is well known that the biomass used for the carbonization and activation in the production of activated carbons is one of the most important factors regarding the properties of the end-product. In this study, a comparison between two different routes in the production of ACs for activating carbon were performed. The results presented give some new understanding of the parameters influencing the production of ACs with different properties.
According to the results, there are differences in the properties of ACs produced in regard to process yield, specific surface area, and pore-size distribution. The differences can be related to the starting materials used for the activation, direct carbonization, and activation (one-stage) or pre-carbonization into bio-chars followed by activation (two-stage). Regarding the total carbon content in the ACs produced, there is no significant difference between one-stage and two-stage processes, but small differences between the starting materials can be seen. The yield is apparently higher using the two-stage process. ACs with higher surface areas are produced in the one-stage carbon activation process. The total pore volume of the one-stage process is, in general, higher compared to that of the two-stage process. Regarding the yields, there is also a difference between precursors used, the pore distribution presents a particular difference as evidenced by the adsorption isotherms t-plot and DFT model. According to the results, the treatment order of the precursors appears to have, in combination with the wood species used, the most significant effect on the properties of the activated carbons.


