Article

Activated Carbons Derived from High-Temperature Pyrolysis of Lignocellulosic Biomass

1
Materials Science and Technology Division, Oak Ridge National Laboratory, Oak Ridge, TN 37831, USA
2
Proton Power, Inc., Lenoir City, TN 37771, USA
*
Authors to whom correspondence should be addressed.
Submission received: 17 August 2018 / Revised: 6 September 2018 / Accepted: 10 September 2018 / Published: 12 September 2018
(This article belongs to the Special Issue Carbons from Biomasic Waste and Their Applications)

Abstract

:
Biomass pyrolysis to produce biofuel and hydrogen yields large amounts of charred byproducts with low commercial value. A study was conducted to evaluate their potential for being converted into higher value activated carbons by a low-cost process. Six chars derived from various lignocellulosic precursors were activated in CO2 at 800 °C to 30–35% weight loss, and their surface area and porosity were characterized by nitrogen adsorption at 77 K. It was found that, in similar activation conditions, the surface area of the activated carbons correlates with the activation energy of the oxidation reaction by CO2, which in turn varies inversely with the carbon yield after thermolysis in nitrogen at 1000 °C. Since lignin is the most thermally-stable component of lignocellulosic biomass, these results demonstrate, indirectly, that robust, lignin-rich vegetal precursors are to be preferred to produce higher quality activated carbons. The chars derived from white pine (pinus strobus) and chestnut oak (quercus prinus) were converted to activated carbons with the highest surface area (900–1100 m2/g) and largest mesopores volume (0.85–1.06 cm3/g). These activated carbons have properties similar to those of commercially-available activated carbons used successfully for removal of pollutants from aqueous solutions.

Graphical Abstract

1. Introduction

Due to their high surface area, large pore volume, and favorable pore sizes, activated carbons (AC) (essentially, porous carbons) are being used in many applications, ranging from gas adsorption, storage and separation, to water cleaning, and as catalysts in various chemical reactions [1,2,3]. The surface functional groups on activated carbons determine their adsorption behavior and surface reactivity, among other properties [4,5]. In general, the final surface functionalities and properties are determined by the activation process and by the nature of charred precursors [6]. Out of the different types of precursors, lignocellulosic biomass derived from agricultural wastes is a promising raw material, in part because of its abundant availability [2]. Apart from the economic benefits, using these feedstocks for producing AC closes the carbon cycle and helps in solving air pollution and water pollution problems [7,8]. Numerous lignocellulosic precursors—such as wood, almond shells, coconut shells, apple pulp, cotton stalks, rice husk, plum stones, and others—are being successfully used to produce activated carbons [7,9,10,11,12,13]. This is basically a two-step process, of which the first one is carbonization in a high-temperature (300–900 °C) pyrolysis process, where moisture, volatiles, and most of the non-carbon hetero-elements in biomass (oxygen, hydrogen, nitrogen, and sulfur) are removed. The resultant charred material (biochar) has much higher carbon content. The second step is the activation process, intended to develop high internal porosity and surface area for enabling and enhancing the adsorption function. The main constituents of lignocellulosic biomass are cellulose, hemicellulose, and lignin. During the carbonization step, these macromolecules decompose at different rates and at different temperatures [6,14]. Of all three, lignin is the most thermally resilient and ends up being the most abundant component of charred materials. Hence the respective proportions of the three components in the initial raw material and at the end of the carbonization step play a big role in determining the properties of charred materials, their behavior during activation, and eventually the yield and adsorptive properties of end products—activated carbons [1,8,10,13,15].
Conversion of biomass to biochar is one of the newest approaches to carbon sequestration in terrestrial ecosystems. In general, biochar is a byproduct from pyrolysis of cellulosic biomass for production of biofuels and hydrogen. The char materials can act as a soil conditioner, enhancing plant growth by retaining humidity and supplying nutrients, and eventually improving soil physical and biological properties [16]. Another potential use of biochar is a fuel additive in ruminant diets [17]. However, a higher value product could be obtained by converting biochar to activated carbons. There are two main routes for this conversion: physical activation and chemical activation. Physical activation (sometimes also called thermal activation) is the process of slow oxidation of the char with mild oxidizing agents—such as steam and carbon dioxide—at temperatures usually between 600 °C and 900 °C. The slow oxidation process creates new porosity or enlarges the existing pores. Carbon dioxide is usually preferred over steam because of its low reactivity that permits controlling oxidation rates such that uniform porosity is developed. Chemical activation is based on char impregnation with chemicals (ZnCl2, KOH, H3PO4) which promote dehydration, polycondensation, and gasification reactions at lower temperatures than those needed for physical activation. The yield is higher, but the process requires extensive washing of final product for elimination of chemicals, which is perceived as an environmental penalty.
This study is focused on physical activation by CO2 of biochar materials obtained from different lignocellulosic precursors, and characterization of their surface properties and porosity using nitrogen adsorption measurements. An attempt was made to relate the properties of activated carbons, such as surface area and pore volumes, to the activation conditions and the nature of precursor materials.

2. Materials and Experimental Details

2.1. Materials

The biochar materials for this study were provided by Proton Power, Inc. (Lenoir City, TN, USA). They were obtained from lignocellulosic precursors commonly found in Eastern Tennessee. Three types of materials were used. The hardwood-derived chars were represented by a ‘hardwood mixture’ (HW) composed of charred oak (quercus) and hickory (carya), and also by charred chestnut oak (CO) (quercus prinus), and by charred yellow poplar (YP) (liriodendron tulipifera). The softwood-derived chars were typified by charred redwood (RW) (sequoia sempervirens) and charred white pine (WP) (pinus strobus). Lastly, a grass type, charred switchgrass (SG) (panicum virgatum), was also used. The main properties of raw and dried biomass materials of biochars obtained by pyrolysis, and of end-product activated carbons, are presented in Table 1. This comprehensive summary table will be recalled often in the manuscript.

2.2. Charring by Fast Biomass Pyrolysis

Proton Power, Inc. uses fast biomass pyrolysis for production of liquid biofuel and hydrogen. Biochar is a byproduct of this process. For this study, wood chips were obtained from whole logs using a brush chipper (Vermeer BC1000XL, Pella, IA, USA). Wet wood crumbles (mostly in the 5–10 mm range size) were generated by using a Forest Concepts 6.4 mm M24ci Crumbler (Forest Concepts, LLC, Auburn, WA, USA) and then were pyrolyzed using a Proton Power CHyP engine (Proton Power, Inc., Lenoir City, TN, USA). While biochar can be obtained by pyrolysis starting from low temperature (300 °C) and preferably not exceed 900 °C [18], the chars used in this study were prepared by Proton Power in a modified fast pyrolysis process, with a higher peak temperature (1110 °C) and short residence time. This continuous process conveys feedstock using an auger, which requires correlation of the volumetric displacement per revolution with the material’s bulk density. This correlation is used to maintain the desired mass throughput. Depending on density, the residence time window was between 3 min and 5 min, during which the material’s temperature was rapidly increased from ambient to the peak temperature. The fast pyrolysis regime was selected to maximize the liquid product yield and to improve the quality of the solid product [10,19]. The biochar was collected in a sealed metal bin to prevent oxidation, allowed to cool, and stored for further use, in general as a soil conditioner. Small batches of pyrolyzed biochars were further used for activation studies presented here. These biochar samples were fractionated with a single deck orbital separator (SWECO LS24S44, SWECO, Florence, SC, USA) equipped with a Market Grade 80 mesh screen (178 μm opening) woven with a 0.14 mm diameter stainless steel wire. They were additionally washed with 1 M HCl to remove residual mineral matter, followed by neutralization with large amounts of deionized water and final drying.

2.3. Initial Thermogravimetric Analyzes

Initial characterization of as-received chars included thermogravimetric analysis (TGA) using a Q5000 thermogravimetric balance (TA Instruments, New Castle, DE, USA) under flowing nitrogen or carbon dioxide; sample sizes were less than 100 mg. The runs in nitrogen were used to quantify the volatiles still present in the charred precursors and to determine the steps of their devolatilization. The chars were heated (10 °C/min) up to 1000 °C and kept isothermally at 1000 °C for an additional 30 min. It was found that the biochar behavior in this devolatilization process controls the properties of physically activated carbons.
The runs in carbon dioxide were used to simulate activation and to measure kinetic parameters of the oxidation reaction by CO2. They included similar heating ramps (10 °C/min) and isothermal segments at 600, 700, and 800 °C, using fresh samples each time. This exercise showed that each char has specific oxidation kinetics. This information was used for estimating the length of activation treatments needed to achieve about 30–35% weight loss at preselected temperatures. The simplified sequence of experiments, from initial biochar characterization, through physical activation, and to the subsequent characterization of activated carbons, is presented in Figure 1.

2.4. Activation

Activation of all charred carbons was performed under flowing CO2 at 800 °C (also at 700 °C for several chars) in a quartz tube (2.54 cm diameter) placed in a horizontal furnace. In a typical run, about 0.5–0.6 g char was loaded in a porcelain boat placed in the uniform temperature zone and heated (10 °C/min) to the activation temperature. The CO2 flow (5 L/min) was kept at the programmed temperature for the duration needed to reach about 30% weight loss, estimated from prior kinetic analysis of oxidation rates by CO2. Subsequent cooling was done under flowing N2 (5 L/min). The weight loss recorded for each sample was used as the index for the degree of activation. Activated samples were kept in tightly closed vials before characterization by nitrogen adsorption.

2.5. Characterization

Biochar morphology was characterized by scanning electron microscopy (SEM) in a Quanta 200 instrument (FEI Company, Hillsboro, OR, USA) at 15 kV. Secondary electron (SE) imaging revealed topographical information, and back-scattered electron (BSE) imaging modes emphasized features due to atomic number contrast. The powdered samples were affixed to conventional specimen stubs via electrically conductive double-sided adhesive tape; the adhesive surface was merely pressed into the sample of char, placed into the SEM, and imaged.
Nitrogen adsorption/desorption isotherms at 77 K were measured using a volumetric Autosorb 1C instrument (Quantachrome Instruments, Boynton Beach, FL, USA). The samples were first outgassed overnight at 300 °C. Adsorption data were used to calculate the BET surface area (using the method of Brunauer-Emmett-Teller) [20], the total volume of accessible pores (<300 nm in size), and the pore size distribution of open pores (<30 nm in size) in the charred materials and activated carbons. Data reduction employed the commercial software (ASiQwin 2.0) available from Quantachrome Instruments (Boynton Beach, FL, USA), with options for calculation of pore size distributions using DFT (density functional theory) models.

3. Results

3.1. Morphology of Charred Materials

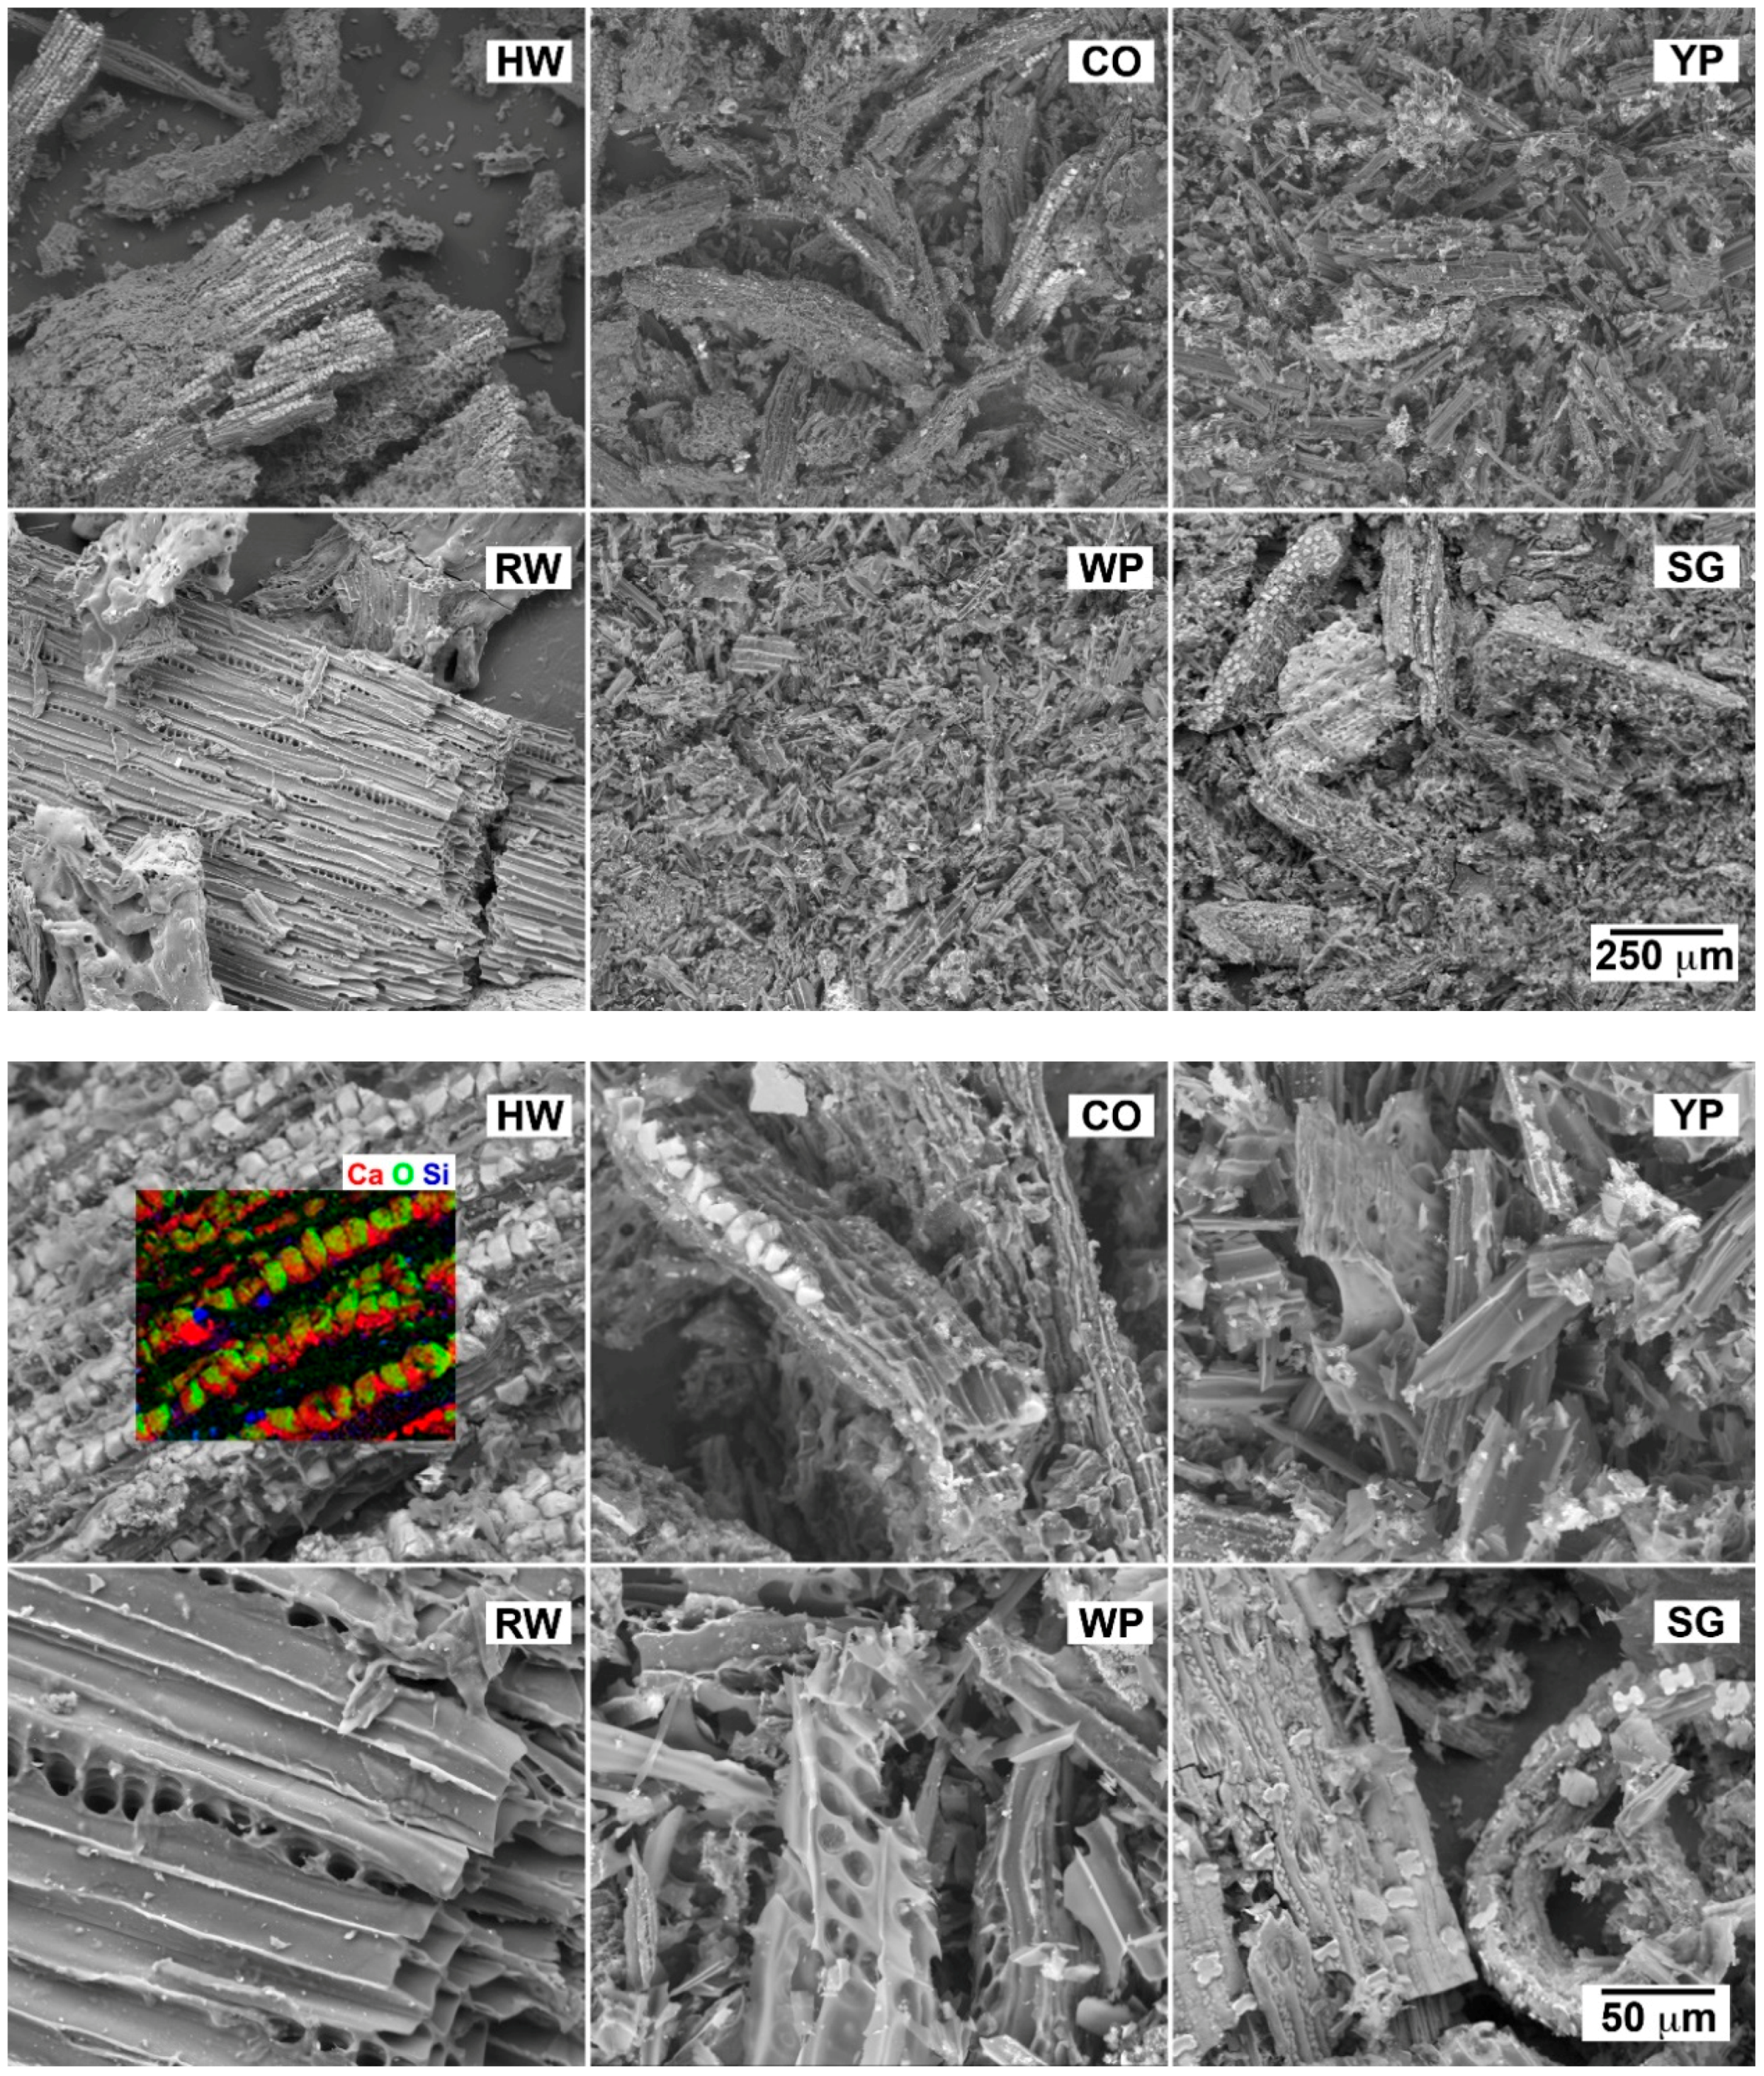
SEM images in Figure 2 show representative fields of view of charred samples (prior to activation) at 100× and 500× magnification. To show both topographical information contained by SE signals, and atomic number contrast from BSE signals, each image in Figure 2 is a digital, weighted summation (70% BSE plus 30% SE) of these two simultaneously acquired signals. This imaging technique shows the size and morphology of the char particles and the presence of phytoliths in the pyrolyzed biomass. Phytoliths are minute mineral deposits (e.g., Si, Ca, P based) in plant tissues due to the uptake of minerals during their life cycles. Having a higher average atomic number than the surrounding pyrolyzed carbon phases, these phytoliths appear as bright features. An example of the local distribution of Ca, O, and Si is shown by the energy dispersive X-ray spectroscopy (EDS) color image overlapped on the HW micrograph at 500× magnification.
The architecture of charred materials reflects the anatomy of the original precursors. Hardwoods are porous wood types, containing vessels (little pipelines) used for water and mineral salt transport in living trees. These vessels are sometimes visible with naked eyes as pores in wood’s mass, distributed either uniformly (like in YP) or in distinct patterns (like in CO). Large-but-short vessels are easy to recognize in the images of the three hardwood chars (HW, CO, YP) in Figure 2. In contrast, softwoods are non-porous. Water transport occurs through elongated tracheid cells which do not form distinct porous structures, as visible for RW and WP chars in Figure 2. Switchgrass has variable structures between species, but the most lignified tissues are the xylem and the fiber sheath surrounding vascular bundles [21]. SG char in Figure 2 shows mixed structures. These architectural features and the voids between them are too large to significantly contribute to adsorption properties. Extremely large pores (macropores > 50 nm by the IUPAC definition [22]) are ideal channels for gas and/or liquid transport to narrower pores (micropores < 2 nm, mesopores at 2–50 nm [22]) which enable the adsorption function of activated carbons. The very large pores seen in Figure 2 and their rough surfaces will not contribute essentially to the BET surface area and pore volumes measured by gas adsorption. However, a certain amount of micro- and mesoporosity is already present in the fast pyrolyzed chars, as it will be shown later.

3.2. Char Devolatilization

The chars obtained from fast pyrolysis at ~1100 °C still contain thermolabile components, because their short exposure time (<5 min) did not allow complete decomposition of cellulose, hemicellulose, and lignin. Moreover, since fast pyrolysis was not done in an inert atmosphere, the formation of oxygenated surface groups cannot be excluded. Before proceeding to physical activation in CO2, it was necessary to survey the thermal behavior in an inert gas (nitrogen) and to quantify weight losses caused by thermolysis of remnant lignocellulose components and surface oxides.
Figure 3 shows TGA plots for all samples from the initial characterization under nitrogen, and Table 1 shows quantitative results. The weight loss percentages are provided for five temperature ranges, defined by analogy with thermolysis of surface functionalities on carbon materials [23,24,25]: desorption of physisorbed water (30 to 120 °C), release of carbon dioxide (120 to 500 °C), release of carbon monoxide (500 to 800 °C), and release of hydrogen and methane (800 to 1000 °C), which continued during the final isothermal step (1000 °C for 30 min). The carbon yield obtained after this treatment varied between 80% and 90%.
The plots in Figure 3 do not show any clear difference between hardwood chars (HW, CO, YP) and softwood chars (RW, WP). At a closer analysis, it is seen that the switchgrass char (SG) contains the largest amount of moisture (about 6%). One hardwood (YP) and one softwood (WP) char release the least amount of moisture and CO2. The rate of weight loss increased for all chars after 800 °C. At these temperatures, weight loss is caused by dehydrocyclization and aromatization of alkanes, accompanied by the release of hydrogen, as documented elsewhere [23,24,25]. The three hardwoods (HW, CO, YP) differ by the initial moisture content, but have similar behavior above 800 °C. Globally, the thermal behaviors under nitrogen of YP and CO are quite similar, with the difference that CO contains a large amount of moisture. The carbon yield increases in the order HW < SG < RW < CO < YP < WP.

3.3. Oxidation Kinetics in Carbon Dioxide

After several exploratory TGA runs in CO2, systematic kinetic analysis of the activation process continued with oxidation rate measurements at constant temperatures (600 °C, 700 °C and 800 °C) in separate experiments. At these temperatures, the chars are slowly oxidized by CO2:
C (solid) + CO2 (gas) = 2 CO (gas)
The rates of oxidation at constant temperature T can be generally represented by the Arrhenius relationship.
  R a t e   ( % m i n ) =   Δ m m o   1 Δ t 100 % = Δ w t   ( % ) Δ t   ( m i n ) = A   e x p ( E a c t R T )  
where ∆m/∆t is the rate of weight loss by chemical reaction (mg/min) at constant temperature T (K), mo is the initial sample weight (mg), and R is the gas constant (8.314 J mol–1 K–1). The values of apparent kinetic parameters (activation energy, Eact, and pre-exponential factor, A) obtained from this analysis are shown in Table 2. The length of isothermal reaction times at 800 °C (min) is also provided for each carbon.
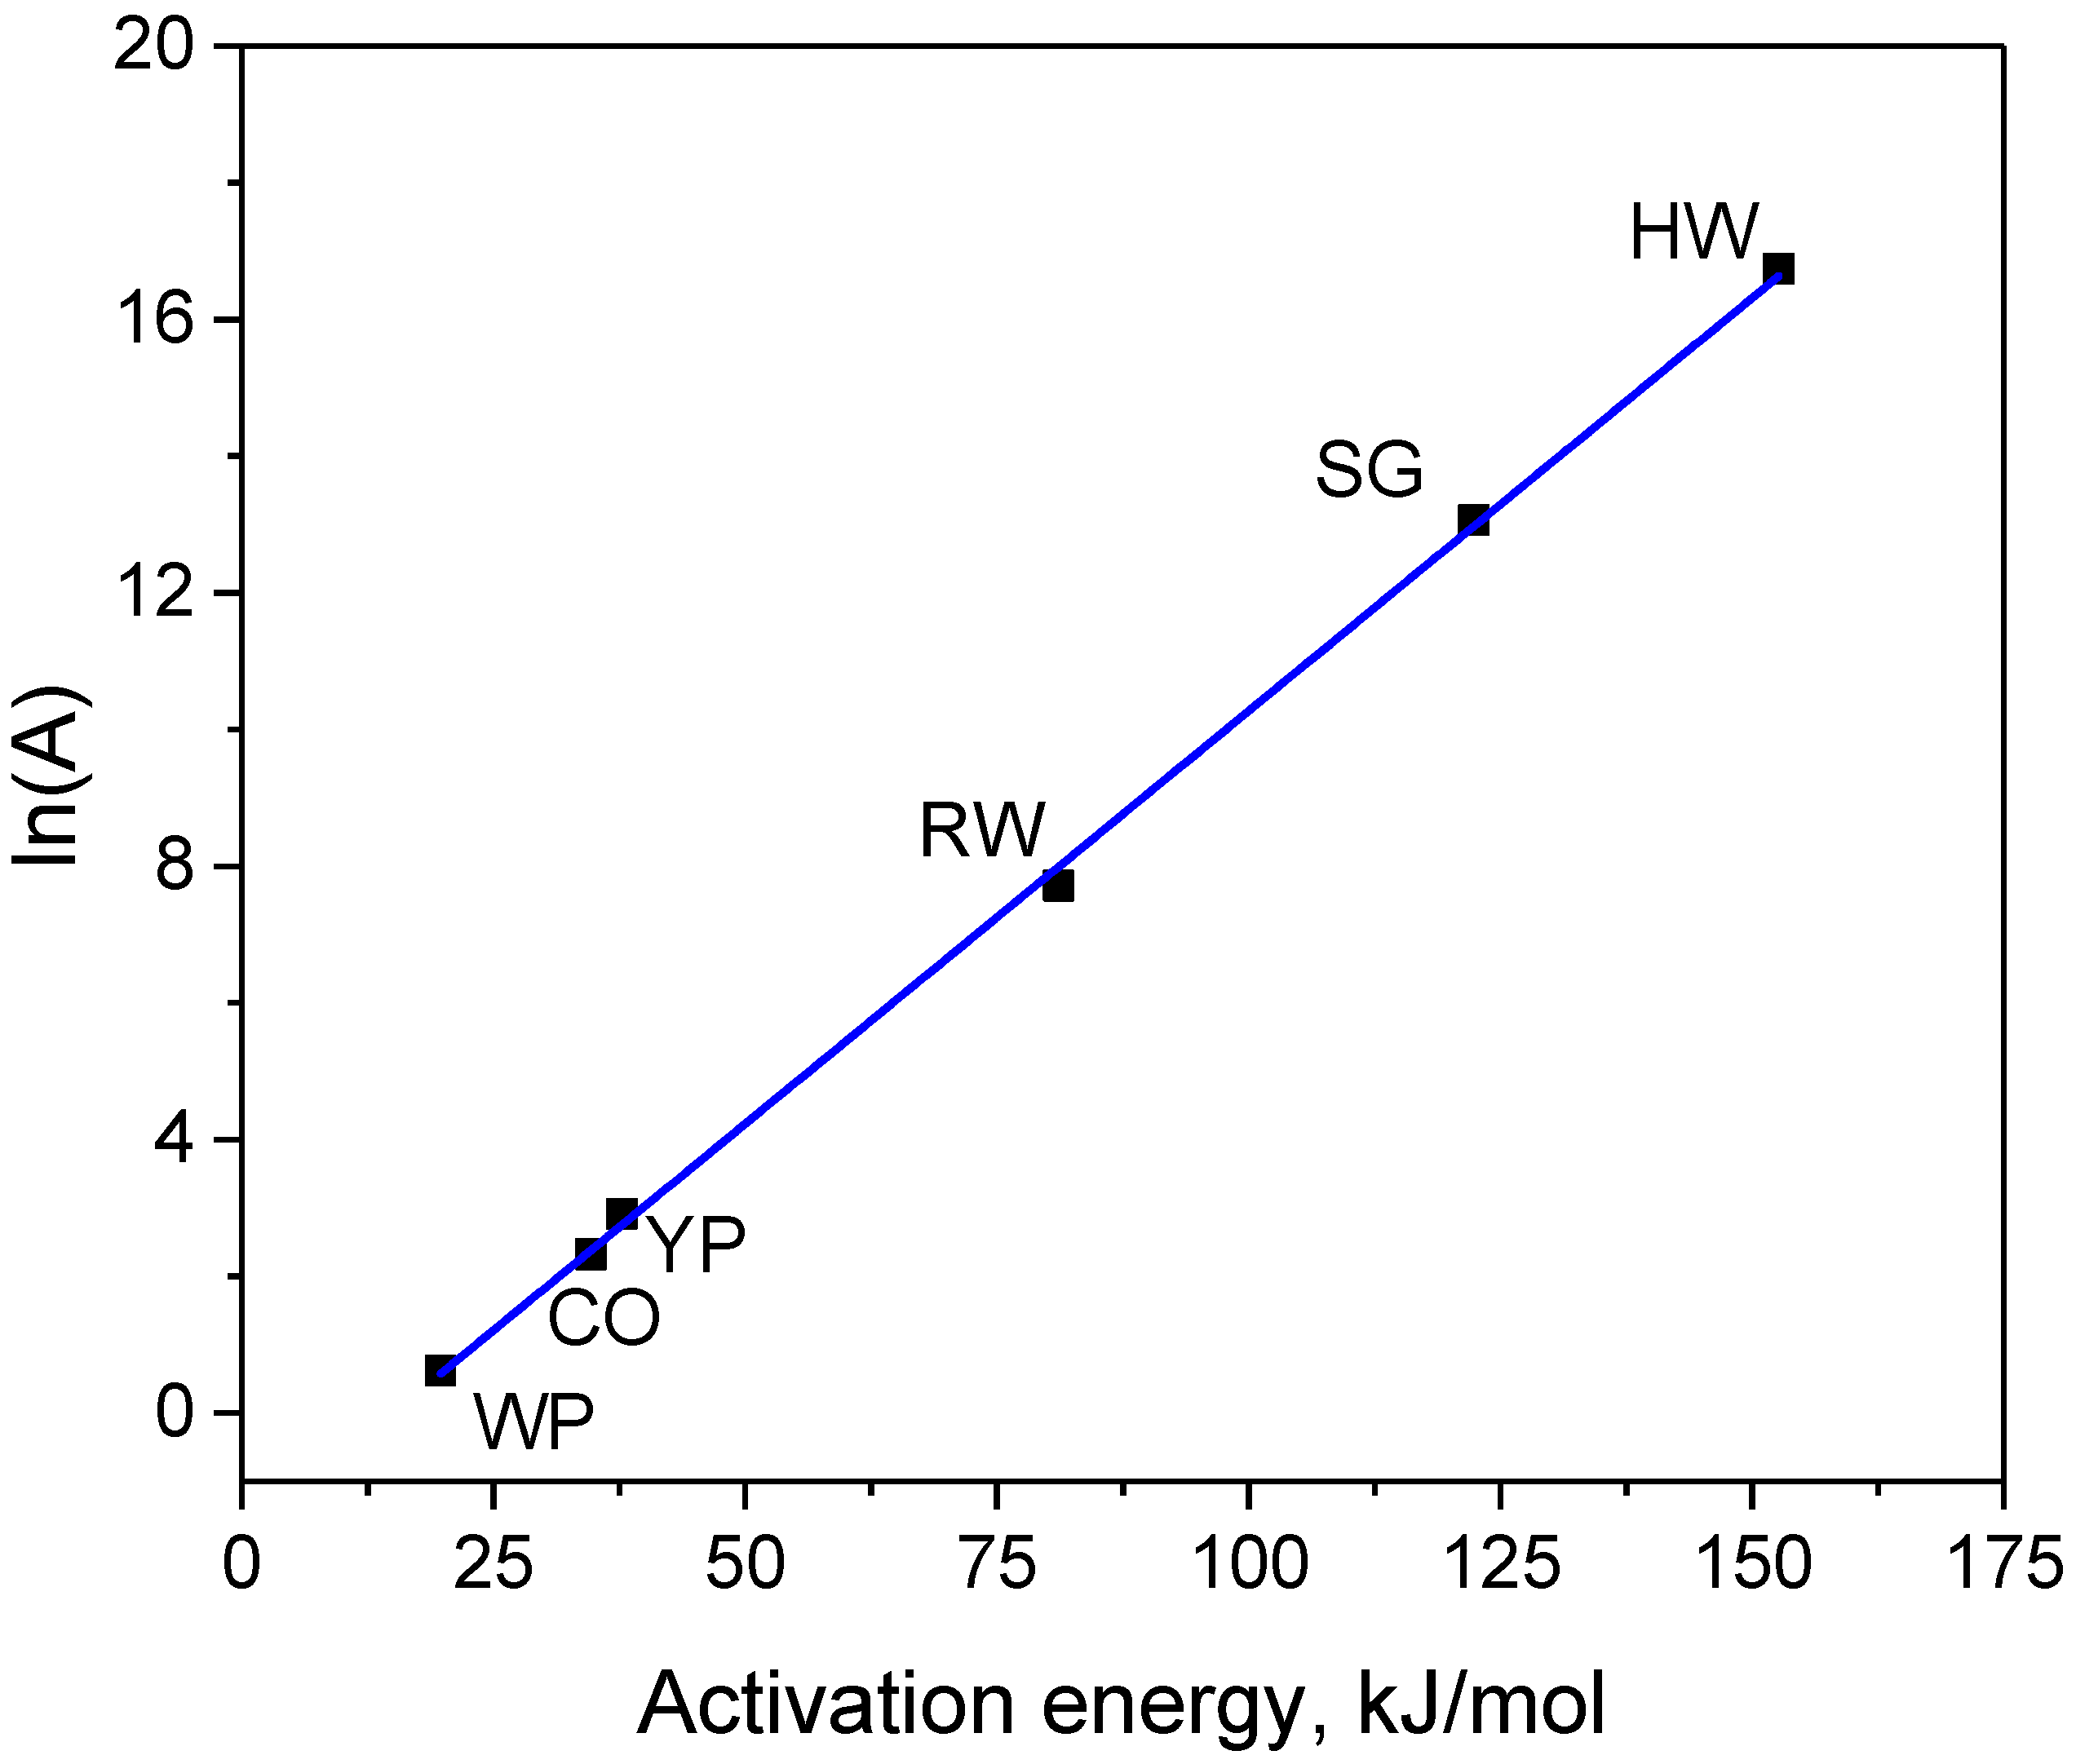
The chars have very different kinetic response during oxidation by CO2. Data in Table 2 show a large variation of pre-exponential factors and apparent activation energies. Figure 4 shows a linear correlation between ln(A) and Eact for all chars studied. This proportional variation of ln(A) and Eact in a class of similar reactions is known in the chemical kinetics literature as the compensation effect [26,27]. Although sensitive to error propagation (since the error in Eact is reflected in ln(A)), linear relationships between ln(A) and Eact were typically found for reactions that follow a common mechanism, including carbon oxidation reactions—catalyzed or not [28,29]—and cellulose pyrolysis [30]. One possible explanation of the compensation effect is based on the transition state theory of chemical reactions, according to which the energy levels and the entropy of the activated complex intermediary in the mechanism of carbon oxidation should be correlated [27].
The char-specific kinetic parameters for oxidation by CO2 were further used to estimate the reaction time that would produce about 30–35% weight loss at preselected temperatures. The following equation was used:
Δ t ( m i n ) = Δ w t % A ( m i n 1 )   e x p ( E a c t ( J m o l ) 8.314 T ( K ) )  
Table 2 shows actual weight loss during physical activation at 800 °C. For each material, the global weight loss is the difference between the initial and final weights normalized by initial weight of biochar. The global weight losses include dehumidification and devolatilization losses before reaching the activation temperature; they are larger than the target of 30–35%. After accounting for the amounts of moisture and light gases (CO2, CO) released before 800 °C (using information from TGA exploratory runs in nitrogen), the corrected weight losses for the oxidation reaction only are reasonably close to the initial target, with an average of 32 ± 7%. The outliers are YP and SG with 43% and 25% corrected weight loss. Thus, even though the starting chars have different properties and largely different oxidation kinetics, the procedure used here produced activated carbon with quite close oxidation levels. The porous structures and nitrogen adsorption properties of carbons activated at 800 °C are discussed next.

3.4. Adsorption Properties

Adsorption properties of activated carbons are mainly governed by surface area and distribution of pore sizes. The size of the pores developed during the activation process has an important role in adsorption [31]. Carbons with a large volume of narrow pores (micropores and lower mesopores) are most effective for adsorption of small gas molecules. Possible applications include gas storage (methane), gas separation (CO2 from methane), volatile organic compound recovery (in the chemical industry, refineries, dry cleaning units), odor removal from indoor air, etc. Narrow pores generate large BET surface areas, which can reach the range of 2000–2500 m2/g for best performing activated carbons. Carbons with lesser micropore volumes and lower surface area are better suited for adsorption from solutions (drinking and industrial waters cleaning, taste, color and odor control, stabilization against corrosion, metals recovery, etc.) [32,33,34,35]. The presence of mesopores is highly desirable in these applications because they ensure wetting and liquid transport throughout the bulk of carbon adsorbent.
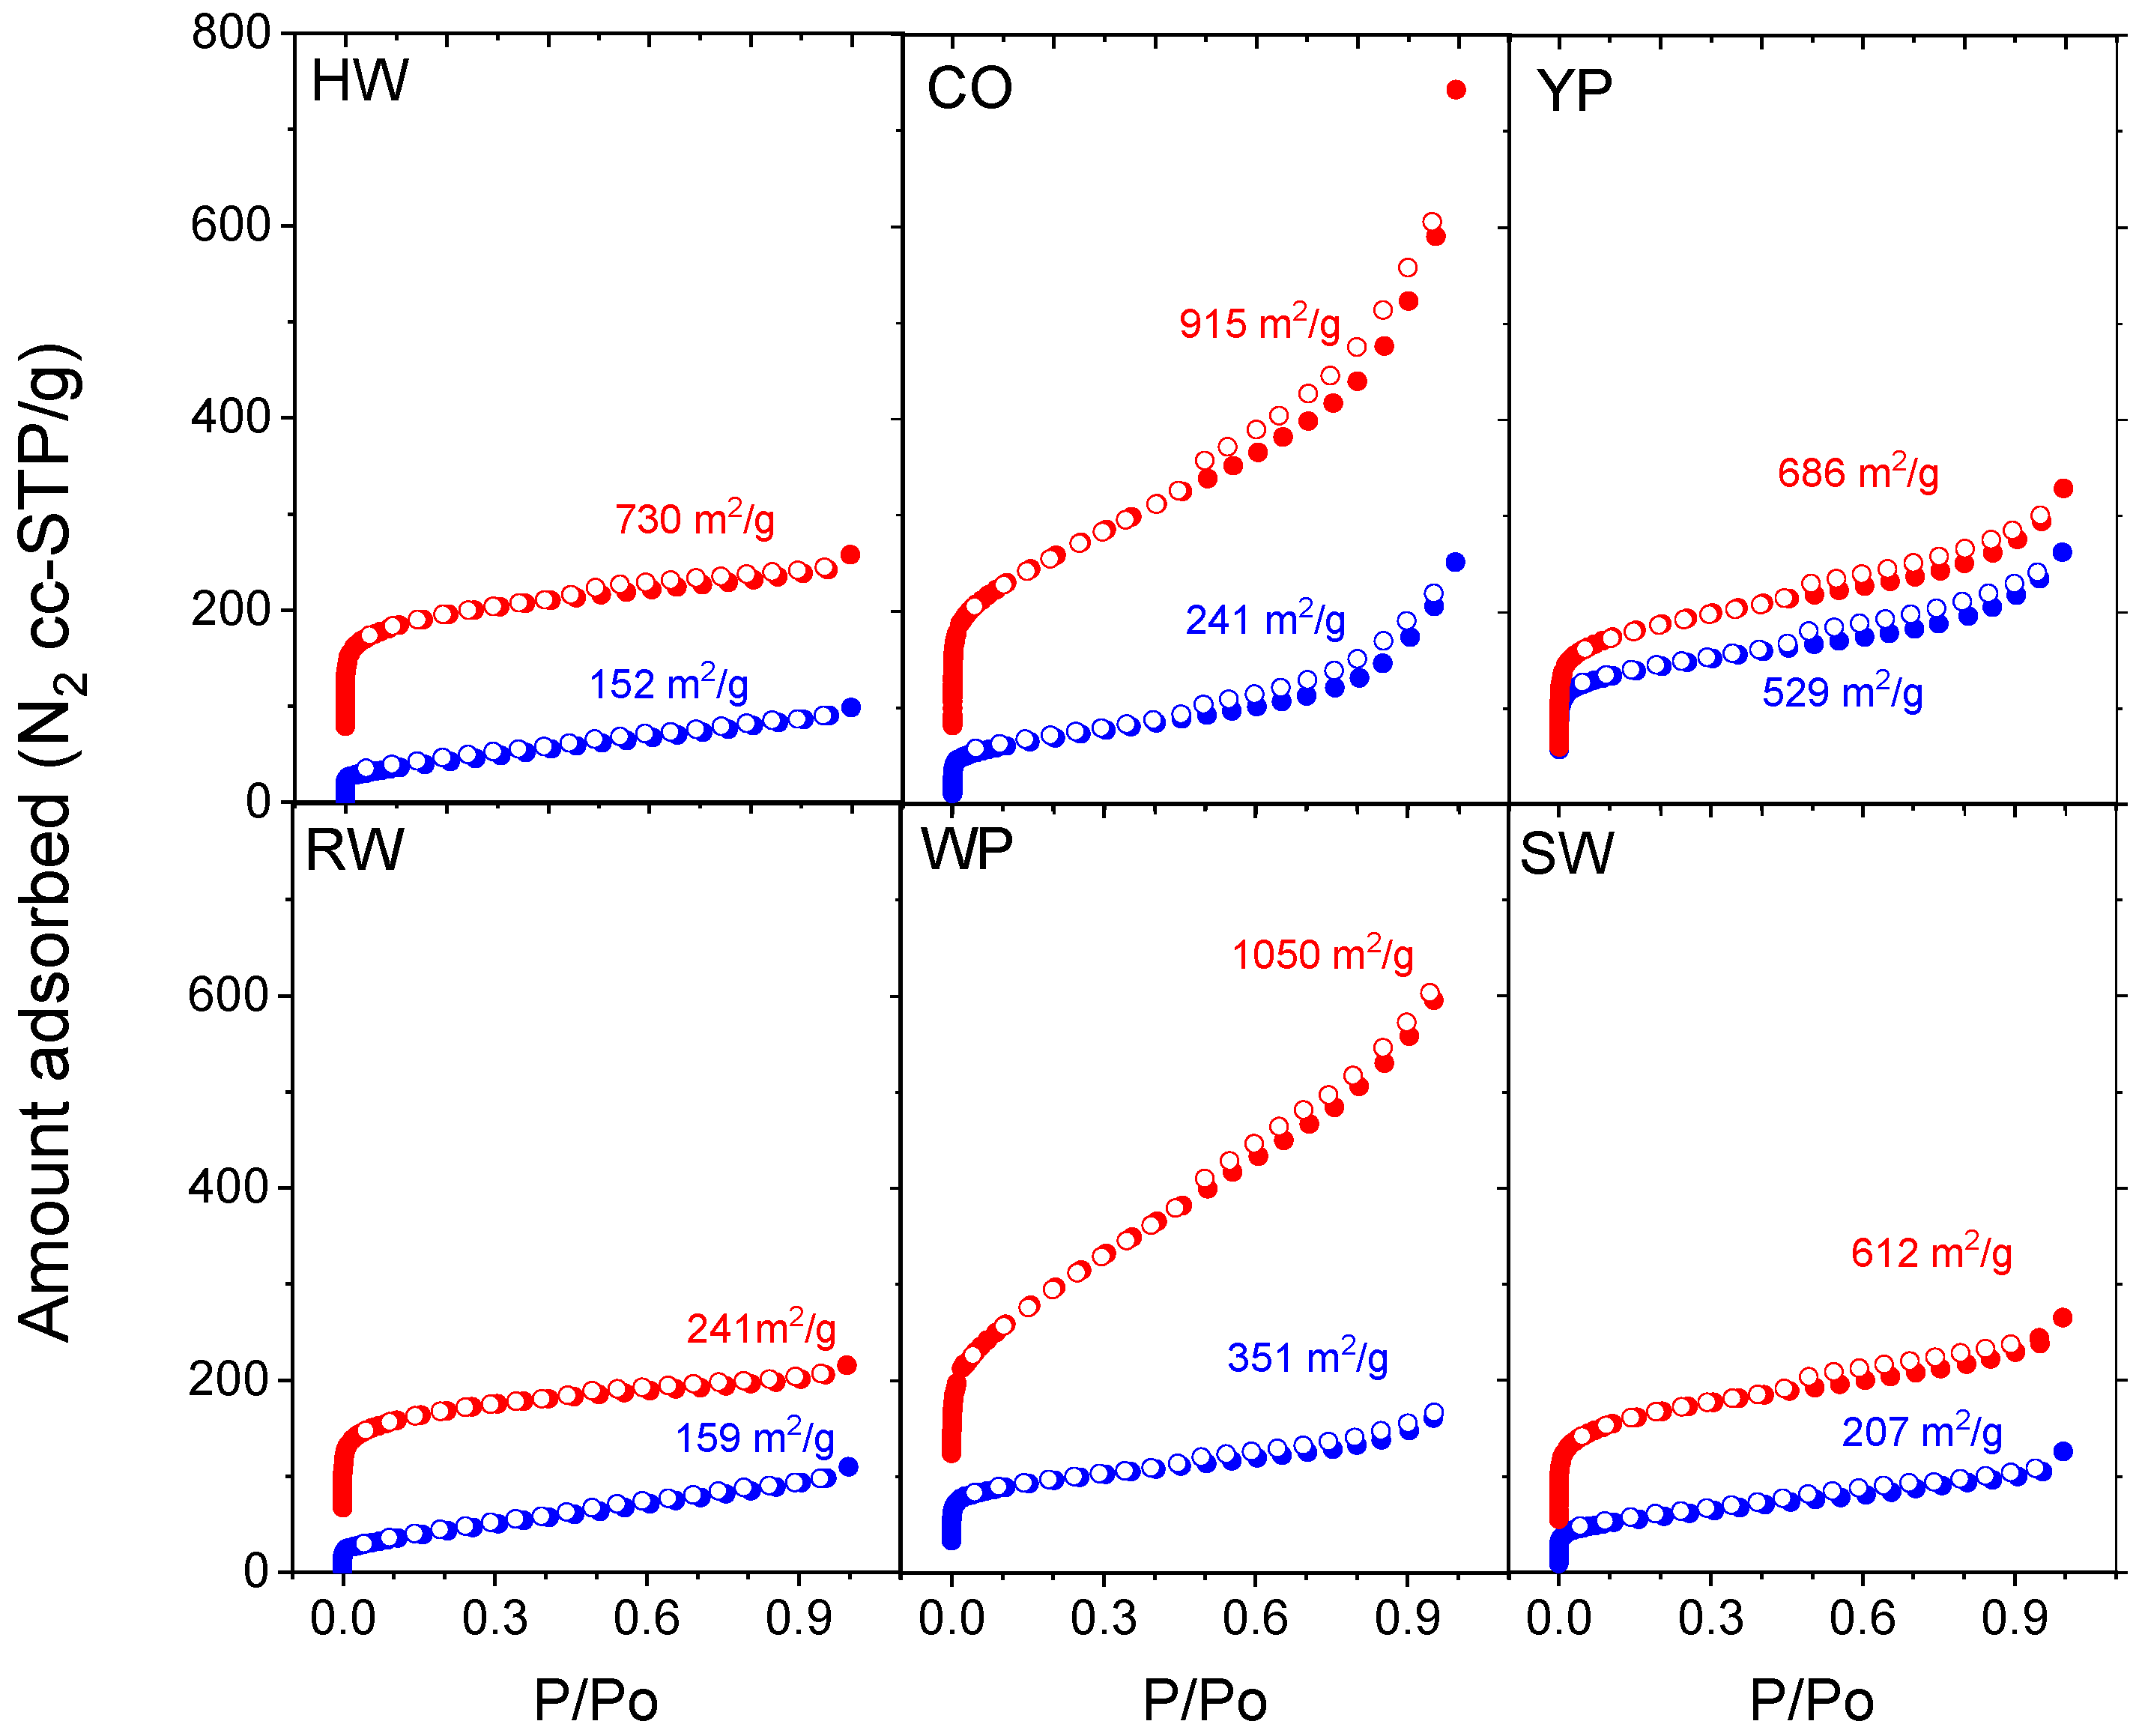
Figure 5 shows representative nitrogen adsorption/desorption isotherms for initial charred materials and their corresponding activated carbons. Table 1 summarizes the BET surface area, the volume of open pores (<300 nm), mesopores, and micropores, and the respective fractions of micropores and mesopores before and after activation at 800 °C. The initial chars have already some porosity, which was generated during high-temperature pyrolysis. After activation at 800 °C, all BET surface areas increased by a factor between 1.3 (YP) and 4.8 (HW) times. The carbons derived from WP and CO chars show a 3.0–3.8 times increase in BET surface areas, reaching the largest values of all specimens, in the range of 950–1050 m2/g after activation.
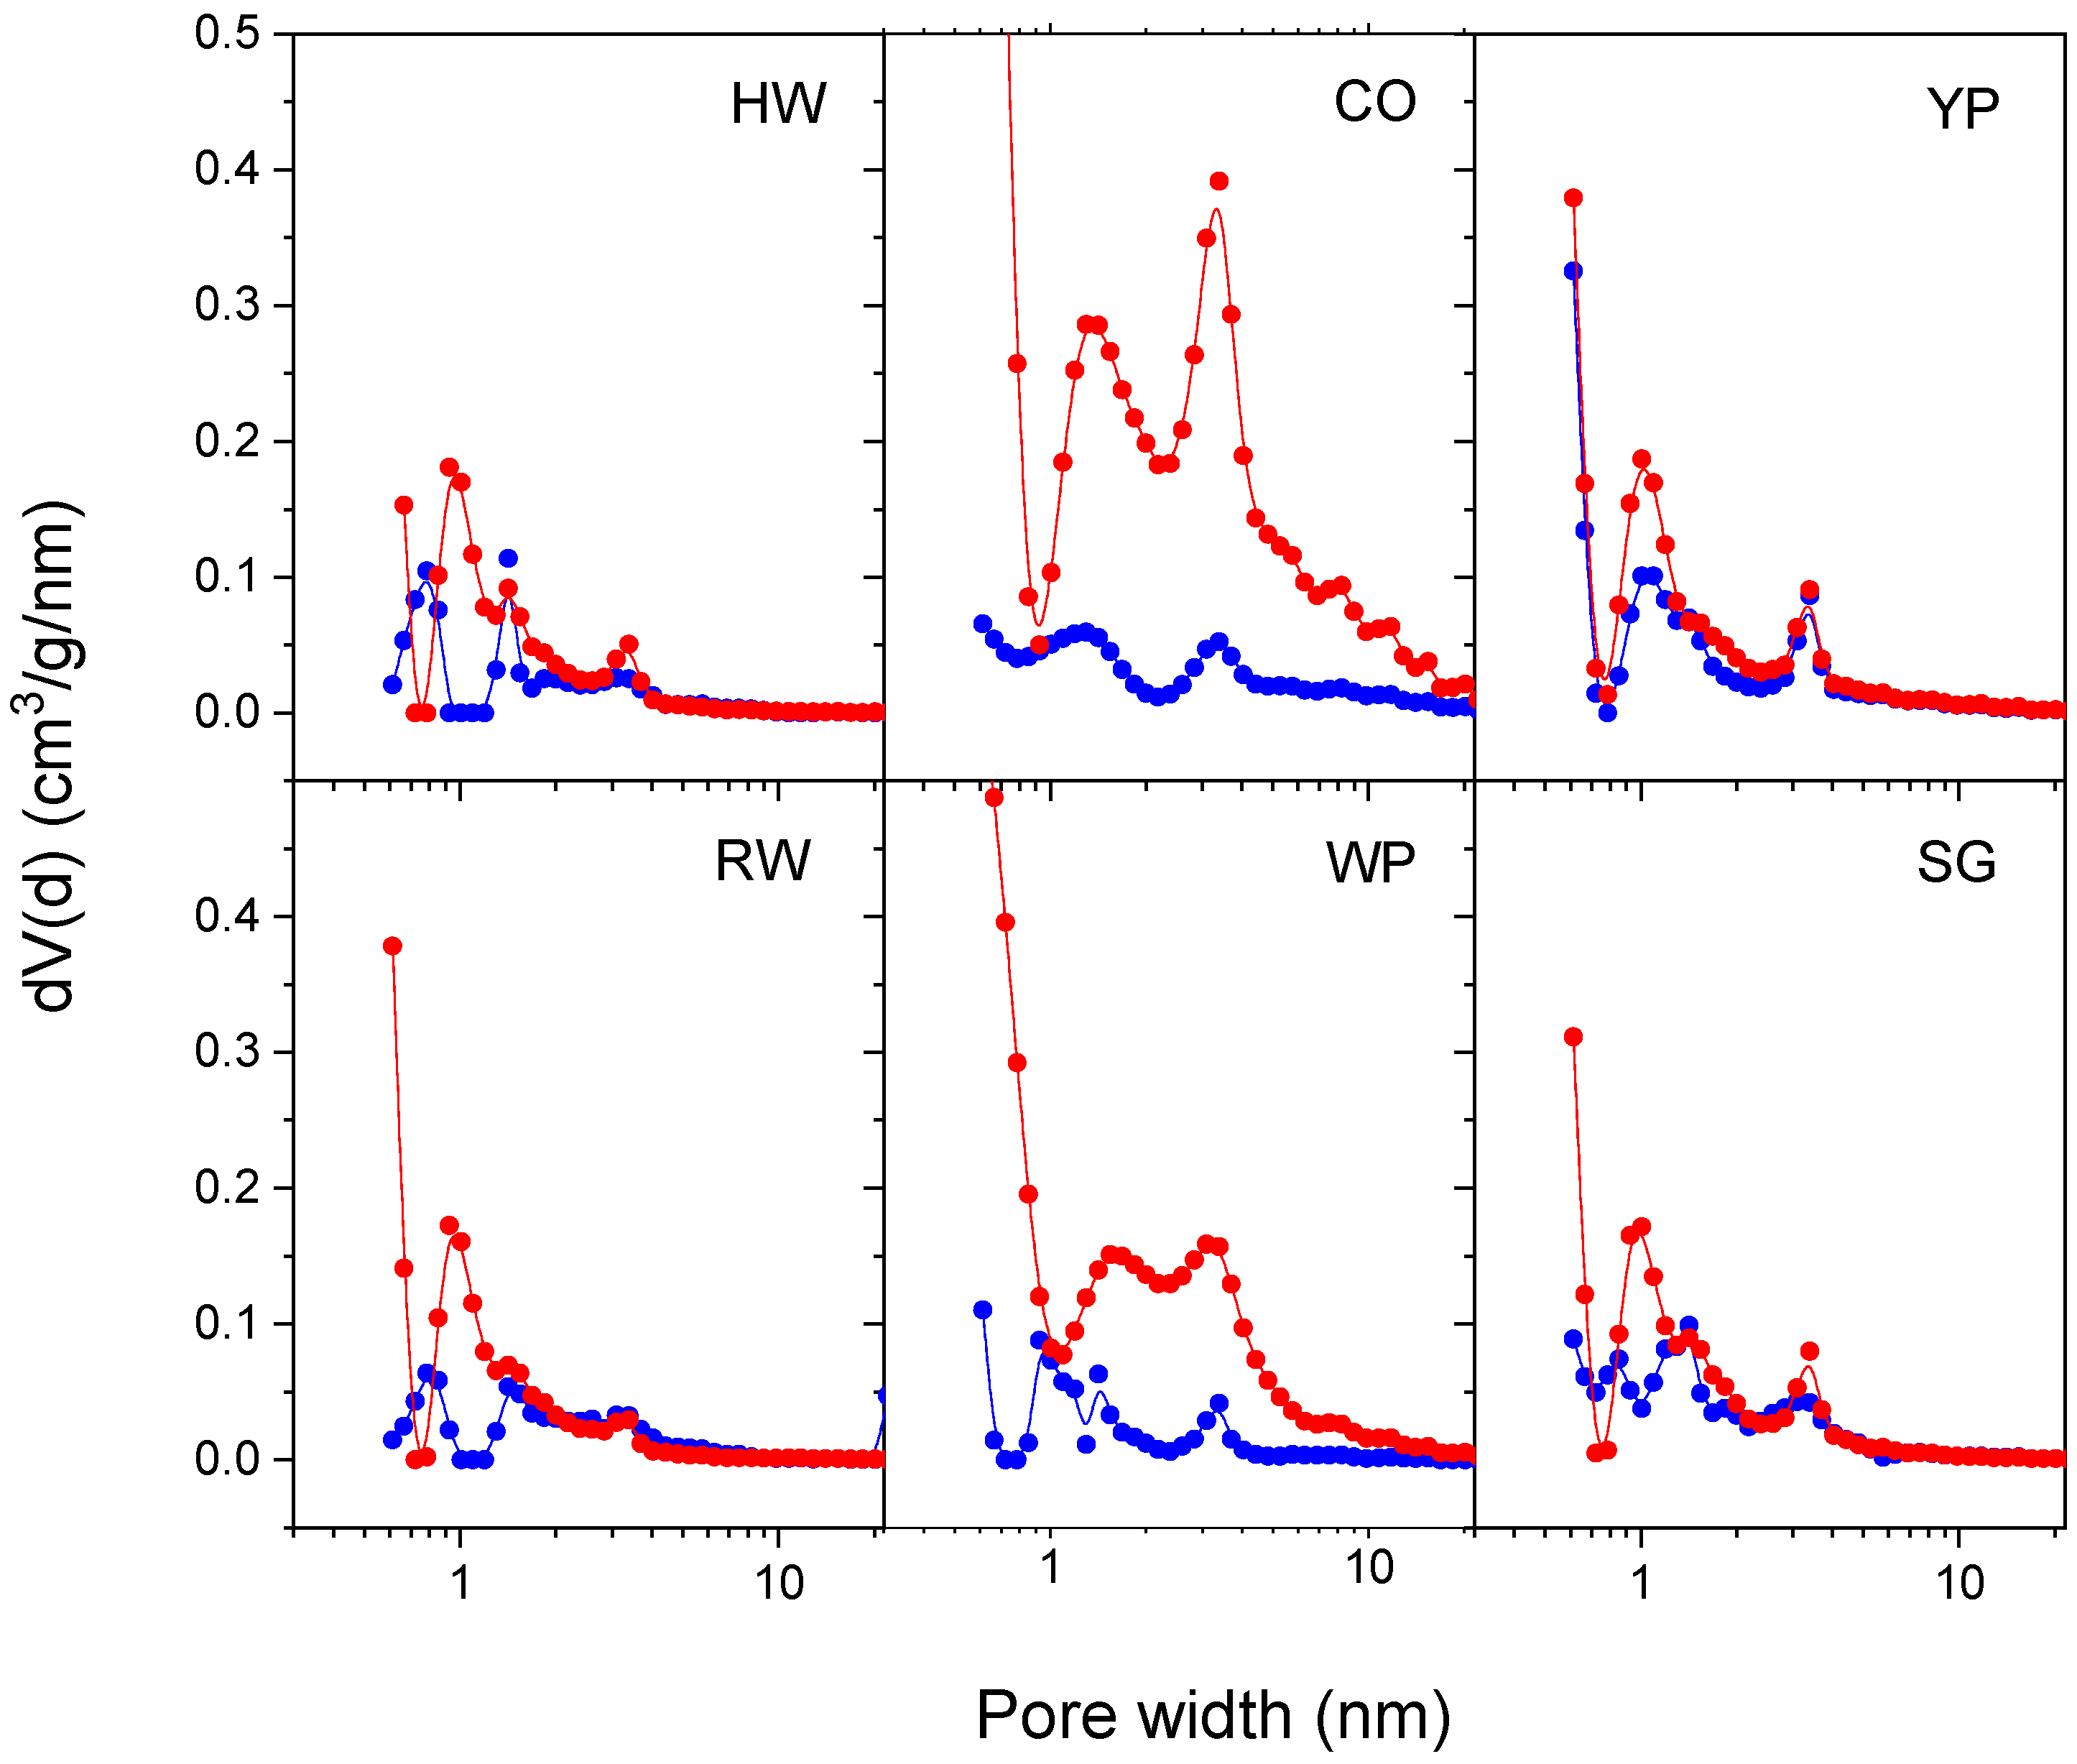
Figure 6 shows differential pore size distributions for all samples, before and after activation at 800 °C. Again, samples CO and WP show the largest increase of porosity after activation, especially in the range of mesopores (2–50 nm). Thus, the pore size distributions explain the origin of hysteresis on the isotherms plots, Figure 5.

4. Discussion

Using charred materials from various raw materials—pyrolyzed at identical conditions and physically activated to weight losses in a narrow range (30–35%)—made it possible to seek correlations between the nature of raw lignocellulose materials and the properties of char intermediates, on one hand, and function-enabling properties of activated carbons, on the other hand. It is generally agreed that the properties of activated carbons depend largely on the nature of lignocellulosic precursors, carbonization (pyrolysis) conditions, and activation procedures. Of the three components of lignocellulosic precursors—hemicellulose, cellulose, and lignin—lignin is more resistant to the thermal process and ends as the main component of chars and activated carbons [6]. Cellulose and hemicellulose are thermally decomposed in larger proportion than lignin and end as being a minor component in charred materials and in physically activated carbons. Thus, the ratio of cellulose, hemicelluloses, and lignin in the charred precursor determine the properties of the activated carbon, but in different ways and in proportion to their initial weight content: thermally labile cellulose and hemicelluloses contribute to the pore system, while the more resistant lignin is retrieved in the solid carbon matrix.
Since the steps of biomass pyrolysis and physical activation of chars were done (as close as possible) in similar conditions, a closer look into the results may possibly reveal correlations, if any, between the nature of raw lignocellulosic materials, properties of intermediate chars, process conditions during activation, and useful properties of the end products—activated carbons. Searching for correlations between the raw material (wood, grass) and the product (activated carbon) is difficult because the sequence of physical and chemical transformations along the process chain may have weakened or even hidden any causality.
Table 1 summarizes available information on raw biomass, charred materials, and activated carbons, including porosity, and surface area. The raw biomass contains significant amounts of moisture, and about half of its weight is elemental carbon. Analysis of dried wood crumbles before pyrolysis (Table 1) shows that volatile products (to be collected as biofuel and gas products in the fast pyrolysis process) represent about 90% of weight, fixed carbon (to be retrieved as biochar) represents 4–8 wt %, and mineral ash is less than 2 wt %. The biochars contain much lower amounts of moisture and volatile products, and their carbon yield after TGA analysis in N2 at 1000 °C (Figure 3) is 80–90%. No attempts were made to determine the ash content in this carbon solid. Activation in CO2 at 800 °C yields roughly 50–72% activated carbon, based on the initial char weight. The weight loss in the gasification reaction with CO2 is 20–45%, and the difference is made by moisture and volatiles.
Rutherford et al. [36] studied chemical processes during pyrolysis of pine bark, pine wood, and poplar wood. They reported that thermal degradation of cellulose and hemicellulose in the early stages (below ~250 °C) is accompanied by an increase of aromatic structures, a decrease of aliphatic structures, and release of hydrogen and oxygen at a faster rate than carbon oxides. These conclusions were supported by Zhao et al. [24] who performed TGA runs up to 900 °C in nitrogen using pure chemical components. They found that the decomposition of cellulose occurs in one sharp step (335 °C) and is almost complete at 900 °C; decomposition of hemicellulose occurs in two sharp steps (295 and ~750 °C) with little residue (~15%) at 900 °C; and thermolysis of lignin is a continuous process (~300–600 °C) with a larger residue (35%) at 900 °C.
The original charred materials used in this work have already porous structure (Table 1), with BET surface areas between 150 m2/g (HW) and 530 m2/g (YP). Interestingly, the chars that produced activated carbons with the highest BET surface area after oxidation by CO2 have had modest surface areas before activation: 250 m2/g (CO) and 340 m2/g (WP). This proves that the activation step plays an important role in determining the final properties of activated carbons. As reiterated by Cha et al. [37] in a recent review, porosity is generated during activation by selective oxidation of the weakest, unstructured regions in the charred material, where fine pores are developed. The kinetics of the oxidation process appears to be a key factor in controlling porosity.
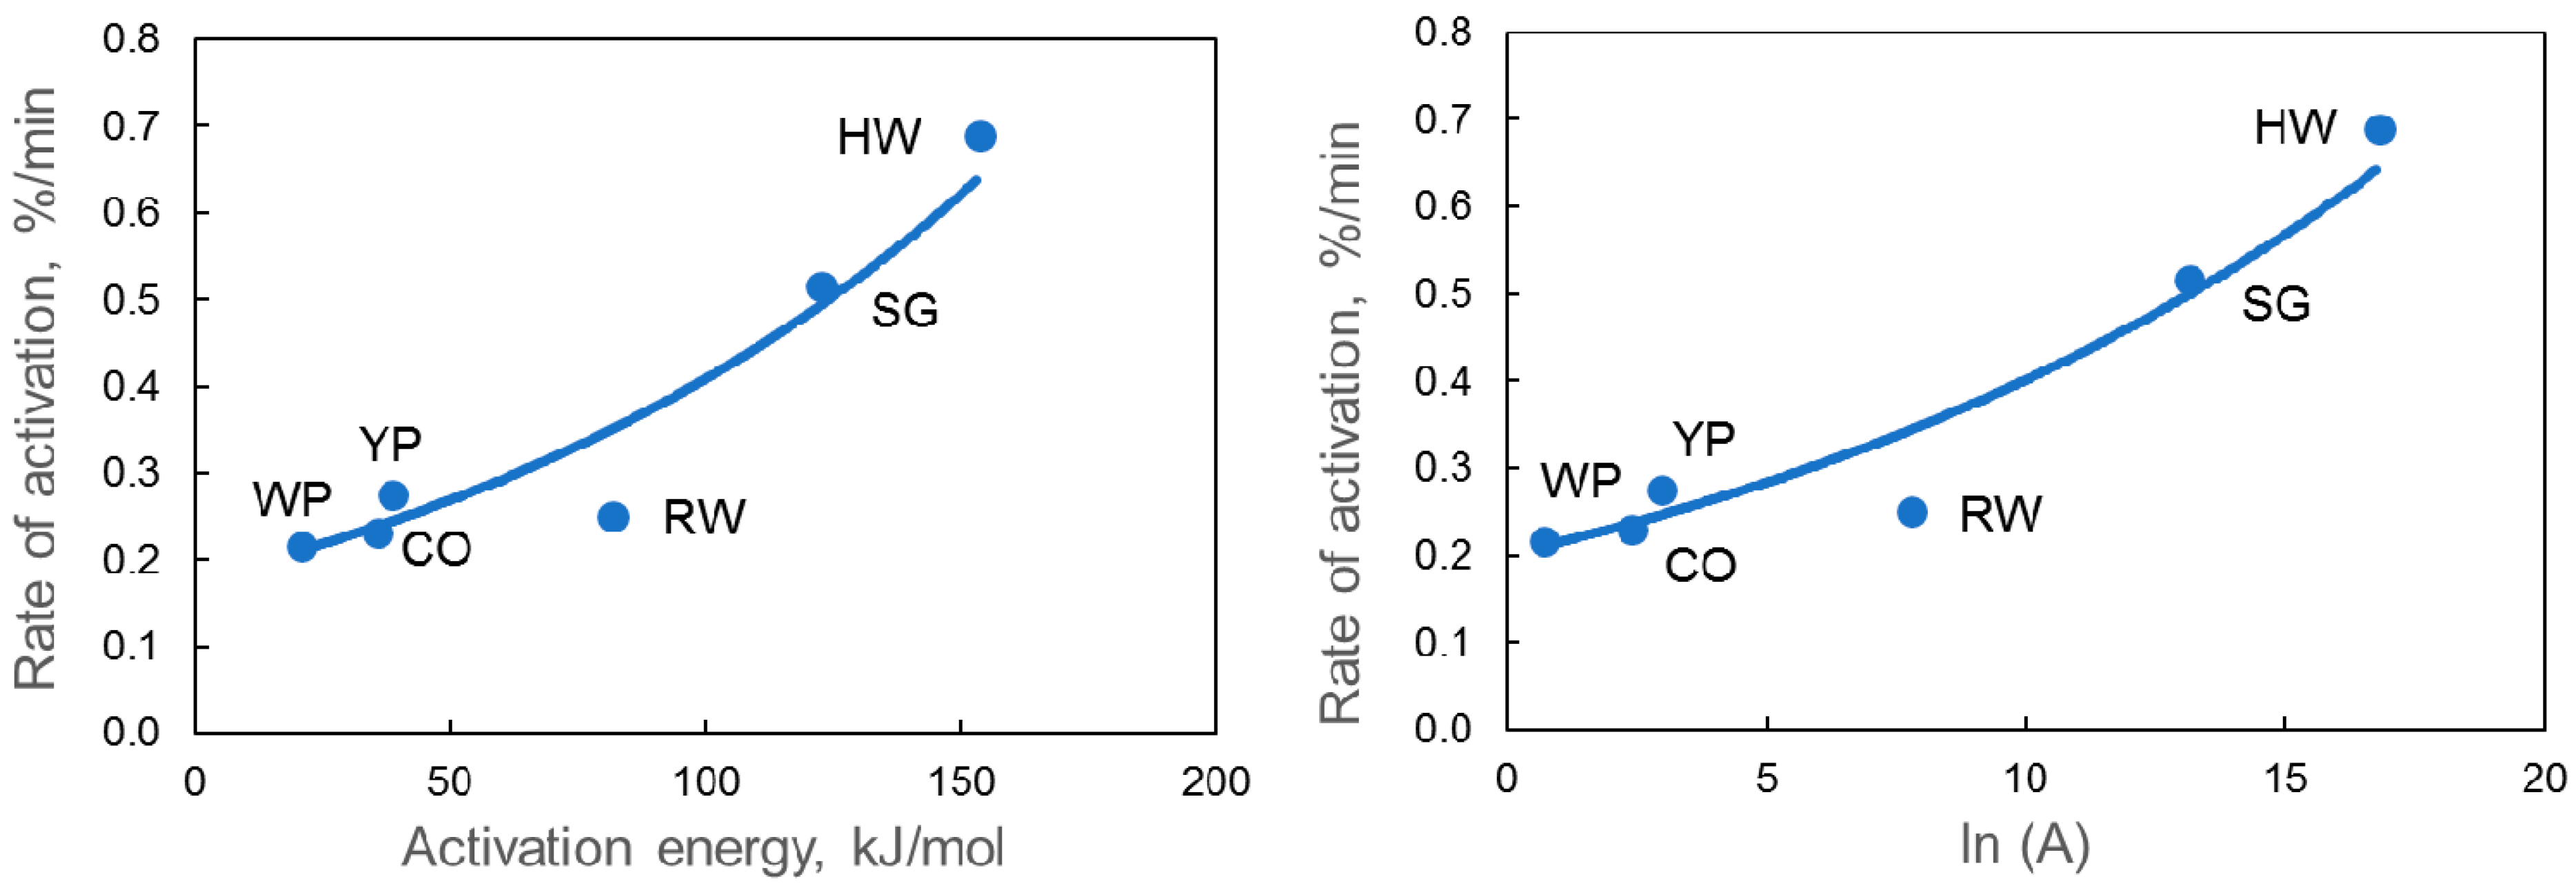
The compensation relationship between Eact and ln(A) in oxidation kinetics by CO2 (Figure 4) has direct effects on the rate of activation, as illustrated in Figure 7. The rate of activation increases with the increase of both parameters, but in different ways. The activated carbons with the largest BET area, WP, and CO, were obtained with the slowest oxidation reaction rates, corresponding to the lowest Eact and ln(A). They have been exposed the longest times at 800 °C before reaching the target weight loss. The slow rates of activation allowed extensive development of surface area and porosity. It is also observed from Table 1 that both WP and CO chars have similar moisture and volatile contents, but WP lost more weight in the gasification step at 800 °C (35%) than CO (21%). As a result, WP developed larger surface area and pore volume (1050 m2/g; 1.44 cm3/g) than CO (915 m2/g; 1.15 cm3/g). However, in relative terms, the fraction of mesopores (2–50 nm) in the total pore volume is equal and large (73%) for both these activated carbons. The dominant mesoporous structure of activated WP and CO carbons (Figure 6) is an advantage for solution applications. It enables good penetration of the electric double layer at carbon/solution interface, and enhances adsorption properties not only for hydrated ions but also for large organic molecules (dyes, antibiotics) and micelles in colloidal solutions (oil in water, proteins) etc.
In contrast, the activated carbon derived from HW has moderate BET surface area (730 m2/g) and total pore volume (0.40 cm3/g) and contains a large proportion (67%) of micropores (<2 nm). The HW char had the faster oxidation reaction in CO2, supported by the largest kinetic parameters (Figure 7). A high proportion of micropores is desirable for gas phase applications based on adsorption in molecular-sized micropores, such as gas cleaning, storage, and separation.
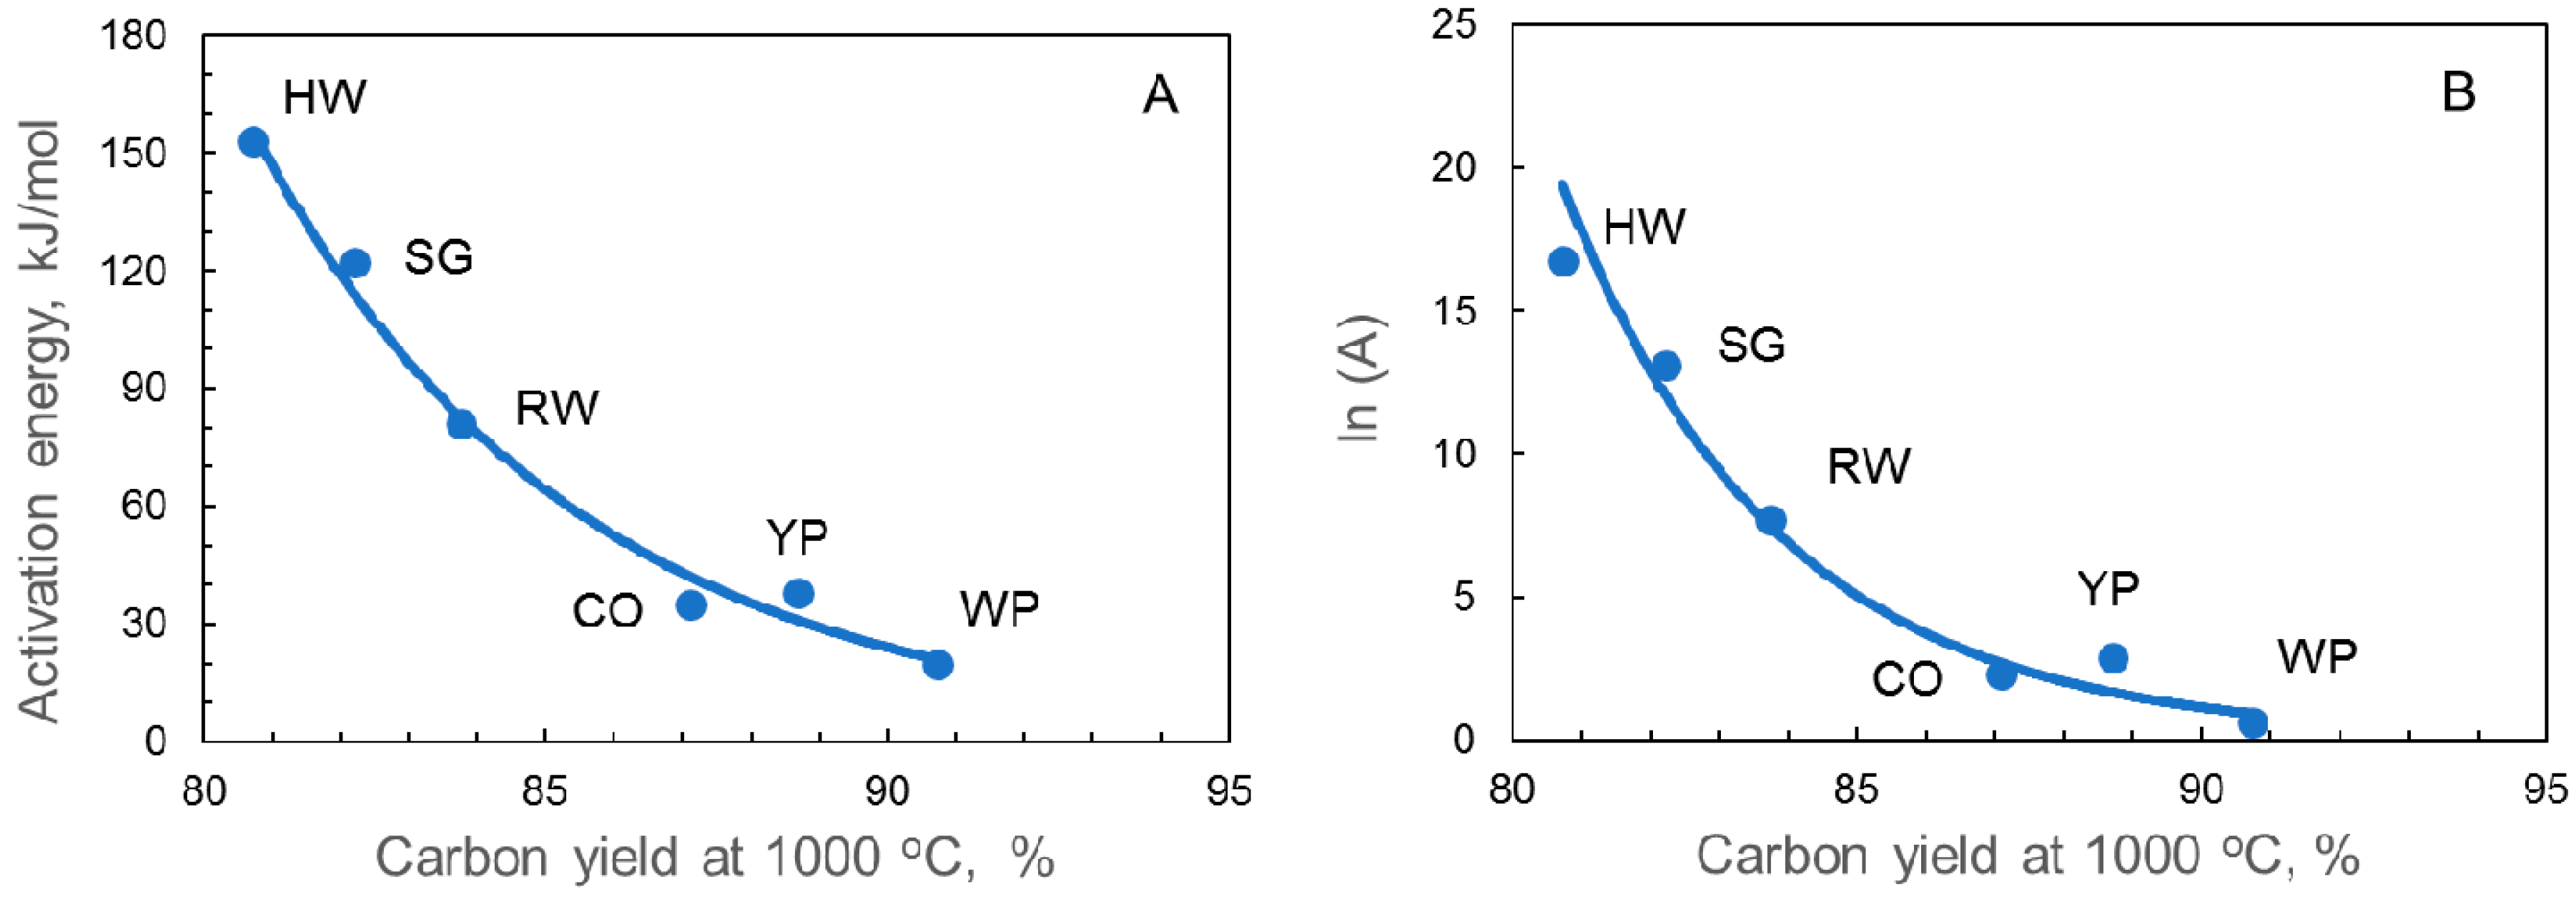
Since the rate of activation in CO2 appears as an important factor for the development of porosity in the activated carbon, it is interesting to examine which char properties determine the rate of oxidation by CO2. Figure 8 shows correlations between Eact and ln(A) parameters, on one hand, and the carbon yield in TGA tests at 1000 °C in dry nitrogen (Table 1) on the other hand. Three of the four best ranking activated carbons based on the BET surface area (WP, CO, YP) were obtained from chars with the largest carbon yield in nitrogen. Apparently, high carbon yields at 1000 °C characterize more robust chars with slow activation rates (consistent with low Eact and ln(A)) which generate high surface areas. However, this rule is not obeyed by HW, an oak-hickory mixture ranked third on the BET scale. Although the charred HW gave the lowest carbon yield at 1000 °C, its reaction rate in CO2 was the fastest (Figure 7) and the kinetic parameters were the largest (Figure 4).
The above correlations gain substance when analyzed in the context of chemical processes that occur during thermal treatments. It is known that the major transformation occurring during pyrolysis of lignocellulose materials above 400–500 °C is the development of aromatic structures. Lignin already contains aromatic structures and is more resistant to pyrolysis and oxidation than cellulose and hemicellulose [38]. At 800 °C, some biochars may still contain small amounts of aliphatic carbon from untransformed cellulose, but the major content is lignin carbon with fused aromatic rings. Dehydrogenation and condensation of aromatic structures intensify above 800–900 °C and continue at 1000 °C. The lignin-derived carbon provides the matrix for the development of microporosity. Low weight losses (of hydrogen) during dwelling for 30 min at 1000 °C and high carbon yields at the end of the thermal process in nitrogen signify the presence of robust, well-structured aromatic carbon in the materials derived from WP, CO, and YP chars. They will be converted to activated carbons with large BET surface area.
Oxidation by CO2 is endothermic and becomes thermodynamically possible only after about 700 °C; the rates increase significantly from 900 °C or 950 °C [39]. Porosity is generated in the reaction of CO2 with organized aromatic structures of lignin-derived carbon, as found in the solid residue left from TGA runs in nitrogen at 1000 °C. If disordered hemicellulose-derived carbon structures were still present in biochar at 800 °C, they would be oxidized by CO2 but would not contribute much to the development of porosity and increase in surface area. Indeed, materials with the lowest carbon yields (HW, SG, RW) produced activated carbons with low surface areas and a large proportion of micropores.
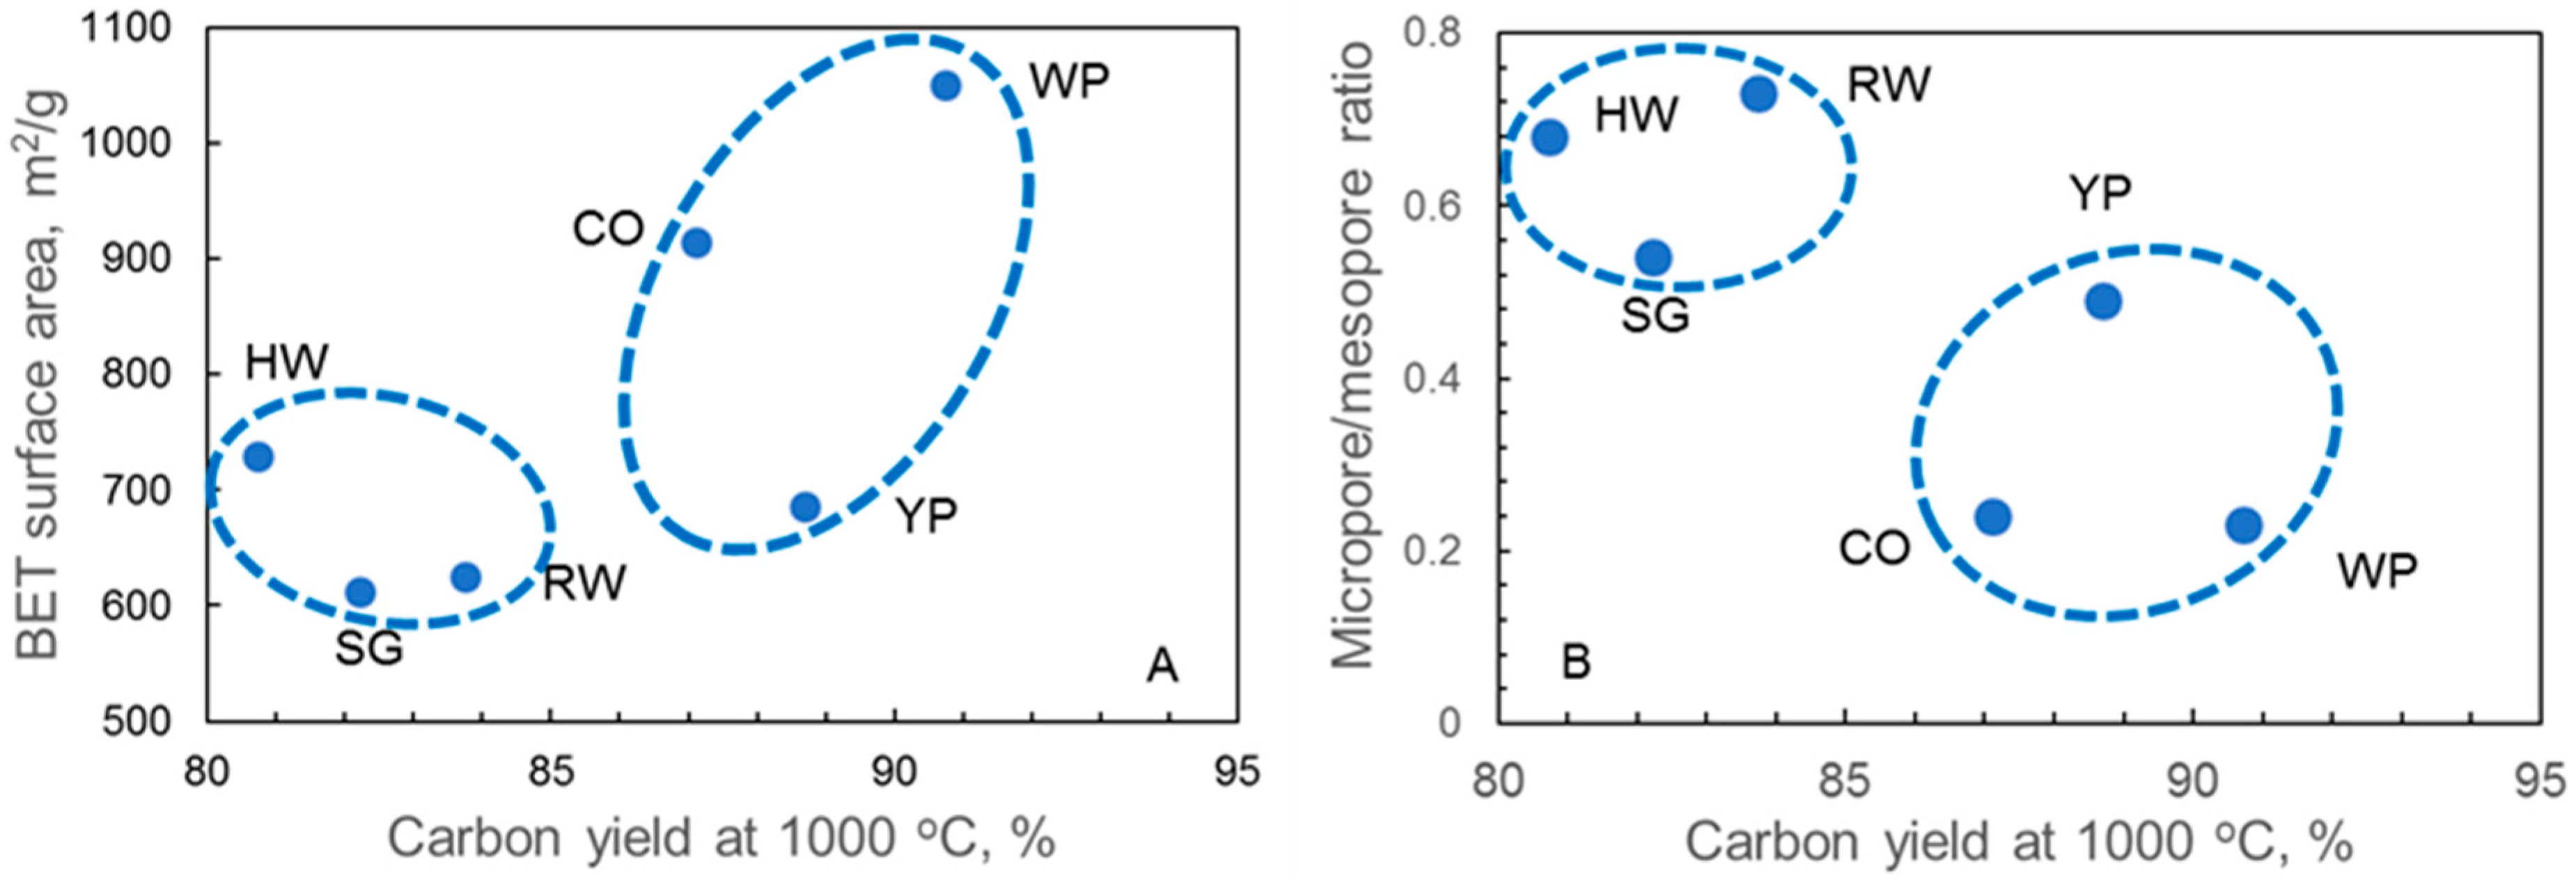
Figure 9A,B illustrate these conclusions. They compare BET values of activated carbons and the corresponding micropore/mesopore volumes ratios against the final carbon yield at 1000 °C in nitrogen (Figure 3). The six activated carbons form two groups. Those chars with high carbon yield (YP, CO, WP) generate activated carbons with high BET surface area and more mesopores in their total porosity. Indeed, robust chars with slow activation rates have spent longer times in the activation step and develop larger pores and higher BET areas. Less robust chars, with low carbon yield in dry nitrogen (HW, RW, SG) have faster reaction rates during activation, which leads to primary development of micropores but limits the growth of BET surface area. A paradoxical situation is observed: in the group of activated carbon studied here, large surface area carbons are mostly mesoporous, while microporous carbons have quite low surface area. This contrasts with the known trends observed during physical activation of any given char, where initial development of micropores expands BET area, and further collapse of micropores into mesopores drops it. Evidently, comparing activated carbons obtained from different charred sources is not expected to reproduce familiar trends encountered in activation of uniquely sourced chars.

5. Conclusions

This work demonstrates that the charred carbon byproducts produced during fast pyrolysis of lignocellulosic biomass can be easily converted into porous (activated) carbons. After pyrolysis in similar conditions and physical activation with CO2 to average weight losses in the 30–35% range, the biochars produced a large diversity of activated carbons, with surface areas of 600–1100 m2/g and pore volumes (<300 nm) of 0.4–1.4 cm3/g. The carbons with the highest surface area were mostly mesoporous, while those with the lowest surface areas were predominantly microporous. It appears that the controlling factor for the proportion of micropores and mesopores in activated carbons is the kinetics of oxidation by CO2. The chars derived from chestnut oak (CO) and from white pine (WP) were converted with slow kinetics to mesoporous porous carbons with surface areas of 915 m2/g and 1050 m2/g respectively, comparable to numerous commercial carbons suitable for adsorption from solution applications. More work is needed to understand the relationship between the properties of initial biomaterials, charred derivatives, and the activated carbons obtained by physical activation.

Author Contributions

Conceptualization, N.C.G.; Data curation, S.P.A.; Formal analysis, C.I.C.; Funding acquisition, N.C.G.; Investigation, C.I.C., N.C.G., and N.D.E.; Methodology, C.I.C.; Project administration, C.I.C. and N.C.G.; Resources, N.D.E. and B.E.B.; Supervision, N.C.G.; Validation, B.E.B.; Visualization, N.D.E.; Writing—original draft, S.P.A.; Writing—review & editing, C.I.C. and S.P.A.

Funding

This work was funded by the State of Tennessee in partnership with the University of Tennessee and Oak Ridge National Laboratory through the RevV! Manufacturing Voucher program.

Acknowledgments

The research at Oak Ridge National Laboratory (ORNL), managed by UT Battelle, LLC, for the U.S. Department of Energy (DOE) under contract E-AC05-00OR22725 was sponsored through the RevV! Program by the State of Tennessee, in partnership with the University of Tennessee and Oak Ridge National Laboratory under Cooperative Research and Development Agreement (CRADA) NFE-15-05573. One of the authors (SPA) was supported by the Postdoctoral Professional Development program at ORNL. The authors thank J. Bierkamp (Proton Power, Inc.) for continuous interest in and support for this project.

Conflicts of Interest

This manuscript has been authored by UT-Battelle, LLC under Contract No. DE-AC05-00OR22725 with the U.S. Department of Energy. The United States Government retains and the publisher, by accepting the article for publication, acknowledges that the United States Government retains a non-exclusive, paid-up, irrevocable, world-wide license to publish or reproduce the published form of this manuscript, or allow others to do so, for United States Government purposes. The Department of Energy will provide public access to these results of federally sponsored research in accordance with the DOE Public Access Plan (http://energy.gov/downloads/doe-public-access-plan).

References

  1. González-García, P. Activated carbon from lignocellulosics precursors: A review of the synthesis methods, characterization techniques and applications. Renew. Sustain. Energy Rev. 2018, 82, 1393–1414. [Google Scholar] [CrossRef]
  2. Nor, N.M.; Lau, L.C.; Lee, K.T.; Mohamed, A.R. Synthesis of activated carbon from lignocellulosic biomass and its applications in air pollution control—A review. J. Environ. Chem. Eng. 2013, 1, 658–666. [Google Scholar] [CrossRef]
  3. Vilella, P.C.; Lira, J.A.; Azevedo, D.C.S.; Bastos-Neto, M.; Stefanutti, R. Preparation of biomass-based activated carbons and their evaluation for biogas upgrading purposes. Ind. Crop. Prod. 2017, 109, 134–140. [Google Scholar] [CrossRef]
  4. Radovic, L.R.; Silva, I.F.; Ume, J.I.; Menéndez, J.A.; Leon, C.A.L.Y.; Scaroni, A.W. An experimental and theoretical study of the adsorption of aromatics possessing electron-withdrawing and electron-donating functional groups by chemically modified activated carbons. Carbon 1997, 35, 1339–1348. [Google Scholar] [CrossRef]
  5. Figueiredo, J.; Pereira, M.F.; Freitas, M.M.; Órfão, J.J. Modification of the surface chemistry of activated carbons. Carbon 1999, 37, 1379–1389. [Google Scholar] [CrossRef]
  6. Cagnon, B.; Py, X.; Guillot, A.; Stoeckli, F.; Chambat, G. Contributions of hemicellulose, cellulose and lignin to the mass and the porous properties of chars and steam activated carbons from various lignocellulosic precursors. Bioresour. Technol. 2009, 100, 292–298. [Google Scholar] [CrossRef] [PubMed] [Green Version]
  7. Ioannidou, O.; Zabaniotou, A. Agricultural residues as precursors for activated carbon production—A review. Renew. Sustain. Energy Rev. 2007, 11, 1966–2005. [Google Scholar] [CrossRef]
  8. Suhas; Carrott, P.J.M.; Carrott, M.M.L.R. Lignin—From natural adsorbent to activated carbon: A review. Bioresour. Technol. 2007, 98, 2301–2312. [Google Scholar] [CrossRef] [PubMed]
  9. Gratuito, M.K.B.; Panyathanmaporn, T.; Chumnanklang, R.-A.; Sirinuntawittaya, N.; Dutta, A. Production of activated carbon from coconut shell: Optimization using response surface methodology. Bioresour. Technol. 2008, 99, 4887–4895. [Google Scholar] [CrossRef] [PubMed]
  10. Yahya, M.A.; Al-Qodah, Z.; Ngah, C.W.Z. Agricultural bio-waste materials as potential sustainable precursors used for activated carbon production: A review. Renew. Sustain. Energy Rev. 2015, 46, 218–235. [Google Scholar] [CrossRef]
  11. Yakout, S.M.; El-Deen, G.S. Characterization of activated carbon prepared by phosphoric acid activation of olive stones. Arab. J. Chem. 2016, 9, S1155–S1162. [Google Scholar] [CrossRef]
  12. Li, W.; Peng, J.; Zhang, L.; Yang, K.; Xia, H.; Zhang, S.; Guo, S. Preparation of activated carbon from coconut shell chars in pilot-scale microwave heating equipment at 60 kW. Waste Manag. 2009, 29, 756–760. [Google Scholar] [CrossRef] [PubMed]
  13. Daud, W.M.A.W.; Ali, W.S.W.; Sulaiman, M.Z. The effects of carbonization temperature on pore development in palm-shell-based activated carbon. Carbon 2000, 38, 1925–1932. [Google Scholar] [CrossRef]
  14. Paethanom, A.; Yoshikawa, K. Influence of pyrolysis temperature on rice husk char characteristics and its tar adsorption capability. Energies 2012, 5, 4941–4951. [Google Scholar] [CrossRef]
  15. Correa, C.R.; Stollovsky, M.; Hehr, T.; Rauscher, Y.; Rolli, B.; Kruse, A. Influence of the carbonization process on activated carbon properties from lignin and lignin-rich biomasses. ACS Sustain. Chem. Eng. 2017, 5, 8222–8233. [Google Scholar] [CrossRef]
  16. Lehmann, J.; Gaunt, J.; Rondon, M. Bio-char Sequestration in terrestrial ecosystems—A review. Mitig. Adapt. Strat. Glob. Chang. 2006, 11, 403–427. [Google Scholar] [CrossRef]
  17. McFarlane, Z.D.; Myer, P.R.; Cope, E.R.; Evans, N.D.; Bone, T.C.; Biss, B.E.; Mulliniks, J.T. Effect of biochar type and size on in vitro rumen fermentation of orchard grass hay. Agric. Sci. 2017, 8, 316–325. [Google Scholar] [CrossRef]
  18. Chen, Y.; Zhang, X.; Chen, W.; Yang, H.; Chen, H. The structure evolution of biochar from biomass pyrolysis and its correlation with gas pollutant adsorption performance. Bioresour. Technol. 2017, 246, 101–109. [Google Scholar] [CrossRef] [PubMed]
  19. Inguanzo, M.; Menendez, J.A.; Fuente, E.; Pis, J.J. Reactivity of pyrolyzed sewage sludge in air and CO2. J. Anal. Appl. Pyrolysis 2001, 58, 943–954. [Google Scholar] [CrossRef]
  20. Brunauer, S.; Emmett, P.H.; Teller, E. Adsorption of gases in multimolecular layers. J. Am. Chem. Soc. 1938, 60, 309–319. [Google Scholar] [CrossRef]
  21. Sarath, G.; Mitchell, R.B.; Sattler, S.E.; Funnell, D.; Pedersen, J.F.; Graybosch, R.A.; Vogel, K.P. Opportunities and roadblocks in utilizing forages and small grains for liquid fuels. J. Ind. Microbiol. Biotechnol. 2008, 35, 343–354. [Google Scholar] [CrossRef] [PubMed] [Green Version]
  22. Rouquerol, J.; Avnir, D.; Fairbridge, C.W.; Everett, D.H.; Haynes, J.M.; Pernicone, N.; Ramsay, J.D.F.; Sing, K.S.W.; Unger, K.K. Recommendations for the characterization of porous solids (Technical Report). Pure Appl. Chem. PAC 1994, 66, 1739–1758. [Google Scholar] [CrossRef] [Green Version]
  23. Bahadur, J.; Contescu, C.I.; Rai, D.K.; Gallego, N.C.; Melnichenko, Y.B. Clustering of water molecules in ultramicroporous carbon: In-situ small-angle neutron scattering. Carbon 2017, 111, 681–688. [Google Scholar] [CrossRef]
  24. Zhao, C.; Jiang, E.; Chen, A. Volatile production from pyrolysis of cellulose, hemicellulose and lignin. J. Energy Inst. 2017, 90, 902–913. [Google Scholar] [CrossRef]
  25. Gorgulho, H.F.; Mesquita, J.P.; Gonçalves, F.; Pereira, M.F.R.; Figueiredo, J.L. Characterization of the surface chemistry of carbon materials by potentiometric titrations and temperature-programmed desorption. Carbon 2008, 46, 1544–1555. [Google Scholar] [CrossRef]
  26. Agrawal, R. The compensation effect: A fact or a fiction. J. Therm. Anal. Calorim. 1989, 35, 909–917. [Google Scholar] [CrossRef]
  27. Conner, W.C. A general explanation for the compensation effect: The relationship between ΔS and activation energy. J. Catal. 1982, 78, 238–246. [Google Scholar] [CrossRef]
  28. Feates, F.S.; Harris, P.S.; Reuben, B.G. Compensation effect in the kinetics of the catalysed oxidation of carbon. J. Chem. Soc. Faraday Trans. 1974, 70, 2011–2020. [Google Scholar] [CrossRef]
  29. Yip, K.; Ng, E.; Li, C.-Z.; Hayashi, J.-I.; Wu, H. A mechanistic study on kinetic compensation effect during low-temperature oxidation of coal chars. Proc. Combust. Inst. 2011, 33, 1755–1762. [Google Scholar] [CrossRef]
  30. Wang, S.; Dai, G.; Yang, H.; Luo, Z. Lignocellulosic biomass pyrolysis mechanism: A state-of-the-art review. Prog. Energy Combust. Sci. 2017, 62, 33–86. [Google Scholar] [CrossRef]
  31. McDougall, G.J. The physical nature and manufacture of activated carbon. J. S. Afr. Inst. Min. Metall. 1991, 91, 109–120. [Google Scholar]
  32. Marsh, H.; Rodríguez-Reinoso, F. Characterization of activated carbon. In Activated Carbon; Elsevier Science Ltd. Press: Oxford, UK, 2006; pp. 143–242. [Google Scholar] [CrossRef]
  33. Pendleton, P.; Wong, S.H.; Schumann, R.; Levay, G.; Denoyel, R.; Rouquero, J. Properties of activated carbon controlling 2-Methylisoborneol adsorption. Carbon 1997, 35, 1141–1149. [Google Scholar] [CrossRef]
  34. Al-Degs, Y.S.; El-Barghouthi, M.I.; Khraisheh, M.A.; Ahmad, M.N.; Allen, S.J. Effect of surface area, micropores, secondary micropores, and mesopores volumes of activated carbons on reactive dyes adsorption from solution. Sep. Sci. Technol. 2005, 39, 97–111. [Google Scholar] [CrossRef]
  35. Gisi, S.D.; Lofrano, G.; Grassi, M.; Notarnicola, M. Characteristics and adsorption capacities of low-cost sorbents for wastewater treatment: A review. Sustain. Mater. Technol. 2016, 9, 10–40. [Google Scholar] [CrossRef]
  36. Rutherford, D.W. Changes in Composition and Porosity Occurring During the Thermal Degradation of Wood and Wood Components; U.S. Dept. of the Interior, U.S. Geological Survey: Reston, VA, USA, 2005.
  37. Cha, J.S.; Park, S.H.; Jung, S.C.; Ryu, C.; Jeon, J.K.; Shin, M.C.; Park, Y.K. Production and utilization of biochar: A review. J. Ind. Eng. Chem. 2016, 40, 1–15. [Google Scholar] [CrossRef]
  38. Xie, X.; Goodell, B.; Zhang, D.; Nagle, D.C.; Qian, Y.; Peterson, M.L.; Jellison, J. Characterization of carbons derived from cellulose and lignin and their oxidative behavior. Bioresour. Technol. 2009, 100, 1797–1802. [Google Scholar] [CrossRef] [PubMed]
  39. Clark, T.J.; Woodley, R.E.; Halas, D.D.R. Gas-Graphite systems. In Nuclear Graphite; Nightingale, R.E., Ed.; Academic Press: New York, NY, USA, 2013; pp. 387–444. [Google Scholar] [CrossRef]
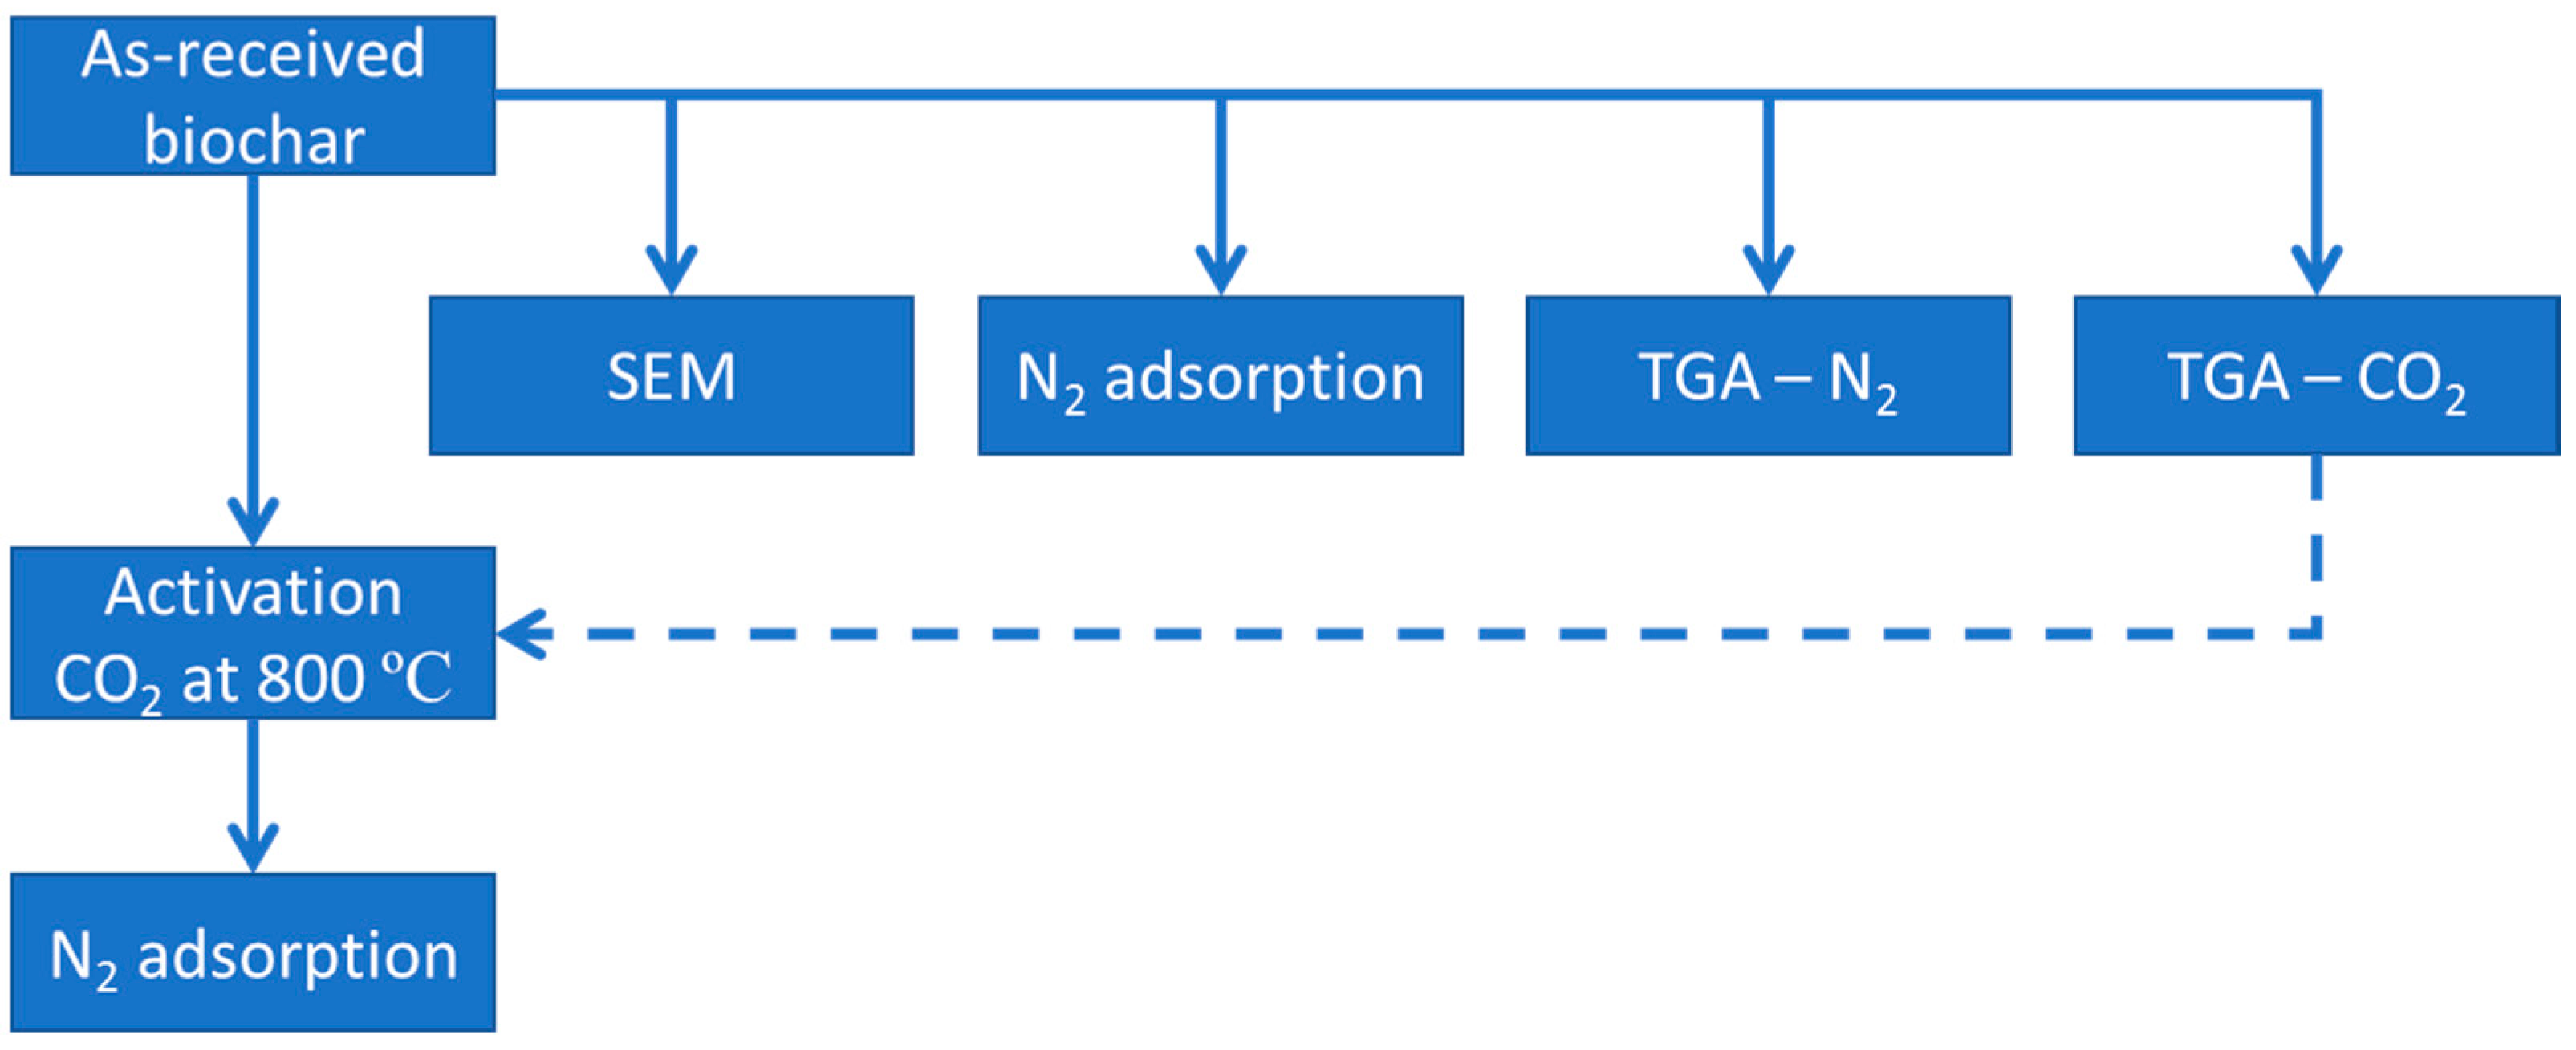
Figure 1. Sequence of experimental steps, from as-received biochars to activated carbons.
Carbon 04 00051 g001
Figure 2. SEM images of the char samples before activation at 100× (upper arrangement) and 500× magnification (bottom arrangement). The chars derived from HW, RW, and SG were not screened to 178 μm before imaging; those derived from CO, WP, and YP were screened to 178 μm before imaging.
Carbon 04 00051 g002
Figure 3. TGA data for representative char samples under N2. The three hardwood chars are plotted with continuous lines; the two softwood chars and the switchgrass char are plotted with broken lines.
Carbon 04 00051 g003
Figure 4. Linear correlation between pre-exponential factors and apparent activation energies.
Carbon 04 00051 g004
Figure 5. Nitrogen adsorption/desorption isotherms for carbon samples before and after physical activation at 800 °C. Blue symbols are used for char materials and red symbols for the corresponding activated carbons. Closed symbols are used for adsorption and open symbols for desorption.
Carbon 04 00051 g005
Figure 6. Pore size distributions for char materials (blue symbols) and activated carbons obtained by physical activation at 800 °C (red symbols).
Carbon 04 00051 g006
Figure 7. Relationship between physical activation rates at 800 °C and the kinetic parameters of oxidation by CO2 of charred materials. The trend lines represent just a visual helper, with no implied significance.
Carbon 04 00051 g007
Figure 8. Relationship between kinetic parameters for oxidation by CO2 at 800 °C and the carbon yield after isothermal pyrolysis in nitrogen at 1000 °C. The trend lines represent just a visual helper, with no implied significance.
Carbon 04 00051 g008
Figure 9. Comparison of BET surface areas after activation at 800 °C (A) and of micropore-to-mesopore volume ratios (B) with the carbon yield after TGA treatment in nitrogen at 1000 °C. The trend lines represent just a visual helper, with no implied significance.
Carbon 04 00051 g009
Table 1. Properties of source biomass, charred intermediates, and end-product activated carbons.
MaterialsProperties HardwoodSoftwoodGrass
HWCOYPRWWPSG
Raw materialMoisture, %40.8538.7246.8060.2161.0710.28
Carbon, %44.8247.7947.6725.9949.3043.22
Hydrogen, %6.065.826.337.716.485.22
Nitrogen, %0.070.250.301.350.150.59
Dried biomassMoisture, %<100.673.24<102.4910.28
Total volatile matter, %81.889.2691.7285.390.8879.4
Fixed carbon, %7.668.153.784.536.078.40
Total ash, %0.541.761.260.17 0.571.80
BiocharMoisture (<120 °C), %4.392.692.015.232.035.94
Light volatiles (120–500 °C), %2.022.671.631.561.742.76
Volatiles (500–800 °C), %1.841.252.011.571.471.94
Heavy volatiles (800–1000 °C), %4.743.663.473.152.213.58
Volatiles (isotherm 1000 °C), %5.452.973.233.642.403.60
Carbon yield, %80.7387.1088.7083.7590.7382.21
BET surface area, m2/g152241529159351207
Pore volume (<300 nm), cm3/g0.150.390.400.170.260.19
Micropore volume (<2 nm), cm3/g0.050.070.190.070.130.08
Mesopore volume (2–50 nm), cm3/g0.090.320.210.110.130.11
Activated carbonMoisture (<120 °C), %4.392.692.015.232.038.94
Volatiles (120–800 °C), %3.863.923.643.133.214.70
Gasified (800 °C), %31.0121.3243.7537.2735.2125.25
Activated product (total yield), %60.7472.0750.6054.3759.5561.11
BET surface area, m2/g7309156866251050612
Pore volume (<300 nm), cm3/g0.401.150.510.331.440.41
Micropore volume (<2 nm), cm3/g0.270.280.250.240.330.22
Mesopore volume (2–50 nm), cm3/g0.100.850.250.071.060.18
Micropore volume (<2 nm), %67.524.349.072.722.953.7
Mesopore volume (2–50 nm), %25.073.949.021.273.643.9
Note: HW = mixed hardwood; CO = chestnut oak; YP = yellow poplar; RW = redwood; WP = white pine; SG = switchgrass.
Table 2. Kinetic parameters for physical activation, reaction hold time in CO2 at 800 °C, and weight loss levels achieved.
SamplesTime at 800 °C, minEact, kJ/molA, min−1ln(A)Weight Loss %
GlobalMoisture-CorrectedVolatiles-Corrected
HW char431531.9 × 10716.74383331
CO char143351.0 × 1012.32272421
YP char113381.8 × 1012.91474543
RW char119812.2 × 1037.71443937
WP char148201.9 × 1000.63393735
SG char581224.7 × 10513.07342825
Average weight loss %32 ± 7