Article

N, S-Doped Carbon Dots (N, S-CDs) for Perfluorooctane Sulfonic Acid (PFOS) Detection

by
Hani Nasser Abdelhamid
Department of Chemistry, College of Science, Imam Mohammad Ibn Saud Islamic University (IMSIU), Riyadh 11623, Saudi Arabia
Submission received: 5 May 2025 / Revised: 20 May 2025 / Accepted: 23 May 2025 / Published: 29 May 2025

Abstract

:
Nitrogen and sulfur-co-doped carbon dots (N, S-CDs) were synthesized using a simple, eco-friendly hydrothermal technique with L-cysteine as the precursor. The synthesis approach produced highly water-dispersible, heteroatom-doped CDs with surface functional groups comprising amine, carboxyl, thiol, and sulfonic acid. Data analysis of X-ray diffraction (XRD), Fourier transform infrared spectroscopy (FT-IR), and transmission electron microscopy (TEM) confirmed their amorphous nature, nanoscale dimensions (1–8 nm, average particle size of 2.6 nm), and surface chemistry. Optical examination revealed intense and pure blue fluorescence emission under UV excitation, with excitation-dependent emission behavior attributed to surface defects and heteroatom doping. The N, S-CDs were applied as fluorescent probes for detecting perfluorooctanesulfonic acid (PFOS), a notable component of the perfluoroalkyl substances (PFAS) family, demonstrating pronounced and concentration-dependent fluorescence quenching. A linear detection range of 3.33–20 µM and a limit of detection (LOD) of 2 µM were reported using the N, S-CDs probe. UV-Vis spectral shifts and dye-interaction investigations indicated that the sensing mechanism is regulated by non-covalent interactions, primarily electrostatic and hydrophobic forces. These findings confirm the potential of N, S-CDs to be used as effective optical sensors for detecting PFOS in environmental monitoring applications.

Graphical Abstract

1. Introduction

Persistent organic pollutants (POPs) are serious environmentally hazardous chemicals due to their ability to undergo long-distance environmental transport and bioaccumulate in humans and animals [1]. A synthetic perfluorinated compound such as perfluorooctane sulfonate (PFOS, C8F17SO3) has been widely used in textiles, leather, paper, food packaging, and semiconductors. PFOS is highly resistant to heat, light, microbial degradation, and metabolic breakdown in higher organisms. Its hydrophobic and lipophobic properties enable it to accumulate in the bloodstream and liver. PFAS can lead to toxic effects, including hepatotoxicity, neurotoxicity, immunotoxicity, carcinogenicity, and developmental delays, as reported in various animal studies [2,3]. Recognizing these risks, PFOS was added to Annex B of the Stockholm Convention on POPs in May 2009, and the European Union set strict limits on its use in 2010 (maximum 0.001% by weight). However, due to its long production history and continued use in some regions, PFOS pollution is expected to persist. As such, developing sensitive, efficient, and accessible methods for PFOS detection in environmental samples is critical for protecting public health.
PFOS analysis mainly relies on advanced techniques, e.g., high-performance liquid chromatography (HPLC), capillary electrophoresis (CE), and gas chromatography (GC) [4,5,6]. Most of these methods offer high sensitivity, but they are often time-consuming and costly, and they require complex sample preparation and skilled operation, which limits their application in routine environmental monitoring [7,8,9]. Therefore, developing low-cost, rapid, and user-friendly detection methods is highly desirable [10,11,12]. Other methods have been reported, including colorimetric methods using organic dyes [13], small molecules, e.g., 2,6-bis(3,5-diethyl-1H-pyrrol-2-yl)pyridine [14], cyclodextrin-embedded with gold (Au) nanoparticles [15], β-cyclodextrin-modified with methylene blue (βCD-MB) [16], conjugated polymers [17], and metal-organic frameworks (MOFs) [18,19]. Electrochemical methods were also investigated [20]. The combination of two or more methods, was also reported, including the photoelectrochemical method [21], surface acoustic wave (SAW) resonator [22], electrochemical and colorimetric methods [23], and colorimetric/fluorescence/electrochemical methods [23]. New analytical methods rely on advanced materials such as MXene/Silver nanoparticles [24], titanium dioxide/graphene oxide/molecular nanocages (TiO2/GO/MNCs) [21], and molecularly imprinted poly(o-phenylenediamine) polymers [25]. Among these methods, fluorescence is promising due to its high sensitivity, tunability, and low cost. Thus, several fluorescent probes have been reported, including carbon quantum dots (CQDs) [26], perylene diimide derivatives (PDI-Pyr) [27], and calix [4] arene/Au nanocrystals (NCs) [28].
Carbon nanomaterials demonstrate good potential for applications with many carbon allotropes [29,30,31,32,33,34]. Carbon dots (CDs) are zero-dimensional (0D) carbon nanomaterials [35]. They are small carbon-based nanoparticles with distinct structural and functional properties [36], with a diameter of less than 10 nm. CDs have been applied to medicine [37,38], tumor therapy [39], zinc-based batteries [40], anti-corrosion [41], and electrocatalysis [42]. They exhibit unique optical properties, making them effective probes for sensing and biosensing applications [43,44]. They have been used to detect analytes such as glyphosate [45], D-penicillamine [46], heavy metals in cancer cells [47], and PFOS [48]. The analysis can be performed in water, fruits, and vegetables [45]. A specialized subclass, heteroatom-doped CDs, especially those doped with nitrogen, sulfur, or oxygen, exhibit enhanced fluorescence and excellent water dispersibility [49]. Doping introduces new energy levels and repairs surface defects, significantly improving their photoluminescence (PL) properties. Fluorine (F) and nitrogen(N)-doped CDs have been used for the analysis of PFOA in drinking water [50]. F, N-doped CDs were synthesized using polyethyleneimine (PEI) and tetrafluoroterephthalic acid (TFTA) with a ratio from 1:3 to 1:10 [50]. Heteroatom-doped CDs could be effective probes for PFOS detection using fluorescence spectroscopy.
Here, N, S-CDs were synthesized via solvothermal treatment using L-cysteine. The prepared material was described using X-ray diffraction (XRD), Fourier transform infrared (FT-IR), transmission electron microscopy (TEM), and particle size distribution. N, S-CDs exhibit blue emission upon excitation under 254 nm light. They can be used as a probe to detect PFOS in water.

2. Experimental Section

2.1. Materials and Methods

L-cysteine and PFOS were purchased from Sigma-Aldrich (Steinheim, Germany). A stock solution of PFOS (1 mg/mL, Sigma Aldrich) was prepared by dissolving 100 mg of PFOS in ultrapure water and diluting to the mark in a 100 mL volumetric flask. A solution of methyl orange (MO) or phenol red (Riedel de Haen Ag, Seelze-Hannover, Germany) at a concentration of 1 mg/mL was made by dissolving 100 mg of the corresponding dyes in water.

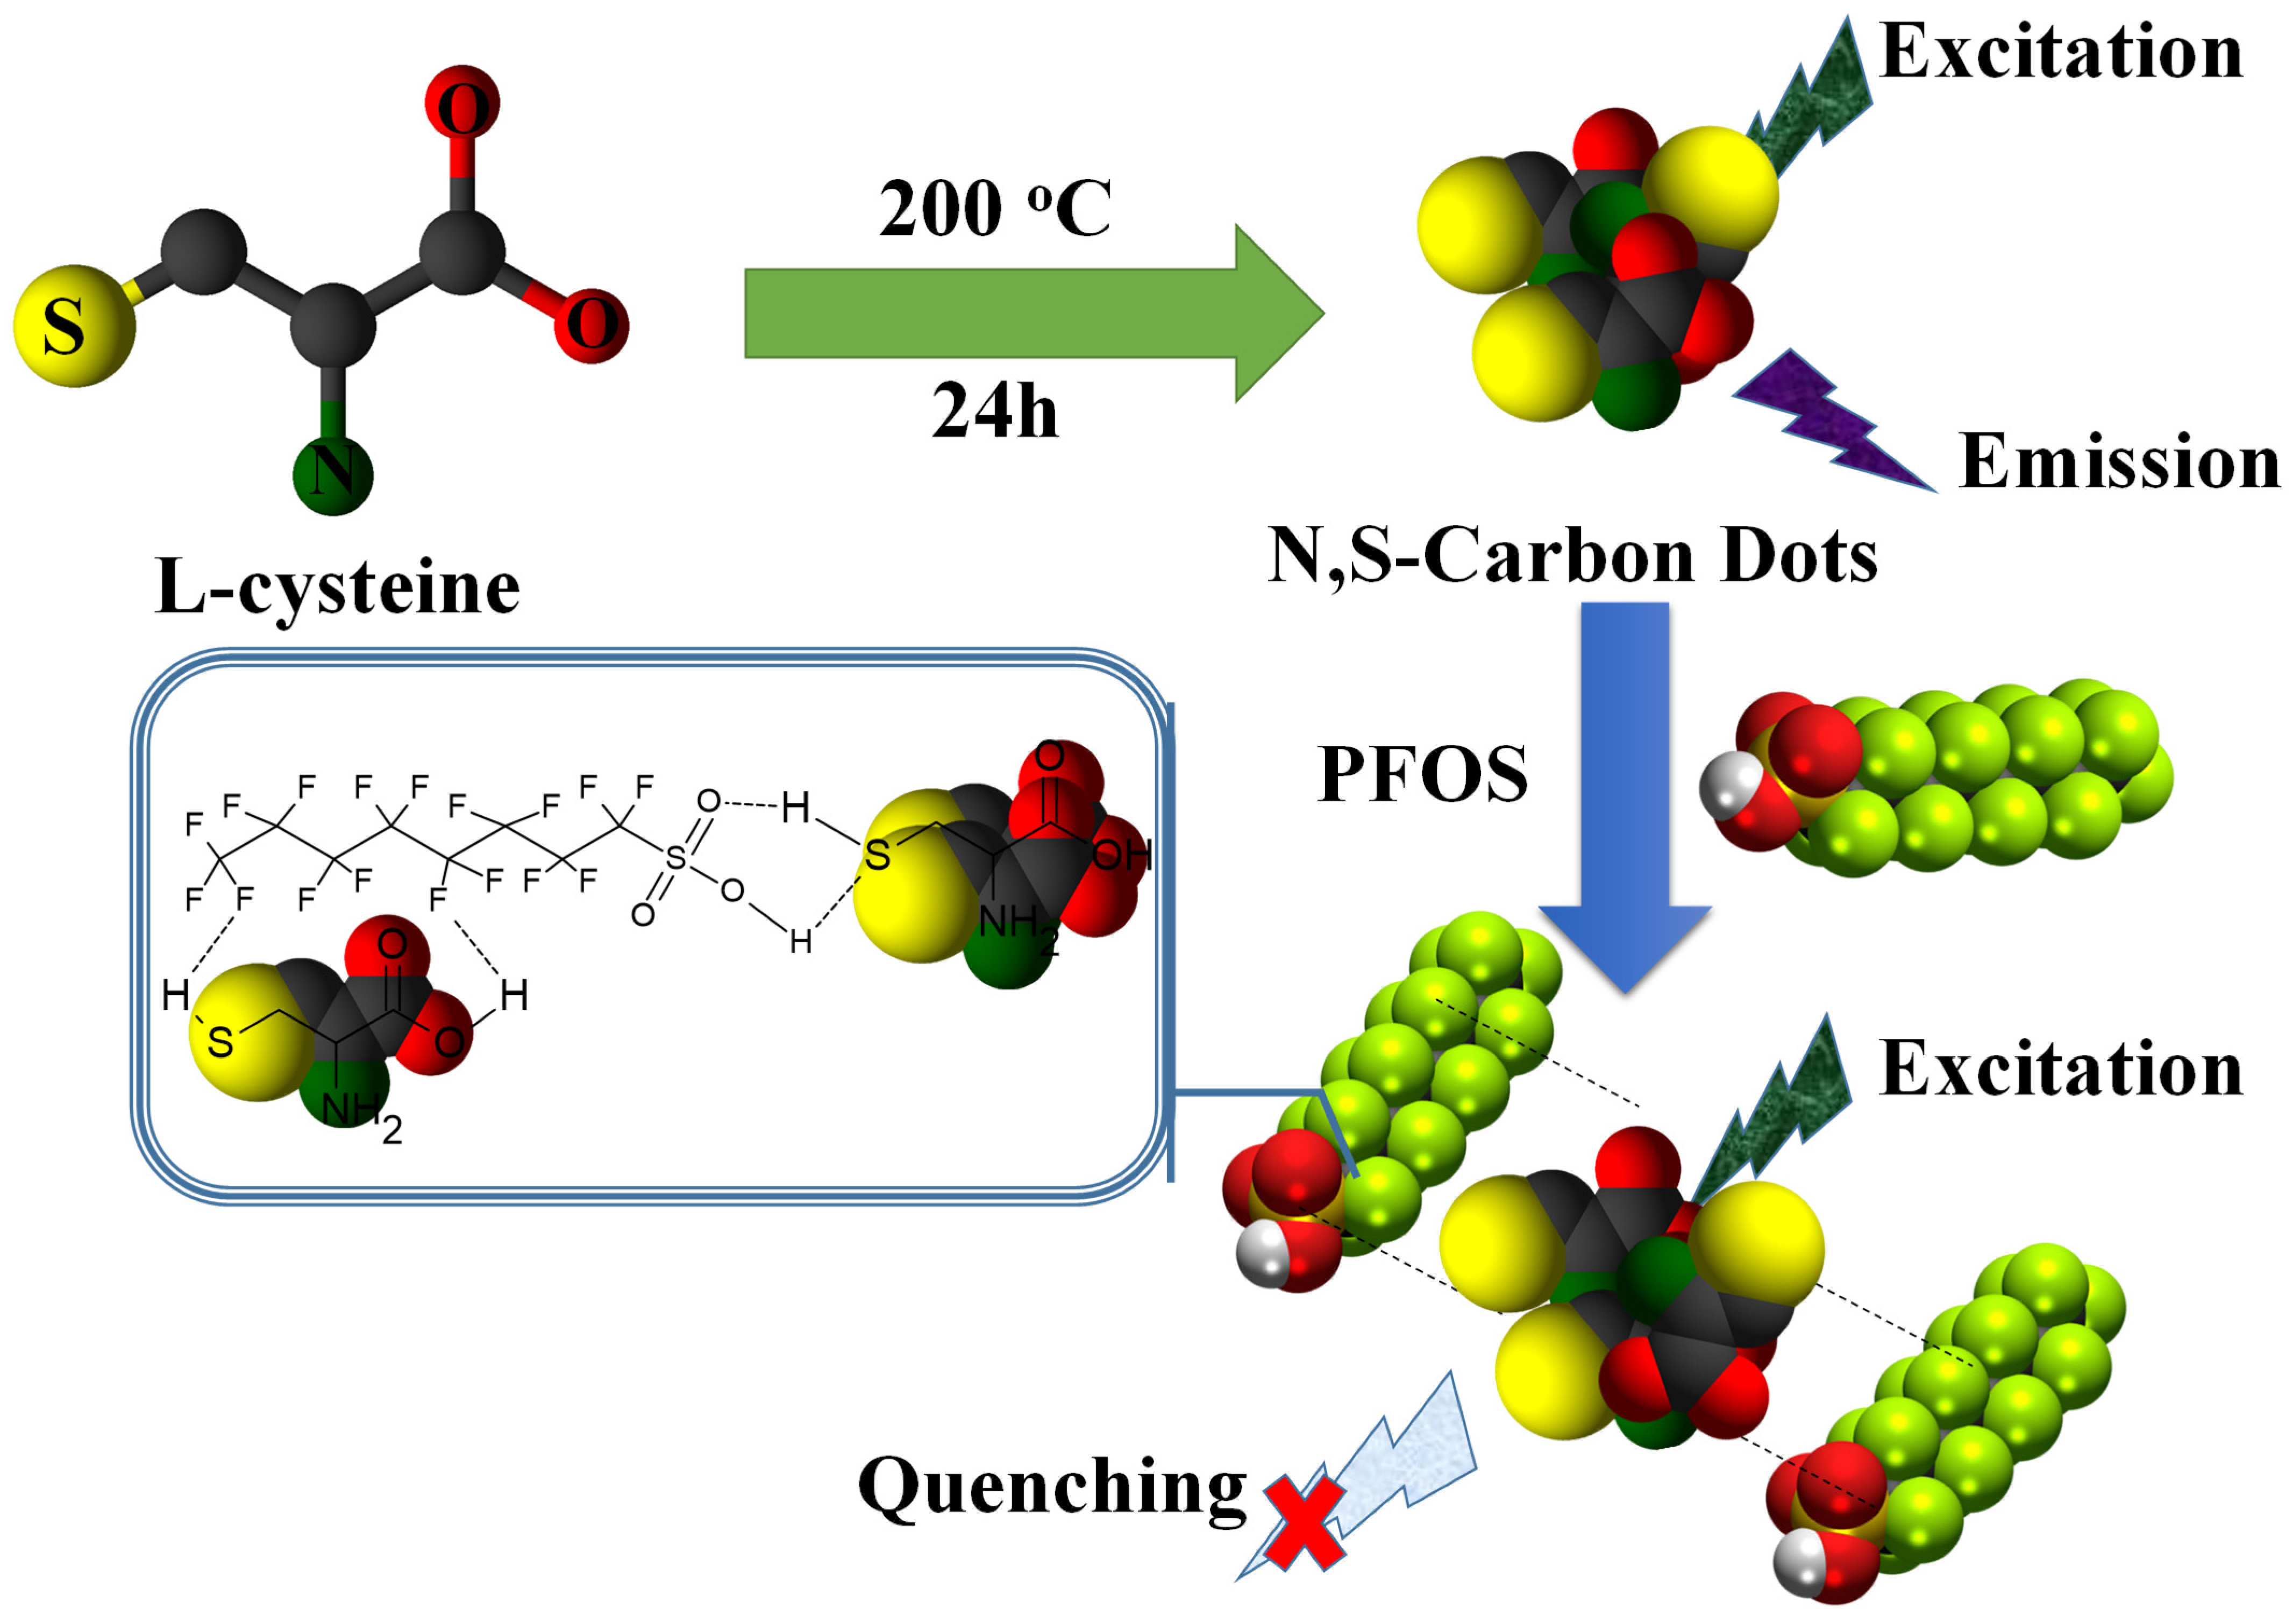
2.2. Synthesis of N, S-Doped CDs

The N- and S-CDs were synthesized through hydrothermal treatment [49]. L-cysteine (2 g) was dissolved in 10 mL of water via ultrasonic waves for 30 min. The solution was added into an autoclave and heated at 200 °C for 24 h. After cooling, a brown-yellow material was obtained, which was further purified by filtration with nitrocellulose filters (0.22 μm).

2.3. Characterization Instruments

An XRD pattern was obtained using a Philips 1700 diffractometer, utilizing Cu Kα radiation (a wavelength of 1.5418 Å, current of 30 mA, and a generating voltage of 40 kV). FT-IR spectrum was collected by a Nicolet model 6700 spectrophotometer (Thermo Fisher, Waltham, MA, USA). TEM imaging was conducted utilizing a JEM 2100 (JOEL, Tokyo, Japan).

2.4. Fluorescence Measurements

The emission spectra of the N, S-doped CDs solution were recorded utilizing an excitation wavelength range of 300–350 nm. The solution of PFOS was prepared in water as a real sample.
50 μL of N, S-CDs solution (1 mg mL−1), 1.5 mL of water, and a certain volume of PFOS solution were stirred for 3 min. The fluorescence emission spectra of these solutions were recorded at an excitation wavelength of 350 nm. Spectra were repeated at least two times with a consistent signal and low standard deviation value.

2.5. UV-Vis Spectroscopy

The interaction between N, S-CDs with PFOS, MO, and phenol red was evaluated using a UV-Vis spectrophotometer (UV-2600i, Shimadzu, Kyoto, Japan). Equal volumes containing the same concentrations of N, S-CDs, and the corresponding analyte were added. The solution was then incubated for 5 min before measurements.

3. Results and Discussion

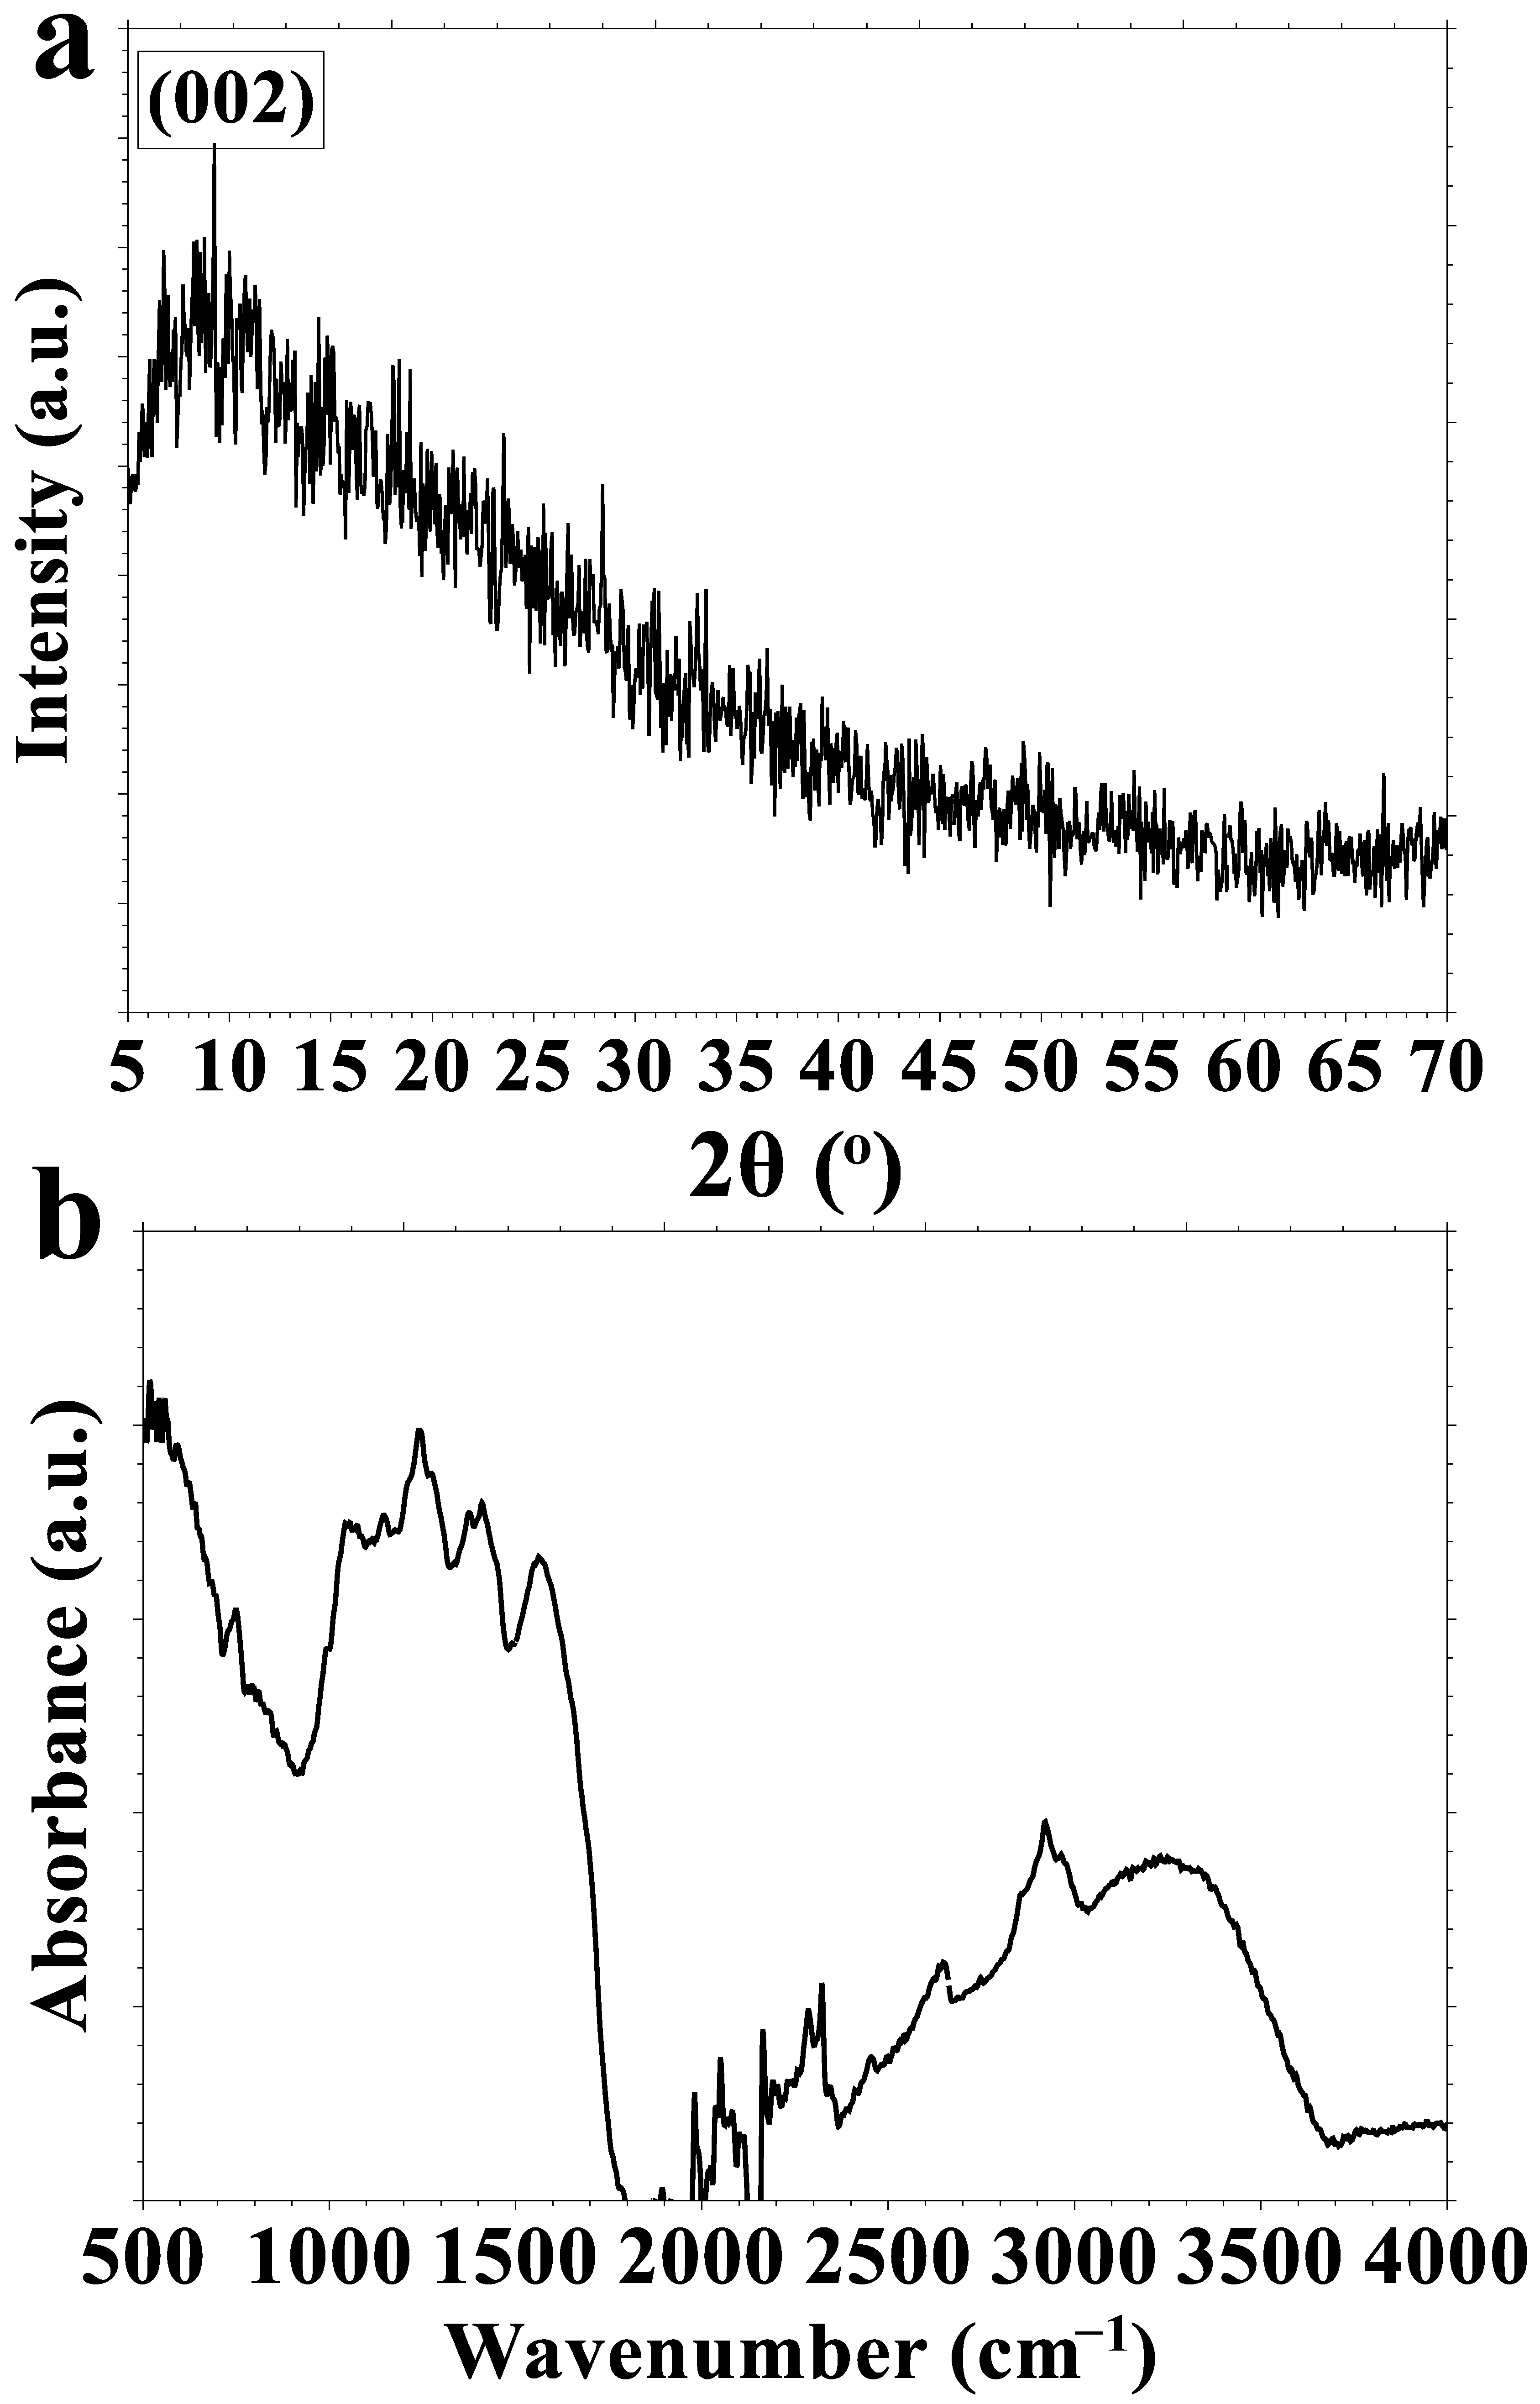
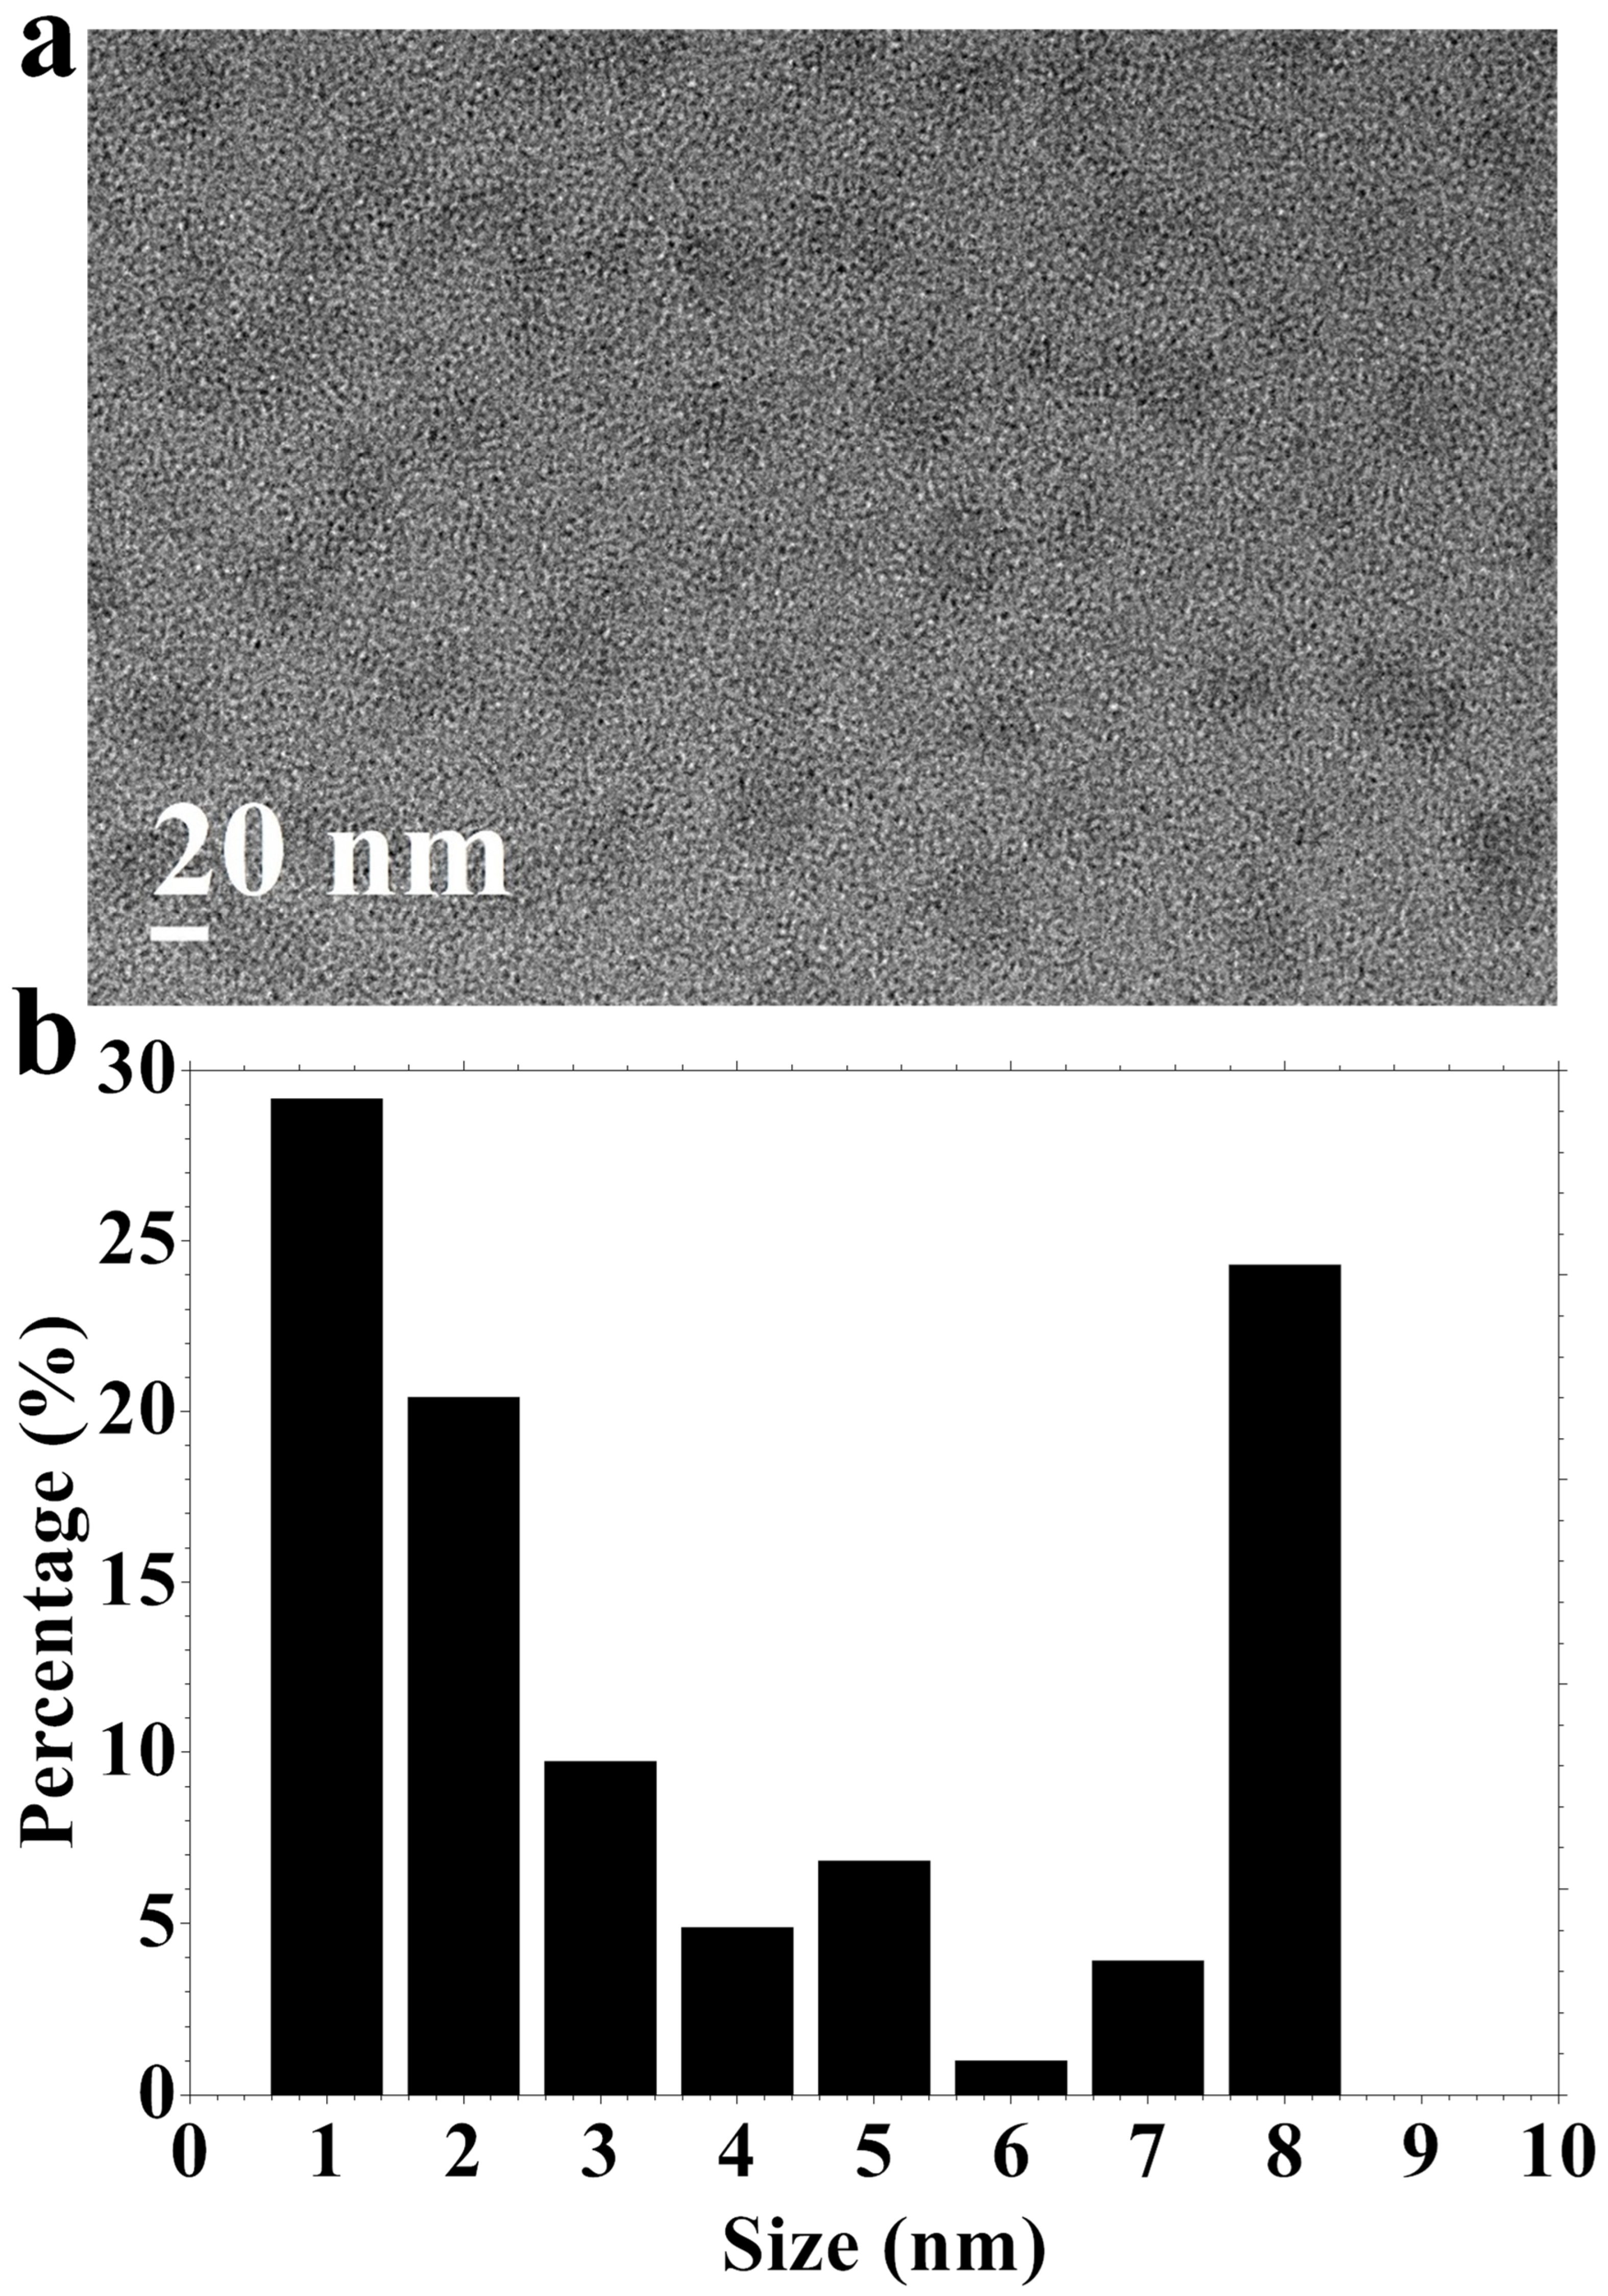
3.1. N, S-CDs Synthesis and Characterization

N, S-CDs were produced using a straightforward hydrothermal treatment of L-cysteine (Figure 1). During this procedure, L-cysteine was solubilized in deionized water using an ultrasonication bath for 30 min to guarantee complete dissolution. The resultant homogeneous solution was heated at 200 °C for 24 h. Upon completion of the reaction and subsequent natural cooling to ambient temperature, a brown-yellow product was obtained. The solution was refined by filtration through nitrocellulose membranes to exclude bigger particles and contaminants. The synthesis procedure is an eco-friendly and efficient method that produces water-dispersible, heteroatom-doped carbon dots, i.e., N, S-CDs. The material was characterized using XRD (Figure 2a), FT-IR (Figure 2b), TEM image (Figure 3a), particle size distribution (Figure 3b), and fluorescence spectroscopy (Figure 4a,b).
The XRD pattern of N, S-CDs is shown in Figure 2a. The pattern indicates an amorphous or partially graphitized carbon composition. In contrast to well-crystallized materials, N, S-CDs lack distinct diffraction peaks. The pattern exhibits a broad diffraction peak within a Bragg angle (2θ) of 5–30°, with a centered peak at 10° corresponding to the (002) plane of disordered graphitic carbon (Figure 2a). The diffract peak at 10° results from the interlayer spacing between carbon sheets with an interplanar distance of 4.4 Å, which typically exceeds that of bulk graphite (≈3.4 Å, Bragg angle diffract at 26.5–27°) [51,52,53,54,55]. The observed clear interplanar distance of N, S-CDs is due to oxygen-containing surface groups, defects, and heteroatom doping (e.g., N, S). The low crystallinity and functional groups of N, and S-CDs are defining features of CDs, aligning with their quasi-spherical shape and nanoscale dimensions. The synthesis of N, S-CDs through hydrothermal treatment of L-cysteine involves several chemical reactions under high temperature and pressure. L-cysteine first undergoes heat breakdown and hydrolysis, during which its functional groups, e.g., amino (-NH2), thiol (-SH), and carboxylic acid (-COOH), interact with water, resulting in the generation of smaller reactive intermediates. The intermediates subsequently undergo several condensation and polymerization reactions, forming oligomers and cross-linked macromolecular networks. During the reaction, these carbon-rich networks undergo carbonization due to the elimination of water, carbon dioxide, and other gas molecules, forming amorphous N, S-CDs. In summary, nitrogen and sulfur atoms from L-cysteine are integrated into the carbon framework or affixed to the surface, resulting in heteroatom doping.
The functional groups of N,S-CDs are evaluated using FT-IR (Figure 2b). N, S-CDs exhibit a diverse array of surface functional groups originating from the structure of L-cysteine and the transformation processes during synthesis. L-cysteine, an amino acid, possesses amine (-NH2), carboxyl (-COOH), and thiol (-SH) groups, which are expected to be integrated into the external surface of N and S-CDs. During hydrothermal treatment at high temperatures and pressure, L-cysteine experiences carbonization and dehydration, forming the carbon core of the CDs while preserving its heteroatom-containing groups. The resultant N, S-CDs display the functional groups of amine/amide groups (-NH2, -CONH-), carboxyl group (-COOH), and thiol and sulfonic groups (-SH, -SO3H). The FT-IR spectrum shows N–H stretching vibrations around 2919 cm−1 (Figure 2b). These contribute to water solubility and interaction with other molecules. The C=O stretching vibration of carboxylic acids typically appears around 1570 cm−1, and the O–H stretching of the hydroxyl in –COOH appears broadly in 3280 cm−1. The S–H stretching vibration appears weakly around 2540 cm−1, and when oxidized, sulfonic (–SO3H) or sulfoxide (–SO–) groups appear around 1040–1245 cm−1 (S=O stretching). The nitrogen from the amino group in L-cysteine may persist as primary amines or undergo reactions to create amide functions during carbonization. These groups facilitate nitrogen doping, increase hydrophilicity, and participate in fluorescence emission via surface states. The carboxyl group in N, S-CDs enhances water solubility, offers acidic functional sites, and serves as anchoring points or interaction sites for further functionalization, coordination, or interaction with a target analyte. The sulfur in the thiol group may be preserved or oxidized to provide thiol, sulfone, or sulfonic acid groups. These groups facilitate sulfur doping and affect the CDs’ electrical structure and photoluminescent properties.
The particle size of N, S-CDs were characterized using a TEM image (Figure 3). The TEM image of N, S-CDs demonstrates a polydisperse size distribution, signifying the existence of nanoparticles with diverse sizes (Figure 3a). The size distribution data indicate that the predominant particles are within the 1–8 nm range, with an average size of 2.6 nm (Figure 3b).

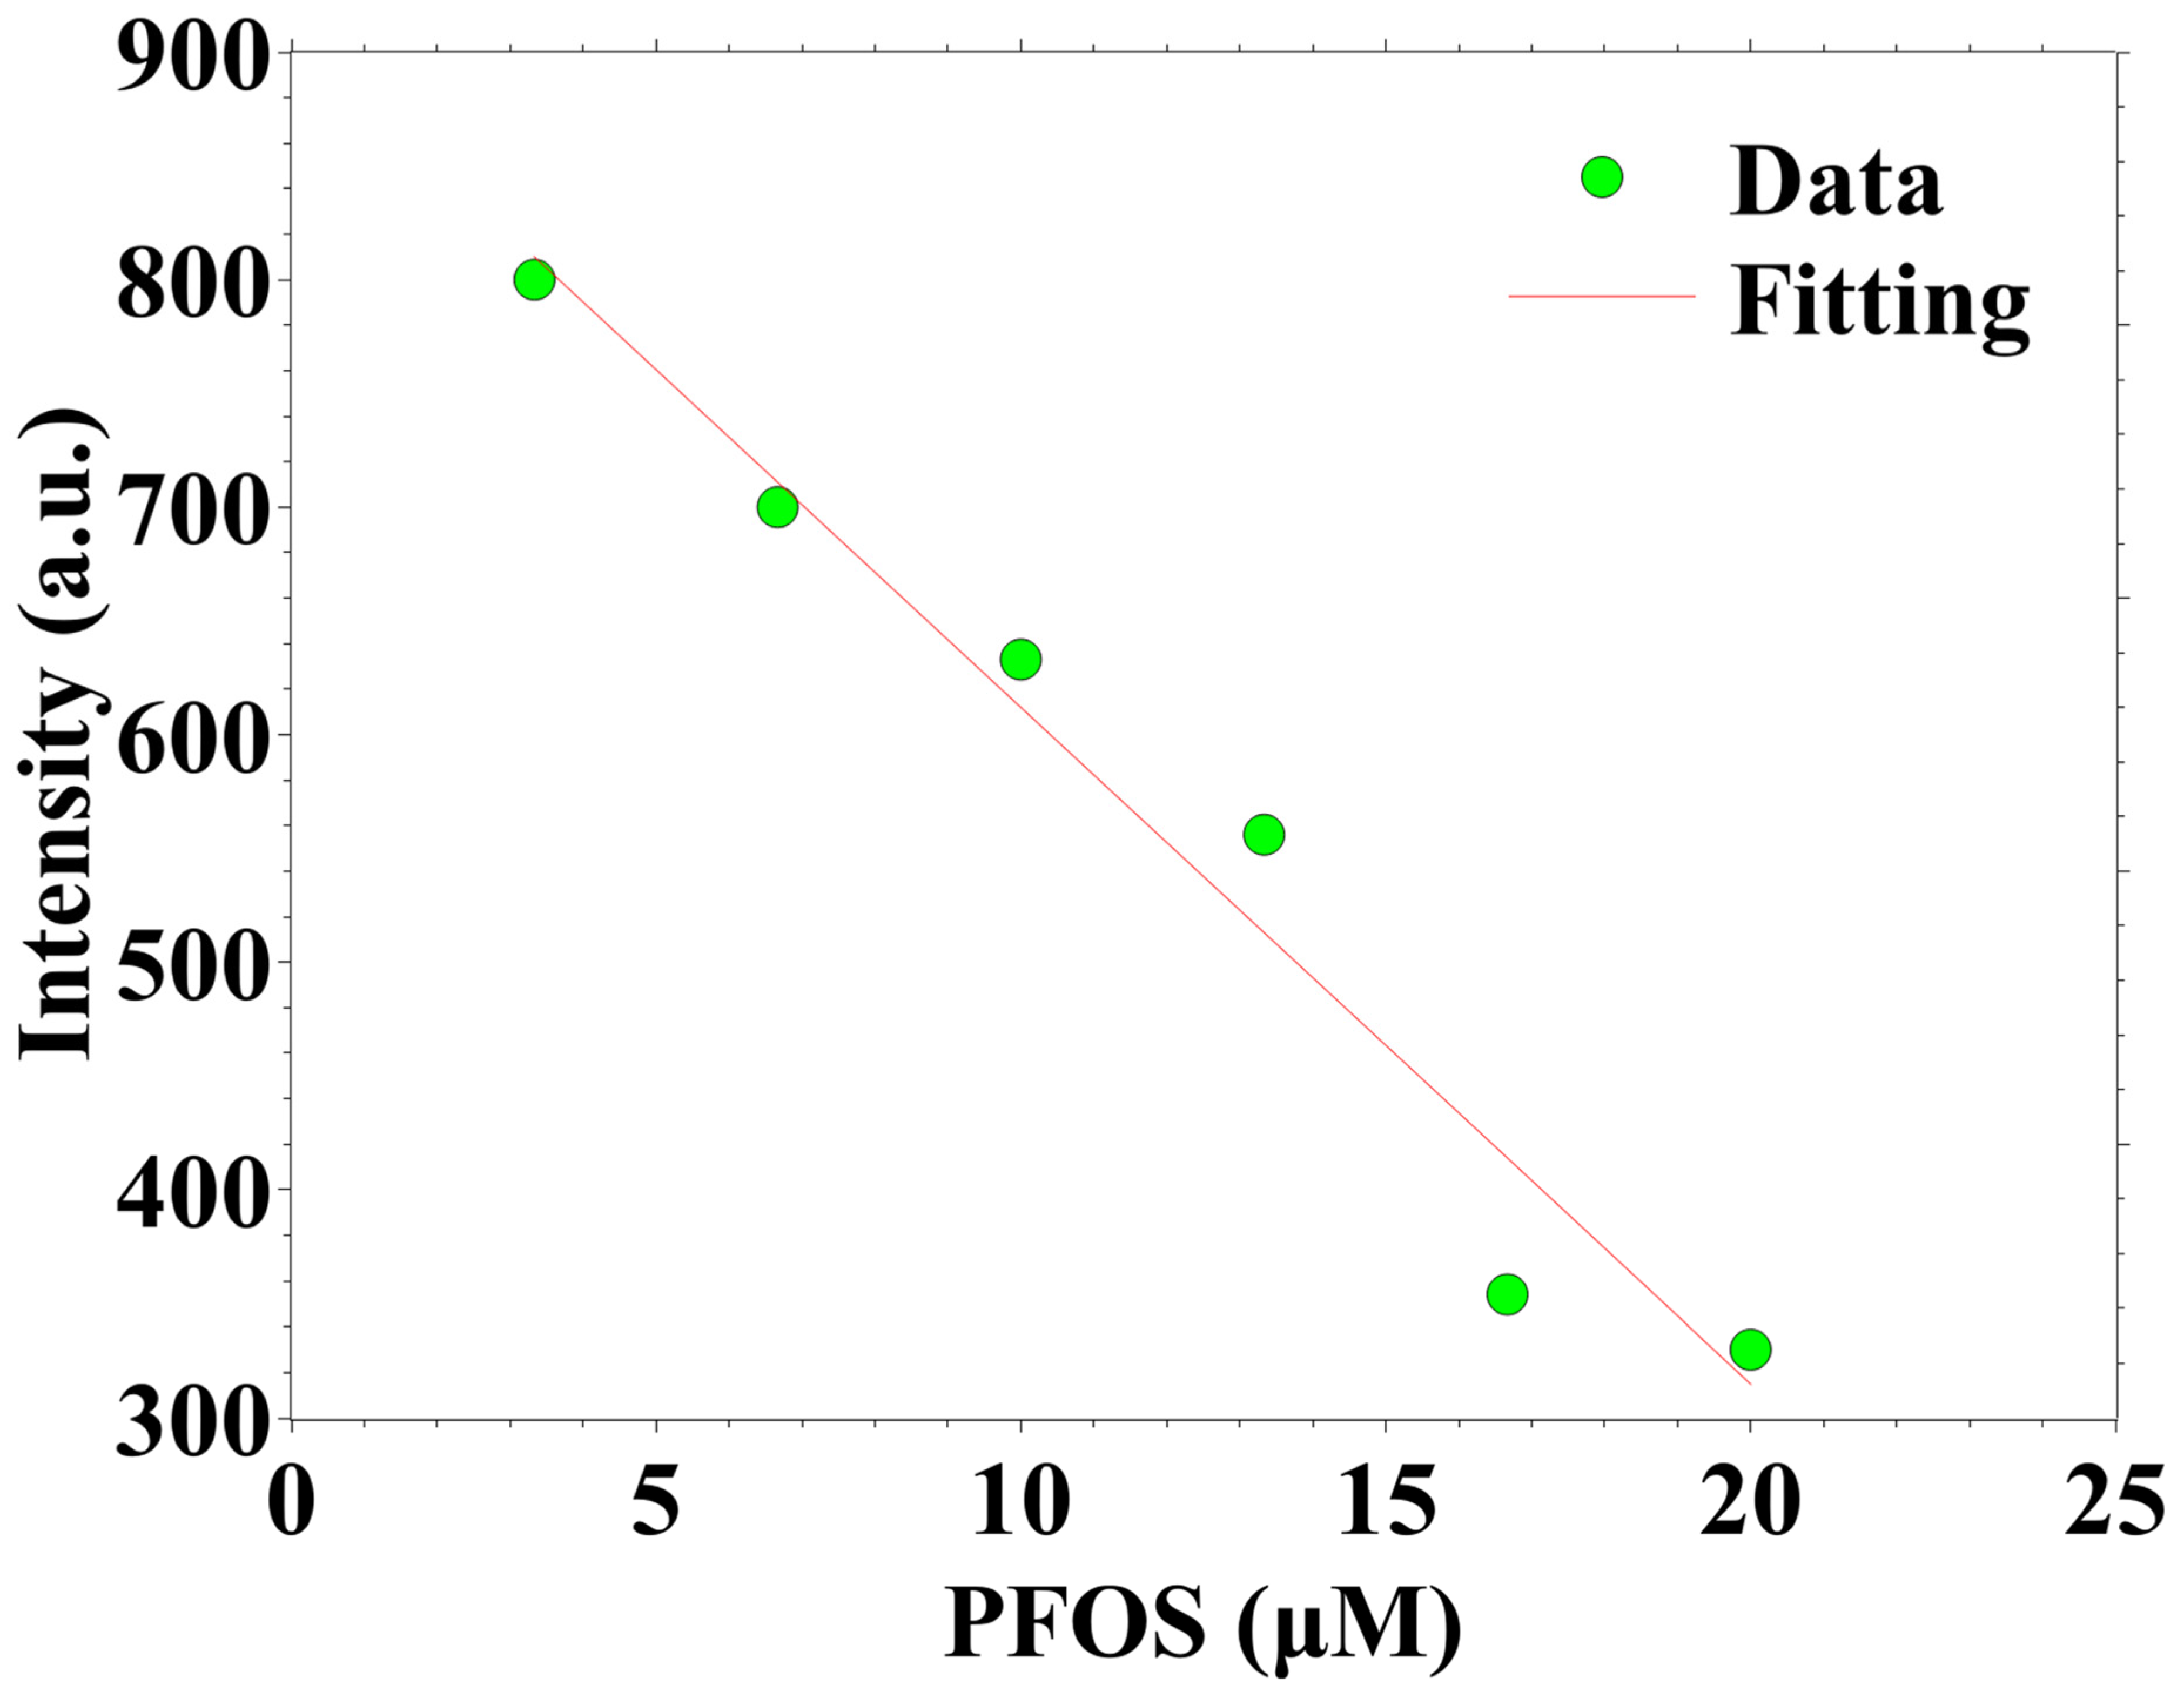
3.2. Analysis of PFOS

Doping CDs with N and S-heteroatoms create new electronic states and aid in passivating surface imperfections, improving the photoluminescence of the resultant carbon dots. Optical properties such as color and emission are characterized as shown in Figure 4. The end product’s surface is adorned with diverse functional groups containing oxygen, nitrogen, and sulfur, guaranteeing superior water solubility and significantly influencing the optical characteristics and potential chemical reactivity of the N, S-CDs.
N, S-CDs exhibit brown-yellow color under ambient light and blue emission under UV-LED lamp (Figure 4a). Under ambient light, the N, S-CDs solution exhibits a brown-yellow color, which results from the surface states and light absorption within the visible spectrum. Surface functional groups and conjugated π-domains in the carbon core can explain this. The brown-yellow coloration is typical of CDs produced using hydrothermal techniques, particularly from precursors like L-cysteine, which incorporate nitrogen and sulfur into the framework. When exposed to UV light, the N, S-CDs solution displays a blue-color emission (Figure 4a). This emission arises from the quantum confinement effect and surface defect states, which promote the radiative recombination of excited electrons. Nitrogen and sulfur atoms may improve the photoluminescence quantum yield by creating supplementary energy levels and mitigating non-radiative recombination sites.
The emission of N, S-CDs under excitation wavelengths, 300–350 nm, was recorded as shown in Figure 4b. The emission intensity is maximal at 300 nm excitation wavelength, with a peak emission centered approximately at 370–380 nm. This observation indicates robust radiative recombination associated with surface states. As the excitation wavelength increases from 300 to 350 nm, the emission peak progressively red-shifts, and the fluorescence intensity consistently decreases (Figure 4b). The red shift signifies the existence of various emissive sites or distinct energy traps on the surface of the N, S-CDs, possibly introduced by the nitrogen and sulfur heteroatoms. The peak emission intensity occurs at 300–315 nm, indicating that these wavelengths are optimal for the excitation of these N, S-CDs, probably due to resonance with surface functional groups or defect states. Beyond 330 nm excitation, the emission intensities decrease and become broad, highlighting a drop in the emissive centers’ excitation efficiency (Figure 4b). N, S-CDs exhibit excitation-dependent activity due to surface structures, defects, and size distributions. These properties enable tunable photoluminescence and rendering N, S-CDs appropriate for sensing, imaging, and optoelectronic applications. Thus, PFOS was selected as a representative PFAS for this study because of its significance as one of the substances included on the Environmental Protection Agency’s (EPA) list of regulated chemicals.
The effect of PFOS concentration on the emission signal of N, S-CDs was tested, as shown in Figure 5 and Figure 6. Figure 5a shows the fluorescence quenching characteristics of N, S-CDs in the presence of PFOS. It illustrates the emission spectra of the N and S-CDs following the gradual addition of PFOS in different amounts from 10 to 100 μL. The fluorescence emission intensity, especially near the peak at approximately 360–370 nm, decreases progressively with increasing PFOS concentration (Figure 5a). The gradual quenching suggests a robust contact between the N, S-CDs, and PFOS molecules, perhaps via electrostatic interactions or electron/energy transfer mechanisms, resulting in non-radiative decay pathways and fluorescence suppression. Figure 5b illustrates the quantitative correlation between PFOS concentration (in μM) and the associated fluorescence intensity of the CDs. The graph demonstrates a distinct downward trend, particularly pronounced between 10 and 20 μM, signifying high sensitivity within that concentration range. The quenching effect stabilizes beyond 20 μM, indicating the saturation of binding or interaction sites on the CDs (Figure 5b). N, S-CDs are efficient fluorescent sensors for detecting PFOS, exhibiting a significant and concentration-dependent fluorescence quenching response. It shows a linear relationship within the concentration range of 3.33–20 µM with a limit of detection (LOD) of 2 µM (Figure 6).

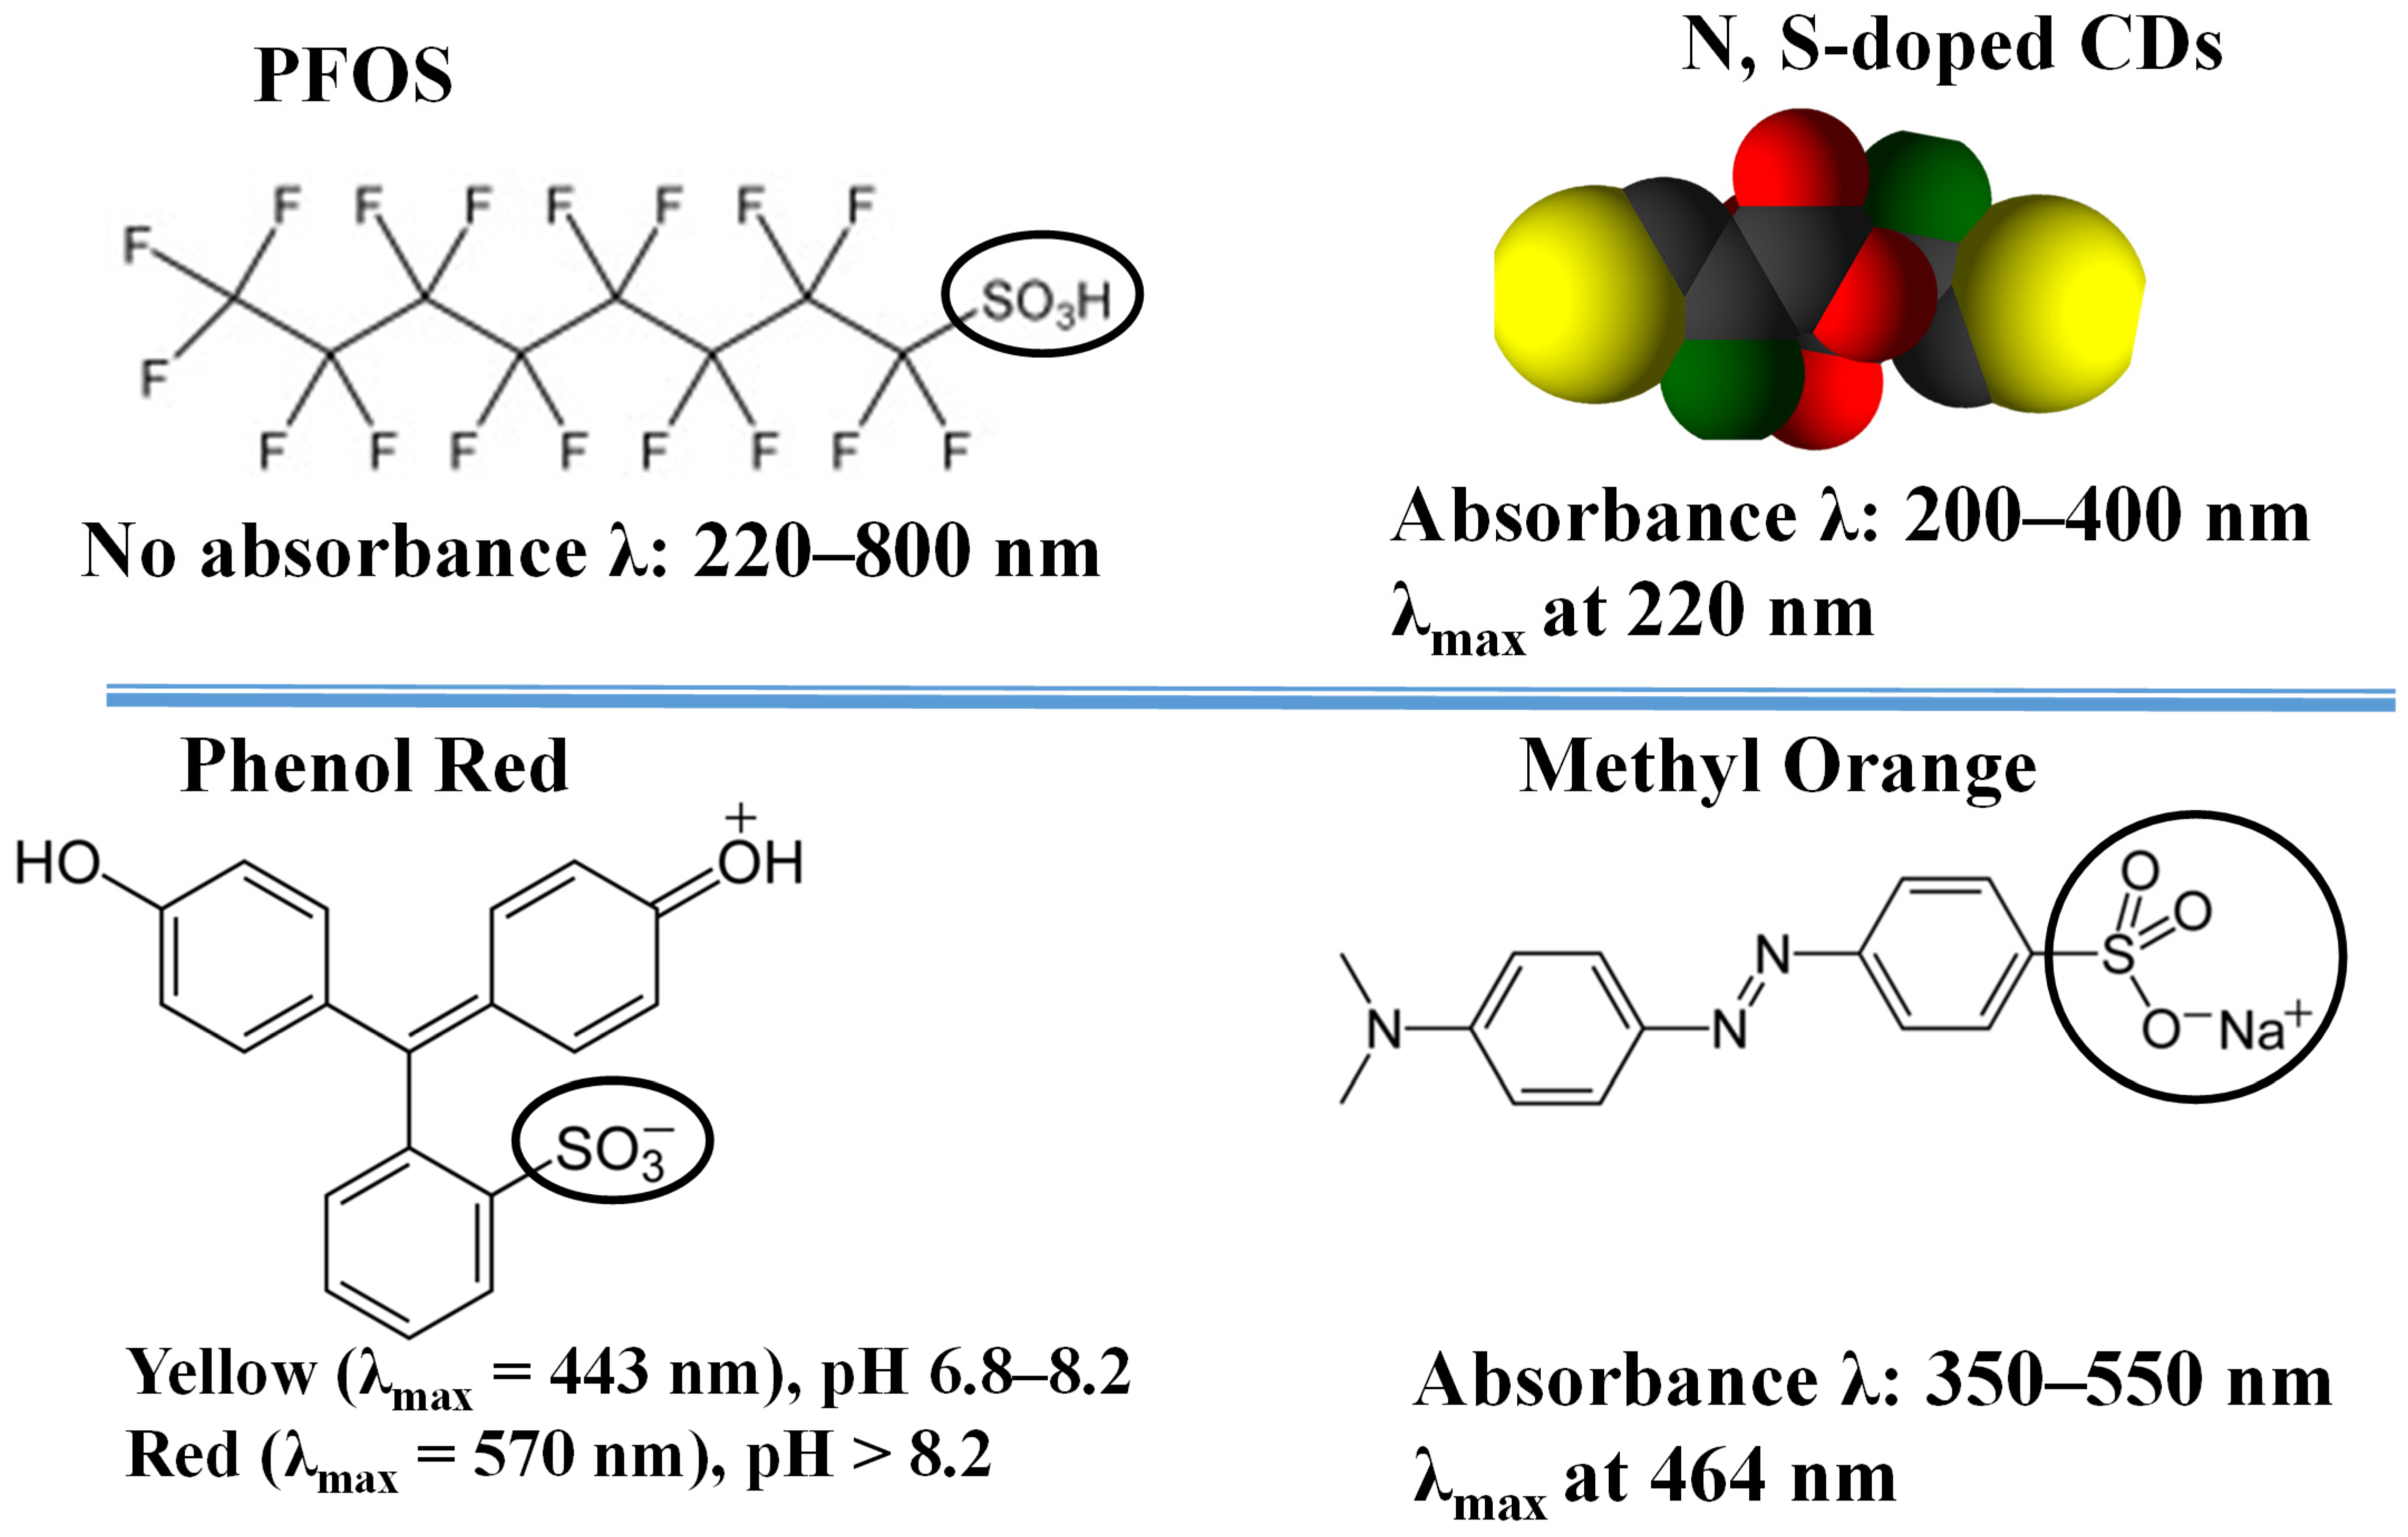
3.3. Mechanism of Interaction and Sensing: Dye-CD Interactions

PFOS exhibited no light absorption in the 220–800 nm range [56]. Thus, the standard mechanisms of sensing using fluorescent sensing materials to detect PFOS were competitive absorption, Förster resonance energy transfer (FRET), and aggregation-induced interchain FRET [17]. PFOS can interact via several interactions, such as fluorophilic, hydrophobic, electrostatic, cation bridging, ionic exchange, and hydrogen bonds [57]. To support the interaction mechanism between PFOS and N, S-CDs, two dyes, methyl orange (MO) and phenol red, with sulfonic groups, were investigated (Figure 7).
UV-Vis spectra were reported for N, S-CDs, and interactions with PFOS (Figure 8a), MO (Figure 8b), and phenol red (Figure 8c,d). In the UV-Vis spectrum, N, S-CDs exhibit absorbance in the 200–400 nm wavelength range, with maximum absorption at 225 nm (Figure 8a). The maximum absorption peak shifts to 245 nm upon interaction with PFOS. The UV-Vis shift in the absorbance indicates the complexation between N, S-CDs, and PFOS (Figure 8a). The N, S-CDs absorbance shifts at maximum wavelength were observed for MO (Figure 8b) and phenol red (Figure 8c,d). The color change in phenol red can confirm the interactions between phenol red and N, S-CDs (Figure 8c,d). However, the solutions of N, S-CDs still exhibit blue emission under UV light after interactions with phenol red (Figure 8d). These observations indicate that the interactions are mainly non-covalent and occur in the ground state.
A study reported that organic dyes such as crystal violet (CV) may interact with PFOS to create a 1:1 complex via electrostatic and hydrophobic interactions across a broad pH range (5.0 to 11.0) within 60 s [56]. The complexes undergo self-aggregation into nanoparticles [CV-PFOS]n. This occurrence resulted in alterations to the absorption and Raman spectra and a considerable enhancement in the resonance Rayleigh scattering (RRS) intensities. [CV-PFOS]n exhibited new RRS peaks at 327 nm, 492 nm, and 654 nm [56]. The interactions of PFOS with organic dyes, e.g., Meldola Blue (MDB), Safranin O (SF), Malachite Green (MG), Thionin (Th), and Methylene Blue (MB), were reported [13]. The interactions were analyzed using UV–Vis spectroscopy, fluorescence, and electrochemistry. The binding of PFOS to each dye reduces absorbance, fluorescence, and LOD [13]. A complex of green fluorescent dye, trisodium-8-hydroxypyrene-1,3,6-trisulfonate (HPTS), with protonated chitosan was reported for PFOS detection [58]. Complexation relies on the electrostatic attraction between the positive charge of chitosan and the negative charge of HPTS. This interaction leads to significant quenching of HPTS signals [58]. The fluorescence of HPTS was restored in the presence of PFOS due to the electrostatic and hydrophobic interactions between PFOS and chitosan. The fluorometric technique utilizing a chitosan-mediated “turn-on” mechanism is straightforward, swift, sensitive, and cost-effective, demonstrating the potential for detecting PFOS in environmental water samples [58]. The complexation between the cationic PDI-Pyr probe and PFOS was reported depending on electrostatic and hydrophobic interactions [27].
A comparison among several methods reported for PFOS detection is summarized in Table 1. PFOS was detected using fluorescence [59]. Using colorimetric analysis, a nanozyme material using coordination polymers or MOFs, denoted as Fe/Zn-BDC-F4, was reported for PFOS analysis [18]. The peroxidase-like activity of Fe/Zn-BDC-F4 enabled a quick, selective, and visible colorimetric approach for detecting PFOS. It offered a detection limit of 100 nM [18]. A molecular nanocage (MNC) was reported as an effective sensor and sorbent material for PFOS [59]. It can be used for sensitive and fluorescence response within 10 s. The sensing and adsorption were explained regarding host-guest interactions between MNC and PFOS [59]. Perylene diimide-based (PDI-2+, PDI-6+) fluorescent was reported as a rapid and sensitive fluorometric sensor for detecting PFOS [60]. The detection method is based on forming a complex between PFOS and cationic fluorophores. The complexation is based on the synergistic effects of electrostatic, hydrophobic, and π-π stacking interactions. These non-covalent interactions enabled a rapid and effective fluorometric response for PFOS detection. The LOD for PFOS was determined to be 3.5 nM and 2.7 nM for PDI-2+ and PDI-6+, respectively [60]. Indirect methods for PFOS analysis were also reported. For example, PFOS can be detected after degradation into fluoride ions that can interact with organic molecules, forming fluorescence emission signals [61].
Two multi-head cationic siloxanes, M1 and D1, were reported as “turn-on” fluorescent systems to selectively identify PFOS [61]. The siloxanes, produced using thiol-ene click chemistry with quaternary ammonium salts, exhibited variations in cationic groups and steric configurations. They undergo interaction with organic dye, i.e., erythrosine B (EB), facilitating the exploration of surfactant-dye interactions. Both systems demonstrated significant sensitivity to PFOS due to a synergistic interaction of electrostatic attraction and steric hindrance. The fluorescence responses of single-, two-, and four-head cationic compounds were compared to elucidate the underlying detection mechanism. The fluorescence intensity exhibited a linear Stern–Volmer correlation with PFOS concentration in both low and high ranges, with LODs of 4.65 μM and 2.7 μM, respectively. At low concentrations, static quenching prevailed due to robust electrostatic contacts, whereas at high concentrations, dynamic quenching transpired as micelle structures disassembled, breaking the electrostatic binding and the release of EB dye. The EB-D1 system exhibited a steeper Stern–Volmer slope than EB-M1, indicating increased vulnerability to PFOS-induced disruption, possibly due to enhanced steric hindrance promoting dye release. Furthermore, the EB-D1 system exhibited nearly total fluorescence recovery at around 30 μM PFOS, aligning with the intersection of dual Stern–Volmer plots. Both systems, i.e., EB-D1 or EB-M1, exhibited great sensitivity, with the D1-based system providing an enlarged detection window owing to its distinctive response characteristics [62]. However, the synthesis procedure is tedious and requires organic dyes, i.e., EB, which can also be considered a pollutant.
Carbon quantum dots (CQDs) were synthesized via a one-pot hydrothermal method and utilized as a probe to detect PFOS [63]. The preparation involved heating an o-phenylenediamine (OPD) mixture and phosphoric acid at 200 °C for 10 h. After natural cooling to room temperature, the resulting navy-blue solution was centrifuged to remove larger particles, and the supernatant was collected. The CQDs interact with PFOS to form a ground-state complex, leading to measurable changes in fluorescence, UV–vis absorption, and resonance light scattering (RLS) signals. These signal variations correlate with PFOS concentration, enabling sensitive and visual detection. The fluorescence-based method offered high selectivity and a LOD of 18.27 nM [63].
CQDs with orange fluorescence were synthesized via the hydrothermal method using 4-(diethylamino) salicylaldehyde and phosphoric acid [64]. The CQDs exhibit sensitive detection of PFOS. PFOS attenuates the fluorescence of the CQDs via an electron transfer process. The fluorescence quenching by PFOS exhibited linearity throughout the ranges of 0.05–1.0 μM, with LOD of 5 nM [64]. Selenium and nitrogen co-doped carbon quantum dots (SeN-CQDs) were synthesized using a simple one-pot hydrothermal method with selenomethionine [26]. The synthesis involved dissolving selenomethionine in water and heating the solution at 120 °C for 24 h. Se, N-CQDs were synthesized with a 30 to 45 nm particle range and exhibited bright blue fluorescence at 350/445 nm excitation/emission. The fluorescence intensity is pH-sensitive and decreases in acidic conditions. The Se, N-CQDs serve as selective fluorescent probes for detecting perfluorooctanoic acid (PFOA). Upon interaction with PFOA, their fluorescence is quenched without changes in particle size, indicating that quenching is not due to aggregation but due to internal electron transfer in an excited-state complex. The detection system is linear from 10–70 μM with a detection limit of 1.8 μM and shows high selectivity for PFOA [26]. N-CDs were produced by a hydrothermal reaction employing vitamin B1 (VB1) and triethylamine as precursors [65]. VB1 and TEA were solubilized in deionized water under sonication, and the heating was performed at 200 °C for 6 h. N-CDs displayed intense blue fluorescence, with an emission peak at 437 nm (excitation wavelength at 370 nm). N-CDs exhibited selective and sensitive fluorescence increases in reaction to PFOS, induced by electrostatic interactions resulting in nanoparticle aggregation. This interaction resulted in a quantifiable rise in fluorescence, allowing the N-CDs to serve as an efficient “turn-on” nanoprobe for PFOS. Under optimal conditions, the fluorescence response to PFOS exhibited linearity within a concentration range of 0.3–160 nM, with an LOD of 0.3 nM. The approach was effectively utilized for quantifying PFOS in spiked actual water samples, resulting in satisfactory recoveries and reliability [65]. A ratiometric sensor was reported using fluorescent dye ethidium bromide (EB) with N-CDs [66]. N-CDs were prepared via the hydrothermal treatment of Victoria Blue B. It shows emission peaks at 472 nm, 560 nm, and 600 nm upon excitation at 280 nm. The EB functioned as the reference signal label, while the N-CDs, which responded to the analytes, served as the response signal label. The F472/I568 ratio of the nanosensor exhibited strong linearity concerning PFOS concentrations within a range of 0–2.0 μM with a LOD of 27.8 nM [66]. A sensing method using CDs/berberine chloride hydrate (BH) was reported for the detection of PFOS in aqueous solution [67]. The fluorescence of CDs significantly switched "OFF" in the presence of BH within a pH of 6.09. Upon introduction of PFOS into the system, fluorescence turned "ON" [67].
Table 1. Summary of methods and materials reported for PFOS analysis.
MaterialsMethodLODLinear RangeRef
Organic dyes
MBD
SF
Electrochemical
Fluorescence
Colorimetric
0.08 μM
0.64 μM
0.03 μM
0.1–15 μM (MBD)
0.75–20 (SF)
[13]
Fe/Zn-BDCColorimetric100 nM0–75 μM[18]
Molecular Nanocages Fluorescence0.105 nM0–20 µM[59]
M1-EB2.7–4.65 μM 0–40 µM[62]
CQDs18.27 nM0–12 µM[63]
CQDs5 nM0.05–1.0 μM[64]
EB/N-CDs27.8 nM0–2.0 μM[66]
BH/CD21.7 nM0.22–50.0 μM[67]
CDs2 μM3–20 µMHere

4. Conclusions

This study illustrates the synthesis of N, S-CDs utilizing L-cysteine through an eco-friendly hydrothermal approach. N, S-CDs exhibited low dimensions, small particle size, high water solubility, and excitation-dependent fluorescence attributed to heteroatom-induced surface states. They showed robust and adjustable luminescence, facilitating the sensitive and selective detection of PFOS using fluorescence quenching. The interaction mechanism was corroborated by UV-Vis absorption changes and dye-complexation analogs, indicating non-covalent interactions, including electrostatic attraction and hydrophobic effects. N, S-CDs provide a cost-effective and efficient platform for PFOS detection, characterized by a low LOD and a distinct linear response within the wide concentration range. This study emphasizes the capability of N, S-CDs as nanoprobes for detecting environmental contaminants.

Funding

This work was supported and funded by the Deanship of Scientific Research at Imam Mohammad Ibn Saud Islamic University (IMSIU) (grant number IMSIU-DDRSP2502).

Data Availability Statement

Data are availabe from authors upon reasonable reasons.

Conflicts of Interest

The author declares no conflicts of interest.

References

  1. Shi, W.; Zhang, Z.; Li, M.; Dong, H.; Li, J. Reproductive toxicity of PFOA, PFOS and their substitutes: A review based on epidemiological and toxicological evidence. Environ. Res. 2024, 250, 118485. [Google Scholar] [CrossRef] [PubMed]
  2. Chang, M.; Yin, R.; Wang, J.; You, M.; Wang, N.; Wong, Y.J.; Xiao, T. Perfluorooctane Sulfonate (PFOS) and Perfluorooctanoic Acid (PFOA) in the Surface Waters of China: A Meta-Analysis. Water 2025, 17, 1275. [Google Scholar] [CrossRef]
  3. Tang, L.; Hao, G.; Zhou, D.; Fan, Y.; Wei, Z.; Li, D.; Shen, Y.; Fang, H.; Lin, F.; Zhao, M.; et al. Hepatotoxicity in Carp (Carassius auratus) Exposed to Perfluorooctane Sulfonate (PFOS): Integrative Histopathology and Transcriptomics Analysis. Animals 2025, 15, 610. [Google Scholar] [CrossRef] [PubMed]
  4. Rehman, A.U.; Crimi, M.; Andreescu, S. Current and emerging analytical techniques for the determination of PFAS in environmental samples. Trends Environ. Anal. Chem. 2023, 37, e00198. [Google Scholar] [CrossRef]
  5. Nahar, K.; Zulkarnain, N.A.; Niven, R.K. A Review of Analytical Methods and Technologies for Monitoring Per- and Polyfluoroalkyl Substances (PFAS) in Water. Water 2023, 15, 3577. [Google Scholar] [CrossRef]
  6. Takayama, T.; Shingu, A.; Kato, S.; Nagatomo, R.; Tsutsumi, T.; Inoue, K. Countermeasure for interfered monitoring ion of perfluorooctanesulfonic acid (PFOS) from intrinsic food samples based on LC-MS/MS analysis of per- and polyfluoroalkyl substances. J. Food Compos. Anal. 2024, 133, 106436. [Google Scholar] [CrossRef]
  7. Menger, R.F.; Funk, E.; Henry, C.S.; Borch, T. Sensors for detecting per- and polyfluoroalkyl substances (PFAS): A critical review of development challenges, current sensors, and commercialization obstacles. Chem. Eng. J. 2021, 417, 129133. [Google Scholar] [CrossRef]
  8. Al Amin, M.; Sobhani, Z.; Liu, Y.; Dharmaraja, R.; Chadalavada, S.; Naidu, R.; Chalker, J.M.; Fang, C. Recent advances in the analysis of per- and polyfluoroalkyl substances (PFAS)—A review. Environ. Technol. Innov. 2020, 19, 100879. [Google Scholar] [CrossRef]
  9. Zhang, M.; Zhao, Y.; Bui, B.; Tang, L.; Xue, J.; Chen, M.; Chen, W. The Latest Sensor Detection Methods for per- and Polyfluoroalkyl Substances. Crit. Rev. Anal. Chem. 2025, 55, 542–558. [Google Scholar] [CrossRef]
  10. Wang, Y.; Darling, S.B.; Chen, J. Selectivity of Per- and Polyfluoroalkyl Substance Sensors and Sorbents in Water. ACS Appl. Mater. Interfaces 2021, 13, 60789–60814. [Google Scholar] [CrossRef]
  11. Ryu, H.; Li, B.; De Guise, S.; McCutcheon, J.; Lei, Y. Recent progress in the detection of emerging contaminants PFASs. J. Hazard. Mater. 2021, 408, 124437. [Google Scholar] [CrossRef] [PubMed]
  12. Garg, S.; Kumar, P.; Greene, G.W.; Mishra, V.; Avisar, D.; Sharma, R.S.; Dumée, L.F. Nano-enabled sensing of per-/poly-fluoroalkyl substances (PFAS) from aqueous systems—A review. J. Environ. Manag. 2022, 308, 114655. [Google Scholar] [CrossRef] [PubMed]
  13. Rehman, A.U.; Locke, E.; Andreescu, S. Spectroelectrochemical investigation of the interaction of perfluorooctane sulfonic acid (PFOS) with organic dyes. Microchem. J. 2025, 209, 112683. [Google Scholar] [CrossRef]
  14. Yang, Y.; Zhang, Q.; Jin, X.; Chau, C.V.; Yang, J.; Henkelman, G.; Chi, X.; Gong, H.; Hooley, R.J.; Sessler, J.L. Readily Visualized Perfluorooctanoic Acid Detection Using a Small Molecule Chemosensor. Angew. Chem. Int. Ed. 2025, 64, e202501245. [Google Scholar] [CrossRef] [PubMed]
  15. Ma, J.; Liu, C.; Li, J.; An, Z.; Zhang, B.; Hong, W.; Ye, C.; Li, M.; Guo, L.-H. Colorimetric visualization detection of perfluorooctanoic acid based on host–guest interactions with cyclodextrin-modified gold nanoparticles. Environ. Sci. Nano 2025, 12, 1581–1591. [Google Scholar] [CrossRef]
  16. Zhu, X.; Cheng, C.; Qin, X.; Wang, Y. β-cyclodextrin imprinted film embedded with methylene blue: A host-guest sensitive electrochemical strategy for PFAS detection. J. Hazard. Mater. 2025, 485, 136870. [Google Scholar] [CrossRef]
  17. Chen, X.; Hussain, S.; Tang, Y.; Chen, X.; Zhang, S.; Wang, Y.; Zhang, P.; Gao, R.; Wang, S.; Hao, Y. Two-in-one platform based on conjugated polymer for ultrasensitive ratiometric detection and efficient removal of perfluoroalkyl substances from environmental water. Sci. Total Environ. 2023, 860, 160467. [Google Scholar] [CrossRef]
  18. Liu, Q.; Chen, Q.; Tong, Y.-J.; Zou, X.; Zheng, X.; Gong, Z. Tailoring the Coordination Environment of Fe/Zn-BDC to Boost Peroxidase-like Activity for Highly Selective Detection of PFOS. Anal. Chem. 2024, 96, 4673–4681. [Google Scholar] [CrossRef]
  19. Dalapati, R.; Hunter, M.; SK, M.; Yang, X.; Zang, L. Fluorescence Turn-on Detection of Perfluorooctanoic Acid (PFOA) by Perylene Diimide-Based Metal–Organic Framework. ACS Appl. Mater. Interfaces 2024, 16, 32344–32356. [Google Scholar] [CrossRef]
  20. Lu, D.; Zhu, D.Z.; Gan, H.; Yao, Z.; Luo, J.; Yu, S.; Kurup, P. An ultra-sensitive molecularly imprinted polymer (MIP) and gold nanostars (AuNS) modified voltammetric sensor for facile detection of perfluorooctance sulfonate (PFOS) in drinking water. Sens. Actuators B Chem. 2022, 352, 131055. [Google Scholar] [CrossRef]
  21. Han, Q.; Luo, R.; Yang, D.; Gao, Y.; Chen, X.; Xu, L.; Hu, X. A sustainable photoelectrochemical sensing platform for effective detection of perfluorooctane sulfonate. Sens. Actuators B Chem. 2025, 426, 137095. [Google Scholar] [CrossRef]
  22. Ivanov, G.R.; Venelinov, T.; Marinov, Y.G.; Hadjichristov, G.B.; Terfort, A.; David, M.; Florescu, M.; Karakuş, S. First Direct Gravimetric Detection of Perfluorooctane Sulfonic Acid (PFOS) Water Contaminants, Combination with Electrical Measurements on the Same Device—Proof of Concepts. Chemosensors 2024, 12, 116. [Google Scholar] [CrossRef]
  23. Xu, Y.; Yin, Q.; Du, N.; Yi, Y.; Zhu, G. An innovative homogeneous electrochemistry coupled with colorimetry dual-model sensing strategy for perfluorooctane sulfonate based on Cu@CuO aerogel nanozyme. Microchim. Acta 2024, 191, 693. [Google Scholar] [CrossRef]
  24. Khan, R.; Uygun, Z.O.; Andreescu, D.; Andreescu, S. Sensitive Detection of Perfluoroalkyl Substances Using MXene-AgNP-Based Electrochemical Sensors. ACS Sens. 2024, 9, 3403–3412. [Google Scholar] [CrossRef] [PubMed]
  25. Karimian, N.; Stortini, A.M.; Moretto, L.M.; Costantino, C.; Bogialli, S.; Ugo, P. Electrochemosensor for Trace Analysis of Perfluorooctanesulfonate in Water Based on a Molecularly Imprinted Poly(o-phenylenediamine) Polymer. ACS Sens. 2018, 3, 1291–1298. [Google Scholar] [CrossRef]
  26. Walekar, L.S.; Zheng, M.; Zheng, L.; Long, M. Selenium and nitrogen co-doped carbon quantum dots as a fluorescent probe for perfluorooctanoic acid. Microchim. Acta 2019, 186, 278. [Google Scholar] [CrossRef]
  27. Zhang, Q.; Liao, M.; Xiao, K.; Zhuang, K.; Zheng, W.; Yao, Z. A water-soluble fluorescence probe based on perylene diimide for rapid and selective detection of perfluorooctane sulfonate in 100% aqueous media. Sens. Actuators B Chem. 2022, 350, 130851. [Google Scholar] [CrossRef]
  28. Guo, T.-Y.; Duncan, C.L.; Li, H.-W.; Zhang, C.-X.; Mocerino, M.; Wu, Y. Calixarene-based supramolecular assembly with fluorescent gold-nanoclusters for highly selective determination of perfluorooctane sulfonic acid. Spectrochim. Acta Part A Mol. Biomol. Spectrosc. 2023, 302, 123127. [Google Scholar] [CrossRef]
  29. Al Kiey, S.A.; Abdelhamid, H.N. Metal-organic frameworks (MOFs)-derived Co3O4@N-doped carbon as an electrode materials for supercapacitor. J. Energy Storage 2022, 55, 105449. [Google Scholar] [CrossRef]
  30. Abdelhamid, H.N.; Khan, M.S.; Wu, H.F. Graphene oxide as a nanocarrier for gramicidin (GOGD) for high antibacterial performance. RSC Adv. 2014, 4, 50035–50046. [Google Scholar] [CrossRef]
  31. Abdelhamid, H.N.; Wu, H.-F. Ultrasensitive, Rapid, and Selective Detection of Mercury Using Graphene Assisted Laser Desorption/Ionization Mass Spectrometry. J. Am. Soc. Mass Spectrom. 2014, 25, 861–868. [Google Scholar] [CrossRef]
  32. Abdelhamid, H.N.; Wu, H.-F. Reduced graphene oxide conjugate thymine as a new probe for ultrasensitive and selective fluorometric determination of mercury(II) ions. Microchim. Acta 2015, 182, 1609–1617. [Google Scholar] [CrossRef]
  33. Ibrahim, M.; Abdelhamid, H.N.; Abuelftooh, A.M.; Mohamed, S.G.; Wen, Z.; Sun, X. Covalent organic frameworks (COFs)-derived nitrogen-doped carbon/reduced graphene oxide nanocomposite as electrodes materials for supercapacitors. J. Energy Storage 2022, 55, 105375. [Google Scholar] [CrossRef]
  34. Ni, Q.; Zhang, M.; Tang, B.; Hou, W.; Wang, K.; Guo, H.; Zhang, J.; Han, T.; Wu, M.; Wang, L. Rapid synthesis of carbon quantum dot-integrated metal–organic framework nanosheets via electron beam irradiation for selective 5-hydroxymethylfurfural electrooxidation. Adv. Powder Mater. 2025, 4, 100267. [Google Scholar] [CrossRef]
  35. Chen, H.; Luo, K.; Xie, C.; Zhou, L. Nanotechnology of carbon dots with their hybrids for biomedical applications: A review. Chem. Eng. J. 2024, 496, 153915. [Google Scholar] [CrossRef]
  36. Ren, J.; Opoku, H.; Tang, S.; Edman, L.; Wang, J. Carbon Dots: A Review with Focus on Sustainability. Adv. Sci. 2024, 11, e2405472. [Google Scholar] [CrossRef]
  37. Singh, P.; Bhankar, V.; Kumar, S.; Kumar, K. Biomass-derived carbon dots as significant biological tools in the medicinal field: A review. Adv. Colloid Interface Sci. 2024, 328, 103182. [Google Scholar] [CrossRef] [PubMed]
  38. Yang, M.; Han, Y.; Bianco, A.; Ji, D.-K. Recent Progress on Second Near-Infrared Emitting Carbon Dots in Biomedicine. ACS Nano 2024, 18, 11560–11572. [Google Scholar] [CrossRef]
  39. Zhang, H.; Liu, Y.; Qu, S. Recent advances in photo-responsive carbon dots for tumor therapy. Responsive Mater. 2024, 2, e20240012. [Google Scholar] [CrossRef]
  40. Yi, M.; Jing, M.; Yang, Y.; Huang, Y.; Zou, G.; Wu, T.; Hou, H.; Ji, X. Recent Developments of Carbon Dots for Advanced Zinc-Based Batteries: A Review. Adv. Funct. Mater. 2024, 34, 2400001. [Google Scholar] [CrossRef]
  41. Xiang, T.; Wang, J.; Liang, Y.; Daoudi, W.; Dong, W.; Li, R.; Chen, X.; Liu, S.; Zheng, S.; Zhang, K. Carbon Dots for Anti-Corrosion. Adv. Funct. Mater. 2024, 34, 2411456. [Google Scholar] [CrossRef]
  42. Chen, M.; Ma, J.; Chen, C.; Ding, J.; Liu, Y.; He, H.; Liu, Q.; Hu, G.; Wu, Y.; Liu, X. Cutting-edge innovations in red carbon dots: Synthesis, perfection, and breakthroughs in optoelectronics and electrocatalysis. Chem. Eng. J. 2024, 498, 155302. [Google Scholar] [CrossRef]
  43. Zhang, Y.; Chen, L.; Liu, B.; Yu, S.; Yang, Y.; Liu, X. Multicolor Afterglow Carbon Dots: Luminescence Regulation, Preparation, and Application. Adv. Funct. Mater. 2024, 34, 2315366. [Google Scholar] [CrossRef]
  44. Li, J.; Zhou, H.; Qiu, H.; Yan, Y.; Wang, X.; Gao, Z.; Wang, Z. Phosphorescent carbon dots: Intermolecular interactions, properties, and applications. Coord. Chem. Rev. 2024, 503, 215642. [Google Scholar] [CrossRef]
  45. Wu, W.; Cheng, H.-L.; Huang, Y.-L.; Ni, C.; Shi, Y.; Xu, Z.-H.; Zhang, G.-Q. Achieving ultrasensitive detection of glyphosate in fruits and vegetables using a triple-mode strategy based on carbon dots nanozymes derived from expired drugs. Spectrochim. Acta Part A Mol. Biomol. Spectrosc. 2025, 326, 125214. [Google Scholar] [CrossRef]
  46. Feng, M.; Zhang, X.; Huang, Y. Developing oxygen vacancy-rich CuMn2O4/carbon dots dual-function nanozymes via Chan-Lam coupling reaction for the colorimetric/fluorescent determination of D-penicillamine. Biosens. Bioelectron. 2025, 267, 116864. [Google Scholar] [CrossRef]
  47. Abdelhamid, H.N.; Talib, A.; Wu, H.-F. One pot synthesis of gold—Carbon dots nanocomposite and its application for cytosensing of metals for cancer cells. Talanta 2017, 166, 357–363. [Google Scholar] [CrossRef] [PubMed]
  48. Sendão, R.M.S.; Esteves da Silva, J.C.G.; Pinto da Silva, L. Polyfluoroalkyl Substances (PFASs) Detection Via Carbon Dots: A Review. Sustain. Chem. 2023, 4, 339–362. [Google Scholar] [CrossRef]
  49. Algethami, F.K.; Abdelhamid, H.N. Heteroatoms-doped carbon dots as dual probes for heavy metal detection. Talanta 2024, 273, 125893. [Google Scholar] [CrossRef]
  50. Mohammadi, S.; Dorado, Z.N.; Sharifan, H. Nanoscale Fluorinated Carbon Dots for the Detection of Perfluorooctanoic Acid in Aqueous Systems: A Fluorescence Assay Enhanced by Fluorophilic Interactions. ACS Appl. Nano Mater. 2024, 7, 21410–21419. [Google Scholar] [CrossRef]
  51. Abdelhamid, H.N.; Wu, H.-F. Multifunctional graphene magnetic nanosheet decorated with chitosan for highly sensitive detection of pathogenic bacteria. J. Mater. Chem. B 2013, 1, 3950–3961. [Google Scholar] [CrossRef]
  52. Shahnawaz Khan, M.; Abdelhamid, H.N.; Wu, H.-F. Near infrared (NIR) laser mediated surface activation of graphene oxide nanoflakes for efficient antibacterial, antifungal and wound healing treatment. Colloids Surf. B Biointerfaces 2015, 127C, 281–291. [Google Scholar] [CrossRef] [PubMed]
  53. Dowaidar, M.; Abdelhamid, H.N.; Hällbrink, M.; Zou, X.; Langel, Ü. Graphene oxide nanosheets in complex with cell penetrating peptides for oligonucleotides delivery. Biochim. Biophys. Acta—Gen. Subj. 2017, 1861, 2334–2341. [Google Scholar] [CrossRef]
  54. Soliman, M.; Sadek, A.A.; Abdelhamid, H.N.; Hussein, K. Graphene oxide-cellulose nanocomposite accelerates skin wound healing. Res. Vet. Sci. 2021, 137, 262–273. [Google Scholar] [CrossRef] [PubMed]
  55. Hussein, K.H.; Abdelhamid, H.N.; Zou, X.; Woo, H.-M. Ultrasonicated graphene oxide enhances bone and skin wound regeneration. Mater. Sci. Eng. C 2019, 94, 484–492. [Google Scholar] [CrossRef] [PubMed]
  56. Qiao, M.; Jiang, J.; Liu, S.; Yang, J.; Tan, K.; Zhu, J.; Shi, Y.; Hu, X. Triple-wavelength overlapping resonance Rayleigh scattering method for facile and rapid assay of perfluorooctane sulfonate. Environ. Monit. Assess. 2015, 187, 658. [Google Scholar] [CrossRef]
  57. Leung, S.C.E.; Wanninayake, D.; Chen, D.; Nguyen, N.-T.; Li, Q. Physicochemical properties and interactions of perfluoroalkyl substances (PFAS)—Challenges and opportunities in sensing and remediation. Sci. Total Environ. 2023, 905, 166764. [Google Scholar] [CrossRef]
  58. He, J.; Su, Y.; Sun, Z.; Zhang, R.; Wu, F.; Bai, Y. A chitosan-mediated “turn-on” strategy for rapid fluorometric detection of perfluorooctane sulfonate. Microchem. J. 2020, 157, 105030. [Google Scholar] [CrossRef]
  59. Chen, Z.; Lu, Y.-L.; Wang, L.; Xu, J.; Zhang, J.; Xu, X.; Cheng, P.; Yang, S.; Shi, W. Efficient Recognition and Removal of Persistent Organic Pollutants by a Bifunctional Molecular Material. J. Am. Chem. Soc. 2023, 145, 260–267. [Google Scholar] [CrossRef]
  60. Dalapati, R.; Manickam, S.; Shi, J.; Hunter, M.; Zang, L. Perylene diimide based fluorescent sensors for aqueous detection of perfluorooctane sulfonate (PFOS). Anal. Chim. Acta 2025, 1341, 343670. [Google Scholar] [CrossRef]
  61. Luo, Y.; Ma, S.; Sui, B.; Zhang, L.; Yu, A.; Zhang, J.; Zhang, Y.; Zhao, W.; Ouyang, G. Exploring an indirect quantification strategy for PFOA in rat tissues via efficient degradation and fluorescence spectroscopy. Microchem. J. 2024, 207, 112108. [Google Scholar] [CrossRef]
  62. Gou, Z.; Wang, A.; Zhang, X.; Zuo, Y.; Lin, W. Multi-head cationic siloxane based “turn on” fluorescent system for selective detection of perfluorooctanoic sulfonate (PFOS). Sens. Actuators B Chem. 2022, 367, 132017. [Google Scholar] [CrossRef]
  63. Chen, Q.; Zhu, P.; Xiong, J.; Gao, L.; Tan, K. A sensitive and selective triple-channel optical assay based on red-emissive carbon dots for the determination of PFOS. Microchem. J. 2019, 145, 388–396. [Google Scholar] [CrossRef]
  64. Hong, Y.; Chen, X.; Zhang, Y.; Zhu, Y.; Sun, J.; Swihart, M.T.; Tan, K.; Dong, L. One-pot hydrothermal synthesis of high quantum yield orange-emitting carbon quantum dots for sensitive detection of perfluorinated compounds. New J. Chem. 2022, 46, 19658–19666. [Google Scholar] [CrossRef]
  65. Lin, L.; Zhou, S.; Guo, H.; Chen, Y.; Lin, S.; Yan, L.; Li, K.; Li, J. Nitrogen-doped carbon dots as an effective fluorescence enhancing system for the determination of perfluorooctyl sulfonate. Microchim. Acta 2019, 186, 380. [Google Scholar] [CrossRef] [PubMed]
  66. Chen, Q.; Zhu, P.; Xiong, J.; Gao, L.; Tan, K. A new dual-recognition strategy for hybrid ratiometric and ratiometric sensing perfluorooctane sulfonic acid based on high fluorescent carbon dots with ethidium bromide. Spectrochim. Acta Part A Mol. Biomol. Spectrosc. 2020, 224, 117362. [Google Scholar] [CrossRef]
  67. Cheng, Z.; Dong, H.; Liang, J.; Zhang, F.; Chen, X.; Du, L.; Tan, K. Highly selective fluorescent visual detection of perfluorooctane sulfonate via blue fluorescent carbon dots and berberine chloride hydrate. Spectrochim. Acta Part A Mol. Biomol. Spectrosc. 2019, 207, 262–269. [Google Scholar] [CrossRef]
Figure 1. Schematic representation for synthesizing N, S-CDs, and their sensing for PFOS molecules. Color for PFOS: Carbon (C) is black; Hydrogen (H) is white; Oxygen (O) is red; Nitrogen (N) is green; Fluorine (F) is yellow-green; and Sulfur (S) is yellow.
Carbon 11 00036 g001
Figure 2. Characterization using (a) XRD and (b) FT-IR.
Carbon 11 00036 g002
Figure 3. (a) TEM image and (b) particle size distribution of N, S-CDs.
Carbon 11 00036 g003
Figure 4. (a) solution of N, S-CDs under ambient light (brown-yellow color solution) and UV-LED lamp (254 nm, blue color), and (b) fluorescence emission upon different excitation wavelengths.
Carbon 11 00036 g004
Figure 5. (a) fluorescence emission upon the addition of PFOS, and (b) intensity change versus PFOS concentration.
Carbon 11 00036 g005
Figure 6. Linear relationship between fluorescence emission signal and PFOS concentration.
Carbon 11 00036 g006
Figure 7. Chemical structure of PFOS, N, S-CDs, MO, and phenol red. The color and absorbance wavelength are also included.
Carbon 11 00036 g007
Figure 8. UV-Vis spectra for CDs and their interactions with (a) PFOS, (b) MO, (c) phenol red, and (d) camera photo for phenol red before and after interactions with CDs; the solutions were presented under ambient and UV light.
Carbon 11 00036 g008
Disclaimer/Publisher’s Note: The statements, opinions and data contained in all publications are solely those of the individual author(s) and contributor(s) and not of MDPI and/or the editor(s). MDPI and/or the editor(s) disclaim responsibility for any injury to people or property resulting from any ideas, methods, instructions or products referred to in the content.

