

Numerical Simulation Studies on the Design of the Prosthetic Heart Valves Belly Curves


Abstract
1. Introduction
2. Methods
2.1. Geometry and Mesh Generation
2.2. Materials
2.3. FSI Approach
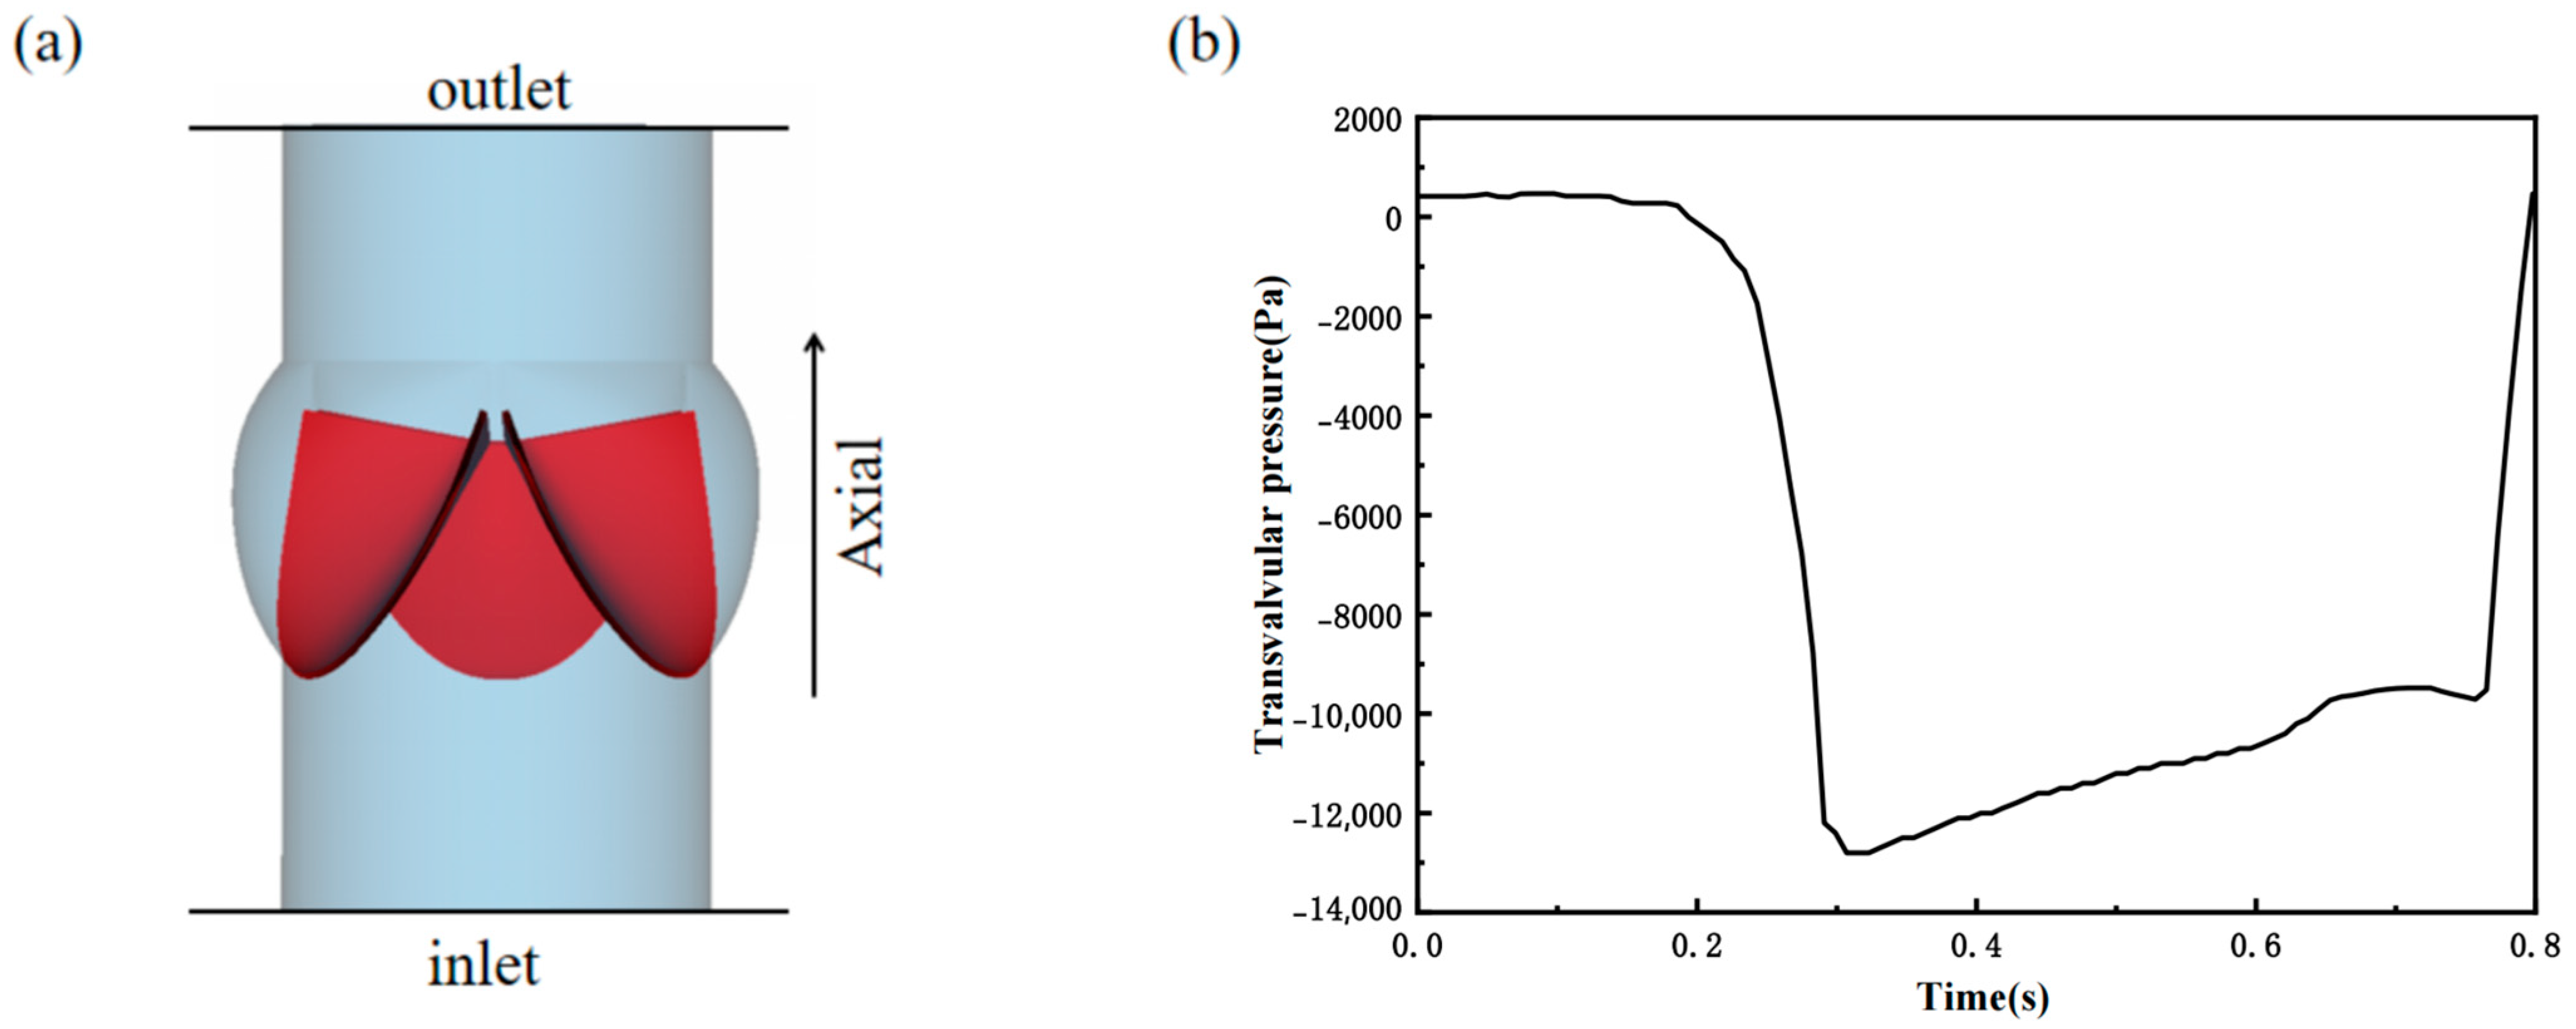
2.4. Flow and Boundary Conditions
3. Results
3.1. Valve Performance Parameters
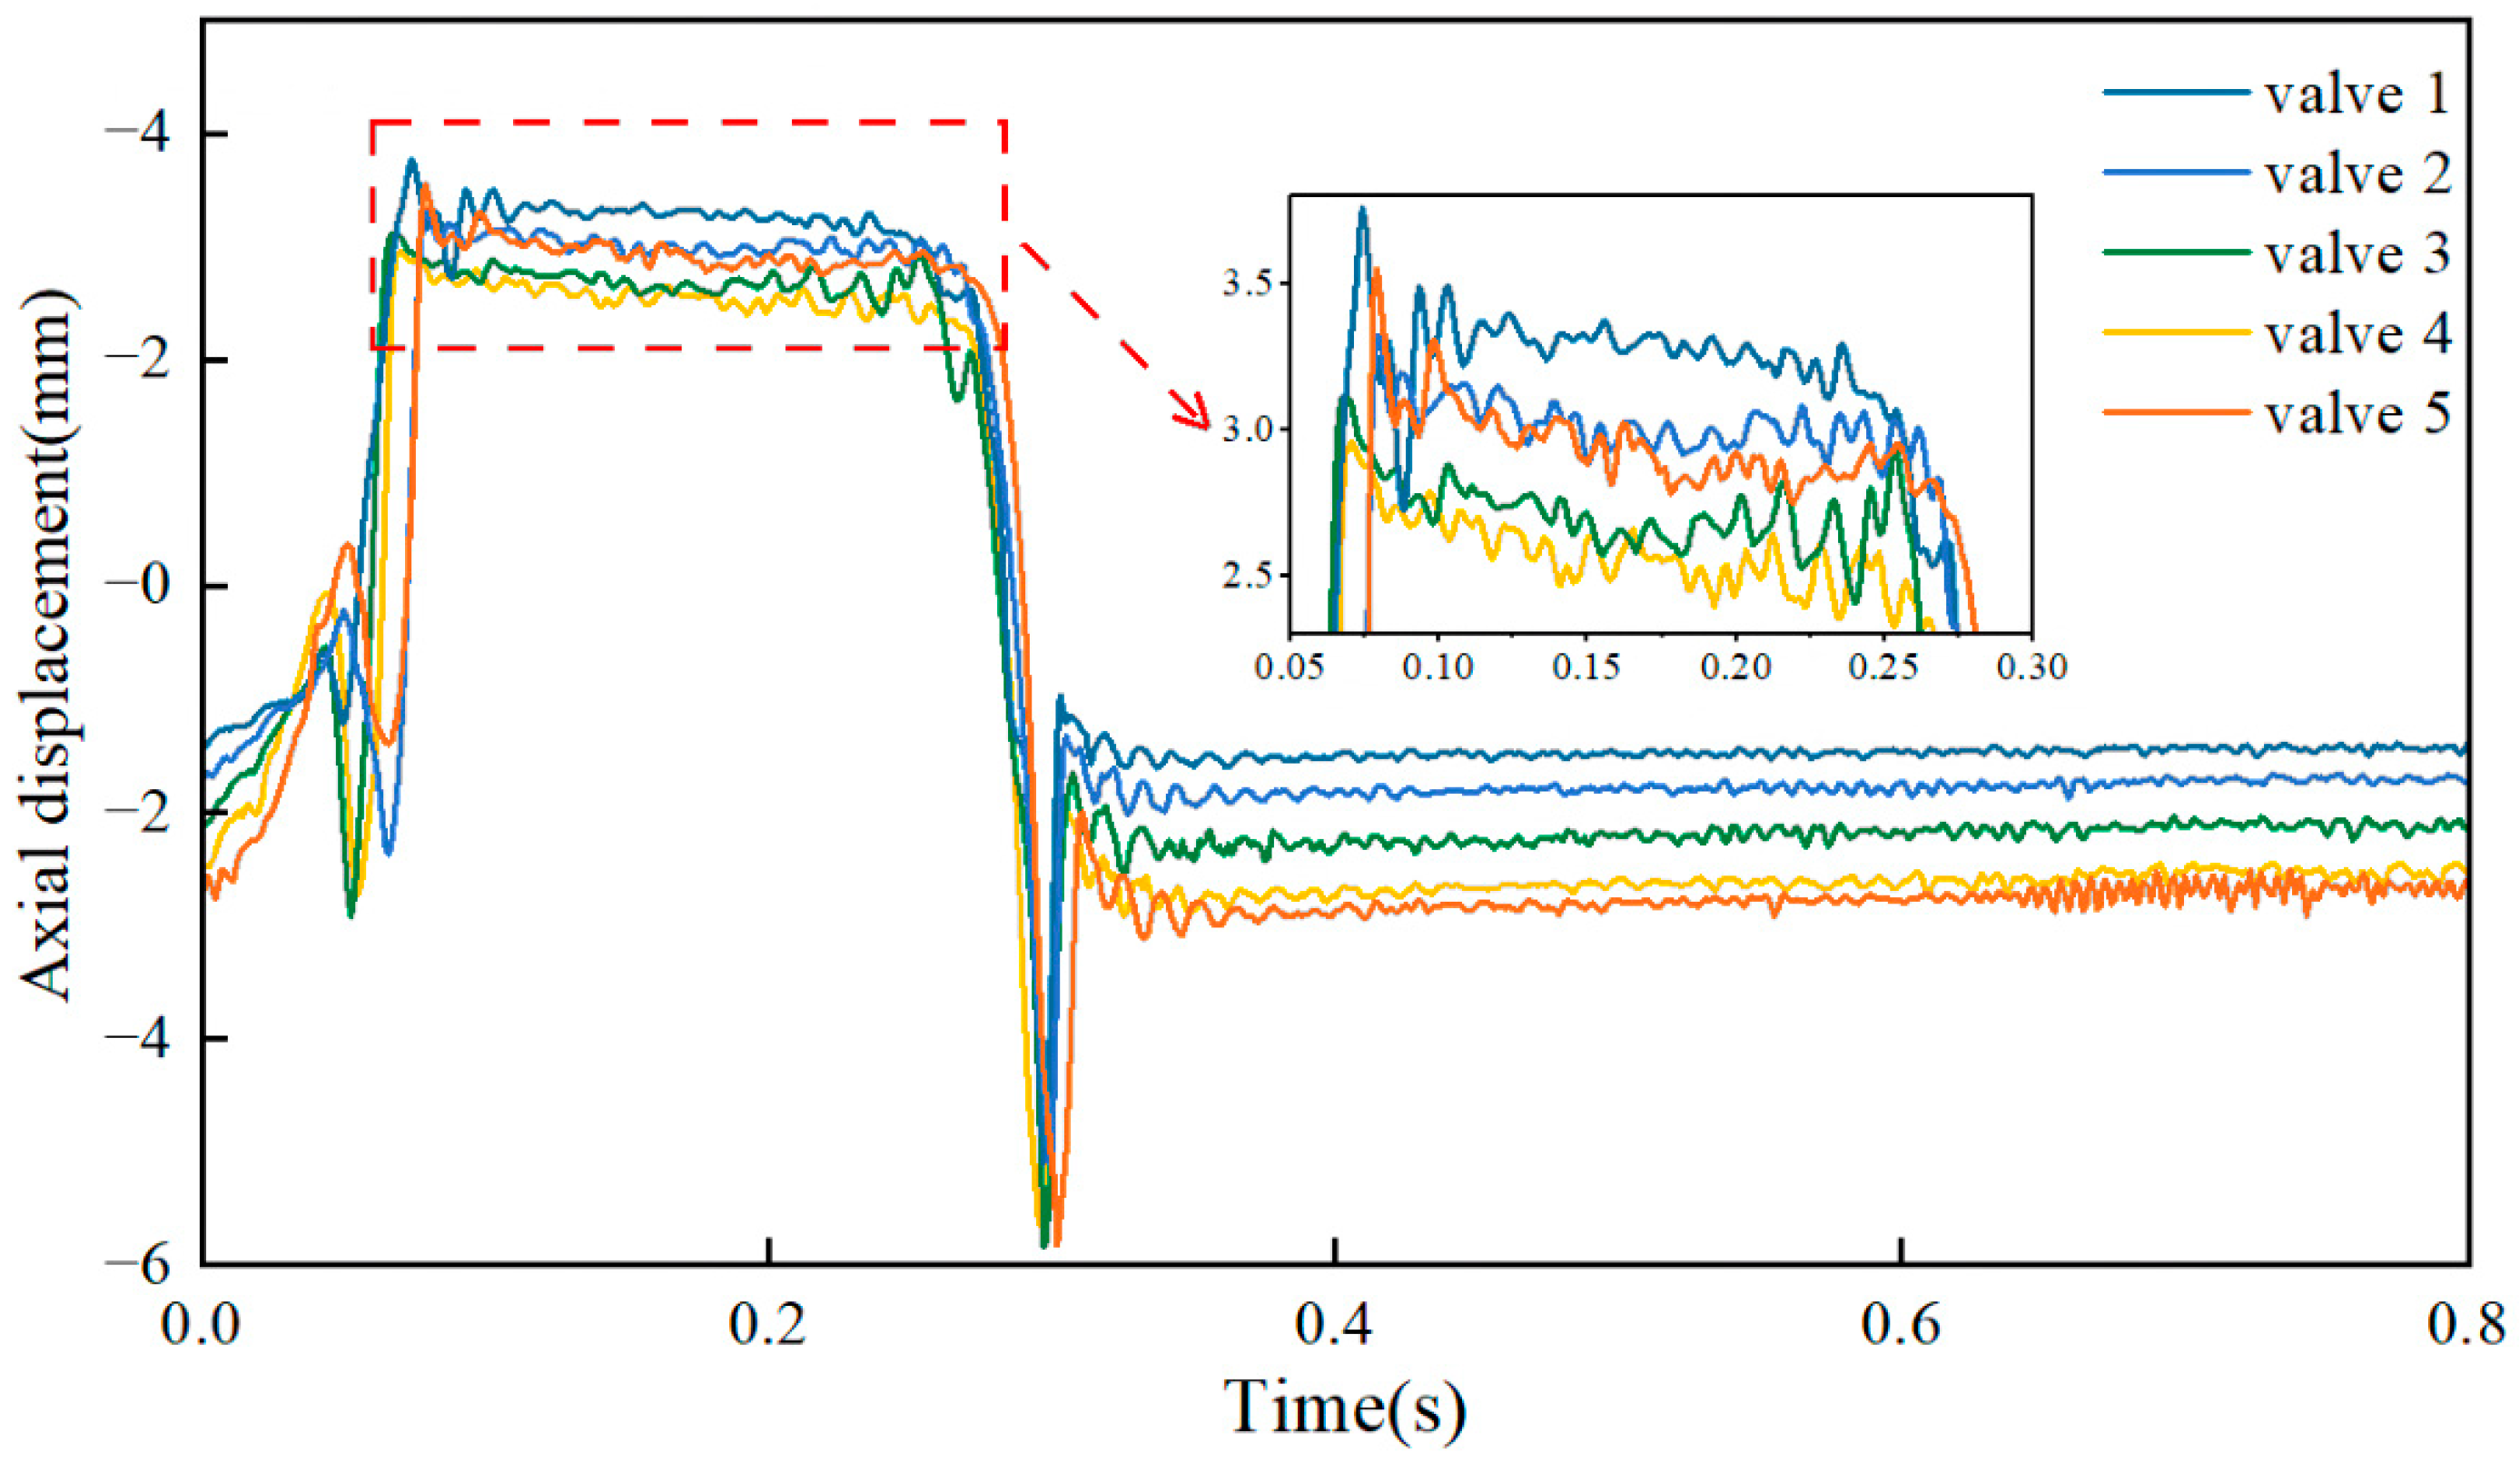
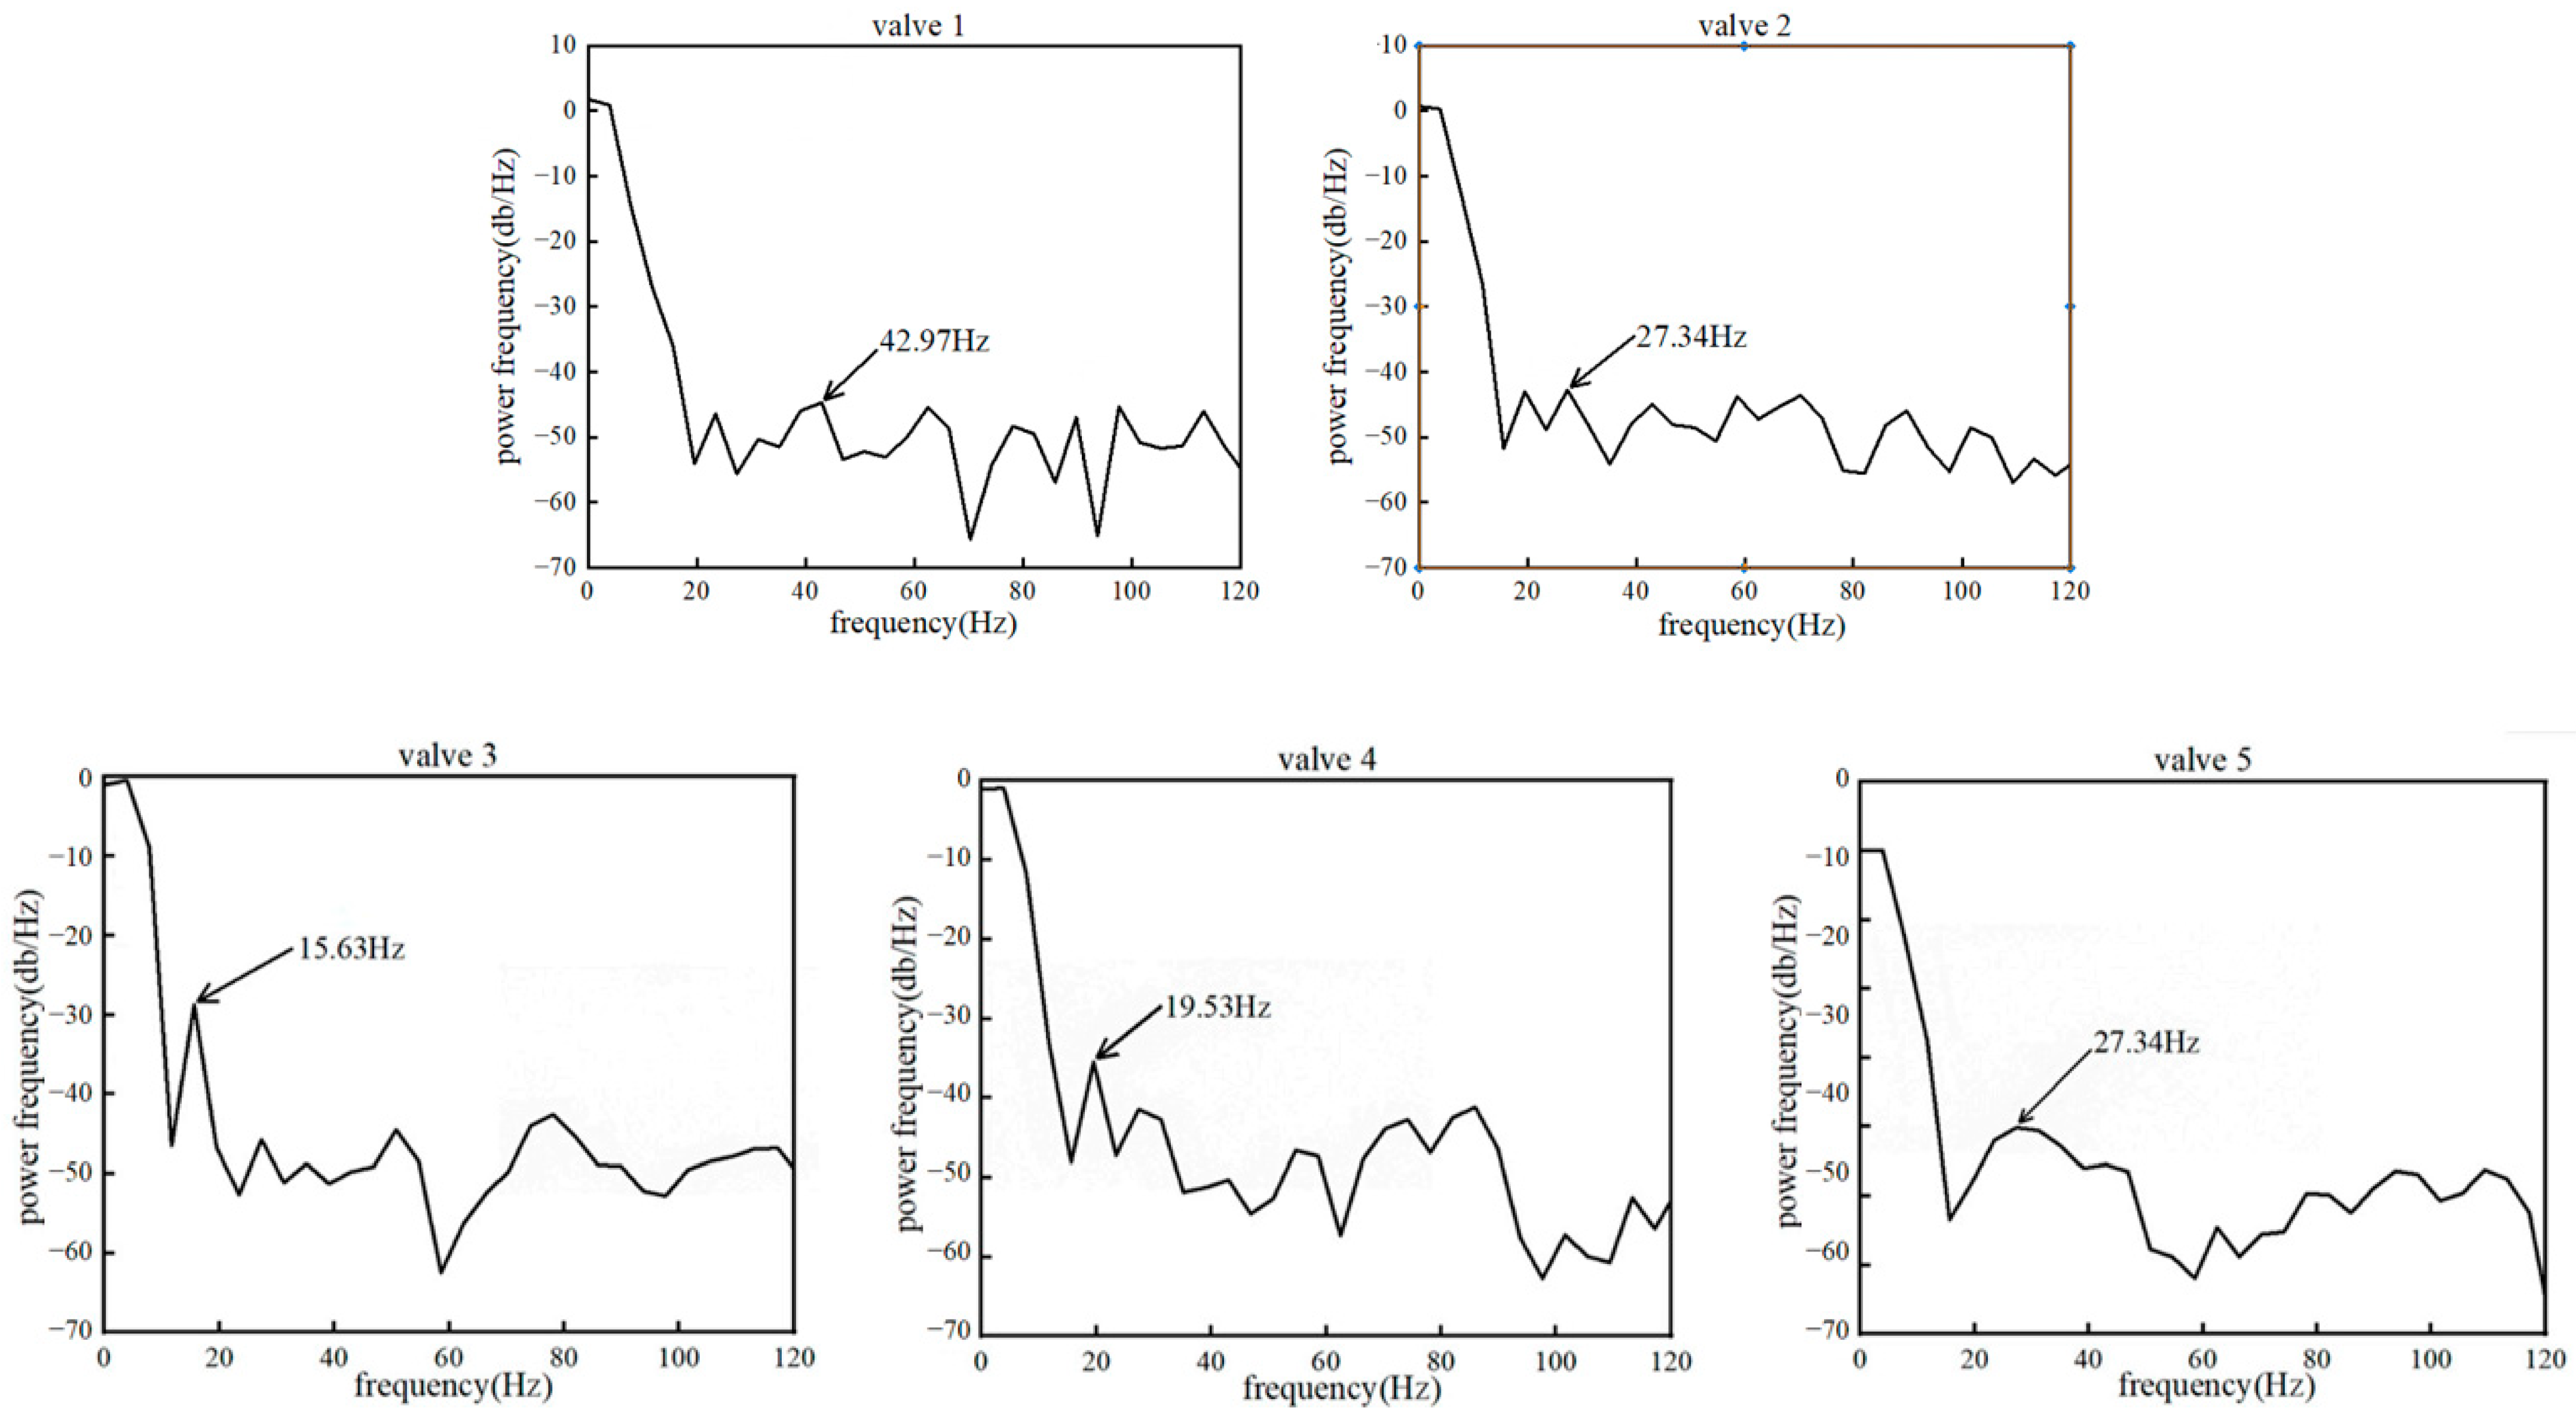
3.2. Leaflet Kinematics
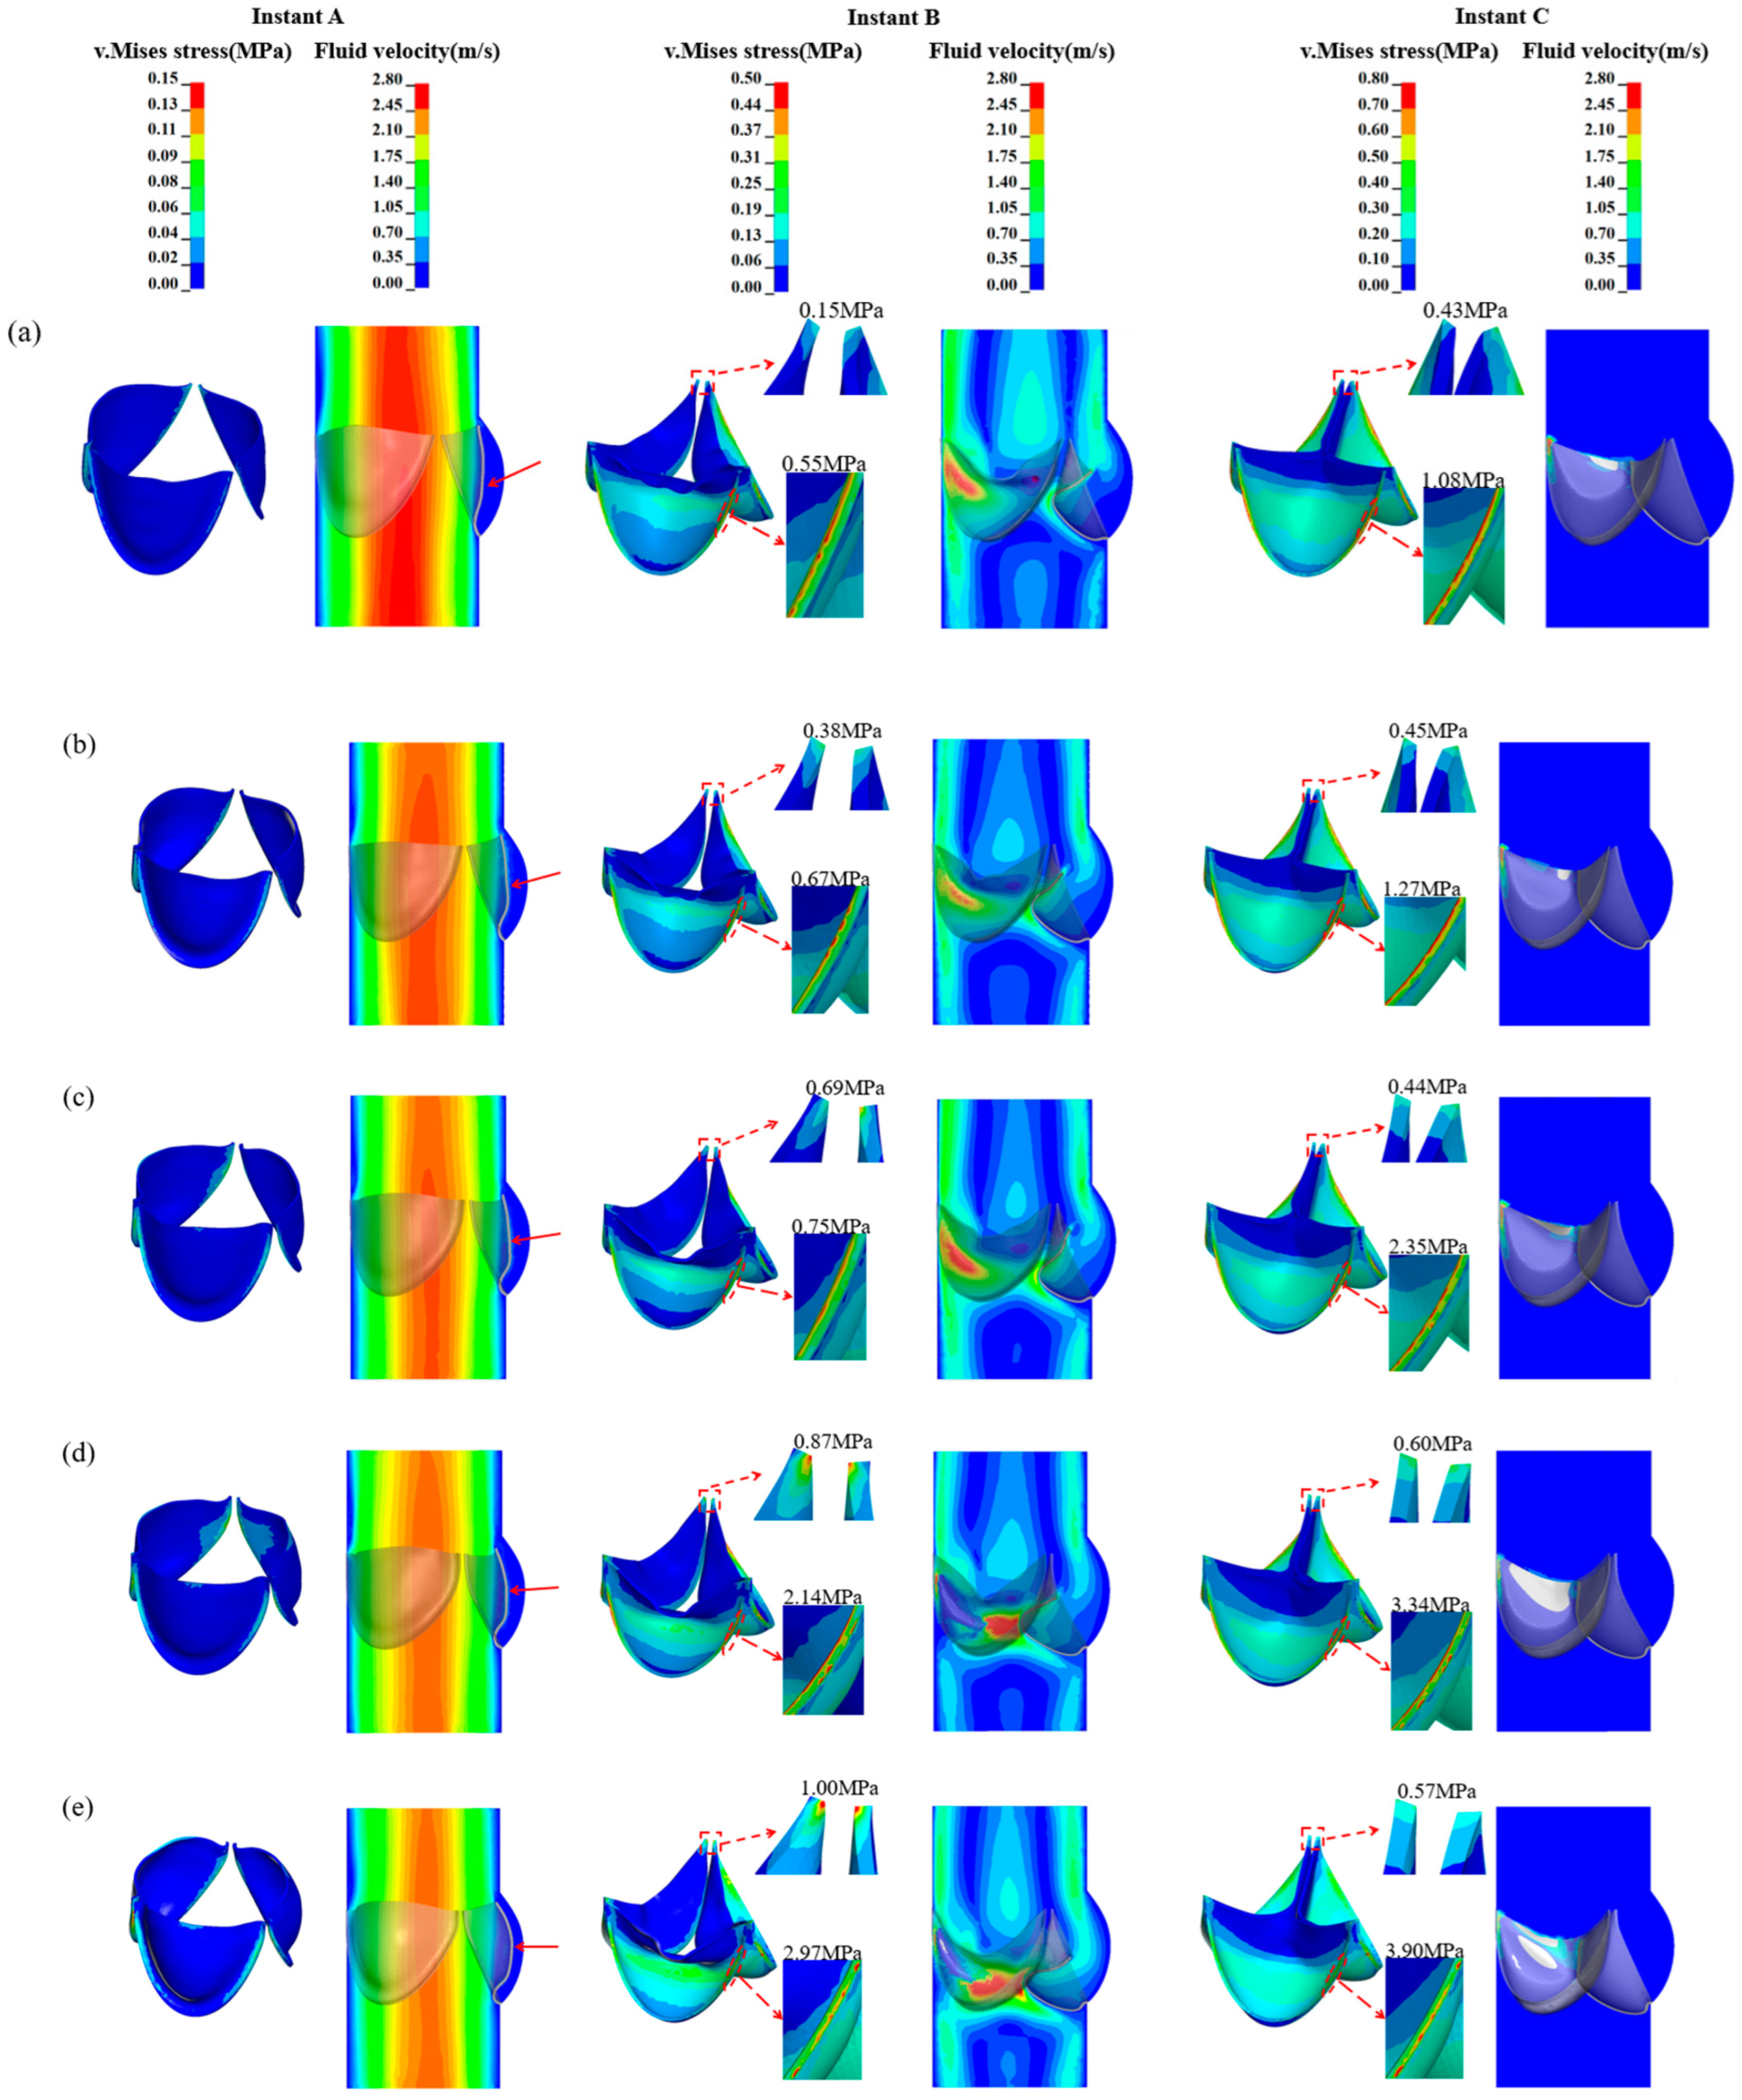
3.3. Von-Mises Stress and Flow Velocity
4. Discussion
5. Limitation
6. Conclusions
Author Contributions
Funding
Data Availability Statement
Conflicts of Interest
Appendix A

| Fluid Domain | Solid Domain | ||||
|---|---|---|---|---|---|
| Main Body Min–Max Size (mm) | Fluid–Structure Interface Min–Max Size (mm) | Total Elements | Leaflet Element Size (mm) | Total Elements | |
| Coarse | 0.4–1 | 0.4 | 263,662 | 0.4 | 35,051 |
| Fine | 0.2–0.8 | 0.2–0.4 | 469,891 | 0.2–0.4 | 65,379 |
| Finer | 0.15–0.6 | 0.15–0.3 | 1,194,995 | 0.15–0.3 | 130,773 |

| Fluid Elements | Solid Elements | Total Elements | |
|---|---|---|---|
| valve 1 | 469,891 | 65,379 | 535,270 |
| valve 2 | 467,639 | 68,878 | 536,517 |
| valve 3 | 468,862 | 70,903 | 539,765 |
| valve 4 | 448,666 | 72,870 | 521,536 |
| valve 5 | 438,432 | 73,043 | 511,475 |
References
- Salaun, E.; Clavel, M.A.; Rodes-Cabau, J.; Pibarot, P. Bioprosthetic aortic valve durability in the era of transcatheter aortic valve implantation. Heart 2018, 104, 1323–1332. [Google Scholar] [CrossRef] [PubMed]
- Butcher, J.T.; Mahler, G.J.; Hockaday, L.A. Aortic valve disease and treatment: The need for naturally engineered solutions. Adv. Drug Deliv. Rev. 2011, 63, 242–268. [Google Scholar] [CrossRef] [PubMed]
- Dvir, D.; Bourguignon, T.; Otto, C.M.; Hahn, R.T.; Rosenhek, R.; Webb, J.G.; Treede, H.; Sarano, M.E.; Feldman, T.; Wijeysundera, H.C.; et al. Standardized Definition of Structural Valve Degeneration for Surgical and Transcatheter Bioprosthetic Aortic Valves. Circulation 2018, 137, 388–399. [Google Scholar] [CrossRef] [PubMed]
- Iung, B.; Rodes-Cabau, J. The optimal management of ant thrombotic therapy after valve replacement: Certainties and uncertainties. Eur. Heart J. 2014, 35, 2942–2949. [Google Scholar] [CrossRef] [PubMed]
- Li, R.L.; Russ, J.; Paschalides, C.; Ferrari, G.; Waisman, H.; Kysar, J.W.; David, K. Mechanical considerations for polymeric heart valve development: Biomechanics, materials, design and manufacturing. Biomaterials 2019, 225, 119493. [Google Scholar] [CrossRef] [PubMed]
- Gharaie, S.H.; Morsi, Y. A novel design of a polymeric aortic valve. Int. J. Artif. Organs 2015, 38, 259–270. [Google Scholar] [CrossRef] [PubMed]
- Rahmani, B.; Tzamtzis, S.; Ghanbari, H.; Burriesci, G.; Seifalian, A.M. Manufacturing and hydrodynamic assessment of a novel aortic valve made of a new nanocomposite polymer. J. Biomech. 2012, 45, 1205–1211. [Google Scholar] [CrossRef]
- Rahmani, B.; Tzamtzis, S.; Sheridan, R.; Mullen, M.J.; Yap, J.; Seifalian, A.M.; Burriesci, G. A new transcatheter heart valve concept (the TRISKELE): Feasibility in an acute preclinical model. Eurointervention 2016, 12, 901–908. [Google Scholar] [CrossRef]
- Dasi, L.P.; Simon, H.A.; Sucosky, P.; Yoganathan, A.P. Fluid Mechanics of Artificial Heart Valves. Clin. Exp. Pharmacol. Physiol. 2009, 36, 225–237. [Google Scholar] [CrossRef]
- ISO 5840-3:2013; Cardiovascular Implants-Cardiac Valve Prostheses-Part 3: Heart Valve Substitutes Implanted by Transcatheter Techniques. The International Organization for Standardization: Geneva, Switzerland, 2013.
- Jiang, H.J.; Campbell, G.; Boughner, D.; Wan, W.K.; Quantz, M. Design and manufacture of a polyvinyl alcohol (PVA) cryogel tri-leaflet heart valve prosthesis. Med. Eng. Phys. 2004, 26, 269–277. [Google Scholar] [CrossRef]
- Travaglino, S.; Murdock, K.; Anh, T.; Martin, C.; Liang, L.; Wang, Y.; Sun, W. Computational Optimization Study of Transcatheter Aortic Valve Leaflet Design Using Porcine and Bovine Leaflets. J. Biomech. Eng.-Trans. ASME 2020, 142, 011007. [Google Scholar] [CrossRef] [PubMed]
- Li, K.; Sun, W. Simulated transcatheter aortic valve deformation: A parametric study on the impact of leaflet geometry on valve peak stress. Int. J. Numer. Methods Biomed. Eng. 2017, 33, e02814. [Google Scholar] [CrossRef] [PubMed]
- Tao, L.; Zhou, J.; Zhou, H.; Li, Y.; Yan, X.; Yu, C. Research on fatigue optimization simulation of polymeric heart valve based on the iterative sub-regional thickened method. Int. J. Numer. Methods Biomed. Eng. 2023, 39, e3717. [Google Scholar] [CrossRef] [PubMed]
- Claiborne, T.E.; Xenos, M.; Sheriff, J.; Chiu, W.-C.; Soares, J.; Alemu, Y.; Gupta, S.; Judex, S.; Slepian, M.J.; Bluestein, D. Toward Optimization of a Novel Trileaflet Polymeric Prosthetic Heart Valve via Device Thrombogenicity Emulation. Asaio J. 2013, 59, 275–283. [Google Scholar] [CrossRef]
- Kouhi, E.; Morsi, Y.S. A parametric study on mathematical formulation and geometrical construction of a stentless aortic heart valve. J. Artif. Organs 2013, 16, 425–442. [Google Scholar] [CrossRef]
- Abbasi, M.; Azadani, A.N. A geometry optimization framework for transcatheter heart valve leaflet design. J. Mech. Behav. Biomed. Mater. 2020, 102, 103491. [Google Scholar] [CrossRef]
- Xu, F.; Morganti, S.; Zakerzadeh, R.; Kamensky, D.; Auricchio, F.; Reali, A.; Hughes, T.J.R.; Sacks, M.S.; Hsu, M.-C. A framework for designing patient-specific bioprosthetic heart valves using immersogeometric fluid-structure interaction analysis. Int. J. Numer. Methods Biomed. Eng. 2018, 34, e2938. [Google Scholar] [CrossRef]
- Gulbulak, U.; Ertas, A.; Baturalp, T.B.; Pavelka, T. The effect of fundamental curves on geometric orifice and coaptation areas of polymeric heart valves. J. Mech. Behav. Biomed. Mater. 2020, 112, 104039. [Google Scholar] [CrossRef]
- Toggweiler, S.; Wood, D.A.; Rodes-Cabau, J.; Kapadia, S.; Willson, A.B.; Ye, J.; Cheung, A.; Leipsic, J.; Binder, R.K.; Gurvitch, R.; et al. Transcatheter Valve-In-Valve Implantation for Failed Balloon-Expandable Transcatheter Aortic Valves. JACC Cardiovasc. Interv. 2012, 5, 571–577. [Google Scholar] [CrossRef]
- Feng, W.; Yang, X.; Liu, Y.; Fan, Y. An In Vitro Feasibility Study of the Influence of Configurations and Leaflet Thickness on the Hydrodynamics of Deformed Transcatheter Aortic Valve. Artif. Organs 2017, 41, 735–743. [Google Scholar] [CrossRef]
- Roman, M.J.; Devereux, R.B.; Kramerfox, R.; Oloughlin, J.; Spitzer, M.; Robins, J. Two-Dimensional Echocardiographic Aortic Root Dimensions in Normal-Children and Adults. Am. J. Cardiol. 1989, 64, 507–512. [Google Scholar] [CrossRef] [PubMed]
- LS-DYNA_Manual_Volume_I_R11 LSTC. 2018. Available online: https://lsdyna.ansys.com/manuals/ (accessed on 2 September 2024).
- Bonet, J.; Burton, A.J. A simple average nodal pressure tetrahedral element for incompressible and nearly incompressible dynamic explicit applications. Commun. Numer. Methods Eng. 1998, 14, 437–449. [Google Scholar] [CrossRef]
- Amindari, A.; Kırkköprü, K.; Saltık, İ.l.; Sünbüloğlu, E. Effect of non-linear leaflet material properties on aortic valve dynamics—A coupled fluid-structure approach. Eng. Solid Mech. 2021, 9, 123–136. [Google Scholar] [CrossRef]
- Gnyaneshwar, R.; Kumar, R.K.; Balakrishnan, K.R. Dynamic analysis of the aortic valve using a finite element model. Ann. Thorac. Surg. 2002, 73, 1122–1129. [Google Scholar] [CrossRef]
- Huelsmann, J.; Gruen, K.; El Amouri, S.; Barth, M.; Hornung, K.; Holzfuss, C.; Lichtenberg, A.; Akhyari, P. Transplantation material bovine pericardium: Biomechanical and immunogenic characteristics after decellularization vs. glutaraldehyde-fixing. Xenotransplantation 2012, 19, 286–297. [Google Scholar] [CrossRef]
- Bozkurt, S.; Preston-Maher, G.L.; Torii, R.; Burriesci, G. Design, Analysis and Testing of a Novel Mitral Valve for Transcatheter Implantation. Ann. Biomed. Eng. 2017, 45, 1852–1864. [Google Scholar] [CrossRef]
- Wei, Z.A.; Sonntag, S.J.; Toma, M.; Singh-Gryzbon, S.; Sun, W. Computational Fluid Dynamics Assessment Associated with Transcatheter Heart Valve Prostheses: A Position Paper of the ISO Working Group. Cardiovasc. Eng. Technol. 2018, 9, 289–299. [Google Scholar] [CrossRef]
- Luraghi, G.; Wu, W.; De Gaetano, F.; Matas, J.F.R.; Moggridge, G.D.; Serrani, M.; Stasiak, J.; Costantino, M.L.; Migliavacca, F. Evaluation of an aortic valve prosthesis: Fluid-structure interaction or structural simulation? J. Biomech. 2017, 58, 45–51. [Google Scholar] [CrossRef]
- Marom, G.; Haj-Ali, R.; Raanani, E.; Schaefers, H.-J.; Rosenfeld, M. A fluid-structure interaction model of the aortic valve with coaptation and compliant aortic root. Med. Biol. Eng. Comput. 2012, 50, 173–182. [Google Scholar] [CrossRef]
- Caldichoury, I.; Paz, R.R.; Del Pin, F. ICFD Theory Manual Incompressible Fluid Solver in LS-DYNA; Livermore Software Technology Corp: Livermore, CA, USA, 2014. [Google Scholar]
- Cao, K.; Sucosky, P. Computational comparison of regional stress and deformation characteristics in tricuspid and bicuspid aortic valve leaflets. Int. J. Numer. Methods Biomed. Eng. 2017, 33, e02798. [Google Scholar] [CrossRef]
- De Hart, J.; Baaijens, F.P.T.; Peters, G.W.M.; Schreurs, P.J.G. A computational fluid-structure interaction analysis of a fiber-reinforced stentless aortic valve. J. Biomech. 2003, 36, 699–712. [Google Scholar] [CrossRef] [PubMed]
- de Tullio, M.D.; Afferrante, L.; Demelio, G.; Pascazio, G.; Verzicco, R. Fluid-structure interaction of deformable aortic prostheses with a bileaflet mechanical valve. J. Biomech. 2011, 44, 1684–1690. [Google Scholar] [CrossRef]
- Kim, H.; Lu, J.; Sacks, M.S.; Chandran, K.B. Dynamic simulation of bioprosthetic heart valves using a stress resultant shell model. Ann. Biomed. Eng. 2008, 36, 262–275. [Google Scholar] [CrossRef]
- Garcia, D.; Kadem, L. What do you mean by aortic valve area: Geometric orifice area, effective orifice area, or Gorlin area? J. Heart Valve Dis. 2006, 15, 601–608. [Google Scholar]
- Wu, C.; Saikrishnan, N.; Chalekian, A.J.; Fraser, R.; Ieropoli, O.; Retta, S.M.; Joseph, R.; Lee, S.; Marquez, S.; Mester, D.; et al. In-Vitro Pulsatile Flow Testing of Prosthetic Heart Valves: A Round-Robin Study by the ISO Cardiac Valves Working Group. Cardiovasc. Eng. Technol. 2019, 10, 397–422. [Google Scholar] [CrossRef]
- Lee, J.H.; Scotten, L.N.; Hunt, R.; Caranasos, T.G.; Vavalle, J.P.; Griffith, B.E. Bioprosthetic aortic valve diameter and thickness are directly related to leaflet fluttering: Results from a combined experimental and computational modeling study. JTCVS Open 2021, 6, 60–81. [Google Scholar] [CrossRef] [PubMed]
- Luraghi, G.; Migliavacca, F.; Matas, J.F.R. Study on the Accuracy of Structural and FSI Heart Valves Simulations. Cardiovasc. Eng. Technol. 2018, 9, 723–738. [Google Scholar] [CrossRef] [PubMed]
- Hsu, M.-C.; Kamensky, D.; Xu, F.; Kiendl, J.; Wang, C.; Wu, M.C.H.; Mineroff, J.; Reali, A.; Bazilevs, Y.; Sacks, M.S. Dynamic and fluid-structure interaction simulations of bioprosthetic heart valves using parametric design with T-splines and Fung-type material models. Comput. Mech. 2015, 55, 1211–1225. [Google Scholar] [CrossRef]
- Weinberg, E.J.; Kaazempur Mofrad, M.R. Transient, three-dimensional, multiscale simulations of the human aortic valve. Cardiovasc. Eng. 2007, 7, 140–155. [Google Scholar] [CrossRef]
- Rassoli, A.; Fatouraee, N.; Guidoin, R.; Zhang, Z.; Ravaghi, S. A comparative study of different tissue materials for bioprosthetic aortic valves using experimental assays and finite element analysis. Comput. Methods Programs Biomed. 2022, 220, 106813. [Google Scholar] [CrossRef]
- Applegate, P.M.; Boyd, W.D.; Applegate Ii, R.L.; Liu, H. Is it the time to reconsider the choice of valves for cardiac surgery: Mechanical or bioprosthetic? J. Biomed. Res. 2017, 31, 373–376. [Google Scholar] [CrossRef] [PubMed]
- Rodriguez-Gabella, T.; Voisine, P.; Puri, R.; Pibarot, P.; Rodes-Cabau, J. Aortic Bioprosthetic Valve Durability Incidence, Mechanisms, Predictors, and Management of Surgical and Transcatheter Valve Degeneration. J. Am. Coll. Cardiol. 2017, 70, 1013–1028. [Google Scholar] [CrossRef] [PubMed]
- Aljalloud, A.; Shoaib, M.; Egron, S.; Arias, J.; Tewarie, L.; Schnoering, H.; Lotfi, S.; Goetzenich, A.; Hatam, N.; Pott, D.; et al. The flutter-by effect: A comprehensive study of the fluttering cusps of the Perceval heart valve prosthesis. Interact. Cardiovasc. Thorac. Surg. 2018, 27, 664–670. [Google Scholar] [CrossRef] [PubMed]
- Johnson, E.L.; Wu, M.C.H.; Xu, F.; Wiese, N.M.; Rajanna, M.R.; Herrema, A.J.; Ganapathysubramanian, B.; Hughes, T.J.R.; Sacks, M.S.; Hsu, M.-C. Thinner biological tissues induce leaflet flutter in aortic heart valve replacements. Proc. Natl. Acad. Sci. USA 2020, 117, 19007–19016. [Google Scholar] [CrossRef] [PubMed]
- Peacock, J.A. An Invitro Study of the Onset of Turbulence in the Sinus of Valsalva. Circ. Res. 1990, 67, 448–460. [Google Scholar] [CrossRef]
- Becsek, B.; Pietrasanta, L.; Obrist, D. Turbulent Systolic Flow Downstream of a Bioprosthetic Aortic Valve: Velocity Spectra, Wall Shear Stresses, and Turbulent Dissipation Rates. Front. Physiol. 2020, 11, 577188. [Google Scholar] [CrossRef]
- Vennemann, B.; Roesgen, T.; Heinisch, P.P.; Obrist, D. Leaflet Kinematics of Mechanical and Bioprosthetic Aortic Valve Prostheses. ASAIO J. 2018, 64, 651–661. [Google Scholar] [CrossRef]
- Avelar, A.H.d.F.; Canestri, J.A.; Bim, C.; Silva, M.G.M.; Huebner, R.; Pinotti, M. Quantification and Analysis of Leaflet Flutter on Biological Prosthetic Cardiac Valves. Artif. Organs 2017, 41, 835–844. [Google Scholar] [CrossRef]
- Hsu, M.-C.; Kamensky, D.; Bazilevs, Y.; Sacks, M.S.; Hughes, T.J.R. Fluid-structure interaction analysis of bioprosthetic heart valves: Significance of arterial wall deformation. Comput. Mech. 2014, 54, 1055–1071. [Google Scholar] [CrossRef]
- Nestola, M.G.C.; Zulian, P.; Gaedke-Merzhauser, L.; Krause, R. Fully coupled dynamic simulations of bioprosthetic aortic valves based on an embedded strategy for fluid-structure interaction with contact. EUROPACE 2021, 23, I96–I104. [Google Scholar] [CrossRef]
- Kendall, M.E.; Rembert, J.C.; Greenfield, J.C. Pressure-Flow Studies in Man—Nature of Aortic Flow Pattern in both Valvular Mitral-Insufficiency and Prolapsing Mitral-Valve Syndrome. Am. Heart J. 1973, 86, 359–365. [Google Scholar] [CrossRef] [PubMed]
- Uther, J.B.; Peterson, K.L.; Shabetai, R.; Braunwal, E. Measurement of Ascending Aortic Flow Patterns in Man. J. Appl. Physiol. 1973, 34, 513–518. [Google Scholar] [CrossRef] [PubMed]
- Sundaram, G.B.K.; Balakrishnan, K.R.; Kumar, R.K. Aortic valve dynamics using a fluid structure interaction model—The physiology of opening and closing. J. Biomech. 2015, 48, 1737–1744. [Google Scholar] [CrossRef] [PubMed]

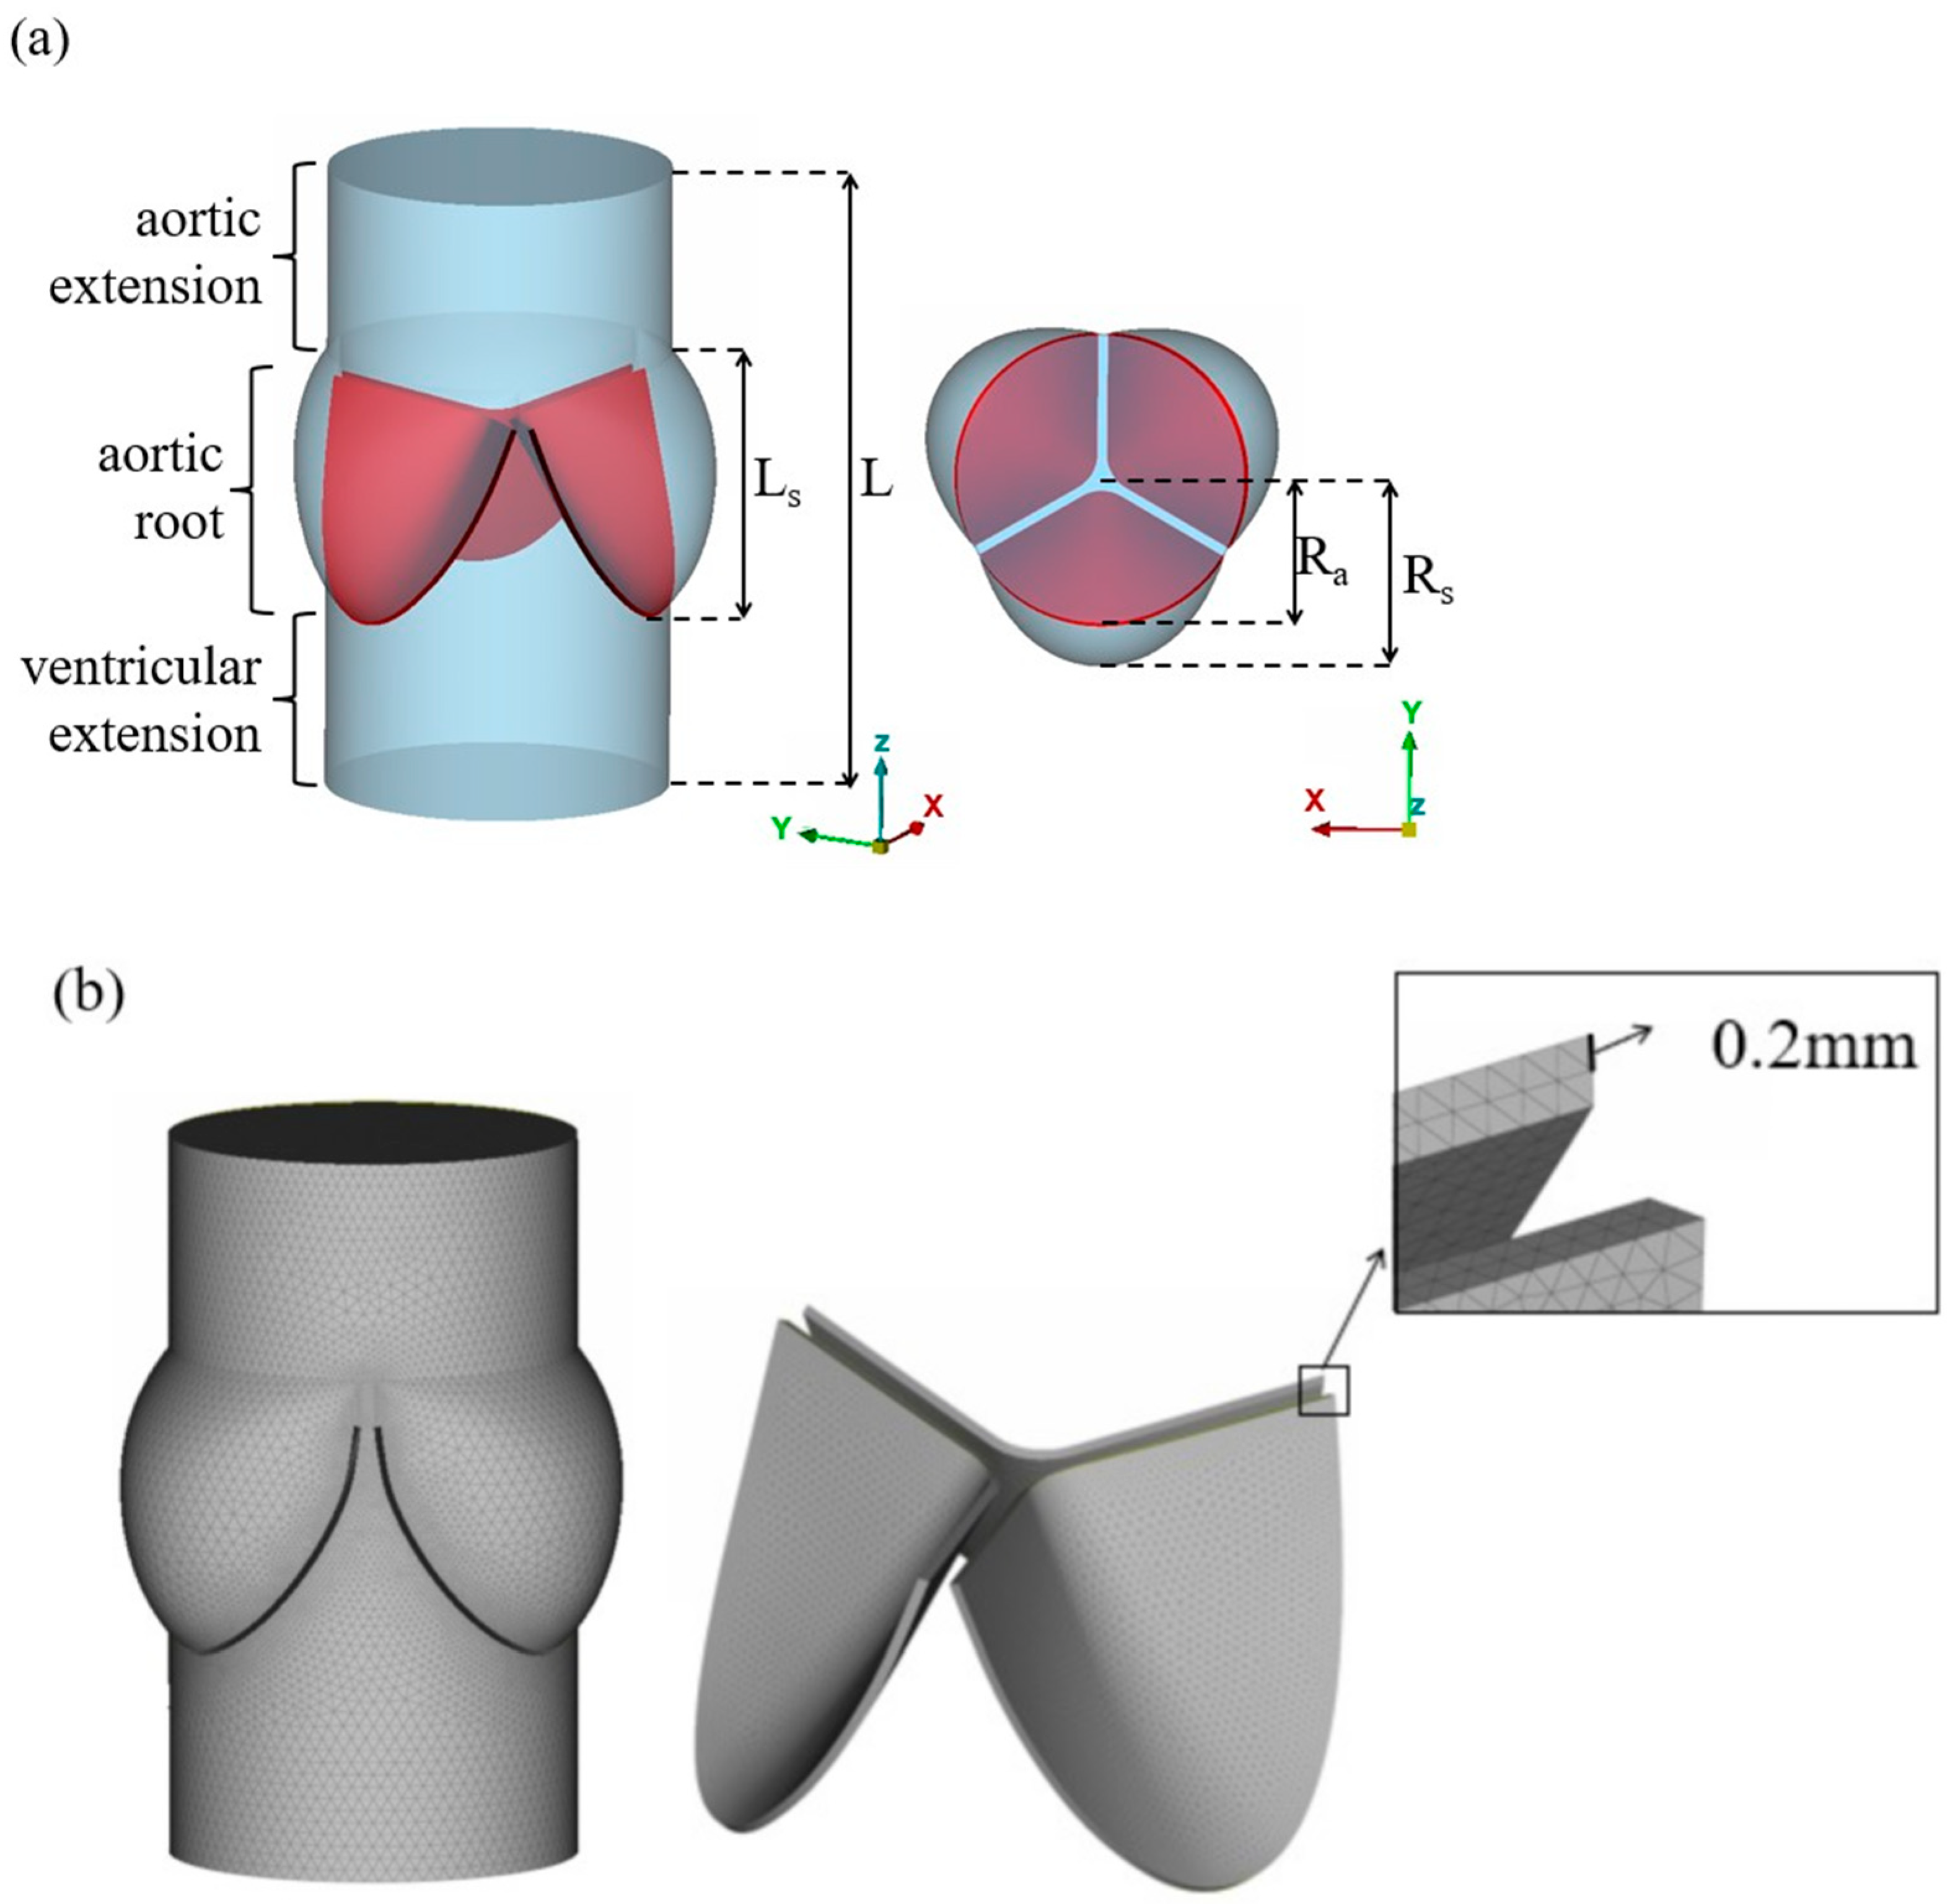

| Ra | Rs | Ls | L | |
|---|---|---|---|---|
| Dimension(mm) | 11.5 | 15.0 | 17.0 | 42.0 |
| GOA (mm2) | CA (mm2) | |
|---|---|---|
| valve 1 | 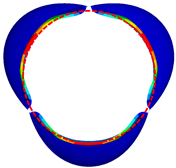 362.21 | 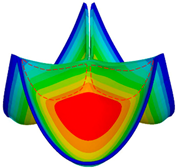 222.16 |
| valve 2 | 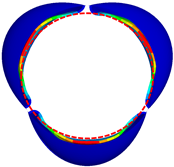 361.62 | 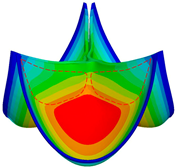 246.97 |
| valve 3 |  361.51 | 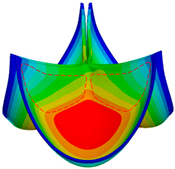 265.91 |
| valve 4 | 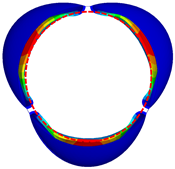 350.52 | 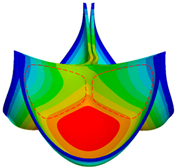 365.73 |
| valve 5 |  349.52 |  299.58 |
Disclaimer/Publisher’s Note: The statements, opinions and data contained in all publications are solely those of the individual author(s) and contributor(s) and not of MDPI and/or the editor(s). MDPI and/or the editor(s) disclaim responsibility for any injury to people or property resulting from any ideas, methods, instructions or products referred to in the content. |
© 2024 by the authors. Licensee MDPI, Basel, Switzerland. This article is an open access article distributed under the terms and conditions of the Creative Commons Attribution (CC BY) license (https://creativecommons.org/licenses/by/4.0/).
Share and Cite
Zhou, J.; Wu, Y.; Chen, L.; Li, T.; Xiong, Y.; Chen, Y. Numerical Simulation Studies on the Design of the Prosthetic Heart Valves Belly Curves. Fluids 2024, 9, 209. https://doi.org/10.3390/fluids9090209
Zhou J, Wu Y, Chen L, Li T, Xiong Y, Chen Y. Numerical Simulation Studies on the Design of the Prosthetic Heart Valves Belly Curves. Fluids. 2024; 9(9):209. https://doi.org/10.3390/fluids9090209
Chicago/Turabian StyleZhou, Jingyuan, Yinkui Wu, Lu Chen, Tao Li, Yan Xiong, and Yu Chen. 2024. "Numerical Simulation Studies on the Design of the Prosthetic Heart Valves Belly Curves" Fluids 9, no. 9: 209. https://doi.org/10.3390/fluids9090209
APA StyleZhou, J., Wu, Y., Chen, L., Li, T., Xiong, Y., & Chen, Y. (2024). Numerical Simulation Studies on the Design of the Prosthetic Heart Valves Belly Curves. Fluids, 9(9), 209. https://doi.org/10.3390/fluids9090209