Article

Adjoint Solver-Based Analysis of Mouth–Tongue Morphologies on Vapor Deposition in the Upper Airway

1
Department of Biomedical Engineering, University of Massachusetts, Lowell, MA 01854, USA
2
Department of Aerospace, Industrial, and Mechanical Engineering, California Baptist University, Riverside, CA 92504, USA
*
Author to whom correspondence should be addressed.
Fluids 2024, 9(5), 104; https://doi.org/10.3390/fluids9050104
Submission received: 28 March 2024 / Revised: 20 April 2024 / Accepted: 26 April 2024 / Published: 27 April 2024
(This article belongs to the Special Issue Advances in Hemodynamics and Related Biological Flows)

Abstract

:
Even though inhalation dosimetry is determined by three factors (i.e., breathing, aerosols, and the respiratory tract), the first two categories have been more widely studied than the last. Both breathing and aerosols are quantitative variables that can be easily changed, while respiratory airway morphologies are difficult to reconstruct, modify, and quantify. Although several methods are available for model reconstruction and modification, developing an anatomically accurate airway model and morphing it to various physiological conditions remains labor-intensive and technically challenging. The objective of this study is to explore the feasibility of using an adjoint–CFD model to understand airway shape effects on vapor deposition and control vapor flux into the lung. A mouth–throat model was used, with the shape of the mouth and tongue being automatically varied via adjoint morphing and the vapor transport being simulated using ANSYS Fluent coupled with a wall absorption model. Two chemicals with varying adsorption rates, Acetaldehyde and Benzene, were considered, which exhibited large differences in dosimetry sensitivity to airway shapes. For both chemicals, the maximal possible morphing was first identified and then morphology parametric studies were conducted. Results show that changing the mouth–tongue shape can alter the oral filtration by 3.2% for Acetaldehyde and 0.27% for Benzene under a given inhalation condition. The front tongue exerts a significant impact on all cases considered, while the impact of other regions varies among cases. This study demonstrates that the hybrid adjoint–CFD approach can be a practical and efficient method to investigate morphology-associated variability in the dosimetry of vapors and nanomedicines under steady inhalation.

1. Introduction

Respiratory diseases, both chronic and acute, are among the leading causes of mortality and morbidity globally [1,2]. In 2019, chronic respiratory diseases (CRDs) ranked as the third leading cause of death, accounting for 4.0 million fatalities and affecting 454.6 million people worldwide [3]. Respiratory morphology is a key component in predicting pulmonary drug delivery [4]. In contrast to extensive studies on aerosol properties (devices and formulations) and breathing conditions (patients and delivery methods), studies on the effects of the respiratory tract and variability are scarce. Generating anatomically accurate airway models is still challenging and time-consuming. It is even more challenging to generate representative airway models specific to different ages, genders, races, and diseases [5]. Furthermore, the respiratory tract is multiscale, from the nose–mouth–throat, tracheobronchial area, and central airway, down to submicron alveoli [6]. The smaller the airway, the more difficult it is to reconstruct from images. The respiratory tract is compliant and can be dynamic during drug delivery. Drug aerosol transport and deposition involve multiple physics, including inertial impaction, diffusion, and sedimentation. Particle transport and deposition are highly sensitive to anatomical details, such as airway curvature, as is disease-induced airway remodeling. Interactions between airway morphology and other factors (aerosols, breathing, etc.) can also be important [7].
Current methods to generate respiratory airway models include computer-aided design (CAD), the segmentation of medical images, and algorithm-based morphing [8]. CAD-based approaches have historically included Gambit and SolidWorks to generate new geometries, and HyperMorph, MAYA, and/or Blender to modify existing geometries [9]. Zhao et al. [10] and Talaat et al. [11] used user-defined functions (UDFs) to control the opening/closing of the glottis and the expansion–contraction of the alveoli following tidal breathing waveforms. Wang et al. [12] used a multi-point approach in MAYA to control boundary motions such as uvula flapping. Similar methods have also been applied in the hydrodynamics of fish fins and the aerodynamics of insect wings [13,14]. The segmentation method used computed tomography (CT) scans and magnetic resonance imaging (MRI) scans to reconstruct anatomically accurate, patient-specific airway models [15]. With rapid advances in both imaging and segmentation techniques, this approach has become mainstream in airway model development in recent years, starting from relatively simple geometries such as the trachea to increasingly more sophisticated structures such as the nose and deep lungs [16,17,18,19,20]. Image segmentation has also been used to develop respiratory airway models in other species, with an emphasis on lab animals like mice, rats, rabbits, dogs, and monkeys to decrease animal usage [21,22,23,24,25,26,27]. However, this approach has been limited by ethical issues, low image resolutions, and data availability to meaningfully study the shape variation effects [28,29].
High variability in the tongue position exists among subjects during inhalation drug delivery. The tongue position can significantly affect the upper airway geometry and airflow dynamics during inhalation, which are crucial for effective drug delivery to the lungs [30]. The variability in tongue position among subjects during inhalation drug delivery can be attributed to several factors. First, the size, shape, and position of the tongue, as well as the dimensions of the oral cavity, vary considerably among individuals. These anatomical differences can lead to differences in tongue positioning during inhalation. Second, breathing patterns, such as nasal vs. oronasal or shallow vs. deep breathing, can influence the tongue position. The coordination of the muscles involved in breathing maneuvers, including the genioglossus, hyoglossus, and styloglossus muscles, can vary among individuals and activities. Third, the posture and head position during drug delivery can also affect the positioning of the tongue and the pharyngeal morphology [31]. Other factors contributing to tongue position variability include age, health (e.g., obesity), medical condition (e.g., obstructive sleep apnea), medication use (e.g., sedatives or muscle relaxants), and inhalation devices (DPI, MDI, and nebulizers) [32,33,34]. The variability in tongue position can impact the airflow patterns, particle deposition, and overall effectiveness of inhaled drug delivery [35]. Considering this variability is key to optimizing inhalation drug delivery techniques and devices to ensure consistent and efficient delivery to the targets within the respiratory tract.
The adjoint solver was proposed in the 1970s in the field of aerodynamics, particularly in the context of aircraft design optimization [36]. The adjoint method has the advantage of efficiently computing the system performance with respect to shape design variables. Its earliest applications involved the design optimization of transonic airfoils and wings. By using the adjoint solver, researchers could efficiently compute the sensitivity of aerodynamic quantities (such as drag or lift) to changes in the shape of the airfoil or wing. This information was then used in optimization algorithms to iteratively modify the shape and improve the aerodynamic performance [37,38]. Since its inception, the adjoint solver has found applications in various other fields, including structural optimization, inverse design problems, shape optimization, and multiphase flows [39,40,41,42]. Note that the observables in the adjoint solver require field variables, such as velocity, pressure, and temperature, to compute the adjoint sensitivity, thus precluding its usage in simulations of inhalation drug delivery, where aerosols are often considered as the discrete phase [43]. One exception is when aerosols are treated as chemical species or a probability density; the concentration or probability are field variables, and thus can be used to construct design observables for adjoint sensitivity calculation and shape optimization.
The objective of this study was to evaluate the feasibility of using the adjoint solver to study the morphological effect of the mouth–tongue on the deposition of inhaled vapor or nanomedicine. It was hypothesized that new airway morphologies could be generated in a controlled manner using the adjoint solver. Two chemical species, Acetaldehyde and Benzene, were considered to assess the validity of the hypothesis, i.e., generating new mouth–tongue geometries for desired variations in vapor deposition. A CFD model with a PBPK (physiology-based pharmacokinetics) module was employed to simulate the vapor transport and wall absorption. Our specific aims included the following:
  • To develop an adjoint-based CFD-PBPK model for vapors and nanomedicines.
  • To evaluate the sensitivity of the filtration efficiency to the airway shape.
  • To optimize the airway shape for prescribed species-specific filtration efficiencies.

2. Methods

2.1. Study Design

The adjoint–CFD solver used in this study consists of three components: a flow solver, an adjoint solver, and morphing, which is followed by an optimization loop (Figure 1). The flow solver simulates the flow/vapor fields in the upper airway based on inputs and computes the objective function, or the observable (exiting vapor flux). The adjoint equations solve for shape sensitivity and modify the geometry according to a prescribed target for the observable. The updated observable is compared to the target, and the above process continues until the target is reached.
A mouth–tongue–throat model that was previously developed in [44] was used to evaluate the airway morphological impacts on inhalation dosimetry (Figure 2a,b). Specifically, the effects of the tongue shape and position on vapor filtration were investigated using the adjoint method. To study the vapor filtration at different tongue positions, the observable in the adjoint equation was defined as the surface integral of the vapor concentration at the tracheal outlet (i.e., the exiting mass flux). Adjoint outputs include shape sensitivity and normal displacement. Due to the large range of sensitivity variation, the shape sensitivity magnitude on the log10 scale was adopted to visualize the sensitivity on the surface.
Automatic airway remodeling was achieved by morphing the surface mesh according to the calculated adjoint sensitivity and targeted optimization. Controls included zone selection, objective, design constraints, region, smoothness, and number of optimizations. A polynomial interpolation method was used to generate the new shape of the mouth and tongue from existing surfaces. The optimization was carried out using a gradient-based optimizer. To evaluate the applicability of the adjoint solver, the airway geometry was modified until the resultant geometry became anatomically unrealistic or the computational mesh became unrepairable due to negative cells.
To study the effects of different chemicals, two vapors, Acetaldehyde and Benzene, were considered in this study for their similar diffusivities but different solubilities in liquids [45,46]. Both computational and analytical methods were used to study the transport and absorption of inhaled chemicals. To consider the differences between chemicals, an analytical wall boundary condition was developed at the air–mucus interface that included the solubilities and diffusivities in different media, as well as the thicknesses of the media.

2.2. Airflow and Vapor Transport

Airflows were assumed to be isothermal and incompressible. At the mouth inlet, the inhalation flow rate was 30 L/min, and the volume fraction was 0.05% for both chemicals, Acetaldehyde and Benzene. For the walls, the non-slip condition was specified for momentum and a user-defined function was developed for chemical species, as detailed in the following Section 2.3. At the tracheal outlet, no back flows were specified for momentum and chemical species. The Low-Reynolds-Number (LRN) k-ω model was used to simulate respiratory airflow and vapor transport in the airway [47,48]. The LRN k-ω model has also been well validated to capture turbulent and transitional flows characteristic of human respirations [49,50,51]. The governing equations are [48]
u ¯ i x i = 0 ; u ¯ i t + u ¯ j u ¯ i x j = 1 ρ p x i + x j ν + ν T u ¯ i x j + u ¯ j x i
Here, u ¯ i represents the airflow velocity components (i = 1, 2, and 3), ν is the viscosity, k is turbulent kinetic energy, and ω is the specific dissipation rate (ω).
k t + u ¯ j k x j = τ i j u ¯ i x j ε k + x j ν + 0.5 ν T k x j
ω t + u ¯ j ω x j = 13 25 ω k τ i j u ¯ i x j ε ω + x j ν + 0.5 ν T ω x j
Here, τ i j is the shear stress tensor [48]. The mass transport of the chemical concentration (c) in the airflow and liquid is governed by diffusion and/or convection, which are expressed below.
c t + u j c x j = x j D ˜ + ν T S c T c x j
Here, D ˜ is the chemical diffusivity in the medium and ScT is the Schmidt number (0.9).

2.3. Boundary Condition at the Air–Mucus Interface

Unlike particles that readily deposit on sticky airway walls upon contact, vapors do not deposit completely due to their finite solubility. The absorption of vapors from the air into another medium is governed by various factors, including solubility, diffusivity, and reactivity in both phases. These parameters are specific to the materials involved and must be determined through experimental investigations [52]. This study does not account for any chemical reactions. In steady-flow conditions, the rate of mass transfer per unit area (mass flux, m ˙ ) occurring at the air–liquid interface can be expressed as follows [53]:
m ˙ a = D a C a s = D a C a , d s C a , m d s ; m ˙ m = D m λ m m a C a , m C m , t t h m ; m ˙ t = D t λ t m C m , t 0 t h t
Here, Da, Dm, and Dt are vapor diffusivities in the air, mucus, and tissue, respectively; ds represents the distance between the near-wall cell center and the interface, while th denotes the thickness of the liquid layer, as illustrated in Figure 2c. Due to the differences in chemical solubilities in air and liquid, there exists a discontinuity in the vapor concentration across the interface. This can be expressed as Cm,a = λmaCa,m, where λma is the air–mucus partition factor for the chemical. Based on the above equations, the chemical concentration at the interface in the air phase can be calculated as
C a , m = C a , d s 1 1 + K d s ; K = D l D a λ m a λ t m D m D t D m t h t + λ t m D t t h m
The above equation was derived by assuming m ˙ a = m ˙ m = m ˙ t , with no reaction. The transport properties of Acetaldehyde and Benzene are listed in Table 1 [53]. For a given medium, their diffusivities do not differ much. However, their partition factors are significantly different, with Acetaldehyde being two orders of magnitude higher than Benzene at the air–mucus interface, while being one order of magnitude lower than Benzene at the mucus–tissue interface (Table 1). Inserting all transport parameters into Equation (6)., the kappa (K) was 117.73 for Acetaldehyde and 9.42 for Benzene. A user-defined function (UDF) was developed to account for the airway wall vapor concentration for different chemicals [53].

2.4. Adjoint State Equation

The adjoint equations for fluid flows are derived from introducing adjoint variables into the Navier–Stokes equations [54,55,56,57]. These adjoint variables represent the sensitivity of a specific objective function, or observable, to changes in the design variables, such as shape or material properties. Note that the boundaries, Ω, determine the shape. The flow solution of field variables q _ with inputs c _ can be expressed as zero residuals of the Navier–Stokes equations, i.e., R i q _ c _ ; c _ = 0 . For an observable J q _ c _ ; c _ , which is a function of both the inputs and flow solution, the adjoint sensitivities can be expressed as
d J d c _ = d q d c _ J q _ + q ˜ _ T R q _ + J c _ + q ˜ _ T R c _
Here, q ˜ _ T represents the adjoint solution variables, such that
J q _ + q ˜ _ T R q _ = 0 R q _ T q ˜ _ = J q _ T
Thus, the adjoint sensitivity Equation (7) is reduced to a linear problem.
d J d c _ = J c _ + q ˜ _ T R c _
The above equation is assessed at every mesh point within the computational model. When considering shape sensitivity, the computational mesh (x, y, z) serves as the input vector. The term on the left-hand side represents the overall sensitivity of J. The initial term on the right-hand side is the variation in J with respect to x, y, z at a given mesh node, while the second term is the change in J due to the flow solution. Note that J / c _ and R / c _ are computed using expressions derived from the definitions of the observables and the CFD discretized equations, respectively. The adjoint method makes it practical to compute the shape derivative in large-scale optimization. The algebraic multigrid (AMG) iterative approach is used to compute an approximate solution to the above equation [58].

2.5. Numerical Methods

ANYSYS Fluent (Canonsburg, PA, USA) was implemented to simulate steady airflows within the upper airway at 30 L/min. The transport and absorption of inhaled chemical vapors were simulated by means of user defined scalers (UDSs). The vapor concentration on the airway walls was considered using a user-defined function. Zero vapor mass flux was specified at the tracheal outlet. Spatial discretization of second-order accuracy was implemented for all transport equations. ANSYS ICEM CFD (Canonsburg, PA) was utilized to generate computational mesh (Figure 2b). A grid-independent study was performed following Xi et al. [59], as shown in Figure 2b. Five mesh densities (0.6–2.6 million cells) were tested and the grid-independent results were established at 1.8 million cells, which was used for vapor transport/absorption in this study (Figure 2b). A normalized residual of 1 × 10⁻⁶ was used as the convergence criterion for flow continuity and 1 × 10⁻¹⁸ for UDS.
Discrete adjoint equations were used in this study, which discretized the flow solver first and then discretized the adjoint equation on the same mesh. In this manner, better accuracy of CFD solutions can be obtained, especially for the turbulence problem [60]. Similar to the flow solver, the least squares cell-based approach was selected for the gradient, a standard approach was selected for the pressure, and second-order upwind differencing was selected for the momentum. The dissipation suppression scheme was used for stabilization.
Airway remodeling was realized by morphing the mesh according to the calculated design change. Polynomial interpolation methods were used to define new surface shapes. Before mesh morphing, the recommended modified geometry was previewed relative to the original mesh to ensure its physical reasonability. The design space (i.e., region) enclosed the oral cavity (mouth and tongue). Mobile motion and a symmetric plane were enabled for the x, y, z directions to allow for deformation in all directions. A residual of × 10−6 was used for adjoint continuity and 1 × 10⁻¹⁸ for adjoint UDS.

3. Results

3.1. Control Cases

Figure 3 shows the vapor concentration fields within the airway, as well as the vapor concentration on the airway surface. Both chemicals show a decrease in concentration along the airway, exhibited by the tapering red zone in the mid-sagittal planes. However, Acetaldehyde decreases at a higher rate and thus has a higher absorption rate than Benzene. This is consistent with the higher solubility of Acetaldehyde in mucus (Table 1). Due to the higher wall absorption rate and quicker depletion, the concentration of Acetaldehyde on the wall is much lower than that of Benzene. It is also clear that the gradient for Acetaldehyde is larger. In addition, the Acetaldehyde concentration field appears more heterogeneous, indicating a higher sensitivity to local flows and anatomical details.
Figure 4 shows the shape sensitivity magnitude (SSM) relative to the mouth–tongue morphology on the log10 scale. Overall, larger shape sensitivity magnitudes are observed for Acetaldehyde than Benzene (Figure 4a vs. Figure 4b). The sensitivity distributions are highly heterogeneous. Locally, higher sensitivities are observed at the mouth inlet, tongue (bottom view), and throat, while low sensitivities are observed in the lateral oral cavity and at the mouth roof (top view). The statistics of the shape sensitivities over the entire airway are shown as histograms in the right panels of Figure 4a,b for Acetaldehyde and Benzene, respectively, both of which exhibit an approximate normal distribution.

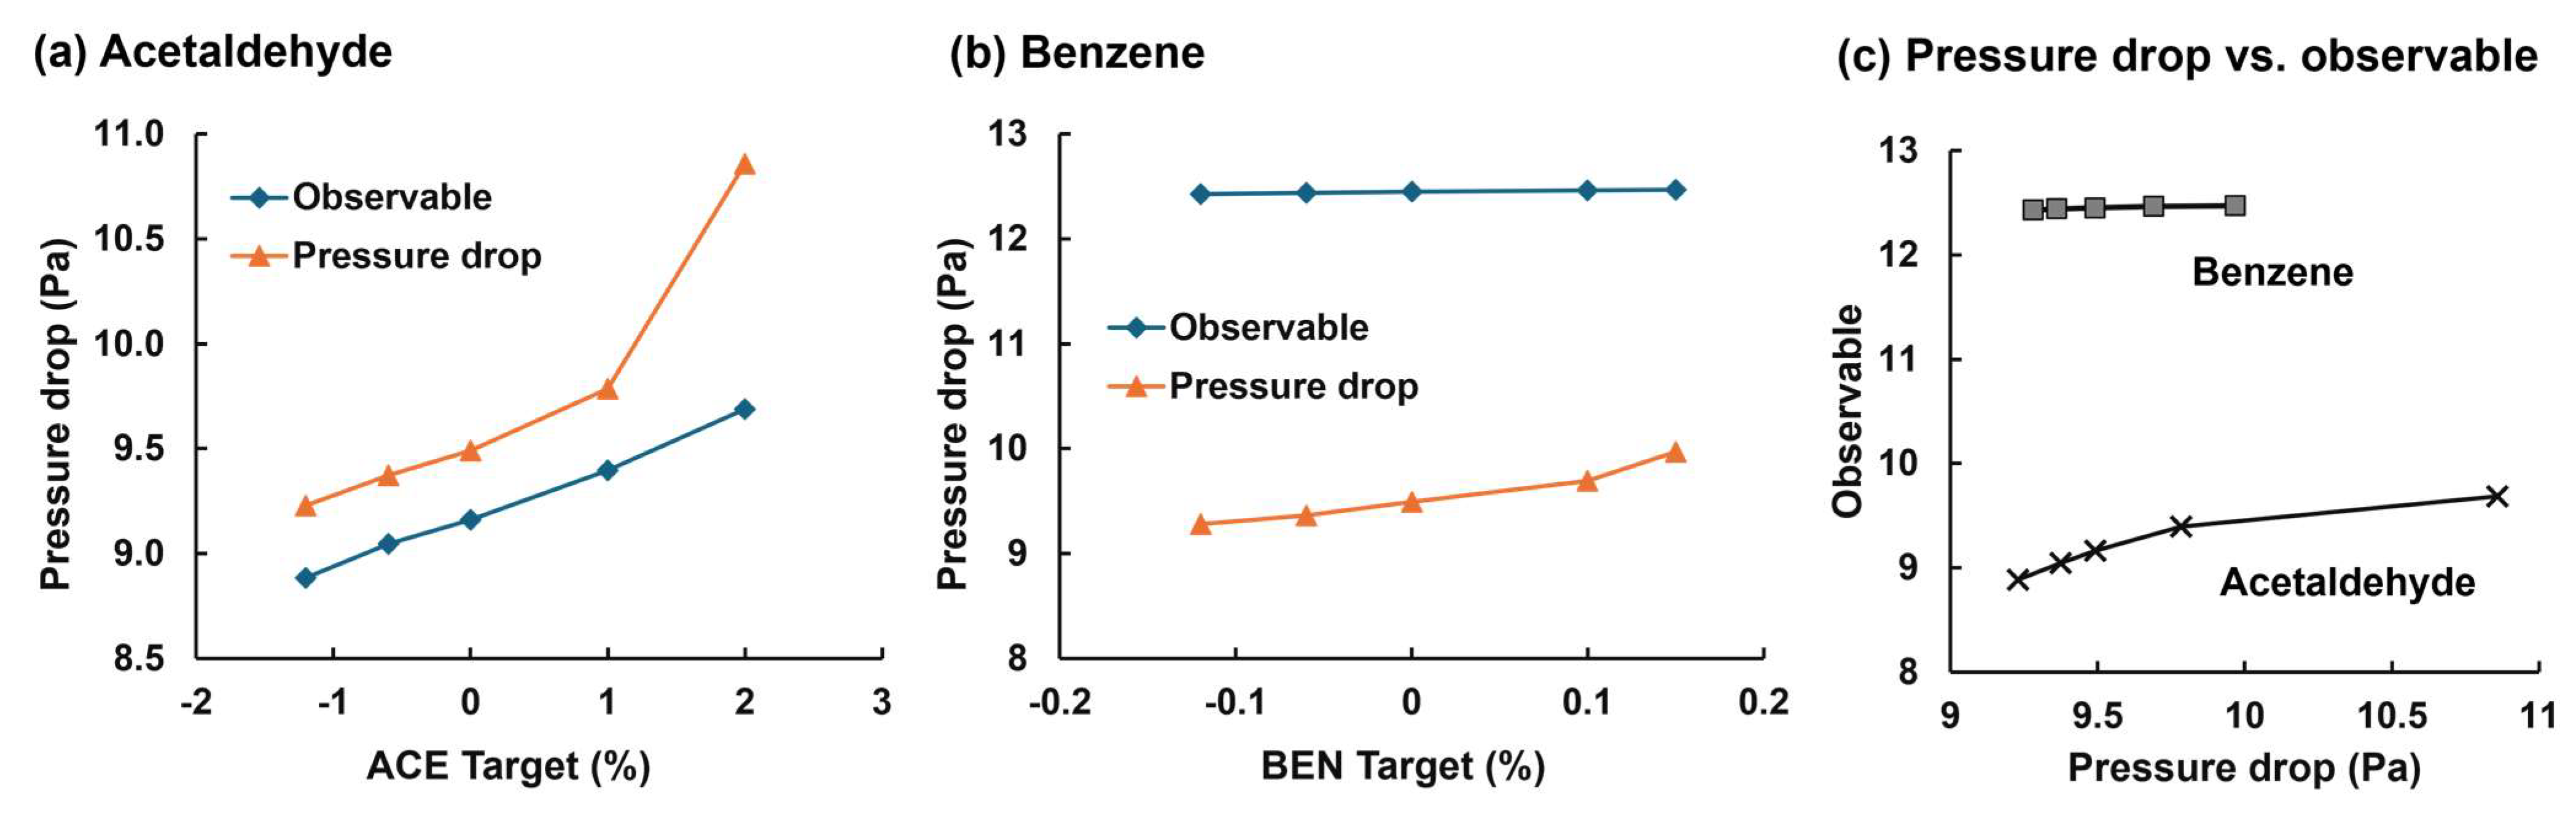
3.2. Adjoint-Modified Airway Models with Varying Observable Targets

Figure 5 shows the modified mouth–tongue morphologies (red) specific to a target variation in the observable in comparison to the control (green). The first row shows the mouth roof (top view), the second row shows the tongue (bottom view), and the third row shows the lateral view of the oral cavity. Recall that the observable, which must be a field variable, is defined as the surface integral of the vapor concentration at the tracheal outlet, equivalent to the mass flux escaping the filtration by the upper airway and entering the lung. The cases of decreasing the exiting mass flux by 1.2% (i.e., −1.2%) or increasing by 2% (i.e., +2%) are those with successful geometry/mesh modifications. Targets beyond this range for Acetaldehyde’s exit mass flux (i.e., −1.2~+2%) have led to failed meshes with negative cell volumes. Likewise, the adjoint solutions for Benzene with exiting mass flux are limited to −0.12% to +0.15%, indicating a small design space to control Benzene uptake, as well as a smaller dosimetry variability for Benzene than Acetaldehyde. The observation that similar magnitudes of morphological changes occurred in cases of −1.2% variation for Acetaldehyde and −0.12% variation for Benzene indicates a much higher sensitivity of Acetaldehyde deposition to airway geometries. It was also observed that the front tongue exerted a significant impact on vapor dosimetry in all cases considered (see yellow arrow in Figure 5a).
The lower panels of Figure 5 compare the variation in morphological dimensions (area and volume) among the four models with different observable targets. Increasing the oral cavity volume/surface area decreases the exiting mass flux for both chemicals. This decrease may result from a longer residence time to interact with the wall or a larger surface area for absorption. Moreover, the volume varies at a much higher ratio than the surface area (lower panels, Figure 5).
The four shape variants for Acetaldehyde and Benzene are further shown in Figure 6 in 2D plots with the mid-sagittal plane and two coronal slides. The filled gray represents the control case, while the red line represents the adjoint-morphed geometry. Two observations are notable. First, Slice 1 experienced limited morphing for all cases considered, while Slice 2 underwent drastic changes, particularly with the target of increasing mass flux exiting the upper airway. In particular, the case that increased the exiting concentration of Acetaldehyde by 2% (+2% for short) resulted in severe constriction in the back oral cavity (right panel, Figure 6a). This geometry was deformed to a level that was likely beyond physiological feasibility. Second, the geometrical variation patterns appear similar between Acetaldehyde and Benzene for any of the first three columns (i.e., Acetaldehyde: −1.2% vs. Benzene: −0.12%, Figure 6). Considering that the geometry modification is determined by adjoint sensitivity and target observables, this similarity indicates the overall similarity in adjoint-determined-shape normal sensitivity between Acetaldehyde and Benzene, in addition to the local discrepancies as shown in Figure 5.

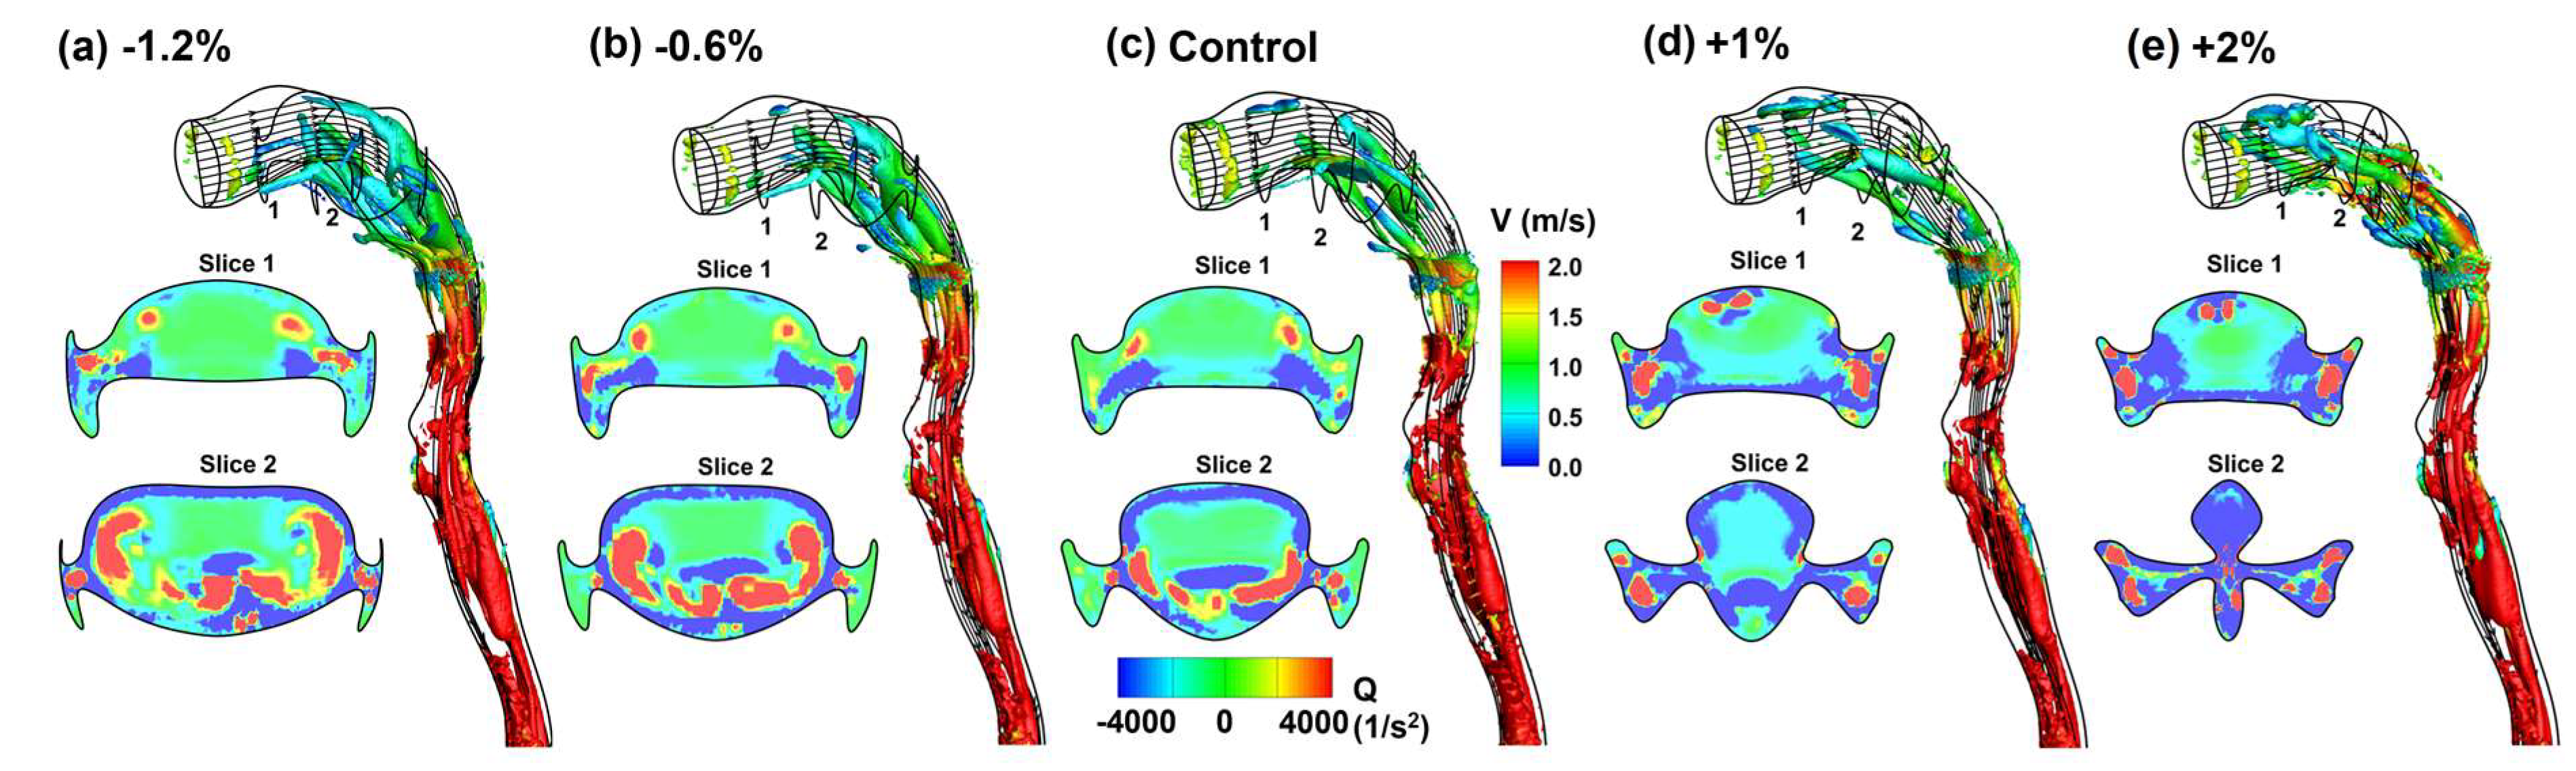
3.3. Flow Fields in Adjoint-Modified Airway Models

The velocity fields in the adjoint-morphed oral airways from the Acetaldehyde control case are shown in Figure 7. Different color codes are used for the coronal and sagittal planes, reflective of their large differences in velocity ranges. Because the sagittal plane cuts through the main flow, while the coronal slices cut through the transverse secondary flows, the velocity range is 0–3 m/s for the sagittal plane and 0–1 m/s for the two coronal slices.
Clear differences exist among the five models in both the mid-sagittal plane and the two coronal slices. From Figure 7a–e, the exit mass flux of Acetaldehyde progressively increases. The oral cavity becomes increasingly constricted at the back, accelerating airflow in the oropharyngeal region (blue arrow). At the same time, the core flow intensity constantly increases because of a gradual airway constriction, as indicated by the red-colored zone in Slice 2. The flow dynamics in the modified geometries with Benzene are similar and are thus not presented.
Figure 8 shows the vortex structures in terms of the Q-criterion within the airway, as well as two coronal slices. Note that the 3D iso-surfaces of the Q-criterion are colored by velocity, while the cross-sectional contour in the two coronal slices is colored by the Q-criterion per se in the range from −4000 to 4000. In the most constricted case (i.e., +2%), the vortices are significantly intensified in the oropharyngeal region compared to the other three due to the high flow speed. Comparing the Q-contour in the coronal slices, vorticity pairs are noted in the two larger oral cavities (i.e., −1.2% and −0.6% in Figure 8a,b), particularly in Slice 2. These vortices may increase the residence time of the vapor, increasing its chance of being absorbed by the mucus.

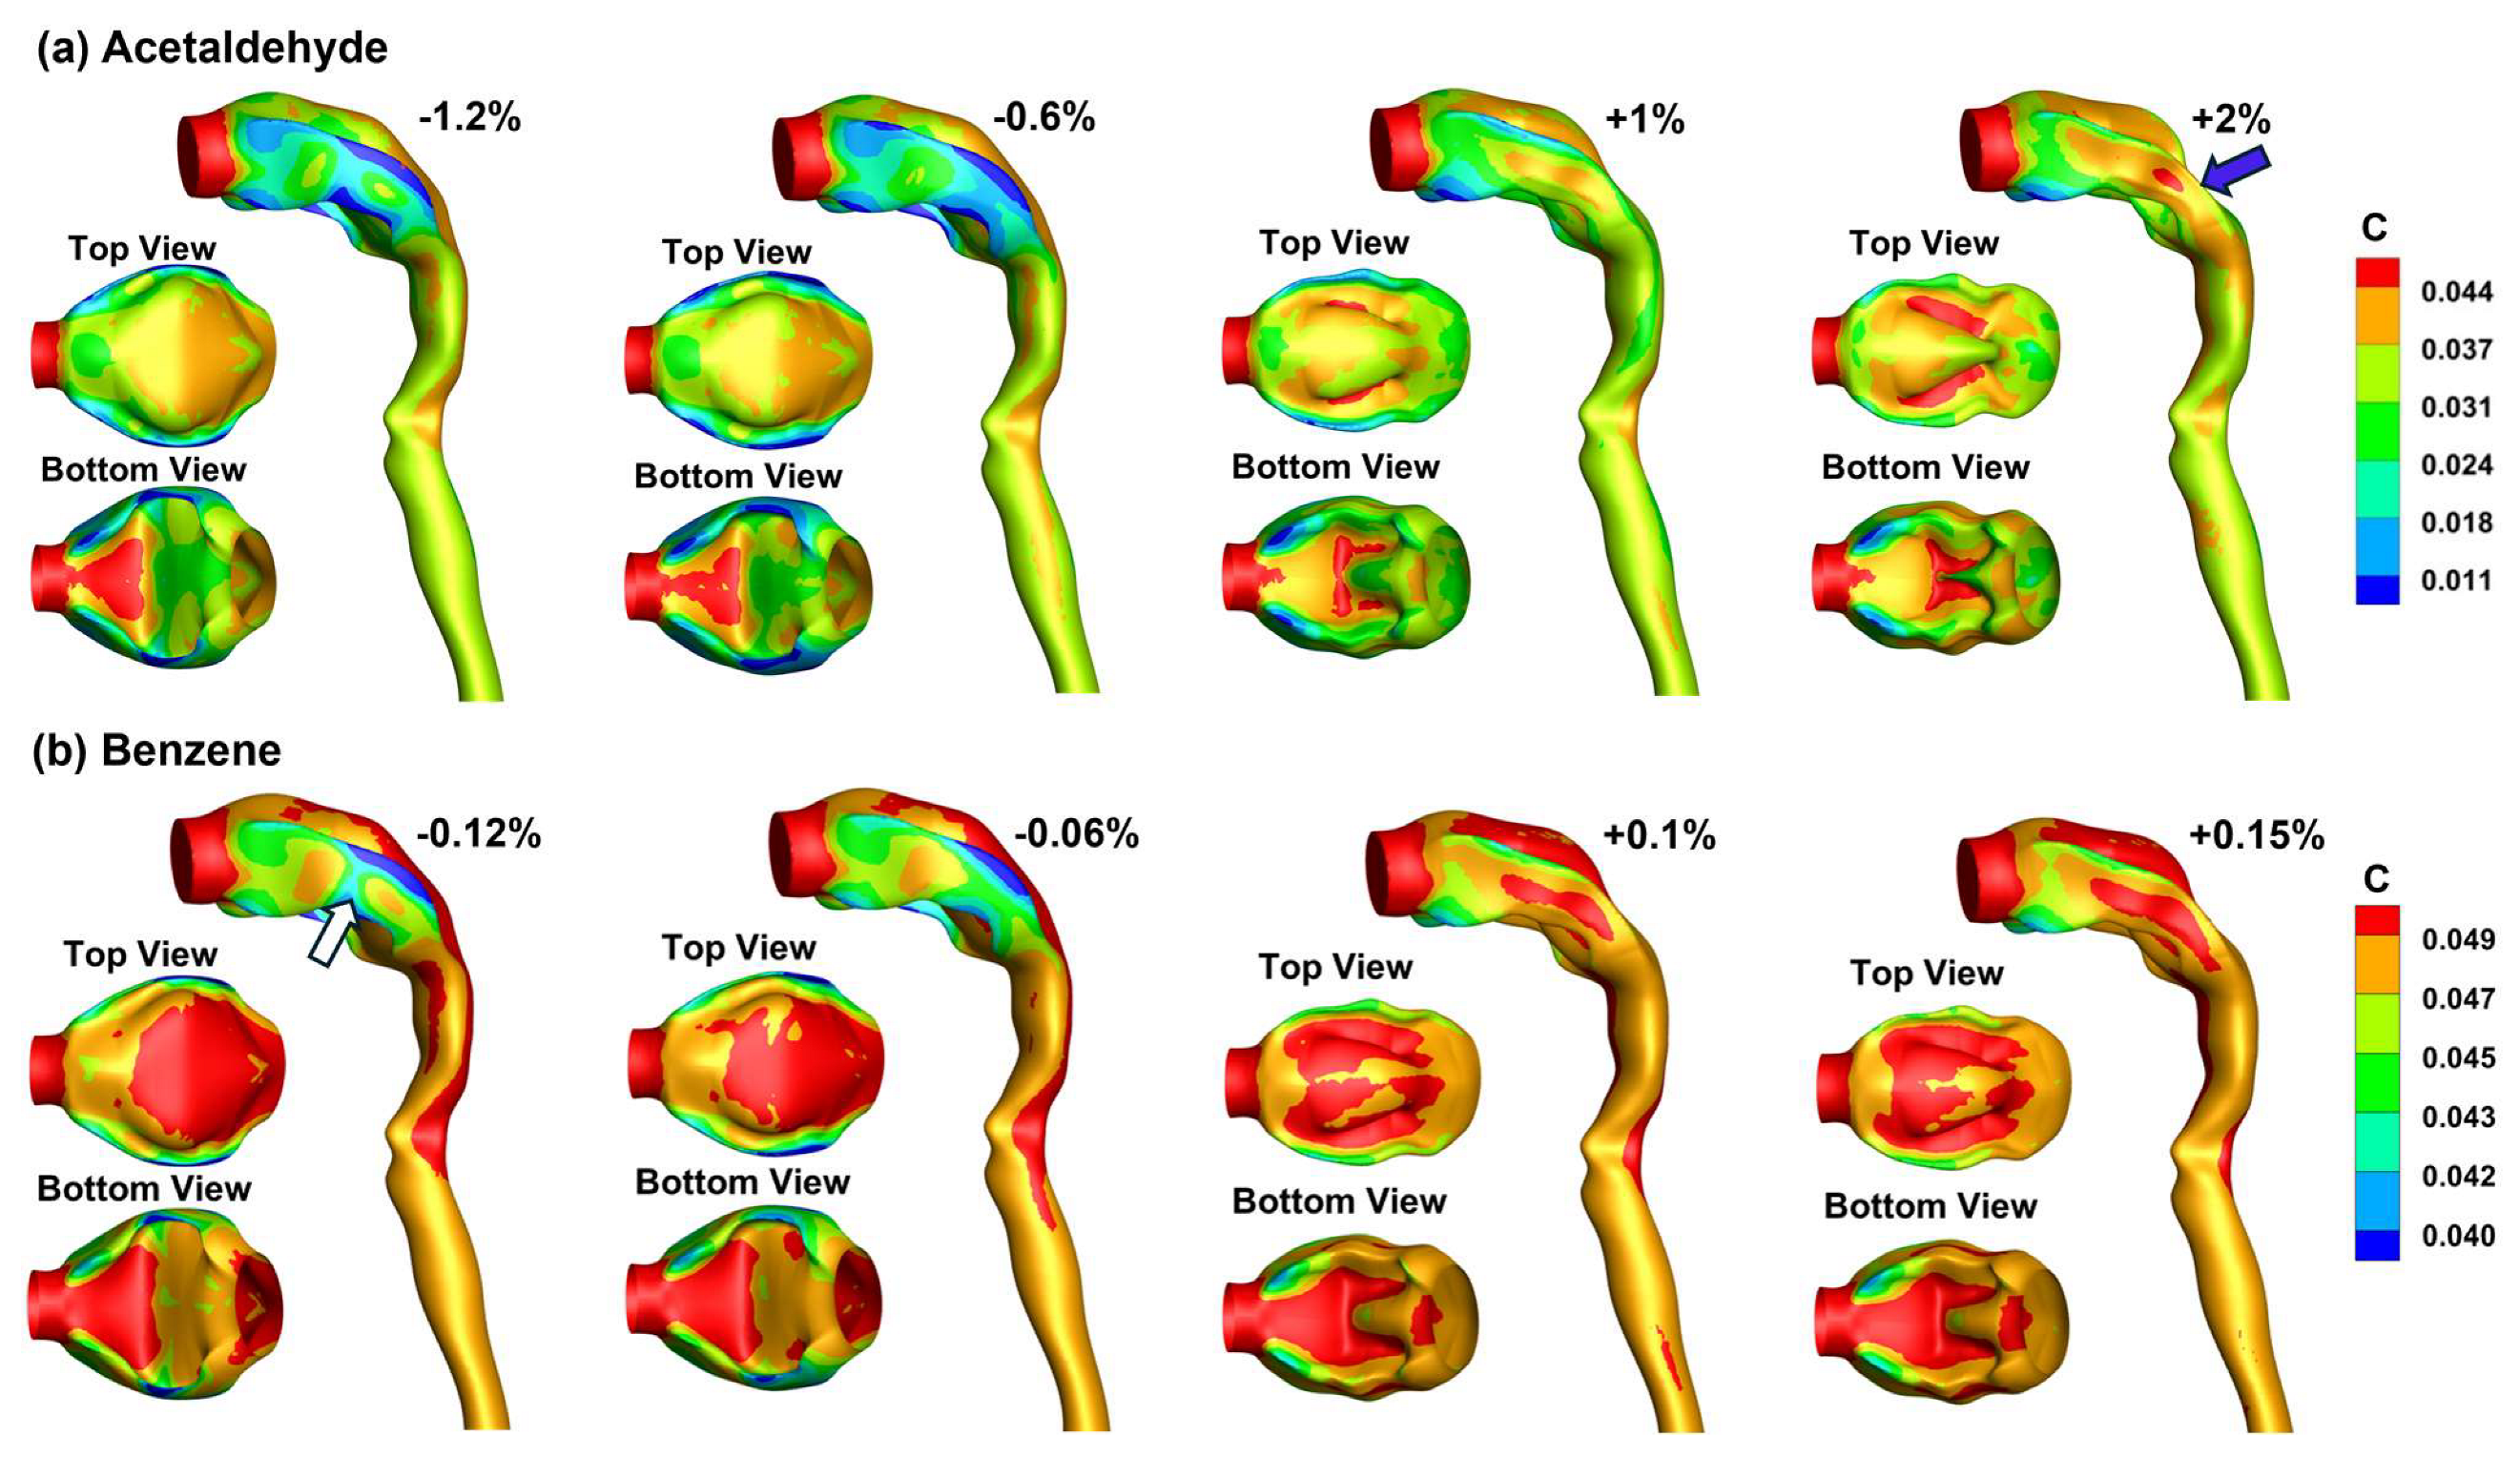
3.4. Vapor Transport and Wall Concentration in Adjoint-Modified Airway Models

The vapor transport in the modified oral airways is shown in Figure 9 in four models, whose exit mass flux increases from the left (i.e., −1.2%) to the right (+2%). Considering Acetaldehyde in Figure 9a, a high concentration of Acetaldehyde enters the mouth and tapers off due to diffusion, advection, and wall absorption. Dispersions are apparent in the oral cavity, which is featured by an abrupt expansion after the mouth opening. The secondary flows divert the Acetaldehyde vapor laterally toward the cheeks, further diluting the vapor concentration. However, the adjoint-morphed geometries from the left to the right successfully delayed the tapering process and prolonged the penetration depth of the vapor.
Considering Benzene (Figure 9b), very different patterns and magnitudes from those of Acetaldehyde are observed in both the mid-sagittal plane and two coronal slices. Note that the color code is 0.0470–0.0495 for Benzene, which is much higher than that of Acetaldehyde, 0.040–0.045 (Figure 9b vs. Figure 9a). When comparing the vapor pattern from left to right, the modified geometries progressively increase the vapor penetration depth. However, due to its relatively low absorption rate, the vapor concentration is consistently higher than that in Figure 9a. The gradient of Benzene concentration is lower, as indicated by the continuous, similar colors in the near-wall region, in contrast to the drastic color transition from red to blue for Acetaldehyde (Figure 9a).
Vapor concentrations on the airway wall are shown in Figure 10 in four modified airway geometries with increasing exit mass fluxes. Again, the oral cavity becomes narrower and more constricted in the models from the left to the right. Simultaneously, the shape of the mouth roof and tongue evolve, appearing to be more irregular from the case of “−1.2%” to “+2%”. The vapor concentration on the lateral oral cavity (blue arrow, Figure 10a) is apparently higher in the “+2%” case than in the cases of “−1.2%” and “−0.6%”, which constitutes a lower concentration gradient and thus a lower absorption rate (Figure 10a). Considering the top view (mouth roof), the wall concentration on the back mouth increases, thus reducing the vapor concentration gradient and slowing vapor absorption. Similarly, the high-concentration zone on the tongue (bottom view) shifts from the front to the back, slowing the absorption-induced vapor depletion.
Large differences exist in the wall vapor concentration between Benzene and Acetaldehyde, as evidenced by the overall red color in Figure 10b vs. the greenish yellow in Figure 10a. The color code in Figure 10b ranges from 0.040 to 0.049, which is significantly higher than that of 0.011–0.044 in Figure 10a, especially for the lower end. Comparing the four cases in Figure 10b reveals that modifying the oral cavity with a similar magnitude to that in Figure 9a generates a much smaller change in the wall vapor concentration, limiting the potential to effectively reduce vapor absorption. For Benzene (Figure 10b), the region with the greatest vapor concentration change is the lateral oral cavity or the lumen between the teeth and cheek (white arrow).
Figure 11 examines the correlation between the flow resistance and the observable in adjoint-modified airway models with different target observables. Again, Acetaldehyde shows a higher sensitivity to pressure drop than Benzene (Figure 11a vs. Figure 11b), consistent with the observations in Figure 9 and Figure 10. Also, the potential for vapor uptake control through varying flow resistance is much smaller for Benzene than for Acetaldehyde (Figure 11c).

4. Discussion

In this study, we explored the adjoint–CFD approach in studying the effects of mouth–tongue shape on the dosimetry of orally inhaled vapors. A practical method to study the influences of morphological variations on aerosol transport and deposition can open a new door to understanding drug bioavailability and bioequivalence among different subjects and between health and disease [61,62,63,64]. Despite large intersubject and intrasubject variability in respiratory anatomy, their effects on inhalation dosimetry have been historically less studied than other parameters, such as the flow rate and particle size. This has been attributed to challenges in varying the airway morphology while still keeping it physiologically realistic and representative. The results of this study demonstrate that the adjoint solver can provide a practical approach to examining the impacts of morphological factors. The adjoint sensitivity identified the most important factors affecting vapor dosimetry, allowing an exploration of mouth–tongue shape variations to minimize or maximize the vapor uptake in the upper airway (Figure 9, Figure 10 and Figure 11). Instead of remodeling the airway geometry and solving the problem multiple times, the adjoint solver computes the observable gradient with respect to mesh points (shape sensitivity) by solving an additional set of equations (adjoint equations) only once. The structural modification can be a consequence of node displacements in a specific domain for a prescribed observable target, as shown in Figure 4, Figure 5 and Figure 6. This makes the adjoint solver particularly powerful for inhalation dosimetry predictions, where the airway variability is tremendous, significantly reducing the computational cost compared to sensitivity analysis with individually modified airway models. Furthermore, detailed mechanisms for transport and deposition can also be explored after shape morphing by examining the shape variations and subsequent variations in flow/vapor dynamics (Figure 7, Figure 8 and Figure 9). The CFD–adjoint method used in this study is particularly well suited for patient-specific treatment planning. With an airway model that accurately represents the patient, the CFD–adjoint model can recommend the optimal oral cavity morphology for achieving a specific delivery target.
Due to the automatic morphing capacity, this approach can be more user-friendly than other morphing methods based on CAD, image segmentation, mathematical algorithms (e.g., statistical shape modeling), or manual remodeling (e.g., Hypermesh, MAYA, Blender) [65]. Note that the statistical shape modeling approach needs a training database of airway shape models, which are difficult to obtain per se, let alone consistent shapes with desired variability. HyperMorph modifies a shape by enclosing the region using a lattice and moving individual lattice points [66]. Even though it provides controlled shape remodeling, HyperMorph is labor-intensive and can generate unrealistic or unintended shapes due to the spline function [67]. By comparison, the adjoint solver does not need a training dataset and is automatic and controllable. It is also noted that the adjoint solver is optimization-orientated with a final output of static, optimized shapes; it is not suitable for dynamic shape variations as seen in fluid–structure interactions [68,69,70].
This study can be further improved by enhancing several simplifications, such as steady flow, oral airway only, rigid wall, and single observable. Also, no measurements of upper airway deposition for Acetaldehyde or Benzene were found in the literature to validate the results hereof. The inhalation dosimetry of chemical vapors and nanomedicines is sensitive to breathing maneuvers and can vary in different regions of the respiratory tract. An airway model extending beyond the oral airway can provide more realistic predictions of the pulmonary dosimetry of orally inhaled aerosols. Including more bifurcations of the lung can even provide local or regional dosimetry in the lungs per se, providing granular information on bioavailability. Formulating and solving adjoint equations can be mathematically complex, and adapting existing simulation codes to include adjoint solvers can be challenging. Recall that the adjoint solver must use field variables to constitute the observables (or objective functions) for optimization. As a result, only a limited number of field variables are available, like pressure, velocity, temperature, and chemical species in the latest ANSYS Fluent 23. Many field variables, as well as all discrete-phase variables, are still not available to be used for optimization. The level of geometry remodeling is also limited and susceptible to negative cells. In this study, the feasible control of the exiting mass flux is limited to “−1.2–2%” for Acetaldehyde and is even one order of magnitude lower for Benzene, “−0.12–1.5%”, as shown in Figure 4 and Figure 5. It is also noted that the CFD–adjoint framework in this study only works for steady flows, because the shape sensitivity was computed based on perturbations to a steady flow solution. To consider a cyclic flow or fluid–structure interactions, shape sensitivities should be considered from a time series of flow solutions [71]. Moreover, the CFD–adjoint model in this study works only for vapors, which are treated as a continuous phase, not for discrete-phase particles, whose trajectories are tracked individually, with the deposition rate being calculated as a cumulative value. Future studies to extend the CFD–adjoint to discrete-phase particles are needed. After saying this, the adjoint solver was indeed demonstrated to be feasible to consider morphological effects on the deposition of orally inhaled vapors under steady flows. This CFD–adjoint model can be further applied for a broader range of chemicals with different physical properties, or for investigation of morphological effects in other airway regions. Geometric constraints are necessary to ensure that the adjoint-morphed airway geometries remain anatomically feasible.

5. Conclusions

In summary, the hybrid adjoint–CFD model with a wall absorption model has been demonstrated to provide a practical approach to explore the effects of mouth–tongue shape on vapor deposition. Similar efforts can be extended to other respiratory tract regions or the same region between health and disease or among different groups. The adjoint shape sensitivity analysis and optimization are significantly more efficient than conventional parametric analysis methods. However, at this stage, only continuous field variables can be used to constitute design observables for calculating the adjoint shape sensitivity with steady respiration; thus, the adjoint–CFD method is still infeasible for the dosimetry control of discrete-phase particles or under tidal breathing conditions.

Author Contributions

Conceptualization, X.S. and J.X.; methodology, M.T., X.S. and J.X.; software, M.T. and J.X.; validation, X.S. and J.X.; formal analysis, M.T., X.S. and J.X.; investigation, M.T., X.S. and J.X.; data curation, M.T.; writing—original draft preparation, J.X.; writing—review and editing, M.T. and X.S.; visualization, M.T. and J.X.; supervision, J.X. All authors have read and agreed to the published version of the manuscript.

Funding

This research received no external funding.

Data Availability Statement

The data presented in this study are available upon request from the corresponding author.

Acknowledgments

Amr Seifelnasr at UMass Lowell Biomedical Engineering is gratefully acknowledged for editing and proofreading this manuscript.

Conflicts of Interest

The authors declare no conflicts of interest.

References

  1. Shukla, S.D.; Swaroop Vanka, K.; Chavelier, A.; Shastri, M.D.; Tambuwala, M.M.; Bakshi, H.A.; Pabreja, K.; Mahmood, M.Q.; O’Toole, R.F. Chapter 1—Chronic respiratory diseases: An introduction and need for novel drug delivery approaches. In Targeting Chronic Inflammatory Lung Diseases Using Advanced Drug Delivery Systems; Dua, K., Hansbro, P.M., Wadhwa, R., Haghi, M., Pont, L.G., Williams, K.A., Eds.; Academic Press: Cambridge, MA, USA, 2020; pp. 1–31. [Google Scholar]
  2. Ramji, H.F.; Hafiz, M.; Altaq, H.H.; Hussain, S.T.; Chaudry, F. Acute respiratory distress syndrome; A Review of recent updates and a glance into the future. Diagnostics 2023, 13, 1528. [Google Scholar] [CrossRef] [PubMed]
  3. Momtazmanesh, S.; Moghaddam, S.S.; Ghamari, S.-H.; Rad, E.M.; Rezaei, N.; Shobeiri, P.; Aali, A.; Abbasi-Kangevari, M.; Abbasi-Kangevari, Z.; Abdelmasseh, M.; et al. Global burden of chronic respiratory diseases and risk factors, 1990–2019: An update from the Global Burden of Disease Study 2019. eClinicalMedicine 2023, 59, 101936. [Google Scholar] [CrossRef] [PubMed]
  4. Labiris, N.R.; Dolovich, M.B. Pulmonary drug delivery. Part I: Physiological factors affecting therapeutic effectiveness of aerosolized medications. Br. J. Clin. Pharmacol. 2003, 56, 588–599. [Google Scholar] [CrossRef] [PubMed]
  5. Xi, J.; Walfield, B.; Si, X.A.; Bankier, A.A. Lung Physiological Variations in COVID-19 Patients and Inhalation Therapy Development for Remodeled Lungs. SciMed. J. 2021, 3, 198–208. [Google Scholar] [CrossRef]
  6. Ochs, M.; Nyengaard, J.R.; Jung, A.; Knudsen, L.; Voigt, M.; Wahlers, T.; Richter, J.; Gundersen, H.J.G. The number of alveoli in the human lung. Am. J. Respir. Crit. Care Med. 2004, 169, 120–124. [Google Scholar] [CrossRef]
  7. Islam, M.S.; Paul, G.; Ong, H.X.; Young, P.M.; Gu, Y.T.; Saha, S.C. A review of respiratory anatomical development, air flow characterization and particle deposition. Int. J. Environ. Res. Public Health 2020, 17, 380. [Google Scholar] [CrossRef] [PubMed]
  8. Kitaoka, H.; Takaki, R.; Suki, B. A three-dimensional model of the human airway tree. J. Appl. Physiol. 1999, 87, 2207–2217. [Google Scholar] [CrossRef] [PubMed]
  9. Wang, J.; Wainwright, D.K.; Lindengren, R.E.; Lauder, G.V.; Dong, H. Tuna locomotion: A computational hydrodynamic analysis of finlet function. J R. Soc. Interface 2020, 17, 20190590. [Google Scholar] [CrossRef] [PubMed]
  10. Zhao, J.; Feng, Y.; Fromen, C.A. Glottis motion effects on the particle transport and deposition in a subject-specific mouth-to-trachea model: A CFPD study. Comput. Biol. Med. 2020, 116, 103532. [Google Scholar] [CrossRef] [PubMed]
  11. Talaat, M.; Si, X.A.; Tanbour, H.; Xi, J. Numerical studies of nanoparticle transport and deposition in terminal alveolar models with varying complexities. Med One 2019, 4, e190018. [Google Scholar]
  12. Wang, J.; Xi, J.; Han, P.; Wongwiset, N.; Pontius, J.; Dong, H. Computational analysis of a flapping uvula on aerodynamics and pharyngeal wall collapsibility in sleep apnea. J. Biomech. 2019, 94, 88–98. [Google Scholar] [CrossRef] [PubMed]
  13. Zhong, Q.; Dong, H.; Quinn, D.B. How dorsal fin sharpness affects swimming speed and economy. J. Fluid Mech. 2019, 878, 370–385. [Google Scholar] [CrossRef]
  14. Koehler, C.; Liang, Z.; Gaston, Z.; Wan, H.; Dong, H. 3D reconstruction and analysis of wing deformation in free-flying dragonflies. J. Exp. Biol. 2012, 215, 3018–3027. [Google Scholar] [CrossRef] [PubMed]
  15. Vinchurkar, S.; De Backer, L.; Vos, W.; Van Holsbeke, C.; De Backer, J.; De Backer, W. A case series on lung deposition analysis of inhaled medication using functional imaging based computational fluid dynamics in asthmatic patients: Effect of upper airway morphology and comparison with in vivo data. Inhal. Toxicol. 2012, 24, 81–88. [Google Scholar] [CrossRef] [PubMed]
  16. Lepley, T.J.; Frusciante, R.P.; Malik, J.; Farag, A.; Otto, B.A.; Zhao, K. Otolaryngologists’ radiological assessment of nasal septum deviation symptomatology. Eur. Arch. Otorhinolaryngol. 2023, 280, 235–240. [Google Scholar] [CrossRef] [PubMed]
  17. Corley, R.A.; Kabilan, S.; Kuprat, A.P.; Carson, J.P.; Minard, K.R.; Jacob, R.E.; Timchalk, C.; Glenny, R.; Pipavath, S.; Cox, T.; et al. Comparative computational modeling of airflows and vapor Dosimetry in the respiratory tracts of rat, monkey, and human. Toxicol. Sci. 2012, 128, 500–516. [Google Scholar] [CrossRef] [PubMed]
  18. Amjadimanesh, H.; Faramarzi, M.; Sadrizadeh, S.; Abouali, O. Micro-particle deposition in maxillary sinus for various sizes of opening in a virtual endoscopic surgery. Exp. Comput. Multiph. Flow 2023, 5, 262–271. [Google Scholar] [CrossRef]
  19. Wedel, J.; Steinmann, P.; Štrakl, M.; Hriberšek, M.; Ravnik, J. Can CFD establish a connection to a milder COVID-19 disease in younger people? Aerosol deposition in lungs of different age groups based on Lagrangian particle tracking in turbulent flow. Comput. Mech. 2021, 67, 1497–1513. [Google Scholar] [CrossRef] [PubMed]
  20. Shrestha, K.; Wong, E.; Salati, H.; Fletcher, D.F.; Singh, N.; Inthavong, K. Liquid volume and squeeze force effects on nasal irrigation using Volume of Fluid modelling. Exp. Comput. Multiph. Flow 2022, 4, 445–464. [Google Scholar] [CrossRef]
  21. Craven, B.A.; Neuberger, T.; Paterson, E.G.; Webb, A.G.; Josephson, E.M.; Morrison, E.E.; Settles, G.S. Reconstruction and morphometric analysis of the nasal airway of the dog (Canis familiaris) and implications regarding olfactory airflow. Anat. Rec. 2007, 290, 1325–1340. [Google Scholar] [CrossRef] [PubMed]
  22. Rygg, A.D.; Van Valkenburgh, B.; Craven, B.A. The influence of sniffing on airflow and odorant deposition in the canine nasal cavity. Chem. Senses 2017, 42, 683–698. [Google Scholar] [CrossRef] [PubMed]
  23. Corley, R.A.; Minard, K.R.; Kabilan, S.; Einstein, D.R.; Kuprat, A.P.; Harkema, J.R.; Kimbell, J.S.; Gargas, M.L.; Kinzell, J.H. Magnetic resonance imaging and computational fluid dynamics (CFD) simulations of rabbit nasal airflows for the development of hybrid CFD/PBPK models. Inhal. Toxicol. 2009, 21, 512–518. [Google Scholar] [CrossRef] [PubMed]
  24. Wu, Z.; Jiang, J.; Lischka, F.W.; McGrane, S.J.; Porat-Mesenco, Y.; Zhao, K. Domestic cat nose functions as a highly efficient coiled parallel gas chromatograph. PLoS Comput. Biol. 2023, 19, e1011119. [Google Scholar] [CrossRef] [PubMed]
  25. Dong, J.; Ma, J.; Tian, L.; Inthavong, K.; Ito, K.; Tu, J. Numerical analysis of nanoparticle transport and deposition in a cynomolgus monkey nasal passage. Int. J. Numer. Methods Biomed. Eng. 2021, 37, e3414. [Google Scholar] [CrossRef] [PubMed]
  26. Tian, L.; Dong, J.; Shang, Y.; Tu, J. Detailed comparison of anatomy and airflow dynamics in human and cynomolgus monkey nasal cavity. Comput. Biol. Med. 2022, 141, 105150. [Google Scholar] [CrossRef] [PubMed]
  27. Xi, J.; Si, X.A.; Malvè, M. Nasal anatomy and sniffing in respiration and olfaction of wild and domestic animals. Front. Vet. Sci. 2023, 10, 1172140. [Google Scholar] [CrossRef] [PubMed]
  28. Tanabe, N.; Hirai, T. Recent advances in airway imaging using micro-computed tomography and computed tomography for chronic obstructive pulmonary disease. Korean J. Intern. Med. 2021, 36, 1294–1304. [Google Scholar] [CrossRef] [PubMed]
  29. Fernandez-Tena, A.; Fernandez-Francos, J.; Agujetas-Ortiz, R.; Casan-Clara, P. Airway model reconstructed from CT images. Eur. Respir. J. 2016, 48, PA4404. [Google Scholar]
  30. Xi, J.; Yang, T. Variability in oropharyngeal airflow and aerosol deposition due to changing tongue positions. J. Drug Deliv. Sci. Technol. 2019, 49, 674–682. [Google Scholar] [CrossRef]
  31. Gurani, S.F.; Di Carlo, G.; Cattaneo, P.M.; Thorn, J.J.; Pinholt, E.M. Effect of head and tongue posture on the pharyngeal airway dimensions and morphology in three-dimensional imaging: A systematic review. J. Oral Maxillofac. Res. 2016, 7, e1. [Google Scholar] [CrossRef] [PubMed]
  32. Wang, S.H.; Keenan, B.T.; Wiemken, A.; Zang, Y.; Staley, B.; Sarwer, D.B.; Torigian, D.A.; Williams, N.; Pack, A.I.; Schwab, R.J. Effect of weight loss on upper airway anatomy and the apnea-hypopnea index. the importance of tongue fat. Am. J. Respir. Crit. Care Med. 2020, 201, 718–727. [Google Scholar] [CrossRef]
  33. Horiguchi, T.; Kondo, R. Determination of the preferred tongue position for optimal inhaler use. J. Allergy Clin. Immunol. Pract. 2018, 6, 1039–1041.e1033. [Google Scholar] [CrossRef] [PubMed]
  34. Zhou, X.; Li, Y.; Miao, H.; Zhang, Y.; Yu, A.; Huang, F.; Li, R.; Tong, Z. Numerical study on the effect of the realistic mouth-inhaler positions on orally inhaled drug delivery in pediatric intersubject upper airways. Powder Technol. 2024, 432, 119163. [Google Scholar] [CrossRef]
  35. Yang, T.; Si, X.; Xi, J. Sensitivity analysis and uncertainty quantification of nanoparticle deposition from tongue morphological variations. Life 2024, 14, 406. [Google Scholar] [CrossRef] [PubMed]
  36. Jansen, J.D. Adjoint-based optimization of multi-phase flow through porous media—A review. Comput. Fluids 2011, 46, 40–51. [Google Scholar] [CrossRef]
  37. Martins, J.R.R.A. Aerodynamic design optimization: Challenges and perspectives. Comput. Fluids 2022, 239, 105391. [Google Scholar] [CrossRef]
  38. Li, Z.; Zheng, X. Review of design optimization methods for turbomachinery aerodynamics. Prog. Aerosp. Sci. 2017, 93, 1–23. [Google Scholar] [CrossRef]
  39. Fikl, A.; Le Chenadec, V.; Sayadi, T. Control and optimization of interfacial flows using adjoint-based techniques. Fluids 2020, 5, 156. [Google Scholar] [CrossRef]
  40. Ancourt, K.; Peter, J.; Atinault, O. Adjoint and direct characteristic equations for two-dimensional compressible euler flows. Aerospace 2023, 10, 797. [Google Scholar] [CrossRef]
  41. Alexias, P.; Giannakoglou, K.C. Shape optimization of a two-fluid mixing device using continuous adjoint. Fluids 2020, 5, 11. [Google Scholar] [CrossRef]
  42. Basse, N.T. Flow-based optimization of products or devices. Fluids 2020, 5, 56. [Google Scholar] [CrossRef]
  43. Russell, T.F.; Celia, M.A. An overview of research on Eulerian–Lagrangian localized adjoint methods (ELLAM). Adv. Water Resour. 2002, 25, 1215–1231. [Google Scholar] [CrossRef]
  44. Lu, J.; Xi, J.; Langenderfer, J.E. Sensitivity analysis and uncertainty quantification in pulmonary drug delivery of orally inhaled pharmaceuticals. J. Pharm. Sci. 2017, 106, 3303–3315. [Google Scholar] [CrossRef] [PubMed]
  45. Tian, G.; Longest, P.W. Application of a new dosimetry program TAOCS to assess transient vapour absorption in the upper airways. Inhal. Toxicol. 2010, 22, 1047–1063. [Google Scholar] [CrossRef] [PubMed]
  46. Tian, G.; Longest, P.W. Transient absorption of inhaled vapors into a multilayer mucus–tissue–blood system. Ann. Biomed. Eng. 2010, 38, 517–536. [Google Scholar] [CrossRef] [PubMed]
  47. Ghalichi, F.; Deng, X.; Champlain, A.D.; Douville, Y.; King, M.; Guidoin, R. Low Reynolds number turbulence modeling of blood flow in arterial stenoses. Biorheology 1998, 35, 281–294. [Google Scholar] [CrossRef] [PubMed]
  48. Wilcox, D.C. Turbulence Modeling for CFD, 2nd ed; DCW Industries, Inc.: La Canada Flintridge, CA, USA, 1998. [Google Scholar]
  49. Zhang, Z.; Kleinstreuer, C. Low-Reynolds-number turbulent flows in locally constricted conduits: A comparison study. AIAA J. 2003, 41, 831–840. [Google Scholar] [CrossRef]
  50. Zhang, Z.; Kleinstreuer, C. Airflow structures and nano-particle deposition in a human upper airway model. J. Comput. Phys. 2004, 198, 178–210. [Google Scholar] [CrossRef]
  51. Longest, P.W.; Vinchurkar, S. Validating CFD predictions of respiratory aerosol deposition: Effects of upstream transition and turbulence. J. Biomech. 2007, 40, 305–316. [Google Scholar] [CrossRef] [PubMed]
  52. ICRP. Human Respiratory Tract Model for Radiological Protection; Elsevier Science Ltd.: New York, NY, USA, 1994; Volume 66. [Google Scholar]
  53. Tian, G.; Longest, P.W. Development of a CFD boundary condition to model transient vapor absorption in the respiratory airways. J. Biomech. Eng. 2010, 132, 051003. [Google Scholar] [CrossRef] [PubMed]
  54. Farazmand, M. An adjoint-based approach for finding invariant solutions of Navier–Stokes equations. J. Fluid Mech. 2016, 795, 278–312. [Google Scholar] [CrossRef]
  55. Gałecki, J.; Szumbarski, J. Adjoint-based optimal control of incompressible flows with convective-like energy-stable open boundary conditions. Comput. Math. Appl. 2022, 106, 40–56. [Google Scholar] [CrossRef]
  56. Popovac, M. Continuous adjoint topology optimization of duct flow configurations with explicit volume constraint for design variable update. Energies 2022, 15, 7349. [Google Scholar] [CrossRef]
  57. Grossberg, S.; Jarman, D.S.; Tabor, G.R. Derivation of the adjoint drift flux equations for multiphase flow. Fluids 2020, 5, 31. [Google Scholar] [CrossRef]
  58. Sbai, M.A.; Larabi, A. On solving groundwater flow and transport models with algebraic multigrid preconditioning. Ground Water 2021, 59, 100–108. [Google Scholar] [CrossRef] [PubMed]
  59. Xi, J.; Si, X.; Kim, J.W.; Berlinski, A. Simulation of airflow and aerosol deposition in the nasal cavity of a 5-year-old child. J. Aerosol. Sci. 2011, 42, 156–173. [Google Scholar] [CrossRef]
  60. Stein, L.; Straube, F.; Weinzierl, S.; Lemke, M. Directional sound source modeling using the adjoint Euler equations in a finite-difference time-domain approach. J. Acoust. Soc. Am. 2020, 148, 3075. [Google Scholar] [CrossRef] [PubMed]
  61. Sun, Q.; Dong, J.; Zhang, Y.; Tian, L.; Tu, J. Numerical study of the effect of nasopharynx airway obstruction on the transport and deposition of nanoparticles in nasal airways. Exp. Comput. Multiph. Flow 2022, 4, 399–408. [Google Scholar] [CrossRef]
  62. Zare, F.; Aalaei, E.; Zare, F.; Faramarzi, M.; Kamali, R. Targeted drug delivery to the inferior meatus cavity of the nasal airway using a nasal spray device with angled tip. Comput. Methods Programs Biomed. 2022, 221, 106864. [Google Scholar] [CrossRef] [PubMed]
  63. Vinchurkar, S.; Vos, W.; Holsbeke, C.; Backer, J.D.; Poli, G.; Backer, W.D. The effects of extrafine beclomethasone/formoterol on hyperinflation and airway geometry in COPD patients. Eur. Respir. J. 2012, 40, P4833. [Google Scholar]
  64. Si, X.; Xi, J.S.; Talaat, M.; Donepudi, R.; Su, W.-C.; Xi, J. Evaluation of impulse oscillometry in respiratory airway casts with varying cbstruction phenotypes, locations, and complexities. J. Respir. 2022, 2, 44–58. [Google Scholar] [CrossRef]
  65. Talaat, M.; Si, X.A.; Dong, H.; Xi, J. Leveraging statistical shape modeling in computational respiratory dynamics: Nanomedicine delivery in remodeled airways. Comput. Methods Programs Biomed. 2021, 204, 106079. [Google Scholar] [CrossRef] [PubMed]
  66. Xi, J.; Wang, Z.; Si, X.A.; Zhou, Y. Nasal dilation effects on olfactory deposition in unilateral and bi-directional deliveries: In vitro tests and numerical modeling. Eur. J. Pharm. Sci. 2018, 118, 113–123. [Google Scholar] [CrossRef] [PubMed]
  67. Xi, J.; Zhao, W. Correlating exhaled aerosol images to small airway obstructive diseases: A study with dynamic mode decomposition and machine learning. PLoS ONE 2019, 14, e0211413. [Google Scholar] [CrossRef] [PubMed]
  68. Menzer, A.; Gong, Y.; Fish, F.E.; Dong, H. Bio-inspired propulsion: Towards understanding the role of pectoral fin kinematics in Manta-like swimming. Biomimetics 2022, 7, 45. [Google Scholar] [CrossRef] [PubMed]
  69. Gong, Y.; Wang, J.; Zhang, W.; Socha, J.J.; Dong, H. Computational analysis of vortex dynamics and aerodynamic performance in flying-snake-like gliding flight with horizontal undulation. Phys. Fluids 2022, 34, 121907. [Google Scholar] [CrossRef]
  70. Guo, J.; Zhang, W.; Han, P.; Fish, F.E.; Dong, H. Thrust generation and propulsive efficiency in dolphin-like swimming propulsion. Bioinspir. Biomim. 2023, 18, 056001. [Google Scholar] [CrossRef] [PubMed]
  71. Gholampour, S.; Fatouraee, N. Boundary conditions investigation to improve computer simulation of cerebrospinal fluid dynamics in hydrocephalus patients. Commun. Biol. 2021, 4, 394. [Google Scholar] [CrossRef] [PubMed]
Figure 1. The adjoint–CFD solver with three phases: flow solution, adjoint solution, and design.
Fluids 09 00104 g001
Figure 2. Models: (a) geometry model of mouth–tongue–throat, (b) computational mesh, and (c) mass transfer at the airway wall with mucus, tissue, and blood.
Fluids 09 00104 g002
Figure 3. Vapor concentration in the core flows and on the wall surfaces for (a) Acetaldehyde and (b) Benzene. Different concentration ranges were used to highlight the concentration variation.
Fluids 09 00104 g003
Figure 4. Adjoint shape sensitivity magnitude (SSM) on the log10 scale: (a) Acetaldehyde and (b) Benzene.
Fluids 09 00104 g004
Figure 5. Comparison between original and adjoint-modified airway models with four different observable targets in terms of 3D morphology and dimension variation: (a) Acetaldehyde and (b) Benzene.
Fluids 09 00104 g005
Figure 6. Comparison of the 2D contours between original and adjoint-modified airway geometries with four different observable targets: (a) Acetaldehyde and (b) Benzene.
Fluids 09 00104 g006
Figure 7. Airflow fields in modified airway models with different targets in Acetaldehyde exit mass flux: (a) −1.2%, (b) −0.6%, (c) control, (d) +1%, and (e) +2%.
Fluids 09 00104 g007
Figure 8. Iso-surfaces of Q-criterion in modified airway models with different targets in Acetaldehyde exit mass flux: (a) −1.2%, (b) −0.6%, (c) control, (d) +1%, and (e) +2%.
Fluids 09 00104 g008
Figure 9. Vapor transport in modified airway models with different targets for the exit mass flux relative to the control case: (a) Acetaldehyde and (b) Benzene.
Fluids 09 00104 g009
Figure 10. Vapor concentration distributions on the wall surfaces in modified airway models: (a) Acetaldehyde and (b) Benzene.
Fluids 09 00104 g010
Figure 11. Correlation between flow resistance and observable: (a) Acetaldehyde, (b) Benzene, and (c) pressure drop vs. observable.
Fluids 09 00104 g011
Table 1. Trasport properties of chemical vapors.
Da (cm2/s)λmaDm (cm2/s)λtmDt (cm2/s)
Acetaldehyde8.0 × 10−23.2 × 1028.0 × 10−65.9 × 10−12.64 × 10−6
Benzene8.8 × 10−24.49.8 × 10−64.13.23 × 10−6
Disclaimer/Publisher’s Note: The statements, opinions and data contained in all publications are solely those of the individual author(s) and contributor(s) and not of MDPI and/or the editor(s). MDPI and/or the editor(s) disclaim responsibility for any injury to people or property resulting from any ideas, methods, instructions or products referred to in the content.

