Abstract
Background: In the research of coronary artery disease, the precise initial injury that starts the atherosclerotic cascade remains unidentified. Moreover, the mechanisms governing the progression or regression of coronary plaque are not yet fully understood. Based on the concept that the cardiovascular system is a network of pumps and pipes, could fluid mechanics principles and practices elucidate the question of atherosclerosis using flow dynamics images from a novel angiographic technique, focusing on antegrade and retrograde flows and their collisions in iliac and coronary arteries? Methods: From January 2023 to May 2024, coronary angiograms of all hemodynamically stable patients with stable or unstable angina were screened. The angiograms displaying either no lesions (normal) or mild-to-moderate lesions were selected. Each patient underwent an evaluation of flow dynamics and arterial phenomena in both iliac and right coronary arteries. For each artery, data were categorized based on the following parameters: laminar versus non-laminar flow, presence versus absence of collisions, and presence versus absence of retrograde flow. Additionally, in two sub-studies, we analyzed the relationship between retrograde flow and blood pressure, and artificial intelligence algorithms were used to detect the retrograde flow in the right coronary artery. Results: A total of 95 patients were screened, and 51 were included in this study. The results comprised quantitative data (prevalence of laminar flows, collisions, and retrograde flows) and qualitative data (morphological characteristics of antegrade laminar flow, retrograde contrast flow, and instances of flow collision). The results showed that in the iliac artery, laminar flow was observed in 47.06% (24/51) of cases, with collisions noted in 23.53% (12/51). Retrograde flow was present in 47.06% (24/51) of cases, and notably, 75% (18/24) of these cases were associated with uncontrolled diastolic blood pressure (DBP) above 80 mmHg (p < 0.001). Conversely, in the RCA, laminar flow was observed in 54.9% (28/51) of cases, with collisions noted in only 3.92% (2/51). Retrograde flow was identified in 7.84% (4/51) of cases, and all these cases (100%, 4/4) were associated with uncontrolled systolic blood pressure (SBP) above 120 mmHg, though statistical significance was not reached due to the small sample size (p > 0.05). Conclusions: Based on the concept that the cardiovascular system is a network of pumps and pipes, this research methodology provides intriguing insights into arterial flow behaviors by integrating fluid mechanics practices with novel angiographic observations. The preliminary results of this study identified laminar flow as the predominant pattern, with retrograde flow and collisions occurring infrequently. The implications of vortex, collision, and disorganized flow highlight potential mechanisms for endothelial damage and atherosclerosis initiation. Moreover, the correlation with blood pressure underscores the critical role of hypertension management in preventing adverse hemodynamic events. Future directions include refining imaging techniques and further exploring the mechanistic links between flow dynamics and vascular pathophysiology to enhance diagnostic and therapeutic strategies for cardiovascular diseases.
1. What Is New?
For the first time, in vivo images of laminar flow and retrograde flow with collisions are reported in the medical literature. The presence of retrograde flow is critical, as it may precipitate collisions and subsequent disorganized flow. Without retrograde flow, collisions do not occur. The occurrence of retrograde flow in the iliac artery is dependent on diastolic blood pressure (DBP). Specifically, if the DBP is less than 80 mmHg, retrograde flow does not occur. This phenomenon may explain the beneficial mechanism of maintaining a DBP below 80 mmHg, as recommended in current hypertension guidelines.
2. Introduction
In both basic science and clinical research on coronary artery disease (CAD), the precise initial injury that starts the atherosclerotic cascade remains unidentified [1]. Moreover, the mechanisms governing the progression or regression of coronary plaque are not yet fully understood [2]. Although wall shear stress (WSS) has been proposed as the primary trigger of atherosclerosis, this theory has not significantly advanced current research [3]. One reason for this limitation is that WSS is primarily studied in animal or computational fluid dynamic models, with data extrapolated to humans, and cannot be routinely measured in cardiac catheterization laboratories [4].
Over the past eight years, our research laboratories have prioritized fluid mechanics as the primary methodology for studying flow in coronary, iliac, and femoral arteries. This shift has redirected our focus from the traditional identification of luminal contrast shadow indentations, commonly referred to as stenoses, to a comprehensive analysis of flow characteristics and dynamics. Consequently, we have revised our angiography protocol to capture detailed flow phenomena, including the antegrade and retrograde flows and their interactions [5].
In our research hypothesis, we conceptualize the cardiovascular (CV) system as a network of pipes and pumps. To explore this concept, in this article, we first present the methodologies employed by fluid mechanics engineers to identify flow patterns in pipes. We then discuss the rationale of selection and plan for visual observation and artificial intelligence (AI) in the analysis of similar flows in arteries. We identify the distinct characteristics of flows and phenomena in pipes, using them as key parameters to validate analogous in vivo arterial phenomena in focus in this study: antegrade blood flow, retrograde contrast flow, their collision, vortex formation, degeneration into disorganized flow, and subsequent cyclic stress. Additionally, we conduct one sub-study investigating the relationship between uncontrolled blood pressure and abnormal flow patterns and one sub-study using artificial intelligence algorithms to detect the retrograde flow in the right coronary artery.
In the preliminary report of this study, the objectives are to (1) quantify the incidence of laminar flow, retrograde flow, and flow collisions in iliac and coronary arteries; and (2) characterize the morphological features of these flow patterns. Furthermore, we analyze the parallels and differences between the mechanisms underlying typical flow patterns and their degeneration into disorganized flow, which may damage the lining of pipes or injure the endothelial layers of the intima, potentially triggering the atherosclerotic process. Lastly, we summarize the fluid mechanics techniques used to troubleshoot issues in fluid transportation, exploring how these practices can be applied to diagnose and reverse disease processes in coronary artery disease (CAD), peripheral artery disease, and cerebrovascular accidents.
3. Methods
Selection criteria: All hemodynamically stable patients older than 18 years old with stable or unstable angina presented to our institutions for coronary angiograms (CAGs) from January 2023 to May 2024 were screened. All right coronary angiograms (RCAs) displaying either no lesions (normal) or mild-to-moderate lesions were selected. The reason for selecting RCAs was because of their large diameter (3–4 mm), so the morphology of the blood flow could be observed, identified, and recorded. Patients with ST-segment elevation myocardial infarction (STEMI), non-STEMI, a history of coronary bypass graft surgery (CABG), previous percutaneous coronary interventions (PCIs), critical stenosis, or chronic total occlusion were excluded. These exclusions were made because critical stenosis restricted common flows or prior instrumentation disturbed them.
New dynamic angiographic protocol: At the beginning of the procedure, recording started with injection of contrast until the target coronary artery was fully opacified. Following cessation of contrast injection, the recording continued with the camera capturing the images of unstained blood entering the artery, appearing white on the angiogram. By observing the unstained blood displacing the black-colored contrast, various flow patterns could be identified. The coronary angiogram was recorded at a standard rate of 15 frames per second, with a 0.067 s interval between consecutive images. At the end of the diagnostic or interventional procedure, in preparation for deploying a percutaneous closure device, a blood pressure tracing from the femoral sheath was recorded, and less than thirty seconds later, an iliac angiography was performed. This novel angiographic technique has been previously described and published [6,7].
Study protocol: At the cardiac catheterization laboratories, all patients received standard treatment in accordance with the current clinical guidelines. The implementation of the new dynamic angiographic protocol did not interfere with the prescribed treatments. Throughout the procedures, vital signs were systematically collected and monitored to ensure patient safety and to gather comprehensive physiological data.
Each patient underwent an evaluation of flow dynamics and arterial phenomena in both iliac and right coronary arteries. For each artery, data were categorized based on the following parameters: laminar versus non-laminar antegrade flow, presence versus absence of retrograde flow, and presence versus absence of collisions. Additionally, we analyzed the relationship between retrograde flow and blood pressure, with a particular focus on the association with uncontrolled diastolic blood pressure exceeding 80 mmHg in the iliac artery. Artificial intelligence algorithms were used to detect the retrograde flow.
Analysis of iliac and coronary images: The initial examination of the iliac and femoral angiograms aimed to document the patterns of antegrade blood flow, depicted in white during systole, and retrograde contrast flow, shown in black during late systole and early or mid-diastole. Special attention was given to the interactions between retrograde and antegrade flows and their resulting fluid dynamic phenomena, including collisions. The collision images were analyzed to investigate flow interactions at the interface, the incidence of retrograde flows under varying conditions of systolic and diastolic blood pressure, vortex formation, and subsequent transition to disorganized flow.
Similarly, the right coronary artery images documented antegrade blood flow in white during diastole, followed by retrograde contrast flow in black during systole, with a subtle collision at the location of transition from diastole to systole or systole to diastole.
The sequence of arterial flow events, beginning with diastole and concluding with systole, repeats with each heartbeat, forming a cyclic pattern of averaged flow dynamics rather than a continuous single-flow effect. This pattern reflects the integration of individual events into an overall flow dynamic. In this article, turbulent flow is not distinctly identified because the Reynolds number is not routinely calculated in cardiac catheterization laboratories, and when disorganized flow does occur, it typically persists for only 15% of a cardiac cycle.
Methodological approaches: In a pipeline network, laminar flow is the most common type of flow. It is characterized by the smooth, continuous movement of a uniformly colored fluid mass without mixing, maintaining a consistent and predictable flow pattern, often with a distinctive pointed tip (Figure 1A) [8]. In contrast, turbulent flow refers to disorganized flow with irregular fluctuations in velocity and pressure caused by vortices, eddies (circular movements of water counter to the main current, causing small whirlpools), and wakes (tracks of waves left by objects moving through the water, greater than the natural waves in the immediate area) (Figure 1B) [9].
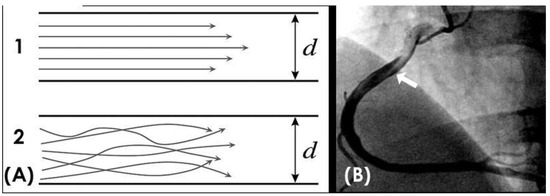
Figure 1.
(A,B) Laminar and turbulent flow. (A) This is a schematic diagram of laminar flow in organized layers, with the highest velocity in the middle, and turbulent flow, where all the elements of the blood move in a disorganized fashion. (B) In a right coronary artery filled with black contrast, the blood in white color moves in a laminar fashion with a pointed tip (white arrow).
In the cardiovascular network, laminar flow is common, moving in an antegrade direction from the heart to the peripheries, in contrast to retrograde flow, which moves from the peripheries back to the heart. Because these two flows run in opposite directions, their interactions can result in collisions, generating various fluid phenomena, including disorganized flow and mechanical effects.
Visual observation: In a pipe, visual observation to verify laminar flow involves introducing dye into the flow and observing its behavior. In laminar flow, the dye will form a smooth, straight line, while in turbulent flow, the dye will mix and form a chaotic pattern. In laminar flow, fluid particles move in smooth, parallel layers, or streamlines, with minimal mixing between these layers. The flow appears steady and orderly, lacking the swirls, eddies, and chaotic motion characteristic of turbulent flow.
The current coronary and iliac angiographic technique involves injecting the contrast into the index artery, which appears black on the angiogram, followed by the entry of blood, which appears white. This method parallels classic fluid dynamics experiments where dye is introduced into a flow [10].
In the cardiac catheterization laboratories, all the assessments of the coronary angiogram are conducted by visual observations. The novel dynamic recording protocol demonstrates success in capturing (1) the morphological composition of the flow (e.g., straight or blunt tip, homogeneous or disorganized mix, covering the entire arterial diameter or circulating along one border); (2) the interaction of the main flow with the arterial wall; (3) concurrent imaging of antegrade blood flow at the distal tip and retrograde flow of contrast at the mid- and proximal segments; and (4) flow patterns (e.g., organized or disorganized, detached, curved) at different anatomical features of the artery (e.g., straight segments, curves, bifurcations). Therefore, in this study, the identification of in vivo flows is based on visual observation, as this is the usual way of assessing the severity of lesion stenosis before or after stenting.
Artificial intelligence analysis: Analysis of coronary angiographic images by artificial intelligence (AI) is very challenging [11,12,13]. In this study, there were four key challenges to be addressed: stenosis detection, retrograde flow detection, estimation of photosensitive flow time, and detection of kinked blood vessels.
For all four problems, the first step involved obtaining segmentation images of the coronary arteries. To achieve this, we trained two models using the R2U Attention architecture [14] on two distinct datasets: one containing labeled full-vessel images and another with labeled catheter images. For post-training, we had one model capable of detecting edges in angiographic images, identifying both vessels and occasionally catheters misinterpreted as vessels. The second model exclusively detected catheters, enabling us to eliminate them from the output of the first model. This resulted in segmented coronary images devoid of catheters.
Next, we created 20 × 20 pixel sliding windows across the vessels in the segmented images. Each window captured the coordinates (x, y) and the average color value within the window, which were stored as a matrix for subsequent steps. We used 80 windows per coronary image. If a coronary artery was small and required fewer windows, the remaining values were set at 0. For larger coronary arteries, sliding stopped after 80 windows to exclude insignificant regions. This process yielded an 80 × 3 matrix for each image, where 80 windows sufficiently captured critical information about the coronary arteries.
For retrograde flow detection, we extracted 75 frames from each 5 s video (standard medical video frame rate is 15 fps). Each frame generated an 80 × 3 matrix as previously described, resulting in a 3D matrix of size 75 × 80 × 3 for each video. This 3D matrix served as input for a CNN model to determine the presence of retrograde flow. For stenosis detection, we employed the Vision Transformer architecture [15] with a Two-Way Loss function [16]. The input consisted of 80 small images derived from the coordinates (x, y) of a coronary angiographic image. For small vessels, the excess small images were set to black (all values were 0). The output was an 80-value vector, where each value was 1 if the corresponding window captured stenosis and 0 otherwise.
To estimate photosensitive flow time, we measured the duration from the appearance of the largest vessel segmentation (with the most pixels) to the point where the vessel was no longer segmented in the video. To detect kinked blood vessels, we applied an algorithm that calculated the angle between the centers of three consecutive windows. An angle smaller than 90 degrees indicated a high likelihood of a kinked vessel at that position (Figure 2).
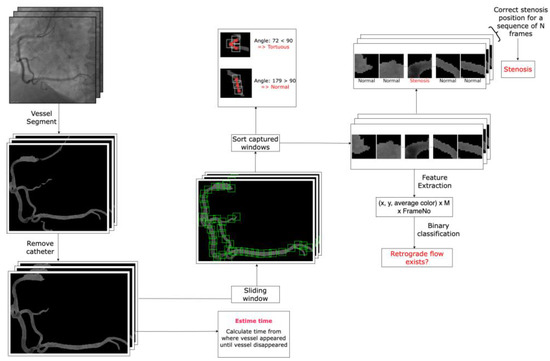
Figure 2.
The artificial intelligence flowchart used for the detection of stenosis, retrograde flow, kinked blood vessels, and estimation of photosensitive flow time (arterial phase time) in the right coronary artery.
Ethical standards: This study was approved by the Institutional Review Board of the University Consortium.
4. Results
From the medical records spanning January 2023 to May 2024, we excluded all patients with STEMI, non-STEMI, and those who had undergone CABG or PCI. Subsequently, we screened the coronary angiograms of 95 patients, selecting 51 for inclusion in our study. The results comprised both quantitative and qualitative data on blood flow dynamics in the iliac and right coronary artery (RCA), as well as preliminary data from the two sub-studies regarding the correlation of retrograde flow with blood pressure and the detection of retrograde flow by artificial intelligence (AI) algorithms. Quantitative data encompass the prevalence of laminar flows, collisions, and retrograde flows, while qualitative data emphasize the morphological characteristics of the antegrade laminar flow and retrograde contrast flow and instances of flow collision.
In the iliac artery, laminar flow was observed in 47.06% (24/51) of cases, with collisions noted in 23.53% (12/51). Retrograde flow was present in 47.06% (24/51) of cases. Conversely, in the RCA, laminar flow was observed in 54.9% (28/51) of cases, with collisions noted in only 3.92% (2/51). Retrograde flow was identified in 7.84% (4/51) of cases.
In the sub-study focused on blood pressure, 75% (18 out of 24) of patients with retrograde flow in the iliac arteries were statistically significantly associated with uncontrolled diastolic blood pressure (DBP) above 80 mmHg (p < 0.001). In the group of RCAs, all these cases (100%, 4/4) with retrograde flow were associated with uncontrolled systolic blood pressure (SBP) above 120 mmHg, though statistical significance was not reached due to the small sample size (p > 0.05) (Figure 3).
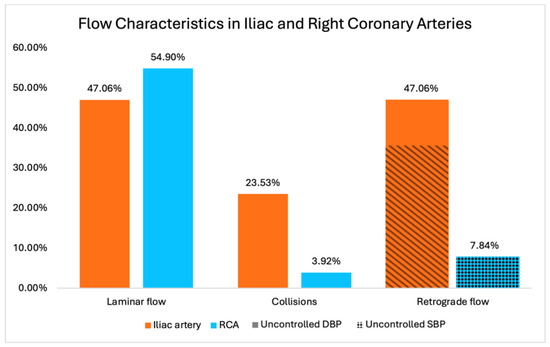
Figure 3.
Prevalence of laminar flow, retrograde flow, and collision in iliac and coronary arteries. Correlations between retrograde flow in coronary artery and uncontrolled systolic blood pressure (non-statistically significant) as well as iliac artery and uncontrolled diastolic blood pressure (statistically significant) are displayed in the last 2 columns.
In the AI sub-study on detecting retrograde flow, the final dataset comprised 225 videos, yielding 11,208 images for training the segmentation model, which achieved an accuracy of 99.18%. After excluding videos that did not meet the new angiographic protocol criteria, the final training set included 109 videos, 18 of which featured retrograde flow. The validation set consisted of 37 videos, including 9 with retrograde flow. The testing set comprised 37 videos, with 8 exhibiting retrograde flow. The retrograde flow prediction model demonstrated a sensitivity of 0.75 and a specificity of 0.86 on the testing set.
ANTEGRADE blood flow: With the novel angiographic technique, in the iliac artery, during systole, the blood in white color was recorded moving forward on a black background of contrast. The blood moved in an antegrade direction secondary to the positive pressure gradient generated by the contraction of the left ventricle (LV), resulting in higher pressure in the aorta in comparison to lower pressure in the distal peripheral arteries. In the iliac artery, the flow could be laminar or non-laminar and of entry type (Figure 4A,B).
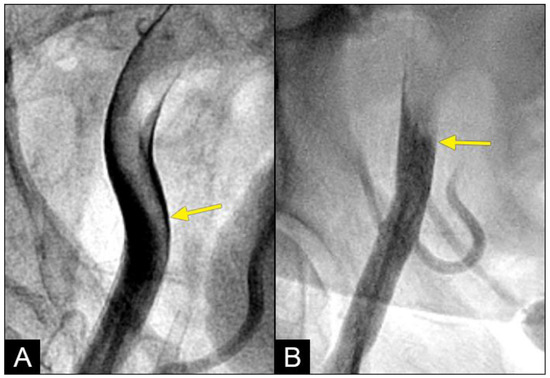
Figure 4.
(A) In the iliac artery, the laminar flow is observed curving along the apex of the artery with a pointed tip. (B) In a different patient, the antegrade flow never had a laminar pattern. This flow looks like an entry non-laminar flow.
In the right coronary artery (RCA), during diastole, the blood flow could be observed over a black contrast background and identified clearly with well-organized flow and a sharp border, without mixing between blood and contrast, following the apex of the curves. By visual observation, this flow was laminar (Figure 5A–D) (Video S1).
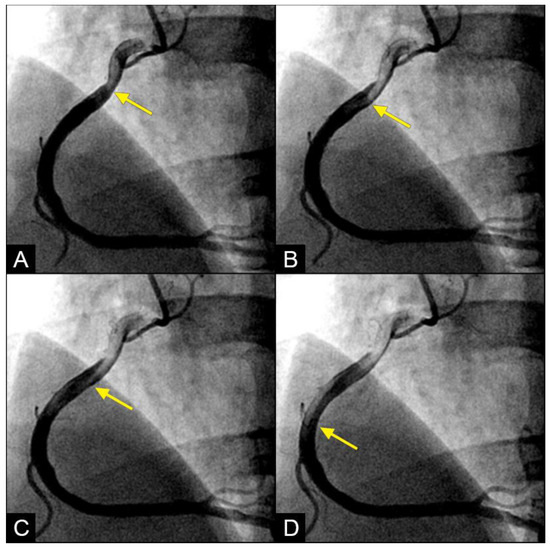
Figure 5.
(A,B) Laminar flow. These four coronary images are in consecutive sequence. (A) This is the angiogram of the right coronary artery (RCA), which is filled with contrast (in black). (B) The blood (in white) is seen well organized with a sharp border and a pointed tip, curving along the apex (yellow arrow). (C,D) The blood (in white) is seen following the apex of the curves (yellow arrow). This is the laminar flow following the curves in a helical fashion.
RETROGRADE contrast flow: In this iliac angiogram recorded by the novel dynamic angiographic technique, near the end of systole and in the first half of diastole, the retrograde flow is observed as a black contrast moving upwards from the iliac arteries towards the aortic bifurcation (Figure 6A–D). In contrast, for the right coronary artery (RCA), the retrograde flow happened mainly in the first half of systole. The retrograde flow in the coronary artery will be discussed in more detail in the next section.
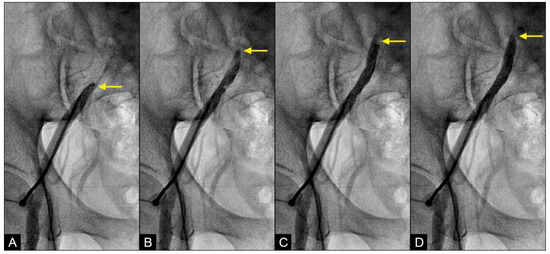
Figure 6.
(A–D) Retrograde flow in the iliac artery. These are consecutive images separated from each other by 0.067 s. (A) Near the end of systole, the contrast (in black) could be seen moving upwards with a blunted, curved head (arrow). (B–D) In each image, separated by 0.67 s, the column of contrast was seen mixed with white-colored blood moving further up with a blunted, curved head (arrow).
At the interface site, there were multiple levels of clashes depending on the level of blood pressure (BP). In cases of both severe systolic and diastolic hypertension (with systolic blood pressure (BP) > 160 mmHg and diastolic BP > 90 mmHg), the interface displayed a flat demarcation line, indicating a strong interaction between uncontrolled diastolic BP (DBP) and systolic BP (SBP) (Figure 7A). In cases of controlled SBP and elevated DBP, the interface appeared with a round proximal head (Figure 7B). In cases where diastolic BP was well controlled (<80 mmHg), there was no retrograde flow.
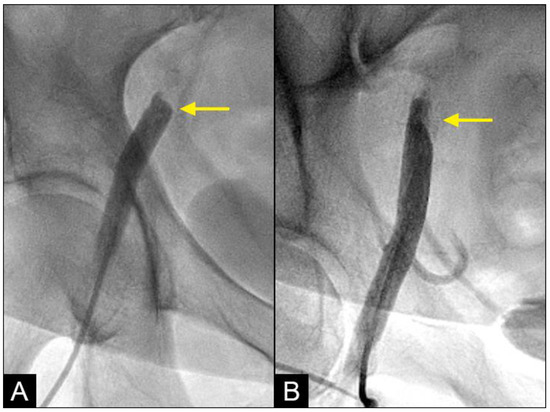
Figure 7.
(A,B) Interface of the collision between the antegrade blood flow and the retrograde contrast flow. The antegrade flow represents the systolic contraction, while the diastolic contrast flow represents the exaggerated peripheral vascular resistance or diastolic blood pressure (DBP). In patient (A), the systolic BP at the time of the iliac angiogram was 185/100 mmHg, while in patient (B), it was 120/90 mmHg.
COLLISION: In the iliac artery, near the end of systole and during the first half of diastole, the retrograde flow was observed moving upwards with a well-defined round head, despite the distinct separation between the two flows (Figure 8A,B). This retrograde flow was not laminar due to the heterogeneous composition of the fluid. There was a slight mixing of white blood and black contrast, with most of the fluid at the proximal head of the retrograde flow appearing predominantly black. The retrograde flow continued upwards (arrow) until it was overridden by the antegrade flow of the subsequent systole (Figure 8C,D). Overall, the interface between the antegrade and retrograde flows exhibited a subtle demarcation line, indicating a gentle interaction between the two opposing forces.
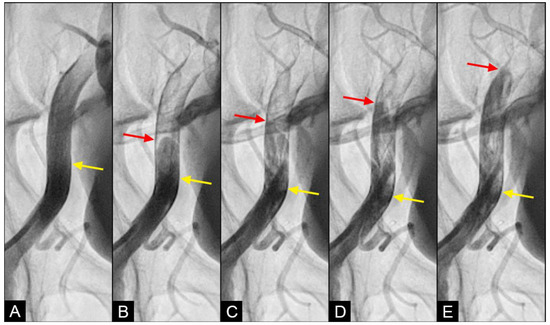
Figure 8.
(A–D) Interface of the collision between the antegrade blood flow and the retrograde contrast flow. These figures are in consecutive sequence. The antegrade flow represents the systolic contraction, while the diastolic contrast flow represents the exaggerated peripheral vascular resistance. (A) The blood advances with a soft, vague tip (yellow arrow). (B) Then, 0.067 s later, the retrograde flow begins to form, slowly pushing upwards (red arrow). (C–E) At the same time, the antegrade flow moves forward slowly (yellow arrow). At the interface, the proximal end of the retrograde flow has a round curve shape suggestive of a soft interaction with the antegrade flow (red arrow). The blood in white still flows forward at a slower pace (yellow arrow), while the retrograde flow moves upwards (red arrow).
In the right coronary artery (RCA), with the novel angiographic technique, during diastole, the antegrade flow was clearly illustrated (Figure 9A–D). The leading edge of the flow was sharp, suggestive of laminar flow (Figure 9C). The speed in diastole was fast, as the blood could traverse from the end of the proximal segment to halfway through the mid-segment in just 0.067 s, equivalent to one image interval (Figure 9D). At this junction, at the onset of systole, the antegrade flow decelerated (yellow arrow), while the mixed black contrast persisted at the location of the transition from diastole to systole (red arrow). This contrast remained until near the end of systole, providing visual evidence of disorganized flow secondary to the interaction between the retrograde and antegrade flows; most likely, it was a collision (Figure 9E–H) (Video S2).
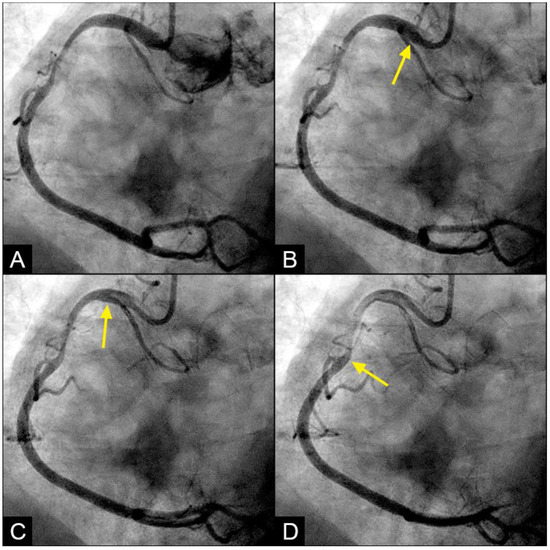
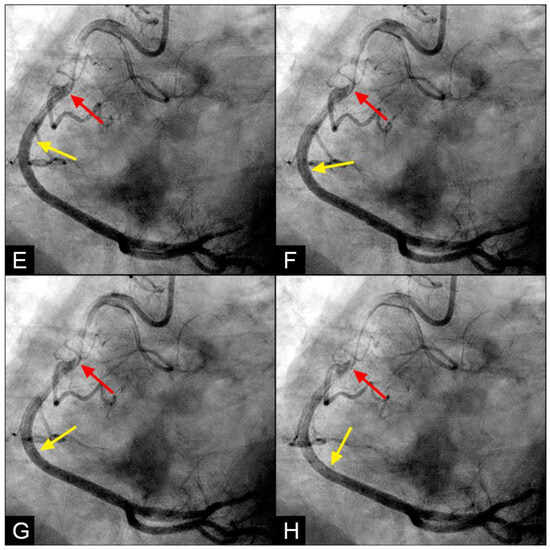
Figure 9.
(A–D) Collision in the RCA. This is a series of eight consecutive images of an angiogram of the right coronary artery (RCA). (A) The artery is filled with contrast. There is a moderate lesion at the mid-segment. (B) The blood (white) is seen entering the ostium of the RCA (arrow). This is the beginning of diastole. (C) The blood (white) is seen at the outer border of the first curve of the RCA (yellow arrow). (D) The blood (white) moves to the mid-segment of the RCA (yellow arrow). (E–H) Collision during the transition to systole. (E) The blood is seen reaching the mid-segment of the RCA (yellow arrow) at the end of diastole and beginning of systole. Here, the blood (white) is mixed with the contrast (black), seen as a random, disorganized black-and-white pattern (red arrow). This is the visual imaging of turbulent flow. (F,G) The contrast (black) concentrates at the mid-segment, at the collision line (red arrow). The contrast is also seen darker in the proximal segment, suggestive of retrograde flow. The antegrade flow still moves forward slowly (yellow arrow). (H) The blood is seen reaching the beginning of the distal segment (yellow arrow). The turbulent flow (mixing black contrast and white blood) is still seen prominently at the collision site, and the retrograde flow is lighter at the mid-segment (red arrow).
VORTEX formation and degeneration: With the novel angiographic protocol, we observed the following phenomena in the iliac artery during systole: At first, the blood (depicted in white) flowed in an antegrade direction, exhibiting a pointed tip of laminar flow that followed the apical curve of the artery (white arrow) (Figure 10A,B). Subsequently, the pointed tip of the blood flow halted abruptly, with all layers recoiling like a collapsing stack of dominoes (white arrow) (Figure 10C). The tip of the flow then twisted and turned on itself, resembling a vortex (white arrow) (Figure 10D). Sixty-seven milliseconds later, this motion dissipated and was replaced by a mass of black contrast (arrowhead) moving in a retrograde direction along the inner curve (Figure 10E). This black contrast mass gradually expanded, indicating the superior strength of the retrograde flow (Figure 10F). The sharp interface between the blood (white) and the contrast (black) suggested a soft contact between the two liquids (Video S3).
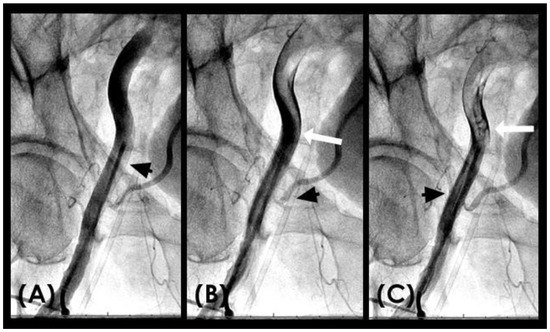
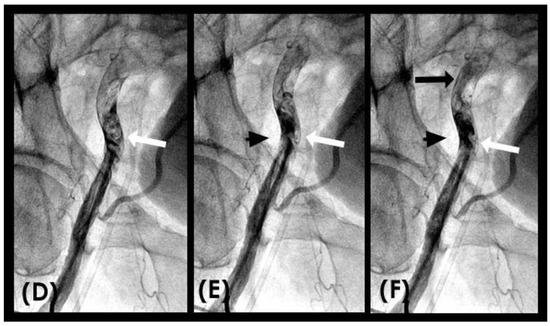
Figure 10.
(A–C) Vortex formation in the iliac artery. This is a sequence of six consecutive angiographic images of the iliac artery. (A) The iliac artery is filled with contrast (in black). (B) Sixty-seven milliseconds later, the blood (homogenously white) is seen moving down with a sharp tip of laminar flow (white arrow). (C) Subsequently, the pointed tip of the blood flow halted abruptly, with all layers recoiling like a collapsing stack of dominoes (white arrow). (D) The tip of the flow then twisted and turned on itself, resembling a vortex. (E,F) This vortical motion dissipated and was replaced by a mass of black contrast (arrowhead) moving in a retrograde direction along the inner curve (black arrow).
5. Discussion
Summary of findings: The preliminary results of this study provide intriguing insights into the hemodynamic flow patterns within the iliac artery and RCA, highlighting the prevalence of laminar and retrograde flows as well as the occurrence of collisions. In the first sub-study on the correlation with blood pressure (BP), there was a statistically significant positive correlation between retrograde flow and diastolic BP > 80 mmHg. In the AI sub-study, the preliminary results showed weak sensitivity and specificity for the machine learning algorithms.
To elaborate, the primary finding highlights the average prevalence of laminar flow and the relatively frequent occurrence of retrograde flow. These results are critical, as retrograde flow is considered pathological and may significantly contribute to the insidious development of atherosclerotic plaque. Another significant finding pertains to the qualitative characteristics of arterial flows, as evidenced through dynamic imaging. These images and videos provide comprehensive data, including fluid composition, flow direction, and movement within the flow or at the interface. This detailed information enables clinician-researchers to gain a deeper understanding of the flow dynamics and their impact on the arterial wall. Additionally, these insights may help to elucidate the mechanisms of flow and fluid mechanical reactions at straight or curved walls or at branch openings, as well as subsequent outcomes such as plaque formation, growth, or regression.
Review of the literature: In the literature review, the search included keywords such as “antegrade laminar flow”, “retrograde flow”, “collision”, and “vortex formation”. However, comprehensive discussions were found only for antegrade laminar flow. Information from Doppler studies primarily provided qualitative insights, such as flow direction, rather than quantitative measurements. Specifically, data were lacking on aspects such as in vivo fluid composition, dynamic flow characteristics, interactions with the arterial wall, and the final status of the flow before re-entry into a new cardiac cycle [17,18,19]. The scarcity of past data is attributed to the lack of prior angiographic techniques capable of displaying in vivo images of complex fluid mechanics coronary flow.
Retrograde flow: In this study, the prevalence and morphological characteristics of the retrograde flow emerged as the most significant and intriguing findings. While retrograde flow is rare in domestic and industrial fluid or air transport systems, it is essential to address and correct it. Conversely, our study revealed that the retrograde flow was relatively common within the iliac arteries and rare in the coronary system. Despite its frequency, the retrograde flow must be prevented due to its potential to cause collisions with degeneration to disorganized flow. The documentation of the retrograde flow in dynamic angiography represents a novel discovery, as it has not been previously reported in the medical literature (Figure 11A,B).
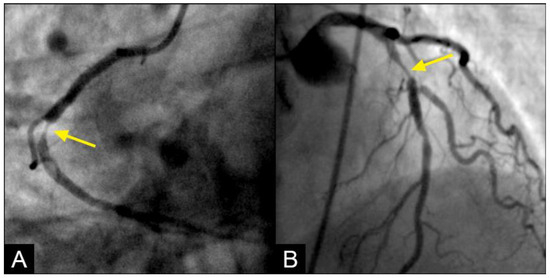
Figure 11.
(A,B) Collision of the retrograde against the antegrade flow with resulting disorganized flow distal to the collision site. (A) In the mid-segment of the right coronary artery, the lesion presents a reversed rat-tail configuration. At the point where the antegrade and retrograde flows converge, the antegrade flow predominates. As a result, plaque formation occurs in the disorganized flow zone created by the weak retrograde flow. The reversed rat-tail configuration indicates that the retrograde force is concentrated at the center, leading to the deposition of debris or plaque growth along its edges, with the force increasing from DISTAL to proximal. (B) In contrast, at the interface between the antegrade and retrograde flows in the left anterior descending artery (LAD), the lesion forms in the disorganized flow zone of the weak antegrade flow, situated in the end of the proximal segment of the LAD, where retrograde flow predominates. The rat-tail configuration suggests that the antegrade force is concentrated at the center, resulting in the deposition of debris or plaque growth along its periphery, with the force increasing from PROXIMAL to distal. One interesting detail in angiographic imaging is that the contrast in the predominating zone is much darker: antegrade zone in (A) and retrograde zone in (B).
Upon further analysis of the retrograde flow in the iliac artery, the primary morphological characteristic observed is a heterogeneous mixture of blood and contrast medium at its proximal end, indicative of disorganized, non-laminar flow. Additionally, the proximal end exhibits a round shape, in contrast to the typical pointing tip of the laminar flow, suggesting a diffuse impact. This morphology implies an oblique interaction at the interface where antegrade and retrograde forces converge, likely resulting in coordinated synergistic effects rather than a direct head-on collision. Notably, the retrograde flow initiates in the distal iliac artery and progresses upward gradually. This phenomenon resembles a water hammer event (Figure 12), where the merging forces generate a retrograde-reflection pressure wave while the antegrade flow continues forward at a slower pace (Figure 8A–D).
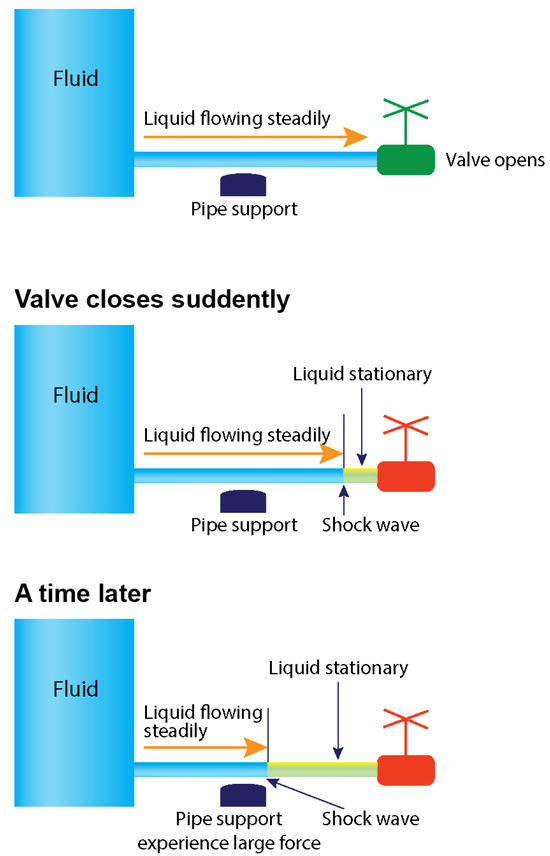
Figure 12.
Water hammer event. The sequence of antegrade and retrograde flows results in a collision and shock waves when the distal valve of a pipe is abruptly closed. Water hammer shock occurs when there is an abrupt change in velocity or flow direction in the pipe systems, such as power failure, main breaks, pump start-up and shut-down operations, check-valve slam, rapid demand variation, and opening and closing of fire hydrants, as a pressure wave propagates in the pipe [5].
Impact of uncontrolled blood pressure: The second key finding concerns the impact of uncontrolled systolic and diastolic blood pressure. The current guidelines recommend maintaining systolic and diastolic blood pressure below 120/80 mmHg, based on population studies [20]. Our sub-study, however, indicated that retrograde flow was a direct consequence of uncontrolled hypertension. Specifically, retrograde flow was observed in the iliac artery due to uncontrolled diastolic blood pressure (DBP) and in the coronary artery due to uncontrolled systolic blood pressure (SBP). Nonetheless, the occurrence of retrograde flow was infrequently common, and collisions were even rarer. When DBP was optimally maintained below 80 mmHg, there was no observed reversed iliac flow.
Vortex formation and degeneration to disorganized flow: In the iliac artery, near the end of systole and in the first half of diastole, the systolic antegrade flow can encounter the retrograde flow due to elevated peripheral vascular resistance, as indicated by diastolic blood pressure. This interaction can result in a collision, occasionally leading to the formation of vortices, characterized by an organized swirling motion of black contrast and white blood. Over time, these vortices may evolve into a fully disorganized flow structure (Figure 13A). This raises the following question: How and where does disorganized flow impact the iliac artery?
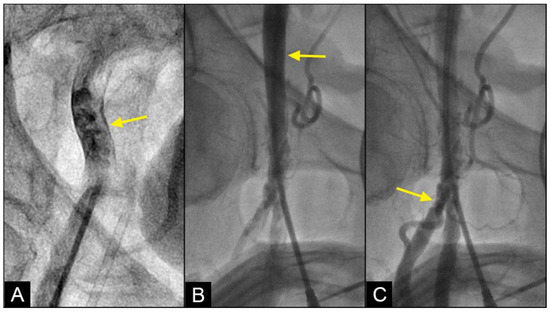
Figure 13.
(A) Disorganized flow is identified as an unorganized and aimlessly moving mix of contrast in black and blood in white color at or around the collision site (yellow arrow). (B) While the disorganized flow happens at the mid-iliac artery, this area is devoid of lesion (yellow arrow). (C) The lesions are seen frequently in the distal common femoral artery and the bifurcation area with the superficial femoral artery (SFA) and deep femoral artery (DFA). Far away from the bifurcation area, the distal segments of the SFA and DFA have minimal lesions.
In pumps and pipes, the principal mechanism by which turbulence causes damage is through the generation of fluid-induced vibrations, which lead to mechanical stress and material fatigue. Such stresses can compromise the structural integrity of the pipe, increasing the likelihood of failure, particularly at stress-concentration points such as fittings, valves, and bends. Furthermore, turbulence can contribute to erosion and corrosion of the pipe material, especially where high-velocity flow impacts the pipe surface, resulting in substantial shear stress [21]. In the iliac arteries, disorganized flow can inflict mechanical damage on the arterial wall, particularly at branching points or regions of stenosis where flow velocity is elevated. While disorganized flow is observed at the mid-segment of the iliac artery, lesions are more commonly found at the junction with the superficial femoral artery (SFA) and at the bifurcation with the deep femoral artery (DFA) (Figure 13B,C). This difference is attributed to the iliac artery’s ability to flex, twist, or turn in response to variations in the velocity and pressure of disorganized flow, whereas the distal SFA and PFA, more confined within Scarpa’s triangle, lack the flexibility to accommodate shear stresses. Consequently, the endothelial layers at the bifurcations with the SFA and DFA are exposed to persistent disorganized flow, leading to endothelial injury and possible subsequent development of atherosclerosis. This situation is aggravated further because of substantial mechanical stress from repetitive hip flexion and extension [22].
In the right coronary artery (RCA) angiogram, the convergent point of the retrograde and antegrade flows occurred at the location of the transition from diastole to systole. At this juncture, the interaction between the opposing flows was not prominently displayed, likely due to the small caliber of the coronary artery, which averages 2–3.5 mm in diameter. Consequently, current imaging techniques are insufficient to accurately capture and document vortex formation or swirling fluid motion and the subsequent transitions or degenerations. As a result, in the coronary artery, the swirling flow pattern could not be clearly delineated, and only disorganized flow was observed.
Cyclic stress: In pumps and pipes, recurrent cyclic mechanical stress denotes the repeated loading and unloading of a material or structure over an extended period. In iliac or coronary arteries, vortices or disorganized flow are usually transient, owing to the rapid cyclic fluctuations between systole and diastole, which occur at least 40 times per minute. As a result, in our study of fluid mechanics within arteries, the cyclic emergence and dissipation of laminar and disorganized flows produce cyclic stress rather than sustained turbulence.
Clinical applications: Retrograde flow plays a crucial role in the progression of collision events that lead to disorganized flow, possibly initiating a cascade resulting in atherosclerosis. Pressure and velocity fluctuations within disorganized flow zones are exacerbated by uncontrolled systolic hypertension and peripheral vascular resistance (diastolic hypertension). Therefore, the primary clinical approach is to manage blood pressure. The following question arises: How tightly should blood pressure be controlled? Clinical guidelines recommend maintaining blood pressure below 120/80 mmHg.
Our sub-study elucidates the clinical mechanism: when diastolic blood pressure (DBP) was below 80 mmHg, the retrograde flow was absent in the iliac artery, and when systolic blood pressure (SBP) was below 120 mmHg, collisions were most likely minimal or absent in the right coronary artery. Further investigation is warranted to determine an appropriate threshold that maximizes benefits by minimizing or eliminating hemodynamic collisions in the coronary arteries, iliac arteries, or cerebral arteries, thereby reducing the incidence of acute coronary syndrome, critical limb ischemia, or transient ischemic attacks [23].
CONCLUSIONS: Based on the concept that the cardiovascular system is a network of pumps and pipes, this research methodology provides intriguing insights into arterial flow behaviors by integrating fluid mechanics practices with novel angiographic observations. This study identifies laminar flow as the predominant pattern, with retrograde flow and collisions occurring infrequently. The implications of vortex, collision, and disorganized flow highlight potential mechanisms for endothelial damage and atherosclerosis initiation. Moreover, the correlation with blood pressure underscores the critical role of hypertension management in preventing adverse hemodynamic events. Future directions include refining imaging techniques and further exploring the mechanistic links between flow dynamics and vascular pathophysiology to enhance diagnostic and therapeutic strategies for cardiovascular diseases.
LIMITATIONS: The limitations of this study encompass its retrospective design, the employment of a novel approach incorporating AI support (without external validation), and a small study population. Consequently, the primary aim of the results is to introduce a new concept and describe the novel findings, rather than to establish a definitive cause-and-effect relationship. This study’s robustness is obviously lower compared to those based on large-population case–control prospective cohort studies or randomized clinical trials, where potential unmeasured confounding factors can be more effectively controlled.
FUTURE DIRECTIONS: Future research should prioritize collecting more robust data through randomized controlled trials and longitudinal studies to validate the above preliminary findings. It is essential to comprehensively investigate the long-term impacts of flow dynamics on the arterial intima. Addressing confounding biases and developing personalized approaches to blood pressure management based on individual flow dynamics are critical steps towards advancing clinical applications and preventing the progression of arterial lesions. Our current efforts aim to establish a foundation for a future where treatments for patients with coronary artery disease are precisely tailored based on their pathological fluid mechanics profiles [24,25,26,27,28]. However, extensive research (case–control prospective cohorts, randomized control trials, etc.) with a larger population is required to assess the efficacy and impact of this approach before its full potential can be realized.
Supplementary Materials
The following supporting information can be downloaded at https://www.mdpi.com/article/10.3390/fluids9100222/s1: Video S1. Normal laminar flow; Video S2. Baseline flow in right coronary artery with lesion at mid-segment; Video S3. Vortex.
Author Contributions
Conceptualization of paper: T.N., V.T.L., C.M.G. and H.D.N.; Methodology: T.N., V.T.L., C.M.G. and H.D.N.; Images: H.Q.N., T.H.T.D., V.T.L. and H.D.N.; Data input: V.T.L., H.D.N., H.Q.N., T.H.T.D., T.L., N.V. and V.L.; Data analysis: T.N., V.T.L., K.N., H.D.N., N.V., T.Q.T.L. and Q.T.N.N.; Writing manuscript: T.N., V.T.L., H.D.N., K.N., C.D., H.V.K.D., D.Q.H. and T.T.; Critical appraisal of manuscript: H.T., C.M.G., G.R., M.Z., H.V.K.D., M.K., H.H.T., D.Q.H., M.A. and A.N.; Supervision and oversight: T.N. and V.T.L.; Project administration: V.T.L. and T.N. All authors have read and agreed to the published version of the manuscript.
Funding
This research received no external funding.
Institutional Review Board Statement
The study was conducted in accordance with the Declaration of Helsinki, and the protocol was approved by the Ethics Committee of Tân Tạo University (TTU.RS.24.302.009, 26 June 2024).
Informed Consent Statement
Patient consent was waived due to retrospective chart review protocol.
Data Availability Statement
The original contributions presented in this study are included in the article. Further inquiries can be directed to the corresponding author.
Conflicts of Interest
The authors declare no conflicts of interest.
References
- Stefanadis, C.; Antoniou, C.K.; Tsiachris, D.; Pietri, P. Coronary Atherosclerotic Vulnerable Plaque: Current Perspectives. J. Am. Heart Assoc. 2017, 6, e005543. [Google Scholar] [CrossRef] [PubMed] [PubMed Central]
- Badimon, L.; Vilahur, G. Thrombosis formation on atherosclerotic lesions and plaque rupture. J. Intern. Med. 2014, 276, 618–632. [Google Scholar] [CrossRef] [PubMed]
- Young, D.F.; Tsai, F.Y. Flow characteristics in models of arterial stenoses. I. Steady flow. J. Biomech. 1973, 6, 395–410. [Google Scholar] [CrossRef] [PubMed]
- Gijsen, F.; Katagiri, Y.; Barlis, P.; Bourantas, C.; Collet, C.; Coskun, U.; Daemen, J.; Dijkstra, J.; Edelman, E.; Evans, P.; et al. Expert recommendations on the assessment of wall shear stress in human coronary arteries: Existing methodologies, technical considerations, and clinical applications. Eur. Heart J. 2019, 40, 3421–3433. [Google Scholar] [CrossRef] [PubMed] [PubMed Central]
- Nguyen, T.; Ngo, K.; Vu, T.L.; Nguyen, H.Q.; Pham, D.H.; Kodenchery, M.; Zuin, M.; Rigatelli, G.; Nanjundappa, A.; Gibson, M. Introducing a Novel Innovative Technique for the Recording and Interpretation of Dynamic Coronary Angiography. Diagnostics 2024, 14, 1282. [Google Scholar] [CrossRef] [PubMed]
- Nguyen, T.N.; Talarico, E.F., Jr.; Phúc, L.X.M.; Nguyen, D.K.; Luscomb, R., Jr.; Nguyen, T.H. The-Hung Nguyen Chapter 2: Dynamic Coronary Angiography and Flow. In Practical Handbook of Advanced Interventional Cardiology; Nguyen, T.N., Chen, S.L., Kim, M.-H., Pinto, D.S., Grines, C.L., Gibson, C.M., Talarico, E.F., Jr., Eds.; Wiley Blackwell: Oxford, UK, 2020; pp. 29–72. [Google Scholar]
- Nguyen, T.; Nguyen, D.H.; Vu, L.T.; Nguyen, H.Q.; Le, T.N.; Kieu, T.N.; Dinh, H.V.; Le, L.K.; Nguyen, N.T.; Nguyen, T.; et al. New Techniques of Recording and Interpretation of Dynamic Coronary Angiography. TTU J. Biomed. Sci. 2023, 2, 1–8. [Google Scholar] [CrossRef]
- Faith, R.E.; Hessler, J.R. 10. Housing and Environment. In The Laboratory Rat, 2nd ed.; Suckow, M.A., Weisbroth, S.H., Franklin, C.L., Eds.; American College of Laboratory Animal Medicine (AP): Amsterdam, The Netherland; Boston, MA, USA, 2006. [Google Scholar]
- Avila, M.; Barkley, D.; Hof, B. Transition to Turbulence in Pipe Flow. Annu. Rev. Fluid Mech. 2023, 55, 575–602. [Google Scholar] [CrossRef]
- Dwivedi, P.N. Particle-fluid mass transfer in fixed and fluidized beds. Ind. Eng. Chem. Process Des. Dev. 1977, 16, 157–165. [Google Scholar] [CrossRef]
- Enayet, M.M.; Gibson, M.M.; Taylor, A.M.K.P.; Yianneskis, M. Laser-Doppler Measurements of Laminar and Turbulent Flow in a Pipe Bend. Int. J. Heat Fluid Flow 1982, 3, 213–219. [Google Scholar] [CrossRef]
- Selvarajah, A.; Bennamoun, M.; Playford, D.; Chow, B.J.W.; Dwivedi, G. Application of Artificial Intelligence in Coronary Computed Tomography Angiography. Curr. Cardiovasc. Imaging Rep. 2018, 11, 12. [Google Scholar] [CrossRef]
- Nobre Menezes, M.; Silva, J.L.; Silva, B.; Rodrigues, T.; Guerreiro, C.; Guedes, J.P.; Santos, M.O.; Oliveira, A.L.; Pinto, F.J. Coronary X-ray angiography segmentation using Artificial Intelligence: A multicentric validation study of a deep learning model. Int. J. Cardiovasc. Imaging 2023, 39, 1385–1396. [Google Scholar] [CrossRef] [PubMed]
- Zuo, Q.; Chen, S.; Wang, Z.; Zhang, L. R2AU-Net: Attention Recurrent Residual Convolutional Neural Network for Multimodal Medical Image Segmentation. Secur. Commun. Netw. 2021, 2021, 6625688. [Google Scholar] [CrossRef]
- Dosovitskiy, A.; Beyer, L.; Kolesnikov, A.; Weissenborn, D.; Zhai, X.; Unterthiner, T.; Dehghani, M.; Minderer, M.; Heigold, G.; Gelly, S.; et al. An image is worth 16 × 16 words: Transformers for image recognition at scale. arXiv 2020, arXiv:2010.11929. [Google Scholar]
- Kobayashi, T. Two-Way Multi-Label Loss. In Proceedings of the 2023 IEEE/CVF Conference on Computer Vision and Pattern Recognition (CVPR), Vancouver, BC, Canada, 17–24 June 2023; pp. 7476–7485. [Google Scholar]
- Schroder, J.; Prescott, E. Doppler Echocardiography Assessment of Coronary Microvascular Function in Patients with Angina and No Obstructive Coronary Artery Disease. Front. Cardiovasc. Med. 2021, 8, 723542. [Google Scholar] [CrossRef] [PubMed]
- Doucette, J.W.; Corl, P.D.; Payne, H.M.; Flynn, A.E.; Goto, M.; Nassi, M.; Segal, J. Validation of a Doppler guide wire for intravascular measurement of coronary artery flow velocity. Circulation 1992, 85, 1899–1911. [Google Scholar] [CrossRef]
- Joye, J.D.; Schulman, D.S.; Lasorda, D.; Farah, T.; Donohue, B.C.; Reichek, N. Intracoronary Doppler guide wire versus stress single-photon emission computed tomographic thallium-201 imaging in assessment of intermediate coronary stenoses. J. Am. Coll. Cardiol. 1994, 24, 940–947. [Google Scholar] [CrossRef] [PubMed]
- Flack, J.M.; Adekola, B. Blood pressure and the new ACC/AHA hypertension guidelines. Trends Cardiovasc. Med. 2020, 30, 160–164. [Google Scholar] [CrossRef] [PubMed]
- Baldwin, R.M.; Simmons, H.R. Flow induced vibration in safety relief valves. J. Press. Vessel. Technol. 1986, 108, 267–272. [Google Scholar] [CrossRef]
- Desyatova, A.; MacTaggart, J.; Romarowski, R.; Poulson, W.; Conti, M.; Kamenskiy, A. Effect of aging on mechanical stresses, deformations, and hemodynamics in human femoropopliteal artery due to limb flexion. Biomech. Model. Mechanobiol. 2018, 17, 181–189. [Google Scholar] [CrossRef] [PubMed]
- Hsu, W.; Nguyen, T.; Le, T.; Pham, T.; Le, T.; Dang, C.; Nguyen, B.; Vu, P.; Cao, T.; Vu, L.; et al. What are the ideal systolic and diastolic blood pressure which do not injure the intima of iliac and coronary arteries? Eur. Heart J. 2022, 43 (Suppl. S2), ehac544.2176. [Google Scholar] [CrossRef]
- Nguyen, T.N.; Lam, N.M.; Truyen, T.T.T.T.; Vu, L.; Talarico, E.; Le, T.; Pham, T.H.; Pham, H.N.; Ho, D.T.; Cao, T.; et al. Beta-Blockers Prevent Acute Myocardial Infarction By Distal Vasoconstriction And Slower Speed In Proximal Segment: An Angiographic And Machine Learning Analysis. J. Am. Coll. Cardiol. 2022, 79 (Suppl. S9), 1029. [Google Scholar] [CrossRef]
- Truyen, T.T.; Ho, D.T.; Vu, L.T.; Le, D.C.; Zuin, M.; Nguyen, T.; Pham, H.N.; Rigatelli, G.; Cao, T. CRT-500.15 Functional Restoration of Laminar Flow Prevented Late In-Stent Restenosis Better Than Anatomical Coronary Cosmetic Reconstruction: An Angiographic, Artificial Intelligence, and Machine Learning Analysis. J. Am. Coll. Cardiol. 2022, 15 (Suppl. S4), S48–S49. [Google Scholar] [CrossRef]
- Vu, P.; Hsu, W.; Antunes, M.M.; Pham, T.; Vu, L.; Tran, N.; Aggarwal, S.; Mihas, I.; Agarwal, S.; Nguyen, T.; et al. TCT-144 Laminar Flow After Stenting Assured No Early Thrombosis nor Late In-Stent Restenosis: An Angiographic Machine Learning Analysis and Personalized Medicine Approach. J. Am. Coll. Cardiol. 2022, 80 (Suppl. S12), B58–B59. [Google Scholar] [CrossRef]
- Nguyen, T.; Nguyen, H.Q.; Vu, L.O.C.; Vo, M.; Hoang, T.A.; Mihas, I.; Agarwal, S. CRT-500.11 the Length of the Right Coronary Artery Decided Where a Lesion Is Located: A Dynamic Angiographic Coronary Flow and Machine Learning Analysis. J. Am. Coll. Cardiol. 2023, 16 (Suppl. S4), S67–S68. [Google Scholar] [CrossRef]
- Vu, L.; Mai, M.; Huynh, T.; Nguyen, H.; Trinh, H.; Anh, V.T.V.; Vu, V.; Ho, D.T.; Nguyen, T.N.; Mai, A.T. The Coanda Effect Caused Turbulence and Damaged the Intima at the Middle Coronary Segment. J. Am. Coll. Cardiol. 2023, 81 (Suppl. S8), 1418. [Google Scholar] [CrossRef]
Disclaimer/Publisher’s Note: The statements, opinions and data contained in all publications are solely those of the individual author(s) and contributor(s) and not of MDPI and/or the editor(s). MDPI and/or the editor(s) disclaim responsibility for any injury to people or property resulting from any ideas, methods, instructions or products referred to in the content. |
© 2024 by the authors. Licensee MDPI, Basel, Switzerland. This article is an open access article distributed under the terms and conditions of the Creative Commons Attribution (CC BY) license (https://creativecommons.org/licenses/by/4.0/).