Abstract
Numerical techniques have been developed to study flow structures in the wake behind a tapered circular cylinder via computational fluid dynamics. The Reynolds number, based on the mean diameter of the tapered cylinder, is 4 × 10³; here, the boundary layer on the cylinder surface is laminar before separating into a turbulent wake. In order to model this transient turbulent flow, a large eddy simulation was adopted and vortex-shedding frequencies were determined using the fast Fourier transform. The fundamental behaviors of the cellular distributions of vortex-shedding frequencies, mechanisms of vortex splitting and the vortex cell reorganization were addressed. Two constant-frequency vortex cells were observed in the operating Reynolds number, and the respective Strouhal numbers were validated experimentally. Numerical flow visualizations showed that the spanwise shedding vortices are well aligned, whereas the vortex splitting seems to disconnect vortex lines. The pressure coefficients at specific zones and angular positions of the tapered cylinder were illustrated to explore the correlation of pressure variation with vortex shedding. The results showed that the vortex splitting initiates and completes at boundary-layer separation. Furthermore, numerical techniques are elaborated on for readers to tackle similar problems.
1. Introduction
The behavior of the wake flow trailing a slender vehicle at a steep angle of attack bears a strong resemblance to the flow behind a circular cylinder oriented transversely, which undergoes Karman vortex shedding [1]. A study of the bluff-body wake is important in flow control especially with a body at a high angle of attack. Besides, most objects facing the flow are bluff in the front so the wind or stream is severely disturbed to produce unsteady forces and moments acting on them. Common examples of a flow passing over a fore-body include the tapered wing of an aircraft, a high-rise building, or even chimneys. Typically, these entities are limited in length and open-ended in the free stream. The associated flow field is of a three-dimensional nature. In practical scenarios, the cross-sectional area of these entities may exhibit variations in the spanwise direction.
Gaster [2] initially conducted a comprehensive study on the vortex-shedding patterns in the wakes behind slender cones and tapered cylinders. The wake’s velocity fluctuations are amplitude-modulated, with the modulation frequency maintaining near constancy across the spanwise direction. Gaster further demonstrated that the vortex-shedding frequency’s spanwise distribution exhibits a cellular pattern, with velocity fluctuations undergoing modulation at the juncture of adjacent cells [3]. The unique circumstance where vortices are not aligned between neighboring cells is referred to as “vortex splitting” by Eisenlohr and Eckelmann [4]. Piccirillo and Van Atta [5] found that vortex splitting began with a kink in vortex lines and suggested that the mechanism leading to vortex splitting might involve a spanwise pressure gradient. Besides, a two-dimensional (2-D) circular cylinder can generate a cellular frequency distribution resulting from end effects or the non-uniformity of oncoming flow [4,6,7]. Hsiao and Chiang [8] experimentally found two to three constant-frequency vortex cells in the shedding vortices generated along the spanwise direction of tapered circular cylinders at Reynolds numbers over 10,000 with hot-wire anemometry. In the experiment on a trapezoidal cylinder with an aspect ratio of 4.7, Miau et al. [9] concluded that the low-frequency fluctuations observed in the near-wake region exhibit a global characteristic, which could be linked to the spanwise motions in the separated shear layer. Peng et al. [10] conducted an experimental study concerning vortex shedding from a circular cylinder with a slit normal to the stream. They found that the slit in the circular cylinder does weaken the coherence of the shedding vortex. Visscher et al. [11] applied particle image velocimetry to provide more spatial information than point-based measurements and offer insight into Reynolds numbers of 1250, 2500, and 5000. According to their observations, the shape and position of the vortex-formation region were found to be in accordance with findings from uniform cylinders, while the local Strouhal numbers (St) show some fundamental variation due to the locally varying diameter. Seyed-Aghazadeh et al. [12] conducted a series of experiments in a re-circulating water tunnel with an open surface test section for a Reynolds number range of 370–2300. Hybrid shedding modes were observed for cases with velocities up to the value corresponding to the peak amplitude of oscillations.
One of the questions that arises with the cellular distribution of vortex-shedding frequencies is how the vortices link between cells with different frequencies. The vortex lines are aligned through the whole span if the shedding frequency is uniformly distributed, e.g., the vortices in the wake behind a 2-D circular cylinder. However, the distribution of shedding frequencies is cellular in the wake behind a tapered cylinder, and the numbers of shedding vortices generated in different cells are not the same at a certain period of time. Thus, it is impossible to always align the vortex lines throughout the entire span. Clearly, the flow structures in the intersection region of the neighboring cells require more exploration of vortex splitting.
Numerical simulations are becoming increasingly popular in engineering across various industries. Computational fluid dynamic (CFD) analyses are widely employed to predict flow fields for engineering design and to overcome experimental limitations. In this study, the Semi-Implicit Method for Pressure Linked Equations (SIMPLE) algorithm, developed by Patankar for solving incompressible flow, was utilized [13,14]. Besides, to generate a turbulent wake for vortex-shedding simulations, turbulent flow was modeled numerically with a high Reynolds number. Computations for this transient problem can be traced back to Jespersen and Levit [15]. They computed low Reynolds number flow (local Re < 137.23) past a tapered cylinder in a wind tunnel. VallÈS et al. solved full unsteady three-dimensional Navier–Stokes equations numerically to explore the vortex-shedding phenomena along the span of the cylinder [16]. In their research, the Reynolds number based on the velocity of the incoming flow was in the range from 130 to 180. However, the entire flow fields prevailing in such low Reynolds numbers are laminar flows. A turbulent wake in the high-Reynolds-number regions is common in real engineering problems. It corresponds to a Reynolds number greater than 300 or so. Parnaudeau et al. [17] performed three-dimensional direct numerical simulations of vortex shedding behind cylinders when the body diameter and the incoming flow involved spanwise linear non-uniformity. Their computations highlighted distinct vortical features between the shear case and the tapered case. Both cases yielded similarities in flow topology. In our previous work [18], flow fields of a vortex flowmeter with various inflow conditions were simulated numerically via large eddy simulation (LES). The results show that the predominant frequency patterns are altered due to various inlet velocity profiles with the constant-shape vortex generator in a spanwise direction; however, no multiple cells were observed.
The objective of this paper is to explore the characteristics of cellular vortical structures behind a tapered cylinder with a Reynolds number of 4000. This paper studied vortex line structure unalignment or “vortex splitting” via numerical flow visualization techniques. The CFD code of ANSYS FLUENT was used to solve the turbulent flow modeled via LES with a tapered cylinder installed in a wind tunnel. The Strouhal numbers obtained based on the numerical results were validated using experimental data, and then, the numerical methods were further used to analyze the transient phenomena of the vortex splitting mechanism. This study validates the numerical results via experimental data and analyzes the transient phenomena of the flow field. The governing equations and boundary and initial conditions are described in Section 2. Section 2 outlines the governing equations along with the boundary and initial conditions. Section 3 details the numerical methods used for the simulation, including grid-independent tests for verification and experimental validation. The results and discussions are presented in Section 4, while Section 5 provides a summary of the conclusions.
2. Physical Model and Governing Equations
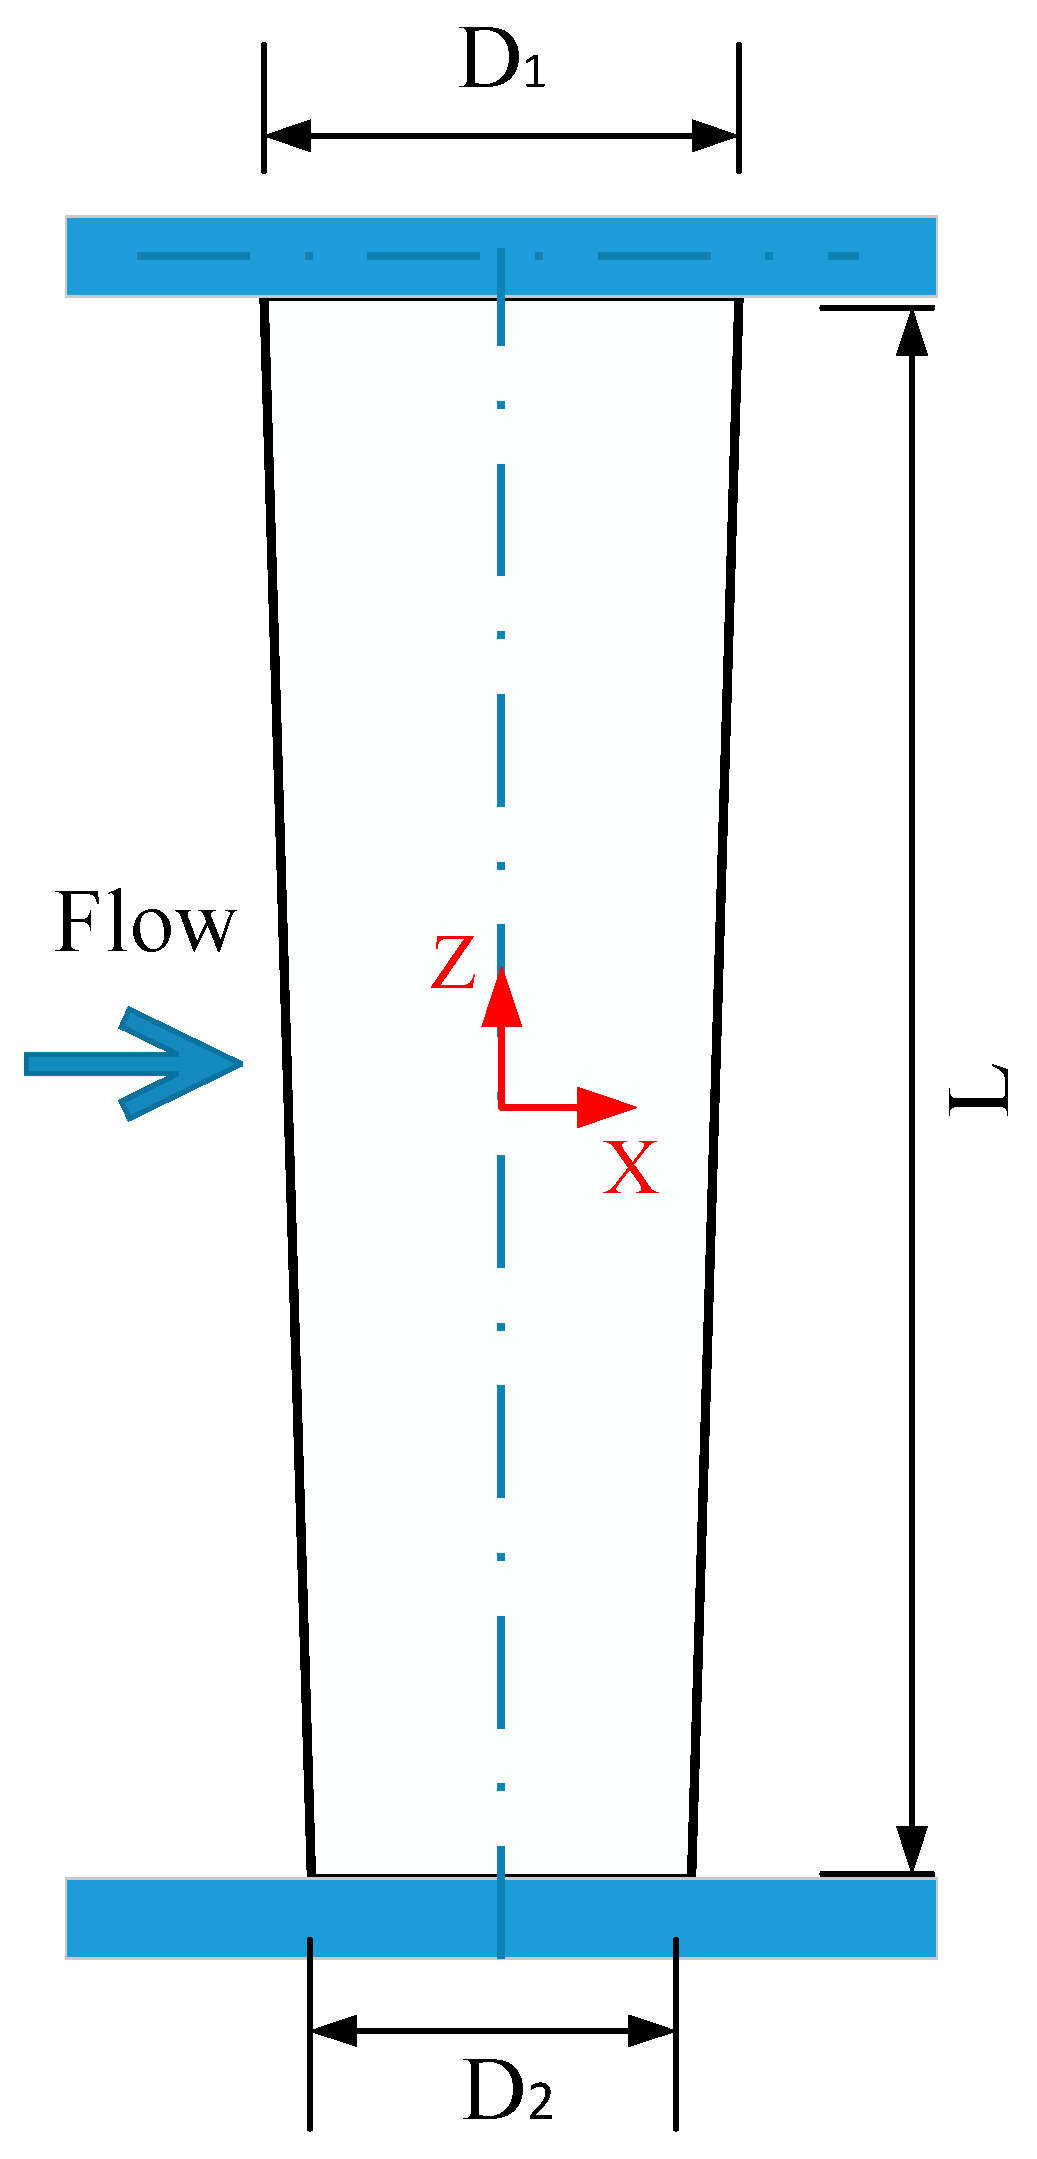
The primary distinction between the wakes behind tapered and 2-D circular cylinders lies in the spanwise alterations in vortex-shedding frequencies. In this context, the distribution of the vortex-shedding frequency across the span was examined to accurately characterize the cellular vortex-shedding phenomenon. The experiments for comparisons were conducted in a low-speed suction-type wind tunnel as shown in Figure 3 of Ref. [8]. Additionally, a block diagram of the measuring and data acquisition system is illustrated in Figure 5 of Ref. [8]. The cross-section of the test section is 0.2 m wide and 0.4 m high with air as the working fluid. The taper ratio based on Gaster [2] and Noack et al. [19] is defined by and , where L is the span length of the tapered cylinder and is the mean diameter with D1 and D2 as the maximum and minimum diameters, respectively. The inlet Reynolds number is 4000 based on with a turbulence intensity less than 0.5%. The Cartesian coordinate system shown in Figure 1 was used throughout the numerical simulations and experimental validation.
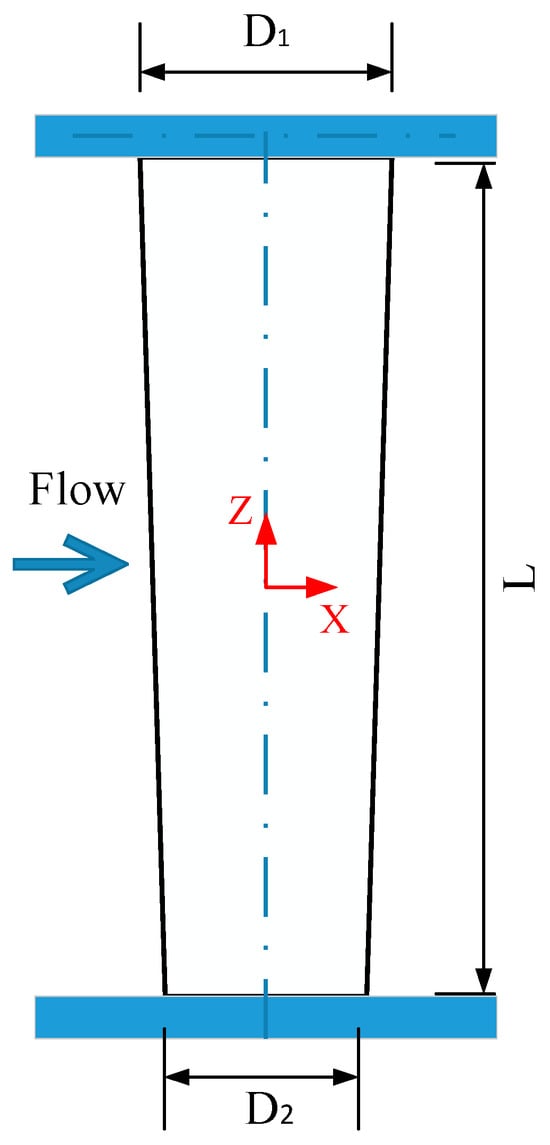
Figure 1.
Physical model for the coordinate system of the tapered cylinder.
The CFD simulation was simplified to model a transient, incompressible, turbulent flow with no heat generation. Non-slip boundary conditions were applied to the walls of both the duct and the tapered cylinder. The transient conservation equation for transport of a scalar quantity ϕ is written in integral form for an arbitrary control volume V as follows [20]:
Here, ρ indicates density; is the velocity vector; is the surface area vector; V is volume; Γ is the diffusion coefficient for ϕ, and Sϕ is the source term of ϕ per unit volume. The symbol ϕ can be replaced by 1 for the continuity equation, and u, v and w are the momentum equations in the X, Y and Z directions, respectively.
The Reynolds number is 4000 in the wind tunnel in which the boundary layer on the fore surface of the cylinder is laminar, but the wake is turbulent [8]. Since the fluid used in the present simulations was air, the density was assumed to be constant in the flow field for air speeds far less than a 0.3 Mach number. We also calculated turbulent flows via LES, which is one of the trustworthy computational tools for studying turbulent flow fields [21,22,23]. Equation (1) can be reformulated in terms of generalized coordinates by employing the finite volume method for numerical simulation.
The discretized formulation for each cell (control volume) based on Equation (1) yields
where f denotes the face of the control volume and is the face area; Nf is the number of faces enclosing cell; is the velocity of flux; and V is the volume of the control volume. After combining boundary conditions, Equation (2) can be linearized and expressed in the computational domain as follows:
where the subscript nb refers to neighboring cells; ap and anb are the linearized coefficients for ϕ and ϕnb; and b is the source term. The number of neighbors for each cell depends on the grid topology but will typically equal the number of faces enclosing the cell. Similar equations can be written for each cell in the grid, and this results in a set of algebraic equations to be solved using the SIMPLE algorithm [13].
In experimental measurements [8], the major device needed for velocity fluctuations was the constant-temperature hot-wire anemometer. This method can identify the dominant vortex-shedding frequencies by detecting velocity fluctuations in the flow field. However, our numerical approach focused on capturing the waveform of the total lift coefficient (Cl = F/(0.5ρv2A); F is lift) by directly integrating the surface of the tapered cylinder over a time period. The power spectral density of the lift-coefficient fluctuation can be calculated using a fast Fourier transform (FFT) method [24], which allows for the identification of the dominant frequency. The Strouhal number is defined as , where f is the predominant vortex-shedding frequency.
3. Numerical Methodology
To investigate the structure of vortex splitting, the signal generated by the tapered cylinder was numerically analyzed to obtain frequency characteristics using pre- and post-CFD techniques. Calculations were performed with ANSYS FLUENT ver. 18 with a desktop computer and a workstation. A standard case tested in the computer with a CPU 7–3960X@3.30 GHz and 4 × 8 GB DDR3-1333 took three weeks; a workstation with 2 × Intel Xeon E5-2620v4 8cores 2.1 GHz and 4 × 32 GB DDR4-2133 ECC RDIMM (Intel, Santa Clara, CA, USA) took three days using the parallel computations by sharing memory allocations on the local machine. Nevertheless, the workstation hardware still requires approximately 3 days for one case, even in single-precision mode, because simulating transient turbulent flow is very time-consuming.
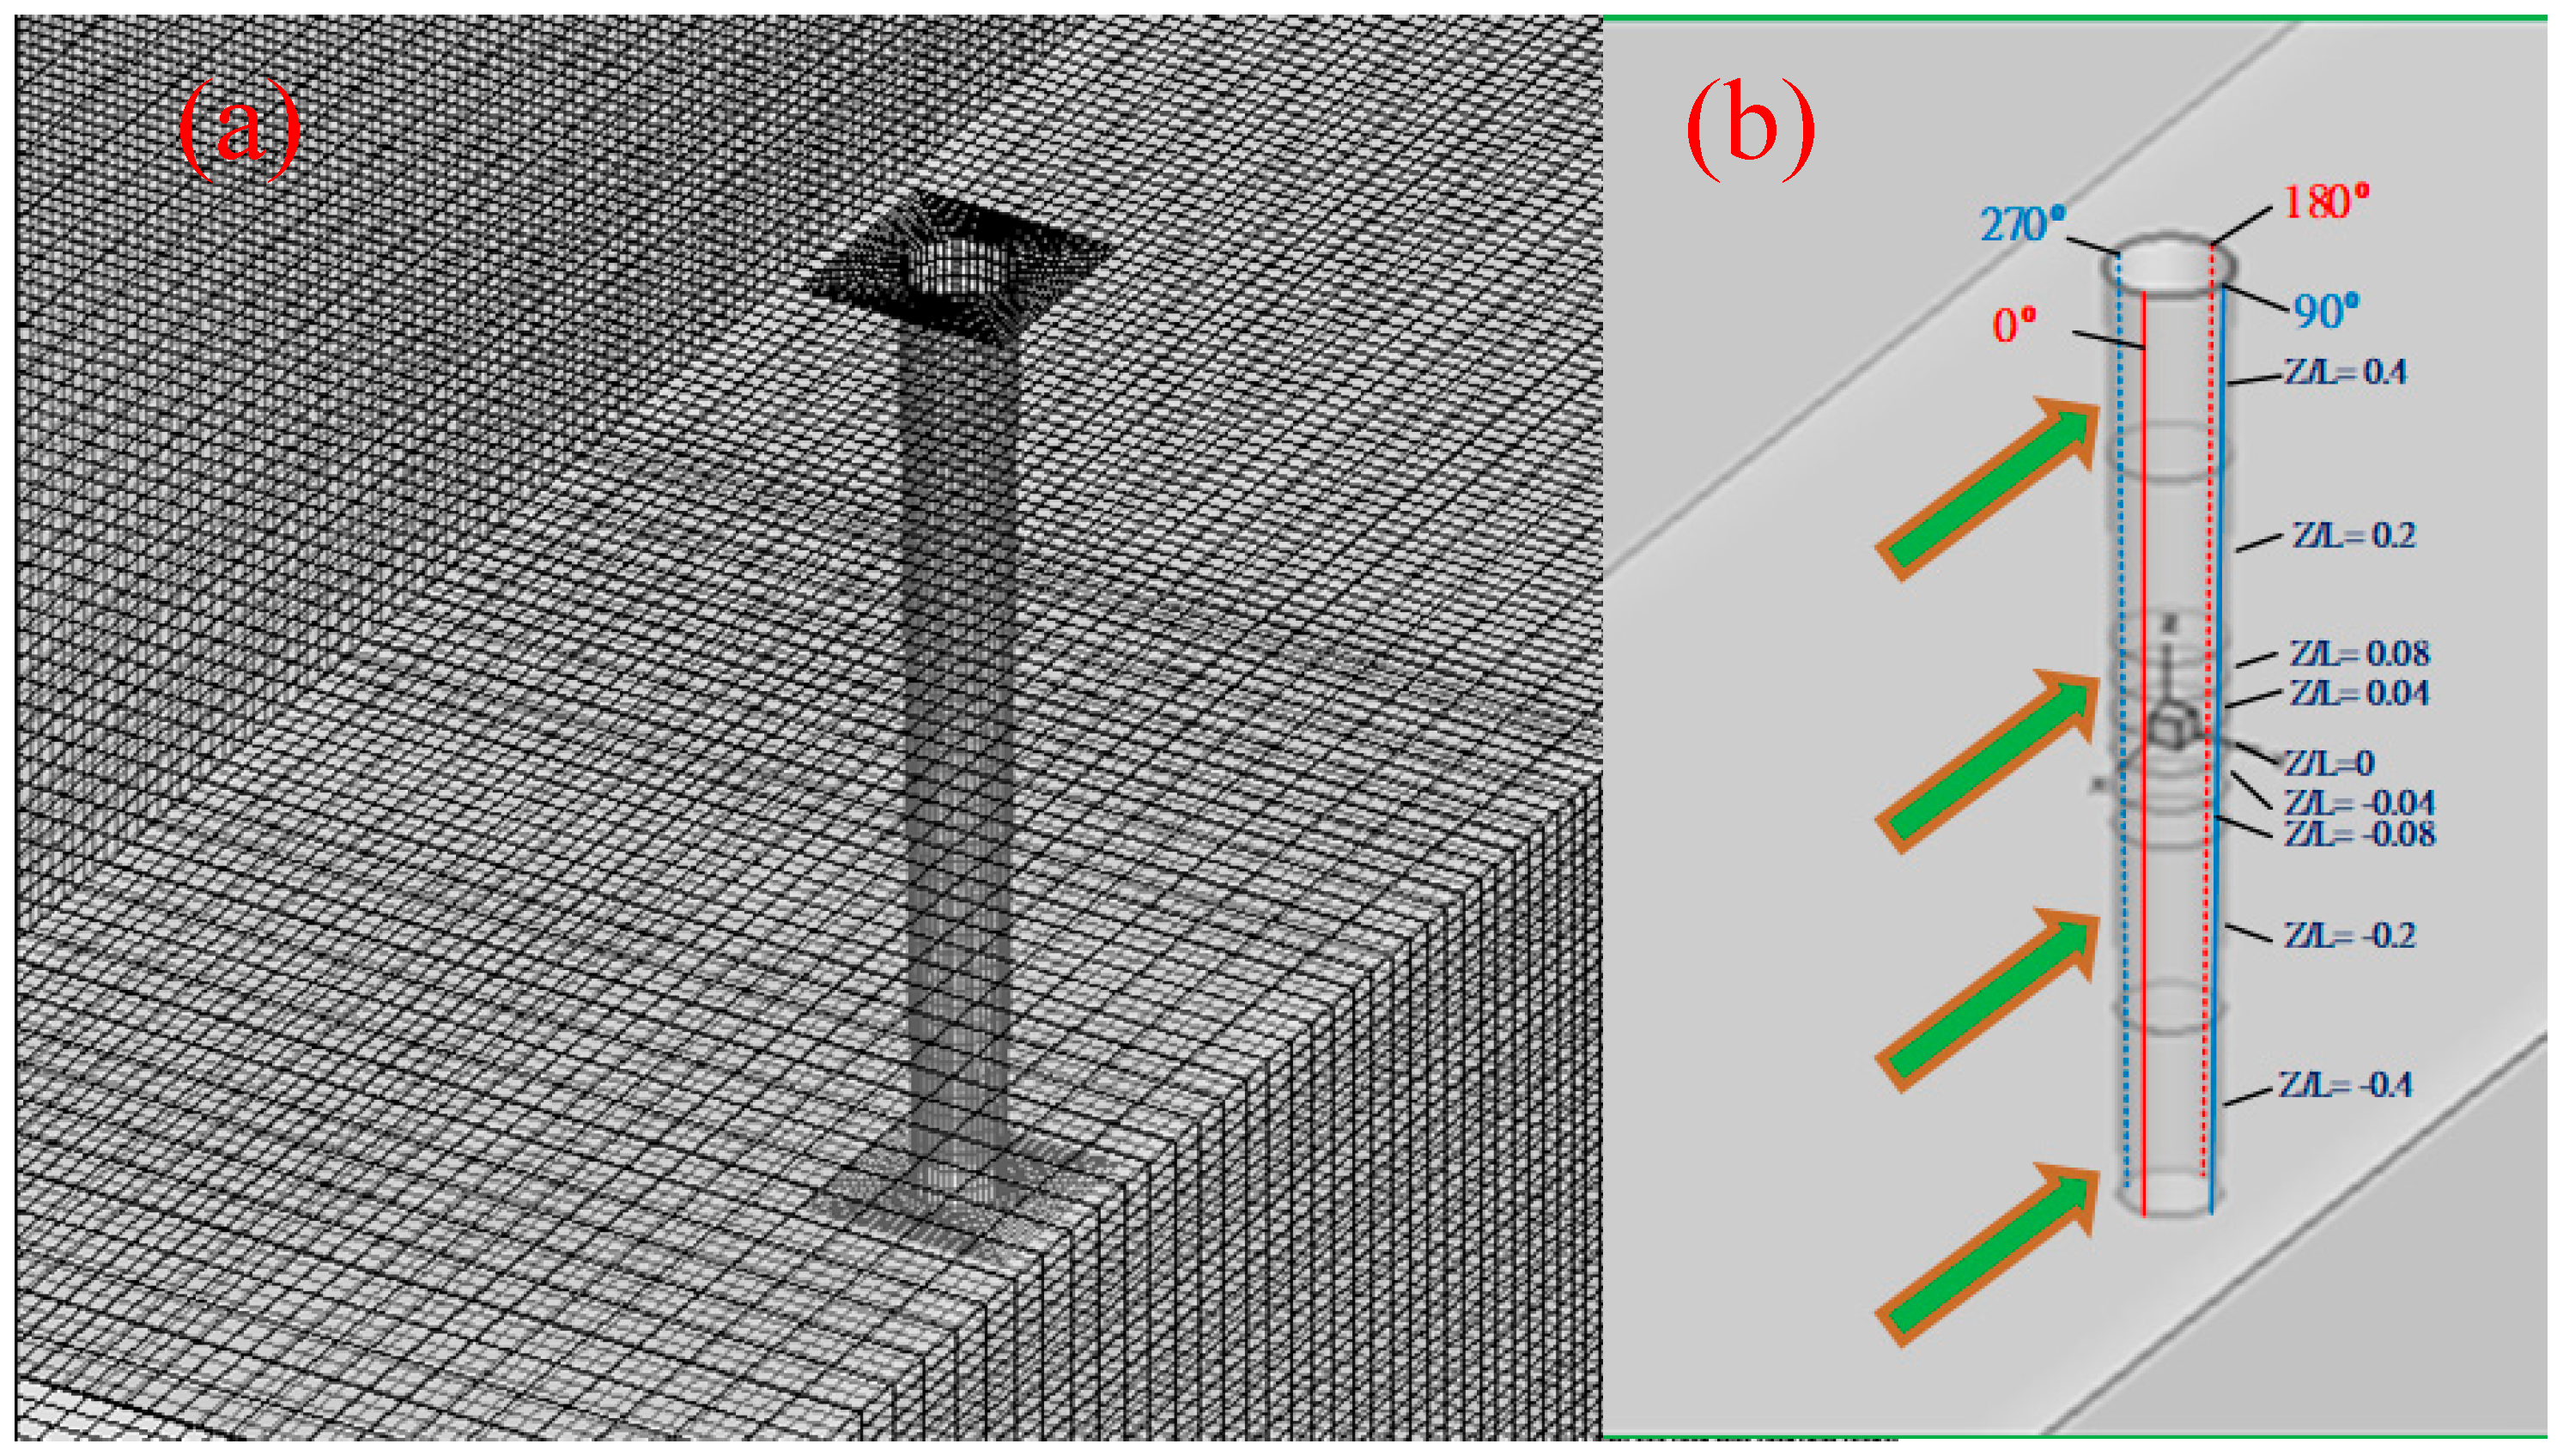
A mesh system corresponding to the experimental setup in Figure 1 was constructed as shown in Figure 2. The tapered cylinder is 0.2 m long with an upper-end diameter D1 = 22.575 mm, lower-end diameter D2 = 17.6 mm, average diameter
= 20.0875 mm, and RT = 40.2, according to a previous definition.
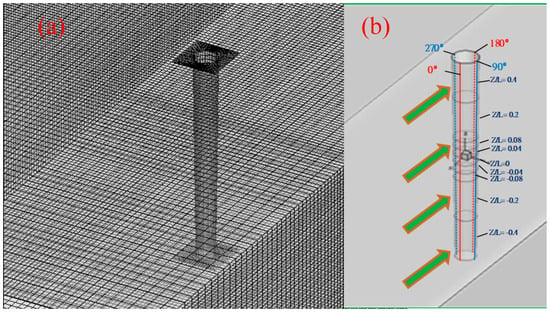
Figure 2.
Computational mesh of (a) nearly structural grid system; (b) nine non-uniform zones for acquiring Cl.
To establish appropriate boundary conditions, both upstream and downstream in the simulations, the computational domain was extended 0.45 m in front of and behind the cylinder. Figure 2b presents a Cartesian coordinate system used for the analysis, with the origin positioned at the center of the tapered cylinder. The X-axis is the direction of the axial flow along the wind tunnel, the Z-axis is the spanwise direction of the cylinder, and the Y-axis is the transverse direction with respect to the cylinder. We used 9 specific zones at Z/L = ±0.4, ±0.2, ±0.08, ±0.04 and 0, as shown in Figure 2b, to numerically obtain the dynamic response, i.e., transient pressure, or lift coefficients, caused by vortex shedding of the tapered cylinder.
The inlet flow was assumed to be a plug flow with a uniform velocity of U = 3.10066 m/s, which is equivalent to a Reynolds number of 4000 in the wind tunnel. The Reynolds number is defined as , where U is the inlet velocity and μ is the dynamic viscosity of the fluid. Dry air at a temperature of 25 °C and pressure were adopted in the simulations. A zero-order extrapolation was applied at the outflow boundary condition for the relevant flow properties. A non-slip condition was imposed on all surfaces, including the inner wall of the wind tunnel and the tapered cylinder. The following numerical techniques were employed to ensure stable and accurate solutions.
(i) When ANSYS FLUENT employs an implicit formulation to solve equations that are time-dependent, it may require multiple iterations at each time step. Users are required to define a maximum limit for the number of iterations per time step. If the solution meets the convergence criteria before reaching this iteration limit, it will proceed to the next time step. It is crucial to carefully determine the maximum iterations per time step to prevent the propagation of errors. A globally-scaled residual of was adopted to check the absolute convergence criteria at each time step.
(ii) The standard k-epsilon turbulence model was initially employed to approximate the Reynolds stresses without considering time evolution, as vortices generated from a 2-D circular cylinder become turbulent when the Reynolds number exceeds 300 [25,26]. The data were then imported to the solver serving as the initial conditions in transient calculations using LES—this has great potential for calculating these complex flows [23,27,28,29]. According to the literature, the Smagorinsky–Lilly model in LES was used for the subgrid model, and the Smagorinsky constant was set to be 0.1 (default value by ANSYS FLUENT). At the inlet boundary, the turbulence intensity was set to be 0.4% based on the experimental data (<0.5%). This calculation procedure was found to yield rather stable calculations for this time-marching problem.
(iii) The FFT algorithm was used to acquire the predominant frequency of vortex shedding based on the time history of the induced lift. Our understanding is that the use of the standard FFT to analyze the spectra of a data string containing a non-sinusoidal component results in spectra with an envelope that decays exponentially. Data for the low frequency part are highly contaminated. On the other hand, the non-periodic condition often yields an adverse effect of frequency contamination. Therefore, an iterative filter proposed by Jeng et al. [24] was adopted to remove the non-sinusoidal trend and reduce the error induced by the non-periodic conditions.
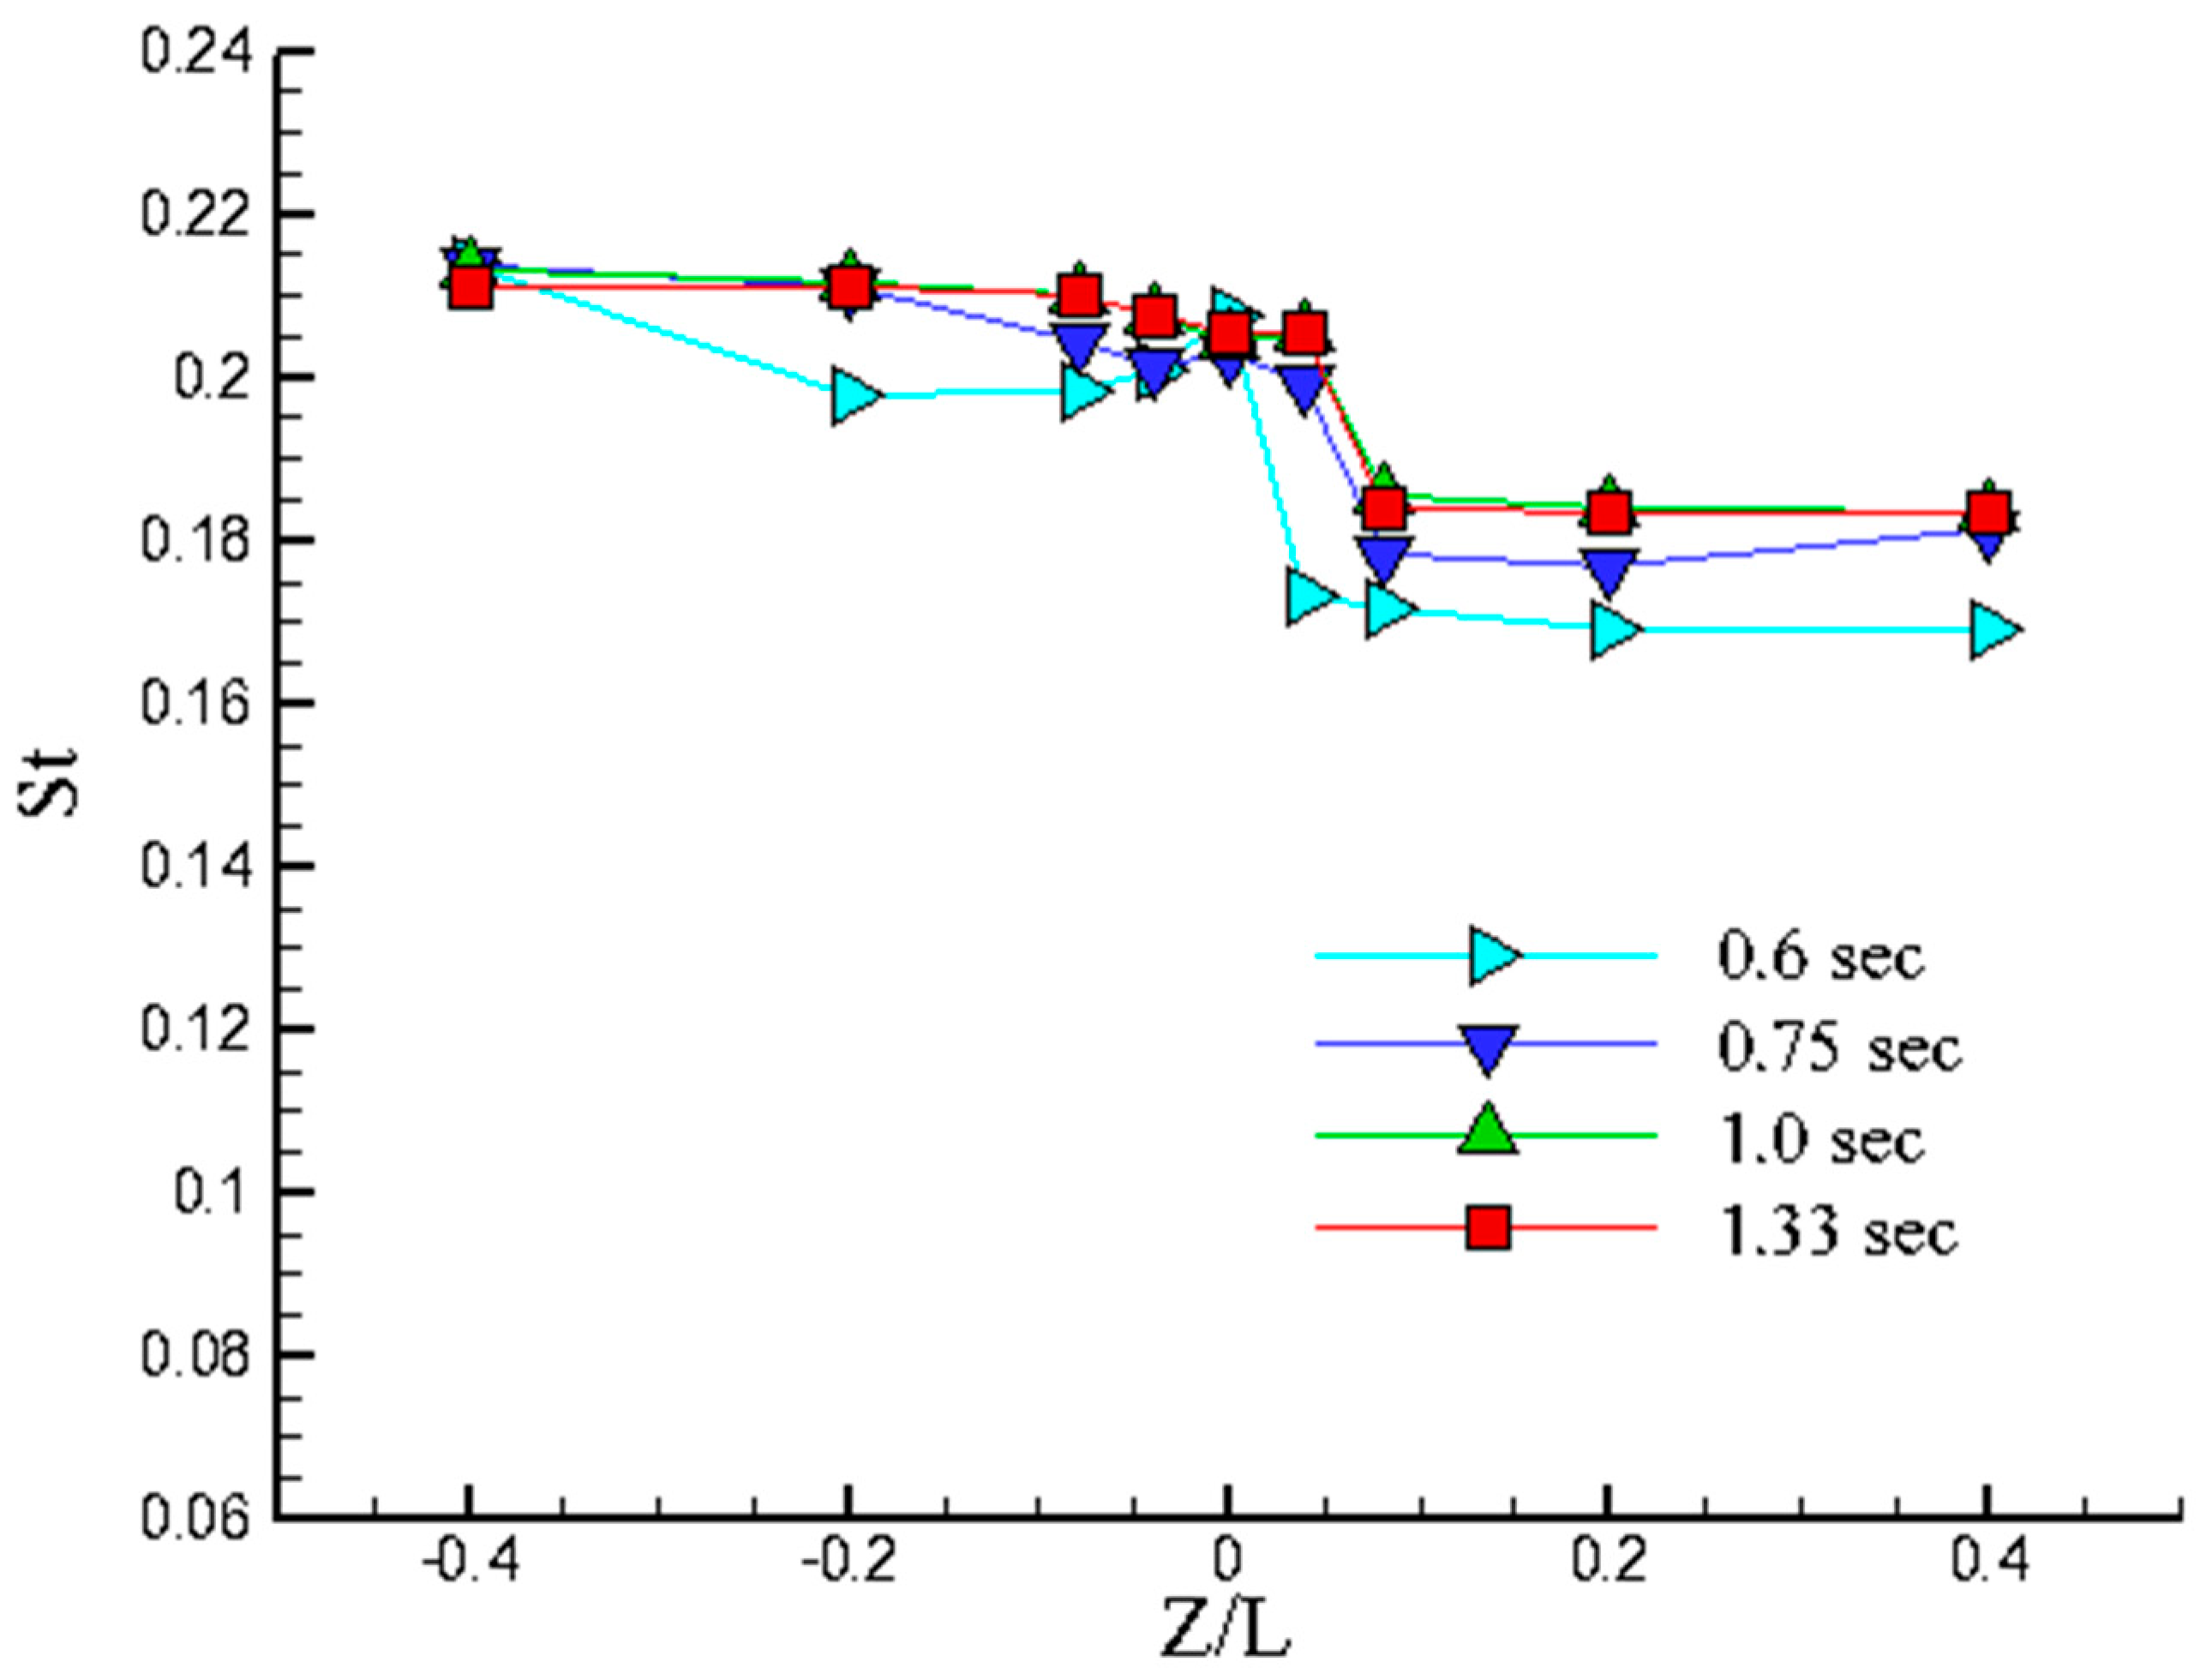
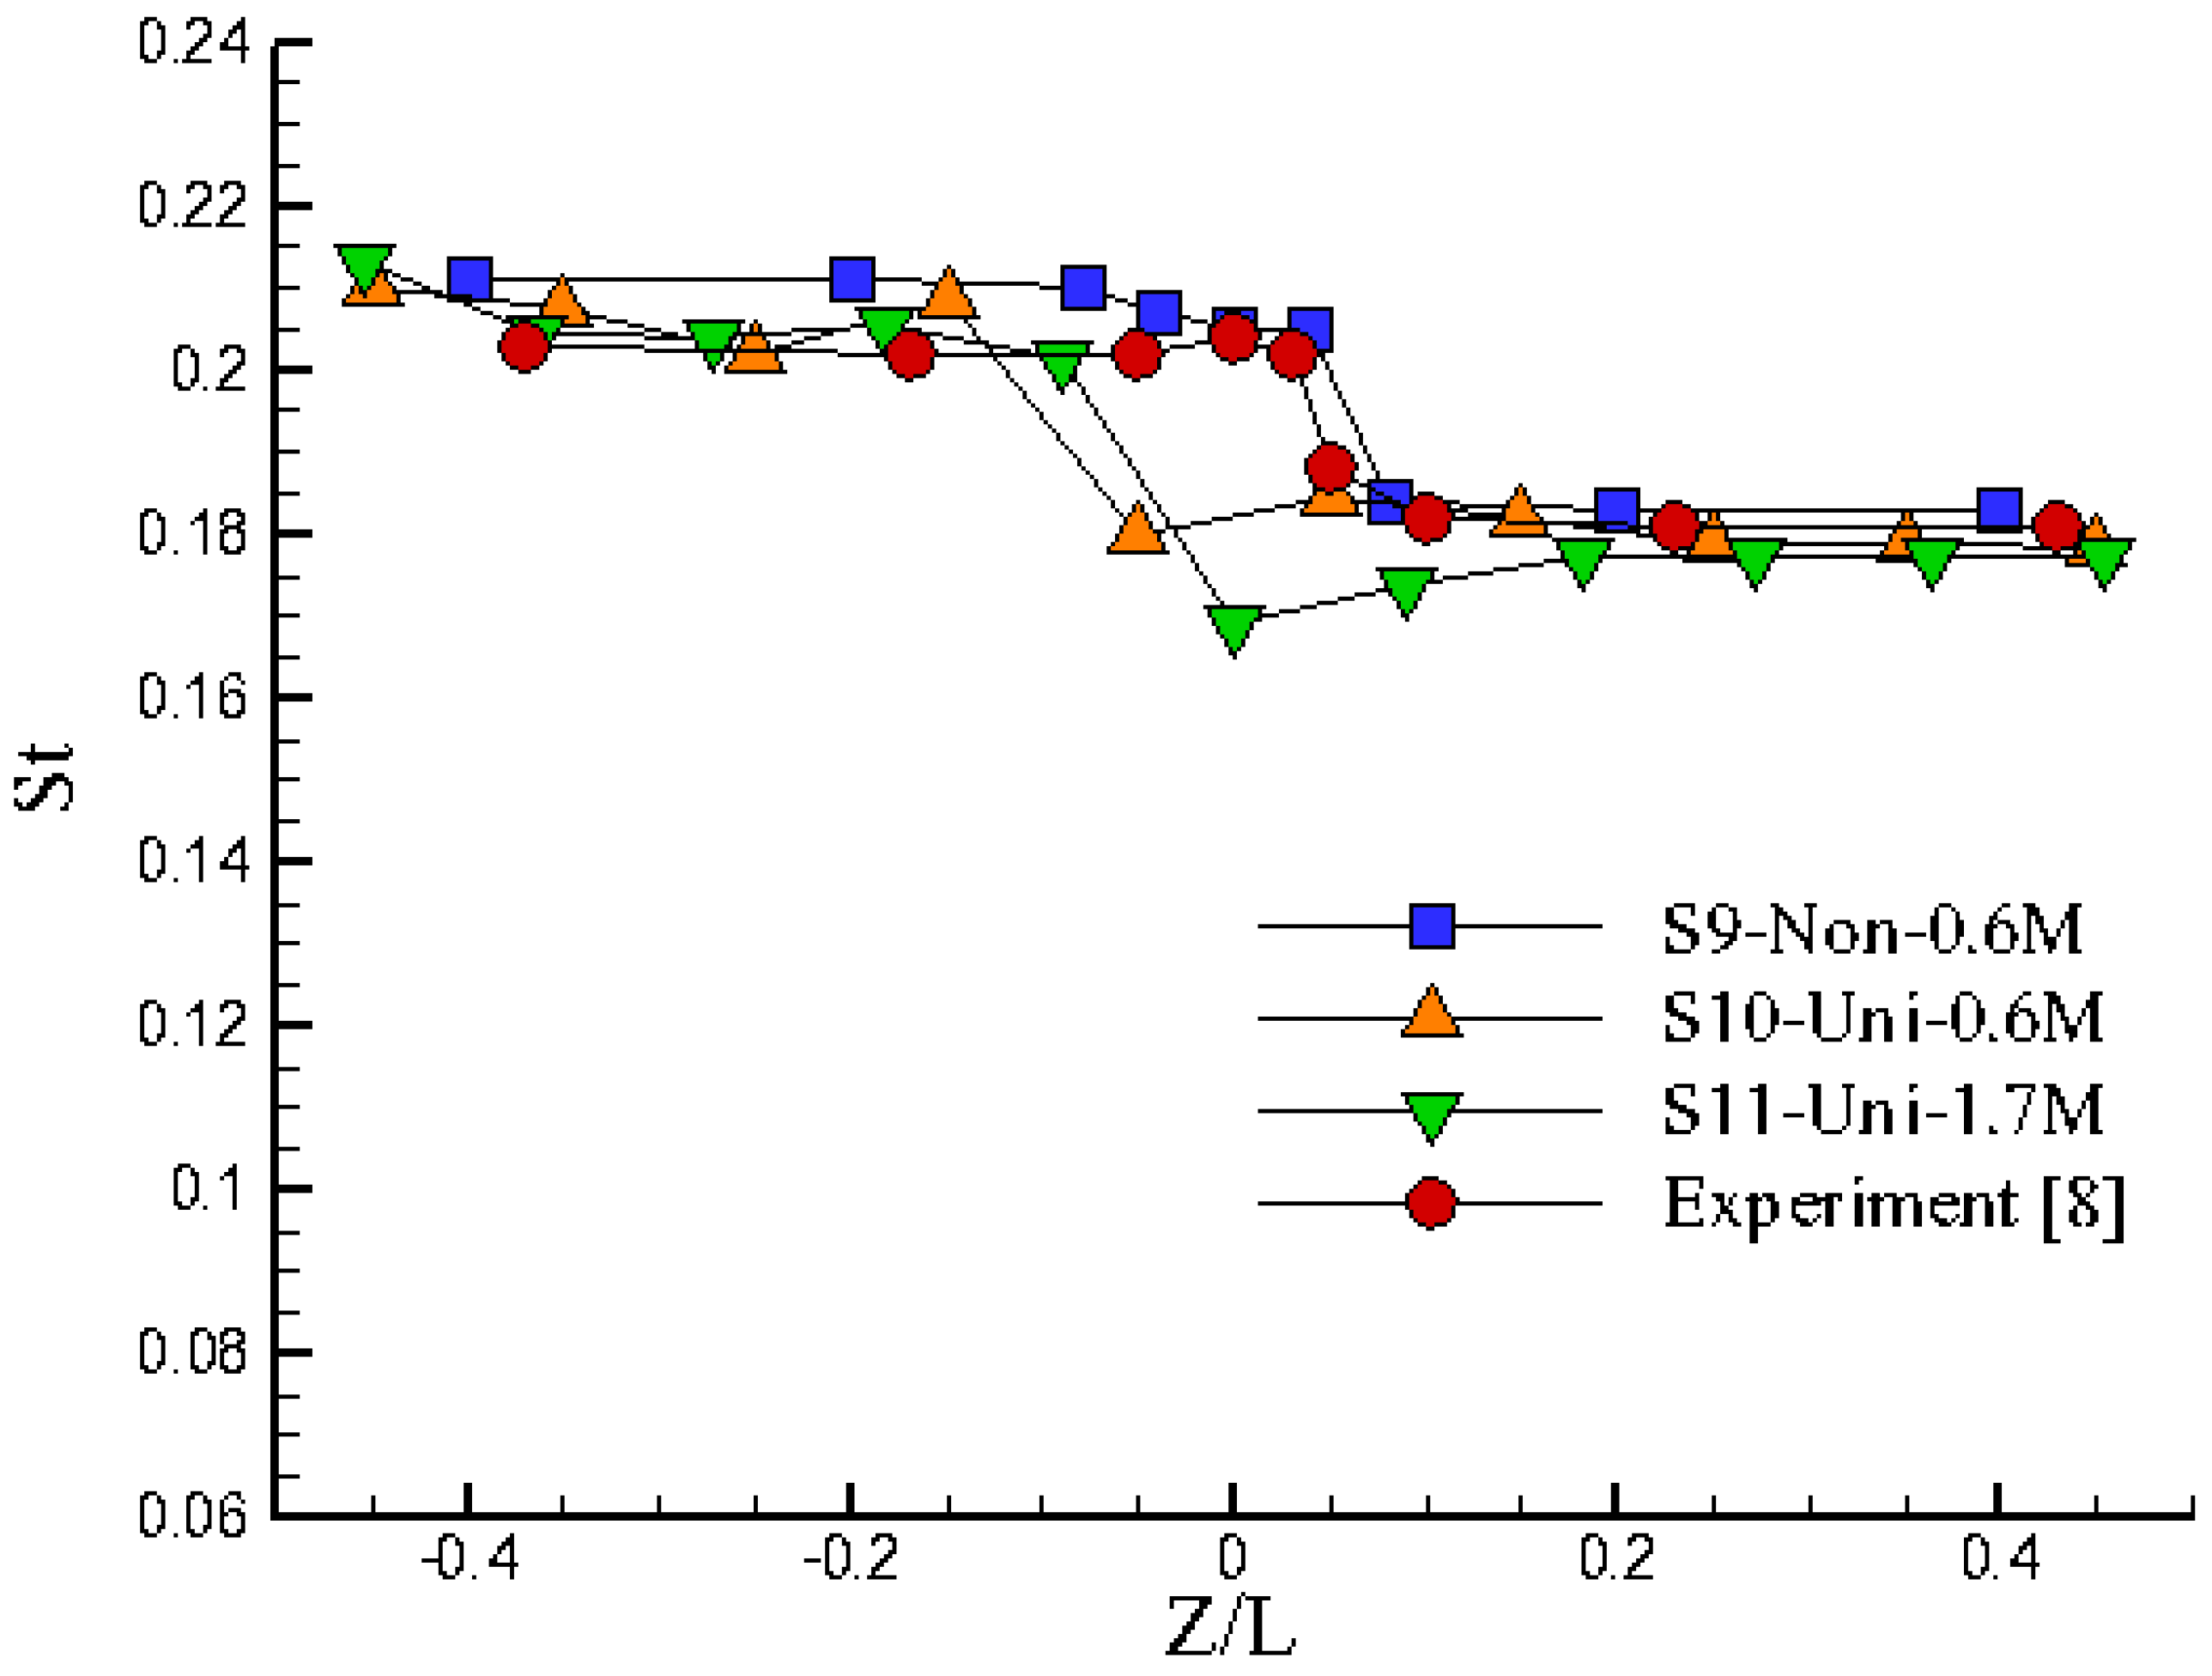
(iv) For the computation, the time steps need to be adequately minuscule to ensure a satisfactory resolution in the time domain and precise identification of the dominant frequency using the FFT algorithm. In this case, the time step is established at 0.0001 s, and the scale of the time step in relation to the small-eddy time scale is estimated to be roughly two orders of magnitude. In Figure 3, the numerical experiments show that distributions of St along the tapered cylinder proceed to converge after one second. Therefore, the final data—in which calculations ceased at an elapsed time of 1.33 s—are used in the following analysis. The Cl plot of 13,300 points was analyzed using FFT to obtain frequency spectra for the case studies. Figure 4 presents the implicit time integration method and compares it with experimental results, using a time step of 0.0001 s. The typical vortex shedding frequency in these cases is approximately 30 Hz, corresponding to a time period of about 0.0333 s. As a result, 333 calculation steps were used to resolve a single complete cycle of vortex shedding.
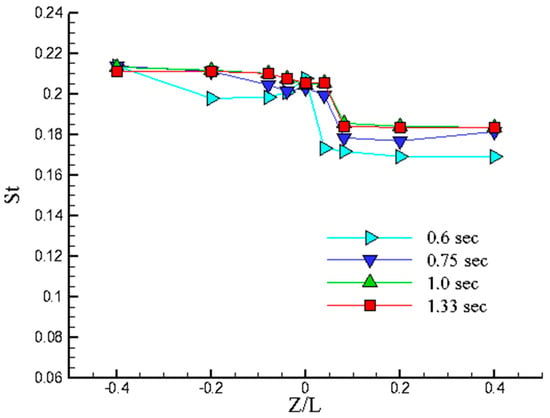
Figure 3.
Distributions of St in the spanwise direction at different elapsed times.
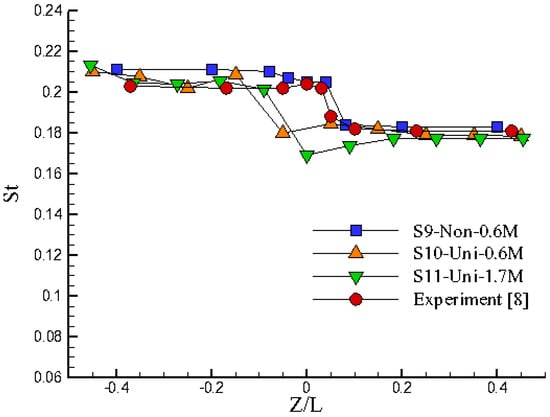
Figure 4.
Grid independence checks and comparisons between the numerical and experimental data [8]. It shows that 0.63 million nonuniform grids (S9-Non-0.6M) are suitable for this study.
(v) Dominant frequencies of convergent solutions are sensitive to sources of potential disturbance, such as minor variations from the grid number, grid distribution, initial conditions, boundary conditions, convergent criteria, etc. [30]. In practice, not only the quantity of the mesh is related to the accuracy of the solution in this research, but also factors that are unavoidable in the experiment, such as the inlet turbulence level, cylinder surface, acoustic noise, and the boundary of the cylinder end, are all sensitive to the phenomenon of vortex shedding [28,29]. Though an exact agreement between the numerical and experimental data most likely cannot be expected in this study, it does not seem to be in conflict with interpreting the vortex-splitting mechanism from a qualitative viewpoint. To effectively compute the present flow fields, the flow domain was divided into smaller subdomains. Mixed grid types were used to fit the subdomain around the tapered cylinder. Subsequently, structured hexahedral grids were utilized to create the mesh encircling the vortex generator, which is represented by the tapered cylinder. Furthermore, finer grids were implemented along the boundary wall to accurately capture the turbulent boundary layer, and the grid scale in relation to the viscous scale was assessed prior to the calculations. Figure 4 shows calculations to check for grid independence and comparisons between the numerical and experimental data. The dominant frequency was obtained by performing FFT for the evolution of Cl over the elapsed time, and St was obtained based on the definition of the Strouhal number. Though the St distribution of simulated results for the case with 1.7 million grids appears favorable versus experiments, that computation took too long to achieve the required convergence. In general, the calculations in Figure 4 show that 0.63 million grids are suitable for this study. Besides, the mesh with 10 uniform zones along the cylinder does not capture the Strouhal-number-jump at the right location, but the mesh with 9 non-uniform zones in Figure 2b does. Thereafter, the 0.63 million grids with 9 non-uniform zones along the tapered cylinder were adopted in the simulations and analysis.
Generally, the numerical and the experimental values are consistent for the case of Re = 4000 in Figure 4. Strouhal numbers at the narrow end of the cylinder (Z/L < 0) by CFD are a little higher than experiments, and the splitting locations show only little discrepancy for both the CFD and experiments around 0 < Z/L < 0.05. These minor deviations in the lower portion of the tapered cylinder might result from the combined effects of the specified numerical boundary and initial conditions of the tunnel wall [31], as well as numerical errors, including the mesh quality and accumulated errors in transient calculations [30].
4. Results and Discussion
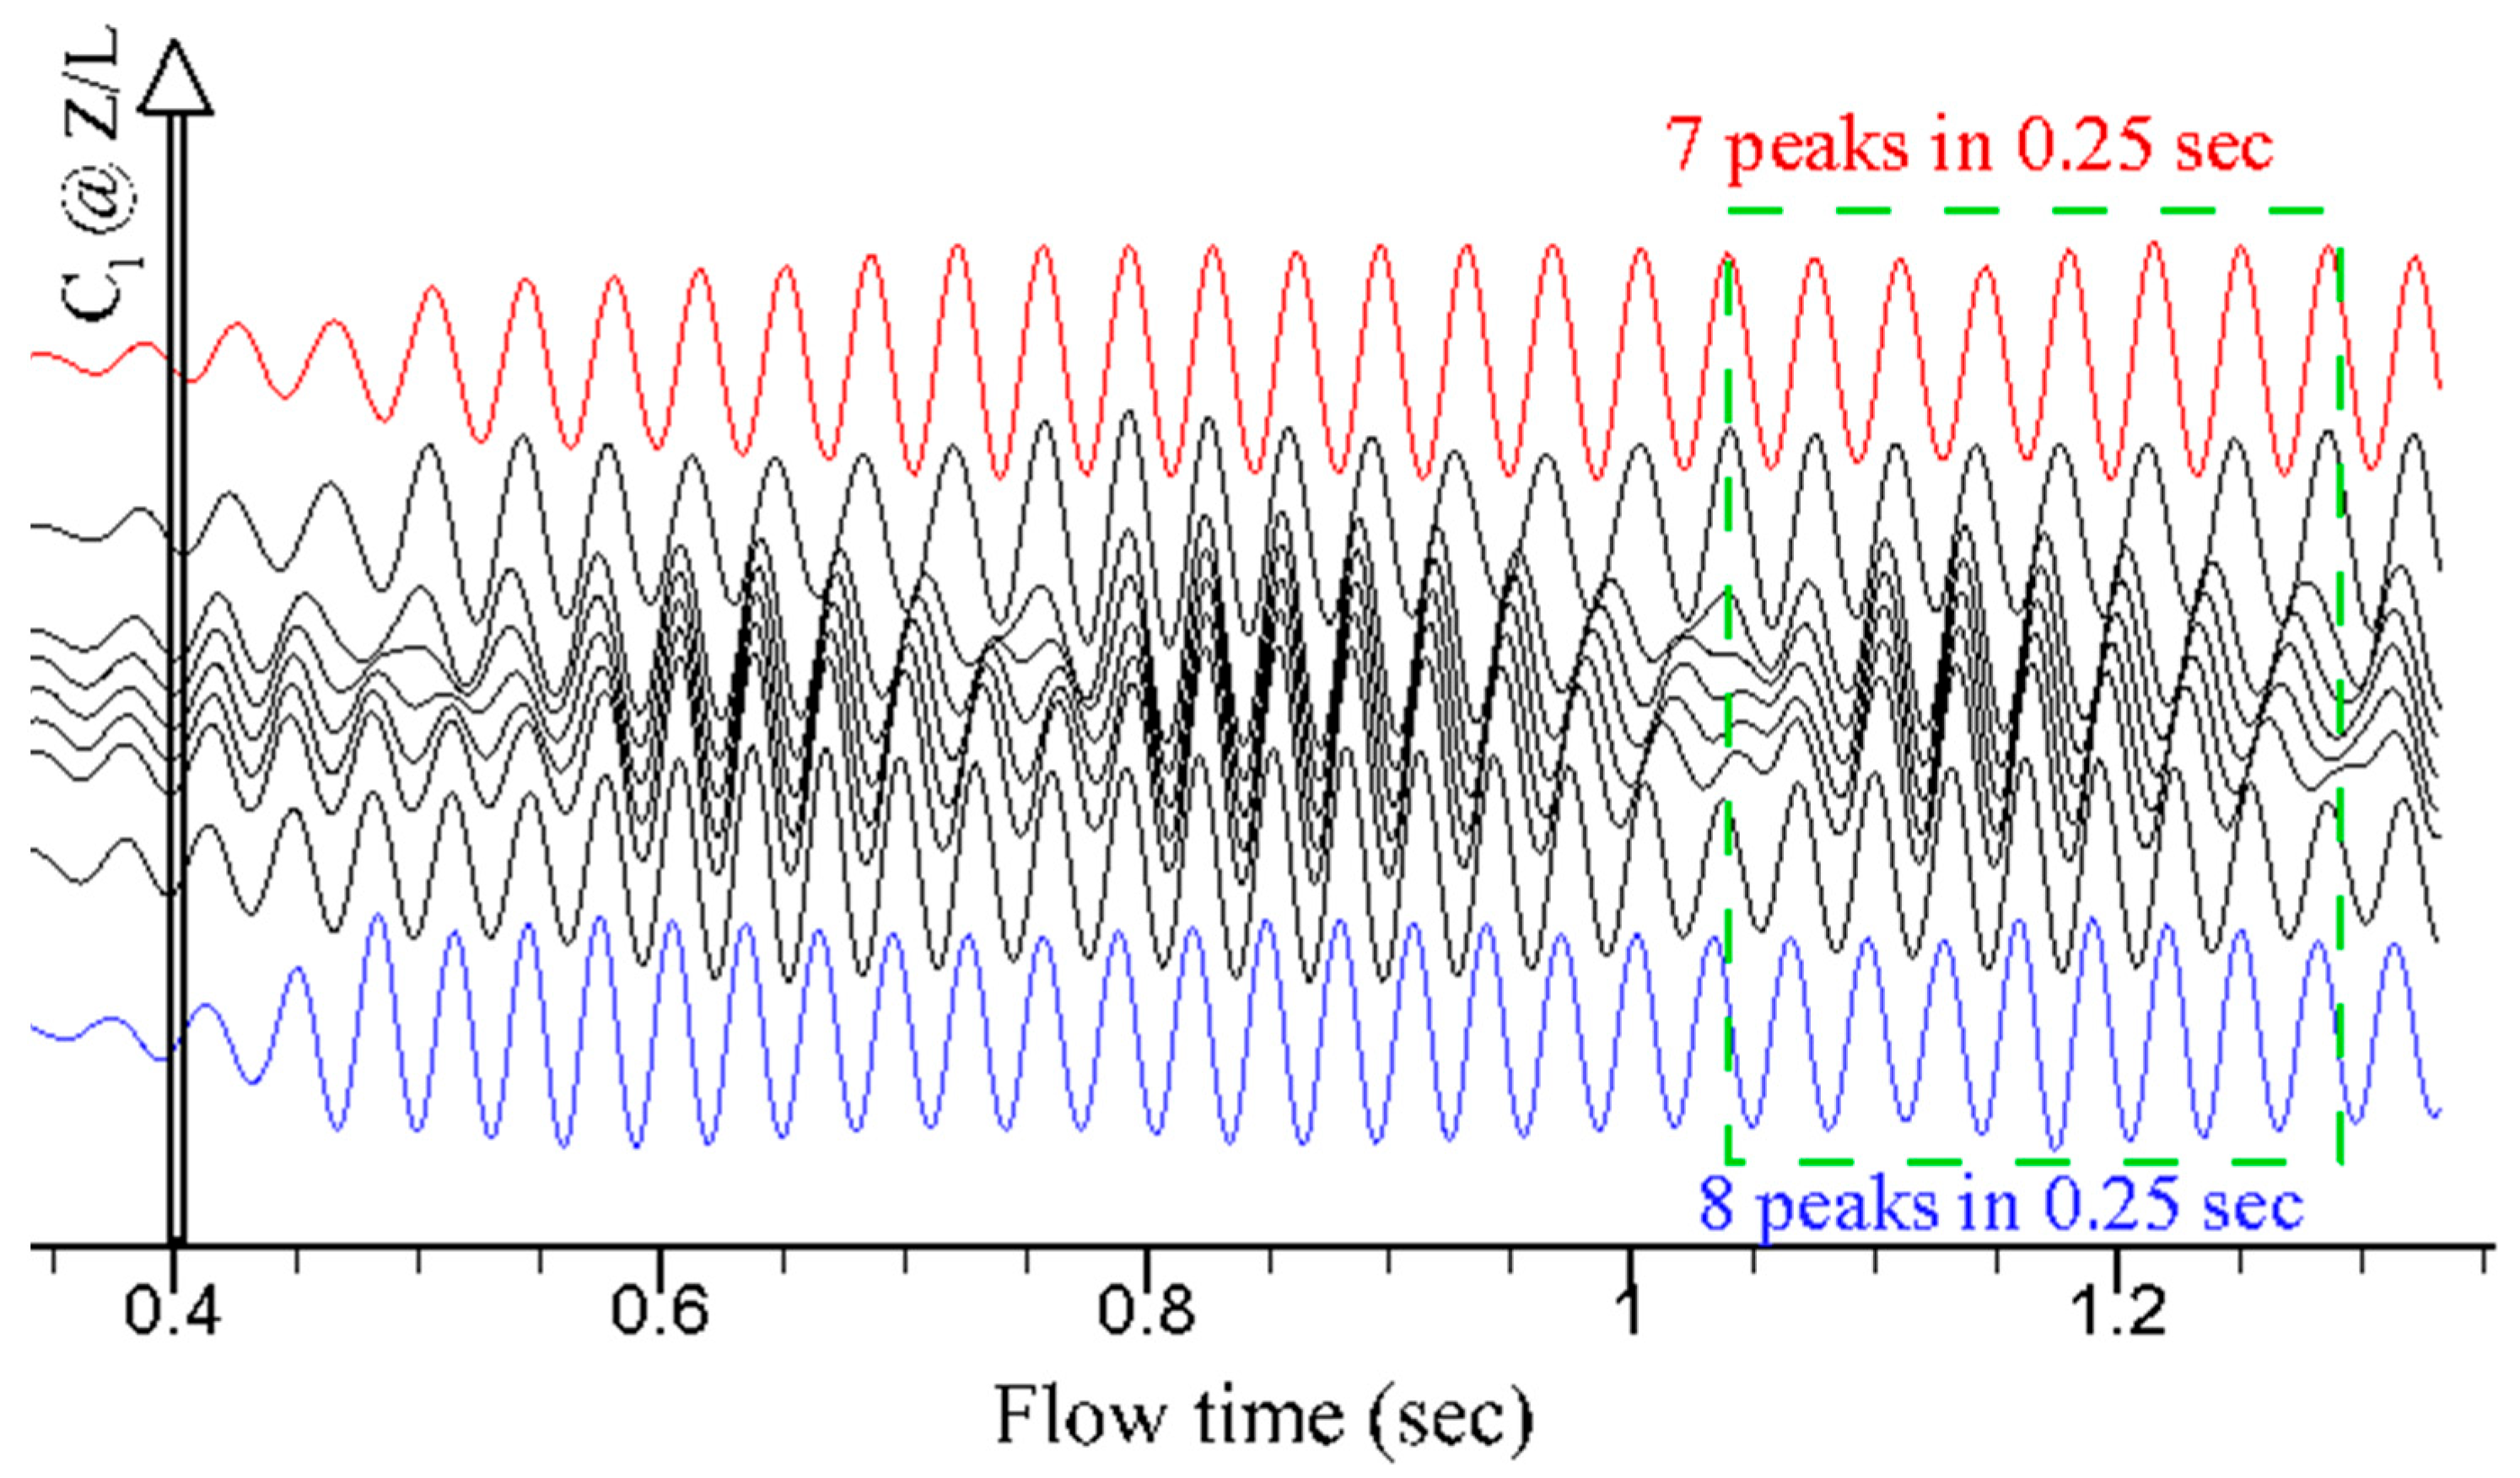
Time-marching calculations were adopted to study this transient problem. After reaching a stable oscillation of the lift coefficient (Cl), 20 more time-step calculations were executed for further analysis. This took 20 × 0.0001 = 0.002 s for every output. A total of 20 outputs (T1–T20) were recorded. Therefore, the total elapsed time is 0.04 s. The nine zones of the tapered cylinder in Figure 2b were selected to acquire the time traces for the lift coefficients in Figure 5, in which the amplitudes of the Cl fluctuations are all normalized to be one. This enhances the images of the transition of vortex splitting. The Cl oscillations at all zones are similar and stabilize after 0.6 s, while phase lags exist around the middle zones. The higher peaks in the trace, at each location of Z/L = −0.08, −0.04, 0, 0.04 and 0.08, determine the period of primary oscillation. The relationship between vortex numbers of the higher-frequency cell and the lower-frequency cell at the vortex splitting can be spotlighted in the dashed rectangle as designated in Figure 5. There are approximately 7 peaks in the 0.25 s period in the lower-frequency cell (near the wide end) and 8 peaks in the higher-frequency cell (near the narrow end) of the tapered cylinder. Therefore, there are 28 peaks for one second in the lower-frequency cell and 32 peaks in the higher-frequency cell of the tapered cylinder. In other words, the mismatching of numbers of vortices between cells in different shedding frequencies is compensated for by vortex splitting during vortex shedding (greater than 0.6 s in Figure 5).
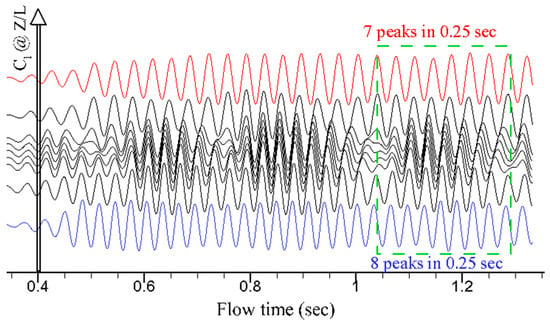
Figure 5.
Time traces of lift coefficients for the nine zones and the dashed rectangular region.
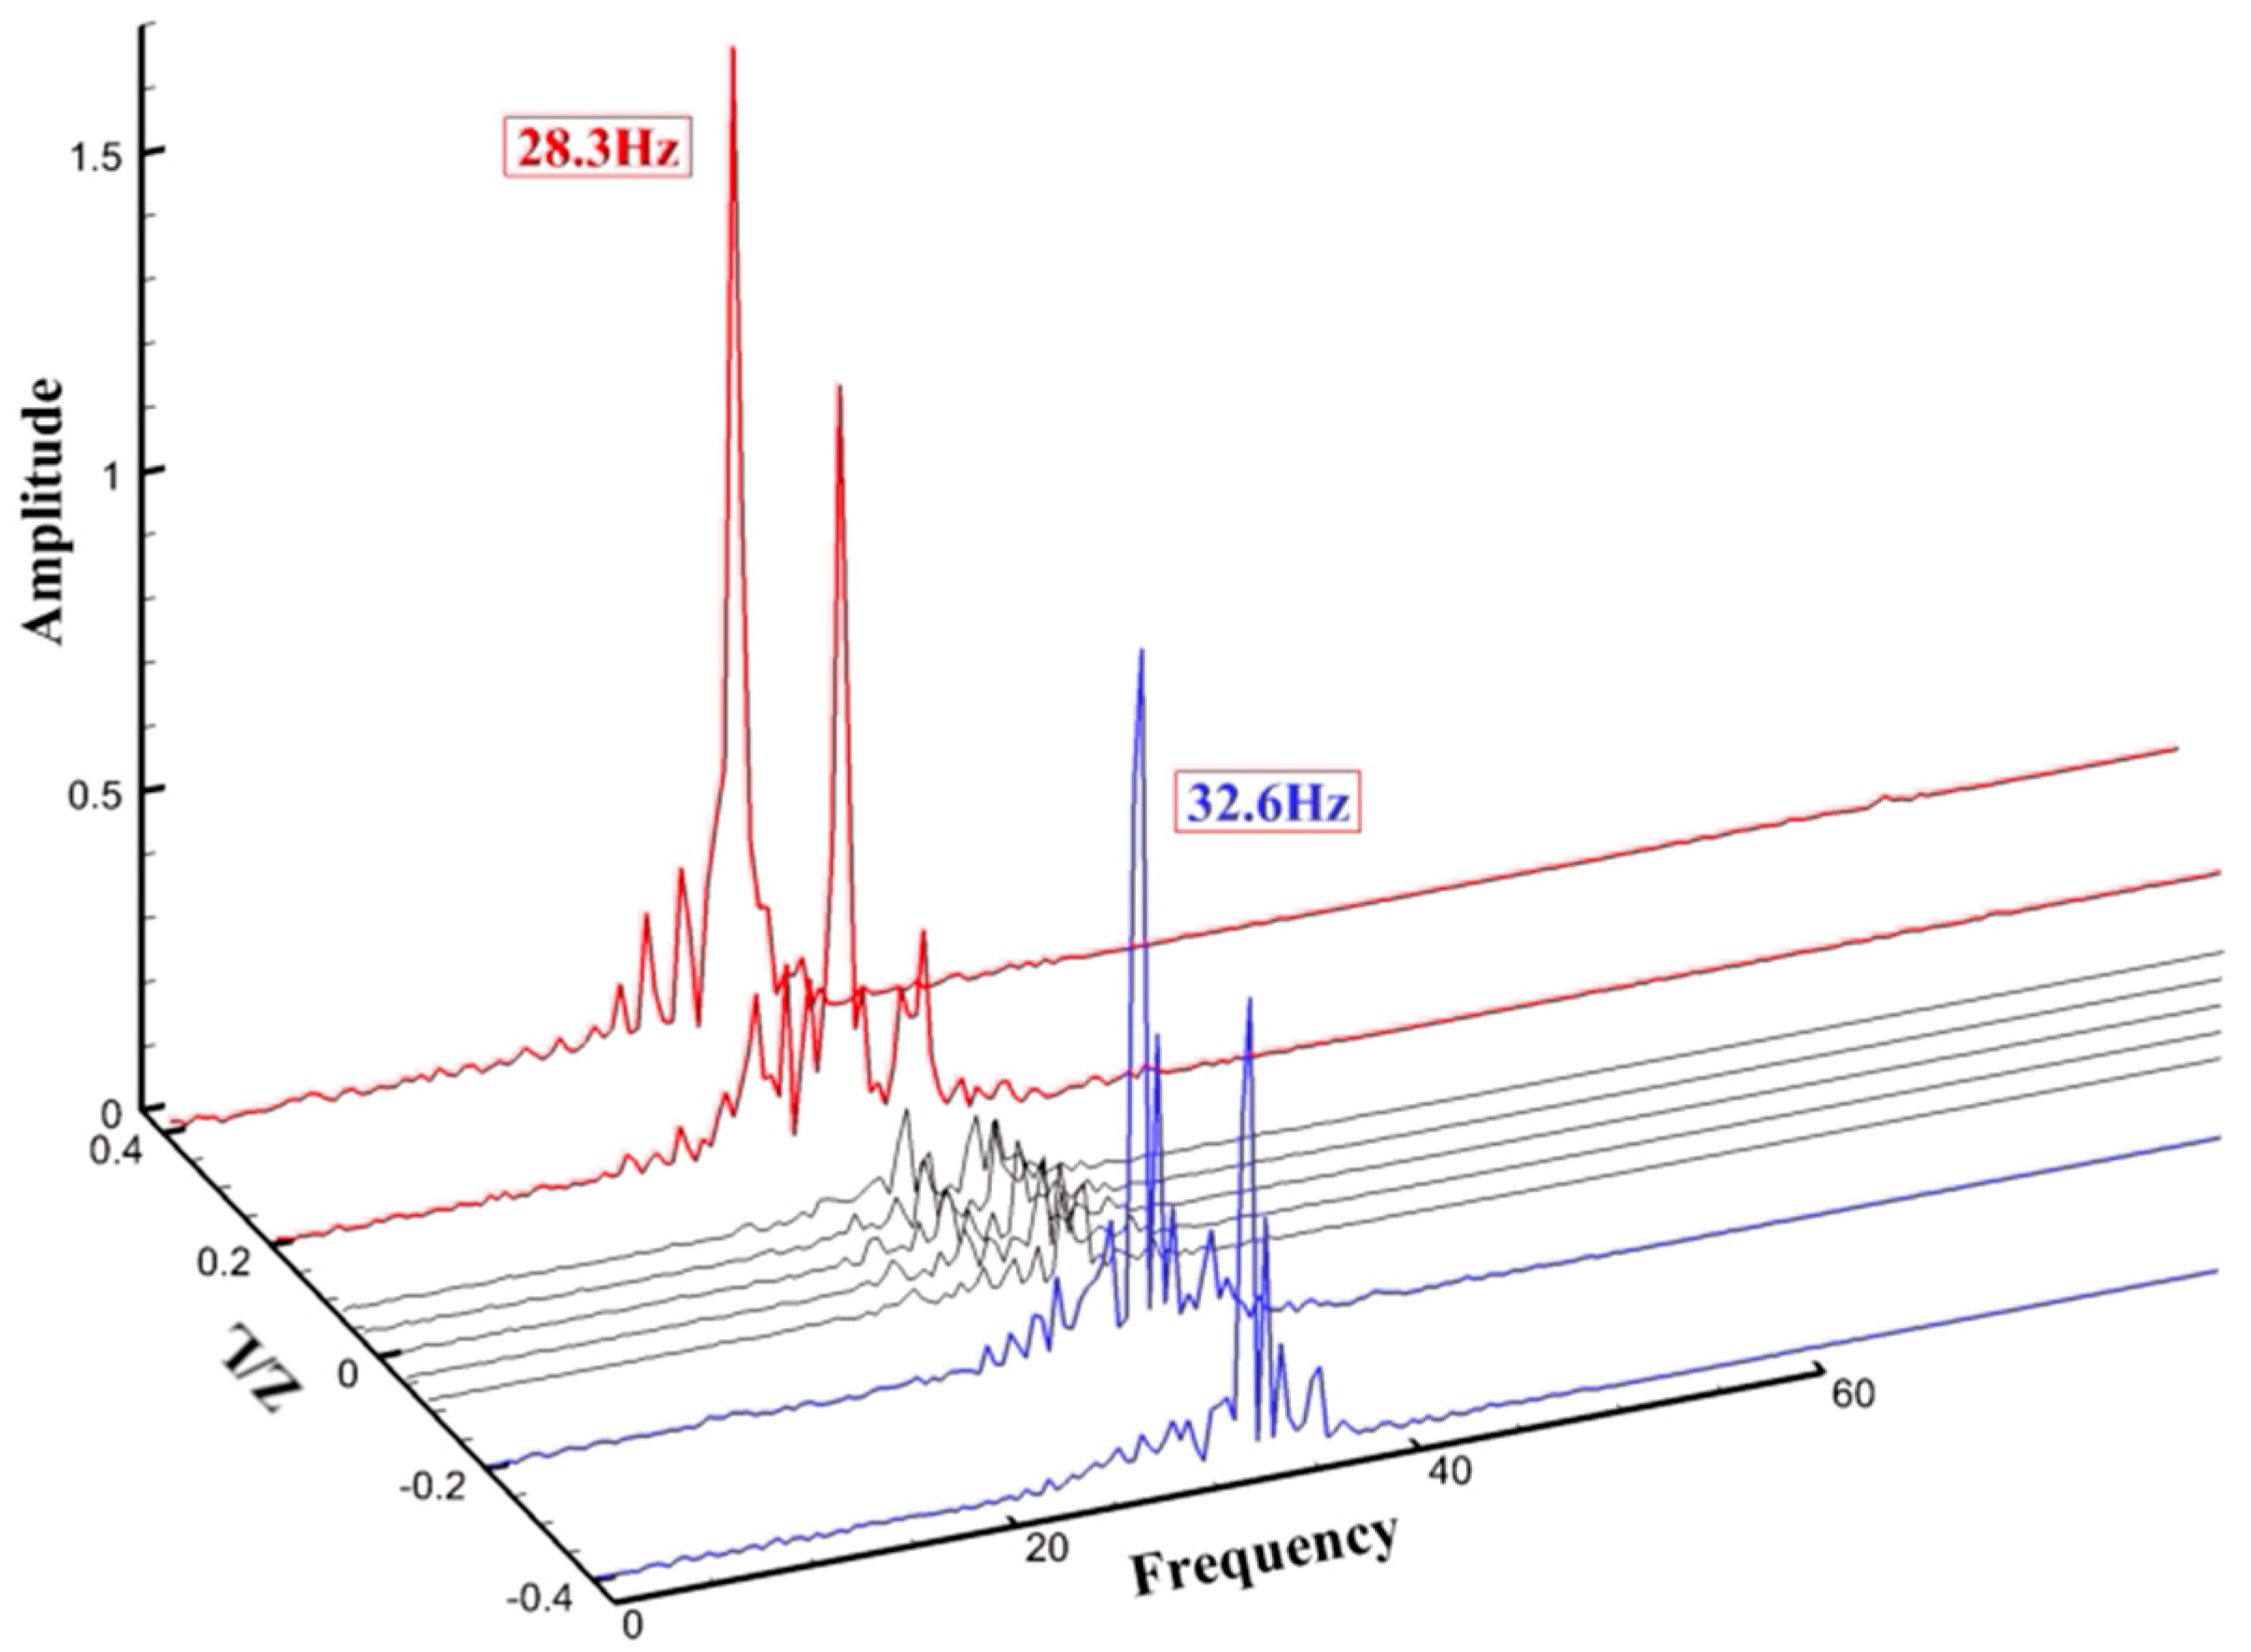
The time traces in Figure 5 can be expressed as the frequency power spectra via the FFT technique. The power spectra of Figure 6 have two global maxima, one of which is located at Z/L > 0 with a frequency of 28.3 (28 peaks per second in Figure 5), and the other is located at Z/L < 0 with a frequency of 32.6 (32 peaks per second in Figure 5). Between these maxima, the spectra are modulated and have phase jumps. The phenomena—including discrete spectra, nonlinear beat and phase jumps in the spectra—seem to be universal for vortex shedding behind bluff bodies with a spanwise geometric inhomogeneity in the cylinder.
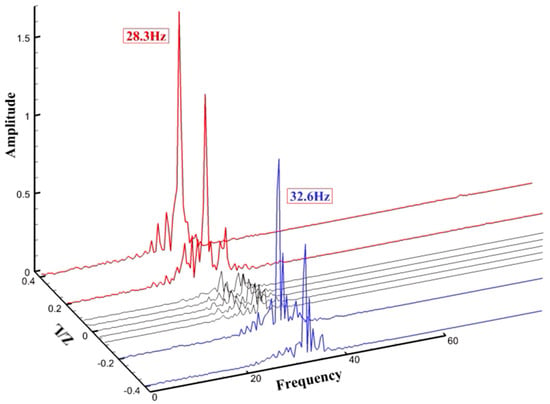
Figure 6.
Frequency spectra of lift coefficients at nine zones along the tapered cylinder.
A simplified model proposed by Hsiao and Chiang [8] can explain the synchronous appearance of the vortex splitting and the decreasing amplitude of the Cl fluctuations. The frequency of vortex splitting is equal to the difference between the dominant frequencies of the adjacent cells. The present simulated results support this model. The occurrence of vortex splitting can be formulated as follows:
Here, we have f1 = 28.3, f2 = 32.6, and Tint is calculated to be 0.233 s.
In this simulation, the period is 0.0353 s in the lower-frequency cell (f1 = 28.3), and the period is 0.0307 s in the higher-frequency cell (f2 = 32.6). If we count the period of occurrence of vortex splitting, then, there are seven peaks for T = 0.0353 s per cycle or 0.247 s total. There are eight peaks for T = 0.0307 s per cycle or 0.246 s total. As stated previously, 0.25 s was expected to be the Tint in Figure 5, and it is close to the 0.233 s predicted by the proposed model [8].
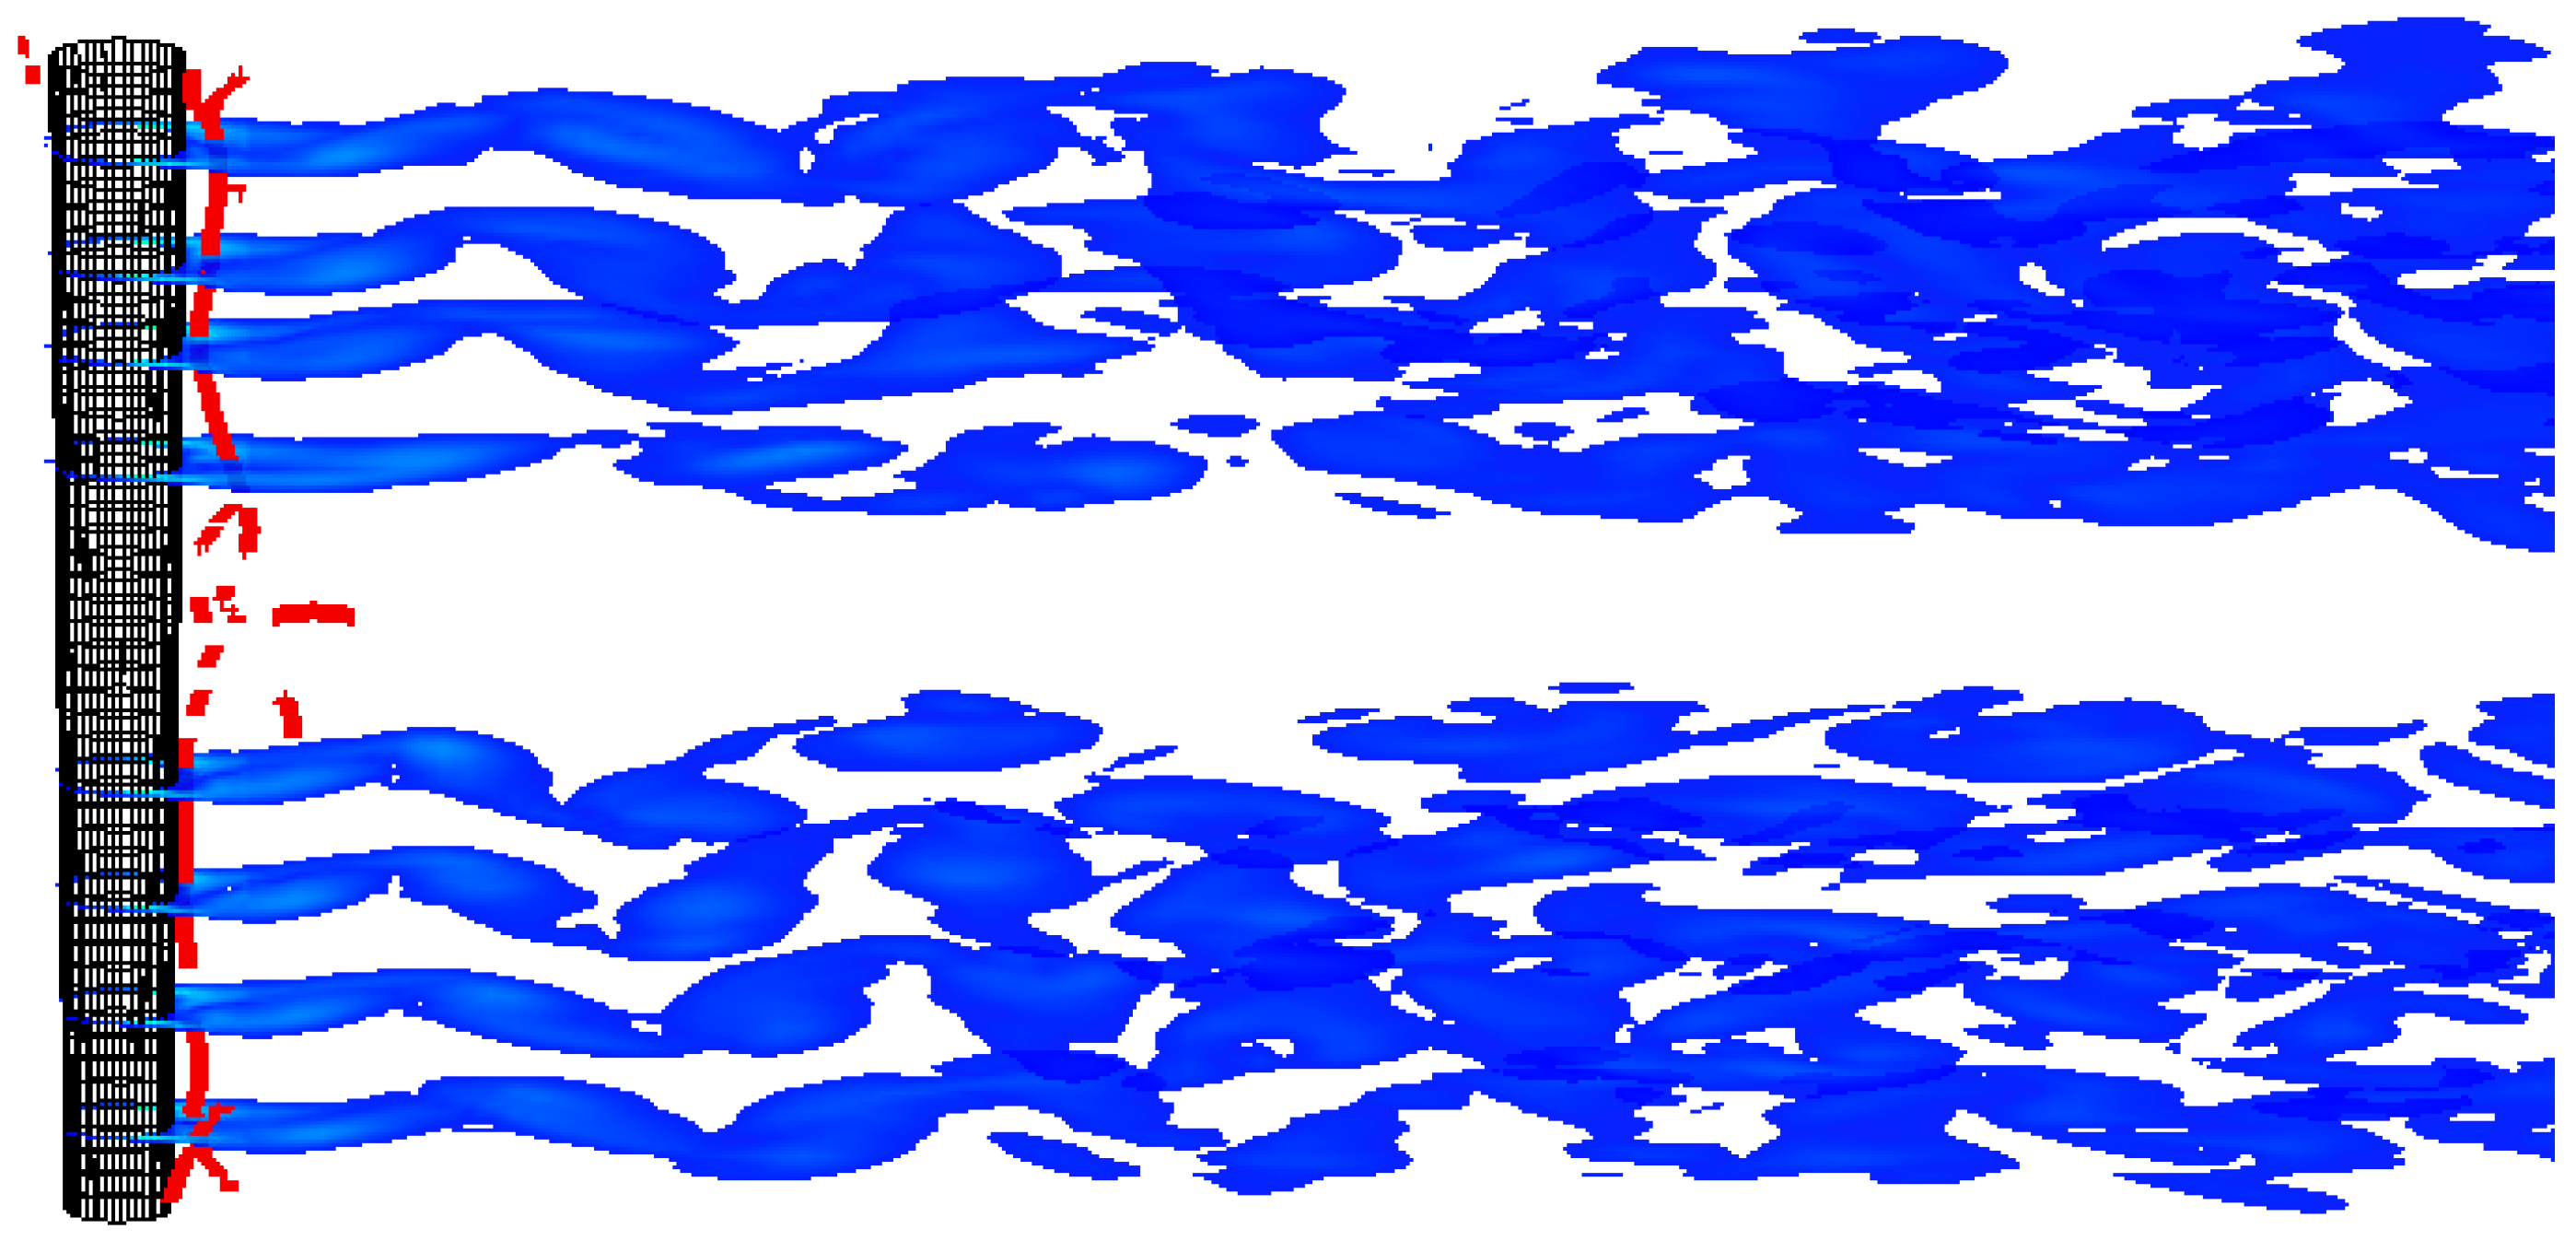
One of the questions that comes with the cellular distribution of vortex-shedding frequencies is how the vortices link between cells with different frequencies. If the shedding frequency is evenly distributed, encompassing the vortices in the wake trailing a 2-D cylinder, the vortex lines maintain alignment across the full span. However, the distribution of shedding frequencies is cellular in the wake behind tapered cylinders, and the number of shedding vortices generated in different cells is not equal over the same duration of time. In addition, the three-dimensional (3-D) effect of cellular vortical structures might accelerate the mixture of momentum and the transition of the wakes making the situation fully turbulent. The vortex line is then impossible to be always aligned throughout the entire span. Numerical flow visualization in Figure 7 displays oblique vortex shedding in terms of the normalized vorticity magnitude at a certain time step. Just behind the tapered cylinder, the red lines of the vortex core appear distinct except for the middle zone where vortex splitting occurs. Thus, splitting is accompanied by decreases in amplitude, and this is reasonable because the vortices in different cells are out of phase at vortex splitting.
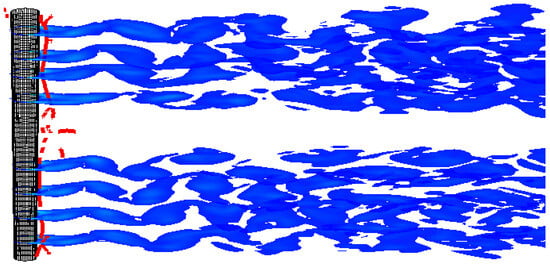
Figure 7.
Oblique vortex shedding in terms of normalized vorticity magnitude at a certain time step, and the red dots indicate the vortex core just behind the tapered cylinder.
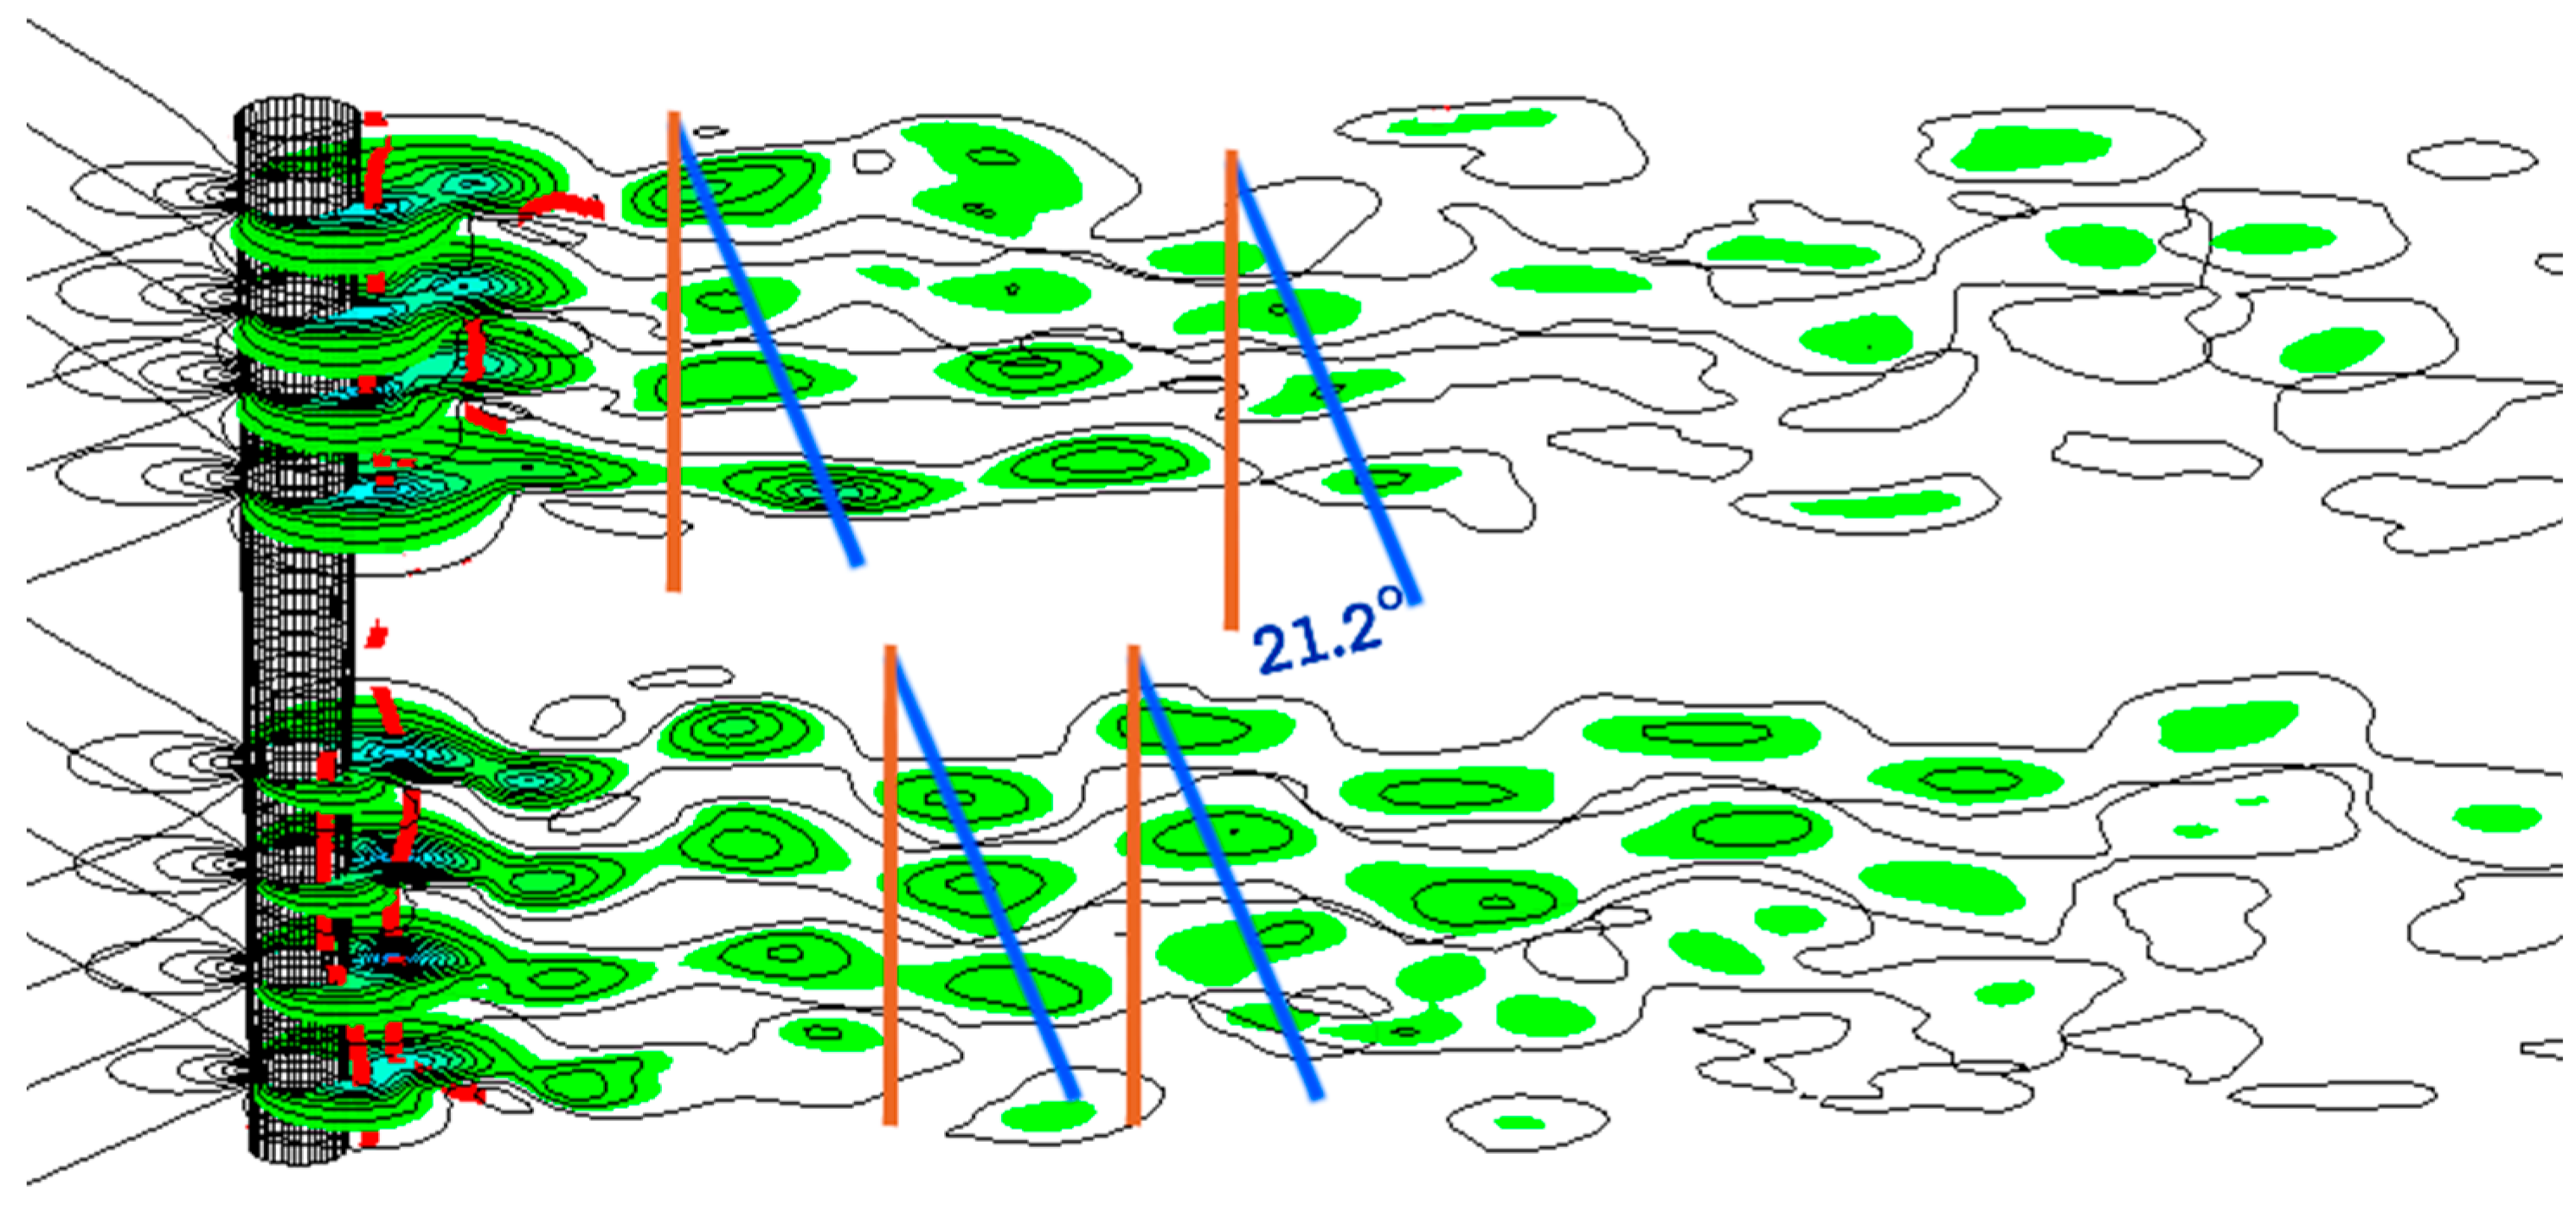
According to Figure 7, the axial vortices dominate the wake flow leading to fluctuations in pressure. Furthermore, the vortices might be more inclined before and after vortex splitting; the spacing between vortex lines extends in the lower-frequency side and reduces in the higher-frequency side. Figure 8 presents the vortex lines of vortex shedding in terms of pressure contours at a certain time step. The gradual transition from two peaks to three occupies the middle zone where no obvious vortex lines can be observed. Besides, the flow visualization showed that the formation of the cellular vortical structure and the roll-up of the shedding vortices occur right behind the tapered cylinder. That means the formation of the vortical structure is closely related to boundary-layer separation on the surface of the tapered cylinder.
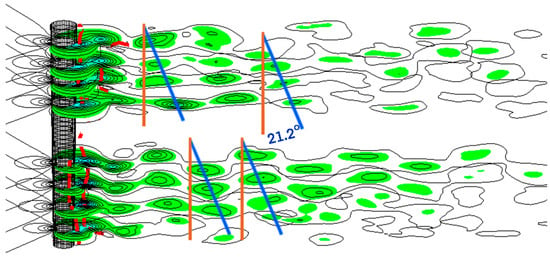
Figure 8.
Vortex lines of vortex shedding in terms of pressure contours at a certain time step, and the red dots indicate the vortex core just behind the tapered cylinder.
The separation of the boundary layer and instability of the wake flow is a major reason for the formation of the vortex street [19]; thus, it is inherently important in the formation of cellular vortical structures. In Figure 8, the inclination angle is measured to be 21.2 degrees after 6 mean diameters of the tapered cylinder. The invariance of the inclination angle of vortex lines in the downstream indicates the formation of vortical structures right behind the cylinder. Inside the vortex-splitting region, the vortex line inclination, phase difference, instantaneous frequency and vortex spacing change suddenly when vortex splitting occurs.
The shedding frequency determined by 2-D instability in the wake behind a tapered cylinder is not the same at different spanwise locations. The variation in diameter along the span is the reason for this. Consequently, the fluctuations in velocity and pressure at a single spanwise location introduce further disturbances at other locations. The shedding frequency that emerges is a result of both the local 2-D instability and the 3-D impact caused by disturbances spreading from other spanwise positions. If the supplementary disturbances grow and surpass the initially most unstable waves, it will diverge from its inherent value [18]. The resulting vortex-shedding frequency depends on the intensity, frequency and emitting position of the additional excitation. Similarly, the interaction or the spanwise coupling between the local stability waves and the perturbations from the tapered cylinder results in the cellular distribution of shedding frequencies.
The fluctuations of pressure dominate the wake flow and cause axial vortices. The vortex formation, inclination and downstream movement are affected by the disturbance transported by the momentum changes, e.g., the pressure gradient [5]. To study possible causes of oblique vortex-shedding formation behind the tapered cylinder, spanwise lines at the perimeter of the tapered cylinder were specified as @0° (cylinder’s front), @90° (cylinder’s right-hand side), @180° (cylinder’s back) and @270° (cylinder’s left-hand side) in Figure 2b (counter-clockwise and downstream-facing view).
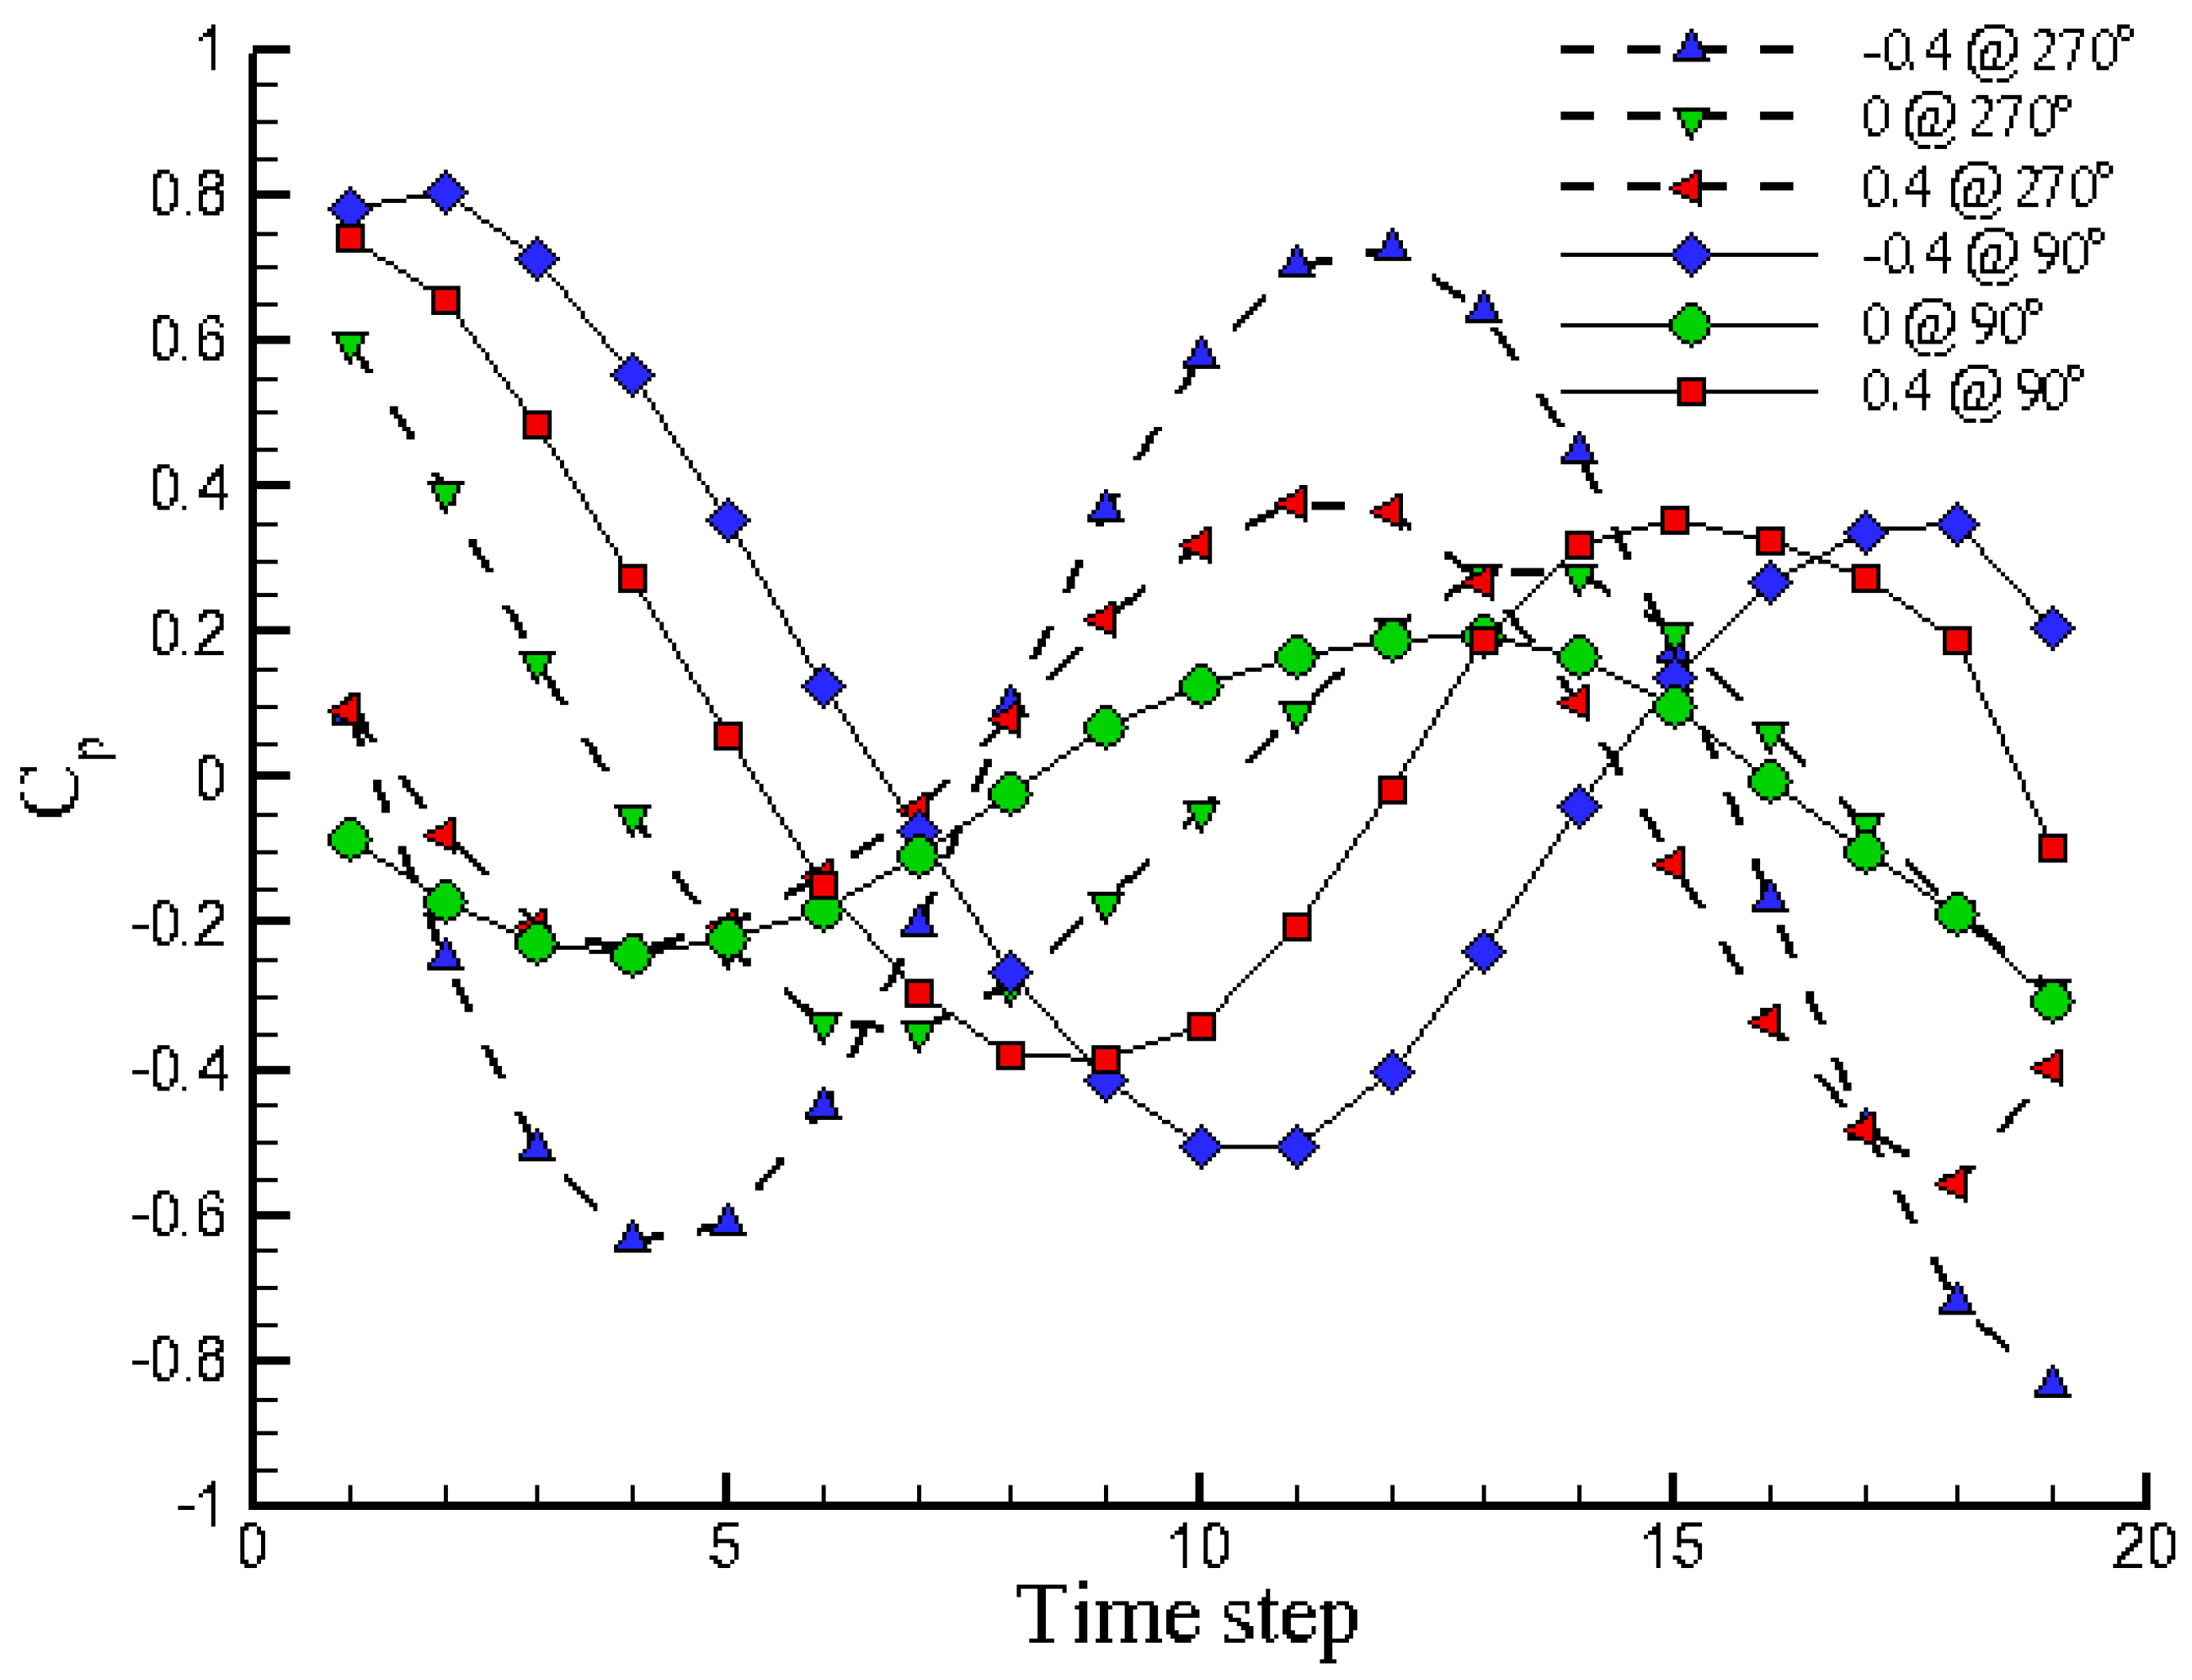
Figure 9 shows the time traces of pressure coefficients (Cp) on Z/L = 0, ±0.4 zones at positions of 90° and 270°. On the middle zone (Z/L = 0), the variations of Cp curves seem milder compared to those on both end zones. In addition, the Cp variations are out of phase on the same zone for positions of 90° and 270° because of vortex paring behind the tapered cylinder. At the same sides for both end zones, e.g., Z/L = ±0.4 at positions of 90° or 270°, the Cp variations are also out of phase but have smaller amplitudes. Figure 9 suggests that the Cp variations are not in phase and caused by the tapered geometry, as well as the instability of the resulting vortex shedding at positions of 90° and 270° of the cylinder.
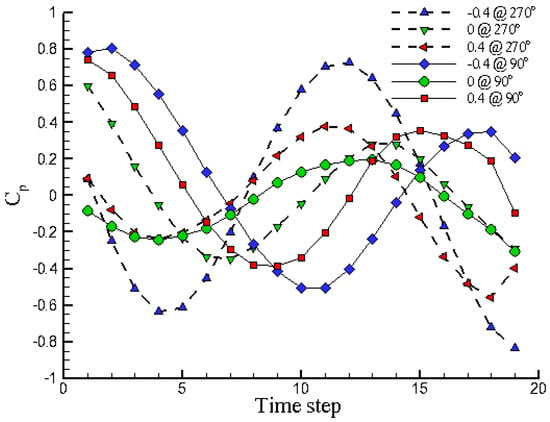
Figure 9.
Time traces of pressure coefficients on Z/L = 0, ±0.4 zones, at 90° and 270° positions.
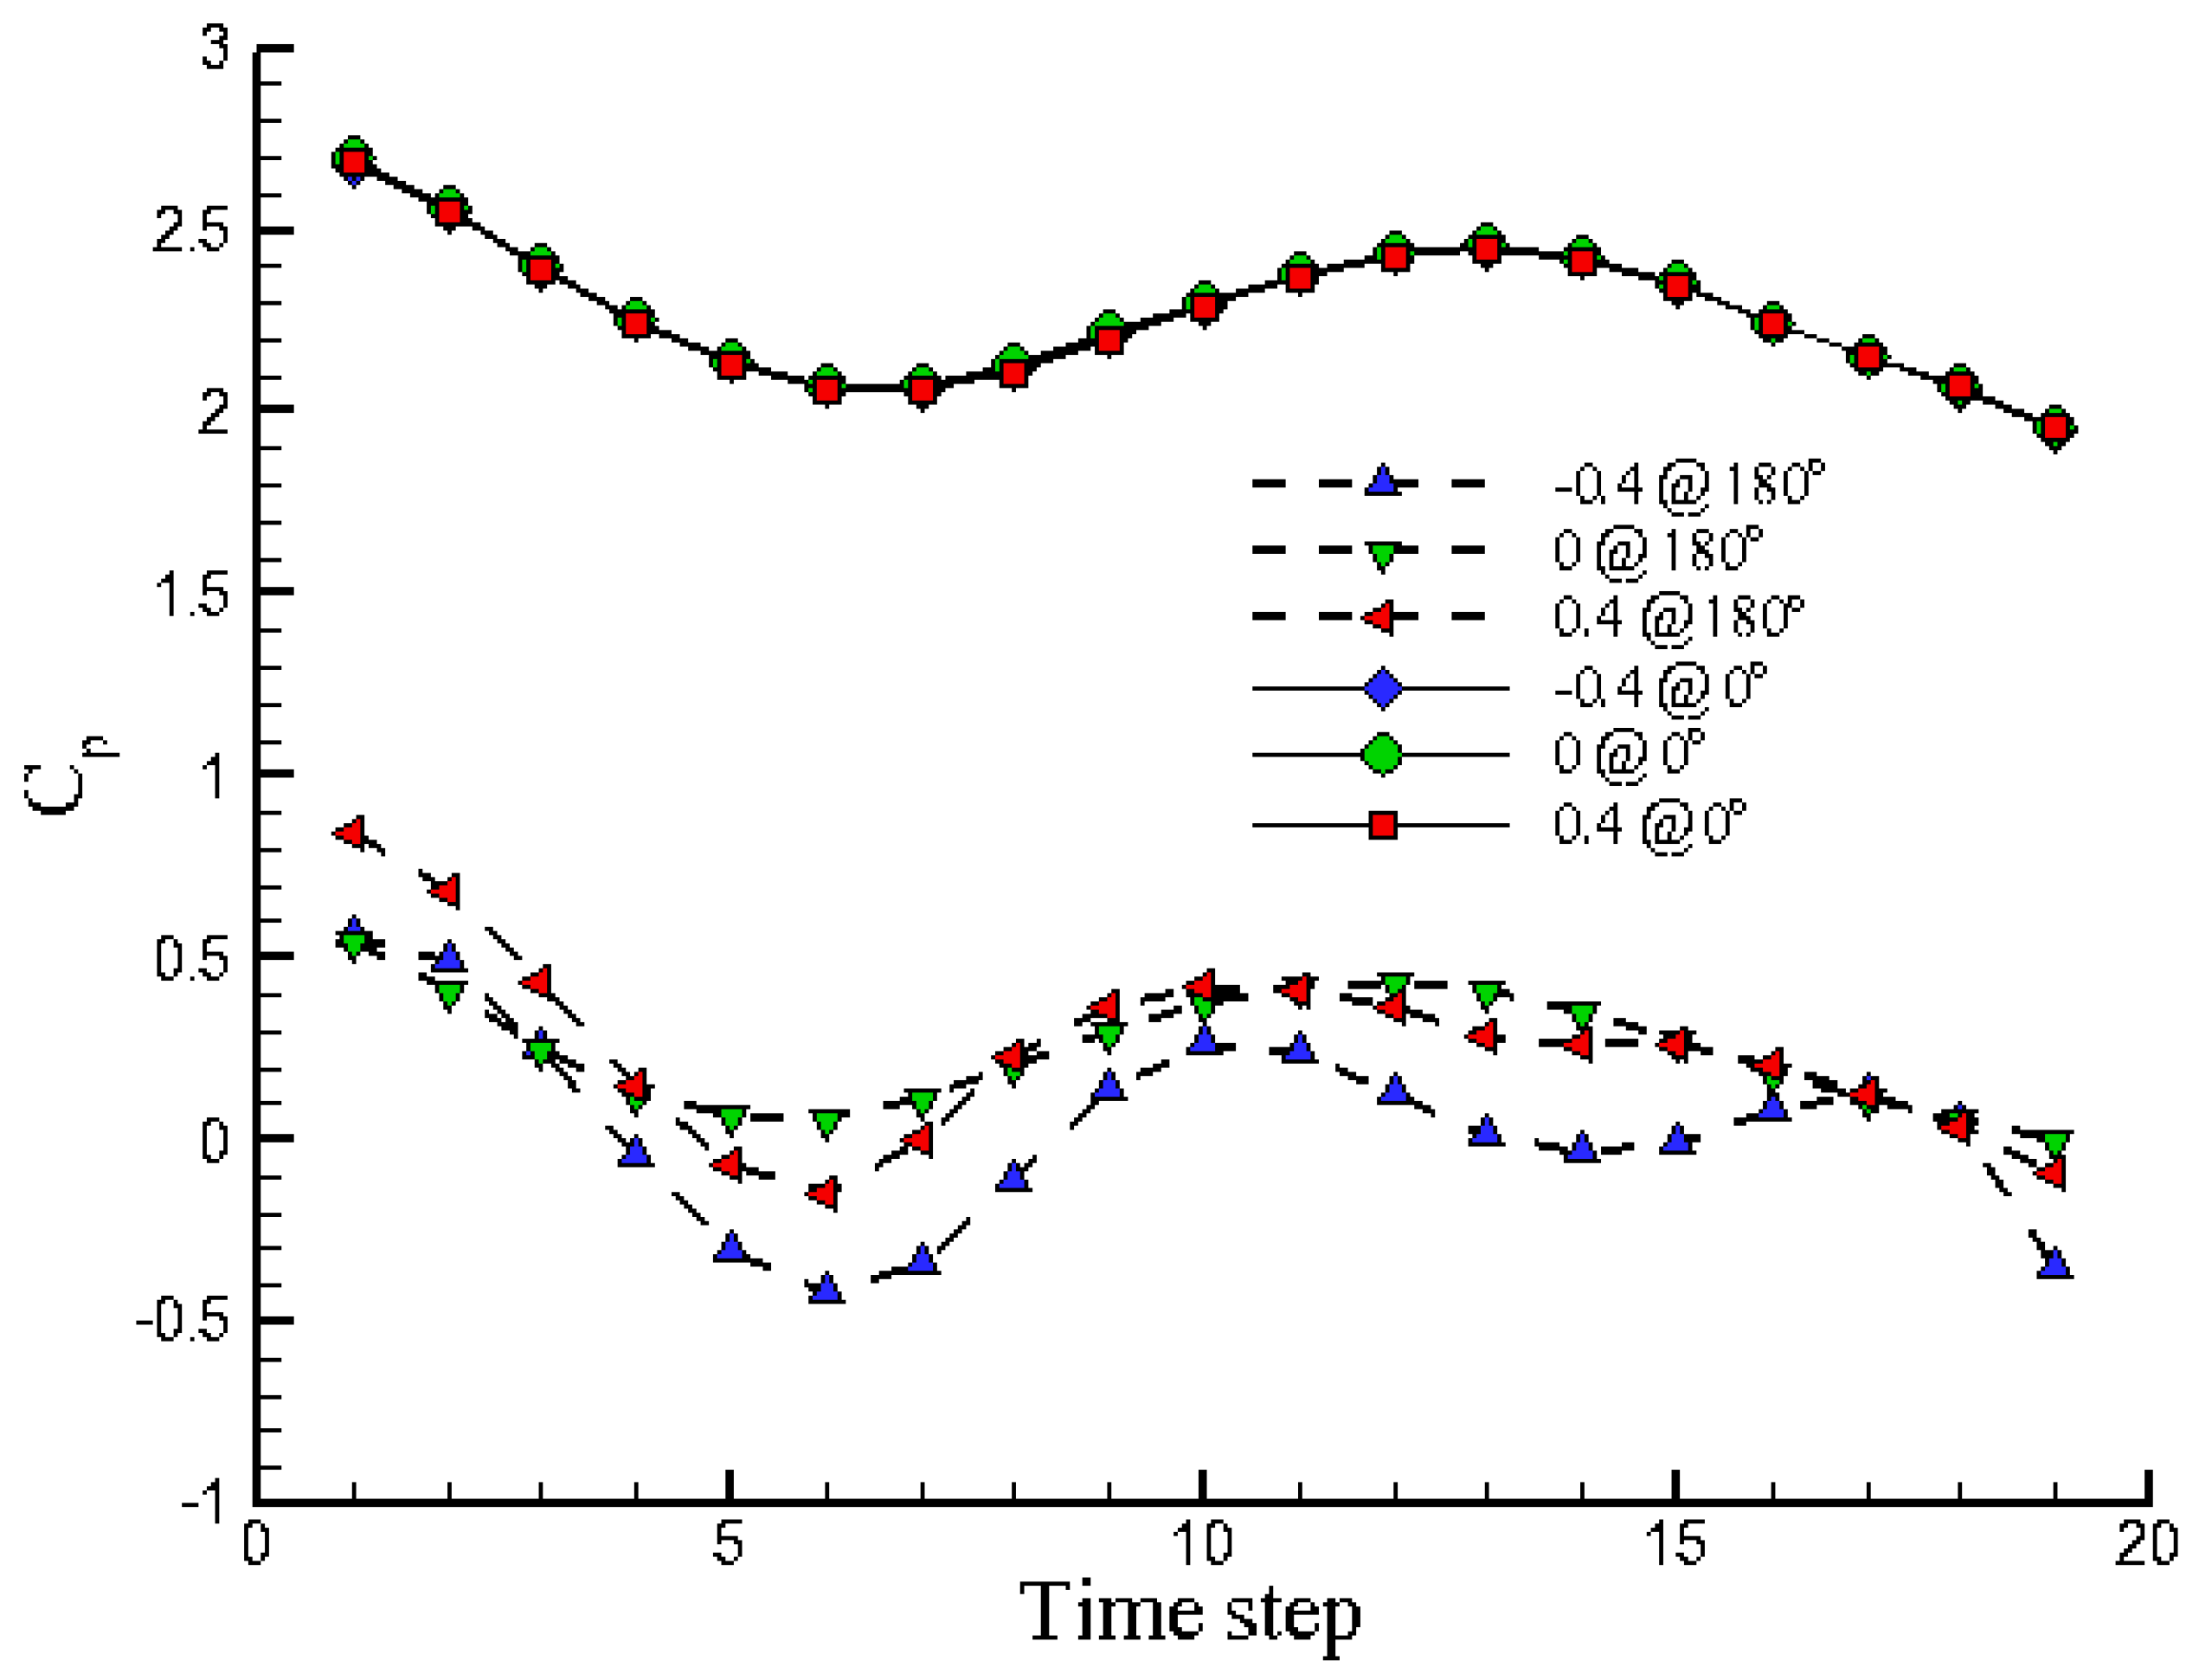
Figure 10 shows time traces of Cp curves on Z/L = 0, ±0.4 zones at positions of 0° and 180°, for about one cycle (20 time steps). Interestingly, at the front position, the Cp variations become wave-like even for those located at the forehead of the cylinder. This reveals that the disturbances from vortex shedding propagate not only in a spanwise direction but also in the upstream direction to the front side of the cylinder. However, one cycle is not long enough to show frequency modulation, and the three curves on Z/L = 0, ±0.4 zones, collapse to nearly become one. It also implies that the disturbances in the spanwise direction based on the tapered geometry of the cylinder hardly affect the upstream flow. Besides, at the position of 180° (behind the tapered cylinder), the Cp variations are almost in-phase and with more moderate amplitudes.
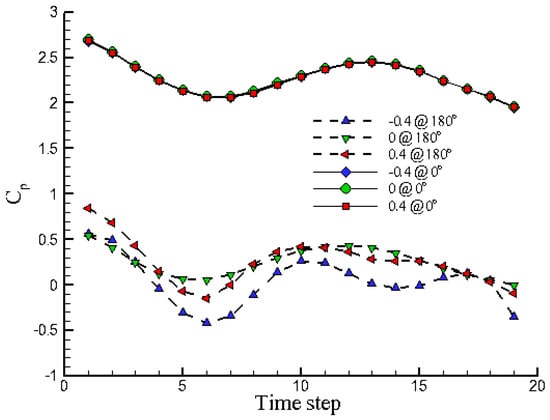
Figure 10.
Time traces of pressure coefficients on Z/L = 0, ±0.4 zones, at 0° and 180° positions.
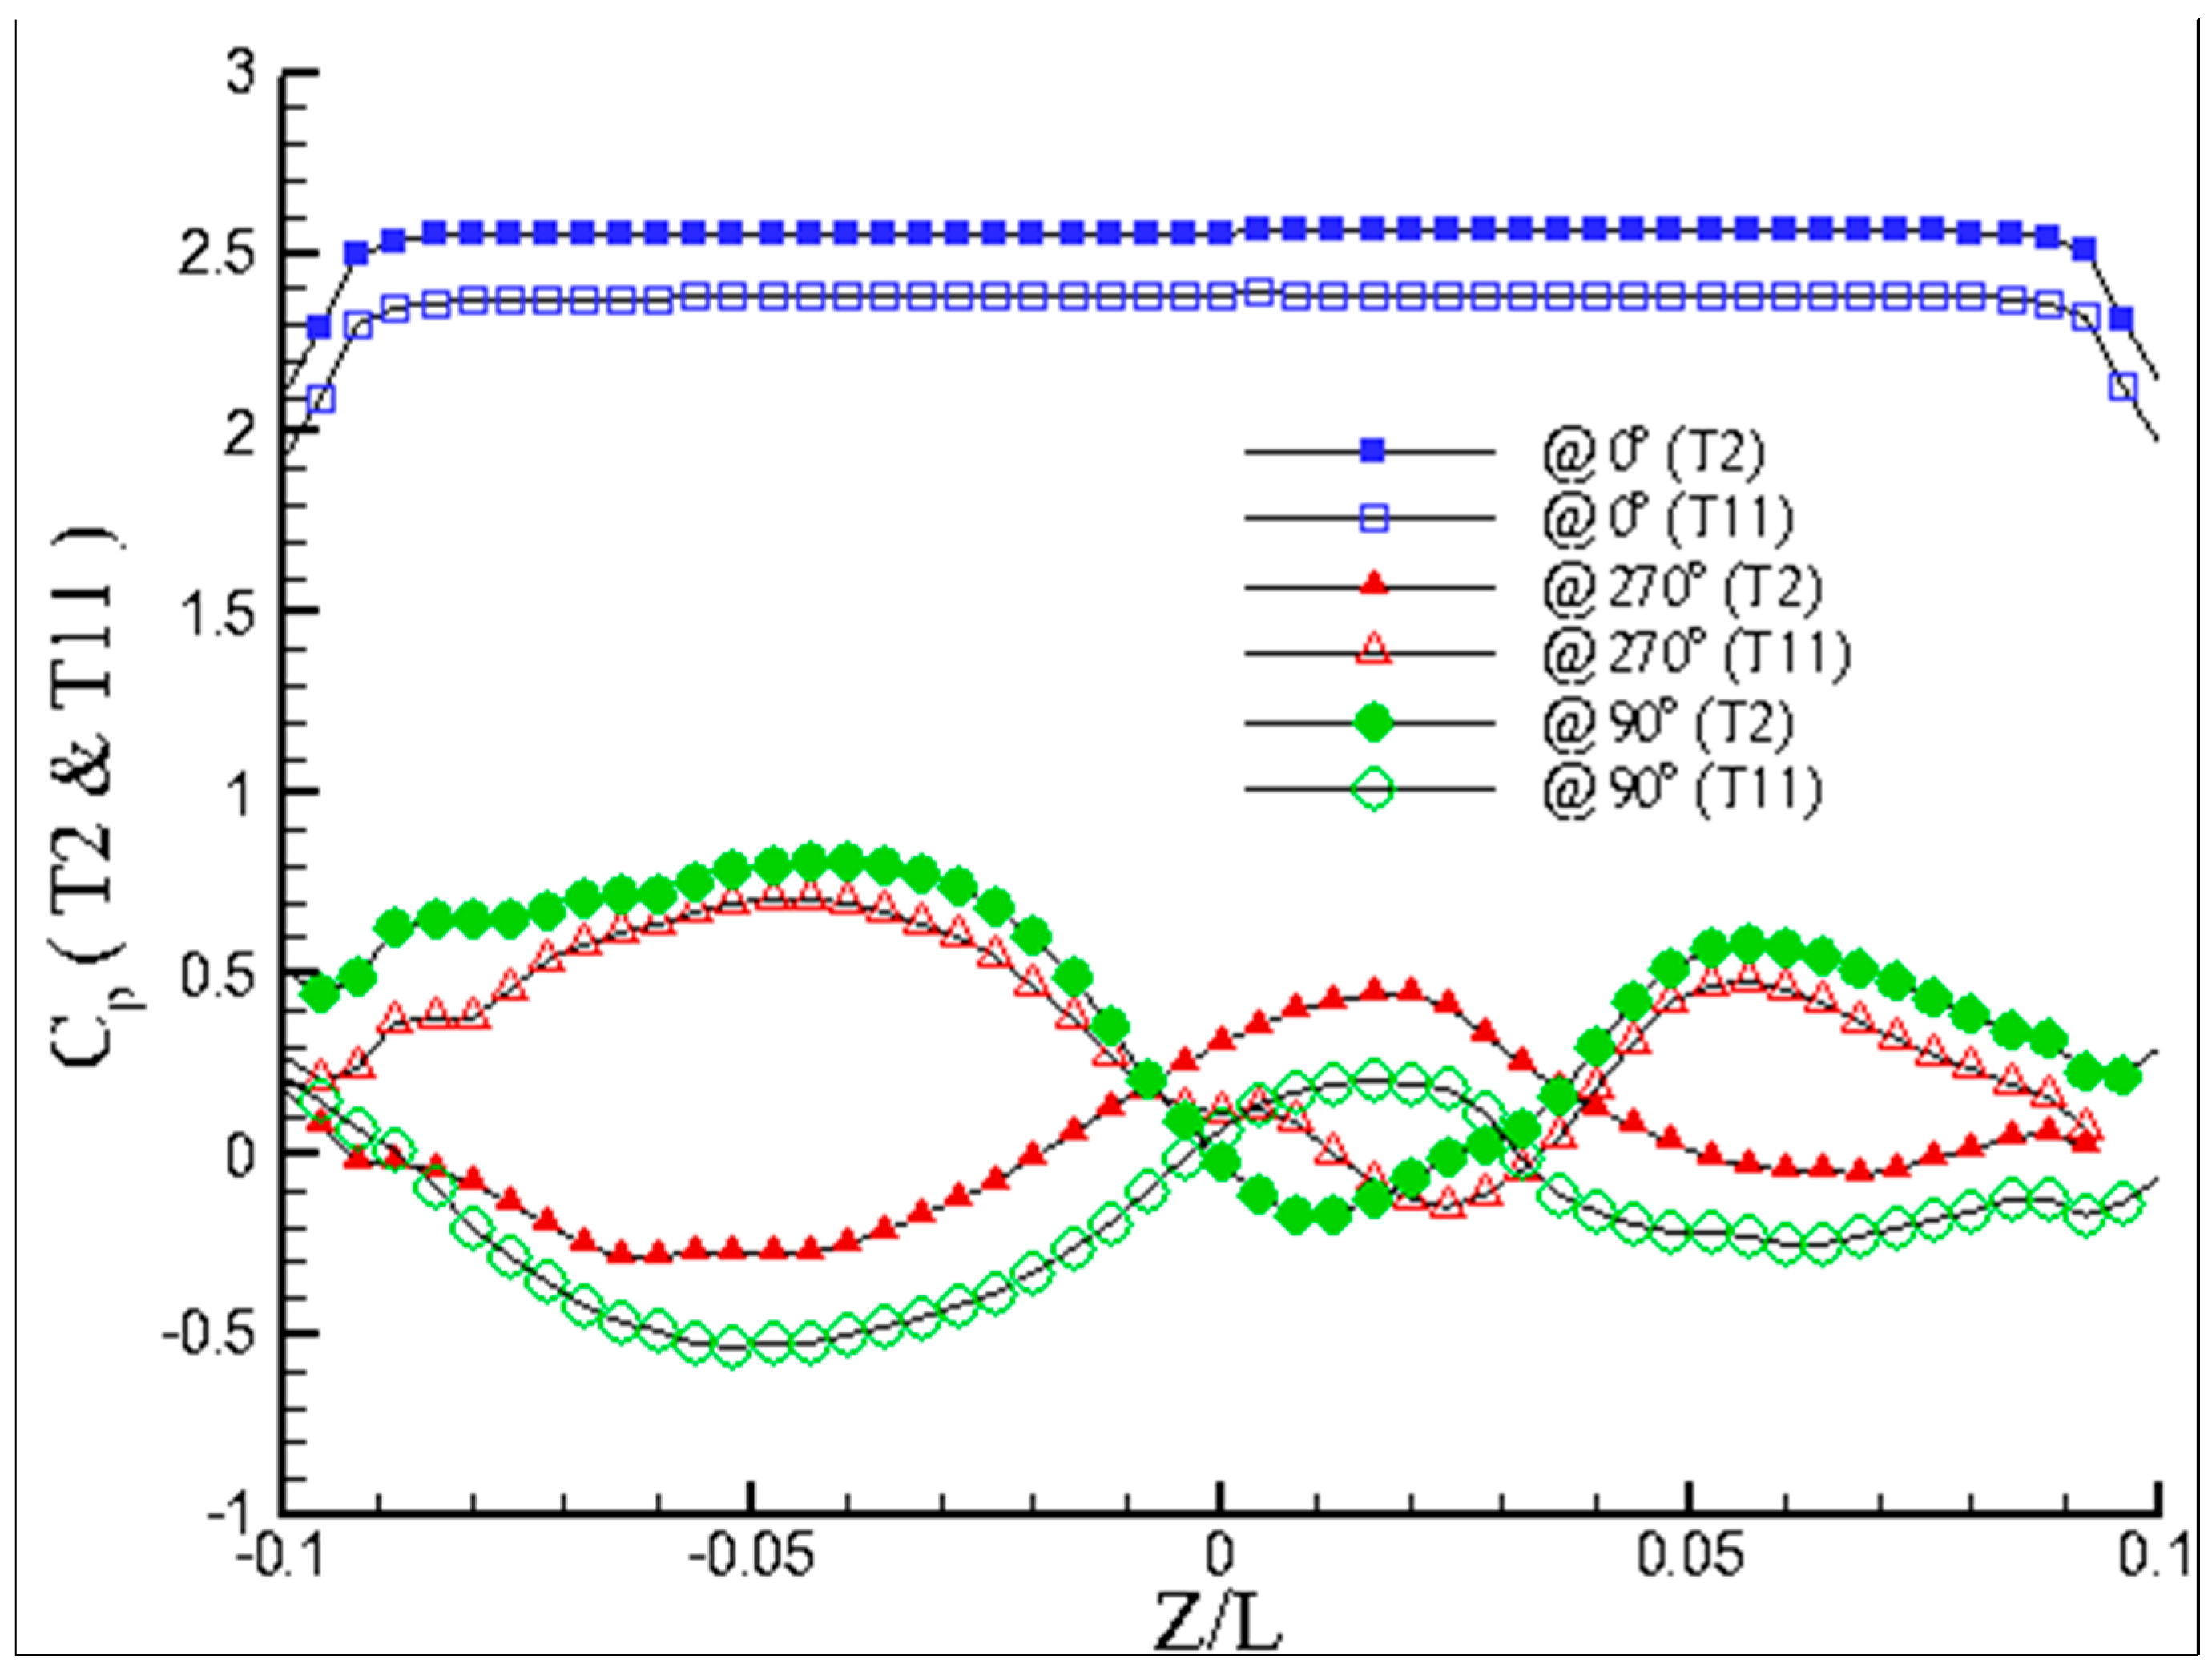
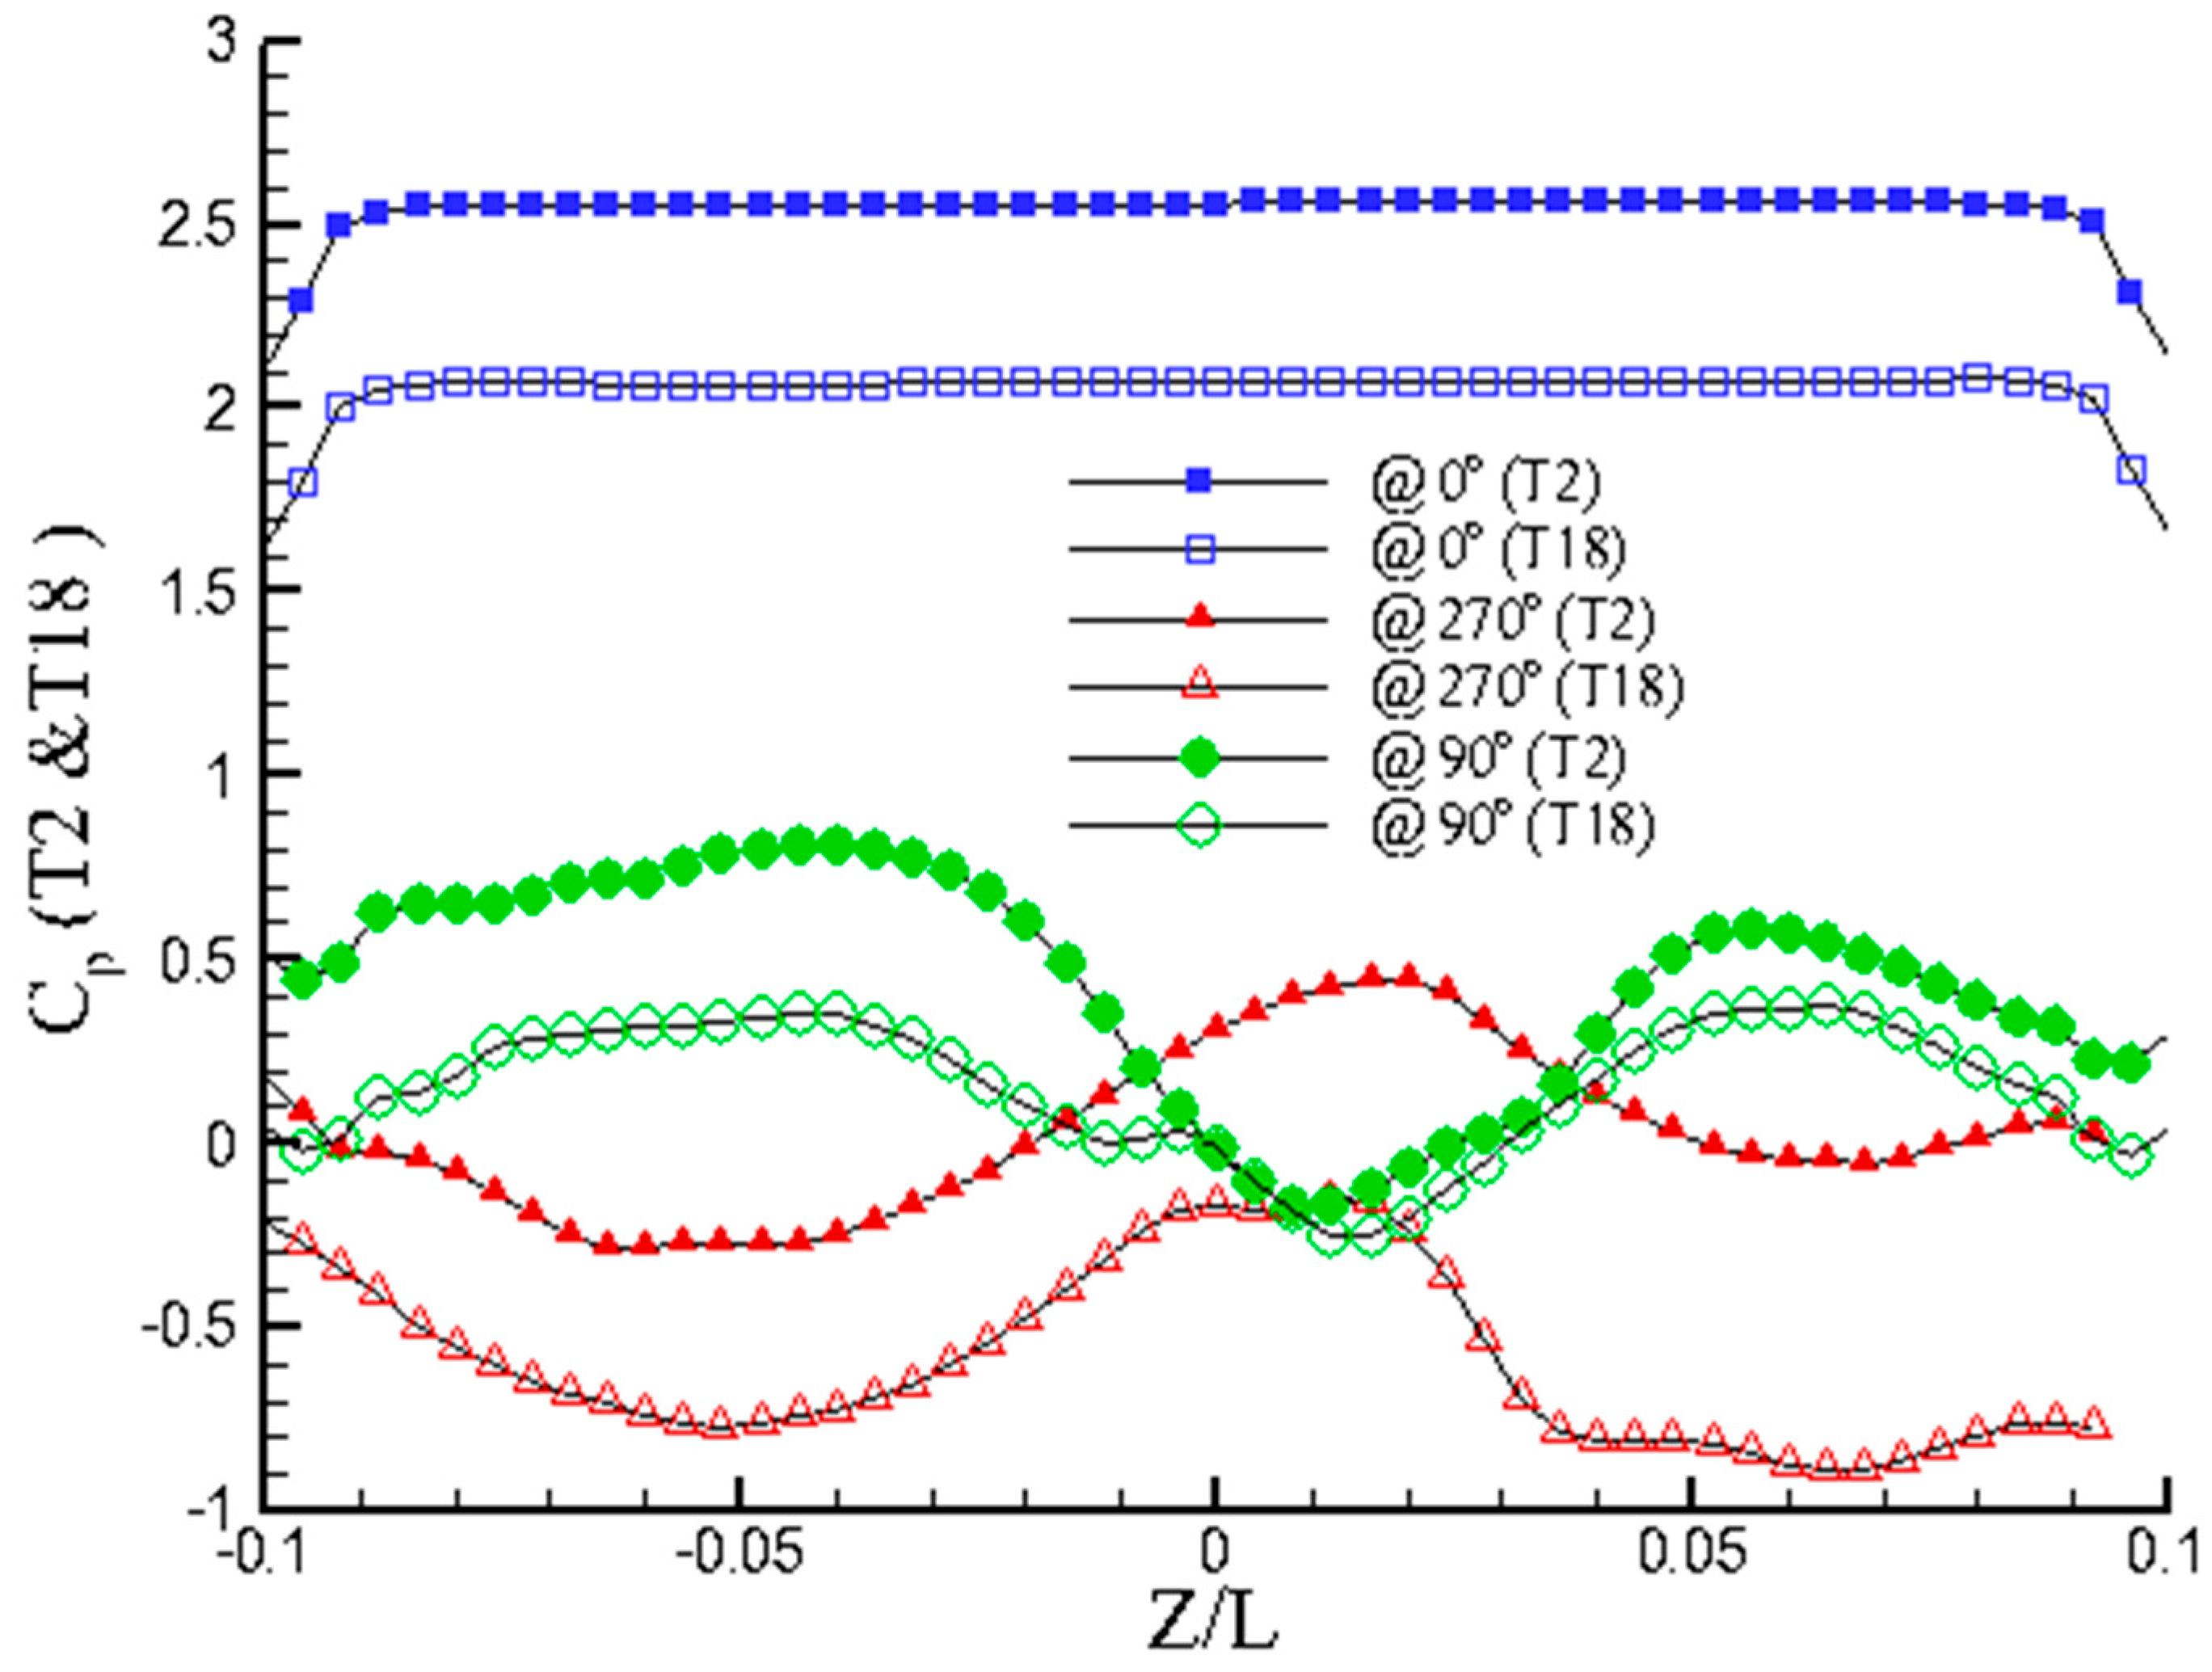
Figure 11 and Figure 12 show spanwise Cp curves on lines of 0°, 90° and 270° at time step T2 and T11 (half period interval) and at time step T2 and time step T18 (one period interval), respectively. In Figure 11 and Figure 12, spanwise Cp distributions on the 0° line of the cylinder act without obvious variations except around both ends of the cylinder. The flat Cp distributions along the front tapered cylinder indicate that the pressure at the cylinder’s front has no direct influence on the formation of vortex splitting. This also indicates that the spanwise disturbances from vortex shedding propagate in the upstream direction but do not significantly affect the pressure on the front side of the cylinder. Indeed, if the cylinder is tapered and there are no 3-D influences, the shedding frequencies are solely dictated by the local 2-D instability, resulting in nearly identical spanwise Strouhal numbers. Hence, the 3-D effect causes the Strouhal number to be different from the 2-D value in these simulations. The Cp curves on lines of 90° and 270° at T2 or T11 in Figure 11 are out of phase due to pairing shedding vortices. This is similar to T2 and T18 in Figure 10. In addition, the Cp curves on lines of 90° and 270° at time step T2 are out of phase with regards to both respective lines at T11 (due to half period), but they are in phase with both respective lines at T18 (due to one period).
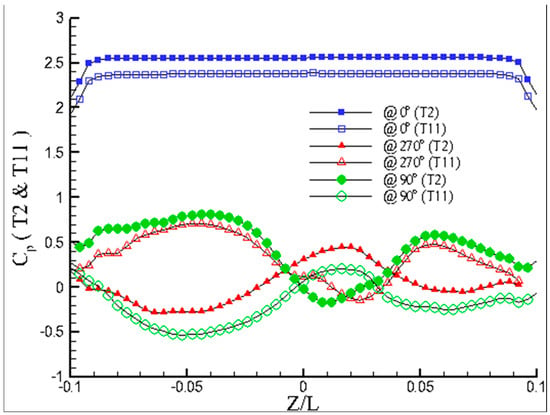
Figure 11.
Spanwise pressure coefficients on lines of 0°, 90° and 270° (at T2 and T11).
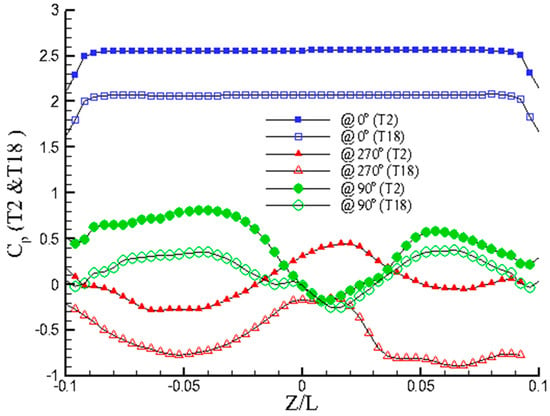
Figure 12.
Spanwise pressure coefficients on lines of 0°, 90° and 270° (at T2 and T18).
Indeed, a more accurate simulation requires a better grid system (including the number, type and distribution of grids) and powerful computing power. Because the presentation of the data results of this transient study requires much computing power, in the near future, we are going to use the supercomputer (NVIDIA A100 GPU*8) in I-Shou University, hoping to use the numerical technology developed in this research to simulate and explore more detailed flow fields and understand the physical mechanism of vortex-splitting formation.
5. Concluding Remarks
This work studied turbulent wakes behind a tapered circular cylinder via computational fluid dynamics. The Strouhal numbers of CFD results were validated through experiments, and the relatively small discrepancy of the location of Strouhal-number-jump between CFD and experimental results further support the validity of the present numerical techniques. Vortex splitting was successfully simulated based on our numerical results, which support the model proposed by Hsiao and Chiang [8]. The distributions of shedding frequencies have no apparent downstream changes implying that the formation of the vortical structures finished in the near wake. The numerical flow visualizations reveal that the disturbances from vortex shedding propagate not only in a spanwise direction but also in the upstream direction but do not significantly affect the pressure distribution on the front side of the cylinder. The formation of the cellular vortical structure and the roll-up of the shedding vortices occur on lines near 90° and 270°, i.e., near the flow separation point, along the tapered cylinder. Hence, the oscillation of the time trace of pressure at the front of the tapered cylinder is accompanied with the vortex-shedding behavior, and the spanwise pressure distribution varies because of the geometric inhomogeneity of the cylinder. As the boundary-layer theory suggested that all vorticities in the boundary layer are generated at the leading edge of the flat plate, the vortex splitting was initiated and completed at the flow separation point, which occurred near the lines of 90° and 270° along the tapered cylinder.
Author Contributions
Software, J.-L.C. and C.-L.C.; Investigation, J.-L.C.; Data curation, C.-L.C.; Writing—review & editing, S.-H.H.; Funding acquisition, S.-H.H. All authors have read and agreed to the published version of the manuscript.
Funding
This research received no external funding.
Data Availability Statement
The original contributions presented in the study are included in the article, further inquiries can be directed to the corresponding authors.
Acknowledgments
S.-H.H. acknowledged the support by the Matching Fund between Thammasat University Research Fund and the National Taipei University of Technology (Contract No. MF 3/2567 and NTUT-TU-112-02).
Conflicts of Interest
The authors declare no conflict of interest.
References
- White, F.M. Fluid Mechanics, 7th ed.; McGraw–Hill Companies, Inc.: New York, NY, USA, 2011. [Google Scholar]
- Gaster, M. Vortex shedding from circular cylinders at low Reynolds numbers. J. Fluid Mech. 1971, 46, 749–756. [Google Scholar] [CrossRef]
- Gaster, M. Vortex shedding from slender cones at low Reynolds numbers. J. Fluid Mech. 1969, 38, 565–576. [Google Scholar] [CrossRef]
- Eisenlohr, H.; Eckelmann, H. Vortex splitting and its consequences in the vortex street wake of cylinders at low Reynolds number. Phys. Fluids A Fluid Dyn. 1989, 1, 189–192. [Google Scholar] [CrossRef]
- Piccirillo, P.S.; Van Atta, C.W. An experimental study of vortex shedding behind linearly tapered cylinders at low Reynolds number. J. Fluid Mech. 1993, 246, 163–195. [Google Scholar] [CrossRef]
- Griffin, O.M. Vortex Shedding From Bluff Bodies in a Shear Flow: A Review. J. Fluids Eng. 1985, 107, 298–306. [Google Scholar] [CrossRef]
- Williamson, C.H.K. Vortex Dynamics in the Cylinder Wake. Annu. Rev. Fluid Mech. 1996, 28, 477–539. [Google Scholar] [CrossRef]
- Hsiao, F.-B.; Chiang, C.-H. Experimental study of cellular shedding vortices behind a tapered circular cylinder. Exp. Therm. Fluid Sci. 1998, 17, 179–188. [Google Scholar] [CrossRef]
- Miau, J.; Wang, J.; Chou, J.; Wei, C. Low-frequency fluctuations in the near-wake region of a trapezoidal cylinder with low aspect ratio. J. Fluids Struct. 2003, 17, 701–715. [Google Scholar] [CrossRef]
- Peng, B.H.; Miau, J.J.; Bao, F.; Weng, L.D.; Chao, C.C.; Hsu, C.C. Performance of vortex shedding from a circular cylinder with a slit normal to the stream. Flow Meas. Instrum. 2012, 25, 54–62. [Google Scholar] [CrossRef]
- Visscher, J.; Pettersen, B.; Andersson, H.I. Experimental study on the wake behind tapered circular cylinders. J. Fluids Struct. 2011, 27, 1228–1237. [Google Scholar] [CrossRef]
- Seyed-Aghazadeh, B.; Carlson, D.W.; Modarres-Sadeghi, Y. The influence of taper ratio on vortex-induced vibration of tapered cylinders in the crossflow direction. J. Fluids Struct. 2015, 53, 84–95. [Google Scholar] [CrossRef]
- Patankar, S.V. Numerical Heat Transfer and Fluid Flow; Hemisphere Publishing Corp.: Washington, DC, USA, 1980. [Google Scholar]
- Shyy, W. Computational Modeling for Fluid Flow and Interfacial Transport; Courier Dover Publications: Mineola, NY, USA, 2006. [Google Scholar]
- Jespersen, D.; Levit, C. Numerical simulation of flow past a tapered cylinder. In Proceedings of the 29th Aerospace Sciences Meeting, American Institute of Aeronautics and Astronautics, Reno, NV, USA, 7–10 January 1991. [Google Scholar]
- VallÈS, B.; Andersson, H.I.; Jenssen, C.B. Oblique vortex shedding behind tapered cylinders. J. Fluids Struct. 2002, 16, 453–463. [Google Scholar] [CrossRef]
- Parnaudeau, P.; Heitz, D.; Lamballais, E.; Silvestrini, J.-H. Direct numerical simulations of vortex shedding behind cylinders with spanwise linear nonuniformity. J. Turbul. 2007, 8, 13. [Google Scholar] [CrossRef]
- Chen, J.-L. Frequency characteristics of a vortex flowmeter in various inlet velocity profiles. Adv. Mech. Eng. 2017, 9, 1687814017690507. [Google Scholar] [CrossRef]
- Noack, B.R.; Ohle, F.; Eckelmann, H. On cell formation in vortex streets. J. Fluid Mech. 1991, 227, 293–308. [Google Scholar] [CrossRef]
- Jeng, Y.N.; Chen, J.L. Geometric conservation law of the finite-volume method for the SIMPLER algorithm and a proposed UPWIND scheme. Numer. Heat Transf. Part B Fundam. 1992, 22, 211–234. [Google Scholar] [CrossRef]
- Rodi, W. Comparison of LES and RANS calculations of the flow around bluff bodies. J. Wind. Eng. Ind. Aerodyn. 1997, 69, 55–75. [Google Scholar] [CrossRef]
- Pope, S.B. Turbulent Flows; Cambridge University Press: Cambridge, UK, 2003. [Google Scholar]
- Omori, T.; Jakirlić, S.; Tropea, C.; Obi, S. Shearless and sheared flow past a circular cylinder: Comparative analysis by means of LES. Int. J. Heat Fluid Flow 2008, 29, 703–720. [Google Scholar] [CrossRef]
- Jeng, Y.N.; Huang, P.; Cheng, Y.C. Decomposition of one-dimensional waveform using iterative Gaussian diffusive filtering methods. Proc. R. Soc. A Math. Phys. Eng. Sci. 2008, 464, 1673–1695. [Google Scholar] [CrossRef]
- Schlichting, H.; Gersten, K. Boundary-Layer Theory, 9th ed.; Springer: Berlin/Heidelberg, Germany, 2017. [Google Scholar]
- Achenbach, E.; Heinecke, E. On vortex shedding from smooth and rough cylinders in the range of Reynolds numbers 6 × 10³ to 5 × 10⁶. J. Fluid Mech. 1981, 109, 239–251. [Google Scholar] [CrossRef]
- Rocchi, D.; Zasso, A. Vortex shedding from a circular cylinder in a smooth and wired configuration: Comparison between 3D LES simulation and experimental analysis. J. Wind. Eng. Ind. Aerodyn. 2002, 90, 475–489. [Google Scholar] [CrossRef]
- Kravchenko, A.G.; Moin, P. Numerical studies of flow over a circular cylinder at ReD = 3900. Phys. Fluids 2000, 12, 403–417. [Google Scholar] [CrossRef]
- Ouvrard, H.; Koobus, B.; Dervieux, A.; Salvetti, M.V. Classical and variational multiscale LES of the flow around a circular cylinder on unstructured grids. Comput. Fluids 2010, 39, 1083–1094. [Google Scholar] [CrossRef]
- Jeng, Y.N.; Chen, J.L. Truncation error analysis of the finite volume method for a model steady convective equation. J. Comput. Phys. 1992, 100, 64–76. [Google Scholar] [CrossRef]
- Griffith, M.D.; Leontini, J.; Thompson, M.C.; Hourigan, K. Vortex shedding and three-dimensional behaviour of flow past a cylinder confined in a channel. J. Fluids Struct. 2011, 27, 855–860. [Google Scholar] [CrossRef]
Disclaimer/Publisher’s Note: The statements, opinions and data contained in all publications are solely those of the individual author(s) and contributor(s) and not of MDPI and/or the editor(s). MDPI and/or the editor(s) disclaim responsibility for any injury to people or property resulting from any ideas, methods, instructions or products referred to in the content. |
© 2024 by the authors. Licensee MDPI, Basel, Switzerland. This article is an open access article distributed under the terms and conditions of the Creative Commons Attribution (CC BY) license (https://creativecommons.org/licenses/by/4.0/).

