Article

Bursting Sand Balloons

by
Gustavo Gómez
1,†,
Francisco José Higuera
2,†,
Florencio Sánchez-Silva
1,† and
Abraham Medina
3,*,†
1
SEPI ESIME Zacatenco, Instituto Politecnico Nacional, Av. Miguel Othon de Mendizabal SN, La Escalera, Ciudad de México 07738, Mexico
2
ETSIAE, Universidad Politecnica de Madrid, Plaza Cardenal Cisneros 3, 28040 Madrid, Spain
3
SEPI ESIME Azcapotzalco, Instituto Politecnico Nacional, Av. de las Granjas 682, Col. Sta. Catarina Azcapotzalco, Ciudad de México 02250, Mexico
*
Author to whom correspondence should be addressed.
These authors contributed equally to this work.
Fluids 2024, 9(2), 49; https://doi.org/10.3390/fluids9020049
Submission received: 7 December 2023 / Revised: 8 February 2024 / Accepted: 8 February 2024 / Published: 14 February 2024
(This article belongs to the Collection Advances in Flow of Multiphase Fluids and Granular Materials)

Abstract

:
Using linear elasticity theory, we describe the mechanical response of dry non-cohesive granular masses of Ottawa sand contained by spherical rubber balloons subject to sudden bursting in the earliest instants of the event. Due to the compression imposed by the balloon, the rupture produces a fast radial expansion of the sand front that depends on the initial radius R 0 , the initial pressure p originated by the balloon, and the effective modulus of compression K e . The hydrostatic compression approximation allows for the theoretical study of this problem. We found a linear decompression wave that travels into the sand and that induces a radial expansion of the granular front in the opposite direction with similar behavior to the wave but with a slightly lower speed.

1. Introduction

Dry cohesionless granular materials can be seen as a cluster of discrete macroscopic particles interacting by contact. Examples include seeds, sand, coals, pharmaceutical powders, etc. Despite their apparent simplicity, they show unique bulk properties that are different from other familiar forms of matter such as solids, gases, or liquids. The unusual behavior of granular materials is clearly and simply illustrated in various ordinary processes such as the unique pressure distribution that arises from their storage in bins, known as the Janssen effect [1,2,3,4,5]. Different works have been carried out to predict the static stresses in vertical circular silos, which include much more detailed cases such as silos under non-uniform temperature distributions [6], overall deformation of circular silos [7], or strong changes in the pressure distribution during emptying regimes caused by defects in the silo structure [8]. It is worth noting that a linear elasticity approach has been used in previous referenced works.
While assuming that the granular material under pressure has a linear elastic behavior, other authors have theoretically analyzed the behavior of the granular medium undergoing a pressure step within a horizontal cylindrical pipe [9]. In summary, they found an interesting interplay between the stopping front of the grains and the pressure front, i.e., that the granular front and the pressure front can move with different speeds. Owing to this finding, it is feasible to predict when the grains will be arrested as well as the resulting final equilibrium pressure profile. For us, this model is of great interest because of the occurrence of an acoustic wave propagating at a speed of c = E e / ρ 1 / 2 , where E e is the effective Young’s modulus and ρ is the bulk density.
Pricking a water-filled balloon is a ludic experiment that reveals surprising effects, such as the sudden liberation and subsequent breaking up of the mass of water [10] and the accelerated propagation of the crack vertically along the elastic membrane [11], among others. Moreover, pricking an air-inflated balloon features a complex phenomenon due to the presence of fragmentation patterns of the membrane in a treelike fragmentation network [12].
However, due to the frictional interaction of each segment with the grains, pricking a spherical sand-filled rubber balloon with a sharp needle does not produce an overall rupture of its elastic film. From an experimental point of view, in order to achieve an extensive break off of the balloon membrane, we directed a flame thrower at it; consequently, the highly stretched membrane yielded very quickly, inducing a rapid peeling away from the granular mass. The ensuing sudden decompression of the granular solid induced a decompression wave traveling inward to the granular mass. As a mechanical response, there is a fast radial expansion or displacement of the granular material which resembles the fragmentation of explosively driven expanding granular shells, where the blast wave front and the particle front travel at different directions and speeds [13].
In the current work, we experimentally and theoretically study the mechanical response of a mass of cohesionless granular material having a near spherical shape and initial mean radius R 0 when it is suddenly relieved of the compressive radial pressure p. The rapid radial expansion changes the volume of the body but does not change its shape; such a deformation is a hydrostatic compression, and as such a specific theoretical approach [14] should be used for this elastic deformation. Our goal is to understand how the granular mass expands elastically as a function of R 0 , p, and the effective hydrostatic compression modulus K e , which is modeled in a simple form. This treatment led us to the discovery of a linear decompression wave which cannot be visualized; instead, we experimentally observed the rapid expansion of the spherical mass, which we understand as a response to the propagation of the elastic wave into the sand mass. The motion of the grains was experimentally tracked by means of high-speed video recording, allowing us to determine that the sand displacement front moves at a constant speed. For prolonged time lapses, gravity dominates and causes the grains to spill, and the model fails to apply.
The division of this work is as follows. In Section 2, we describe and characterize the materials used in our experiments. In Section 3, we report a series of experiments involving the systematic bursting of sand-filled balloons of different sizes and provide measurements of the radial displacement of the sand mass as a function of time. In Section 4, we present the theoretical model of the decompression and its solution in terms of a linear wave. In Section 5, we provide data for K e , used in the computation of the decompression waves, based on a statistical model proposed by Walton [15], K e w , and a new estimation based on the elastic approach discussed later on, K e ; plots of the propagation of the elastic wave are presented as well. Finally, in Section 6 we provide the main conclusions of this work.

2. Materials

Rubber balloons were filled using the following procedure: first, we filled a bottle with a specific mass M of Ottawa sand (average diameter 0.93 × 10 3 m [16], bulk density ρ = 1670 k g / m 3 , packing factor or volume fraction η = 0.63 , angle of repose θ r = 0.58 
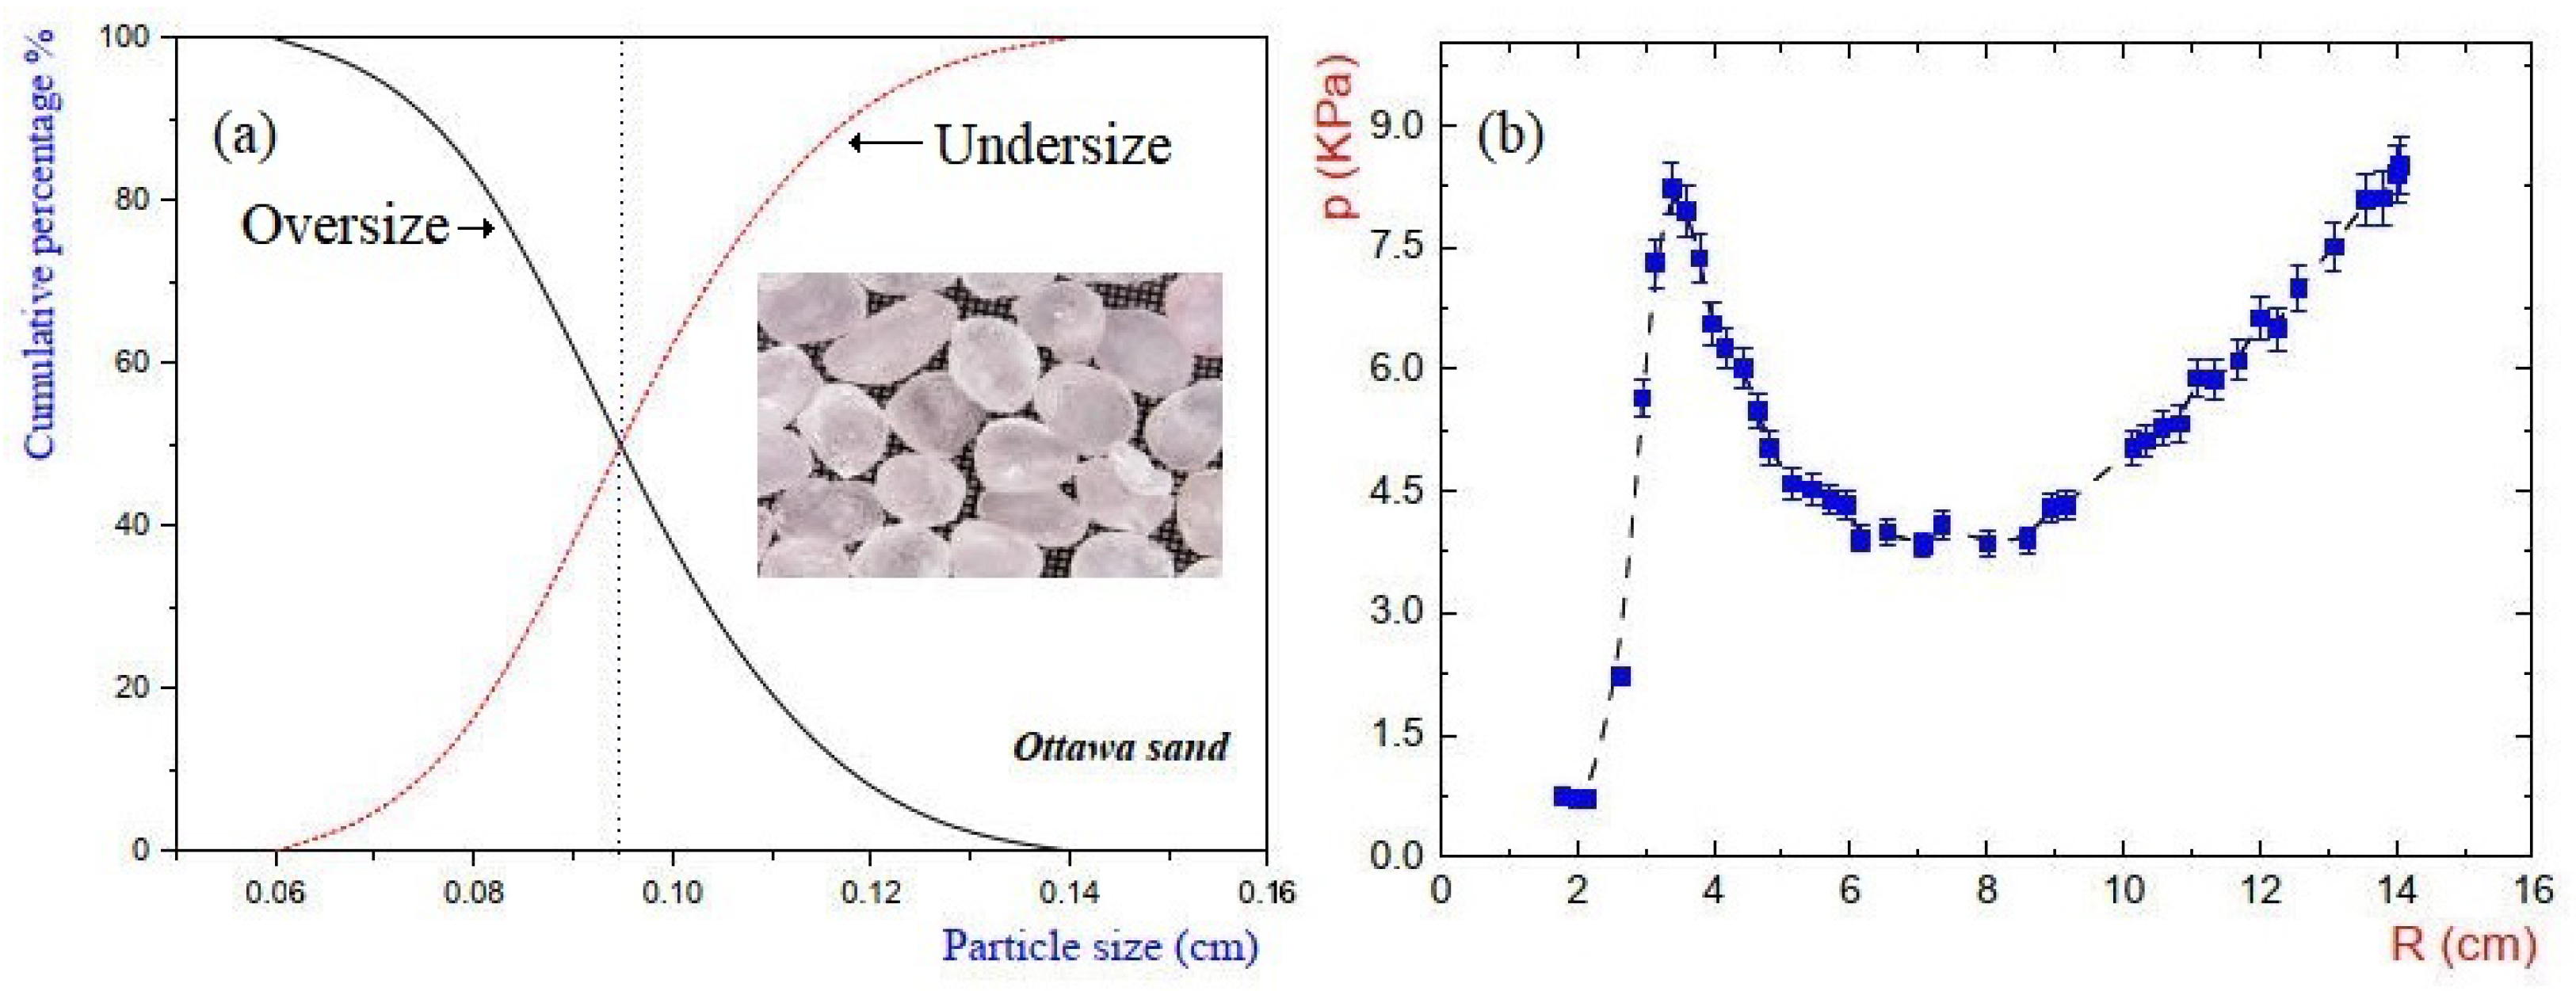
rad), which is a standard specially-graded natural silica sand composed of rounded quartz grains with Young’s modulus E = 110 ± 5 GPa, density ρ g = 2650 k g / m 3 , coefficient of restitution C O R 1 for velocities lower than 1.6 m/s [17], and Poisson’s ratio σ = 0.08 . These last properties were measured elsewhere [18]; see Figure 1a. Simultaneously, we inflated the balloon to a desired average radius R 0 by blowing air through the nozzle of a compressor. Then, we attached the mouth of the inflated balloon to the bottleneck, which was kept standing up on top of a table. Then, by rotating the bottle–balloon system 180°, the grains were allowed to flow as driven by gravity, filling the balloon to the brim. Finally, it was sealed and gently formed into a spherical shape. This procedure was used to obtain sand-filled balloons of different average radius and specific mass. The section of the laboratory in which the experiments were carried out was climate controlled ( 298.2 ± 1 K and 40 ± 10 % R.H.).
The value of the absolute pressure exerted by the balloon against the mass of sand when the balloon reaches a given radius R = R 0 must be determined. Additional experiments were carried out to determine the pressure as a function of the balloon’s radius. We performed measurements of the pressure within the balloon when it was inflating using a Dwyer D1635 pressure transducer, which operates within an absolute pressure range between 0 and 103.24 kPa and operating temperature between 256.15 and 473.15 K, compatible with both liquids and gases. For data acquisition, it was necessary to develop a LabVIEW program, and we used a National Instruments SCB-68 data acquisition module. Figure 1b shows a typical plot of the inflation pressure p as a function of the stretched R during the inflation of a given balloon. Values of the pressure p ( R ) from this plot, are used in the upcoming computations to determine the corresponding pressure p ( R = R 0 ) for a balloon of a given radius R 0 . Incidentally, plots of this type are typical for near-spherical and cylindrical rubber balloons [19,20,21].
The physics of the inflation of rubber balloons evinces a number of interesting facts. The pressure–deformation curve in spherical balloons quickly reaches the maximum pressure (as in this stage the pressure depends on the inverse of the balloon’s radius, which initially is very small); this part of the curve is the first increasing branch. Upon further inflation, the pressure decreases, because the balloon’s radius increases (such a region is the first decreasing branch), after which pressure increases rapidly again until the bursting point. The second ascending branch is due to the ultimate stiffening effect as a result of the influence of the molecular chain structure [21].
In our experiments, when we filled the balloons, the air volume allowing the radius R 0 to be reach was exchanged for the sand volume, and we assumed that the respective inflation pressure p ( R = R 0 ) acts on the granular mass instead. In this sense, the plot in Figure 1b is useful.

3. Experiments

The fast decompression of the granular mass was experimentally visualized and measured using high-speed photography and digital image processing. We employed a Red Lake model HG-100K/HG-LE high-speed camera to video record the burst of the balloon at 1600 frames per second. In the experiments, rubber balloons were filled with different masses of Ottawa sand, as indicated in Table 1, which also provides the mean radii ( R 0 ) reached by the balloons when a certain amount of mass was introduced. After the balloons were filled with sand, they were laid to hang (see Figure 2) and then burst by exposure to an intense flame produced by a plumber’s blow torch (butane/propane gas). The hottest point was approximately 1372.2 K, though the actual temperature a heated component can attain is much lower than this, and depends on the burner along with the thermal properties of the component and its surroundings. After any burst, we immediately collected the sand manually and no sensitive temperature change was noticed. In the same line, we highlight that if air warming occurs then its density decreases; thus, the ratio of ρ g / ρ a i r must be larger than ρ g / ρ a i r = 2240 which was computed at T r o o m = 298.2 K. A large value of this quotient indicates that the grain dynamics dominate the air dynamics [22].
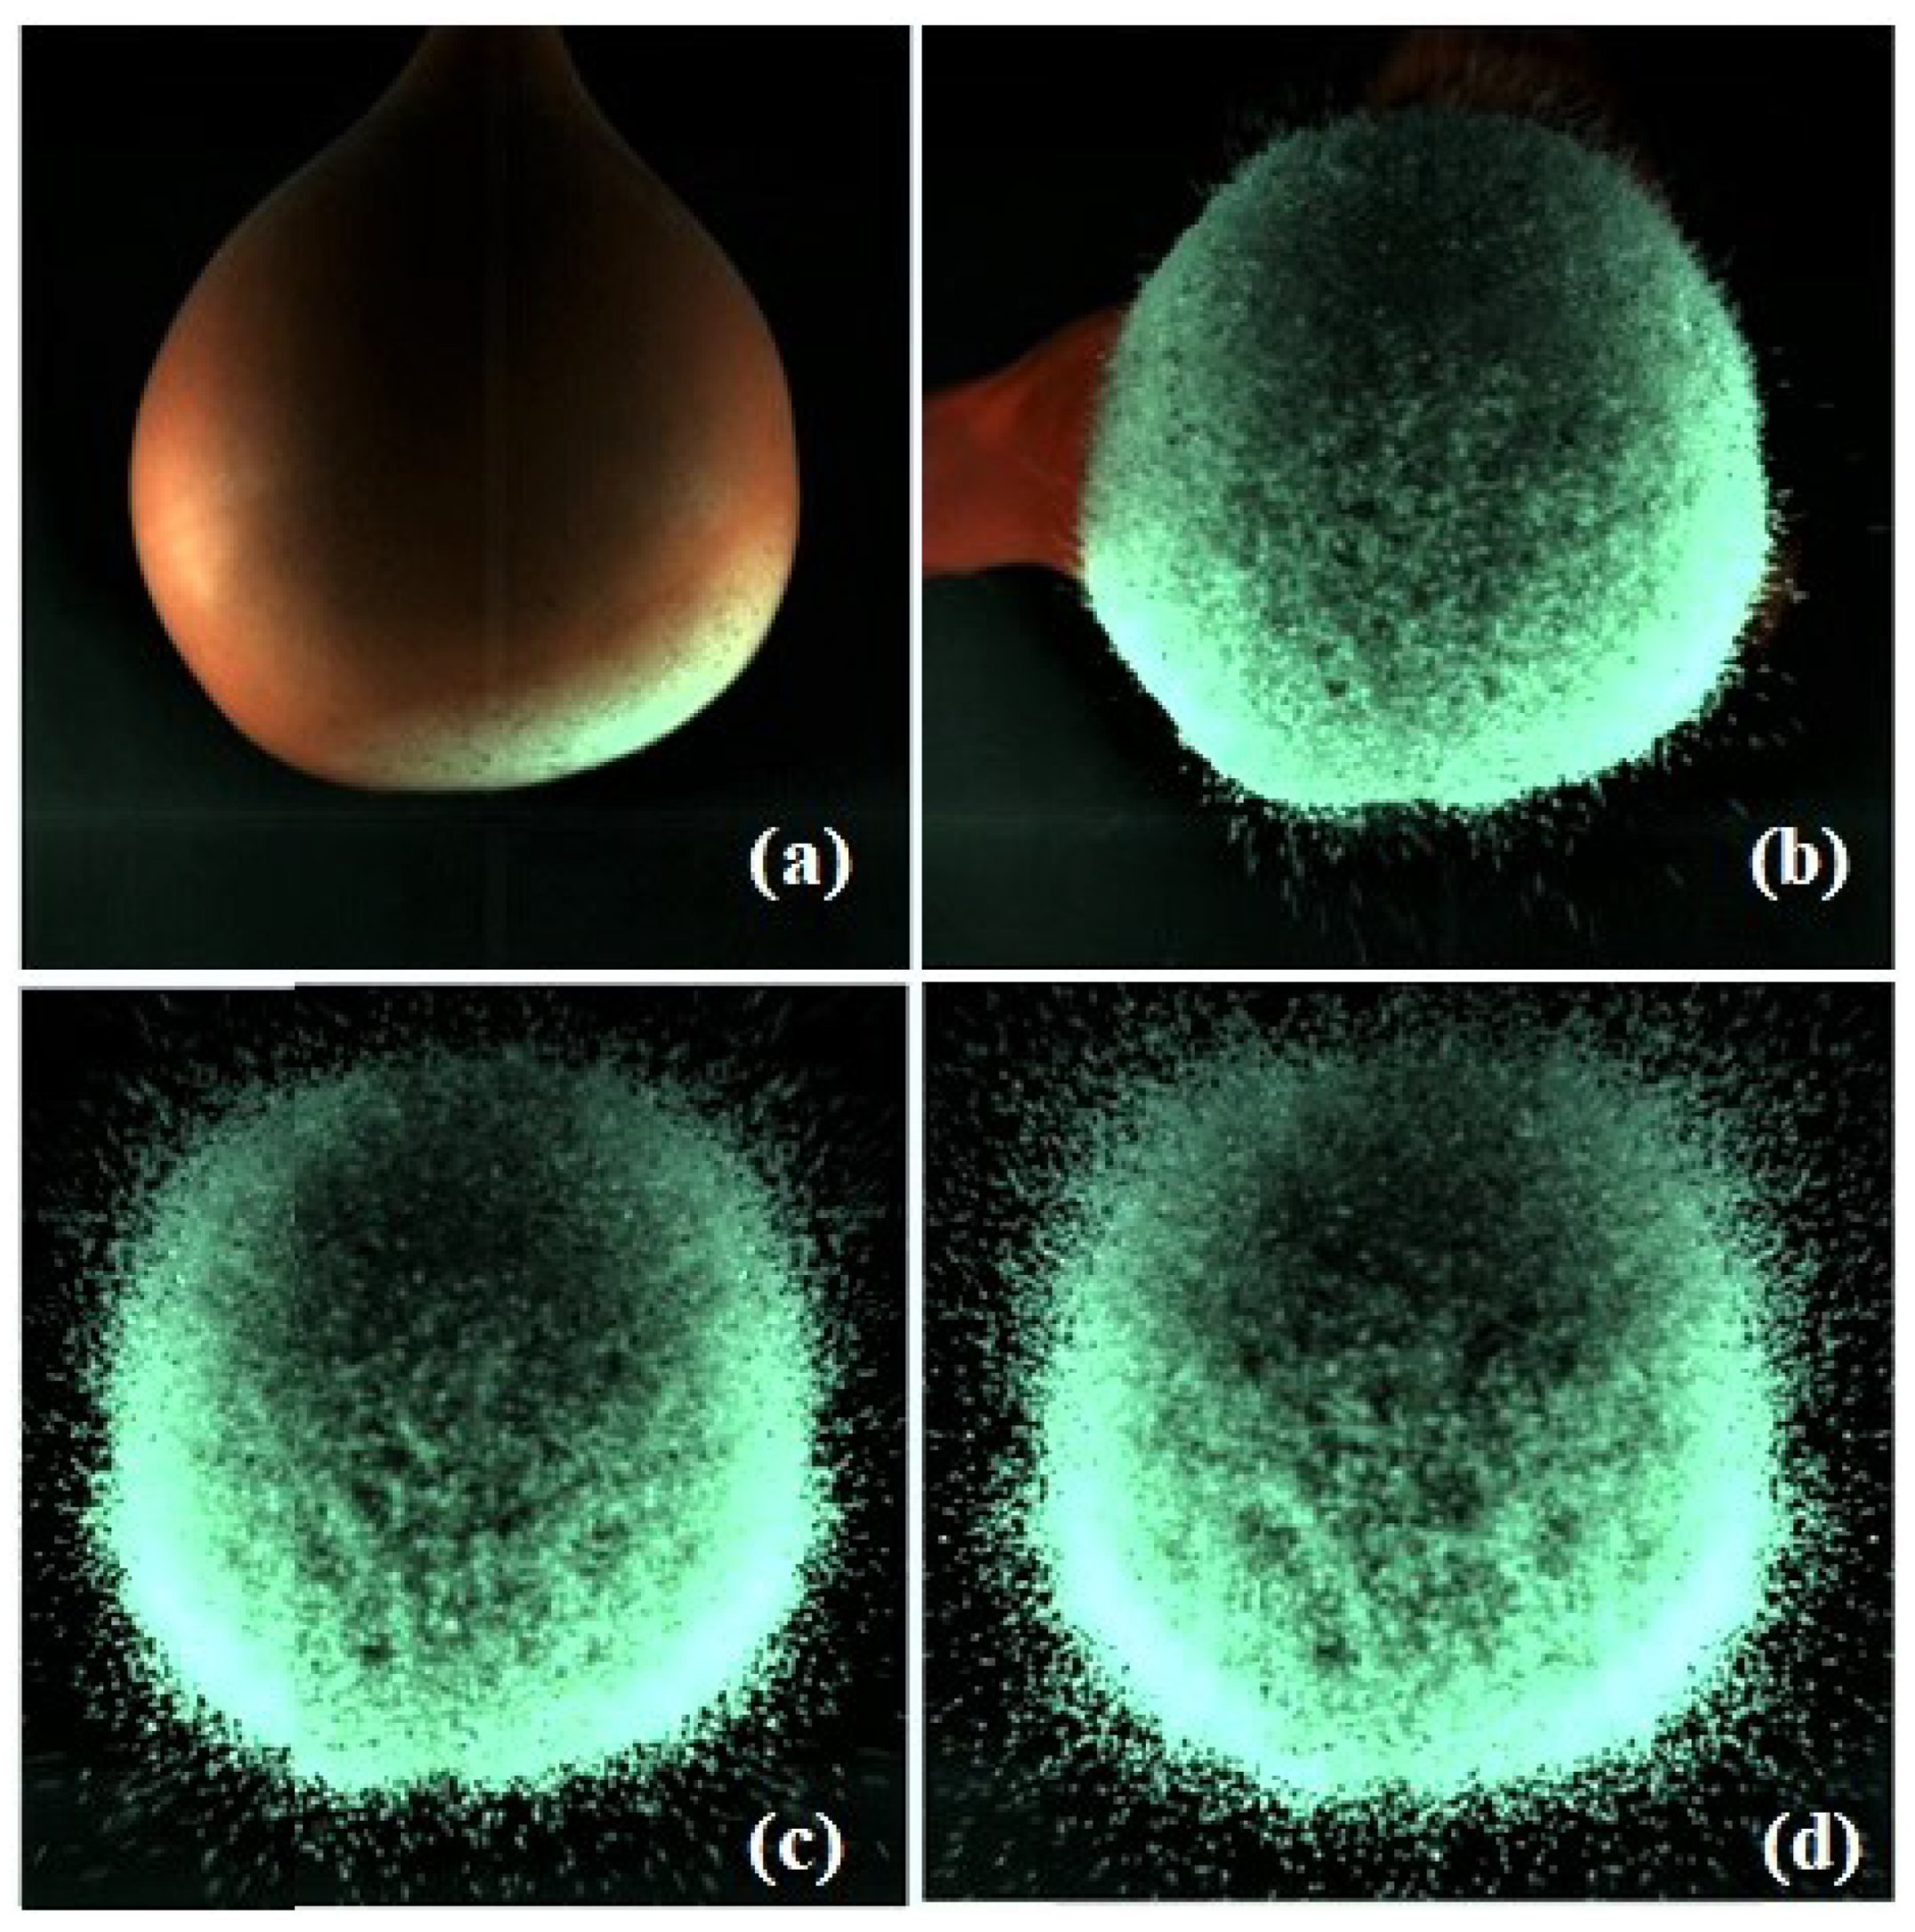
Taking, for instance, a sand filled balloon with a mass of 1.00 kg, upon rupture after exposure to the flame an accelerated peeling of the rubber film from the granular mass takes place. Figure 3b–d shows a sudden radial expansion of the granular mass, which we assume to be due to a decompression wave that penetrates into the a mass. As shown in Figure 3b, a dense front of expansion was measured, while in Figure 3d a very dilute grain cloud can be appreciated. The time range for all of the snapshots in Figure 3 is lower than 0.02 s. Later, we show that for characteristic times t c < 0.02 s the inertial force dominates the hydrostatic compression. In contrast with water balloon bursting, where a vertical crack is observed [11], in sand-filled balloon bursting the principal curvature radii are near the same, and consequently the crack of the rubber film can propagate along any direction. It is possible that the relatively large size of the interaction region between the flame and the balloon may have some contribution to the indeterminate/unpredictable nature of the crack.
The sudden peeling of the rubber film from the spherical granular masses is so sudden that the effect of gravity (i.e., the downward motion of the center of the cluster mass) was not perceived and can be neglected. Thus, we measured the displacement of the granular front to quantify the expansion produced by the decompression wave when the pressure p of the rubber film is instantly released at t = 0 .
Essentially, as previously reported in [23], we used a method to first detect the edge of the balloon R 0 in order to measure of the deformation of spherical mass core, then measured the front of the granular mass r ( t ) resulting from the burst given its efficiency for granular flows. This method allowed us to track the mean displacement of the granular expanding mass as
d i s p l a c e m e n t = r ( t ) R 0
with measurements made around a horizontal line originating from the center of mass and reaching to the granular front r ( t ) . 
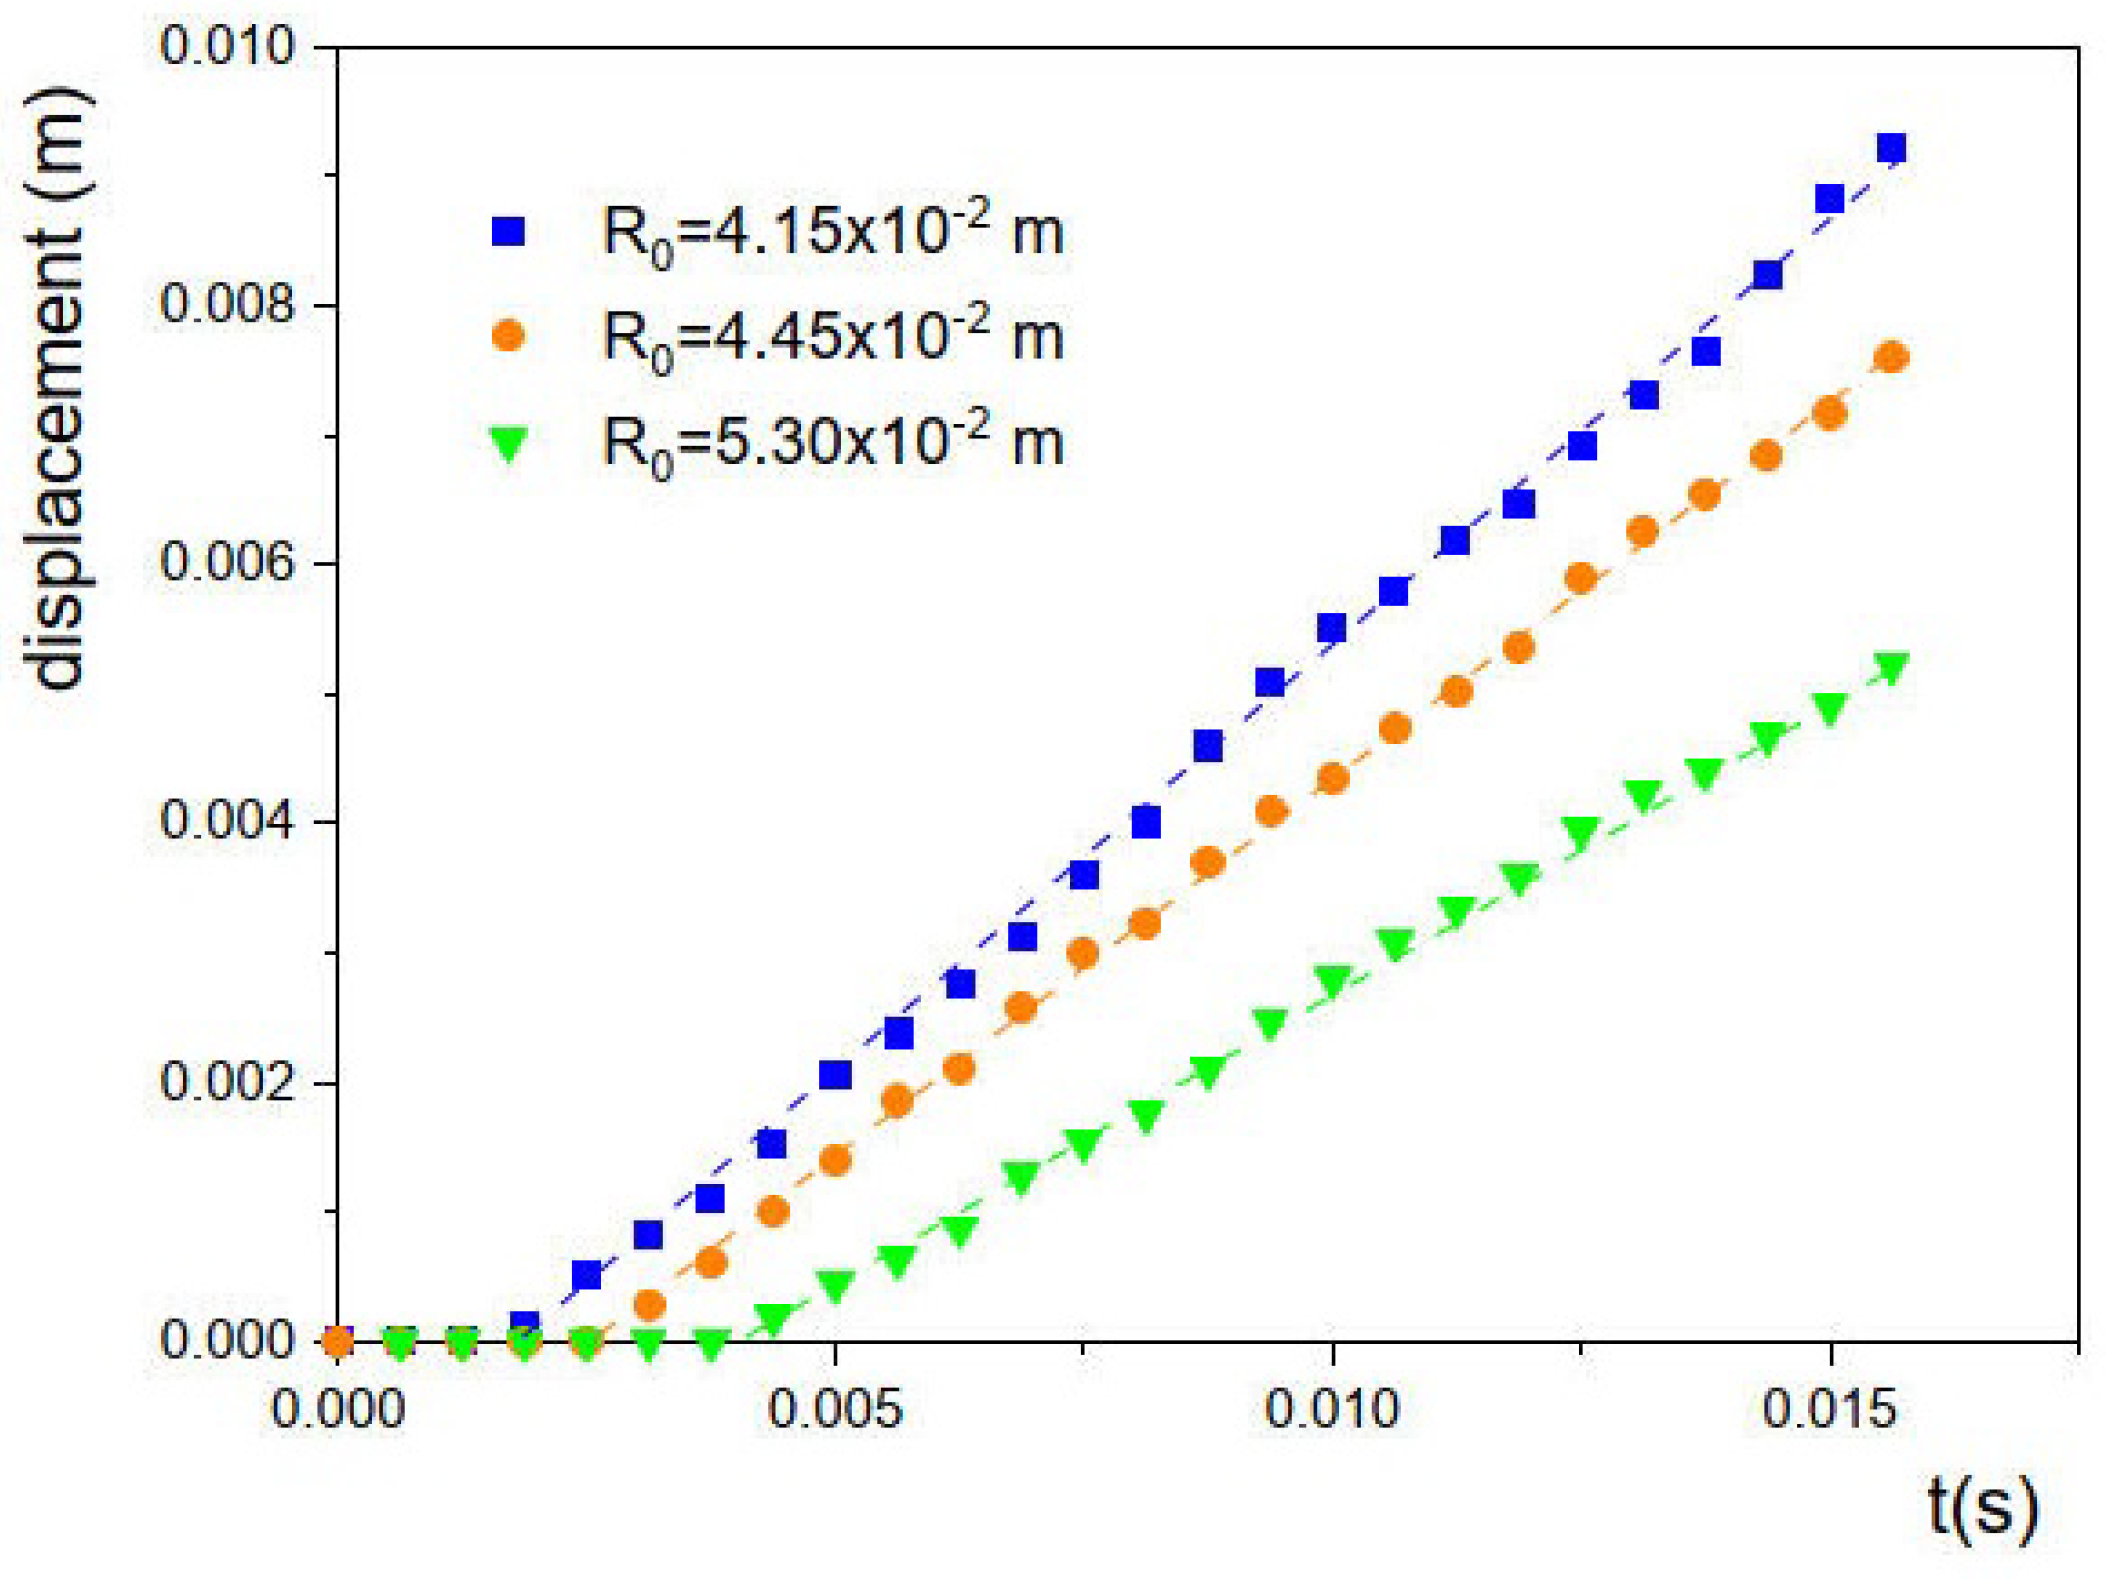
Figure 4 shows the plot of the radial displacement for the bulk mass in Table 1 as a function of time, with data provided for the first 30 frames (0.018 s) in all cases. The lines fitting the symbols indicate the stage of deformation; note that in these cases there is a certain temporal delay after the instant of rupture t = 0 s. The deformation rate for each dataset can then be obtained from the slope of the linear fit, as provided in Table 1.
From Figure 1b and Table 1, we highlight that increasing mean radii of the sand balloons produce lower mean pressures, as the radius is in the region of the first decreasing branch of the inflation pressure. In the plot of Figure 4, the flat part of each radius R 0 refers to the average displacement (provided by the sloped straight lines) starting after a given time, i.e., there is a delay time depending on the radius. This means that the delay time increases for larger masses; in Section 5 we describe how this behavior can be directly associated with the decompression waves that move inward towards the granular masses, which also present temporal delays.
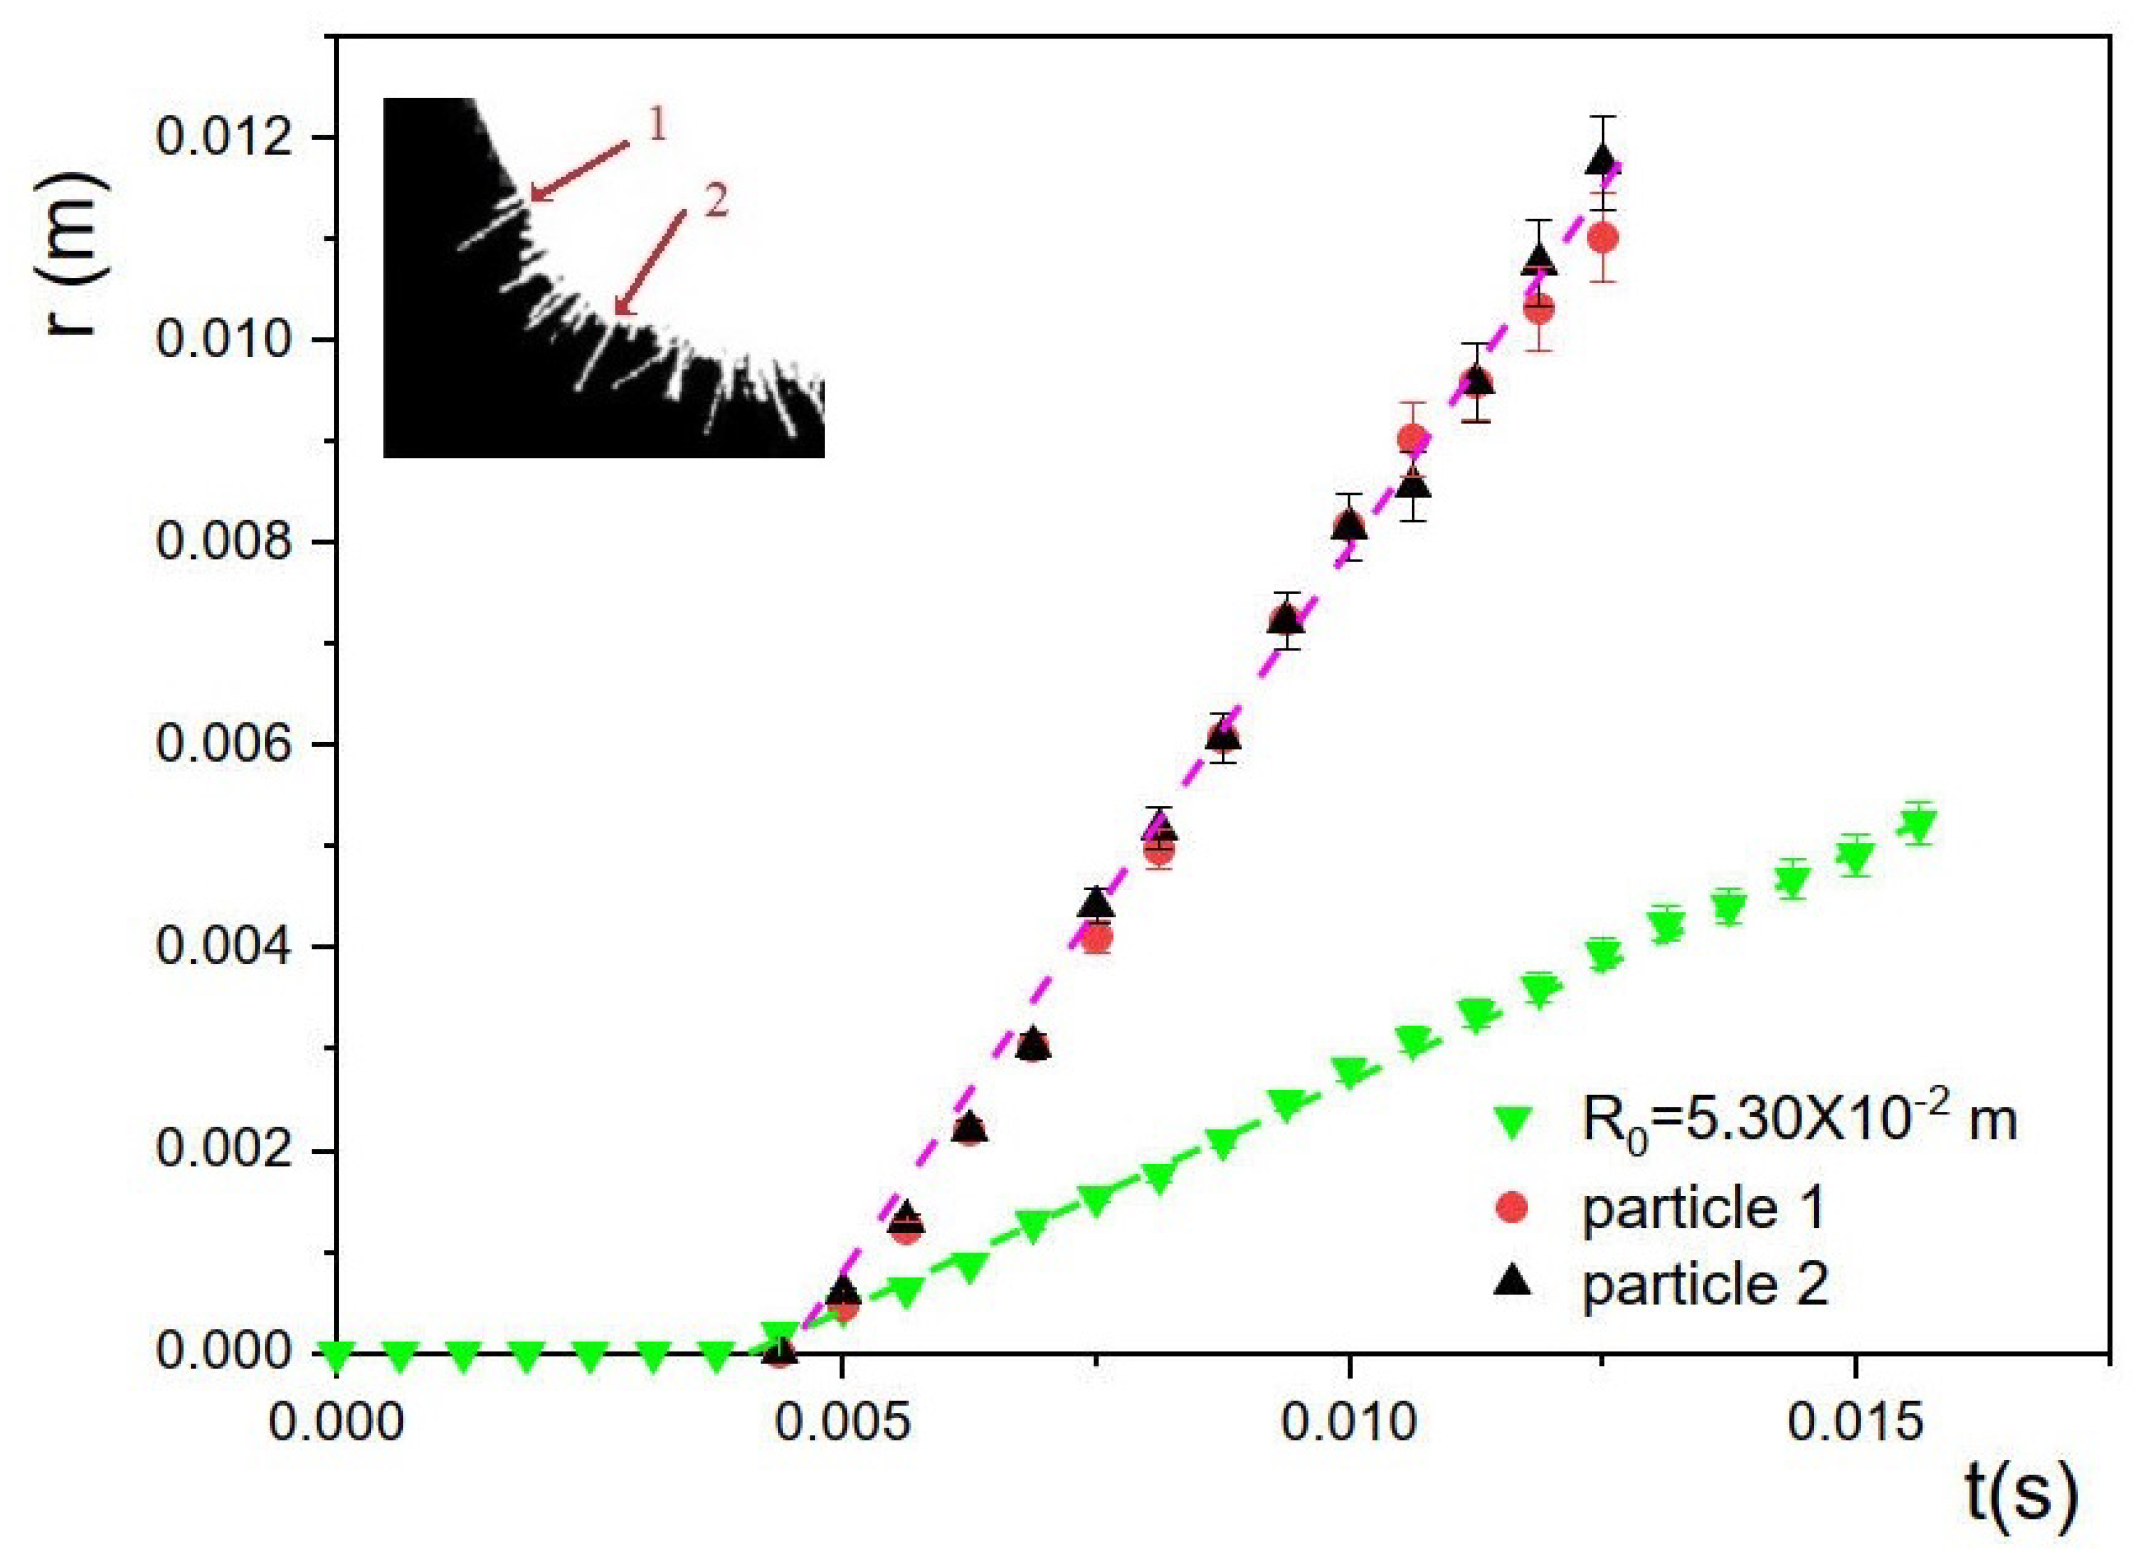
The radial expansion observed in snapshots in Figure 3 indicates interesting behaviors similar to those occurring in the explosive dispersal process [24]. An expansion develops close to the free surface during the early time points of sudden decompression, and the dynamics range from a dense granular expansion, as provided by the measurements in Figure 4, to a dilute gas–solid mixture ( η very low), as shown in the inset of Figure 5. In this latter case, the particles are discrete and far from each other and the probability of a particle–particle collisions is very low; hence, the interactions between the particles can be neglected.
Figure 5 shows that certain particles in the dilute regime (particles 1 and 2 in the inset) rapidly acquire a similar motion to that of the decompression wave except in an opposite direction to the wave itself, whereas large particles respond more slowly due to their larger inertia, as shown in Figure 4. This phenomenon is explored further in Section 5. It is very possible that the more external and smaller particles of our sand samples could be part of the dilute regime, both of which reach an average velocity v g = 1.43 ± 0.07 m/s. We return to this matter later in order to better understand various aspects of the decompression wave.
A last issue concerning the inner structure of the granular mass is related to the possible existence of force chains, which are typical in granular masses subjected to strong compression stresses [25,26,27,28,29,30]. Chain forces in two-dimensional granular materials have been found experimentally through photoelasticity [25,26,27], force sensors [28], and the use of DEM and lattice Boltzmann simulations [25,27].
Transparent materials with a non-crystalline molecular structure are optically isotropic when unstressed, i.e., the polarization of the incident light is not altered by the material. However, such materials become optically anisotropic (birefringent) when placed under stress. The polarization of the incident light in the stressed material is changed in a way similar to the behavior of birefringent crystals. After unloading, the material becomes optically isotropic again.
Measurements show that spatially extended and strong force chains (much larger than the mean force) occur when the applied stresses are large (although these are exponentially rare [29]); conversely, short and weak force chains are produced for small stresses [25,27]. Moreover, the force–force spatial distribution function and contact point radial distribution function indicate that the spatial correlations between the contact forces and positions of the contacts extend out only to approximately three particle diameters. This shows that force correlations dissipate quickly in the bulk and that the force transmission network propagates locally before rapidly becoming diffuse [30]. Taking all this into account along with the fact that the typical inflation pressures involved in our experiments are relatively small (Table 1) and that the decompression wave only penetrates small distances with respect to the free surface before the action of gravity begins to play an important role (see Section 5), it is possible that effect of the chain force on the decompression wave could be marginal.

4. Decompression Model

4.1. Expansion Wave

The experiments described above indicate that the deformation mainly causes a change in the volume of the body of sand with no change in its shape. Such a deformation is a hydrostatic compression [14]. We propose that under these conditions the granular medium can be treated as an effective elastic medium. Attempts to do this in more general conditions exist in the literature; see [15,31,32,33,34,35]. What follows is a simplified account specialized for the problem at hand. This approach is partially justified by the qualitative agreement between its predictions and our experiments.
In the initial state, before the rubber film is broken, the medium is subjected to a uniform compression p, which is assumed to be instantly released when the film disappears. Calling u ( x , t ) the displacement of the medium subsequent to the suppression of the rubber film, the variation of the stress tensor relative to that of the compressed medium is σ i j = K e · u δ i j , where K e is the effective compressibility modulus, · u is the trace of the strain tensor, and δ i j is the identity tensor. Only longitudinal elastic waves exist in these conditions. With spherical symmetry, leaving out the effect of gravity in the early stages of the expansion, we have u = u ( r ) e r , where r is the distance to the balloon center and e r is a unit vector in the local radial direction. Then, · u = r 2 r 2 u / r and the wave satisfies the following equation (see, e.g., [14]):
ρ 2 u t 2 = K e r 1 r 2 r r 2 u ,
where ρ is the effective density of the medium, the product of the density of the spheres’ material and their volume fraction.
An order-of-magnitude estimation of the time for which the decompression occurs in a fast manner (in the absence of gravity) is obtained through Equation (2). If the inertial force dominates the hydrostatic compression when the granular mass has a size r = R 0 , then ρ u / t 2 > K e u / R 0 2 , meaning that t < ρ R 0 2 / K e . Therefore, our theoretical analysis is valid for times that fulfills such a condition.
Equation (2) is solved subject to the boundary conditions
r = 0 : u = 0 and r = R 0 : σ r r = p H ( t ) ,
where H is the Heaviside step function, defined as H ( t ) = 0 if t < 0 and H ( t ) = 1 if t 0 . These consist of the symmetry condition at the center of the balloon and the condition that the pressure of the rubber film is instantly released at t = 0 . The initial conditions are
t : u = u t = 0 .
At short times, the expansion wave originating at r = R 0 when the initial compression is released has only travelled a small distance inward compared with the radius R 0 of the balloon. In terms of the variables ξ = r R 0 and t, Equation (2) can be simplified to the wave equation
2 u t 2 = c 2 2 u ξ 2 with c 2 = K e ρ ,
which is solved for ξ < 0 with the following conditions:
ξ = 0 : K e u ξ = p H ( c t ) , ξ : u = 0 , t : u = u t = 0 .
The solution of (5) is of the form u = f ( ξ + c t ) . The first condition (6) requires K e f ( c t ) = p H ( c t ) , which together with the second condition determines f ( ξ + c t ) = ( p / K e ) ( ξ + c t ) H ( ξ + c t ) .
Undoing the change of variables and rearranging slightly, we have
u ( r , t ) = p K e c t + r R 0 H t + r R 0 c ,
which represents a wave moving towards the center of the balloon at a constant speed c = K e / ρ . Clearly, this solution depends on the effective compressibility modulus K e , which is analyzed in the following section.

4.2. Effective Compressibility Modulus

Ottawa sand grains are mostly well-rounded but not fully spherical; however, in this section we use theoretical results obtained for spheres in an attempt to express the effective compressibility modulus K e approximately in terms of the radius of the spheres (a) and the elastic properties of the material they are made of (E and σ ). The following is a simplified version of the more complete analysis of [15] with adaptations to the assumptions made in previous sections for the problem at hand.
During contact between two elastic spheres, leaving out shear stresses (as mentioned before), the relation between the deformation of their surfaces h = 2 a —the distance between centers and the force F opposing the deformation (see, e.g., [14]) is
F = 2 3 E 1 σ 2 a 1 / 2 h 3 / 2 .
As this is not a linear relation, an elastic response of the granular medium can be expected only in the first stages after the breakdown of the rubber film (assumed to be instantaneous), when the variations of h and F are small compared with their initial values h 0 and F 0 . Thus, the relation (8) can be linearized as follows:
F F 0 d F d h h 0 ( h h 0 ) = 1 2 E 1 σ 2 a 1 / 2 h 0 1 / 2 ( h h 0 ) .
The force F and its variation δ F = F F 0 follow the direction of the line joining the centers of the spheres, the orientation of which is arbitrary. If this line makes an angle α with a given direction in space, say x, then the x-component of δ F is δ F x = δ F cos α , while its mean value, assuming that all the orientations of the line of centers are equally probable, is
δ F x = 1 2 π 0 π / 2 δ F cos α 2 π sin α d α = δ F 2 ,
where the limits of the integral, α = 0 and α = π / 2 , reflect the condition that the center of one of the spheres is at a point with x > 0 and the center of the other is at the image point relative to the point of contact, where x < 0 .
The variation of the distance between the centers accompanying the variation of the force is δ h = h h 0 , for which the projection on the x axis is δ h x = δ h cos α . This is the contribution of the contact considered to the deformation of the medium over a distance 2 a cos α . Averaging over α , we have
δ h x = u x x 1 2 π 0 π / 2 4 π a cos α sin α d α = u x x a ,
where u x / x is the x x component of the effective strain tensor.
If there are N spheres per unit volume of the medium and if each sphere is in contact with a mean number N c of neighboring spheres, then the mean number of contacts in a slab of width a and unit area perpendicular to the x axis is a N N c / 2 , where the factor 1 / 2 accounts for the fact that two spheres are required per contact. Adding over all these contacts, the variation of the total force per unit area perpendicular to the x axis is
a N N c 2 δ F x = N N c 2 2 E 1 σ 2 a 3 / 2 h 0 1 / 2 δ h x = N N c 2 2 E 1 σ 2 a 5 / 2 h 0 1 / 2 u x x .
Identifying with the general expression of the stress tensor for a hydrostatic compression used in the previous section, we obtain
K e = N N c 2 2 E 1 σ 2 a 5 / 2 h 0 1 / 2 .
Equation (13) can be rewritten in terms of the initial compression using (8) particularized at the initial state ( h = h 0 , F = F 0 ) for a contact with the line of centers aligned radially, then writing p = a N N c F 0 with F 0 = F 0 / 2 . Introducing the volume fraction of the spheres η = 4 3 π a 3 N , we find that
K e = 3 2 4 π 2 / 3 η N c 2 / 3 E 1 σ 2 2 / 3 p 1 / 3 ,
which differs from Walton’s result [15] of
K e W = 1 2 × 3 2 / 3 π 2 / 3 η N c 2 / 3 E 1 σ 2 2 / 3 p 1 / 3
only by the numerical factor 3 5 / 3 / 2 3 0.78 .

4.3. Values of the Effective Elastic Parameters

Measurements of the Young’s modulus E and Poisson’s ratio σ for Ottawa sand single grains have been recently reported in [18] as E = 110 GPa and σ = 0.08 .
Using these values along with N c = 6 , which was obtained for sand from discrete element method (DEM) simulations [36], and η = 0.63 , which corresponds to random close packing of identical spheres [37], we found the values of K e and the speed of the wave c = K e / ρ shown in Table 2 for the values of the initial compression p in Table 1.
The rendered values of K e w ( K e ) are compatible with the fact that the ratio is p / K e < 1 , which corresponds to small deformations of the sand masses [14].

5. Plots of the Decompression Waves

Now, we show plots of Equation (7) derived from the values of p, R 0 , and K e in Table 1 and Table 2. Specifically, in plots of Figure 6 and Figure 7 we use the values of K e for our model in Table 2, as the propagation speeds of the waves c in each of the three balloons used in the experiments are slightly lower than when the values of K e w (also provided in Table 2) were used.
Here, we must remember the result in Section 4, which states that an order-of-magnitude estimation of the time for which the decompression occurs obeys the inequality t < ρ R 0 2 / K e . For the balloon of radius R 0 = 4.15 × 10 2 m, this results in t < 1.50 × 10 2 s, similar to the balloon with radius R 0 = 4.45 × 10 2 m, for which t < 1.60 × 10 2 s, and the balloon with radius R 0 = 5.30 × 10 2 m, for which t < 2 s. Times longer than those previously computed imply that the granular masses cease being a connected network of grains.
It is possible to explain the behavior of the elastic waves provided by Equation (7) graphically. 
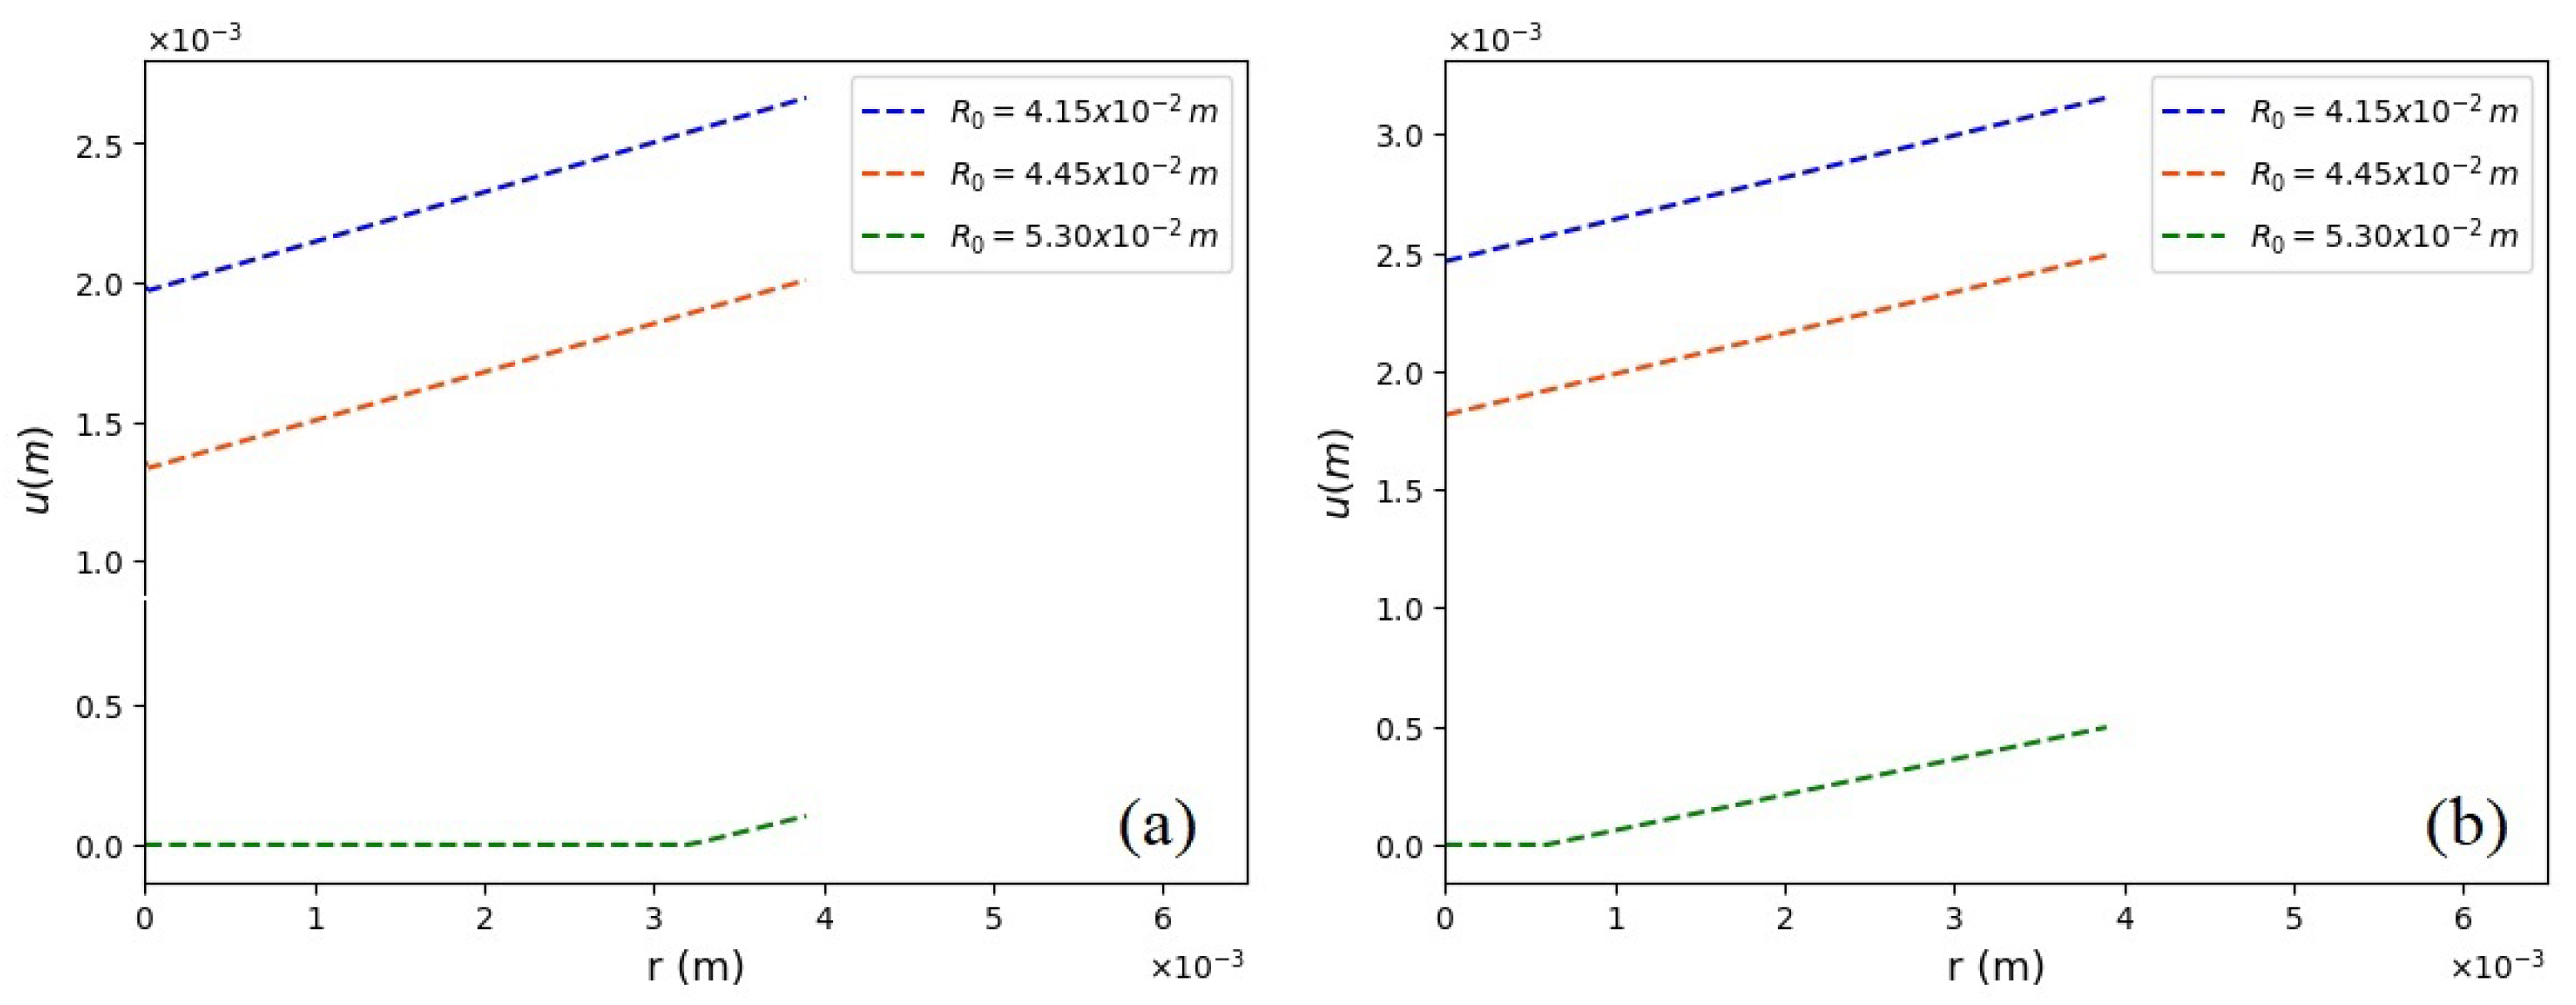
Figure 6 shows the behavior of the decompression waves u ( r , t ) for r = constant. in Figure 6a (for r = 0.03 m) and in Figure 6b (for r = 0.04 m) this latest value is closer to any initial radius of the balloon compressing the sand, with the initial radii indicated in the inset of each plot. The flat parts in the plots shown in Figure 6 indicate that the decompression wave arrived at the radial positions r = 0.03 m and r = 0.04 m at different times larger than t = ( R 0 r ) / c ; this relationship is obtained from Equation (7) when the argument β = c t + r R 0 is equal to zero in order to obtain u = 0 . For instance, considering the balloon of radius R 0 = 5.30 × 10 2 m, we find that the wave arrives at r = 0.03 m after t = 8.77 × 10 3 s, as is observed in the green dashed line in Figure 6a, while when r = 0.04 m the wave reaches the same radial position after t = 4.96 × 10 3 s, as is seen in the green dashed line in Figure 6b. These times are shortest for smaller balloons.
Similarly, the plots of u ( r , t ) for r = constant are provided in Figure 7. The flat parts occur again if β = 0 in this case, we used the formula r = R 0 c t which provides the limit at which u = 0 . Consequently, for time t = 0.019 s and R 0 = 5.30 × 10 2 m, the previous formula produces r = 3 × 10 3 m, meaning that the wave is flat between r = 0 m and between r = 3 × 10 3 m and u = 0 m, as can be seen in Figure 7a. In Figure 7b, when t = 0.020 s, u = 0 m between r = 0 m and r = 0.6 × 10 3 m. Finally, it can be observed that the other waves have no plane parts.
Now, we can compare the plots in Figure 4 for the displacements of the granular fronts as the time evolves with the plots in Figure 6b; both plots can help us to understand that the decompression wave penetrates into the sand mass as a linear wave, while in response the dense sand front evolves in a similar way in the opposite direction and with a reduced velocity. In addition to the dense front, there is a dilute flow of fine particles that is ejected radially; see Figure 5. In this figure, it can be observed that the particles have a mean radial velocity of v g = 1.43 ± 0.07 m/s, which is similar to the velocity of the decompression wave of the front, which from Equation (7) is v f = p c / K e . For a balloon inflated at R 0 = 5.30 × 10 2 m, we have v f = 1.03 m/s, i.e., both velocities are of the same order of magnitude, despite the value of v f being obtained through a series of physical and mathematical approximations used in the theoretical models of the decompression and effective compressibility modulus.
Notably, it is apparent that the dense fronts provided by plots in Figure 4 occur in response to the decompression wave; moreover, they have rate deformations of around 0.5 m/s in order of magnitude but maintain approximately similar forms to the corresponding decompression waves (comparing the data in Figure 4 with those in Figure 6b, the delay times are very similar). These facts lead us to propose the heuristic hypothesis that the rate deformation of the front could be proportional to η v f = η p c / K e , as it yields rate deformations with values of 0.85 m/s for R 0 = 4.15 × 10 2 m, 0.82 m/s for R 0 = 4.45 × 10 2 m, and 0.64 m/s for R 0 = 5.30 × 10 2 m. Obviously, our proposal is very simple and needs many more careful experimental studies before being accepted or denied.

6. Conclusions

In this work, we have experimentally and theoretically shown that the problem of sand balloon bursting is physically interesting and complex. Through the current study, our main purpose was to show that the sudden release of the initially confined granular mass behaves as a genuine elastic body, producing a linear decompression wave that travels into the granular material at the earliest times of the pressure release, and that the sand generates a complex expansion front in response. In order to provide a consistent theoretical treatment, we have proposed a new model to compute the effective compression modulus, which is used in plots shown in Figure 6 and Figure 7. This treatment results in waves 12% slower than those computed using the Walton effective compression modulus [15]. Similarly, by assuming spherical balloons, a theoretical model based on the hydrostatic compression approach has allowed us to analytically find radial decompression waves, which generate radial granular fronts with physical characteristics very similar to those of the elastic wave. Due to the opacity of the granular mass, we could not observe the decompression waves and were only able to detect the effects of the waves through the displacement of the front. For instance, for three balloons of different sizes, it was found that the granular fronts expand in a similar manner to the respective decompression wave; the fronts move at a constant velocity (rate of deformation in Table 1) after delay times very similar to those of the waves. Through Figure 5 we found that the front is simultaneously composed of a dense front and a dilute front. At the free surface, it is possible to compute the velocity of the granular front induced by the decompression wave as v f = p c / K e . Incidentally, in terms of the order of magnitude, such a velocity appears to be more adequate for the most external radially expelled single grains. We characterized the velocity of the dense front experimentally using the rate of deformation and found it to be slower than v f . Due to this, we have proposed, through a heuristic hypothesis, that the velocity of the dense front could simply be equal to the factor η v f as it is of the same order of magnitude as the rate of deformation. Clearly, such a hypothesis merits further theoretical and experimental studies.

Author Contributions

Design and performance of experiments: F.J.H., G.G., A.M. and F.S.-S.; modeling: F.J.H., G.G. and A.M.; writing and revision: F.J.H., G.G., F.S.-S. and A.M. All authors have read and agreed to the published version of the manuscript.

Funding

This research received no external funding.

Data Availability Statement

The data presented in this study are available from the corresponding author upon request. The data are not publicly available as we do not have a publicly accessible repository.

Acknowledgments

A.M. acknowledges S. Álvarez, F. Polo-Peña, D.A. Serrano, Y. Hernández, and J. Casillas for their help in different stages of this study. The work of FJH was supported by Grant No. PID2020-115730GB-C22 funded by MCIN/AEI/10.13039 and by ERDF “A way of making Europe”.

Conflicts of Interest

The authors declare no conflicts of interest.

References

  1. Sperl, M. Experiments on corn pressure in silo cells—translation and comment of Janssen’s paper from 1895. Granul. Matter 2006, 8, 59–65. [Google Scholar] [CrossRef]
  2. Nedderman, R.M. Statics and Kinematics of Granular Materials; Cambridge University Press: Cambridge, UK, 1992. [Google Scholar]
  3. Evesque, P. Stress in Static Sand Piles: Role of the deformation in the case of silos and oedometers. J. Phys. I 1997, 7, 1501–1512. [Google Scholar]
  4. Evesque, P.; de Gennes, P.-G. Sur la statique des silos. C. R. Acad. Sci. 1998, 326, 761–766. [Google Scholar] [CrossRef]
  5. Ovarlez, G.; Clément, E. Elastic medium confined in a column versus the Janssen experiment. Eur. Phys. J. E Soft Matter. 2005, 16, 421–438. [Google Scholar] [CrossRef] [PubMed]
  6. de Gennes, P.-G. Thermal expansion effects in a silo. C. R. Acad. Sci. 1999, 327, 267–274. [Google Scholar] [CrossRef]
  7. Medina, A.; Pliego, M.; Higuera, F.J. Deformation of an elastic cylindrical tube filled with water and a dry granular material. Rev. Mex. Fís. 2016, 62, 89–92. [Google Scholar]
  8. Gutiérrez, G.; Colonnello, C.; Boltenhagen, P.; Darias, J.R.; Peralta-Fabi, R.; Brau, F.; Clément, E. Silo collapse under granular discharge. Phys. Rev. Lett. 2015, 114, 018001. [Google Scholar] [CrossRef]
  9. Boutreux, T.; Raphael, E.; de Gennes, P.G. Propagation of a pressure step in a granular material: The role of wall friction. Phys. Rev. E 1997, 55, 5759–5773. [Google Scholar] [CrossRef]
  10. Vollmer, M.; Möllmann, K.-P. Is There a Maximum Size of Water Drops in Nature? Phys. Teach. 2013, 51, 400–402. [Google Scholar] [CrossRef]
  11. Lund, M.H.; Dalziel, S.B. Bursting water balloons. J. Fluid Mech. 2014, 756, 771–815. [Google Scholar] [CrossRef]
  12. Moulinet, S.; Adda-Bedia, M. Popping Balloons: A Case Study of Dynamical Fragmentation. Phys. Rev. Lett. 2015, 115, 184301. [Google Scholar] [CrossRef]
  13. Xue, K.; Li, F.; Bai, C. Explosively driven fragmentation of granular materials. Eur. Phys. J. E 2013, 36, 95. [Google Scholar] [CrossRef]
  14. Landau, L.D.; Lifshitz, E.M. Theory of Elasticity, 3rd ed.; Elsevier: Oxford, UK, 2015. [Google Scholar]
  15. Walton, K. The effective elastic moduli of a random packing of spheres. J. Mech. Phys. So1id. 1987, 35, 213–226. [Google Scholar] [CrossRef]
  16. Woodcock, C.R.; Mason, J.S. Bulk Solids Handling: An Introduction to the Practice and Technology; Leonard Hill: Glasgow, UK, 1987; pp. 13–14. [Google Scholar]
  17. Ge, J.; Monroe, C.A. The effect of coefficient of restitution in modeling of sand granular flow for core making: Part I Free-Fall Experiment and theory. Intl. J. Met. 2019, 13, 753–767. [Google Scholar] [CrossRef]
  18. Erdogan, S.T.; Forster, A.M.; Stutzman, P.E.; Garboczi, E.J. Particle-based characterization of Ottawa sand: Shape, size, mineralogy, and elastic moduli. Cem. Concr. 2017, 83, 36–44. [Google Scholar] [CrossRef]
  19. Osborne, W.A. The elasticity of rubber balloons and hollow viscera. Proc. R. Soc. Lond. Ser. B 1909, 81, 485–499. [Google Scholar]
  20. Mangan, R.; Destrade, M. Gent models for the inflation of spherical balloons. Int. J. Non-Linear Mech. 2015, 68, 52–58. [Google Scholar] [CrossRef]
  21. Anssari-Benam, A.; Bucchi, A.; Saccomandi, G. Modelling the inflation and elastic instabilities of rubber-like spherical and cylindrical shells using a new generalised neo-Hookean strain energy function. J. Elast. 2022, 151, 15–45. [Google Scholar] [CrossRef]
  22. Bagnold, R.A. The Physics of Blown Sand and Desert Dunes; Chapman & Hall: London, UK, 1941. [Google Scholar]
  23. Cao, W.; Liu, H.; Li, W.; Xu, J. The characteristics of the near field of the granular jet. Fuel 2014, 115, 17–23. [Google Scholar] [CrossRef]
  24. Zhang, F.; Frost, D.L.; Thibault, P.A.; Murray, S.B. Explosive dispersal of solid particles. Shock Waves 2001, 10, 431–443. [Google Scholar] [CrossRef]
  25. Drescher, A.; de Josselin de Jong, G. Photoelastic verification of a mechanical model for the flow of a granular material. Mech. Phys. Solids 1972, 20, 337–340. [Google Scholar] [CrossRef]
  26. Dijkstra, J.; Broere, W. New method of full-field stress analysis and measurement using photoelasticity. Geotech. Test. J. 2010, 33, 1–13. [Google Scholar]
  27. Lesniewska, D.; Nitka, M.; Tejchman, J.; Pietrzak, M. Contact force network evolution in active earth pressure state of granular materials: Photo-elastic tests and DEM. Granul. Matter 2020, 22, 71. [Google Scholar] [CrossRef]
  28. Medina, A.; Lopez-Villa, A.; Gutierrez, G.J. Random forces on obstacles in channels with grains: A mechanical analogy of crowd disasters. In Experimental and Computational Fluid Mechanics; Klapp, J., Medina, A., Eds.; Springer International Publishing: Cham, Switzerland, 2014; pp. 175–184. [Google Scholar]
  29. Liu, C.-h.; Nagel, S.R.; Schecter, D.A.; Coppersmith, S.N.; Majumdar, S.; Narayan, O.; Witten, T.A. Force fluctuations in bead packs. Science 1995, 269, 513–515. [Google Scholar] [CrossRef] [PubMed]
  30. Silbert, L.E.; Grest, G.S.; Landry, J.W. Statistics of the contact network in frictional and frictionless granular packings. Phys. Rev. E 2002, 66, 061303. [Google Scholar] [CrossRef]
  31. Brandt, H. A study of the speed of sound in a porous granular media. ASME J. Appl. Mech. 1955, 22, 479–486. [Google Scholar] [CrossRef]
  32. Duffy, J.; Mindlin, R.D. Stress-Strain Relations and Vibrations of a Granular Medium. J. Appl. Mech. 1957, 14, 585–593. [Google Scholar] [CrossRef]
  33. Deresiewicz, H. Stress-strain relations for a simple model of a granular medium. J. Appl. Mech. 1958, 25, 402–406. [Google Scholar] [CrossRef]
  34. Digby, P.J. The Effective Elastic Moduli of Porous Granular Rocks. J. Appl. Mech. 1981, 48, 803–808. [Google Scholar] [CrossRef]
  35. Jiang, Y.; Liu, M. Granular elasticity without the Coulomb condition. Phys. Rev. Lett. 2003, 91, 144301. [Google Scholar] [CrossRef]
  36. de Bono, J.P.; McDowell, G.R. An insight into the yielding and normal compression of sand with irregularly-shaped particles using DEM. Powder Tech. 2015, 271, 270–277. [Google Scholar] [CrossRef]
  37. Berryman, J.G. Random close packing of hard spheres and disks. Phys. Rev. A 1983, 27, 1053–1061. [Google Scholar] [CrossRef]
Figure 1. (a) Plot of the cumulative percentage undersize and oversize. The average diameter of the grains is taken to be the median (vertical straight line), which is the value separating the higher half of the size distribution from the lower half. Thus, the average diameter of the grains of Ottawa sand is 0.0093 m. (b) Plot of the inflation pressure p as a function of the average stretch R of a near spherical rubber balloon; measurements were performed at room temperature T r o o m = 298.2 K. Notice the strong nonlinear behaviour of the pressure as a function of R.
Fluids 09 00049 g001
Figure 2. Experimental setup for high-speed video recording of the bursting sand balloon.
Fluids 09 00049 g002
Figure 3. Example of a series of snapshots at the very early time instants of a bursting balloon of mass M = 1.00 kg: (a) t = 0 s, (b) t = 3.75 × 10 3 s, (c) t = 1.00 × 10 2 s, and (d) t = 2.18 × 10 2 s. In (a), the balloon is laid to hang and an accelerated peeling of the rubber film occurs. From (b) to (d), decompression occurs simultaneously as a dense granular front (measured in the plot in Figure 4) and as a dilute front of non-interacting single grains (measured in the plot in Figure 5).
Fluids 09 00049 g003
Figure 4. Plot of the radial displacement of the dense granular front as a function of time due to the sudden decompression of the granular masses. Three different masses with different radio were experimentally studied.
Fluids 09 00049 g004
Figure 5. Plot of particle positions as a function of time during the bursting of the balloon. The radial motion of single grains (particles 1 and 2 in the inset) is visible through their tracks. As a reference, we show data for the displacement versus time, as was provided in Figure 4 (green symbols). The measurements correspond to the bursting of a balloon with M = 1.00 kg, and the average velocity of the grains was v g = 1.43 ± 0.07 m/s (magenta dash line).
Fluids 09 00049 g005
Figure 6. Plots of the decompression wave u ( r , t ) (Equation (7)) moving towards the center of the balloon at constant speed c (the values of which are provided in Table 2). Here, the plots are computed for the inner radial positions (a) r = 0.03 m and (b) r = 0.04 m. We remark, by reference to Table 1, that for each radius R 0 in the inset there is a corresponding mass M.
Fluids 09 00049 g006
Figure 7. Plots of the decompression wave u ( r , t ) (Equation (7)) moving towards the center of the balloon at constant speed c (the values of which are provided in Table 2). Here, the plots were computed for times: (a) t = 0.019 s and (b) t = 0.020 s. We remark, by using the Table 1, that for each radius R 0 in the inset there is a corresponding mass M.
Fluids 09 00049 g007
Table 1. Mass of sand in the balloons and their respective initial mean radii R 0 . From the plot in Figure 1b, the initial compression pressures p can be determined graphically. The rate of deformation provides the velocity of the radial deformation of the dense granular front at the earliest times of decompression.
Mass (kg)R0 (m)p (kPa)Rate Deformation (m/s)
0.50 4.15 × 10 2 6.30 0.66
0.60 4.45 × 10 2 6.00 0.58
1.00 5.30 × 10 2 4.52 0.46
Table 2. Effective compressibility modulus K e w and speed of the decompression wave c w obtained using the Walton formula (Equation (15)) and effective compressibility modulus K e and speed of the decompression wave c using our formula (Equation (14)).
Mass (kg) K ew (kPa) c w (m/s) K e (kPa)c (m/s)
0.50 16.46 3.14 12.84 2.77
0.60 16.20 3.11 12.63 2.75
1.00 14.74 2.97 11.49 2.62
Disclaimer/Publisher’s Note: The statements, opinions and data contained in all publications are solely those of the individual author(s) and contributor(s) and not of MDPI and/or the editor(s). MDPI and/or the editor(s) disclaim responsibility for any injury to people or property resulting from any ideas, methods, instructions or products referred to in the content.

