
Further Study and Development of Correlations for Heat Transfer during Subcooled Boiling in Plain Channels

Abstract
:1. Introduction
2. Previous Work
2.1. Experimental Studies

| Source | Fluid | Test Section | pr | G kg/m2s | ∆TSC K | No. of Data Pts. | Mean Absolute Deviation, % (Upper Line) Average Deviation, % (Lower Line) | ||||||||||
|---|---|---|---|---|---|---|---|---|---|---|---|---|---|---|---|---|---|
| Din mm | DHYD (DHP) | Tube with Boiling (Heated Tubes) | |||||||||||||||
| Liu and Winterton | Gungor and Winterton | Haynes and Fletcher | Mole and Shaw | Devahdhanush and Mudawar | Badiuzzaman | Shah (1977) [1] | Shah (2017a) [2] | New Correlation | |||||||||
| Alferov and Rybin (1969) [5] | Water | 15.0 | 10.0 (10.0) | Both | 0.6638 | 319 1898 | 8 23 | 6 | 22.3 22.3 | 49.5 −49.5 | 36.0 36.0 | 14.3 −14.3 | 47.6 47.6 | 40.1 −40.1 | 10.1 3.2 | 6.2 −0.9 | 5.3 −1.3 |
| 6.0 (6.0) | Both | 0.6638 | 618 1780 | 7 12 | 10 | 11.2 9.8 | 51.5 −51.5 | 26.2 26.2 | 18.9 −18.9 | 20.4 20.4 | 49.0 −49.0 | 11.7 −6.0 | 8.7 −7.4 | 9.1 −8.2 | |||
| 6.0 (14.4) | Inner | 0.6638 | 311 750 | 7 31 | 6 | 8.6 8.3 | 72.7 −72.7 | 22.2 22.2 | 33.4 −33.4 | 22.4 15.3 | 52.7 −52.7 | 12.3 −12.3 | 8.8 8.8 | 8.9 −8.9 | |||
| 6.0 (10.3) | Outer | 0.6638 | 299 1860 | 7 28 | 7 | 10.1 10.1 | 68.1 −68.1 | 22.4 22.4 | 26.9 −26.9 | 29.9 29.0 | 47.6 −47.6 | 10.1 −8.0 | 11.2 −10.3 | 11.0 −10.2 | |||
| 2.0 (2.0) | Both | 0.6638 | 705 3006 | 8 43 | 5 | 21.2 16.4 | 30.5 −1.4 | 25.4 24.9 | 25.8 18.2 | 99.5 99.5 | 23.2 −18.0 | 23.1 10.8 | 15.8 3.5 | 16.1 3.3 | |||
| 2.0 (4.3) | Inner | 0.6647 | 295 3103 | 10 28 | 6 | 3.8 3.8 | 47.4 −47.4 | 13.9 13,9 | 11.0 −11.0 | 63.9 63.9 | 34.5 −34.5 | 4.2 1.3 | 4.2 −4.2 | 4.4 −4.4 | |||
| 2.0 (3.8) | Outer | 0.6638 | 303 3191 | 6 16 | 16 | 10.3 8.5 | 53.7 −53.7 | 14.8 −14.8 | 14.8 −14.8 | 34.0 34.0 | 44.3 −44.3 | 9.8 3.1 | 7.4 −4.5 | 7.9 1.4 | |||
| 10.0 (26.7) | Inner | 0.6647 | 319 1870 | 5 31 | 12 | 13.9 13.6 | 63.1 −61.1 | 28.3 28.3 | 36.8 −36.8 | 22.7 0.2 | 57.9 −57.9 | 14.6 −7.5 | 12.9 −11.0 | 13.2 −11.5 | |||
| 10.0 (16.0) | Outer | 0.6638 | 361 1944 | 6 31 | 6 | 13.0 13.0 | 52.1 −52.1 | 25.6 25.6 | 28.4 −28.4 | 24.6 15.7 | 51.6 −51.6 | 14.8 −6.9 | 14.0 −12.8 | 14.1 −13.1 | |||
| 3.0 (3.0) | Both | 0.6638 0.8914 | 602 5019 | 3 42 | 6 | 7.4 6.5 | 30.5 −30.5 | 20.5 20.5 | 15.7 0.4 | 57.7 50.5 | 23.2 23.1 | 14.4 4.2 | 9.3 −4.2 | 9.2 −4.3 | |||
| 3.0 (6.6) | Inner (both) | 0.6647 0.8914 | 309 3668 | 25 63 | 9 | 2.4 1.7 | 36.9 −36.9 | 5.0 5.0 | 13.2 10.2 | 116.4 116.4 | 23.9 −23.9 | 8.5 −8.2 | 7.8 −7.8 | 7.6 =7.6 | |||
| 3.0 (6.6) | Inner | 0.8914 | 310 2457 | 24 30 | 3 | 3.7 1.7 | 44.4 −44.4 | 5.6 5.0 | 11.6 11.6 | 94.9 94.9 | 46.3 −46.3 | 4.2 −3.2 | 8.0 −8.0 | 7.6 −7.6 | |||
| 3.0 (5.5) | Outer (both) | 0.6638 0.8914 | 307 2741 | 24 43 | 6 | 2.1 −1.0 | 34.7 −31.7 | 3.6 3.6 | 11.8 −0.4 | 98.4 98.4 | 24.5 −24.5 | 3.9 −2.4 | 9.0 −9.0 | 7.5 −7.5 | |||
| 3.0 (5.5) | Outer | 0.6638 0.8914 | 300 2685 | 10 65 | 11 | 8.1 5.0 | 36.7 −36.1 | 12.5 12.1 | 17.6 4.9 | 99.2 97.2 | 31.3 −27.6 | 8.4 11.7 | 7.5 −5.6 | 6.6 −3.6 | |||
| Tarasova and Orlov (1969) [25] | Water | 12.97 | 2.12 (4.6) | Inner | 0.5854 0.8914 | 1140 3620 | 1 50 | 20 | 7.4 6.9 | 38.9 −38.2 | 25.4 25.4 | 14.1 −12.1 | 39.0 31.1 | 42.2 −42.2 | 9.0 6.5 | 7.1 −4.5 | 7.5 −4.9 |
| 8.5 | 6.6 (18.3) | Inner | 0.5983 0.9218 | 1360 2723 | 4 110 | 23 | 5.2 1.7 | 56.8 −56.8 | 13.9 13.8 | 30.7 −29.8 | 31.0 15.1 | 56.2 −56.2 | 12.4 −11.1 | 12.7 −12.2 | 13.0 −12.6 | ||
| 34.6 | 4.3 (8.12) | Outer | 0.2238 | 1353 2010 | 6 38 | 4 | 4.4 −1.8 | 46.6 −46.6 | 20.4 20.4 | 24.7 −24.7 | 30.3 13.5 | 14.3 −9.4 | 6.6 1.0 | 7.8 −7.8 | 5.4 −4.2 | ||
| 4.3 (9.13) | Inner | 0.4480 0.6663 | 1322 3044 | 4 66 | 23 | 4.4 3.6 | 39.5 −24.2 | 15.7 15.7 | 22.1 −17.2 | 52.5 42.8 | 31.3 −25.5 | 7.8 4.4 | 5.6 −5.1 | 6.0 −5.8 | |||
| 4.3 (4.3) | Both | 0.2238 0.8914 | 1127 1855 | 1 36 | 22 | 7.0 6.6 | 39.5 −39.5 | 25.0 25.0 | 16.6 −1.2 | 53.2 47.4 | 23.5 −20.7 | 8.1 7.1 | 7.2 −2.7 | 7.5 −3.4 | |||
| 36.6 | 2.28 (4.7) | inner | 0.448 | 1895 | 7 17 | 4 | 7.3 6.6 | 26.4 26.4 | 36.0 −36.0 | 16.8 −16.8 | 21.2 21.2 | 27.3 −27.3 | 12.7 9.2 | 7.0 −4.1 | 7.2 −4.9 | ||
| 2.28 (4.43) | Outer | 0.448 0.6638 | 1905 1965 | 6 29 | 6 | 8.5 8.5 | 22.3 22.3 | 24.1 −24.1 | 7.7 −7.7 | 53.1 53.1 | 25.9 −25.9 | 11.9 11.9 | 4.2 −0.3 | 6.9 4.0 | |||
| 2.28 (2.28) | Both | 0.44 0.6638 | 1905 1965 | 12 28 | 8 | 7.2 7.2 | 17.7 17.7 | 18.6 −18.6 | 3.5 2.2 | 83.5 83.3 | 17.1 −4.1 | 12.1 12.1 | 3.2 0.7 | 3.0 0.2 | |||
| Lung et al. (1977) [26] | Water | 10.0 | 12.0 (38.4) | Inner | 0.009 0.0189 | 471 7674 | 10 54 | 30 | 18.8 −15.3 | 13.0 2.0 | 48.6 −45.6 | 37.7 −37.7 | 27.2 −27.2 | 14.8 −12.4 | 17.7 −0.6 | 16.6 −13.1 | 16.5 −12.9 |
| Dougall and Panian (1972) [27] | R-113 | 19.0 | 12.8 (34.2) | Inner | 0.2018 0.4241 | 542 2550 | 4 48 | 38 | 13.4 −7.8 | 60.6 −60.6 | 9.1 5.9 | 20.9 −16.6 | 21.0 −16.6 | 68.2 −68.2 | 12.0 −4.3 | 12.6 −7.5 | 11.9 −6.6 |
| Thom et al. (1965) [28] | Water | 17.8 | 5.12 (5.12) | Both | 0.6268 | 987 1134 | 6 75 | 22 | 4.4 0.6 | 37.6 −37.4 | 9.1 9.1 | 16.1 −7.7 | 78.5 75.1 | 28.5 −23.7 | 7.1 −2.0 | 11.2 −10.0 | 11.5 −10.3 |
| McAdams et al. (1949) [29] | Water | 6.3 | 4.4 (11.5) | Inner | 0.0189 | 3368 3401 | 11 83 | 26 | 15.5 15.5 | 46.6 −46.6 | 48.9 48.9 | 10.7 10.0 | 30.6 30.6 | 50.4 50.4 | 32.4 32.4 | 27.0 27.0 | 25.6 25.6 |
| 13.2 (53.9) | Inner | 0.0094 0.0281 | 276 1123 | 28 49 | 13 | 10.6 10.2 | 49.1 −49.1 | 29.0 29.0 | 26.7 −26.7 | 8.6 0.7 | 15.0 4.1 | 18.4 12.4 | 14.5 5.6 | 13.5 5.6 | |||
| Rassokhin et al. (1969) [30] | Water | 10.1 | 3.85 (9.16) | Inner | 0.2743 | 2575 6132 | 8 9 | 9 | 7.8 7.4 | 29.2 −29.2 | 40.4 40.4 | 24.4 −24.4 | 5.4 −5.4 | 21.8 −21.8 | 19.9 19.9 | 12.1 9.1 | 12.7 9.3 |
| 9.1 | 4.8 (12.3) | Inner | 0.2828 | 3600 3770 | 4 46 | 13 | 21.8 21.8 | 27.3 −2.7 | 41.7 41.7 | 18.2 −17.7 | 22.8 14.7 | 13.6 −13.6 | 25.4 25.4 | 11.9 4.5 | 13.2 5.3 | ||
| 8.0 | 6.0 (16.4) | Inner | 0.2701 | 3100 | 1 29 | 4 | 8.8 8.8 | 35.4 −35.4 | 40.7 40.7 | 23.9 −15.8 | 26.3 2.3 | 16.2 −10.8 | 11.9 11.0 | 5.9 −0.2 | 6.3 −1.1 | ||
| Colburn et al. (1948) [31] | Water | 42.2 | 8.6 (19.0) | Inner | 0.0048 0.0122 | 87 839 | 9 56 | 15 | 8.3 −7.1 | 47.0 −47.0 | 9.2 7.3 | 10.9 −5.5 | 13.2 −3.5 | 30.9 30.9 | 7.7 −0.3 | 11.0 −6.9 | 10.9 −7.1 |
| Metha-nol | 0.0159 0.0395 | 79 1100 | 28 55 | 33 | 7.6 2.1 | 52.9 −52.9 | 15.7 14.5 | 9.7 7.6 | 17.8 −17.7 | 15.7 −15.7 | 10.7 −4.0 | 11.0 −7.7 | 11.0 −8.0 | ||||
| Lie and Lin (2006) [32] * | R-134 | 16.0 | 4.0 (9.0) | Inner | 0.1209 | 200 | 1 10 | 15 | 15.4 9.5 | 77.3 −77.0 | 36.8 36.8 | 44.0 44.0 | 20.2 11.8 | 20.3 −12.5 | 11.3 5.5 | 12.0 4.5 | 12.4 4.2 |
| 18.0 | 2.0 (4.2) | Inner | 0.1209 | 200 300 | 0.4 7.8 | 12 | 17.3 0.3 | 73.4 −73.4 | 29.3 28.0 | 62.0 62.0 | 20.8 10.6 | 23.7 −7.13 | 16.6 10.2 | 17.1 11.8 | 17.3 11.1 | ||
| Hasan et al. (1990) [33] | R-113 | 15.9 | 22.8 (77.8) | Inner | 0.0544 0.0749 | 579 1102 | 4 60 | 59 | 10.4 −10.4 | 57.9 −57.9 | 10.7 10.1 | 9.5 −8.3 | 27.0 −27.0 | 58.3 −58.3 | 6.8 3.0 | 6.6 1.3 | 6.2 0.9 |
| Hino and Ueda (1985) [34] | R-113 | 8.0 | 10.0 (32.5) | Inner | 0.0429 | 514 1236 | 20 30 | 12 | 15.3 −15.3 | 67.0 −67.0 | 4.3 3.1 | 7.7 −4.3 | 16.8 −16.8 | 51.0 −51.0 | 6.1 0.0 | 8.4 −2.5 | 7.1 −1.7 |
| Boye et al. (2015) [35] | Hexane | 5.0 | 5.0 (7.5) | outer | 0.0462 0.0760 | 100 183 | 0 19 | 15 | 27.1 −25.5 | 85.0 −85.0 | 12.0 −8.3 | 7.7 −0.1 | 15.6 −6.2 | 61.8 −0.9 | 24.7 −23.9 | 23.4 −20.0 | 14.9 −10.6 |
| 12.0 | 3.0 (5.4) | 0.0625 | 59 | 0 36 | 5 | 15.6 −15.6 | 88.3 −88.0 | 7.6 −3.8 | 8.2 6.4 | 14.3 6.7 | 65.4 −1.3 | 24.0 −24.0 | 18.3 −18.3 | 5.9 −5.1 | |||
| 4.0 | 1.0 (1.8) | 0.056 0.086 | 299 499 | 0 20 | 17 | 41.8 −41.8 | 79.0 −79.0 | 25.1 −25.1 | 16.9 9.8 | 15.2 −8.3 | 77.0 5.0 | 23.2 −23.2 | 16.8 −16.8 | 12.6 −10.7 | |||
| Li et al. (2021) [36] | water | 10.0 | 10.0 (20.0) | Inner | 0.0046 | 564 1200 | 5 6 | 32 | 20.7 −20.7 | 53.3 −53.4 | 15.3 15.3 | 12.7 −12.7 | 46.0 −46.0 | 30.1 30.1 | 5.4 −3.8 | 5.9 −4.7 | 6.4 −4.3 |
| Yin et al. (2000) [13] * | R-134a | 16.66 | 10.31 (37.4) | inner | 0.0748 | 100 300 | 8 10 | 32 | 22.9 −22.9 | 74.8 −74.8 | 8.2 −7.7 | 35.5 −35.5 | 42.8 42.8 | 50.9 −50.9 | 23.5 −24.5 | 20.3 −20.3 | 19.4 −19.4 |
| Devadhanush et al. (2021) [37] * | HFE-7100 | 23.6 | 17.3 (81.5) | inner | 0.0519 | 91 683 | 21 36 | 35 | 33.0 −32.0 | 86.2 −86.2 | 22.9 −21.7 | 31.9 −31.7 | 37.4 −37.4 | 72.0 −72.0 | 23.7 −23.6 | 24.6 −23.6 | 21.6 −20.1 |
| All sources | 4.0 42.2 | 1.0 22.8 | 0.009 0.9218 | 59 6132 | 0 110 | 656 | 14.0 −4.1 | 53.8 −51.9 | 19.0 13.1 | 26.2 −3.5 | 35.7 7.3 | 41.5 −27.3 | 13.5 −0.2 | 12.3 −5.7 | 11.6 −4.8 | ||
| Source | Fluid | Test Section | pr | G Kg m−2s−1 | Sub-Cooling K | No. of Data Pts. | Mean Absolute Deviation (MAD), % Average Deviation (AD), % | |||||||||
|---|---|---|---|---|---|---|---|---|---|---|---|---|---|---|---|---|
| Flow Direction | Dhyd (Dhp) mm | |||||||||||||||
| Liu and Winterton | Gungor and Winterton | Haynes and Fletcher | Moles and Shaw | Devahdhanush and Mudwar | Badiuzzaman | Shah (1977) [1] | Shah (2017a) [2] | New Correlation | ||||||||
| Lazarek and Black (1982) [38] | R-113 | V | 3.1 | 0.0503 | 502 | 0.6 24 | 10 | 26.6 −26.6 | 80.8 −80.8 | 9.1 −9.1 | 43.2 43.2 | 8.6 1.8 | 32.7 −30.9 | 8.8 −8.2 | 7.8 −2.3 | 6.8 −0.8 |
| Bao et al. (2000) [39] | R-123 | H | 1.95 | 0.0959 0.1378 | 167 452 | 0.2 48 | 51 | 26.7 −26.7 | 73.0 −73.0 | 13.8 −13.2 | 23.3 23.3 | 15.8 9.5 | 37.1 −37.1 | 15.3 −4.8 | 13.8 −12.5 | 13.2 −12.0 |
| R-11 | 0.0666 0.1070 | 167 560 | 3 46 | 49 | 17.6 −16.9 | 63.3 −63.3 | 6.4 −2.8 | 33.3 33.3 | 37.6 35.2 | 16.6 −14.7 | 12.0 −10.7 | 7.6 −4.5 | 6.7 −2.7 | |||
| Boyd (1988, 1989) [40,41] | water | H | 3.0 | 0.0352 0.0752 | 4600 31500 | 16 100 | 15 | 16.4 −16.4 | 45.8 −45.8 | 6.3 3.5 | 19.0 −19.0 | 21.9 21.9 | 12.3 8.1 | 5.5 1.6 | 7.2 −5.2 | 7.6 −5.9 |
| Haynes and Fletcher (2003) [42] | R-11 | H | 1.95 | 0.0797 0.0959 | 150 1840 | 0 35 | 21 | 23.0 −23.0 | 58.3 −58.3 | 10.0 −6.9 | 154.7 154.0 | 24.7 13.2 | 75.2 33.6 | 15.8 −13.5 | 12.0 −7.8 | 11.9 −9.3 |
| Papell (1963) [43] | water | V | 7.9 | 0.0079 0.0337 | 1306 2200 | 99 133 | 13 | 5.8 −0.8 | 36.0 −36.0 | 9.6 7.9 | 68.3 68.3 | 20.0 18.6 | 14.3 13.2 | 4.7 −0.2 | 7.4 −6.6 | 7.5 −6.9 |
| Hodgson (1968) [44] | water | H | 11.8 | 0.0315 0.1723 | 1781 8130 | 10 129 | 58 | 15.0 15.0 | 30.8 −27.0 | 36.6 36.6 | 17.3 −10.2 | 41.7 41.7 | 16.6 15.2 | 22.6 22.5 | 13.1 11.8 | 12.5 11.0 |
| Gouse and Coumou (1965) [45] | R-113 | H | 10.9 | 0.0325 0.0381 | 525 703 | 0 8.3 | 5 | 10.2 −9.8 | 45.3 −45.3 | 30.5 30.5 | 907.8 907.8 | 18.7 −18.4 | 276.1 241.3 | 26.7 26.7 | 21.8 21.8 | 21.6 21.6 |
| Riedle and Percupile (1973) [46] | R-113 | H | 6.6 | 0.098 0.1343 | 1518 2466 | 1.4 4.9 | 13 | 32.7 −32.7 | 42.0 −42.0 | 11.8 −7.7 | 8.3 2.2 | 54.0 −54.0 | 64.6 −64.6 | 14.2 −12.1 | 24.0 −24.0 | 21.0 −21.0 |
| R-12 | 0.2202 0.2327 | 1457 2190 | 0.5 9.5 | 12 | 33.4 −31.9 | 57.3 −56.0 | 8.0 −1.5 | 23.4 19.7 | 43.2 −43.2 | 41.2 −41.2 | 15.1 −11.4 | 19.1 −19.1 | 18.8 −18.8 | |||
| R-11 | 0.1577 0.2054 | 1639 1703 | 0 9 | 8 | 26.3 −26.3 | 45.9 −45.9 | 15.6 6.2 | 71.8 61.8 | 42.9 −42.9 | 44.8 −25.6 | 16.4 −4.2 | 16.9 −13.3 | 16.2 −11.2 | |||
| R-12 | 18.8 | 0.1702 0.2391 | 1437 4489 | 0.8 11.1 | 25 | 17.6 −16.0 | 41.8 −41.7 | 19.4 19.1 | 13.9 2.0 | 46.2 −46.2 | 49.0 49.0 | 16.3 3.0 | 15.1 −6.6 | 15.9 −5.3 | ||
| R-113 | 0.1459 0.1944 | 1897 4733 | 2 18 | 17 | 30.6 −30.6 | 54.2 −54.2 | 11.4 −2.4 | 12.6 −8.1 | 42.3 −42.3 | 66.3 −66.3 | 15.4 −10.7 | 18.6 −15.0 | 19.4 −15.0 | |||
| R-11 | 0.1069 0.2077 | 1470 4698 | 0 17 | 26 | 14.7 −12.5 | 42.4 −42.4 | 23.0 23.0 | 26.2 10.8 | 30.2 −30.2 | 43.3 −41.6 | 16.7 8.0 | 17.5 1.6 | 19.1 2.4 | |||
| Noel (1961) [47] | NH3 | V | 6.2 | 0.1035 0.6363 | 570 24160 | 14 92 | 27 | 7.3 3.8 | 40.3 −40.3 | 16.2 16.2 | 13.7 −13.4 | 84.0 64.0 | 8.4 −7.2 | 11.1 9.1 | 9.7 4.6 | 9.2 4.9 |
| Yan et al. (2015) [48] | water | V | 9.0 | 0.1367 0.2274 | 6000 10000 | 27 165 | 42 | 13.5 13.0 | 27.2 −27.2 | 27.2 27.2 | 10.1 −4.3 | 67.0 67.0 | 15.2 14.7 | 19.7 19.5 | 15.8 13.7 | 15.5 13.3 |
| Clarke and Rohsenow (1953) [49] | water | V | 4.6 | 0.6268 | 5285 | 64 142 | 30 | 2.4 −0.5 | 17.9 −16.9 | 3.0 3.0 | 8.5 −0.3 | 115.5 115.5 | 9.2 −2.0 | 2.4 0.8 | 6.1 −6.1 | 6.0 −6.0 |
| Bergles and Rohsenow (1964) [50] | water | V | 2.4 | 0.0069 | 509 3293 | 60 | 20 | 3.5 1.2 | 36.1 −36.0 | 17.6 17.6 | 48.6 48.6 | 43.0 43.0 | 63.4 63.4 | 12.6 12.6 | 9.7 8.1 | .9.3 7.6 |
| Callizo et al. (2007) [51] | R-134a | V | 1.22 | 0.2194 | 500 700 | 0 5.4 | 12 | 37.7 6.3 | 38.8 −14.7 | 19.0 14.2 | 65.8 65.8 | 28.6 −24.0 | 37.7 −37.7 | 19.2 13.4 | 20.0 −20.0 | 18.7 −18.7 |
| Ciancolini et al. (2007) [52] | water | H | 4.03 | 0.009 0.0235 | 529 839 | 0.5 34 | 20 | 6.9 0.9 | 38.8 −38.8 | 30.5 30.5 | 27.8 27.8 | 25.4 13.9 | 92.4 92.4 | 19.7 19.7 | 14.7 14.7 | 14.1 14.0 |
| Baburajan et al. (2013) [53] | water | H | 7.5 | 0.0055 | 476 | 17 65 | 11 | 6.9 −6.2 | 53.2 −53.2 | 13.7 10.9 | 22.5 18.0 | 22.2 17.2 | 49.3 49.3 | 5.2 −0.9 | 3.4 −0.9 | 3.2 −1.8 |
| 5.5 | 0.0055 | 686 691 | 21 55 | 14 | 6.3 −6.6 | 22.8 −22.8 | 9.5 8.3 | 18.3 18.3 | 17.4 17.4 | 51.0 51.0 | 6.2 3.9 | 11.0 −7.4 | 11.0 −7.8 | |||
| Styushin and Varshnei (1967) [54] | water | H | 8.97 | 0.0068 | 1152 | 8 24 | 12 | 13.6 13.3 | 8.0 5.0 | 34.3 34.3 | 7.4 −0.6 | 18.5 −18.5 | 38.9 38.9 | 27.5 27.5 | 11.6 4.3 | 12.6 4.3 |
| Isopro-panol | 0.0439 | 1427 1464 | 2 53 | 69 | 11.2 −10.2 | 49.4 −49.4 | 15.4 15.2 | 25.3 25.3 | 29.3 −29.3 | 50.2 −50.2 | 8.7 −0.5 | 11.1 −0.6 | 11.2 −1.4 | |||
| Kreith and Summe-rfield (1949) [55] | water | V | 14.9 | 0.0050 0.0492 | 1868 3815 | 50 145 | 42 | 6.7 −6.4 | 52.0 −52.0 | 6.0 5.7 | 19.3 17.5 | 6.0 −0.7 | 5.9 −1.5 | 13.8 −13.8 | 7.2 −7.1 | 9.7 −9.5 |
| H | 13.6 | 0.0050 0.0471 | 1038 3346 | 37 90 | 11 | 2.5 0.1 | 46.0 −46.0 | 21.6 21.6 | 12.6 9.2 | 7.3 7.3 | 24.1 24.1 | 8.9 8.9 | 10.7 6.8 | 10.3 5.8 | ||
| Liu and Bi (2015) [56] | Cyclo-hexane | H | 2.0 | 0.492 | 318 | 16 116 | 6 | 7.9 −7.9 | 67.5 −67.5 | 3.8 −3.7 | 70.8 63.7 | 51.7 −51.7 | 49.9 −49.9 | 13.1 −13.1 | 13.4 −13.4 | 11.1 −11.1 |
| Saraceno et al. (2012) [57] | FC-72 | H | 1.0 | 0.1612 | 1030 1145 | 67 77 | 14 | 28.9 28.9 | 110.2 110.2 | 22.2 22.2 | 250.3 250.3 | 91.6 91.6 | 19.0 −19.0 | 19.4 19.4 | 2.6 2.6 | 2.6 2.5 |
| He (1988) [58] | Water | H | 9.0 | 0.0046 | 495 891 | 74 | 11 | 18.9 18.1 | 40.6 −40.6 | 32.1 32.1 | 83.5 83.5 | 29.8 29.8 | 51.8 51.8 | 14.9 14.8 | 15.2 12.3 | 14.7 11.8 |
| Guo et al. (2023) [24] | Water | H | 2.0 | 0.1363 0.1813 | 2000 3200 | 35 139 | 82 | 7.6 −5.4 | 43.6 −43.6 | 5.6 5.0 | 12.1 −1.9 | 94.9 94.9 | 32.2 32.2 | 4.5 0.2 | 6.8 −3.6 | 6.8 −3.5 |
| 1.0 | 0.1363 0.2268 | 2700 3200 | 27 128 | 68 | 6.0 5.8 | 29.4 −29.4 | 17.9 17.9 | 20.9 20.8 | 138.3 138.3 | 64.2 84.2 | 14.9 14.9 | 10.8 9.7 | 10.7 9.6 | |||
| Huai et al. (2004) [59] * | CO2 | H | 1.33 | 0.5422 | 200 399 | 0 8 | 18 | 24.3 24.3 | 30.3 −1.1 | 39.5 39.5 | 64.5 64.5 | 37.6 30.6 | 28.0 −23.9 | 27.5 27.5 | 10.1 −8.2 | 10.1 −8.3 |
| Zhao and Bansal (2009) [60] | CO2 | H | 6.16 | 0.1128 | 200 300 | 0 16 | 32 | 19.6 5.0 | 34.6 −26.4 | 39.8 34.2 | 73.9 72.7 | 33.0 5.4 | 30.0 17.7 | 25.2 15.6 | 16.1 −0.2 | 15.9 −0.3 |
| All sources | 1.0 18.8 | 0.0046 0.6363 | 150 31500 | 0 165 | 864 | 13.8 −5.4 | 44.2 −38.9 | 17.3 13.4 | 36.0 28.1 | 50.8 32.7 | 37.5 4.6 | 13.2 5.2 | 11.6 −0.9 | 11.4 −0.9 | ||
2.2. Prediction Methods
2.2.1. Shah (1977) [1] Correlation
2.2.2. Shah (2017a) [2] Correlation
3. Present Research and Development
3.1. New Correlation
3.2. Choice of Equivalent Diameter for Partially Heated Channels
3.3. Heat Transfer in Annuli
3.4. Other Investigations
4. Evaluation of Correlations
4.1. Data Collection
4.2. Correlations Evaluated
4.3. Calculation Method
4.4. Results of Evaluation
5. Discussion
5.1. Partially Heated Rectangular Channels
5.1.1. Effect of Flow Direction
5.1.2. Effect of Channel Diameter
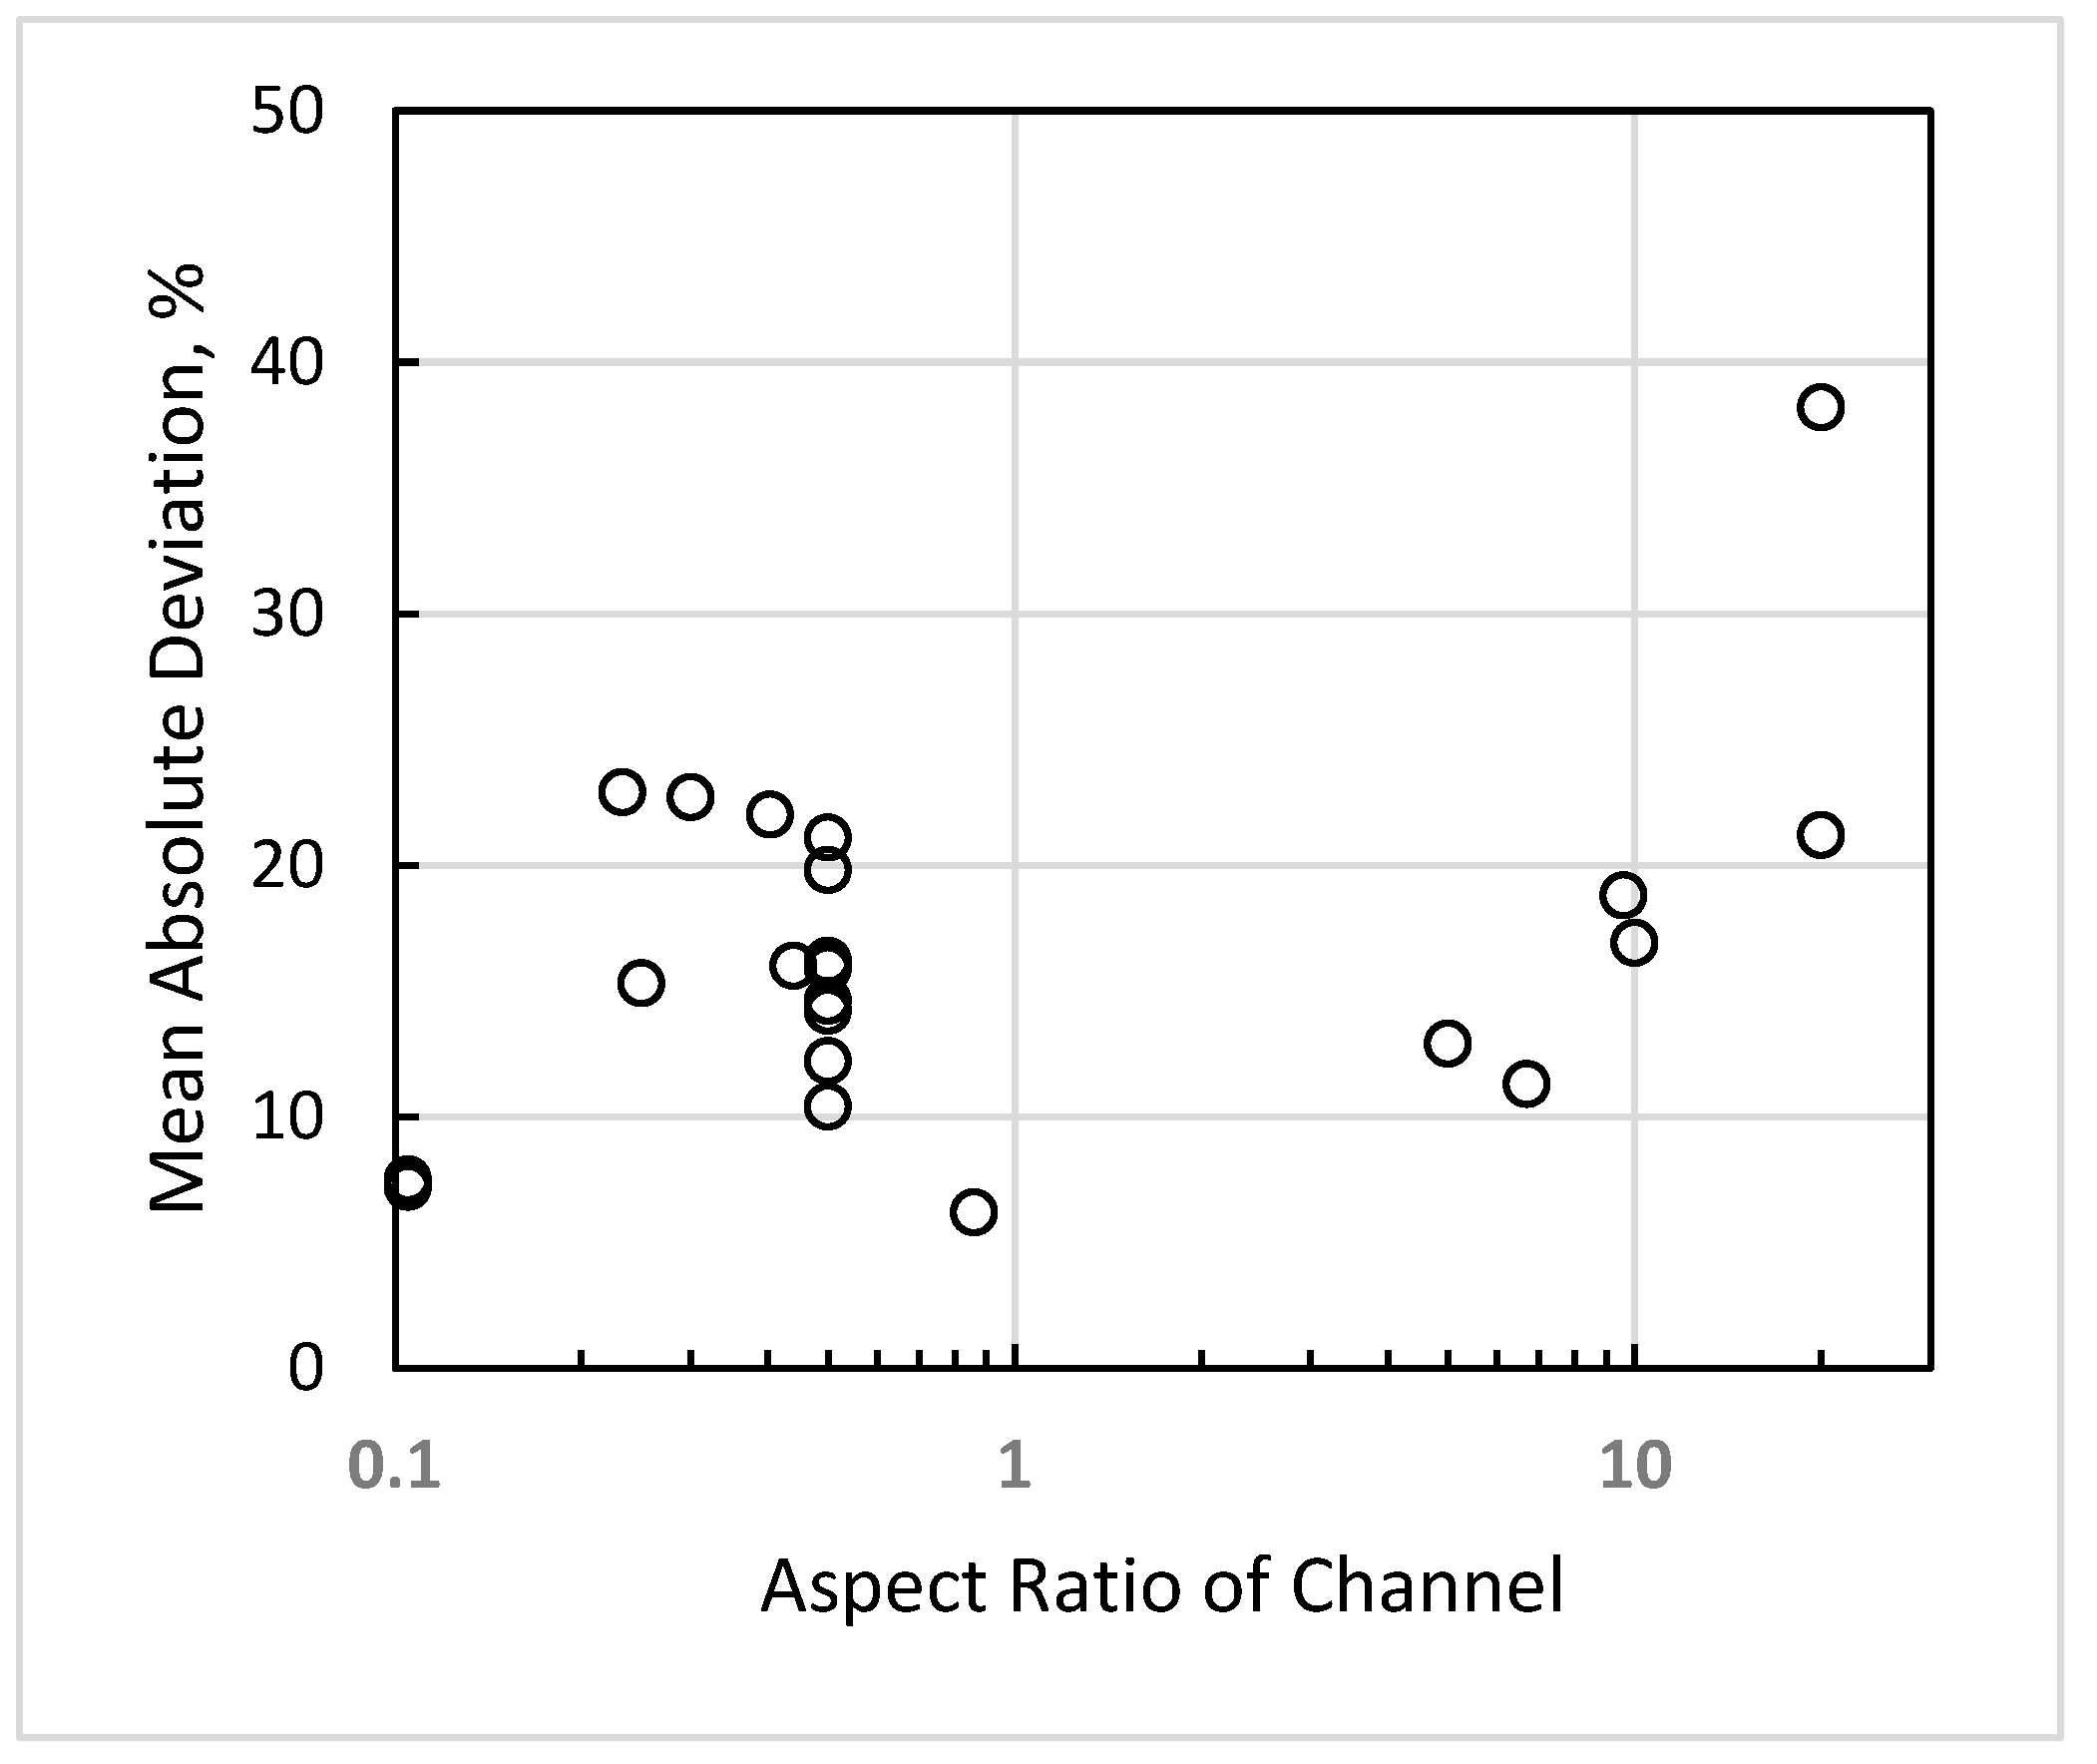
5.1.3. Effect of Channel Aspect Ratio
5.2. Annuli
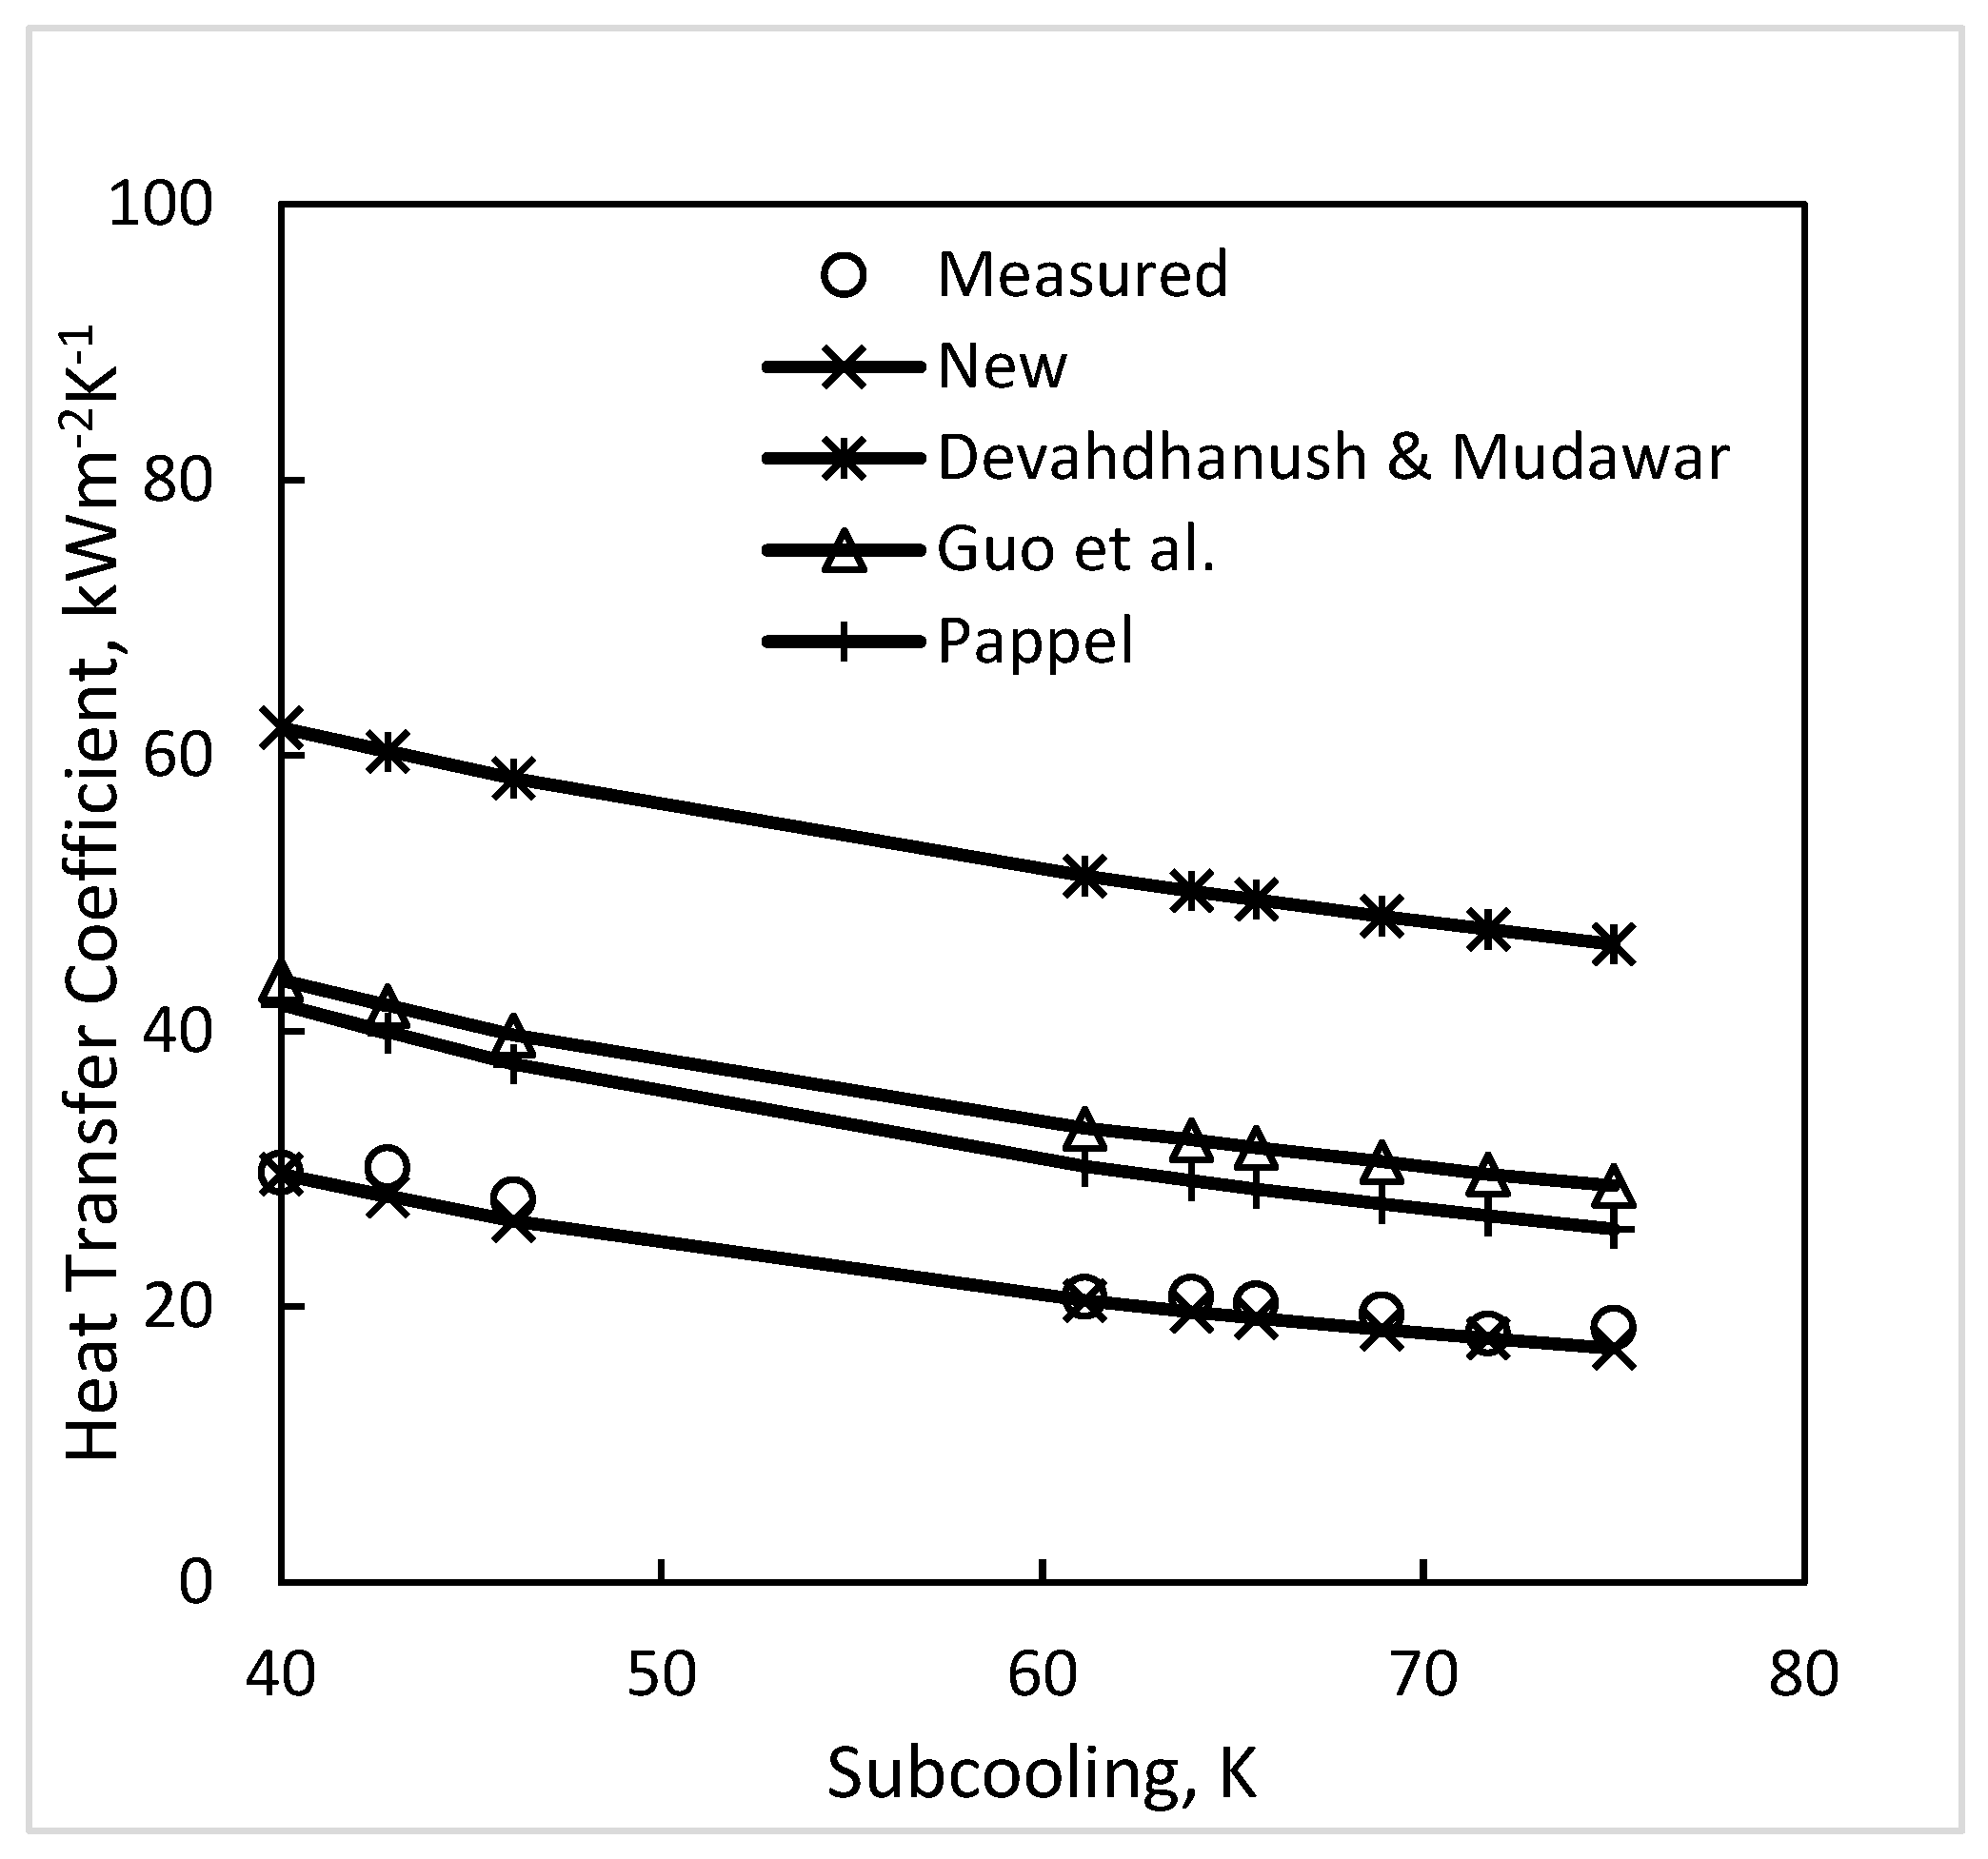
5.3. Round Channels
5.4. Haynes and Fletcher Correlation
5.5. Applicability under Microgravity
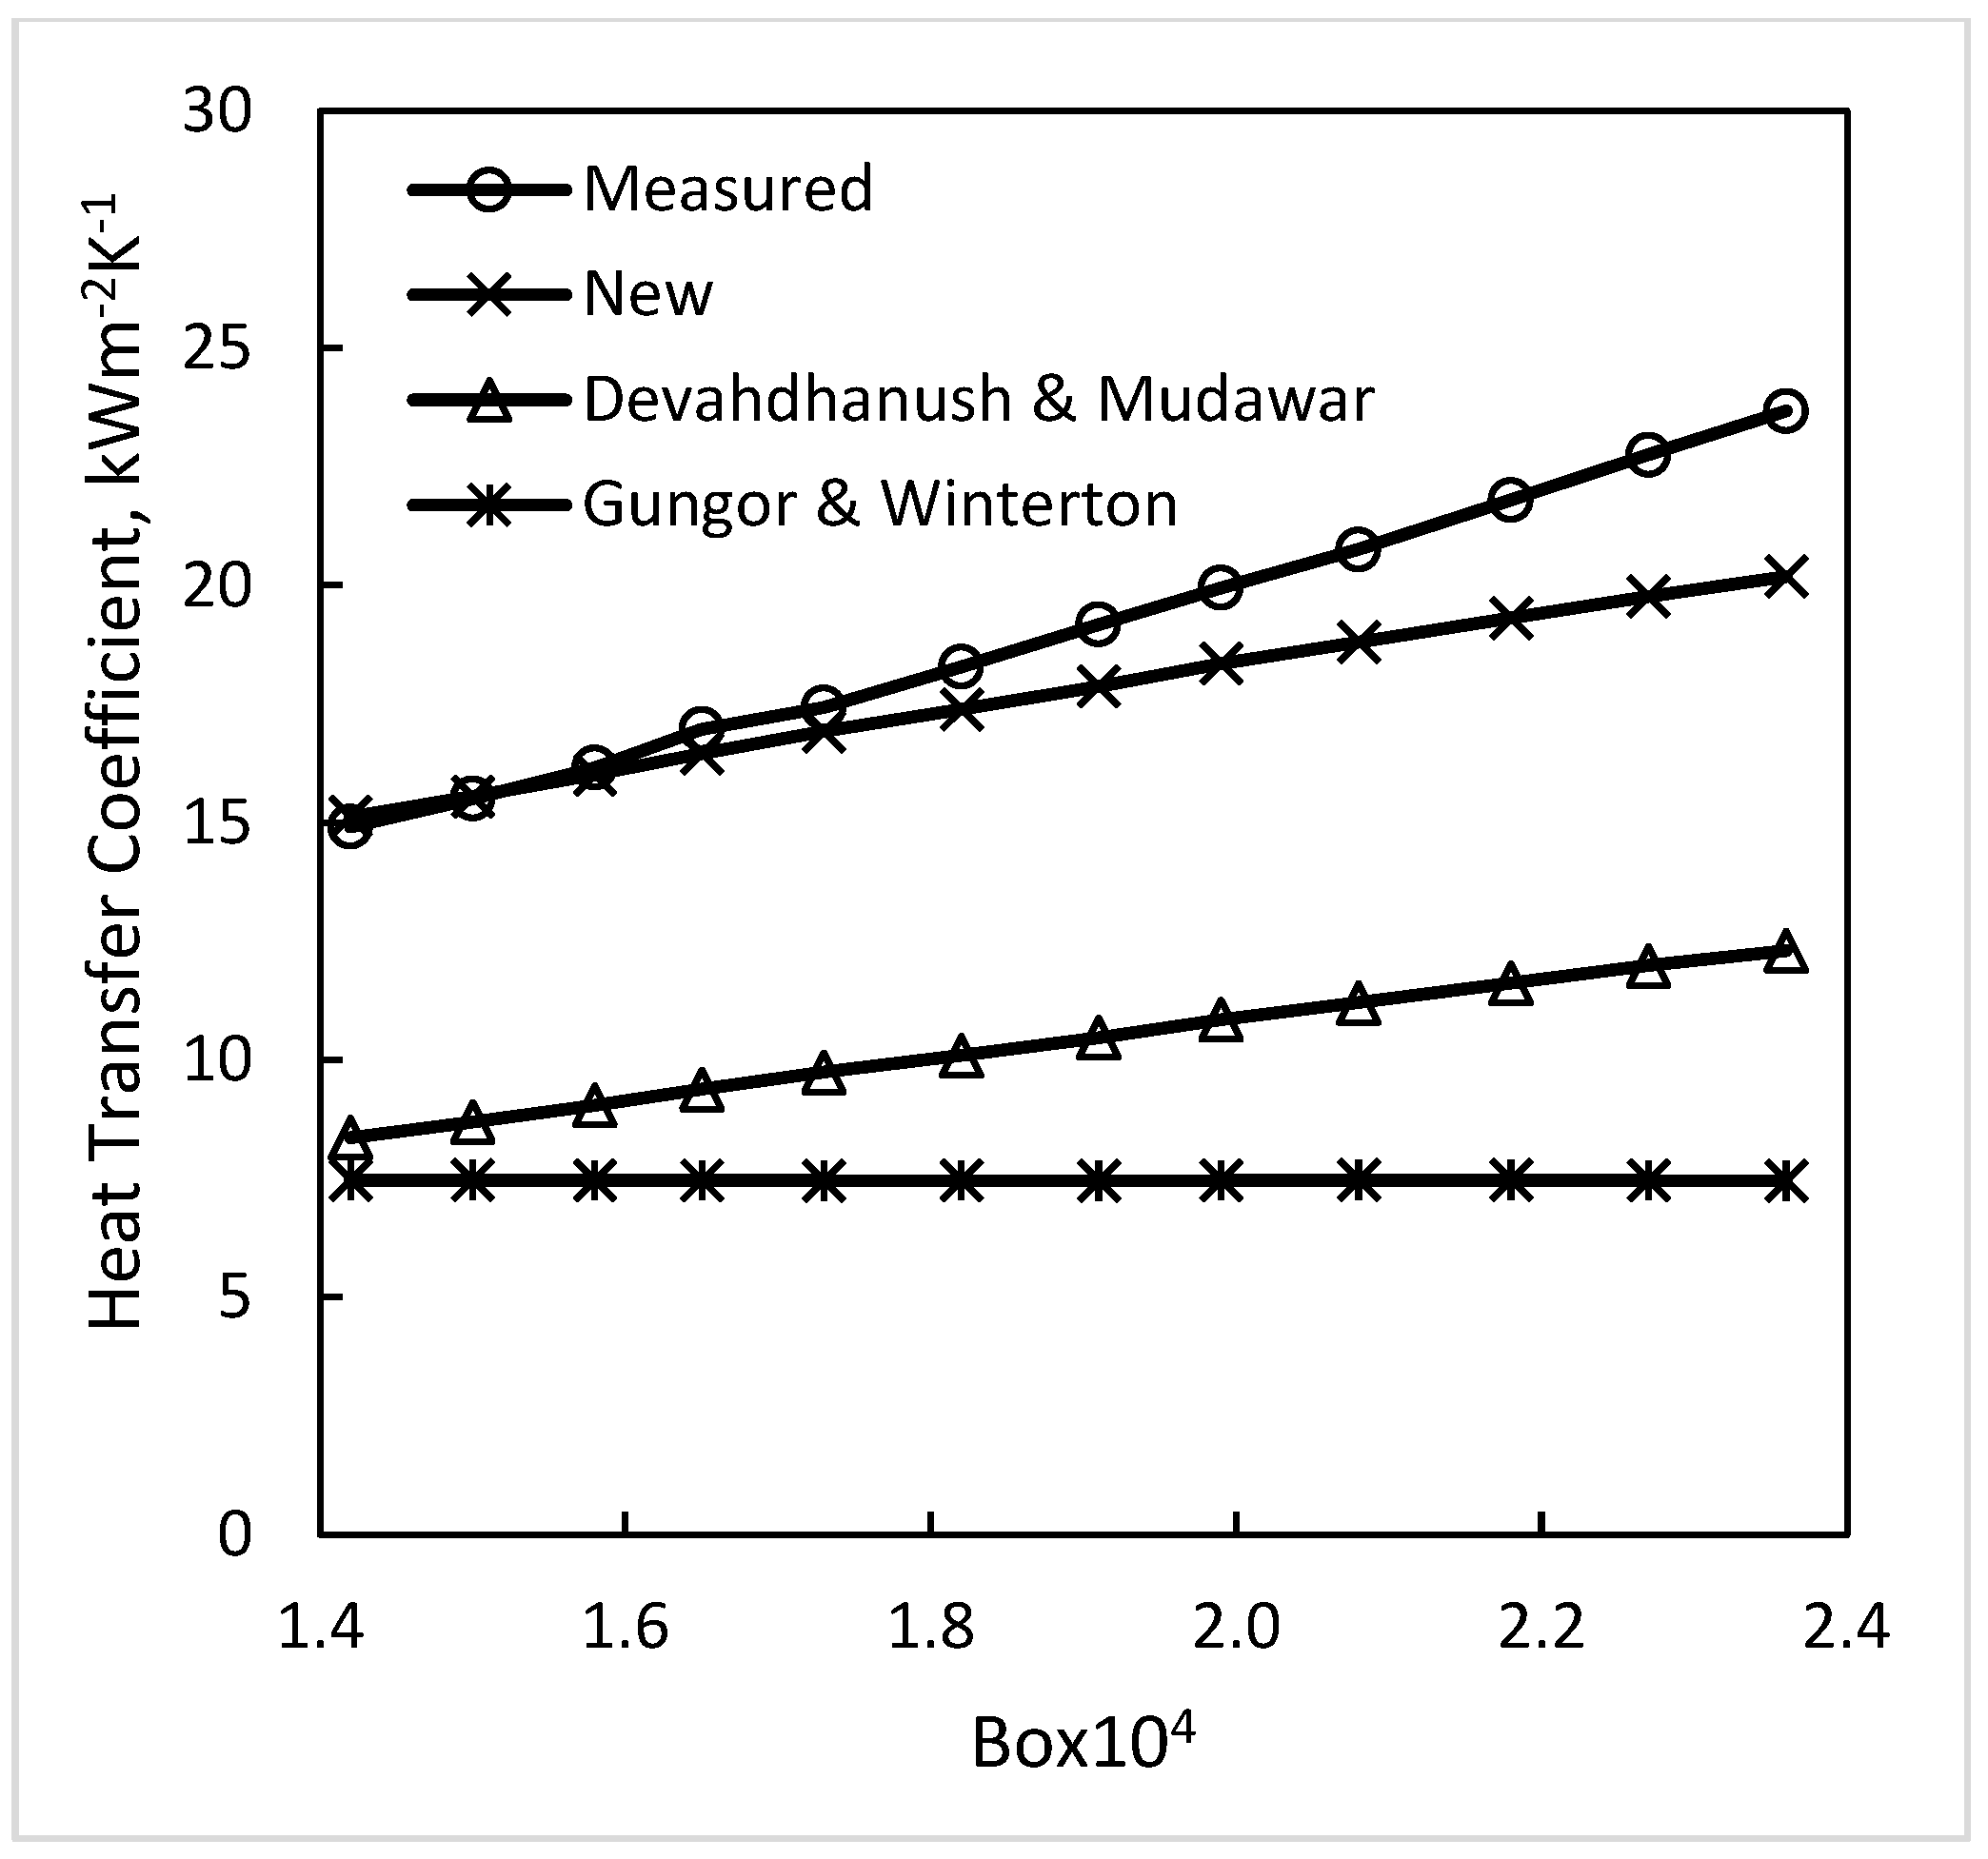
5.6. Application to Minichannels
5.7. Limitations of the New Correlation
5.8. Recommendations for Design
6. Conclusions
- The choice of equivalent diameter of partly heated channels was investigated. It was determined that the hydraulic equivalent diameter should be used for partly heated channels;
- A new correlation was presented for heat transfer during subcooled boiling in channels and annuli which is a modification of the author’s earlier correlation, Shah (2017a) [2];
- The new correlation together with 10 others was compared with a database that included various geometries (round tubes, rectangular channels, and annuli), hydraulic diameters from 0.176 to 22.8 mm, reduced pressure from 0.0046 to 0.922, subcooling from 0 to 165 K, mass flux from 59 to 31,500 kgm−2s−1, all flow directions, and terrestrial to micro gravity. The new correlation has mean absolute deviation (MAD) of 13.3% with 2270 data points from 49 sources. Correlations by other authors had MAD of 18.4% to 116%.
- The data included up- and downflow as well as horizontal flow in channels. For annuli the data were for horizontal flow and upflow. Applicability to downflow in annuli remains to be investigated; new experimental studies are needed for it.
- It was established that low gravity does not deteriorate subcooled flow boiling heat transfer and the correlations based on earth gravity data can be used under microgravity.
- Data were compared with various criteria for minichannels. It was determined that there were no significant effect of surface tension and hence all data were for macrochannels.
Funding
Data Availability Statement
Conflicts of Interest
Nomenclature
| AR | Aspect ratio of channel, width divided by height (−) |
| Bd | Bond number = , (−) |
| Bo | Boiling number = q (G iLG)−1, (−) |
| CPL | Specific heat of liquid at constant pressure, (J kg−1 °C−1) |
| D | Diameter or equivalent diameter, (m) |
| Din | Outside diameter of inner tube of annulus, (m) |
| DHP | equivalent diameter based on perimeter with boiling, defined by Equation (8), m |
| DHYD | hydraulic equivalent diameter, defined by Equation (7), m |
| Dout | Inner surface diameter of the outer tube of annulus, (m) |
| G | Total mass flux (liquid + vapor), (kg m−2s−1) |
| g | Acceleration due to gravity, (m s−2) |
| H | Height of channel, (m) |
| h | Heat transfer coefficient, (Wm−2K−1) |
| hLT | Heat transfer coefficient with all mass flowing as liquid, (Wm−2K−1) |
| hPB | Heat transfer coefficient during pool boiling, (W m−2K−1) |
| hTP | Two-phase heat transfer coefficient defined by Equation (15), (Wm−2K−1) |
| iLG | Latent heat of vaporization, (J kg−1) |
| k | Thermal conductivity, (Wm−1 K−1) |
| N | Number of data points, (−) |
| pr | Reduced pressure, (−) |
| Pr | Prandtl number, (−) |
| q | Heat flux, (Wm−2) |
| ReLT | Reynolds number, = GDµL−1, (−) |
| TB | Bulk liquid temperature, (°C) |
| TSAT | Saturation temperature, (°C) |
| Tw | Wall temperature, (°C) |
| ΔTSAT | = (Tw − TSAT), (°C) |
| ΔTSC | = (TSAT − TB), (°C) |
| W | Width of channel, (m) |
| WeGT | Weber number for all mass flowing as vapor, defined by Equation (33), (−) |
| Greek | |
| μ | Dynamic viscosity, (kg m s−1) |
| ρ | Density, (kg m−3) |
| σ | Surface tension, (N m−1) |
| Ψ0 | Ratio of two-phase to single-phase heat transfer coefficient at zero quality, (−) |
| Subscripts | |
| in | inner |
| G | vapor |
| L | liquid |
| out | outer |
References
- Shah, M.M. A general correlation for heat transfer during subcooled boiling in pipes and annuli. ASHRAE Trans. 1977, 83, 205–215. [Google Scholar]
- Shah, M.M. New correlation for heat transfer during subcooled boiling in plain channels and annuli. Int. J. Therm. Sci. 2017, 112, 358–370. [Google Scholar] [CrossRef]
- Shah, M.M. Comprehensive correlations for heat transfer during condensation in conventional and mini/micro channels in all orientations. Int. J. Refrig. 2016, 67, 22–41. [Google Scholar] [CrossRef]
- Shah, M.M. Generalized prediction of heat transfer during subcooled boiling in annuli. Heat Transf. Eng. 1983, 4, 24–31. [Google Scholar] [CrossRef]
- Alferov, N.S.; Rybin, R.A. Heat transfer in annular channel. In Convective Heat Transfer in Two-Phase and One Phase Flows; Borishanskii, V.M., Paleev, I.I., Eds.; Israel Program for Scientific Translations: Jerusalem, Israel, 1969; pp. 115–134. [Google Scholar]
- Shah, M.M. Chart correlation for saturated boiling heat transfer; equations and further study. ASHRAE Trans. 1982, 88, 165–196. [Google Scholar]
- Shah, M.M. A new correlation for heat transfer during boiling flow through pipes. ASHRAE Trans. 1976, 82, 66–86. [Google Scholar]
- Shah, M.M. Unified correlation for heat transfer during boiling in plain mini/micro and conventional channels. Int. J. Refrig. 2017, 74, 604–624. [Google Scholar] [CrossRef]
- Shah, M.M. New general correlation for heat transfer during saturated boiling in mini and macro channels. Int. J. Refrig. 2022, 137, 103–116. [Google Scholar] [CrossRef]
- Shah, M.M. Two-Phase Heat Transfer; John Wiley and Sons: Hoboken, NJ, USA, 2021. [Google Scholar]
- Mudawar, I.; Devahdhanush, V.S.; Darges, S.J.; Hasan, M.M.; Nahra, H.K.; Balasubramaniam, R.; Mackey, J.R. Heat transfer and interfacial flow physics of microgravity flow boiling in single-side-heated rectangular channel with subcooled inlet conditions –Experiments onboard the International Space Station. Int. J. Heat Mass Transf. 2023, 207, 124000. [Google Scholar] [CrossRef]
- Devahdhanush, V.S.; Mudawar, I. Subcooled flow boiling heat transfer in a partially-heated rectangular channel at different orientations in Earth gravity. Int. J. Heat Mass Transf. 2022, 195, 123200. [Google Scholar] [CrossRef]
- Yin, L.; Xu, R.; Jiang, P.; Cai, H.; Jia, L. Subcooled flow boiling of water in a large aspect ratio microchannel. Int. J. Heat Mass Transf. 2017, 112, 1081–1089. [Google Scholar] [CrossRef]
- Zhu, Y.; Li, X.; Liu, Y.; Mubarak, S.; Wang, S. Experimental study of flow boiling characteristics in minigap channels over a wide heat flux range. Int. J. Heat Mass Transf. 2023, 201, 123567. [Google Scholar] [CrossRef]
- Gupta, S.K.; Misra, R.D. An experimental investigation on flow boiling heat transfer enhancement using Cu-TiO2 nanocomposite coating on copper substrate. Exp. Therm. Fluid Sci. 2018, 98, 406–419. [Google Scholar] [CrossRef]
- Krishnan, R.A.; Balasubramanian, K.R.; Suresh, S. The effect of heating area orientation on flow boiling performance in microchannels heat sink under subcooled condition. Int. J. Heat Mass Transf. 2017, 110, 276–293. [Google Scholar] [CrossRef]
- Li, W.; Li, J.; Feng, Z.; Zhou, K.; Wu, Z. Local heat transfer in subcooled flow boiling in a vertical mini-gap channel. Int. J. Heat Mass Transf. 2017, 110, 796–804. [Google Scholar] [CrossRef]
- Kharangate, C.R.; O’Neill, L.E.; Mudawar, I.; Hasan, M.M.; Nahra, H.K.; Balasubramaniam, R.; Hall, N.R.; Macner, A.M.; Mackey, J.R. Effects of subcooling and two-phase inlet on flow boiling heat transfer and critical heat flux in a horizontal channel with one-sided and double-sided heating. Int. J. Heat Mass Transf. 2015, 91, 1187–1205. [Google Scholar] [CrossRef]
- Qu, W.; Mudawar, I. Flow boiling heat transfer in two-phase micro-channel heat sinks––I. Experimental investigation and assessment of correlation methods. Int. J. Heat Mass Transf. 2003, 46, 2755–2771. [Google Scholar] [CrossRef]
- Lee, J.; Mudawar, I. Fluid flow and heat transfer characteristics of low temperature two-phase micro-channel heat sinks—Part 1: Experimental methods and flow visualization results. Int. J. Heat Mass Transf. 2008, 51, 4315–4326. [Google Scholar] [CrossRef]
- Lee, J.; Mudawar, I. Fluid flow and heat transfer characteristics of low temperature two-phase micro-channel heat sinks—Part 2. Subcooled boiling pressure drop and heat transfer. Int. J. Heat Mass Transf. 2008, 51, 4327–4341. [Google Scholar] [CrossRef]
- Peng, X.F.; Wang, B.X. Forced convection and flow coining heat transfer for liquid flowing through microchannels. Int. J. Heat Mass Transf. 1993, 36, 3421–3427. [Google Scholar] [CrossRef]
- Chernobylskii, I.I.; Tananaiko, I.M. Heat transfer in during boiling of liquids in narrow annular tubes. Sov. Physics. Tech. Phys. 1956, 3, 2244–2249. [Google Scholar]
- Guo, P.; Zheng, S.; Yan, J.; Zhou, Q.; Wang, S.; Li, W. Experimental investigation on heat transfer of subcooled flow boiling of water in mini channels under high heat fluxes. Exp. Therm. Fluid Sci. 2023, 142, 110831. [Google Scholar] [CrossRef]
- Tarasova, N.V.; Orlov, V.M. Heat transfer and hydraulic resistance during surface boiling of water in annular channels. In Convective Heat Transfer in Two-Phase and One Phase Flows; Borishanskii, V.M., Paleev, I.I., Eds.; Israel Program for Scientific Translations: Jerusalem, Israel, 1969; pp. 135–136. [Google Scholar]
- Lung, H.; Latsch, K.; Rampf, H. Boiling heat transfer to subcooled water in turbulent annular flow. In Heat Transfer in Boiling; Hahne, E., Grigull, U., Eds.; Hemisphere: Washington, DC, USA, 1977. [Google Scholar]
- Dougall, R.S.; Panian, D.J. Subcooled Boiling of Trichlorfuoroethane; NASA Contract Report CR-2137; NASA: Washington, DC, USA, 1972. [Google Scholar]
- Thom, J.R.S.; Walker, W.M.; Fallon, T.A.; Reising, G.F.S. Boiling in subcooled water during flow up heated tubes or annuli. Proc. Inst. Mech. Eng. 1965, 180. [Google Scholar]
- McAdams, W.H.; Kennel, W.E.; Minden, C.S.; Carl, R.; Picornell, P.M.; Dew, J.E. Heat transfer at high rates to water with surface boiling. Ind. Eng. Chem. 1949, 41, 1945–1953. [Google Scholar] [CrossRef]
- Rassokhin, N.G.; Tsang-Wen, M.; Melnikov, V.N. Some experimental data on surface boiling of water in narrow annular channels. In Convective Heat Transfer in Two-Phase and One Phase Flows; Borishanskii, V.M., Paleev, I.I., Eds.; Israel Program for Scientific Translations: Jerusalem, Israel, 1969; pp. 163–169. [Google Scholar]
- Colburn, A.P.; Gazley, G.; Schoeborn, E.M.; Sutton, C.S. Effect of Local Boiling and Air Entrainment on Temperatures of Liquid Cooled Cylinders; NACA TN 1498; NACA: Washington, DC, USA, 1948. [Google Scholar]
- Lie, Y.F.; Lin, T.F. Subcooled flow boiling heat transfer and associated bubble characteristics of R-134a in a narrow annular duct. Int. J. Heat Mass Transf. 2006, 49, 2077–2089. [Google Scholar] [CrossRef]
- Hasan, A.; Roy, R.P.; Kalra, S.P. Experiments on subcooled flow boiling heat transfer in a vertical annular channel. Int. J. Heat Mass Transf. 1990, 33, 2285–2293. [Google Scholar] [CrossRef]
- Hino, R.; Ueda, T. Studies on heat transfer and flow characteristics in subcooled flow boiling—Part 1, boiling characteristics. Int. J. Multiph. Flow 1985, 11, 269–281. [Google Scholar] [CrossRef]
- Boye, G.; Schmidt, J.; Beyrau, F. Analysis of flow boiling heat transfer in narrow annular gaps applying the design of experiments method. Adv. Mech. Eng. 2015, 7, 1–14. [Google Scholar] [CrossRef]
- Li, Y.; Ren, S.; Zhang, S.; Jiang, X.; Pan, C. Subcooled flow boiling of seawater in a vertical annulus. Int. J. Heat Mass Transf. 2021, 164, 120591. [Google Scholar] [CrossRef]
- Devahdhanush, V.S.; Mudawar, I. Experimental investigation of sub- cooled flow boiling in annuli with reference to thermal management of ultra- fast electric vehicle charging cables. Int. J. Heat Mass Transf. 2021, 172, 121176. [Google Scholar] [CrossRef]
- Lazarek, G.M.; Black, S.H. Evaporative heat transfer pressure drop and critical heat flux in a small vertical tube with R113. Int. J. Heat Mass Transf. 1982, 25, 941–960. [Google Scholar] [CrossRef]
- Bao, Z.Y.; Fletcher, D.F.; Haynes, B.S. Flow boiling heat transfer of Freon R11 and HCFC123 in narrow passages. Int. J. Heat Mass Transf. 2000, 43, 3347–3358. [Google Scholar] [CrossRef]
- Boyd, R.D. Subcooled water flow boiling experiments under uniform high heat flux conditions. Fusion Technol. 1988, 13, 131–142. [Google Scholar] [CrossRef]
- Boyd, R.D. Subcooled water flow boiling at 1.66 MPa under uniform high heat flux conditions. Fusion Technol. 1989, 16, 324–330. [Google Scholar] [CrossRef]
- Haynes, B.S.; Fletcher, D.F. Subcooled flow boiling heat transfer in narrow passages. Int. J. Heat Mass Transf. 2003, 46, 3673–3682. [Google Scholar] [CrossRef]
- Papell, S.S. Subcooled Boiling Heat Transfer Under Forced Convection in aHeated Tube; Technical Note D-1583; NASA: Cleveland, OH, USA, 1963. [Google Scholar]
- Hodgson, A.S. Forced convection subcooled boiling heat transfer with water in an electrically heated tube at 100–550 lb/in2. Trans. Inst. Chem. Eng. 1968, 46, T25–T31. [Google Scholar]
- Gouse, S.W.; Coumo, K.G. Heat transfer and fluid flow inside a horizontal tube evaporator. ASHRAE Trans. 1965, 71, 152–160. [Google Scholar]
- Riedle, K.; Percupile, J.C. Experimental and analytical investigation—Boiling heat transfer in evaporator tubes—Horizontral flow. ASHRAE Trans. 1973, 142–155. [Google Scholar]
- Noel, M.B. Experimental Investigation of the Forced Convection and Nucleate Boiling Heat Transfer Characteristics of Ammonia; Technical Report; Jet Propulsion Laboratory of the California Institute of Technology: Pasadena, CA, USA, 1961; pp. 32–125. [Google Scholar]
- Yan, J.; Bi, Q.; Liu, Z.; Zhua, G.; Cai, L. Subcooled flow boiling heat transfer of water in a circular tube under high heat fluxes and high mass fluxes. Fusion Eng. Des. 2015, 100, 406–418. [Google Scholar] [CrossRef]
- Clark, J.A.; Rohsenow, W.M. Local boiling heat transfer to water at low Reynolds numbers and high pressures. Trans. ASME 1954, 76, 553–562. [Google Scholar] [CrossRef]
- Bergles, A.E.; Rohsenow, W.M. The determination of forced convection surface boiling heat transfer. Trans. ASME J. Heat Transf. 1964, 86, 365–372. [Google Scholar] [CrossRef]
- Calizzo, C.M.; Palm, B.; Owhaib, W. Subcooled flow boiling of R-134a in vertical channels of small diameter. Int. J. Multiph. Flow 2007, 33, 822–8329. [Google Scholar] [CrossRef]
- Cioncolini, A.; Santini, L.; Ricotti, M.E. Effects of dissolved air on subcooled and saturated flow boiling of water in a small diameter tube at low pressure. Exp. Therm. Fluid Sci. 2007, 32, 38–51. [Google Scholar] [CrossRef]
- Baburajan, P.K.; Bisht, G.K.; Gupta, S.K.; Prabhu, S.V. Measurement of subcooledboiling pressure drop and local heat transfer coefficient in horizontal tubeunder LPLF conditions. Nucl. Eng. Des. 2013, 255, 169–179. [Google Scholar] [CrossRef]
- Styushin, N.G.; Varshnei, B.S.; Wong, C.F. Studies on heat transfer rate of subcooled boiling liquid in tubes. Int. J. Heat Mass Transf. 1967, 10, 1349–1359. [Google Scholar] [CrossRef]
- Kreith, F.; Summerfield, M. Heat transfer to water at high flux densities with and without surface boiling. Trans. Am. Soc. Mech. Eng. 1949, 71, 805–815. [Google Scholar] [CrossRef]
- Liu, Z.; Bi, Q. Onset and departure of flow boiling heat transfer characteristics of cyclohexane in a horizontal minichannel. Int. J. Heat Mass Transf. 2015, 88, 398–405. [Google Scholar] [CrossRef]
- Saraceno, L.; Celata, G.P.; Furrer, M.; Mariani, A.; Zummo, G. Flow boiling heat transfer of refrigerant FC-72 in microchannels. Int. J. Therm. Sci. 2012, 53, 35–41. [Google Scholar] [CrossRef]
- He, J.G. Experimental Investigation for the Enhancing Erect of Polymeric Additives on Subcooled Nucleate Flow Boiling with Higher Velocity. Master’s Thesis, Tsinghua University, Beijing, China, 1988. [Google Scholar]
- Huai, X.; Koyama, S.; Zhao, T.S.; Shinmura, E.; Hidehiko, K.; Masaki, M. An experimental study of flow boiling characteristics of carbon dioxide in multiport mini channels. Appl. Therm. Eng. 2004, 24, 1443–1463. [Google Scholar] [CrossRef]
- Zhao, X.; Bansal, P. Subcooled boiling heat transfer of CO2 in a horizontal tube at low temperatures. Heat Transf. Eng. 2010, 31, 1015–1022. [Google Scholar] [CrossRef]
- Badiuzzaman, M. Correlation of subcooled boiling data. Pak. Eng. 1967, 7, 759–764. [Google Scholar]
- Kandlikar, S.G. Heat transfer characteristics in partial boiling, fully developed boiling, and significant void flow regions of subcooled flow boiling. J. Heat Transf. 1998, 120, 395–401. [Google Scholar] [CrossRef]
- Prodanovic, V.; Fraser, D.; Salcudean, M. On the transition from partial to fully developed subcooled flow boiling. Int. J. Heat Mass Transf. 2002, 45, 4727–4738. [Google Scholar] [CrossRef]
- Gungor, K.E.; Winterton, R.H.S. A general correlation for flow boiling in tubes and annuli. Int. J. Heat Mass Transf. 1986, 29, 351–358. [Google Scholar] [CrossRef]
- Liu, Z.; Winterton, R.H.S. A general correlation for saturated and subcooled flow boiling in tubes and annuli. based on a nucleate pool boiling equation. Int. J. Heat Mass Transf. 1991, 34, 2759–2827. [Google Scholar] [CrossRef]
- McAdams, W.H. Heat Transmission, 3rd ed.; McGraw-Hill: New York, NY, USA, 1954. [Google Scholar]
- Dittus, F.W.; Boelter, L.M.K. Heat transfer in automobile radiators of the tubular type. In University of California Publications of Engineering; University of California Press: Berkeley, CA, USA, 1930; Volume 2, pp. 443–461. [Google Scholar]
- Chen, Z.; Li, W.; Li, J.; Zhou, K.; Feng, Z. A new correlation for subcooled flow boiling heat transfer in a vertical narrow microchannel. J. Electron. Packag. 2021, 143, 014501. [Google Scholar] [CrossRef]
- Saha, P.; Zuber, N. Point of net vapor generation and vapor void; Paper B4.7.1974. In Proceedings of the 5th International Heat Transfer Conference, Tokyo, Japan, 3–7 September 1974. [Google Scholar]
- Shah, M.M. Evaluation of Correlations for Predicting Heat Transfer during Boiling of Carbon Dioxide Inside Channels; Paper # 8435; IHTC: Tokyo, Japan, 2014. [Google Scholar]
- Moles, F.D.; Shaw, J.F.G. Boiling heat transfer to subcooled liquids under condition of forced convection. Trans. Inst. Chem. Eng. Chem. Eng. 1972, 50, 76–84. [Google Scholar]
- Vargatik, N.B. Tables on the Thermophysical Properties of Liquids and Gases, 3rd ed.; Hemisphere: Washington, DC, USA, 1975. [Google Scholar]
- Beaton, C.F.; Hewitt, G.F. Physical Property Data for the Chemical and Mechanical Engineer; Hemisphere: New York, NY, USA, 1989. [Google Scholar]
- Lemmon, E.W.; Huber, M.L.; McLinden, M.O. NIST Reference Fluid Thermodynamic and Transport Properties; REFPROP Version 9.1; NIST: Gaithersburg, MD, USA, 2013. [Google Scholar]
- Pethukov, B.S.; Kirillov, V.V. The problem of heat exchange in turbulent flow of liquids in tubes. Teploenergetika 1958, 4, 63–68. [Google Scholar]
- Gnielinski, V. New equations for heat and mass transfer in turbulent pipe and channel flow. Int. Chem. Eng. 1976, 16, 359–368. [Google Scholar]
- Cooper, M.G. Saturation nucleate boiling. A simple correlation. In Proceedings of the National Conference on Heat Transfer, University of Leeds, Leeds, UK, 3–5 July 1984; Volume 2, pp. 785–793. [Google Scholar]
- Liu, D.; Garimella, S.V. Flow boiling heat transfer in microchannels. J. Heat Transf. 2007, 129, 1321–1332. [Google Scholar] [CrossRef]
- Rohsenow, W.M. Heat transfer with evaporation. In Heat Transfer; University of Michigan Press: Ann Arbor, MI, USA, 1953. [Google Scholar]
- Warrier, G.R.; Dhir, V.K.; Chao, D.F. Nucleate Pool Boiling experiment (NPBX) in microgravity: International Space Station. Int. J. Heat Mass Transf. 2015, 83, 781–798. [Google Scholar] [CrossRef]
- Kandlikar, S.G. Fundamental issues related to flow boiling in minichannels and microchannels. Exp. Therm. Fluid Sci. 2002, 26, 389–407. [Google Scholar] [CrossRef]
- Shah, M.M. Applicability of correlations for boiling/condensing in macrochannels to minichannels. Heat Mass Transf. Res. J. 2018, 2, 20–32. [Google Scholar]
- Cheng, L.; Mewes, D. Review of two-phase flow and flow boiling of mixtures in small and mini channels. Int. J. Multiph. Flow 2006, 32, 183–207. [Google Scholar] [CrossRef]
- Cheng, P.; Wu, H.Y. Macro and microscale phase-change heat transfer. Adv. Heat Transf. 2006, 39, 461–563. [Google Scholar]
- Kew, P.A.; Cornwell, K. Correlations for prediction of flow boiling heat transfer in small-diameter channels. Appl. Therm. Eng. 1997, 17, 705–715. [Google Scholar] [CrossRef]
- Ong, C.L.; Thome, J.R. Macro-to-micro channel transition in two-phase flow: Part 2—Flow boiling heat transfer and critical heat flux. Exp. Therm. Fluid Sci. 2011, 35, 873–886. [Google Scholar] [CrossRef]
- Shah, M.M. Improved general correlation for critical heat flux in uniformly heated vertical tubes. Int. J. Heat Fluid Flow 1987, 8, 326–335. [Google Scholar] [CrossRef]
- Shah, M.M. Applicability of general correlations for CHF in conventional tubes to mini/macro channels. Heat Transf. Eng. 2017, 38, 1–10. [Google Scholar] [CrossRef]
- Shah, M.M. Improved general correlation for CHF in vertical annuli with upflow. Heat Transf. Eng. 2015, 3, 557–570. [Google Scholar]
- Shah, M.M. A general correlation for CHF in horizontal channels. Int. J. Refrig. 2015, 59, 37–52. [Google Scholar] [CrossRef]


| Source | W × H, mm (Heat on) | Dhyd (Dhp) mm | Flow Dir. | Fluid | pr | G kgm−2s−1 | ΔTSC, K | N | Mean Absolute Deviation, % (Upper Row) Average Deviation, % (Lower Row) | ||||||||
|---|---|---|---|---|---|---|---|---|---|---|---|---|---|---|---|---|---|
| Liu and Winterton | Gungor and Winterton | Haynes and Fletcher | Mole and Shaw | Devahdhanush and Mudawar | Badiuzzaman | Shah 1977 [1] | Shah 2017a [2] | Present | |||||||||
| Mudawar et al. (2023) [11] # | 2.5 × 5 (1-side) | 3.33 (20) | VU | nPFH | 0.0674 0.0812 | 200 3800 | 3 29 | 126 | 35.6 −35.3 | 79.0 −79.0 | 19.7 −10.6 | 39.2 38.4 | 19.2 6.5 | 52.9 −52.6 | 21.0 −3.3 | 19.6 8.9 | 19.8 5.3 |
| Devahdhanush and Mudawar (2022) [12] | 2.5 × 5 (top and bottom for H, sides for V) | 3.33 (10) | Hor. | nPFH | 0.0787 | 1682 | 10 17 | 61 | 54.1 −54.1 | 82.4 −82.4 | 38.4 −38.4 | 5.2 −2.2 | 19.7 −19.7 | 66.3 −66.3 | 24.6 −24.6 | 22.9 −22.9 | 21.1 −21.1 |
| VD | 0.0899 | 1600 | 15 22 | 41 | 46.7 −46.7 | 80.3 −80.3 | 30.5 −30.5 | 6.5 5.3 | 11.5 −11.5 | 63.9 −63.9 | 19.4 −19.4 | 16.2 −16.2 | 14.2 −14.2 | ||||
| VU | 0.0695 | 200 | 4 33 | 40 | 38.5 −38.5 | 90.8 −90.8 | 29.3 −29.3 | 12.5 9.8 | 9.2 −9.2 | 61.6 −61.6 | 28.2 −28.2 | 23.0 −23.0 | 15.9 −15.9 | ||||
| 2.5 × 5 (bottom) | 3.33 (20) | VU | 0.0674 | 1600 | 2 4 | 26 | 60.8 −60.8 | 84.9 −84.9 | 42.0 −42.0 | 45.8 45.8 | 17.2 −16.2 | 52.5 −52.5 | 11.6 −10.9 | 12.5 −11.4 | 12.2 −11.3 | ||
| Yin et al. (2017) [13] | 6.0 × 0.3 (bottom) | 0.571 (1.091) | H | water | 0.0046 | 261 981 | 1 32 | 24 | 19.1 −9.9 | 55.7 −55.7 | 20.7 7.8 | 73.0 73.0 | 13.3 5.1 | 98.3 98.1 | 24.3 12.8 | 38.3 26.9 | 38.2 26.3 |
| Zhu et al. (2017) [14] | 10 × 0.5 (bottom) | 0.952 (2.0) | H | water | 0.0046 | 200 400 | 0 33 | 49 | 18.0 −12.4 | 60.4 −60.4 | 18.8 3.1 | 47.8 47.8 | 31.4 1.1 | 72.7 72.7 | 16.2 −0.9 | 20.8 11.7 | 21.2 11.3 |
| 10 × 1 (bottom) | 1.82 (4.0) | 200 400 | 2 15 | 10 | 34.1 −29.1 | 68.9 −68.8 | 18.9 −8.9 | 21.8 18.6 | 34.5 −26.9 | 66.3 66.3 | 25.2 −14.9 | 16.6 −3.2 | 16.9 −4.6 | ||||
| 10 × 2 (bottom) | 3.33 (8.0) | 200 400 | 0 19 | 101 | 17.4 −16.9 | 78.8 −78.8 | 21.7 18.5 | 6.1 4.0 | 9.7 −4.3 | 91.5 91.5 | 14.1 −10.7 | 14.1 −5.4 | 12.9 −4.7 | ||||
| Gupta et al. (2018) [15] * | 10 × 1.5 (bottom) | 2.61 (6.0) | H | water | 0.0046 | 53 361 | 27 42 | 22 | 14.3 1.7 | 79.9 −79.9 | 14.1 13.5 | 23.1 23.1 | 18.7 18.7 | 49.5 49.5 | 13.1 −9.4 | 10.2 6.0 | 11.3 8.0 |
| Krishnan et al. (2017) [16] * | 0.305 × 2.9 (bottom or top) | 0.297 (0.4) | H | water | 0.0046 | 301 900 | 21 39 | 22 | 8.2 −7.7 | 26.8 −26.8 | 7.1 −2.2 | 72.3 72.3 | 20.5 8.2 | 44.9 44.9 | 10.6 8.4 | 8.1 2.2 | 7.9 1.6 |
| Same as above (1-side) | VU VD | 301 602 | 22 38 | 19 | 10.6 −10.6 | 31.8 −31.8 | 7.3 −5.3 | 68.1 68.1 | 16.5 0.1 | 35.5 35.5 | 8.6 4.6 | 7.4 0.6 | 7.2 0.0 | ||||
| Li et al. (2017) [17] | 5 × 0.52 (bottom) | 0.942 (2.08) | VU | Water | 0.0046 | 200 400 | 3 10 | 86 | 35.7 −35.7 | 44.3 44.3 | 14.7 8.1 | 14.7 9.1 | 23.8 −23.7 | 65.5 65.5 | 14.4 7.0 | 19.1 13.4 | 18.8 13.1 |
| Kharangate et al. (2015) [18] | 2.5 × 5.0 (top and bottom) | 3.3 (10.0) | H | FC-72 | 0.0574 | 410 1592 | 17 24 | 13 | 42.0 −42.0 | 78.9 −78.9 | 28.9 −26.1 | 19.5 19.5 | 19.6 −19.6 | 57.7 −57.7 | 20.3 −17.0 | 16.7 −11.4 | 14.6 −9.3 |
| 2.5 × 5.0 (bottom) | 3.3 (20.0) | 410 1801 | 18 24 | 14 | 28.9 =28.9 | 75.7 −75.7 | 14.5 −10.6 | 42.2 42.2 | 41.8 41.8 | 49.6 −49.6 | 7.4 −0.1 | 8.7 5.6 | 10.4 9.7 | ||||
| 2.5 × 5.0 (top) | 3.3 (20.0) | 410 1587 | 19 25 | 19 | 22.3 −22.3 | 79.0 −79.0 | 10.0 −5.4 | 48.8 48.8 | 23.9 23.9 | 45.8 −45.8 | 9.8 5.1 | 10.5 9.1 | 16.2 5.6 | ||||
| Qu and Mudawar (2003) [19] * | 0.213 × 0.713 (bottom) | 0.349 (0.397) | H | water | 0.0053 | 255 | 2 33 | 7 | 34.6 −34.6 | 50.1 −50,1 | 28.2 23.9 | 31.4 −31.4 | 45.6 −45.6 | 12.9 −8.3 | 17.2 −17.2 | 22.1 −22.1 | 22.7 −22.7 |
| Lee and Mudawar (2008a, 2008b) [20,21] * | 0.260 × 1.041 (bottom) | 0.416 (0.46) | H | HFE−7100 | 0.0517 | 671 6722 | 59 93 | 23 | 13.6 −9.1 | 53.5 −49.6 | 7.1 −0.2 | 165.5 16.5 | 36.5 36.5 | 32.8 −32.8 | 12.7 11.9 | 13.8 11.1 | 15.3 12.9 |
| 0.235 × 0.577 (bottom) | 0.334 (0.39) | 0.0517 | 1340 | 31 53 | 6 | 28.0 −28.0 | 70.3 −70.3 | 14.8 −14.8 | 97.7 97.7 | 40.5 40.5 | 35.8 −35.8 | 8.8 8.8 | 13.4 12.6 | 16.0 15.4 | |||
| 0.123 × 0.527 (bottom) | 0.20 (0.22) | 0.0517 | 1280 | 31 51 | 4 | 16.1 −16.1 | 48.6 −48.6 | 5.0 −3.3 | 97.7 97.7 | 60.3 60.3 | 26.3 −26.3 | 22.0 22.0 | 21.4 21.4 | 22.9 22.9 | |||
| 0.123 × 00.305 (bottom) | 0.176 (0.21) | 0.0517 | 2216 5540 | 27 87 | 17 | 17.5 −17.5 | 49.8 −49.8 | 5.1 −3.3 | 168.9 168.9 | 53.5 53.5 | 31.2 31.2 | 20.6 20.6 | 20.4 20.4 | 22.0 22.0 | |||
| Peng and Wang (1993) [22] * | 0.6 × 0.7 (bottom) | 0.646 (0.84) | H | water | 0.0046 | 1574 3564 | 46 68 | 20 | 68.1 67.3 | 85.5 83.6 | 26.0 26.0 | 103.1 103.1 | 49.3 49.3 | 85.1 85.1 | 29.2 29.2 | 6.3 −6.1 | 6.2 −5.9 |
| All sources | 0.176 3.33 | VU, VD, H | 0.0046 0.0899 | 200 3800 | 0 39 | 750 | 29.0 −23.8 | 68.6 −63.9 | 19.1 −9.3 | 43.8 42.3 | 20.9 −0.2 | 62.6 6.5 | 17.9 −0.5 | 17.5 −0.8 | 17.0 1.0 | ||
| N | MAD, % (Upper Row) AD, % (Lower Row) | |||||
|---|---|---|---|---|---|---|
| Shah 1977 [1] | Shah (2017a) [2] | New Correlation | ||||
| DHYD | DHP | DHYD | DHP | DHYD | DHP | |
| 750 | 17.9 −0.5 | 23.0 −18.7 | 17.5 −0.8 | 22.1 −13.9 | 17.0 1.0 | 21.0 −9.3 |
| Heating Mode | Number of Sources | N | MAD % Using | |||
|---|---|---|---|---|---|---|
| DHYD if Annular Gap > 3 mm Otherwise DHP | Alferov Rybin Method | |||||
| Shah (2017a) [2] | Present | Shah (2017a) [2] | Present | |||
| Outer tube heated | 3 | 93 | 12.9 | 12.5 | 10.4 | 10.1 |
| Inner tube heated | 13 | 484 | 12.8 | 12.4 | 13.7 | 13.3 |
| Both tubes heated | 3 | 79 | 8.7 | 8.9 | 8.7 | 8.9 |
| All | 15 | 656 | 12.3 | 12.0 | 12.5 | 12.2 |
| Range | |
|---|---|
| Fluids | Water, ammonia, CO2, R-11, R-12, R-113, R-123, R-134a, FC-72, nPFH, HFE 7100, isopropanol, hexane, cyclohexane, methanol |
| Geometry | Single round tubes, single rectangular channels, rectangular multichannels, round multichannels, annuli heated on inner/outer/both tubes. Rectangular channels heated on top, bottom, top and bottom, or vertical sides |
| Flow direction | Horizontal, vertical up and down |
| Tube material | Various stainless steels, copper, brass, zirconium-copper alloy, nickel, inconel, coated glass |
| DHYD, mm | Round tubes: 1.0 to 18.8; rectangular channels: 0.176 to 3.33; annuli: 1.0 to 22.8 |
| DHP, mm | Rectangular channels: 0.21 to 20.0; annuli: 1.8 to 81.5 |
| DHP/DHYD for rectangular channels | 1.1 to 6.0 |
| Annular gap, mm | 0.5 to 11.4 |
| Aspect ratio rect. channels, W/H | 0.105 to 20 |
| Reduced pressure, pr | 0.0046 to 0.922 |
| G, kg m−2s−1 | 59 to 31,500 |
| Subcooling, degree C | 0 to 165 |
| ReLT | 375 to 1,270,000 |
| Bo × 104 | 0.53 to 91.2 |
| Bond number | 0.025 to 7100 |
| WeGT | 158 to 11,383,366 |
| Data points | 2270 data points from 97 data sets from 49 sources |
| Channel Type | No. of Data Pts. | Mean Absolute Deviation (MAD), % (Upper Row) Average Deviation (AD), % (Lower Rpw) | ||||||||||
|---|---|---|---|---|---|---|---|---|---|---|---|---|
| Liu and Winterton | Gungor and Winterton | Haynes and Fletcher | Moles and Shaw | Devahdhanush and Mudawar | Badiuzzaman | Guo et al. | Pappel | Shah (1977) [1] | Shah (2017a) [2] | New Corre-lation | ||
| Rectangular channels | 750 | 29.0 −23.8 | 68.6 −63.9 | 19.1 −9.3 | 43.8 42.3 | 29.9 −0.2 | 62.6 6.5 | 47.8 24.5 | 62.6 60.5 | 17.9 −0.5 | 17.5 −0.8 | 17.0 1.0 |
| Annuli | 656 | 14.0 −4.1 | 53.8 −51.9 | 19.0 13.1 | 26.2 −3.5 | 35.7 7.3 | 41.5 −27.3 | 68.5 43.7 | 99.6 67.5 | 13.5 −0.2 | 12.3 −5.7 | 11.6 −4.8 |
| Round tubes | 864 | 14.2 −4.0 | 44.8 −40.2 | 17.3 13.4 | 38.3 30.8 | 50.2 32.8 | 37.5 4.6 | 112.2 105.8 | 155.3 136.3 | 13.1 5.3 | 11.5 −0.8 | 11.3 −0.6 |
| All types | 2270 | 19.0 −10.6 | 55.0 −50.9 | 18.4 5.8 | 36.6 24.7 | 36.5 14.5 | 47.0 −4.0 | 78.3 61.0 | 115.9 84.4 | 14.8 1.8 | 13.7 −2.2 | 13.3 −1.3 |
Disclaimer/Publisher’s Note: The statements, opinions and data contained in all publications are solely those of the individual author(s) and contributor(s) and not of MDPI and/or the editor(s). MDPI and/or the editor(s) disclaim responsibility for any injury to people or property resulting from any ideas, methods, instructions or products referred to in the content. |
© 2023 by the author. Licensee MDPI, Basel, Switzerland. This article is an open access article distributed under the terms and conditions of the Creative Commons Attribution (CC BY) license (https://creativecommons.org/licenses/by/4.0/).
Share and Cite
Shah, M.M. Further Study and Development of Correlations for Heat Transfer during Subcooled Boiling in Plain Channels. Fluids 2023, 8, 245. https://doi.org/10.3390/fluids8090245
Shah MM. Further Study and Development of Correlations for Heat Transfer during Subcooled Boiling in Plain Channels. Fluids. 2023; 8(9):245. https://doi.org/10.3390/fluids8090245
Chicago/Turabian StyleShah, Mirza M. 2023. "Further Study and Development of Correlations for Heat Transfer during Subcooled Boiling in Plain Channels" Fluids 8, no. 9: 245. https://doi.org/10.3390/fluids8090245
APA StyleShah, M. M. (2023). Further Study and Development of Correlations for Heat Transfer during Subcooled Boiling in Plain Channels. Fluids, 8(9), 245. https://doi.org/10.3390/fluids8090245