Abstract
This critical review delves into the impact of Computational Fluid Dynamics (CFD) modeling techniques, specifically 2D, 2.5D, and 3D simulations, on the performance and vortex dynamics of Darrieus turbines. The central aim is to dissect the disparities apparent in numerical outcomes derived from these simulation methodologies when assessing the power coefficient () within a defined velocity ratio () range. The examination delves into the prevalent turbulence models shaping values, and offers insightful visual aids to expound upon their influence. Furthermore, the review underscores the predominant rationale behind the adoption of 2D CFD modeling, attributed to its computationally efficient nature vis-à-vis the more intricate 2.5D or 3D approaches, particularly when gauging the turbine’s performance within the designated realm. Moreover, the study meticulously curates a compendium of findings from an expansive collection of over 250 published articles. These findings encapsulate the evolution of pivotal parameters, including , moment coefficient (), lift coefficient (), and drag coefficient (), as well as the intricate portrayal of velocity contours, pressure distributions, vorticity patterns, turbulent kinetic energy dynamics, streamlines, and Q-criterion analyses of vorticity. An additional focal point of the review revolves around the discernment of executing 2D parametric investigations to optimize Darrieus turbine efficacy. This practice persists despite the emergence of turbulent flow structures induced by geometric modifications. Notably, the limitations inherent to the 2D methodology are vividly exemplified through compelling CFD contour representations interspersed throughout the review. Vitally, the review underscores that gauging the accuracy and validation of CFD models based solely on the comparison of values against experimental data falls short. Instead, the validation of CFD models rests on time-averaged values, thereby underscoring the need to account for the intricate vortex patterns in the turbine’s wake—a facet that diverges significantly between 2D and 3D simulations. In a bid to showcase the extant disparities in CFD modeling of Darrieus turbine behavior and facilitate the selection of the most judicious CFD modeling approach, the review diligently presents and appraises outcomes from diverse research endeavors published across esteemed scientific journals.
1. Motivations for a Review
This critical review aims to investigate the extent to which Computational Fluid Dynamics (CFD) modeling can effectively forecast and reproduce the intricate flow structures generated by Darrieus Vertical Axis Wind Turbine (VAWT). The study encompasses an extensive bibliometric analysis based on the Scopus database, exploring yearly published papers related to CFD modeling approaches for Darrieus turbines and shedding light on the growing interest within the scientific community. The review scrutinizes the influence of various CFD modeling approaches, such as 2D, 2.5D, and 3D simulations, on the performance and vortex structures of Darrieus within a specified velocity ratio range. Divergent numerical outcomes from 2D, 2.5D, and 3D CFD simulations are observed when assessing the power coefficient relative to the range. The review comprehensively compiles results from over 250 published articles, elucidating the evolution of various coefficients, velocity contours, pressure fields, vorticity patterns, turbulent kinetic energy production and dissipation, streamlines, and Q-criterion of the vorticity, among other pertinent variables. Additionally, it accentuates the impact of commonly employed turbulence models on values, substantiating its claims through illustrative figures.
The review also highlights the rationale behind the prevalence of 2D CFD modeling, considering its computational tractability compared to 2.5D or 3D alternatives when estimating turbine performance within the designated range. However, it stresses the need to balance computational resources with an accurate portrayal of the underlying flow phenomena. The limitations of 2D parametric studies in capturing turbulent flow structures arising from geometric modifications are elucidated through comprehensive CFD contour plots. Moreover, based on the literature review, the research offers valuable recommendations for mesh generation in CFD simulations of Darrieus turbines, including guidelines for mesh types, grid point selection as a function of Reynolds number, and considerations for simulation accuracy. A practical guide is suggested for constructing meshes tailored to VAWTs based on available knowledge and best practices. Definitions and equations of crucial quantities like and are explicitly included in the text to enhance clarity. Overall, this study provides a concise and comparative assessment of CFD modeling approaches for vertical axis wind turbines, specifically Darrieus, contributing to a comprehensive understanding and aiding researchers and engineers in selecting the most appropriate approach for accurate predictions.
2. Introduction
A bibliometric analysis is presented, focusing on a critical review of CFD modeling approaches applied to Darrieus turbines. The Scopus database was utilized through our institution’s subscription, and relevant keywords and filters were applied to retrieve yearly-published papers from 2010 to 2023. The gathered metadata was used to construct Figure 1, illustrating the distribution of documents by year, type, author, and country/territory. Through this study, the aim is identification of discrepancies in power coefficient estimation and wake vortex development, while also shedding light on the current research trends and influential contributors in the field of CFD modeling for Darrieus turbines.
The CFD modeling of Darrieus turbines continues to attract considerable interest within the scientific community. In 2019, the scientific production on Darrieus turbines witnessed a five-fold increase compared to 2010 (Figure 1a). Over the past 13 years, it has been observed that the percentage of published reviews pertaining to Darrieus turbines remains notably lower (4.6%) when contrasted with the overall scientific contributions on the subject (95.4%) (Figure 1b).
Bianchini [1], with 30 scientific articles authored and co-authored in 2023, has earned recognition as a key reference in the domain of CFD modeling for Darrieus turbines (Figure 1b). Furthermore, Italian research laboratories have emerged as the leading contributors to numerical CFD investigations on Darrieus turbines. As of 2023, Italy holds the foremost position with 61 publications, followed closely by China with 59 publications, and the United States ranking third, with 43 publications (Figure 1c).
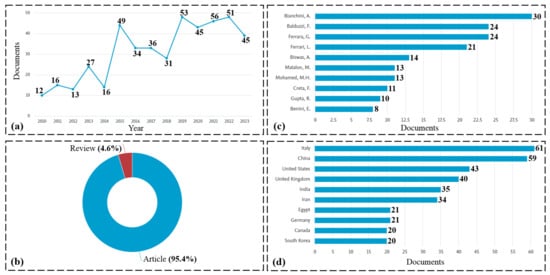
Figure 1.
Bibliometric study based on Scopus database [2]. (a) Documents by year. (b) Documents by type. (c) Documents by author [2]. (d) Documents by country/territory.
Figure 1.
Bibliometric study based on Scopus database [2]. (a) Documents by year. (b) Documents by type. (c) Documents by author [2]. (d) Documents by country/territory.

The Darrieus wind turbine belongs to the family of VAWTs, and is characterized by its distinctive airfoiled blades and vertical axis of rotation. Figure 2a illustrates a scaled-down prototype of a typical Darrieus wind turbine, which has been specifically developed for the purpose of testing and validation. Such a prototype enables comprehensive analysis of the turbine’s performance, aerodynamics, and structural behavior under diverse operational conditions. Through rigorous testing, a prototype provides invaluable insights into the feasibility and potential of the Darrieus design for efficient wind energy generation.
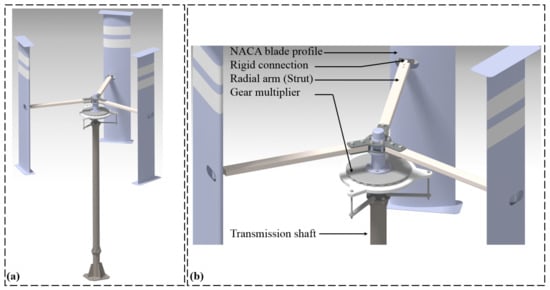
Figure 2.
(a) Prototype of Darrieus wind turbine. (b) Mechanical transmission system of Darrieus.
Figure 2b focuses on the mechanical transmission system of Darrieus. The Darrieus assembly consists of multiple curved blades interconnected to a central hub. The primary function of the mechanical transmission system is to convert the rotational motion of Darrieus into usable mechanical or electrical energy. This system encompasses various components, including gears, shafts, and bearings, meticulously designed to optimize energy transfer and ensure the overall efficiency of the turbine. The mechanical transmission system plays a critical role in preserving the structural integrity and stability of the Darrieus wind turbine.
The Darrieus wind turbine, as depicted in these figures, represents a remarkable advancement in VAWT technology, and underscores its potential for harnessing wind energy. Its unique design confers numerous advantages, including compactness, scalability, and suitability for urban and decentralized applications. The prototype and mechanical transmission system portrayed in the figures serve as pivotal elements in the ongoing development and optimization of the Darrieus wind turbine, thereby contributing significantly to the progression of sustainable energy solutions.
The figures presented in Figure 3 depict various types of Darrieus wind turbines, each showcasing unique characteristics and advancements in VAWT technology. These different designs collectively contribute to the ongoing progress in VAWT technology, and highlight the potential for efficient harnessing of wind energy.
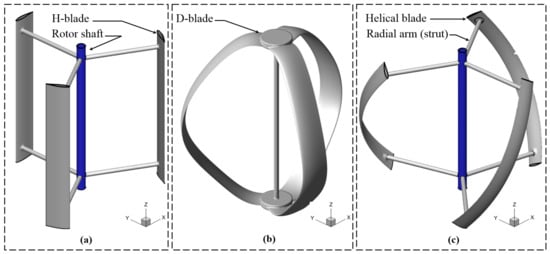
Figure 3.
(a) H-Darrieus wind turbine, (b) D-Darrieus wind turbine, and (c) Helical-Darrieus wind turbine.
Figure 3a illustrates the H-Darrieus wind turbine. In Figure 3b, the D-Darrieus wind turbine is showcased. This variant features a distinctive double-curved blade design that significantly enhances the aerodynamic performance and overall efficiency of the turbine. The advanced blade configuration enables increased power generation, making the D-Darrieus turbine an appealing choice for wind energy applications. Figure 3c displays the Helical-Darrieus wind turbine, which introduces helical-shaped blades to the traditional Darrieus design. This innovative modification offers several advantages, including improved torque generation and reduced noise and vibration levels compared to conventional straight-bladed Darrieus turbines. The helical configuration optimizes the turbine’s performance and further contributes to the development and optimization of VAWT systems.
The development and application of VAWTs are highlighted in a series of studies, as depicted in Figure 4. A 30 kW working prototype of a VAWT, presented in Figure 4a, has been developed and studied by Martin and Rosander [3], showcasing the potential of VAWTs as a viable solution for wind energy generation. In urban areas, wind energy applications have garnered significant attention, and the Eiffel Tower in France serves as a landmark example where VAWTs have been implemented (Figure 4b). Li et al. [4] conducted experimental studies on a VAWT integrated into the Eiffel Tower, demonstrating the feasibility and effectiveness of utilizing wind energy in urban settings.

Figure 4.
(a) S1 30 kW working prototype (reproduced with permission from Martin Rosander, Case Study: SeaTwirl—The Future of Offshore Floating Wind Turbines, published by ANSYS, Inc, 2018 [3]), (b) application of wind energy in urban areas (VAWT applied in the Eiffel Tower, France) (reproduced with permission from Ye Li, Energy Conversion and Management, published by ELSEVIER, 2021 [4]), and (c) schematic of 12 Darrieus helical VAWTs installed in a staggered arrangement on a rooftop. Each pair of adjacent turbines is counter-rotating (reproduced with permission from Rezaeiha, Energy Conversion and Management, published by ELSEVIER, 2020 [5]).
Furthermore, Figure 4c presents a schematic representation of twelve Darrieus helical VAWTs installed in a staggered arrangement on a rooftop. Each pair of adjacent turbines is designed to counter-rotate, aiming to maximize energy extraction and optimize system efficiency, as proposed by Rezaeiha et al. [5]. Collectively, these studies, depicted in the corresponding figures, provide valuable insights into the development and application of VAWTs in various contexts. The findings contribute to the advancement of wind energy technology, particularly in urban areas and landmark structures. Through these investigations, the potential and effectiveness of VAWTs as sustainable energy solutions are further emphasized, promoting the integration of wind energy into the global energy mix.
A schematic diagram in Figure 5a [6] illustrates the scour topography surrounding a Darrieus-type tidal current turbine. This diagram provides a visual representation of the erosion patterns and changes in the seabed caused by the operation of the turbine. Understanding the scour topography is crucial in the design and installation of tidal current turbines to ensure their long-term stability and performance. In Figure 5b [7], an overview of the forces acting on an airfoil is presented. This diagram describes the various aerodynamic forces, such as lift and drag, exerted on the airfoil as it interacts with the flow of air. Accurate understanding of these forces is essential for optimizing the performance and efficiency of turbine systems based on airfoils. The schematic representation of the conventions used for Darrieus in the current study is depicted in Figure 5c [8]. This diagram outlines the key parameters and reference frames employed in the analysis and evaluation of the Darrieus. The established conventions provide a standardized framework for comparing and assessing the performance of different Darrieus designs.
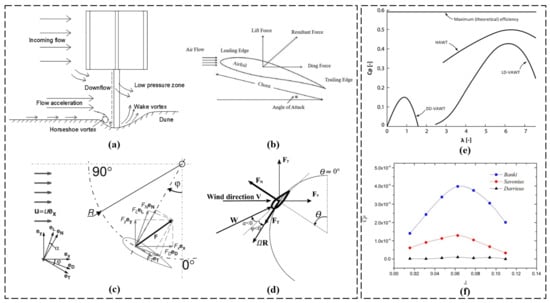
Figure 5.
(a) Schematic diagram of scour topography around Darrieus-type tidal current turbine (reproduced with permission from Wei Haur Lam, Energy Conversion and Management, published by ELSEVIER, 2018 [6]), (b) forces acting on an airfoil (reproduced with permission from Ozkan, Renewable Energy, published by ELSEVIER, 2020 [7]), (c) schematic representation of the conventions used for Darrieus in the current study (reproduced with permission from Daroczy, Energy, published by ELSEVIER, 2015 [8]), (d) rotating directions and forces as a function of azimuthal angle (reproduced with permission from Nguyen, Journal of Wind Engineering and Industrial Aerodynamics; published by ELSEVIER, 2020 [9]), (e) typical power coefficients for HAWT, DD-VAWT and LD-VAWT and the Betz limit = 0.59 (reproduced with permission from Trivellato, Renewable and Sustainable Energy Reviews, published by ELSEVIER, 2015 [10]), and (f) power coefficients for different Darrieus wind turbines (reproduced with permission from Mao, Renewable Energy, published by ELSEVIER, 2020 [11]).
Figure 5d [9] depicts the rotating directions and forces exerted on Darrieus as a function of the azimuthal angle. The diagram highlights the variations in forces experienced by the Darrieus as it rotates through different positions. Understanding these force dynamics is crucial for optimizing the efficiency and stability of turbine operation. In Figure 5e [10], the typical power coefficients () for horizontal axis wind turbines (HAWT), double-Darrieus vertical axis wind turbines (DD-VAWT), and large-diameter vertical axis wind turbines (LD-VAWT) are presented. The diagram includes the Betz limit ( = 0.59), representing the maximum theoretical efficiency of wind energy conversion. Comparing the power coefficients of different turbine types aids in assessing their performance and potential for energy generation.
Figure 5f [11] provides a comparative overview of the coefficients of power for different Darrieus designs. The diagram allows for a comprehensive analysis of the power coefficients of various Darrieus configurations, facilitating an understanding of their efficiency and performance characteristics.
Several CFD studies have been carried out on VAWTs since the 1990s, to assess and improve their aerodynamic performance within a specific tip speed ratio (TSR) range [12]. The CFD studies can be 2D [13], 2.5D [14], or 3D [15], and generally depend on the available computational resources [16]. The state of the art on VAWTs shows that the results from 2D modeling, more particularly the evolution of the power coefficient with respect to the TSR range, can be in a good agreement with the experimental studies of wind tunnels, admitting an acceptable margin of relative error compared to the experimental results [17,18]. Therefore, researchers are encouraged to perform 2D numerical studies, which is the case for several research laboratories, to suggest new optimized geometric designs [19], which basically have a 3D nature, nevertheless modeled by 2D studies, disregarding the structures of complex 3D flow that can develop during the continuous operating regime of the VAWTs [20]. In fact, one of the aims of the present review is to assess the predictive capability of multi-fidelity CFD tools from 2D to 3D approaches, and to highlight advantages and drawbacks of such approaches with respect to both global turbine performance prediction and scrutinity of local flow properties.
2.1. 2D CFD Studies
A novel generation of Darrieus turbines was developed by Wang et al. [21]. This innovative design features automatically deformable blades capable of achieving desired geometries during the operating cycle, thereby enhancing aerodynamic performance. The authors conducted a numerical simulation campaign utilizing the United CFD code. For instance, they showed that at low tip speed ratios below the optimum value, turbines with two and four deformable blades showed a maximum power coefficient increase of 7.51% and 8.07%, respectively, compared to conventional turbines with high solidity. Balduzzi et al. [22] performed 2D CFD simulations of Darrieus wind turbines to investigate critical issues and determine the essential parameters necessary for obtaining reliable unsteady results of a real Darrieus VAWT that had been previously tested in a wind tunnel. Furthermore, Hand et al. [23] conducted a comparative analysis of URANS and DES modeling methods to simulate the aerodynamics of an isolated NACA0018 airfoil undergoing Darrieus pitching motion, specifically dynamic stall at high Reynolds numbers. Their research demonstrated that the Spalart–Allmaras model offers a favorable balance between accuracy and computational requirements.
Arab et al. [24] performed 2D simulations to investigate the self-starting characteristics of the Darrieus turbine, taking into account its moment of inertia. It is worth noting that the most commonly used method by research teams to describe the aerodynamics of the Darrieus turbine involves applying various rotational speeds corresponding to tip speed ratios (TSRs). This approach, known as the forced method, does not consider the inherent inertia of the turbine. In a similar context, Celik et al. [25] focused on studying the start-up capability of the Darrieus, and found that increasing the turbine’s inertia did not significantly affect the final rotational speed. Bakhumbsh et al. [26] investigated the impact of a micro-cylinder as a passive controller on Darrieus wind turbine performance. Their findings revealed that the turbine’s performance decreases when the micro-cylinder has a larger diameter or is positioned on the suction side or downstream of the blade leading edge. Tigabu et al. [27] examined the effects of turbine inertia on the starting performance of a vertical-axis hydrokinetic turbine, indicating that increasing the inertia reduces the peak but slows down the acceleration of the Darrieus turbine. Finally, Nguyen et al. [28] evaluated the effect of pitch angle on the power and hydrodynamics of a Darrieus turbine, reporting a power enhancement of up to 2.3% for positive pitch angles compared to a reference zero pitch.
2.2. 2.5D CFD Studies
Li et al. [14] conducted a study to evaluate the accuracy and feasibility of three different CFD approaches for analyzing the aerodynamics of straight-bladed VAWTs under high angle of attack flow conditions. The investigated approaches included 2D unsteady Reynolds-averaged Navier–Stokes (URANS), 2.5D URANS, and 2.5D large eddy simulation (LES). The results showed that the 2.5D LES approach provided the closest agreement with experimental data, as it captured the realistic three-dimensional vortex diffusion after flow separation. This led to accurate predictions of aerodynamic coefficients during static or dynamic stall situations.
Rezaeiha et al. [29] performed a 2D CFD analysis of dynamic stall in Darrieus turbines using the Scale-Adaptive Simulation (SAS) model. The SAS approach was compared against the URANS and hybrid RANS/LES methods. Notably, SAS has emerged as an improved URANS formulation that bridges the gap between the less accurate URANS and the computationally expensive hybrid RANS/LES approaches for highly separated unsteady flows. Furthermore, He et al. [30] investigated the suitability and accuracy of various CFD modeling techniques for predicting the aerodynamics of Darrieus turbines. The studied approaches included 2D URANS, 2.5D URANS, 2.5D LES, 3D URANS, and 3D LES. A comparison with wind tunnel results revealed that 2.5D LES offered an efficient approach for investigating the aerodynamic behaviors of Darrieus turbines. This choice considered the trade-off between accuracy and computational cost when compared to 2.5D LES, 3D LES, and 3D URANS methods.
2.3. 3D CFD Studies
Rossetti et al. [31] conducted a comprehensive study to assess the start-up capability of Darrieus turbines by comparing various numerical approaches. These approaches included the Blade Element Momentum (BEM) method, as well as two- and three-dimensional computational fluid dynamics (CFD) simulations. In a similar vein, Castelli et al. [32] focused on investigating the deformation patterns of Darrieus turbine blades. They achieved this by employing a combination of CFD simulations to evaluate the aerodynamic and mechanical inertial contributions. Notably, the successful execution of these investigations was made possible through the development and validation of a fluid–structure interaction (FSI) coupling code by the research team.
Furthermore, Le et al. [33] highlighted the limitations of using the sliding mesh technique in 2D and 3D CFD simulations of VAWTs. They specifically pointed out that such simulations fail to account for three crucial parameters: self-starting capability, torque fluctuations, and rotation per minute (RPM). These parameters, which are typically observed and measured during laboratory experiments, cannot be replicated solely through CFD simulations employing prescribed tip speed ratios (TSRs).
In a different study, Joo et al. [34] conducted three-dimensional unsteady Reynolds-averaged Navier–Stokes (URANS) simulations to examine the aerodynamic characteristics of a two-bladed Darrieus VAWT. Their main focus was to investigate the effects of varying solidities and rotational speeds on the turbine’s power coefficient. The accuracy of their findings was confirmed by comparing the numerical results with experimental data obtained from wind tunnel tests.
Moving on to more advanced simulations, Patil et al. [20] performed three-dimensional large-eddy simulations (LES) of Darrieus. They utilized the WALE subgrid model and a dedicated block-structured mesh to analyze the flow field around the turbine. The accuracy of their LES approach was verified by comparing the simulation results with experimental data, specifically normal and tangential forces, provided by TU Delft Aerospace Engineering University.
Addressing the practical implications, Dessoky et al. [35] emphasized the suitability of Darrieus for both low wind velocity conditions and urban areas. However, they acknowledged the need for comprehensive investigations into the complex aerodynamic and aeroacoustic characteristics of these turbines, requiring a combination of experimental and numerical studies. In line with this, Dessoky et al. [36] performed three-dimensional CFD simulations using a high-order Delayed Detached-Eddy Simulation (DDES) model to gain insights into the turbulent aerodynamics and noise mechanisms of Darrieus turbines.
Furthermore, Clary et al. [37] developed an optimally controlled RANS Actuator Force Model (AFM) for efficient computations of arrays of Darrieus tidal turbines. Their approach incorporated detailed three-dimensional force distributions derived from blade-resolved URANS simulations. Expanding on the practical applications, Su et al. [38] highlighted the significance of VAWTs for offshore wind energy conversion as a complementary power source. They conducted three-dimensional CFD simulations to investigate a novel V-shaped blade profile for Darrieus turbines. The objective was to enhance aerodynamic performance at moderate TSRs, mitigating the undesirable blade tip effects commonly observed in conventional straight blades.
In a related context, Tian et al. [11] explored the potential of harnessing turbulent wind energy from the strong wakes generated by high-speed moving vehicles. To broaden the scope of research in this area, they conducted three-dimensional CFD simulations to evaluate the suitability of VAWTs for highway wind energy recovery. Moreover, Ahmad et al. [39] focused on the design optimization of a double-Darrieus hybrid vertical-axis wind turbine. They proposed a methodology that enables the achievement of an optimum design configuration of the hybrid VAWT, along with a high-fidelity analysis in the early design phase. Notably, their findings indicated a self-starting speed as low as 2.81 m/s and a rated power of 1.522 kW at a wind speed of 7.5 m/s for their proposed hybrid wind turbine.
Table 1 presents a summary of computational resources used for Computational Fluid Dynamics (CFD) simulations in modeling the aerodynamic flow around Darrieus wind turbines. Various numerical approaches were employed by different researchers, such as 2D Unsteady Reynolds-Averaged Navier–Stokes (URANS), Large Eddy Simulation (LES), and Fluid–Structure Interaction (FSI). The table provides insights into the processing parameters used in each study.
For instance, Hand et al. [23] utilized a parallel computing setup with 12 Intel Xeon E5-2695 v2 CPUs, running at 2.40 GHz, and 64 GB of RAM for 2D URANS simulations. On the other hand, Hashem et al. [40] employed eight CPUs with a clock speed of 3.40 GHz for their URANS simulations.
The computational effort varied among studies, with cycle times ranging from 25 min [40] to 65.34 h [23]. Patil et al. [20] used 1024 CPUs connected via InfiniBand, with each node featuring two Xeon E5-2630 v3 CPUs and 256 GB of RAM for their 3D LES simulations, taking 48 h per cycle.

Table 1.
CFD calculations demand substantial computational resources to simulate the aerodynamic flow field around Darrieus wind turbines.
Table 1.
CFD calculations demand substantial computational resources to simulate the aerodynamic flow field around Darrieus wind turbines.
| Authors | Numerical Modeling | Numerical Approach | Processing | CPU | Nbr of CPUs | Clock Speed (GHz) | RAM (GB) | Wall Clock Time | Research Institute |
|---|---|---|---|---|---|---|---|---|---|
| Hand et al. [23] | 12 Intel Xeon E5-2695 v2 Ivy Bridge | 12 | 2.40 | 64 | 65.34 h/cycle | Irish Centre for High-End Computing | |||
| Hashem et al. [40] | (-) | 8 | 3.40 | (-) | 25 min/cycle | (-) | |||
| Trivellato et al. [10] | 2D | URANS | (-) | (-) | 2.33 | (-) | (-) | (-) | |
| Asr et al. [41] | Core i7 processor | 8 | 1.73 | (-) | (-) | (-) | |||
| Mohammed et al. [42] | (-) | 8 | 2.80 | (-) | 70 min/cycle | (-) | |||
| Bianchini et al. [1] | Intel gold | 16 | (-) | (-) | 38 h/cycle | (-) | |||
| Bedon et al. [43] | URANS | Parallel calculations | Quad-core Intel i7-860 processor | (-) | (-) | 64 | (-) | (-) | |
| Patil et al. [20] | 3D | LES | 172 nodes connected with an InfiniBand. 2 Xeon E5-2630 v3 per node | 1024 | (-) | 256 | 48 h/cycle | (-) | |
| Castelli et al. [32] | FSI | (-) | 8 | 2.33 | (-) | 15 days for the simulations | (-) | ||
| Rezaeiha et al. [29] | 2D; 2.5D | URANS, SAS, SBES | Intel(R) Xeon(R) E5-2690 v3 | 72 | (-) | 320 | 741.9 h/cycle (2.5D SBES model) | (-) |
The table also highlights that some studies did not provide detailed CPU specifications, making it challenging to assess their computational resources accurately. Nevertheless, it is evident that CFD simulations for Darrieus wind turbines demand substantial computing power, and researchers must carefully consider their numerical approach and processing parameters to achieve reliable results.
Table 2 provides an overview of scientific investigations conducted between 2010 and 2020 to enhance the aerodynamic performance of Darrieus wind turbines using Computational Fluid Dynamics (CFD) modeling. These studies have employed both two-dimensional (2D) and three-dimensional (3D) simulations to analyze the complex flow behavior around the turbine blades. Different NACA four-digit series airfoils were explored in various investigations to assess their impact on aerodynamic efficiency, while the turbine’s diameter was also varied to study its influence on overall performance.
To accurately model turbulence effects, researchers utilized various turbulence models, such as k- SST, k-, Realizable k-, LES (SGS), Spallart Allmaras, TSST, and DDES, depending on the specific focus of each study. Meshing played a crucial role in achieving accurate and computationally efficient results, and the number of meshing elements varied across studies. Here are some examples of the number of meshing elements used in certain studies:
- Rossetti et al. [31] used 8,870,576 meshing elements for their 3D simulations with an SAS model and a y-plus value below 1;
- Malipeddi et al. [44] performed 2D simulations with a k- SST model and a total of 443,155 nodes to study the effect of duct integration;
- Marco et al. [45] used 111,000 meshing elements for their 2D simulations with a Realizable k- model to study low-head hydropower production capability;
- Joo et al. [34] used a meshing with 1,200,000 elements for their 3D simulations while studying the effect of solidities and rotation speeds;
- Dessoky et al. [36] conducted 3D simulations with y-plus values below 1 and a meshing consisting of 41,312,000 elements to study the aerodynamics and aeroacoustics of Darrieus wind turbines equipped with “wind-lens” technology.
The dimensionless wall distance () was carefully controlled to ensure appropriate near-wall flow resolution for reliable simulations.
The scientific investigations explored diverse objectives, including the analysis of self-starting capability, the effect of airfoil selection on efficiency, low-head hydropower production capability, the influence of blade geometries (helical, straight, and J-shaped blades), solidities, and rotation speeds. Some studies also focused on examining the interaction of multiple turbines in a wind farm layout, dynamic stall phenomena, noise assessment, and the impact of various technologies like cavity airfoils, winglets, and Gurney flaps on turbine performance.
These investigations collectively contribute to a comprehensive understanding of Darrieus wind turbine aerodynamics and their implications for designing and operating more efficient and sustainable vertical axis wind turbines, ultimately leading to improved wind energy generation. The knowledge gained from these studies is essential for advancing the field and harnessing wind resources more effectively.
Table 2.
Advancements in aerodynamic performance of Darrieus wind turbines: a decade of scientific research (2010–2020).
Table 2.
Advancements in aerodynamic performance of Darrieus wind turbines: a decade of scientific research (2010–2020).
| Authors | Year | CFD Modeling (2D, 3D) | NACA 4-Digit Series | Diameter of Darrieus (m) | Turbulence Model | y-Plus () | Meshing Elements | Scientific Investigations to Enhance the Aerodynamic Performance of the Darrieus Wind Turbine |
|---|---|---|---|---|---|---|---|---|
| Rossetti et al. [31] | 2012 | 3D | 0018 | 0.75 | SAS | < 1 | 8,870,576 | Self-start capability |
| Malipeddi et al. [44] | 2012 | 2D | 63-018 | 1.60 | k- SST | < 5 | 443,155 nodes | Effect of the duct integration |
| Mohamed et al. [46] | 2012 | 2D | 20 profiles | 1.03 | k- | 30 < < 50 | 95,000 | Effect of 20 airfoils on the overall efficiency |
| Marco et al. [45] | 2013 | 2D | 0018 | 0.39 | Realizable k- | first cell height 0.23 mm | 111,000 | Low-head hydropower production capability |
| Mohamed et al. [47] | 2014 | 2D | 25 airfoils | 2 | k- SST | = 3.70 | 202,426 nodes | Low speed energy conversion capability |
| Le et al. [33] | 2014 | 2D | 0020 | 3 | k- SST | < 5 | 12,945 | Effect of helical and straight blades |
| Joo et al. [34] | 2015 | 3D | 0022, 0012 | 2 | Realizable k- | - | 1,200,000 | Effect of solidities and rotating speeds |
| Balduzzi et al. [48] | 2015 | 2D | 0018 | 1.70 | k- SST | - | 817,422 | CFD modeling methodology |
| Wang et al. [49] | 2015 | 2D | 0021, 0018 | 2 | Spallart Allmaras | - | 115,000 | Influence of the blade vortex interactions |
| Chen et al. [50] | 2015 | 2D | 0015 | 1.25 | k- SST | = 1 | 400,000 | Combined effect of the opening ratio and its location |
| Sengupta et al. [51] | 2015 | 2D | 0018, S815, EN0005 | Aspect ratio | RNG k- | - | - | Effect of high solidity symmetrical and unsymmetrical blades |
| Arab et al. [24] | 2016 | 2D | 4415 | 0.60 | k- SST | = 0.53 | - | Aerodynamic performance and self-starting characteristics (effect of inertia) |
| Balduzzi et al. [16] | 2016 | 3D | 0021 | 1.03 | k- SST | < 1 | 64,000,000 | 3D reliable analysis for the calibration of lower fidelity CFD models |
| Asr et al. [41] | 2016 | 2D | 2418, 0018, 4418, 2418 | 0.75 | k- SST | - | 74,000 | Self-start capability (combined effect of the pitch angle and NACA profiles) |
| Bedon et al. [43] | 2016 | 2D | 0018 | 35 | k- SST | < 1 | 669,000 | Performance-optimized NACA airfoil for a 500 kW Darrieus wind turbine |
| Mabrouk et al. [52] | 2016 | 2D | 0021 | 1.03 | k- | - | 119,128 | Dynamic mechanical vibrations |
| Zamani et al. [53] | 2016 | 2D | 0015 | 3.70 | k- SST | < 1 | 1,397,827 | Starting torque enhancement of a 3 kW Darrieus |
| Zamani et al. [54] | 2016 | 3D | 0015 | 2.50 | k- SST | = 1 | 12,519,254 | 3D modeling of a J-shaped Darrieus |
| Qamar et al. [55] | 2017 | 2D | 0012, 4312 | 2.50 | k- standard | - | 400,000 | Effect of six solidity values |
| Bianchini et al. [56] | 2017 | 2D | 0020 | 1 | k- SST | < 1 | 593,880 | Reliability of 2D CFD simulations |
| Shaheen et al. [57] | 2017 | 2D | 0021 | 1.03 | k- SST | < 1 | 173,768 | Design of a wind turbine farm constituted from 3 Darrieus |
| Sobhani et al. [58] | 2017 | 2D | 0021 | 1.03 | k- SST | - | 505,762 | Effect of dimpled NACA0021 blades |
| Shaaban et al. [59] | 2017 | 2D | 0021 | 1.03 | k- EWT | = 3.5 | 320,032 | Six turbines cluster analysis |
| Dessoky et al. [35] | 2018 | 3D | 0021, 0018 | Aspect ratio | k- SST, DDES | <1 | 16,905,216 | Aerodynamic and aeroacoustic CFD modeling of Darrieus equipped with wind-lens technology |
| Ali et al. [60] | 2018 | 3D | 0015 | 2 | LES (SGS) | < 1 | 1,600,000 | Effect of dynamic tangential velocity |
| Patel et al. [61] | 2019 | 2D | 0021, 0011 | 1.03 | k- SST | = 1 | 880,000 | Effect of three Gurney Flaps technologies located at the trailing edge of Darrieus |
| Barnes et al. [62] | 2019 | 2D | 0015 | 3.40 | Transition k- SST | < 1 | 120,000 | Mutual effect of 15 Darrieus turbines constituting a wind farm |
| Dessoky et al. [36] | 2019 | 3D | 0021, 0018 | 0.20 | DDES | < 1 | 41,312,000 | Turbulence and noise assessment |
| Xu et al. [63] | 2020 | 3D | 0015 | 1.70 | DDES | < 1 | 6,500,000 | Effect of winglet on the aerodynamic performance |
| Jain et al. [64] | 2020 | 2D | 0009, 0012, 0015, 0018, 0021 | 1.20 | TSST | < 1 | 354,169 | Effect of the ratio of blade thickness to the chord length on the dynamic stall phenomenon |
3. Methodology
A meticulous state-of-the-art study on Darrieus turbines was conducted to achieve the objective of our research, which is a critical review of CFD modeling approaches for Darrieus turbines. Over 250 scientific publications extracted from the ScienceDirect platform were evaluated to compile this critical review. To begin with, an introduction was drafted to underscore the significance of wind energy in comparison to other renewable green energy sources. It also aimed to highlight the substantial interest generated within the scientific community towards CFD modeling studies. In the same section, the three primary categories of CFD modeling applied to Darrieus turbines were presented: 2D, 2.5D, and 3D modeling. Parametric studies conducted using CFD within these categories were discussed, specifically targeting an improvement in the power coefficient (Cp).
Following the introduction, the subsequent section involved the presentation and discussion of various methodologies available in the existing literature for modeling turbulent flow around Darrieus turbines. This allowed for a comprehensive overview of the available approaches. To support the critical review, a set of meticulously prepared figures, totaling 16, was introduced. These figures were utilized to facilitate discussions on the observed discrepancies in power coefficient estimation and wake vortex development for Darrieus turbines. As a result, the figures formed the cornerstone of this critical review.
Moreover, the necessary schemes employed for conducting and ensuring reproducibility in 2D, 2.5D, and 3D CFD modeling were extensively addressed. The discussion encompassed the importance of methodological consistency and accuracy in computational simulations. In addition, considerable attention was dedicated to the exploration of diverse meshing techniques employed to discretize the flow domain surrounding Darrieus turbines in the different modeling dimensions (2D, 2.5D, and 3D). These techniques were thoroughly examined to assess their impact on the accuracy of the results. The investigation further delved into the comprehensive exploration of the various boundary layer models implemented by research teams to accurately capture the near-wall viscosity effect on the Darrieus blade surfaces. This discussion shed light on the importance of capturing boundary layer phenomena in the modeling process. Moving forward, the shape, dimensions and boundary conditions applied to the fluid domain surrounding Darrieus turbines in each modeling dimension (2D, 2.5D, and 3D) were carefully examined. This analysis provided insights into the parameterization choices and their implications for the accuracy of the results.
Furthermore, the critical review encompassed the presentation of several parametric studies proposed by various authors to enhance the performance of Darrieus turbines. These studies contributed to a comprehensive understanding of the research objective and underscored the significance of conducting a critical review to assess discrepancies in power coefficient estimation and wake vortex development for Darrieus turbines. In order to highlight the impact of turbulence models on key aerodynamic performance indicators of Darrieus turbines, multiple graphs were presented. These graphs featured numerical results for Cp, Cm, Cl, and Cd, which were compared with reference experimental studies, including the influential work by Castelli et al. [65]. The aggregation and comparison of these results accentuated the uniqueness and novelty of this critical review.
To evaluate the effects of geometric modifications on conventional Darrieus configurations for improved aerodynamic performance, various CFD contours were showcased. These contours formed the foundation for assessing the disparities between different types of CFD modeling, particularly in the 2D, 2.5D, and 3D dimensions. The presentation of these findings further emphasized the significance of this critical review in assessing discrepancies in power coefficient estimation and wake vortex development for Darrieus turbines. Lastly, the critical review included examples of the experimental approach employed to characterize Darrieus turbines using Particle Image Velocimetry (PIV). This demonstration highlighted the importance of validating commercially available computational codes that are widely utilized by research teams and laboratories. Such validation is crucial when proposing geometric modifications to enhance the aerodynamic efficiency of Darrieus turbines.
4. Discussion
4.1. General Form of the Solved Governing Equations
When numerically modeling a Darrieus wind turbine using the governing equations presented in Equations (1)–(4), several key assumptions are incorporated to streamline the simulation process while providing a foundational framework for accurate results. The simulation considers the unsteady-state operation, capturing transient effects due to wind speed variations and turbine rotation. The fluid is treated as incompressible, with negligible density fluctuations from pressure changes. A Newtonian fluid assumption is adopted, implying constant dynamic viscosity irrespective of shear rate. Thermal effects, chemical reactions, and external interactions are omitted. Turbulence effects are accommodated through appropriate turbulence models, assuming predominantly turbulent flow. Inlet conditions are uniform, external forces are neglected, and idealized symmetrical geometry is employed. The blades are rigid, disregarding fluid-induced deformations. Interactions between blades, temperature variations, and phase change phenomena are excluded. FSI simulations assume linear elastic behavior of solid structures and employ a monolithic coupling approach for strong fluid–structure interaction. Collectively, these assumptions facilitate a comprehensive CFD analysis of both the aerodynamic and mechanical aspects of the Darrieus wind turbine.
The general form of the solved governing equations commonly used in published papers related to Darrieus VAWTs encompasses the fundamental principles of fluid dynamics and conservation laws. These equations provide a basis for understanding and simulating the aerodynamic behavior of VAWTs. In the context of CFD studies, the equations can be expressed as follows:
- Continuity Equation: The continuity equation represents the conservation of mass and is expressed as Equation (1):where is the fluid density, is the velocity vector, and t represents time;
- Navier–Stokes Equations: These equations describe the conservation of momentum and are divided into three components along the x (Equation (2)), y (Equation (3)), and z (Equation (4)) axes:
- a.
- X-Component:
- b.
- Y-Component:
- c.
- Z-Component:
where u, v, and w are the velocity components in the respective directions, P is pressure, is dynamic viscosity, and , , and represent acceleration due to gravity along the x, y, and z axes; - Turbulence Modeling Equations: The choice of turbulence modeling approach depends on factors such as computational resources, desired level of accuracy, and specific flow characteristics. These turbulence models enhance the predictive capabilities of simulations, enabling a more comprehensive understanding of the aerodynamic behavior and performance of Darrieus VAWTs;
- (a)
- RANS with Turbulence Models (k-, k-, etc.): Different turbulence models, such as k-, and k-, are used within the RANS framework to capture turbulence effects. These models introduce transport equations for turbulence kinetic energy and its dissipation rate;
- (b)
- Unsteady Reynolds-Averaged Navier–Stokes (URANS): URANS simulations provide a time-averaged representation of turbulent flows. The URANS equations introduce additional turbulence terms to the governing equations to account for Reynolds stresses. This approach is computationally efficient for industrial applications;
- (c)
- Hybrid URANS-LES (Large Eddy Simulation): The hybrid approach combines URANS and LES techniques. URANS is used in regions where turbulence is well-developed and computationally expensive LES is employed in areas with complex flow structures. This balances accuracy and computational cost;
- (d)
- Detached Eddy Simulation (DES): DES is a compromise between URANS and LES. It employs URANS in the near-wall region and LES in the outer flow. This provides accurate predictions for separated flows and regions with turbulent eddies;
- (e)
- Large Eddy Simulation (LES): LES resolves large-scale turbulent structures and models only the small-scale turbulence. It is computationally demanding, but provides highly detailed information about the turbulent flow behavior.
These governing equations are typically solved numerically using techniques like finite volume, finite element, or finite difference methods, depending on the numerical solver employed. The solutions provide insights into the flow patterns, pressure distributions, and forces acting on the Darrieus VAWT blades, aiding in the analysis and optimization of its aerodynamic performance.
In the pursuit of modeling acoustic phenomena arising from the operation of a Darrieus wind turbine, several specific considerations come into play. The governing equations traditionally employed, such as the Navier–Stokes equations for fluid dynamics, can be extended to account for acoustic interactions. The acoustic wave equations, coupled with the equations of mass conservation, momentum, and energy, allow for the description of sound wave propagation resulting from the motion of the blades and interactions with the surrounding atmospheric flow. Models encompassing absorption, diffusion, and reflection of acoustic waves may also be incorporated to accommodate specific characteristics of the surrounding terrain and acoustic environment.
Conversely, when the focus shifts towards mechanical aspects through Fluid–Structure Interaction (FSI) modeling, the governing equations assume an even more intricate form. In addition to the Navier–Stokes equations and structural dynamics equations, FSI coupling equations are introduced to address bidirectional interactions between fluid motions and structural deformations. The equations of mass conservation, momentum, and energy are coupled with the solid deformation equations, thereby enabling the simulation of interactions between the Darrieus wind turbine blades and the surrounding fluid. Advanced numerical techniques, such as time and space partitioning methods, are often required to effectively and accurately solve these coupled equations, providing essential insights into the mechanical and fluid responses of the wind turbine under varying operational conditions.
Performance Indicators
First of all, the tip speed ratio (TSR) is given by Equation (5). It presents the ratio between the tangential velocity and the upstream far-field flow velocity which is designated by .
As the turbine rotates with the angular velocity , the attack velocity at a blade during a revolution is given by Equation (7) [66]. The relative flow velocity can be obtained by Equation (7) [40].
where represents the chordal velocity component and represents the normal velocity component.
- is the normal component of the relative velocity, which is perpendicular to the cord line;
- is the tangential component of the relative velocity, which is parallel to the cord line.
The relation between the angle of attack , the azimuth angle , and the tip speed ratio can be defined from the velocity triangle analysis. It is expressed as shown in Equation (8) [40].
The Reynolds number at which the blade operates can be calculated using the following Equation [61]:
The value of torque coefficient () can be obtained from the instantaneous values of torque coefficients () by integration over an entire revolution (Equation (10)), after reaching a periodic steady state [67]. Generally, 2D and 3D CFD simulations of Darrieus are carried out until the numerical solution reaches a periodic steady state, wherein no cycle-to-cycle variation in the solution is observed. () is the azimuthal position or phase of the turbine.
The performance coefficient () is calculated from the torque coefficient () using Equation (12). The torque coefficient is expressed using Equation (11) [24].
4.2. CFD Modeling Approaches
Numerical modeling through CFD is a powerful approach for studying complex aerodynamic flows around Darrieus wind turbines. Each of the three modeling approaches—2D, 2.5D, and 3D—offers specific advantages and disadvantages to consider based on the study objectives.
The 2D modeling stands as a versatile approach for investigating the aerodynamics of Darrieus wind turbines. Its distinct advantages include computational efficiency and low resource costs. The simplicity of a two-dimensional representation accelerates simulations and allows for the exploration of various configurations and conditions within constrained time frames [40]. Furthermore, 2D modeling, by reducing geometry to a single dimension, demands fewer computational resources, making it well-suited for preliminary studies and swift analyses [23]. Nevertheless, its notable disadvantages stem from geometric simplification and the lack of three-dimensional consideration. This omission of the third dimension can lead to reduced accuracy, particularly in regions where three-dimensional effects are prominent [1]. Additionally, the deficiency in capturing complex features and three-dimensional vortices limits the model’s ability to fully comprehend intricate flow dynamics around Darrieus turbines.
The 2.5D CFD modeling approach emerges as a compelling compromise between computational efficiency and enhanced spatial information. Its advantages encompass a partial consideration of three-dimensional effects while maintaining a balance of simplification. This intermediate approach yields more accurate results compared to pure 2D modeling, especially concerning vortex and swirl phenomena [29]. While more resource-intensive than 2D modeling, 2.5D modeling remains less demanding than full-fledged 3D simulations [14]. However, this approach’s drawbacks include increased complexity and geometric limitations. The incorporation of partial three-dimensional effects elevates resource requirements and computational time, albeit to a lesser extent than full 3D modeling [30]. Geometric constraints may still result in an underestimation of intricate 3D interactions within specific flow regions.
For a comprehensive understanding of Darrieus wind turbine aerodynamics, 3D CFD modeling provides a level of realism that surpasses the aforementioned approaches. Its merits encompass a maximum representation of three-dimensional flow geometry and intricate physics. This capacity to capture complex phenomena like flow separation, three-dimensional vortices, and blade interactions offers an unparalleled level of fidelity [20]. Enhanced precision derives from the thorough consideration of three-dimensional effects, rendering the 3D approach the most accurate among the three methods, particularly in regions with substantial three-dimensional flow [63]. However, these benefits come at the cost of elevated resource requirements. Three-dimensional modeling necessitates significantly higher computational resources, encompassing extended calculation times and increased computational power [36]. Moreover, the computational complexity associated with the 3D approach demands expertise in mesh preparation, boundary condition handling, and result interpretation [43].
In the realm of Darrieus wind turbine research, the selection of a CFD modeling approach hinges on a balance between accuracy, computational resources, and research goals. The trade-offs presented by each approach must be meticulously considered to align with the objectives of the investigation.
A close-up view of the mesh surrounding the airfoil, enabling a detailed analysis of the fluid flow characteristics and aerodynamic behavior within a 2D modeling approach, is presented in Figure 6a [68]. The performance of the airfoil and its interactions with the flow field are illuminated by the detailed mesh representation. It should be noted, however, that the 2D modeling approach is limited in capturing three-dimensional effects and flow phenomena, which can potentially impact the accuracy of predictions and their applicability to real-world scenarios.
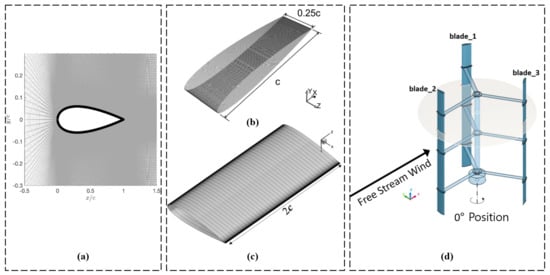
Figure 6.
(a) 2D modeling: close-up view of the mesh around the airfoil (reproduced with permission from Atlaschian, Renewable Energy, published by ELSEVIER, 2021 [68]), (b) 2.5D modeling: computational grid of the turbine for the SAS simulation with a total of 19,753,402 quadrilateral cells (reproduced with permission from Reazeiha, Energy Conversion and Management, published by ELSEVIER, 2019 [29]), (c) 2.5D modeling: mesh distribution for single static NACA0018 airfoil (reproduced with permission from Zhu, Renewable Energy, published by ELSEVIER, 2013 [14]), (d) 3D modeling: definition of blade numbers and 0 degree azimuthal position (reproduced with permission from Jang, Energy Conversion and Management, published by ELSEVIER, 2018 [60]).
In Figure 6b, a 2.5D modeling approach is employed to demonstrate the computational grid of the turbine utilized for the SAS simulation [29]. The high-resolution grid design, consisting of a large number of cells, facilitates precise modeling of the turbine’s geometry and flow domain, leading to accurate predictions of its performance and aerodynamic characteristics. Nonetheless, the 2.5D modeling approach assumes axisymmetric flow and disregards spanwise variations, which may restrict the representation of flow phenomena occurring in the spanwise direction.
The mesh distribution for a single static NACA0018 airfoil within a 2.5D modeling approach is illustrated in Figure 6c [14]. The optimized mesh distribution ensures an accurate representation of flow features and captures the intricate aerodynamic behavior of the airfoil. However, it is important to critically evaluate the sensitivity of the results to the mesh resolution and assess the convergence of the simulations to ensure reliable predictions of performance parameters. Furthermore, Figure 6d depicts the definition of blade numbers and the 0-degree azimuthal position within a 3D modeling approach [60]. These parameters are crucial in accurately representing the geometry and orientation of the turbine blades in three-dimensional space. However, it is important to consider the potential impact of simplifications made in the modeling approach and the assumptions associated with blade geometry and azimuthal position on the accuracy of the results.
4.3. Mesh Generation around Darrieus for CFD Modeling
Creating a mesh for a Darrieus wind turbine involves a systematic approach to ensure precise and dependable simulations. The methodology outlined below facilitates the generation of meshes for 2D, 2.5D, and 3D modeling. The initial step encompasses importing the Darrieus wind turbine geometry into a compatible CAD software, ensuring clean and accurate definitions for distinct components such as blades and hub. Subsequently, the selection of an appropriate meshing strategy hinges on the modeling approach and desired accuracy level. In the context of 2D simulations, the creation of a structured or unstructured mesh along blade profiles and around Darrieus takes center stage. Emphasis is placed on establishing boundary layers near surfaces to accurately capture near-wall flow behavior. Meanwhile, for 2.5D simulations, an extension of the 2D mesh into the third dimension, preserving a simplified geometry representation, is pursued. This can involve extruding the 2D mesh or applying a prism layer to effectively capture boundary layer effects. In the realm of 3D simulations, a comprehensive three-dimensional mesh encompassing the entire wind turbine geometry, encompassing blades, hub, and the surrounding flow domain, is meticulously generated. Special attention is devoted to refining the mesh around blade surfaces, near-wall regions, and potential flow separation zones. To ensure mesh quality, diagnostic tools within the chosen CFD software are employed to identify suboptimal elements. Mesh parameter adjustments are made to optimize quality. Boundary conditions are rigorously defined for inlet, outlet, and walls, aligning with the modeling approach. As part of refinement, mesh studies evaluate result sensitivity to size, with incremental refinements applied to key areas to optimize accuracy. This methodology yields well-structured meshes, forming the basis for insightful aerodynamic analyses of Darrieus wind turbines using CFD software.
The decision on the modeling nature of CFD to characterize Darrieus wind turbine aerodynamics involves choosing between 2D, 2.5D, or 3D modeling, each offering distinct advantages and complexities. Once the nature is determined, selecting an appropriate modeling technique becomes crucial. Techniques like the Multiple Reference Frame (MRF) method, or dynamic methods such as Sliding Mesh or Six Degrees of Freedom (6DOF), provide viable options [69,70]. Each technique requires an appropriate mesh and configuration for accurate results. Special attention must be paid to the small dimensions of the blade trailing edge, affecting mesh cells significantly. Ensuring mesh quality is vital to preserve flow behavior accuracy. Mesh refinement strategies include condensing cells near walls, within boundary layers, and in wake zones. Starting simulations with moderately coarse meshes facilitates efficient wake region identification for subsequent refinement. Partitioning the fluid domain aids structured mesh generation in the wake zone, enhancing computational efficiency. For 2D modeling, triangular cells near the wall are recommended due to blade curvature. A mixed mesh with triangular and quadrilateral elements within the boundary layer separation region is advised. Transitioning to a quadrilateral mesh in the wake zone optimizes resource utilization. In 2.5D and 3D calculations, the mosaic meshing technique proves advantageous, ensuring seamless transitions between boundary layer and flow domain meshes, yielding high-quality hexahedral mesh elements [69]. Careful consideration of these modeling and meshing aspects is pivotal for accurate and insightful Darrieus wind turbine aerodynamic characterizations, advancing the understanding of its behavior and performance comprehensively.
In all cases, the validation of mesh independence and the assurance of convergence to a stable solution are essential. It should be borne in mind that meshing constitutes a critical phase in CFD simulations, and the impact of accuracy and result reliability is significantly influenced by the selection of the modeling approach and mesh quality.
The variations in the torque coefficient for one blade as a function of Darrieus angular position at a fixed tip speed ratio (TSR) of 1.0 are presented in Figure 7a [24]. Fluctuations in the torque coefficient throughout the blade’s rotation are observed through the analysis. However, it is of crucial importance to critically assess the methodology employed, including the choice of grid resolutions and their impact on torque predictions. The influence of grid resolution on the accuracy and reliability of the torque coefficient results should be thoroughly evaluated to ensure robust conclusions.
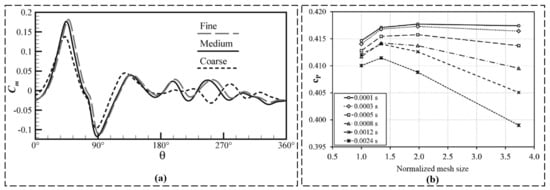
Figure 7.
(a) The variations in the torque coefficient for one blade, as a function of Darrieus angular position, for the three grid resolutions at TSR=1.0 (reproduced with permission from Arab, Renewable Energy, published by ELSEVIER, 2017 [24]). (b) Sensitivity analysis at : power coefficient () as a function of the normalized mesh size (reproduced with permission from Ferrari, Energy, published by ELSEVIER, 2016 [48]).
Figure 7b shows a sensitivity analysis conducted at TSR = 3.3, investigating the power coefficient () as a function of the normalized mesh size [48]. The power coefficient, a key metric for assessing wind turbine efficiency, is examined while systematically varying the mesh size. While this sensitivity analysis provides valuable insights into the impact of mesh size on power predictions, the methodology employed must be critically analyzed. Factors such as the range of mesh sizes considered, the convergence criteria used, and the selection of other modeling parameters should be carefully evaluated to ensure reliable and meaningful results.
The insights gained from these figures, as depicted in Figure 7, contribute to the understanding of wind turbine aerodynamics and efficiency. However, it is important to critically evaluate the limitations and potential sources of uncertainty associated with the analysis. Factors such as the modeling assumptions, turbulence models, and boundary conditions employed in the simulations should be critically assessed to ascertain the reliability of the findings.
Moreover, it is crucial to consider the broader context of these findings within the existing body of literature. Conducting a critical comparison of the results with experimental data and other numerical studies can provide a more comprehensive understanding of the observed trends and their significance. Additionally, incorporating a sensitivity analysis that considers multiple influencing factors can strengthen the validity of the conclusions drawn from the figures.
4.3.1. 2D Grid
Figure 8a presents the rotating domain of the mesh, emphasizing the computational region where the simulation takes place [8]. The wind-lens concept is depicted in Figure 8b [35], demonstrating its potential benefits in enhancing wind turbine performance. The importance of the rotating zone and the mesh design in capturing flow features are demonstrated in Figure 8c,d [24,45]. The significance of turbine spacing and layout in array configurations is highlighted in Figure 8e [71]. The mesh quality and resolution are demonstrated in Figure 8f [71].
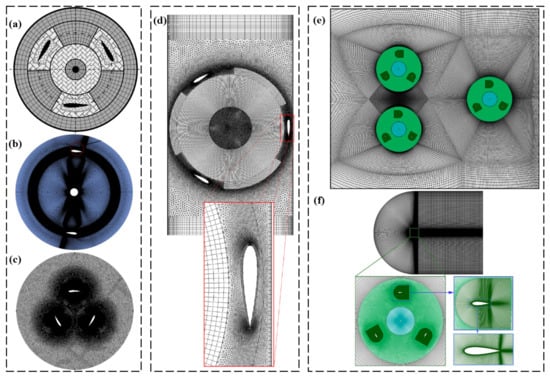
Figure 8.
(a) Rotating domain of the mesh (reproduced with permission from Daroczy, Energy, published by ELSEVIER, 2015 [8]), (b) wind-lens (reproduced with permission from Dessoky, Energy, published by ELSEVIER, 2019 [35]), (c) the rotating zone (reproduced with permission from Arab, Renewable Energy, published by ELSEVIER, 2017 [24]), (d) details of the mesh in the zone swept by the Darrieus (reproduced with permission from Torresi, Procedia Computer Science, published by ELSEVIER, 2013 [45]), (e) mesh distribution of VAWTs in array configurations (reproduced with permission from Ni, Energy, published by ELSEVIER, 2021 [71]), and (f) computational mesh distributions (reproduced with permission from Ni, Energy, published by ELSEVIER, 2021 [71]).
4.3.2. Boundary Layer around the Darrieus Turbine Blades
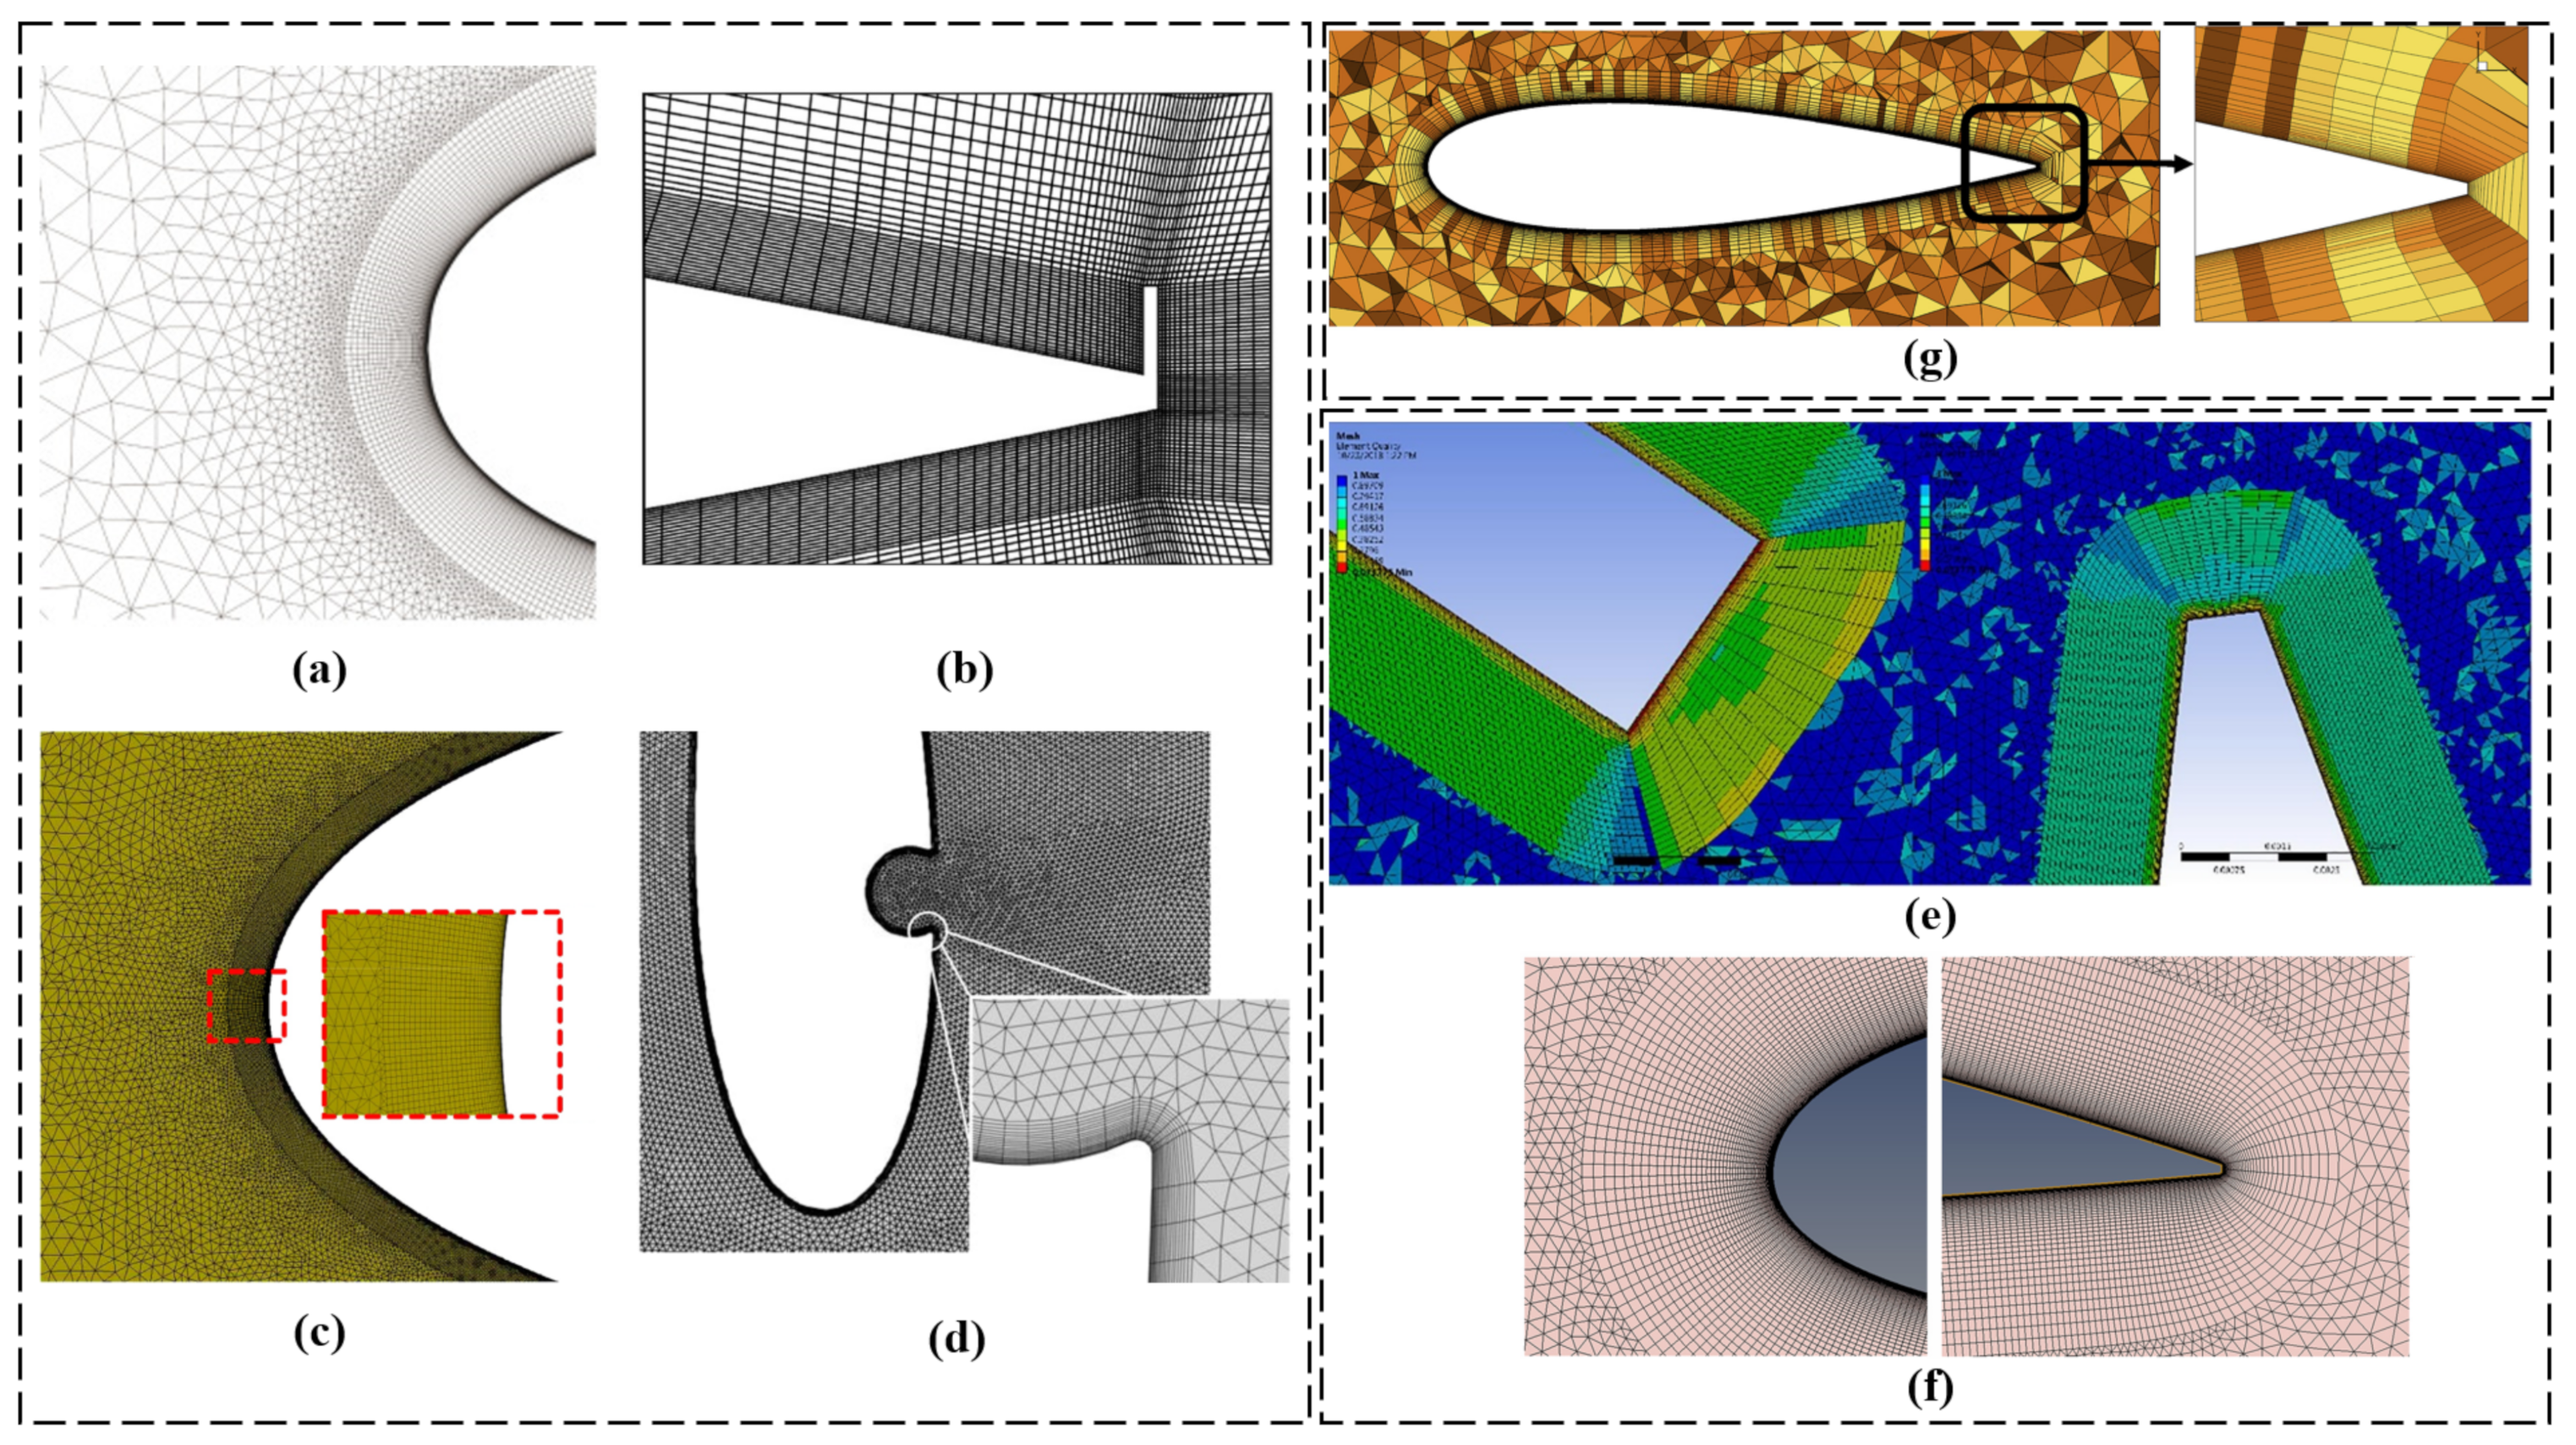
The mesh distribution and grid refinement are presented in Figure 9a,b [43,71]. The near-wall grid resolution and boundary layer development are emphasized in Figure 9c [23]. The boundary layer generation on the blade wall is depicted in Figure 9d [58]. The optimization of the worst elements at the blade tips is shown in Figure 9e [72]. The mesh sensitivity analysis is presented in Figure 9f [22]. The structured grid configuration in close proximity to the turbine blade is showcased in Figure 9g [18].
4.3.3. 3D Grid
Figure 10a depicts the sectional 3D computational mesh utilized in the simulations [35]. The computational mesh used in the simulations is further illustrated in Figure 10b, emphasizing its background [35]. Figure 10c displays the mesh structure of the 3D computational domain [54]. The computational mesh around the combined Darrieus and the front view of the mesh near the blades are depicted in Figure 10d [17]. Figure 10e provides additional details of the computational mesh [16]. Lastly, Figure 10f shows the generated mesh for three-dimensional (3D) models of the turbine using the Sliding Mesh Interface (SMI) [73] and includes a zoomed-in view of Darrieus and the 3D mesh on the blade tip [31].
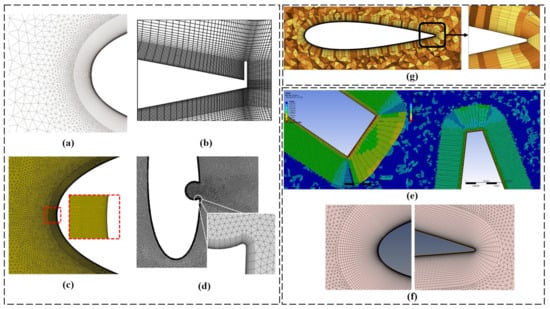
Figure 9.
(a) Representation of the mesh near the blade walls and for the rotating domain (hybrid mesh near the airfoil leading edge) (reproduced with permission from Bedon, Renewable Energy, published by ELSEVIER, 2016 [43]), (b) mesh distribution of the airfoil with GF (reproduced with permission from Ni, Energy, published by ELSEVIER, 2021 [71]), (c) computational grid (near wall grid resolution) (reproduced with permission from Hand, Computers & Fluids, published by ELSEVIER, 2017 [23]), (d) generation of the boundary layer on the blade wall (reproduced with permission from Sobhani, Energy, published by ELSEVIER, 2017 [58]), (e) the worst elements of the hybrid grid structure lied on the tips of the blades (reproduced with permission from Hosseini, Energy conversion and management, published by ELSEVIER, 2019 [72]), (f) mesh details of the fourth grid (G4)—Mesh sensitivity analysis (reproduced with permission from Balduzzi, Renewable Energy, published by ELSEVIER, 2016 [22]), and (g) structured grid close to the turbine blade (reproduced with permission from Karimian, Energy, published by ELSEVIER, 2020 [18]).
4.4. Computational Domain and Boundary Condition Assignment
Figure 11a presents the computational domain and boundary conditions employed in the simulations [24]. It is crucial to critically evaluate the chosen domain size and boundaries to ensure accurate representation of the flow physics and reliable predictions of turbine performance. In the case of a ducted turbine, Figure 11b illustrates the schematic of the computational domain [44]. It is important to critically evaluate the chosen duct design and its influence on flow behavior, considering the impact on turbine performance and potential trade-offs. Figure 11c depicts the computational domain of a cluster consisting of six turbines [59]. It is necessary to critically evaluate the chosen cluster layout and its implications on flow interactions, including the sensitivity to turbine spacing and the impact of turbine wakes. Principal dimensions and boundary conditions of the computational domain are provided in Figure 11d [54]. It is crucial to critically evaluate their adequacy for capturing the flow physics and turbine behavior, considering the representativeness of the dimensions and the influence of domain truncation. Figure 11e focuses on mesh refinement in the wake region [56], highlighting its importance. It is important to critically evaluate the chosen mesh refinement strategy, including the criteria for refinement, the impact on wake capture, and computational cost considerations.
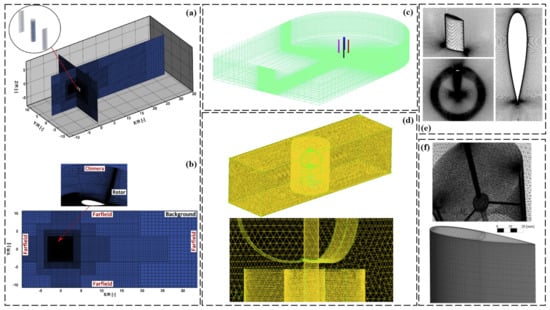
Figure 10.
(a) Sectional 3D computational mesh used in the simulations (reproduced with permission from Dessoky, Energy, published by ELSEVIER, 2019 [35]), (b) computational mesh used in the simulations: background (reproduced with permission from Dessoky, Energy, published by ELSEVIER, 2019 [35]), (c) mesh structure of the 3D computational domain (reproduced with permission from Zamani, Energy, published by ELSEVIER, 2016 [54]), (d) computational mesh around combined Darrieus and the front view of the mesh very near to the blades (reproduced with permission from Ghosh, Journal of the Energy Institute, published by ELSEVIER, 2015 [17]), (e) some details of the computational mesh (reproduced with permission from Balduzzi, Energy, published by ELSEVIER, 2017 [16]), and (f) SB-VAWT: generated mesh for the three-dimensional (3D) models of turbine using Sliding Mesh Interface (SMI) (zoomed Darrieus view) and 3D mesh on blade tip (reproduced with permission from Siddiqui, Renewable Energy, published by ELSEVIER, 2021 and Rossetti, Renewable Energy, published by ELSEVIER, 2013 [31,73]).
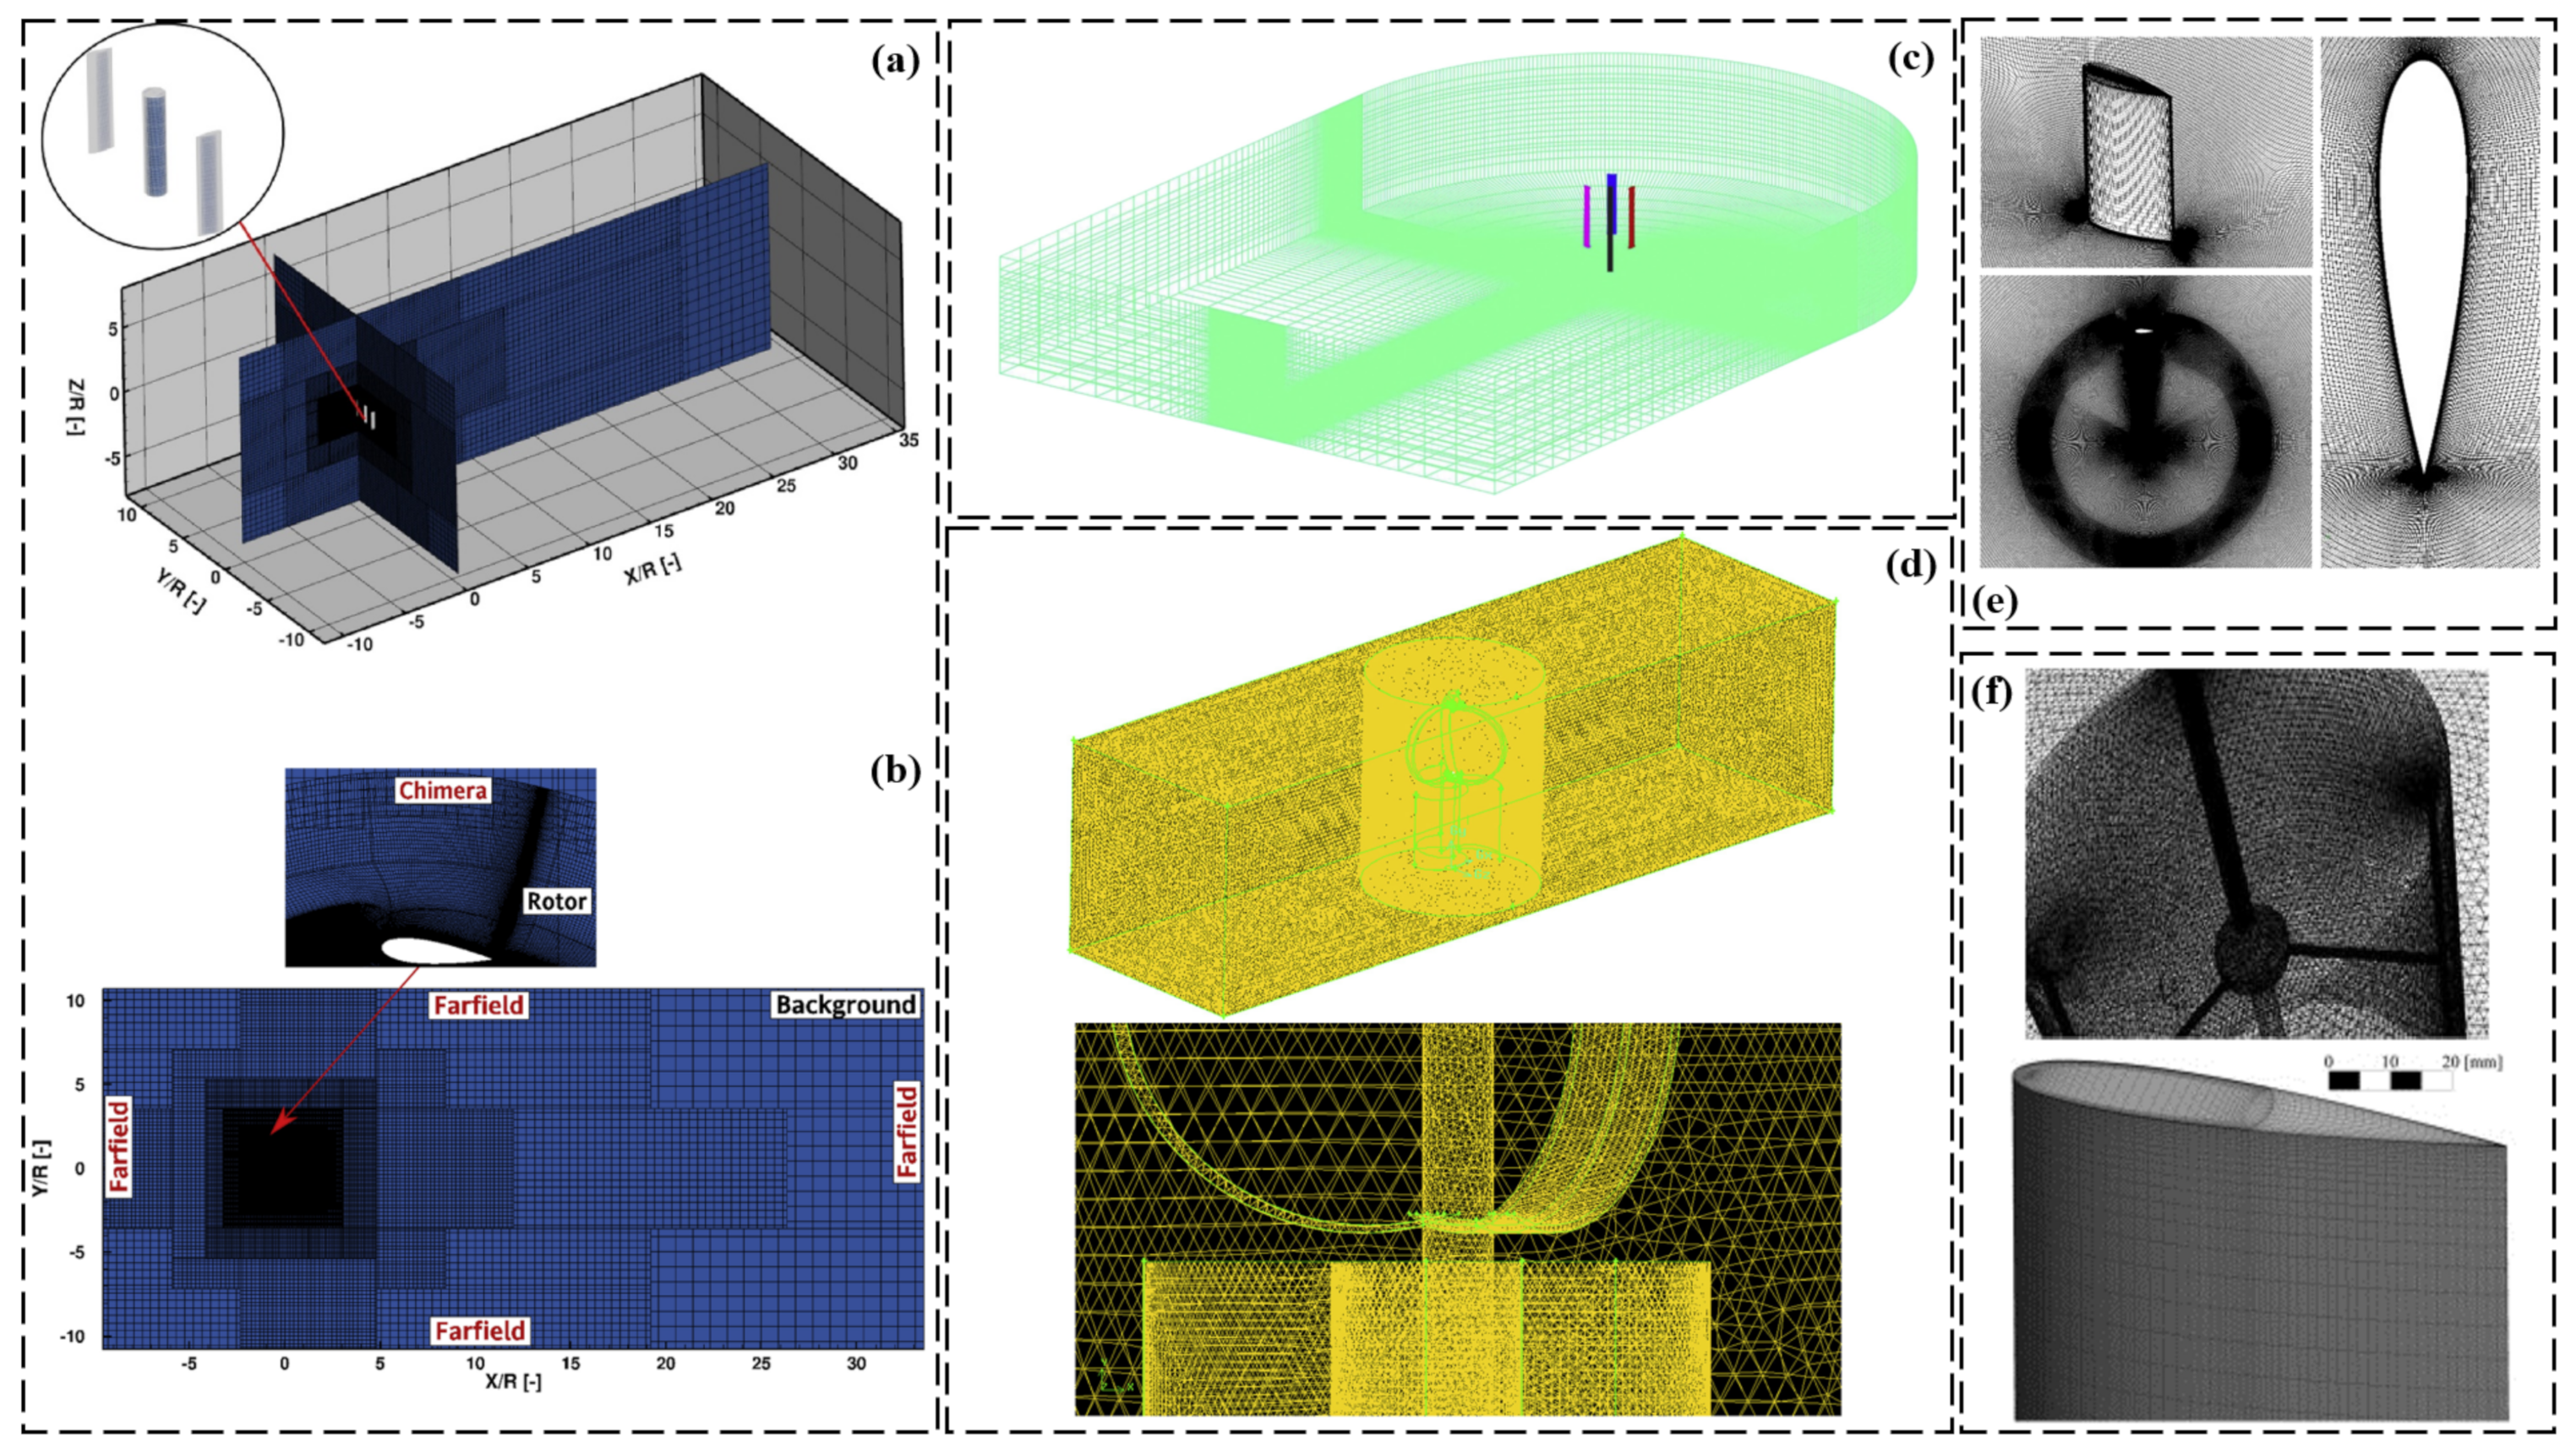
Figure 12a presents the computational domain, including boundary conditions and the grid [34]. It is crucial to critically evaluate their appropriateness and representativeness, considering factors such as domain size, shape, and sensitivity of results to boundary conditions. Figure 12b provides the dimensions of the 3D domain [31]. It is important to critically evaluate their impact on the simulation results, including their representativeness, sensitivity to variations, and scaling effects. Figure 12c depicts the computational domain of the experimental apparatus and its boundary conditions [35]. It is necessary to critically evaluate their alignment with the physical setup and test conditions, considering the accuracy of the representation and fidelity of the description. Figure 12d presents the geometrical parameters of the computational domain and an isometric view of the rotating zone [18]. It is important to critically evaluate the selected geometrical parameters, their accuracy, and their impact on the flow behavior, considering the limitations associated with the isometric view.
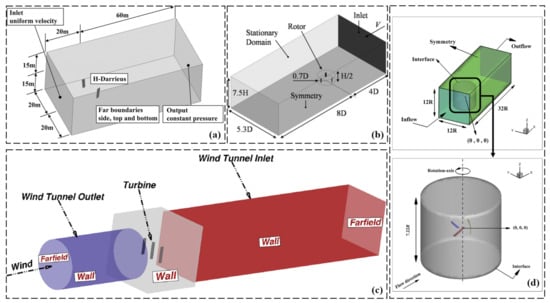
Figure 12.
(a) Computational domain, including boundary conditions (non-scaled) and the grid computational domain (reproduced with permission from Joo, Energy, published by ELSEVIER, 2015 [34]), (b) 3D domain dimension (reproduced with permission from Rossetti, Renewable Energy, published by ELSEVIER, 2013 [31]), (c) experimental apparatus computational domain (reproduced with permission from Dessoky, Energy, published by ELSEVIER, 2019 [35]), and (d) geometrical parameters of the computational domain (isometric view of the rotating zone) (reproduced with permission from Karimian, Energy, published by ELSEVIER, 2020 [18]).
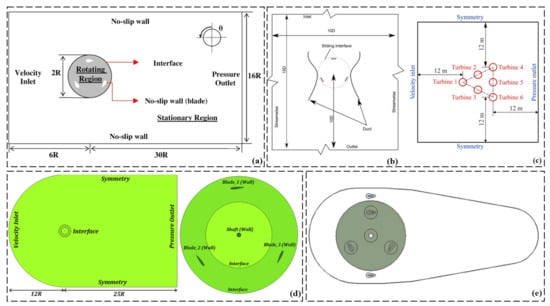
Figure 11.
(a) Computational domain and boundary conditions (reproduced with permission from Arab, Renewable Energy, published by ELSEVIER, 2017 [24]), (b) schematic of the computational domain in case of ducted turbine (reproduced with permission from Malipeddi, Renewable Energy, published by ELSEVIER, 2012 [44]), (c) computational domain of a 6 turbine cluster (reproduced with permission from Shaaban, Renewable Energy, published by ELSEVIER, 2018 [59]), (d) principal dimensions and boundary conditions of computational domain (reproduced with permission from Zamani, Energy, published by ELSEVIER, 2016 [54]), and (e) mesh refinement in the wake (reproduced with permission from Bianchini, Energy Conversion and Management, published by ELSEVIER, 2017 [56]).
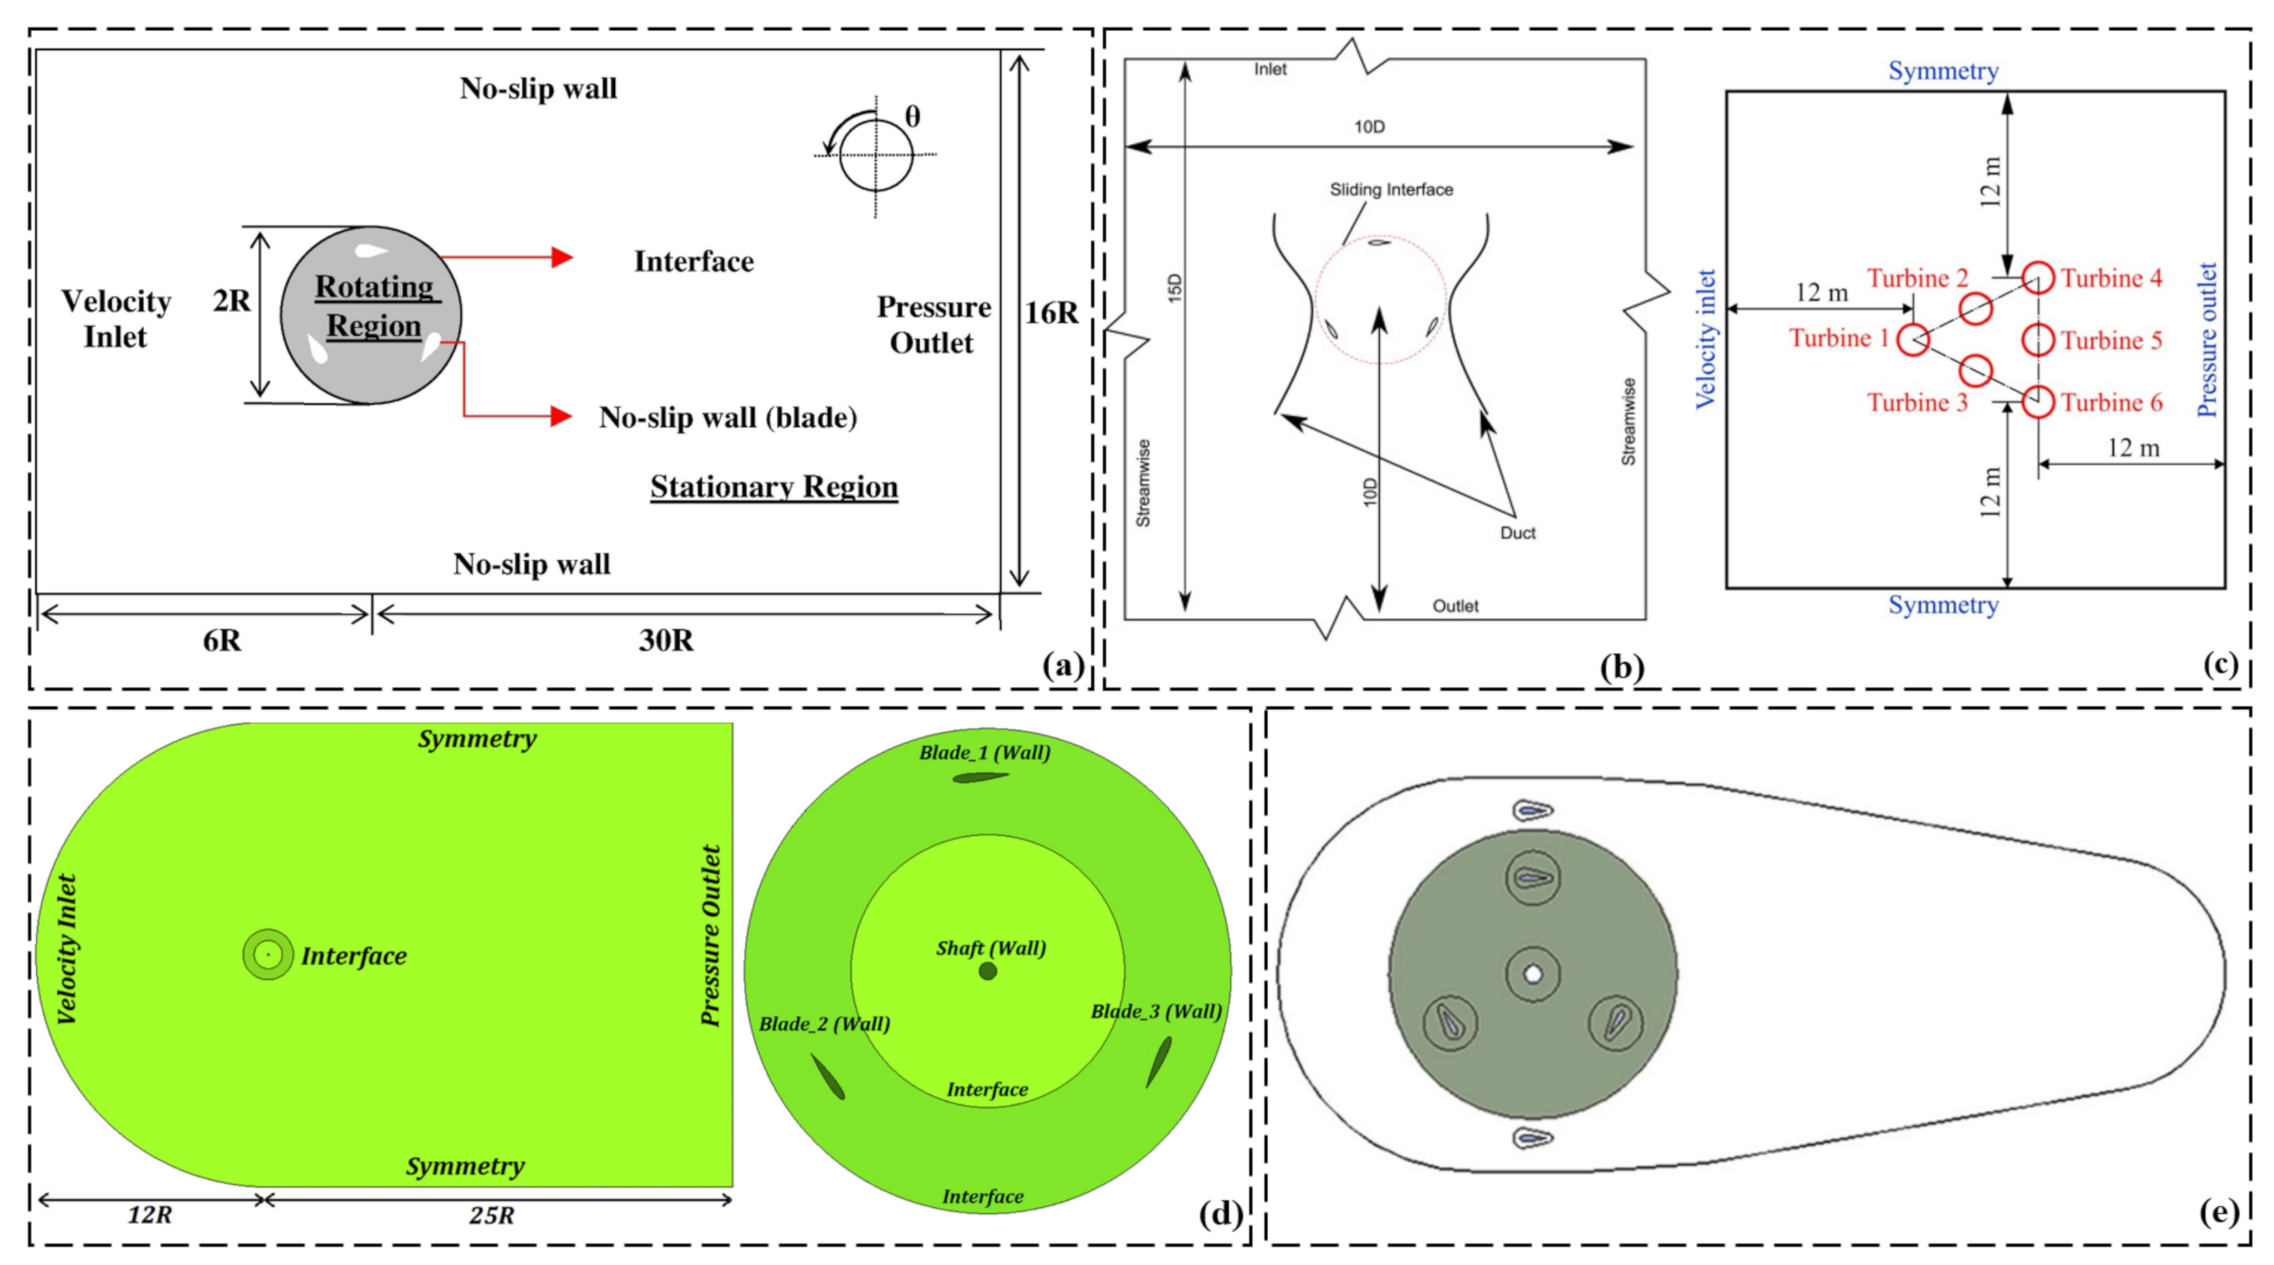
Table 3 presents an overview of Darrieus wind turbine localization on either side of the flow field, along with specific boundary conditions used in CFD modeling. The studies listed in the table focus on 2D and 3D simulations, examining the positioning of the turbines in relation to the upstream and downstream distances, width, and height. Additionally, some investigations include a sliding zone to analyze the movement of the turbines during the simulation.
Table 3.
Positioning of Darrieus wind turbines on both sides of the flow field.
In terms of boundary conditions, all studies utilized a velocity inlet to simulate the incoming wind flow. For the outlet, a pressure boundary condition was applied to represent the pressure at the exit of the computational domain. The table also specifies the boundary conditions on the left and right sides of the flow field, which were either symmetry or slip walls, depending on the study.
Here are some examples of the Darrieus localization and boundary conditions from the table:
- Balduzzi et al. [48] conducted 2D simulations with upstream and downstream distances of 40 D and 100 D, respectively. The width of the domain was set to 60 D, and the height was not specified. A sliding zone was included in their investigation. The inlet boundary condition was velocity, and the outlet was pressure. The left and right sides of the flow field had unspecified boundary conditions;
- Joo et al. [34] performed 3D simulations with an upstream distance of 20 m and a downstream distance of 60 m. The width of the domain was set to 40 m, and the height was 30 m. The simulation included walls as boundary conditions on the top and bottom sides of the flow field;
- Rossetti et al. [31] conducted 3D simulations with an upstream distance of 8 D and a downstream distance of 8 D. The width of the domain was set to 5.30 D, and the height was 7.50 H. The sliding zone was included in their investigation. The left and right sides of the flow field had symmetry boundary conditions;
- Ali et al. [60] performed 3D simulations with an upstream distance of 7.50 D and a downstream distance of 20 D. The width of the domain was set to 15 D, and the height was 8.50 D. The left and right sides of the flow field had slip walls as boundary conditions.
These examples demonstrate the various localization and boundary condition setups used in the CFD modeling of Darrieus wind turbines, providing insights into how researchers approach and analyze the turbine’s performance in different flow field configurations.
4.5. Parametric Studies on Darrieus Turbines Aiming to Enhance Their Power Coefficient
A Darrieus wind turbine is depicted in Figure 13a [40], showcasing its configuration. A critical evaluation of its advantages and limitations compared to other designs is necessary, considering factors such as compactness, scalability, and suitability for various applications. The straight-bladed Darrieus design is shown in Figure 13b [41], highlighting its enhanced aerodynamic performance. However, a critical evaluation of its real-world performance, structural integrity, and power generation capabilities is crucial. Figure 13c presents the final assembly of the Darrieus turbine with specified dimensions [72], which requires a critical evaluation of the accuracy and relevance of these dimensions, considering manufacturing tolerances and material properties. The schematic representation of the experimental setup is depicted in Figure 13d [61], necessitating a critical evaluation of its ability to replicate real-world conditions and measure turbine performance accurately. Figure 13e presents a computer-aided design (CAD) model of the assessed Darrieus turbine [56], requiring a critical evaluation of the CAD model’s fidelity in capturing the turbine’s behavior and its impact on performance predictions. The schematic view of the architecture of the analyzed Darrieus turbines is shown in Figure 13f [19], requiring a critical evaluation of design choices, including structural integrity, material selection, and system efficiency.

Figure 13.
(a) Darrieus wind turbine (reproduced with permission from Hashem, Energy, published by ELSEVIER, 2018 [40]), (b) straight-bladed Darrieus schematic (reproduced with permission from Asr, Energy, published by ELSEVIER, 2016 [41]), (c) the final assembly (dimensions in mm) (reproduced with permission from Hosseini, Energy conversion and management, published by ELSEVIER, 2019 [72]), (d) schematic representation of the experimental set up (reproduced with permission from Patel, International journal of marine energy, published by ELSEVIER, 2017 [61]), (e) CAD of the assessed Darrieus turbine (reproduced with permission from Bianchini, Energy Conversion and Management, published by ELSEVIER, 2017 [56]), (f) schematic view of the architecture of the analyzed Darrieus turbines (reproduced with permission from Bianchini, Energy conversion and management, published by ELSEVIER, 2015 [19]), (g) different compared GF configurations: (left (A) GF in configuration; (B) GF out configuration; (C) GF both configuration). (right (A) flow field around smooth airfoil; (B) hypothesized flow field around an airfoil with a Gurney flap (reproduced with permission from Bianchini, Energy conversion and management, published by ELSEVIER, 2019 [1])), (h) computational domain and boundary conditions (reproduced with permission from Sobhani, Energy, published by ELSEVIER, 2017 [58]), and (i) the different external shapes for which the simulations were performed (reproduced with permission from Malipeddi, Renewable Energy, published by ELSEVIER, 2012 [44]).
A comparison of different configurations of Gurney flaps (GFs) and the conventional blade mounting in Darrieus is depicted in Figure 13g [1], necessitating a critical evaluation of their effectiveness in improving turbine performance, considering flow conditions, GF design parameters, and aerodynamic behavior. Figure 13h illustrates the computational domain and boundary conditions [58], requiring a critical evaluation of their representativeness, accuracy, and impact on simulation results. The influence of different external shapes on turbine performance is presented in Figure 13i [44], requiring a critical assessment of the range of shapes considered, their impact on performance parameters, and their practical implementation.
The schematic representation of a Darrieus with a J-shaped section is depicted in Figure 14a [54], emphasizing the optimized curved profile of the turbine blades. A critical evaluation of the J-shaped section’s performance gains, starting torque, power generation efficiency, and structural integrity is essential. Figure 14b shows a combined three-bladed Darrieus and three-bladed bucket Savonius configuration [17], which requires a critical evaluation of its real-world performance, aerodynamic losses, mechanical complexity, and system efficiency compared to other Darrieus designs. The geometric details of a wind turbine model used for CFD simulation are presented in Figure 14c [60], requiring a critical evaluation of the model’s fidelity in capturing the turbine’s behavior and the impact of geometric simplifications.
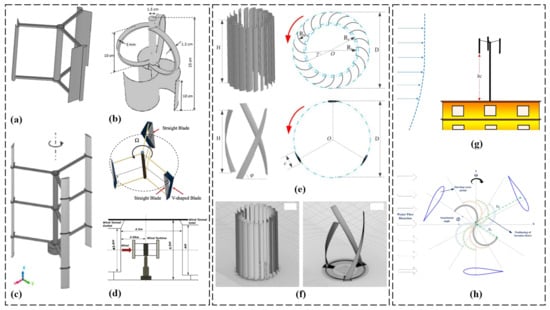
Figure 14.
(a) The schematic representation of a Darrieus VAWT with the J-shaped section (reproduced with permission from Zamani, Energy, published by ELSEVIER, 2016 [54]), (b) combined three-bladed Darrieus and three-bladed bucket Savonius (reproduced with permission from Ghosh, Journal of the Energy Institute, published by ELSEVIER, 2015 [17]), (c) geometric details of wind turbine model for CFD simulation (perspective view) (reproduced with permission from Ali, Energy Conversion and Management, published by ELSEVIER, 2018 [60]), (d) the sketch map of the VAWT with V-shaped blade (transformation of the three-dimensional model)/schematic sketch of experimental apparatus (reproduced with permission from Dessoky, Energy, published by ELSEVIER, 2019 [35]), (e) three VAWTs in the simulation: Banki turbine (Top Configuration); Darrieus (Bottom Configuration) (reproduced with permission from Tian, Renewable Energy, published by ELSEVIER, 2020 [11]), (f) details of the computation mesh: grids around the Banki turbine; grids around the Darrieus (reproduced with permission from Tian, Renewable Energy, published by ELSEVIER, 2020 [11]), (g) SB-VAWT: the schematic of turbine placed on a rooftop illustrating variations in height; five levels of height are considered, i.e., 1.0c (Case i), 2.5c (Case ii), 4.0c (Case iii), 7.5c (Case iv), and 10.0c (Case v) (reproduced with permission from Siddiqui, Renewable Energy, published by ELSEVIER, 2021 [73]), and (h) schematic of a hybrid Darrieus (reproduced with permission from Saini, Ocean Engineering, published by ELSEVIER, 2020 [15]).
The sketch map of the VAWT with V-shaped blades is shown in Figure 14d [35], along with a schematic sketch of the experimental apparatus, necessitating a critical evaluation of their representativeness, scaling effects, instrumentation limitations, and potential sources of uncertainty. Figure 14e compares three VAWTs (Banki turbine and Darrieus) used in simulations [11], requiring a critical assessment of the simulation setup, accuracy of simulation models, boundary conditions, and validation against experimental data. Figure 14f provides details of the computation mesh [11], requiring a critical evaluation of the chosen mesh configuration, resolution, mesh-induced flow disturbances, and computational efficiency. The schematic of a rooftop-mounted SB-VAWT with variations in height is depicted in Figure 14g [73], requiring a critical evaluation of the practical implications, wind flow characteristics, structural considerations, aesthetics, and safety. The schematic of a hybrid Darrieus configuration is presented in Figure 14h [15], requiring a critical assessment of its performance gains, and trade-offs. Factors such as the aerodynamic interaction between different Darrieus components, mechanical complexity, and overall system efficiency should be carefully assessed to determine the practical implications and potential limitations of this configuration. By conducting a thorough analysis, the reliability and significance of the hybrid Darrieus configuration can be properly evaluated.
4.6. Assessment of Discrepancies in Darrieus Power Coefficient
The experimental validation based on Castelli et al. is presented in Figure 15a [8], serving as a reference to validate the numerical simulations. However, a critical evaluation of the experimental setup, methodology, and potential limitations is crucial.
Similarly, a comparison between the numerical results and experimental data of Takao et al. is shown in Figure 15b [24], allowing an assessment of the accuracy and effectiveness of different turbulence models. It is important to critically evaluate the robustness, limitations, and applicability of these turbulence models. Figure 15c illustrates the effect of different turbulence models on the simulation results [50], highlighting the need to critically evaluate their implications and limitations. A comparison between experimental and simulated power coefficients () at different Tip Speed Ratios (TSRs) is depicted in Figure 15d [30], necessitating a critical evaluation of the potential sources of discrepancy.
The lift and drag coefficients of the NACA0018 airfoil at a Reynolds number of 300,000 are displayed in Figure 15e [14], requiring a critical assessment of the limitations and applicability of the chosen airfoil model. In Figure 15f, the tangential force coefficients of a single blade against the azimuthal angle for various CFD schemes at a Tip Speed Ratio (TSR) of 2 are compared [30], necessitating a critical assessment of the assumptions and limitations of each CFD scheme.
The power coefficient () curves between 2D and 3D unsteady Reynolds-averaged Navier–Stokes (URANS) CFD simulations are compared in Figure 15g [35], requiring a critical evaluation of the assumptions and limitations associated with each approach. In Figure 15h, a comparison of the power coefficient () curve of a Darrieus VAWT model is presented [35], necessitating a critical evaluation of the experimental setup and measurement uncertainties. Lastly, the experimental and unsteady Reynolds-averaged Navier–Stokes (URANS) blade-resolved simulation power coefficient () curves are compared in Figure 15i [37], requiring a critical evaluation of the limitations and assumptions associated with the URANS modeling approach.
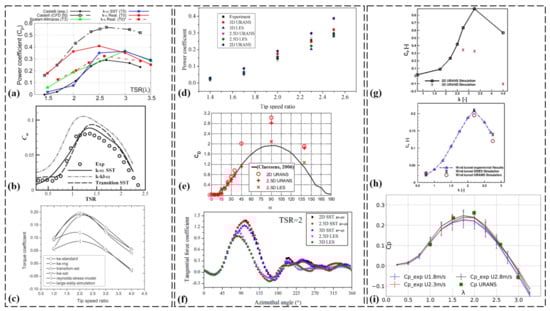
Figure 15.
(a) Experimental validation based on Castelli et al. [65](exp) (reproduced with permission from Daroczy, Energy, published by ELSEVIER, 2015 [8]), (b) the numerical results comparison with the experimental data of Takao et al., using various turbulence models (reproduced with permission from Arab, Renewable Energy, published by ELSEVIER, 2017 [24]), (c) effect of different turbulence models on the simulation results (reproduced with permission from Chen, Energy, published by ELSEVIER, 2015 [50]), (d) comparison of experimental and simulated at different TSRs (reproduced with permission from He, Renewable Energy, published by ELSEVIER, 2020 [30]), (e) lift and drag coefficients of NACA0018 airfoil for Re = 300,000 [77] (reproduced with permission from Li, Renewable energy, published by ELSEVIER, 2013 [14]), (f) tangential force coefficients of a single blade against the azimuthal angle for various CFD schemes (TSR = 2) (reproduced with permission from He, Renewable Energy, published by ELSEVIER, 2020 [30]), (g) comparison of the power coefficient () curves between 2D and 3D URANS CFD simulations (reproduced with permission from Dessoky, Energy, published by ELSEVIER, 2019 [35]), (h) comparison of power coefficient () curve of Darrieus VAWT model (reproduced with permission from Dessoky, Energy, published by ELSEVIER, 2019 [35]), and (i) comparison of the experimental and URANS blade-resolved simulation curves (reproduced with permission from Clary, Ocean Engineering, published by ELSEVIER, 2020 [37]).
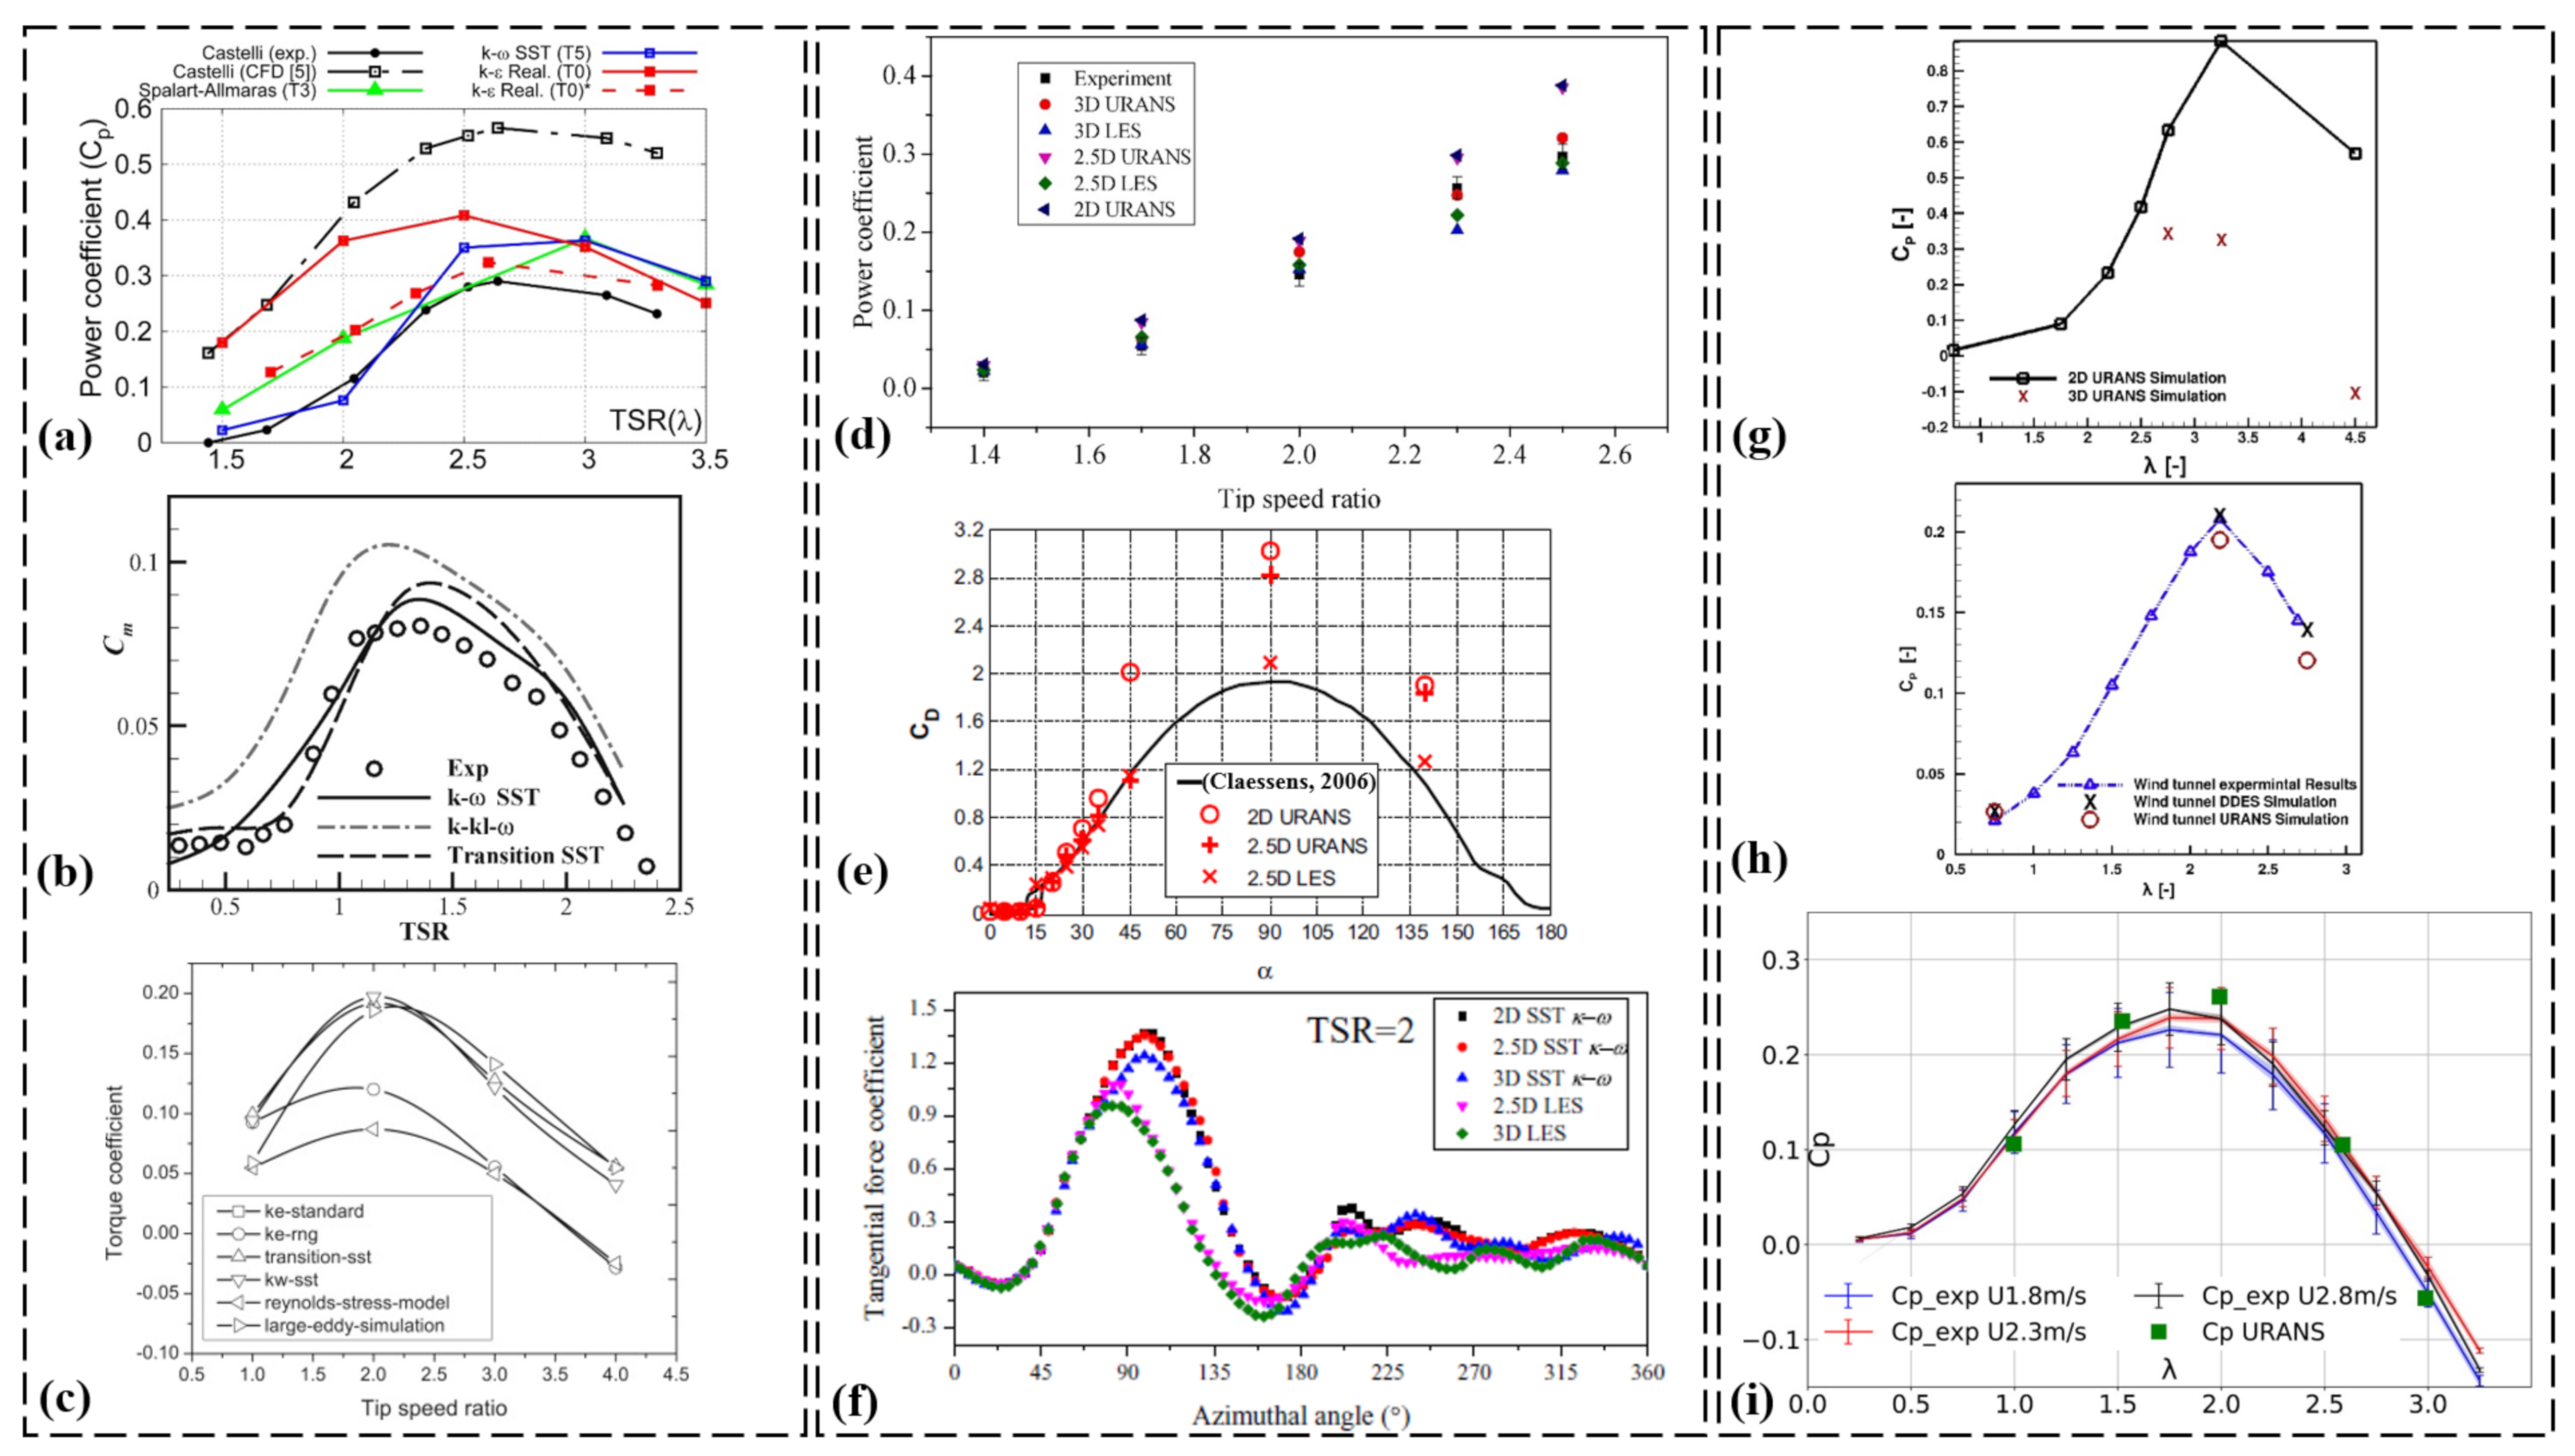
In Figure 16a, a comparison is made between numerical results and experimental data by Bravo et al. [53], necessitating a critical assessment of the experimental setup and methodology. Similarly, a comparison between numerical and experimental results is presented in Figure 16b [58], requiring a critical evaluation of the experimental uncertainties and limitations. The present computational model is validated by comparing it to experimental data and other computational results, as shown in Figure 16c [40], necessitating a critical evaluation of the assumptions and limitations of the model itself.
A comparison of the power coefficient between computational results and experimental values is presented in Figure 16d [71], requiring a critical evaluation of the potential sources of discrepancy between the computational and experimental data. By conducting thorough critical evaluations of these factors, the reliability, accuracy, and predictive capabilities of the numerical simulations and models can be ensured, enhancing the overall confidence in the results and their practical implications.
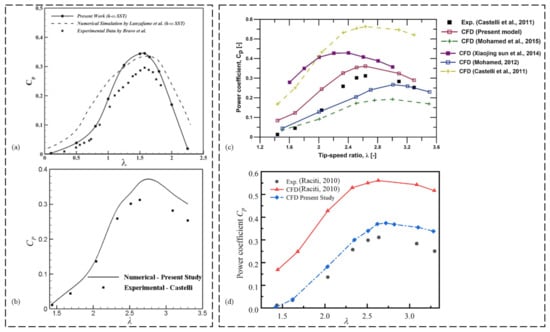
Figure 16.
(a) Comparison of numerical results and experimental data by Bravo et al. (reproduced with permission from Zamani, Renewable Energy, published by ELSEVIER, 2016 [53]), (b) comparison of numerical and experimental results (reproduced with permission from Sobhani, Energy, published by ELSEVIER, 2017 [58]), (c) validation of present computational model, compared to experimental data for open Darrieus turbine and other computational results for Darrieus [40,46,47,65,78] (reproduced with permission from Hashem, Energy, published by ELSEVIER, 2018 [40]), and (d) power coefficient comparison between computation results and experiment values [79] (reproduced with permission from Ni, Energy, published by ELSEVIER, 2021 [71]).
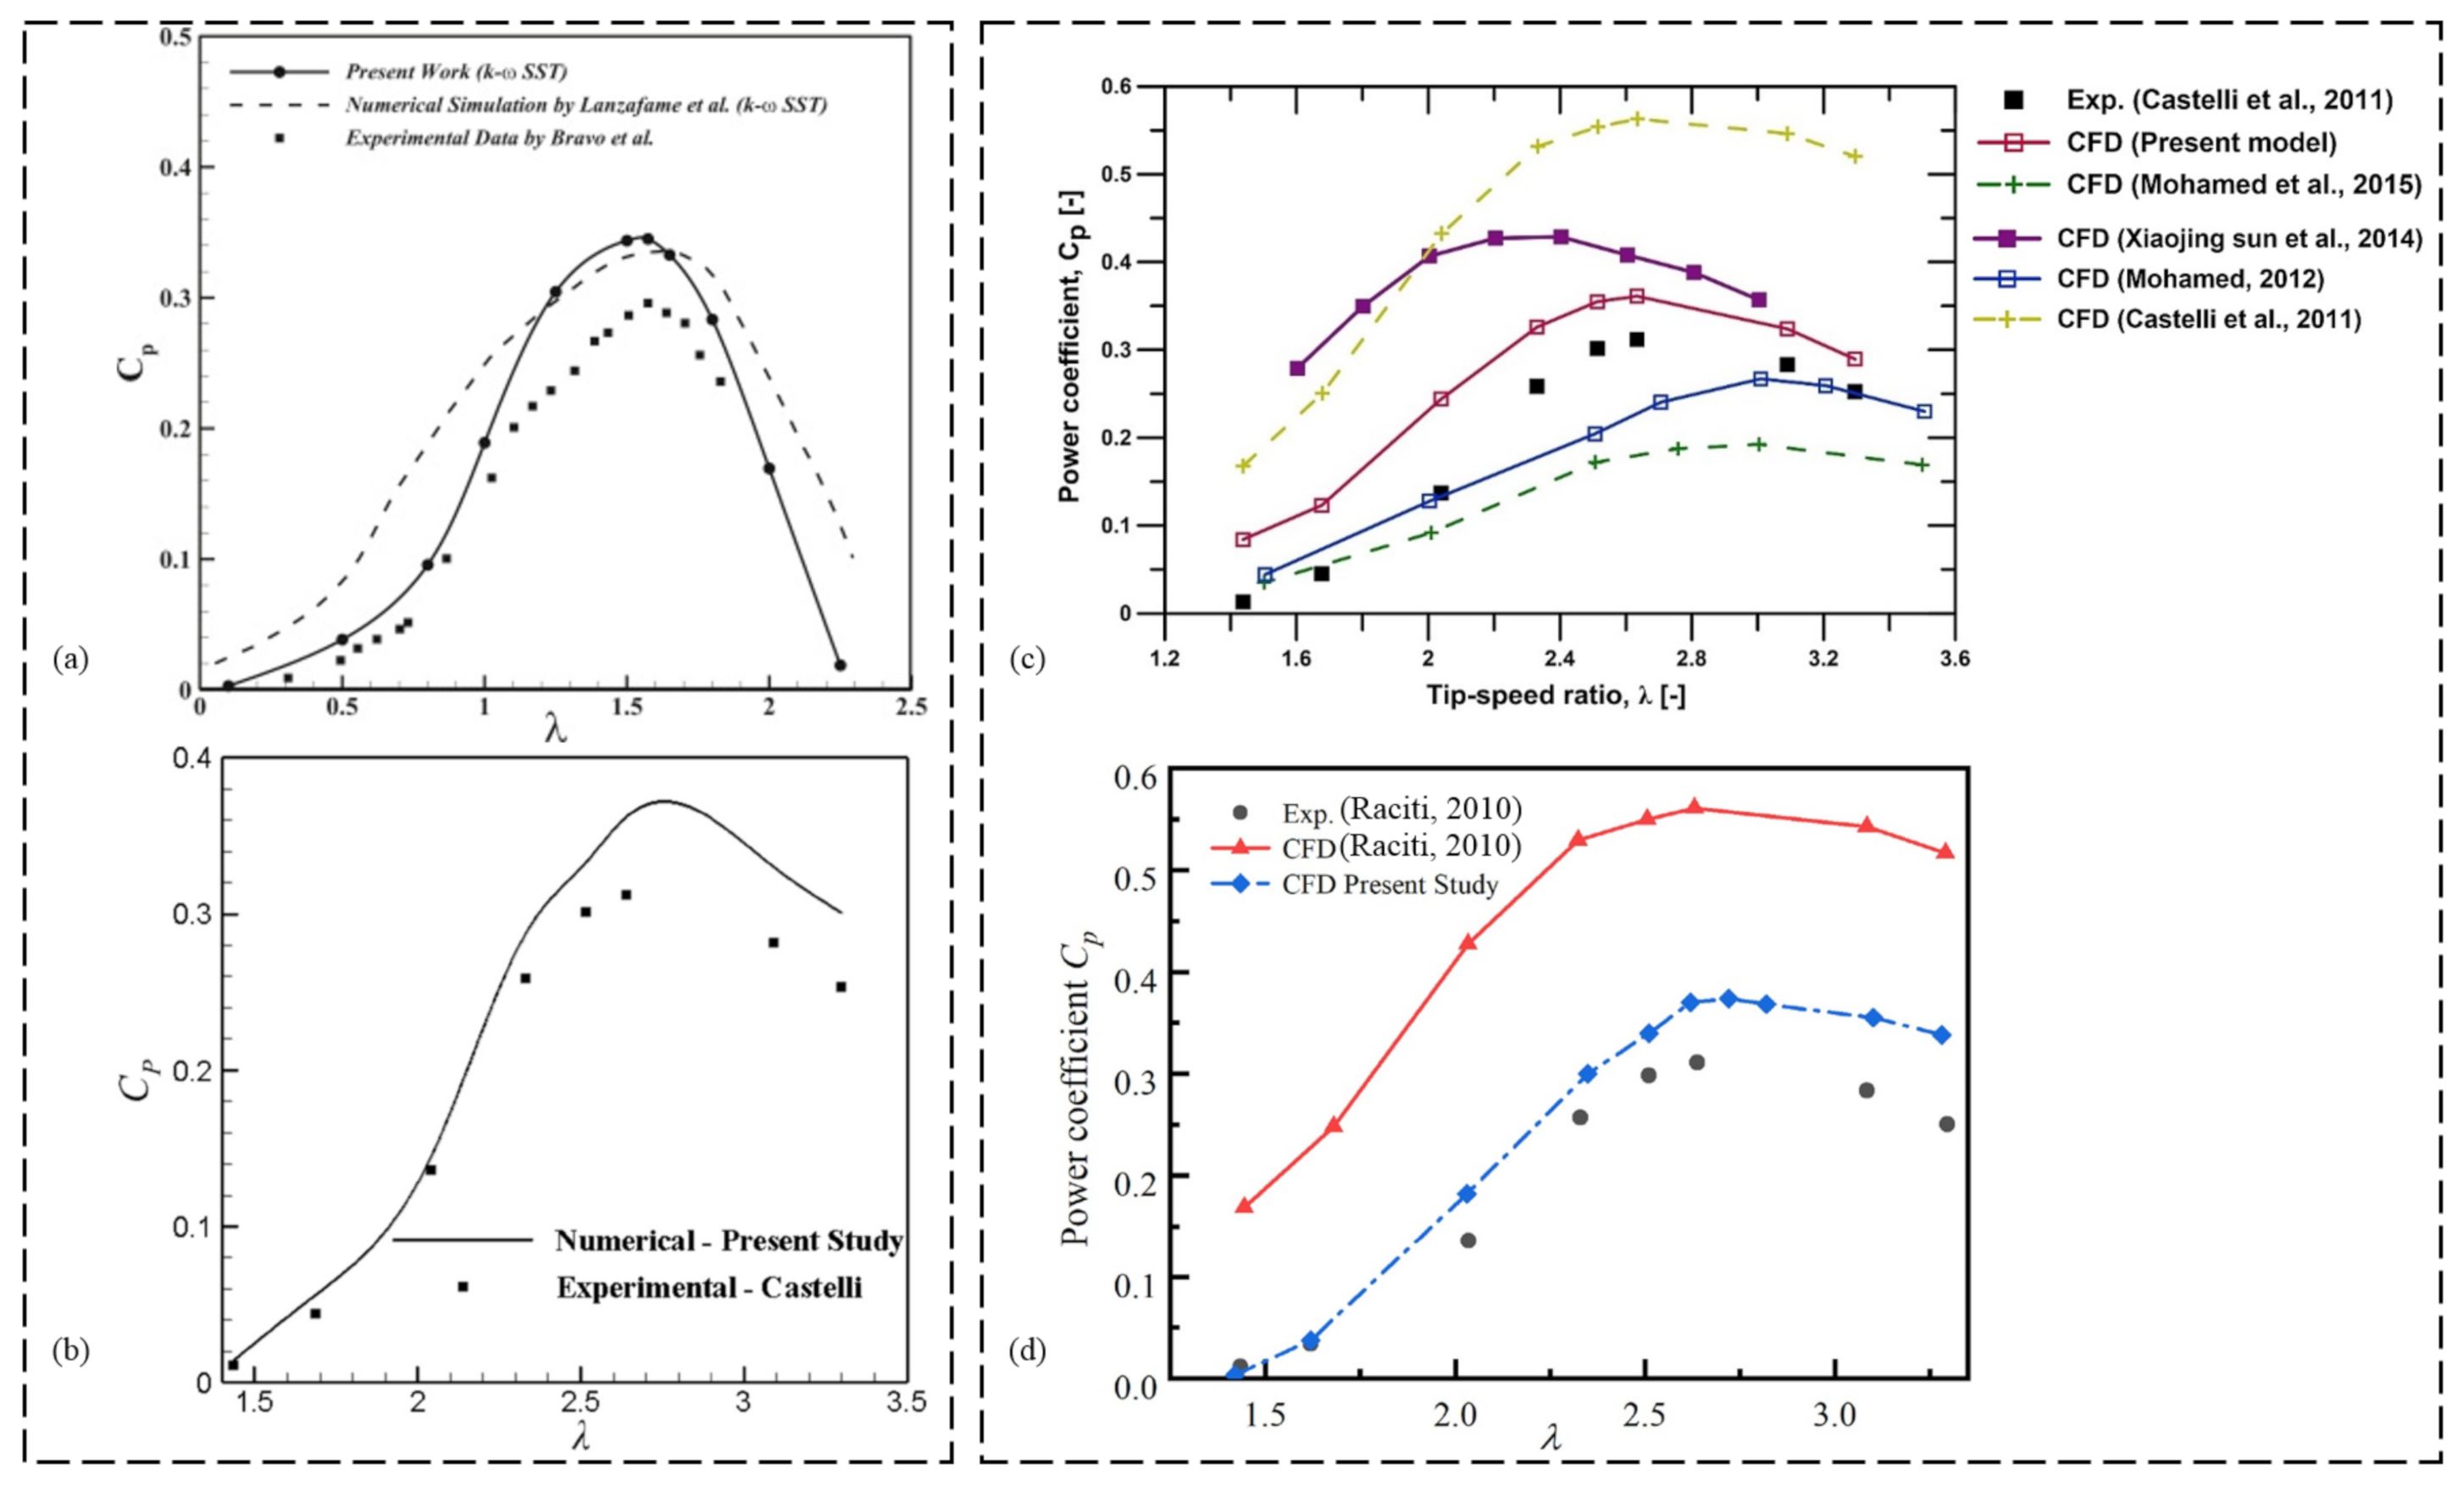
Figure 17a presents a comparison of the torque coefficient in the first five revolutions with the test result at = 2.29 [63]. While this comparison allows for the evaluation of the accuracy of the numerical model in predicting the torque coefficient, it is important to critically assess the experimental conditions and measurement uncertainties. Factors such as instrumentation limitations, experimental setup variations, and potential sources of error, should be critically evaluated to ensure the reliability and significance of the experimental data as a validation reference.
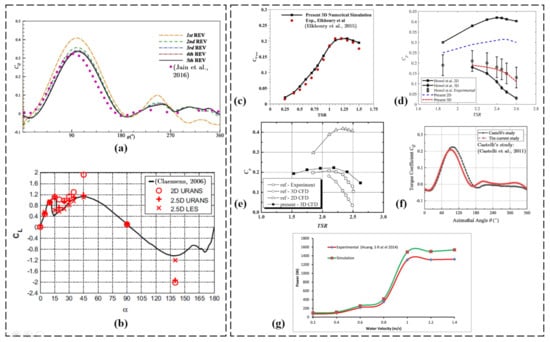
Figure 17.
(a) Comparison of the torque coefficient in the first five revolutions with the test result, = 2.29 [80] (reproduced with permission from Xu, Energy Conversion and Management, published by ELSEVIER, 2020 [63]), (b) lift coefficient of NACA0018 airfoil for Re = 300,000 [77] (reproduced with permission from Li, Renewable energy, published by ELSEVIER, 2013 [14]), (c) comparison between averages of the total power coefficient of experimental data by Elkhoury et al. [81] and 3D results presented in [18] (reproduced with permission from Karimian, Energy, published by ELSEVIER, 2020 [18], (d) SB-VAWT: results are benchmarked with Howel et al. [73] experimental and numerical results (reproduced with permission from Siddiqui, Renewable Energy, published by ELSEVIER, 2021 [73]). Experimental results have been reported at a wind speed of 5.07 m/s. The numerical results are within the ±20% error range and more realistic than Howel et al. results at higher TSRs (reproduced with permission from Siddiqui, Renewable Energy, published by ELSEVIER, 2021 [73]), (e) power coefficient comparison between the computational and experimental results by Robert et al. (reproduced with permission from Joo, Energy, published by ELSEVIER, 2015 [34]), (f) comparison of the dynamic torque coefficient at tip speed ratio = 3.1 (Castelli et al. [65]) (reproduced with permission from Su, Applied Energy, published by ELSEVIER, 2020 [38]), and (g) computational model validation with published experimental data at different values of TSR (reproduced with permission from Tunio, Renewable Energy, published by ELSEVIER, 2020 [82]).
The lift coefficient of the NACA0018 airfoil for Re = 300,000 is depicted in Figure 17b [14]. While this comparison between the numerical results and experimental data allows for the evaluation of the accuracy of the computational model, it is important to critically assess the experimental uncertainties and limitations. Factors such as measurement techniques, calibration procedures, and potential sources of systematic error should be critically evaluated to ensure the reliability and validity of the experimental data for validating the numerical model.
In Figure 17c, a comparison is made between the averages of the total power coefficient from experimental data by Elkhoury et al. and the present 3D results [18]. While this comparison aims to assess the accuracy of the computational model in predicting the power coefficient, it is important to critically evaluate the experimental uncertainties and potential sources of discrepancy. Factors such as measurement techniques, data acquisition procedures, and uncertainties in the experimental setup should be critically assessed to ensure the reliability and validity of the experimental data for validating the computational model.
The results of the SB-VAWT are benchmarked against experimental and numerical results by Howel et al. in Figure 17d. The numerical results demonstrate better agreement with reality compared to Howel et al.’s results at higher TSRs. However, it is crucial to critically evaluate the assumptions and limitations associated with both the numerical and experimental approaches. Factors such as modeling simplifications, numerical approximations, variations in the experimental setup, and uncertainties in the measurements should be thoroughly assessed. By critically evaluating these factors, the accuracy and reliability of the numerical simulations and experimental measurements can be ensured, leading to a more comprehensive understanding of the turbine’s performance and enhancing confidence in the obtained results.
The power coefficient is compared between the computational and experimental results by Robert et al. in Figure 17e. This comparison enables the assessment of the accuracy and predictive capability of the computational model. However, it is crucial to critically assess the experimental setup and potential sources of discrepancy between the computational and experimental data. Factors such as measurement techniques, experimental uncertainties, and limitations in the experimental conditions should be thoroughly evaluated. By critically analyzing these factors, the reliability and validity of the experimental data for validating the numerical model can be ensured, leading to a more comprehensive understanding of the turbine’s performance and enhancing confidence in the computational results.
The dynamic torque coefficient at a tip speed ratio () of 3.1 is compared in Figure 17f, based on Castelli et al.’s findings [38]. This comparison aims to validate the accuracy of the numerical model in predicting the dynamic torque coefficient. However, it is crucial to critically assess the experimental conditions and potential sources of discrepancy between the numerical and experimental data. Factors such as instrumentation limitations, measurement uncertainties, and variations in the experimental setup should be thoroughly evaluated. By critically analyzing these factors, the reliability and significance of the experimental data as a validation reference can be ensured, enabling a more comprehensive understanding of the turbine’s performance and improving confidence in the accuracy of the numerical model’s predictions.
The computational model is validated with published experimental data at different values of tip speed ratio (TSR) in Figure 17g, as described by Tunio et al. [82]. This validation process aims to assess the accuracy and reliability of the computational model. However, it is crucial to critically evaluate the experimental uncertainties and limitations associated with the published data. Factors such as measurement techniques, calibration procedures, and potential sources of error should be thoroughly assessed. By critically analyzing these factors, the reliability and validity of the experimental data for validating the computational model can be ensured, leading to improved confidence in the accuracy of the model’s predictions and a more comprehensive understanding of the turbine’s performance.
4.7. Turbulence Quantities Obtained through CFD Modeling
Figure 18a compares the shed vortex centers’ path for a three-bladed Darrieus using experimental visualization by Strickland JH et al. and FEVDTM prediction [13], allowing for the evaluation of the accuracy and predictive capability of the FEVDTM model. However, it is important to critically assess the experimental visualization techniques and potential sources of uncertainty. Similarly, Figure 18b presents the dimensionless velocity magnitude around the blades for Zone 1 [25], providing insights into the behavior and distribution of the dimensionless velocity magnitude.
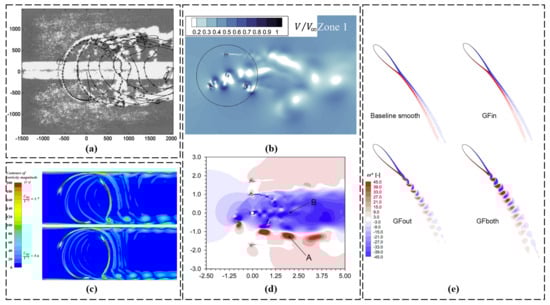
Figure 18.
(a) Shed vortex centers path for a three-bladed Darrieus. Comparison of experimental visualization (Strickland JH et al.) and FEVDTM prediction (reproduced with permission from Ponta, Renewable energy, published by ELSEVIER, 2001 [13]), (b) dimensionless velocity magnitude around the blades for Zone 1 (reproduced with permission from Celik, Journal of Wind Engineering and Industrial Aerodynamics, published by ELSEVIER, 2020 [25]), (c) contours of vorticity magnitude (reproduced with permission from Marco, Procedia Computer Science, published by ELSEVIER, 2013 [45]), (d) normalized velocity in the wake at TSR = 1.4 (computed velocity field) (A: corresponds to powerful vortices that detach upwind from the blades and are subsequently carried downstream by the flow. The strength of these vortices might have been overestimated in CFD simulations compared to experimental observations. B: corresponds to an excessive reduction in velocity within the wake of the tower, a phenomenon that is not observed in experimental results) (reproduced with permission from Bianchini, Energy Conversion and Management, published by ELSEVIER, 2017 [56]) and (e) dimensionless vorticity contours (TSR = 6.0, vs. = 312 degree, h = 2%c) (reproduced with permission from Bianchini, Energy conversion and management, published by ELSEVIER, 2019 [1]).
However, a critical assessment of the numerical model’s assumptions and limitations is necessary. Contours of vorticity magnitude are illustrated in Figure 18c [45], offering insights into the distribution and strength of vorticity. However, the numerical model’s capability to accurately capture the vorticity phenomenon should be critically assessed. Figure 18d displays the normalized velocity in the wake at TSR = 1.4 based on the computed velocity field [56], providing information about the velocity distribution in the wake region. Still, the numerical model’s ability to capture the wake characteristics accurately should be critically evaluated. Dimensionless vorticity contours are depicted in Figure 18e for TSR = 6.0, vs. = 312 degrees, and h = 2%c [1], offering insights into the vorticity distribution and strength. However, the numerical model’s ability to accurately capture the vorticity phenomenon should be critically assessed.
In Figure 19a, velocity contours around a nine Savonius wind turbine farm are illustrated [57], providing a visual representation of the flow field and the distribution of wind velocities within the farm. However, the numerical modeling approach and the accuracy of the velocity predictions should be critically assessed. Similarly, a velocity contour map for a 3 × 5 farm with spacing x = 5, y = 10 is shown in Figure 19b [62], providing detailed information about the velocity distribution within the farm. However, a critical assessment of the numerical modeling assumptions and limitations is necessary. By conducting thorough critical evaluations of these factors, the reliability, accuracy, and predictive capabilities of the numerical simulations and models can be ensured, enhancing the overall confidence in the results and their practical implications.
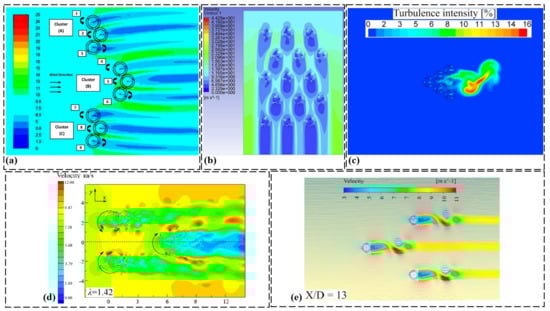
Figure 19.
(a) Velocity contours around a nine savonius wind turbine farm (reproduced with permission from Shaheen, Sustainable Energy Technologies and Assessments, published by ELSEVIER, 2017 [57]), (b) velocity contour map for a 3 × 5 farm with spacing x = 5, y = 10 (reproduced with permission from Barnes, Renewable energy, published by ELSEVIER, 2019 [62]), (c) turbulence intensity of the six turbine cluster at X/D = 1.5 and = 3.3 (reproduced with permission from Shaaban, Renewable Energy, published by ELSEVIER, 2018 [59]), (d) the wake velocity contours at the tip speed ratio of 1.42 (reproduced with permission from Ni, Energy, published by ELSEVIER, 2021 [71]), and (e) pathlines for the three equilateral turbine cluster at X/D = 13 (reproduced with permission from Shaaban, Renewable Energy, published by ELSEVIER, 2018 [59]).
Figure 19c displays the turbulence intensity of a six-turbine cluster at X/D = 1.5 and = 3.3 [59]. While the turbulence intensity distribution provides insights into the level of turbulence generated within the cluster, it is important to critically assess the turbulence modeling approach and its ability to accurately capture the turbulence characteristics. Factors such as turbulence model selection, grid resolution, and numerical stability should be critically evaluated to ensure the accuracy and reliability of the turbulence intensity results.
The wake velocity contours at the tip speed ratio of 1.42 are depicted in Figure 19d [71]. While the wake velocity contours offer insights into the velocity distribution behind the turbines and the wake structure, it is important to critically assess the numerical modeling approach’s ability to capture the wake dynamics accurately. Factors such as turbulence modeling, grid resolution, and boundary conditions should be critically evaluated to ensure the accuracy and reliability of the wake velocity contours in representing the wake characteristics.
Figure 19e shows the pathlines for a three-equilateral turbine cluster at X/D = 13 [59]. While the pathlines provide visualizations of the flow patterns and particle trajectories, it is important to critically assess the numerical modeling approach’s capability to accurately predict the flow behavior within the cluster. Factors such as numerical stability, grid resolution, and turbulence modeling should be critically evaluated to ensure the accuracy and reliability of the pathlines in representing the flow behavior and turbine interactions.
Figure 20a compares the wake of the Darrieus VAWT for an open turbine and a cycloidal surface diffuser wind lens [35]. This figure presents the wake characteristics and vortices generated behind the turbine. Figure 20b presents a comparison of the tip vortex between J-shaped blades and conventional blades [54]. This comparison offers insights into the vortex characteristics and differences between the blade configurations. Figure 20c shows the Q-criterion iso surfaces for three configurations of the rotating Darrieus [20]. These iso surfaces highlight the vortex structures and shedding dynamics. Figure 20d provides visualizations of vorticity magnitude and vortex shedding near the turbine at specific operating conditions [18,82]. These visualizations offer insights into the vorticity distribution and shedding patterns. Figure 20e presents visualizations of vorticity contours and distribution on 2D planes and horizontal cut planes [17,73]. These visualizations provide information about the vorticity behavior within the turbine and its surroundings.
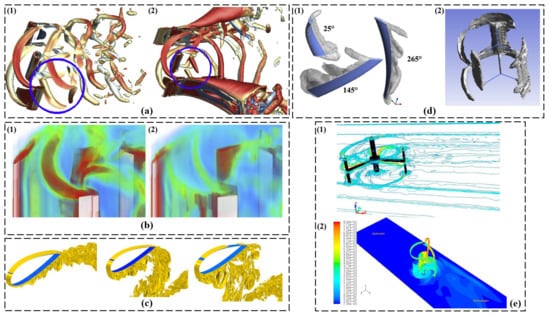
Figure 20.
(a) Wake of the Darrieus VAWT for an open turbine (1) and a cycloidal surface diffuser wind lens (2). (reproduced with permission from Dessoky, Energy, published by ELSEVIER, 2019 [35]), (b) comparison of tip vortex generated by the J-shaped blades (1) and conventional blades (2) at a same azimuth position (reproduced with permission from Zamani, Energy, published by ELSEVIER, 2016 [54]), (c) Q-criterion (isosurface 300 s) for three configurations of the rotating Darrieus modeled by LES (reproduced with permission from Patil, Energy, published by ELSEVIER, 2018 [20]), (d) (1) contour of the vorticity magnitude (3-PB configuration): iso surface of 65 s at a wind speed of 7 m/s, rotational speed of 120 rpm, and azimuth angle of 25 deg. (2) Vortex shedding visualization for near turbine at vorticity of 16 ms at inflow 1 m/s (reproduced with permission from Karimian, Energy, published by ELSEVIER, 2020, and from Tunio, Renewable Energy, published by ELSEVIER, 2020 [18,82]), and (e) (1) SB-VAWT: Contours of vorticity on 2D planes while turbine is mounted at 7.5c and operating at Tip Speed Ratio (TSR) of 3.0. (2) Vorticity distribution (in per s) on horizontal cut planes at y = 0.05 m (reproduced with permission from Siddiqui, Renewable Energy, published by ELSEVIER, 2021, and from Ghosh, Journal of the Energy Institute, published by ELSEVIER, 2015 [17,73]).
In Figure 21a, iso-surface visualizations of the wake of the Darrieus VAWT are compared for different turbulence resolving approaches and speed ratios [36]. These visualizations aim to showcase the wake characteristics and flow structures. Figure 21b presents a 3D view of the dimensional vorticity for a specific azimuth angle [36]. This visualization offers insights into the vorticity distribution and flow structures around the turbine. These visualizations and comparisons provide valuable information about wake characteristics, vortices, and flow structures in relation to turbine performance. Critical evaluations of the numerical modeling approaches, experimental techniques, and associated uncertainties enhance the reliability and accuracy of the presented insights.

Figure 21.
(a) (1) Wake of the Darrieus VAWT with different turbulence resolving approaches and speed ratio: URANS-JST/ = 2.75, (2) DDES-WENO/ = 2.75, (3) URANS-JST/ = 0.75 and (4) DDES-WENO/ = 0.75 (reproduced with permission from Dessoky, Renewable Energy, published by ELSEVIER, 2019 [36]), and (b) 3D view of the dimensional vorticity () for = 120 deg; (1) positive vorticity; (2) negative vorticity (reproduced with permission from Rossetti, Renewable Energy, published by ELSEVIER, 2013 [31]).
4.8. Significance of Experimental Studies in Validating CFD Codes Numerically
A photograph of the two hybrid turbines used in the experiments is presented in Figure 22a [67]. This picture offers a visual representation of the physical turbines utilized in the study. However, it is important to critically evaluate the extent to which the experimental setup accurately represents real-world conditions. Factors such as scale effects, boundary conditions, and the influence of external factors should be critically considered when assessing the turbines’ performance and characteristics based on the experimental data. By conducting a thorough analysis of these factors, the reliability and applicability of the experimental results can be ensured, providing valuable insights into the performance and behavior of the hybrid turbines.
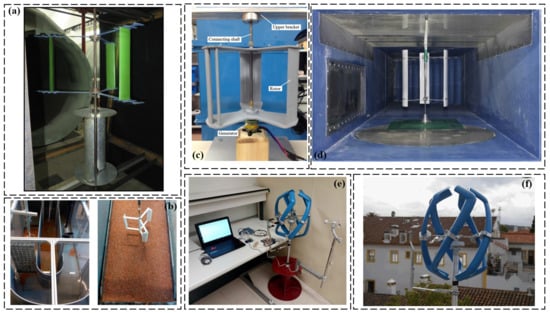
Figure 22.
(a) Photograph showing the two hybrid turbines used in the experiments (reproduced with permission from Jacob, Renewable Energy, published by ELSEVIER, 2019 [67]), (b) experimental setup of model and instrumentation (reproduced with permission from Sun, Energy Conversion and Management, published by ELSEVIER, 2018 [6]), (c) connection of the Darrieus-generator and support system (reproduced with permission from Scungio, Energy Conversion and Management, published by ELSEVIER, 2016 [83]), (d) solid plate and Darrieus turbine installed in three different wind tunnels (wind tunnel-C, blockage ratio: 24.70%) (reproduced with permission from Jeong, Journal of Wind Engineering and Industrial Aerodynamics, published by ELSEVIER, 2018 [84]), (e) prototype and sensors (reproduced with permission from Pereira, Energy, published by ELSEVIER, 2018 [85]), and (f) new Darrieus VAWT design prototype (reproduced with permission from Batista, Renewable and Sustainable Energy Reviews, published by ELSEVIER, 2015 [86]).
Figure 22b illustrates the experimental setup of the model and instrumentation [6]. While the diagram shows the arrangement and positioning of the model turbine within the experimental setup, it is important to critically assess the experimental setup’s capability to accurately reproduce real-world operating conditions. Factors such as flow uniformity, turbulence intensity, and measurement uncertainties should be critically evaluated to ensure the reliability and accuracy of the experimental data and subsequent analysis.
The connection between Darrieus, the generator, and the support system is depicted in Figure 22c [83]. The diagram highlights the mechanical interface and structural components involved in this connection. However, it is crucial to critically evaluate the design and reliability of the connection system. Factors such as structural integrity, power transmission efficiency, and maintenance requirements should be critically assessed to ensure the efficient and reliable operation of the turbine. By conducting a thorough evaluation of these factors, the turbine’s overall performance, durability, and safety can be enhanced, leading to optimized power generation and long-term operational success.
The experimental setup for studying the aerodynamic performance of a solid plate and a Darrieus turbine in three different wind tunnels, including wind tunnel-C with a blockage ratio of 24.70%, is showcased in Figure 22d [84]. The image provides a visual representation of the wind tunnel configurations used to investigate the turbine’s performance. However, it is crucial to critically assess the influence of blockage on the turbine’s aerodynamic characteristics. Factors such as flow distortion, boundary layer effects, and the representativeness of the wind tunnel conditions should be critically evaluated to ensure the validity and applicability of the results obtained. By conducting a thorough analysis of these factors, the accuracy and reliability of the experimental findings can be ensured, leading to a better understanding of the turbine’s performance under various flow conditions and enabling the development of more efficient and reliable wind energy systems.
The image in Figure 22e presents an overview of a prototype turbine and the associated sensors used for data collection in a study [85]. The image visually represents the physical turbine prototype and the sensors deployed for monitoring various parameters during operation. However, it is crucial to critically assess the accuracy and reliability of the sensors in capturing the intended measurements. Factors such as calibration procedures, measurement uncertainties, and sensor placement should be critically evaluated to ensure the accuracy and validity of the collected data. By thoroughly assessing these factors, the quality and reliability of the data can be ensured, enabling more accurate evaluations of the turbine’s performance and facilitating improvements in its design and operation.
Figure 22f shows a new prototype of a Darrieus VAWT design [86]. While the image presents the physical prototype of the turbine and its unique design features, it is important to critically assess the performance and efficiency claims associated with this new design. Factors such as computational analysis, experimental validation, and comparative studies should be critically evaluated to assess the potential improvements offered by the new design.
Stereoscopic particle image velocimetry (PIV) is indeed a sophisticated experimental technique commonly used in the field of fluid mechanics to measure and analyze flow characteristics. However, it is important to critically assess the limitations and challenges associated with the technique to ensure the reliability and validity of the experimental findings.
In Figure 23a, a schematic representation of the TUDelft Open Jet Facility is depicted [87]. The diagram provides an overview of the experimental setup used in the study. However, it is crucial to critically evaluate the representativeness of the facility in relation to real-world conditions. Factors such as scale effects, boundary conditions, and the influence of the open jet setup on the flow characteristics should be carefully considered when interpreting the results obtained from experiments conducted in this facility. By critically assessing these factors, the validity and applicability of the experimental findings can be ensured, enabling a more accurate understanding of the aerodynamic behavior and performance of the tested turbine or airfoil.
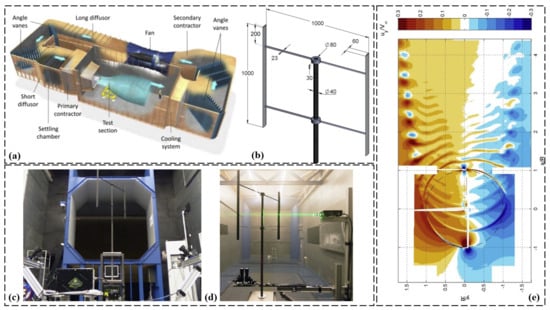
Figure 23.
Stereoscopic particle image velocimetry. (a) Schematic of the TUDelft Open Jet Facility (reproduced with permission from Tescione, Renewable Energy, published by ELSEVIER, 2014 [87]). (b) Wind turbine model (dimensions in mm) (reproduced with permission from Tescione, Renewable Energy, published by ELSEVIER, 2014 [87]). (c) Stereoscopic PIV configuration (reproduced with permission from Tescione, Renewable Energy, published by ELSEVIER, 2014 [87]). (d) Planar PIV configuration (reproduced with permission from Tescione, Renewable Energy, published by ELSEVIER, 2014 [87]). (e) Contours of normalized out of plane vorticity for the combined field of views of the horizontal plane (reproduced with permission from Tescione, Renewable Energy, published by ELSEVIER, 2014 [87]).
Figure 23b describes the wind turbine model used in the experiments, with dimensions provided in millimeters, while the image represents a scaled-down version of a wind turbine, it is important to critically assess the accuracy of the scaling and the representativeness of the model. Factors such as Reynolds number effects, model fidelity, and the extrapolation of results to full-scale turbines should be critically evaluated to ensure the applicability of the findings.
In Figure 23c, the configuration of the stereoscopic PIV setup is depicted, illustrating the arrangement of cameras and light sources [87]. However, it is crucial to critically assess the accuracy and limitations of the measurement technique employed. Factors such as calibration errors, measurement uncertainties, and the potential influence of seeding particles on the flow should be carefully evaluated to ensure the accuracy and reliability of the velocity measurements obtained through stereoscopic PIV. By critically assessing these factors, the validity and significance of the experimental data can be ensured, enabling a more accurate analysis of the flow characteristics and behavior of the tested turbine or airfoil.
Figure 23d represents the planar PIV configuration as an alternative to stereoscopic PIV, while planar PIV provides valuable information about the flow characteristics in a specific plane, it is important to critically evaluate the limitations of this technique. Factors such as the assumption of planar flow, potential flow distortion, and limitations in capturing three-dimensional flow structures should be critically considered when interpreting the results obtained using planar PIV.
The contours of normalized out-of-plane vorticity for the combined field of views of the horizontal plane are displayed in Figure 23e. While the contours provide visual insights into the vortical structures and their distribution within the horizontal plane, it is important to critically evaluate the accuracy and resolution of the vorticity measurements. Factors such as image processing techniques, noise levels, and limitations in capturing small-scale vortices should be critically assessed to ensure the reliability of the vorticity visualization.
5. The Viewpoint Regarding CFD Modeling of Darrieus Turbines
This research article advocates for the adoption of 3D modeling and advanced meshing techniques in the study of Darrieus wind turbines, highlighting the limitations of 2D modeling and the importance of comprehensive investigations. Based on expertise and findings from various research teams, it is evident that, while 2D CFD studies offer reduced computational time, they oversimplify the complex three-dimensional flow field, limiting the representation of crucial physical characteristics. This critical consideration calls for the allocation of additional computational resources to overcome this modeling challenge.
The utilization of powerful workstations with substantial RAM storage, high CPU frequency, and efficient graphics cards is essential in conducting CFD modeling for wind turbine analysis. These resources facilitate fluid domain mesh generation, expedite CFD calculations, and enable the visualization of numerical results. Although researchers often opt for 2D calculations to obtain numerically reliable results within a reasonable computation time frame, it is emphasized that the 3D flow structures generated at the blades and wake zone demand dedicated efforts in terms of calculation procedures and the adoption of 3D CFD modeling. This is particularly crucial when introducing geometric modifications to maximize the power coefficient of Darrieus.
Accurate meshing, meticulous computational grid design, and precise definition of geometric parameters are crucial in analyzing wind turbine systems’ aerodynamic behavior and performance. While different modeling approaches (2D, 2.5D, and 3D) offer valuable insights, their limitations and potential sources of uncertainty must be carefully assessed when interpreting the results. Integrating experimental validation and conducting sensitivity analyses further enhance the reliability and robustness of the findings.
The accurate modeling of wind turbine systems necessitates a critical evaluation of the methodologies employed and their associated limitations. Factors such as mesh representation, mesh distribution, computational grid, boundary layer generation, mesh sensitivity analysis, and structured grid configuration must be meticulously examined to ensure precise modeling and optimization.
This critical review emphasizes the importance of assessing the limitations and uncertainties associated with experimental visualization techniques and numerical modeling approaches. Measurement uncertainties, visualization limitations, numerical assumptions, and model limitations must be rigorously evaluated to establish the reliability, accuracy, and significance of the presented results. Such critical assessments contribute to advancing wind turbine design, optimization, and the development of efficient renewable energy systems.
To enhance the aerodynamic design of Darrieus turbines, research teams should conduct a thorough review of existing literature and incorporate advanced CFD simulations. By launching CFD calculations aimed at improving the power coefficient and properly validating turbulence models within CFD solvers, the performance of Darrieus turbines can be significantly enhanced. This approach ensures that design modifications are based on reliable and validated computational results, contributing to optimization efforts.
In conclusion, this critical review highlights the importance of critically evaluating modeling techniques, methodologies, and experimental data to advance wind turbine design and optimization. By addressing limitations and uncertainties, performing CFD simulations, and validating turbulence models, the aerodynamic performance of Darrieus turbines can be significantly improved. Such critical review and computational analysis contribute to the advancement of research in the field and the development of more efficient and effective wind energy systems.
Within the realm of 2D modeling, a wide spectrum of contours has been explored to capture the intricacies of Darrieus flow patterns. Notably, Pellone et al. [66] present vorticity distribution around Darrieus blades, shedding light on their dynamic behavior. Meanwhile, the contours from Wang et al. [49] provide valuable insights into vortex shedding and normalized velocity distribution. These contours serve as windows into the dynamic behavior of the turbine, revealing vortex dynamics, pressure coefficients, and wind deflection angles.
Advancing to the domain of 2.5D modeling, deeper insights into vortical structures emerge. Li et al. [14] illustrate vorticity contours at different span lengths during Darrieus revolution, enriching our understanding of temporal evolution. The visualization of pressure coefficients and the comparison of tip vortices shedding from the blade end winglet, as presented by Balduzzi et al. [16], provide an enriched perspective on flow behavior.
Transitioning to the realm of 3D modeling, the contours portrayed here offer a multidimensional insight into Darrieus aerodynamics. Notably, Rossetti et al. [31] provide a 3D view of dimensional vorticity, highlighting its volumetric structures. Additionally, contours from Joo et al. [34] depict the velocity distribution and streamlines in the 3D model. These visual representations provide a comprehensive view of aerodynamic efficiency, encompassing pressure distribution, velocity profiles, and wake dynamics.
6. Conclusions
This critical analysis, part of the “critical review issue,” has extensively explored the capability of CFD modeling to simulate and replicate the intricate flow patterns observed in Darrieus VAWTs. By investigating diverse CFD approaches—2D, 2.5D, and 3D simulations—within a specific velocity ratio () range, a comprehensive comprehension of the challenges associated with accurately capturing the aerodynamic behavior and vortex structures of Darrieus turbines has been achieved. The key results are listed as follows:
- An in-depth analysis of over 250 published articles has yielded a comprehensive compilation of findings, shedding light on the evolution of crucial parameters, including the power coefficient (), moment coefficient (), lift coefficient (), drag coefficient (), velocity distributions, pressure fields, vorticity patterns, turbulent kinetic energy production and dissipation, streamlines, and Q-criterion of the vorticity;
- Notably, the influence of commonly used turbulence models on the power coefficient () values has been elucidated, substantiated by illustrative figures that underscore the impact of modeling choices;
- Addressing the prevalent use of 2D CFD modeling, primarily due to its computational efficiency, this review recognizes its advantages while highlighting the limitations inherent in capturing turbulent flow structures resulting from geometric alterations. Comprehensive CFD contour plots underscore these limitations, emphasizing the need for enhanced modeling approaches.
In conclusion, this comprehensive examination advances our understanding of CFD modeling for Darrieus turbines, offering a concise yet comparative evaluation of distinct modeling strategies. By unveiling the disparities among 2D, 2.5D, and 3D simulations and their ramifications for flow prediction and replication, this study aids in selecting the most appropriate modeling approach to ensure accurate and dependable predictions in the realm of VAWTs. The discerned insights hold significant value for researchers and practitioners, empowering them in the pursuit of refined design and optimal performance enhancement of Darrieus VAWTs.
Author Contributions
S.e.-D.F.: Conceptualization, Methodology, Validation, Investigation, Resources, Writing—Original Draft, Writing—Review and Editing, Visualization and Project administration. T.B.: Methodology, Validation, Investigation, Resources. A.K.: Methodology, Validation, Investigation, Resources. A.S.: Methodology, Validation, Investigation, Resources. I.K.: Methodology, Validation, Investigation, Resources. E.B.: Methodology, Validation, Investigation, Resources, Writing—Original Draft—Review. All authors have read and agreed to the published version of the manuscript.
Funding
This research received no external funding.
Data Availability Statement
In this study, no new data were generated. The analysis was conducted based on existing publicly available data and previously published research. Researchers interested in accessing the data used in this study can refer to the sources and references cited in the manuscript.
Acknowledgments
The corresponding author, Saïf ed-Dîn Fertahi, would like to take this opportunity to express sincere gratitude to the editor and reviewers for their valuable remarks that have greatly enhanced the quality of this CFD modeling study.
Conflicts of Interest
The authors declare that they have no known competing financial interests or personal relationships that could have influenced the work reported in this paper.
Nomenclature
| A | Area Swept by Darrieus (m) |
| R | Darrieus Radius (m) |
| Re | Reynolds Number |
| Drag Coefficient | |
| Lift Coefficient | |
| Moment Coefficient | |
| Power Coefficient | |
| g | Acceleration Due to Gravity Vector (m/s) |
| P | Pressure (Pa) |
| Torque on the Wind Turbine (N.m) | |
| Upstream Flow Velocity (m/s) | |
| Tangential Component of Relative Velocity (m/s) | |
| Normal Component of Relative Velocity (m/s) | |
| y | Dimensionless Wall Distance |
| Greek symbols | |
| Dynamic Viscosity (kg/(m.s)) | |
| Darrieus Angular Velocity (rad/s) | |
| Fluid Density (kg/m) | |
| Angle of Attack (degrees) | |
| Tip Speed Ratio | |
| k--SST | Shear Stress Transport turbulence model |
| k- | Turbulence Model |
| Abbreviations | |
| 2.5D | Two-and-a-Half Dimensional |
| 2D | Two-Dimensional |
| 3D | Three-Dimensional |
| 6DOF | Six Degrees of Freedom |
| CAD | Computer-Aided Design |
| CFD | Computational Fluid Dynamics |
| CPU | Central Processing Unit |
| DES | Detached-Eddy Simulation |
| FEVDTM | Free Vortex Element (FVE) Doublet Theory Model |
| FSI | Fluid–Structure Interaction |
| LES | Large Eddy Simulation |
| LES-SGS | Large Eddy Simulation with Sub-Grid Scale model |
| MRF | Multiple Reference Frame |
| NACA | National Advisory Committee for Aeronautics |
| PIV | Particle Image Velocimetry |
| RAM | Random Access Memory |
| RPM | Rotations Per Minute |
| SGS | Sub-Grid Scale model |
| SST | Shear Stress Transport |
| TSR | Tip Speed Ratio |
| TSST | Turbulent Scale Simulation Transport model |
| VAWT | Vertical Axis Wind Turbine |
References
- Bianchini, A.; Balduzzi, F.; Di Rosa, D.; Ferrara, G. On the use of Gurney Flaps for the aerodynamic performance augmentation of Darrieus wind turbines. Energy Convers. Manag. 2019, 184, 402–415. [Google Scholar] [CrossRef]
- Scopus Preview. Welcome to Scopus Preview. 2023. Available online: https://www.scopus.com/home.uri (accessed on 6 August 2023).
- Rosander, M. SeaTwirl: The Future of Offshore Floating Wind Turbines. ANSYS Case Study 2018. Available online: https://www.ansys.com/-/media/ansys/corporate/resourcelibrary/casestudy/seatwirl.pdf (accessed on 20 March 2020).
- Li, S.; Li, Y.; Yang, C.; Wang, Q.; Zhao, B.; Li, D.; Zhao, R.; Ren, T.; Zheng, X.; Gao, Z.; et al. Experimental investigation of solidity and other characteristics on dual vertical axis wind turbines in an urban environment. Energy Convers. Manag. 2021, 229, 113689. [Google Scholar] [CrossRef]
- Rezaeiha, A.; Montazeri, H.; Blocken, B. A framework for preliminary large-scale urban wind energy potential assessment: Roof-mounted wind turbines. Energy Convers. Manag. 2020, 214, 112770. [Google Scholar] [CrossRef]
- Sun, C.; Lam, W.H.; Cui, Y.; Zhang, T.; Jiang, J.; Guo, J.; Ma, Y.; Wang, S.; Tan, T.H.; Chuah, J.H.; et al. Empirical model for Darrieus-type tidal current turbine induced seabed scour. Energy Convers. Manag. 2018, 171, 478–490. [Google Scholar] [CrossRef]
- Erkan, O.; Özkan, M.; Karakoç, T.H.; Garrett, S.J.; Thomas, P.J. Investigation of aerodynamic performance characteristics of a wind-turbine-blade profile using the finite-volume method. Renew. Energy 2020, 161, 1359–1367. [Google Scholar] [CrossRef]
- Daróczy, L.; Janiga, G.; Petrasch, K.; Webner, M.; Thévenin, D. Comparative analysis of turbulence models for the aerodynamic simulation of H-Darrieus rotors. Energy 2015, 90, 680–690. [Google Scholar] [CrossRef]
- Nguyen, M.T.; Balduzzi, F.; Bianchini, A.; Ferrara, G.; Goude, A. Evaluation of the unsteady aerodynamic forces acting on a vertical-axis turbine by means of numerical simulations and open site experiments. J. Wind. Eng. Ind. Aerodyn. 2020, 198, 104093. [Google Scholar] [CrossRef]
- Trivellato, F.; Castelli, M.R. Appraisal of Strouhal number in wind turbine engineering. Renew. Sustain. Energy Rev. 2015, 49, 795–804. [Google Scholar] [CrossRef]
- Tian, W.; Song, B.; Mao, Z. Numerical investigation of wind turbines and turbine arrays on highways. Renew. Energy 2020, 147, 384–398. [Google Scholar] [CrossRef]
- Gavalda, J.; Massons, J.; Diaz, F. Experimental study on a self-adapting Darrieus—Savonius wind machine. Sol. Wind. Technol. 1990, 7, 457–461. [Google Scholar] [CrossRef]
- Ponta, F.L.; Jacovkis, P.M. A vortex model for Darrieus turbine using finite element techniques. Renew. Energy 2001, 24, 1–18. [Google Scholar] [CrossRef]
- Li, C.; Zhu, S.; Xu, Y.-l.; Xiao, Y. 2.5D large eddy simulation of vertical axis wind turbine in consideration of high angle of attack flow. Renew. Energy 2013, 51, 317–330. [Google Scholar] [CrossRef]
- Saini, G.; Saini, R. A computational investigation to analyze the effects of different rotor parameters on hybrid hydrokinetic turbine performance. Ocean Eng. 2020, 199, 107019. [Google Scholar] [CrossRef]
- Balduzzi, F.; Drofelnik, J.; Bianchini, A.; Ferrara, G.; Ferrari, L.; Campobasso, M.S. Darrieus wind turbine blade unsteady aerodynamics: A three-dimensional Navier-Stokes CFD assessment. Energy 2017, 128, 550–563. [Google Scholar] [CrossRef]
- Ghosh, A.; Biswas, A.; Sharma, K.; Gupta, R. Computational analysis of flow physics of a combined three bladed Darrieus Savonius wind rotor. J. Energy Inst. 2015, 88, 425–437. [Google Scholar] [CrossRef]
- Karimian, S.; Abdolahifar, A. Performance investigation of a new Darrieus vertical axis wind turbine. Energy 2020, 191, 116551. [Google Scholar] [CrossRef]
- Bianchini, A.; Ferrara, G.; Ferrari, L. Design guidelines for H-Darrieus wind turbines: Optimization of the annual energy yield. Energy Convers. Manag. 2015, 89, 690–707. [Google Scholar] [CrossRef]
- Patil, R.; Daróczy, L.; Janiga, G.; Thévenin, D. Large eddy simulation of an H-Darrieus rotor. Energy 2018, 160, 388–398. [Google Scholar] [CrossRef]
- Wang, Y.; Sun, X.; Dong, X.; Zhu, B.; Huang, D.; Zheng, Z. Numerical investigation on aerodynamic performance of a novel vertical axis wind turbine with adaptive blades. Energy Convers. Manag. 2016, 108, 275–286. [Google Scholar] [CrossRef]
- Balduzzi, F.; Bianchini, A.; Maleci, R.; Ferrara, G.; Ferrari, L. Critical issues in the CFD simulation of Darrieus wind turbines. Renew. Energy 2016, 85, 419–435. [Google Scholar] [CrossRef]
- Hand, B.; Kelly, G.; Cashman, A. Numerical simulation of a vertical axis wind turbine airfoil experiencing dynamic stall at high Reynolds numbers. Comput. Fluids 2017, 149, 12–30. [Google Scholar] [CrossRef]
- Arab, A.; Javadi, M.; Anbarsooz, M.; Moghiman, M. A numerical study on the aerodynamic performance and the self-starting characteristics of a Darrieus wind turbine considering its moment of inertia. Renew. Energy 2017, 107, 298–311. [Google Scholar] [CrossRef]
- Celik, Y.; Ma, L.; Ingham, D.; Pourkashanian, M. Aerodynamic investigation of the start-up process of H-type vertical axis wind turbines using CFD. J. Wind. Eng. Ind. Aerodyn. 2020, 204, 104252. [Google Scholar] [CrossRef]
- Bakhumbsh, S.A.; Mohamed, M.H. Effect of micro-cylinder as a passive controller on the Darrieus wind turbine performance. Ocean Eng. 2022, 266, 113118. [Google Scholar] [CrossRef]
- Tigabu, M.T.; Khalid, M.S.U.; Wood, D.; Admasu, B.T. Some effects of turbine inertia on the starting performance of vertical-axis hydrokinetic turbine. Ocean Eng. 2022, 252, 111143. [Google Scholar] [CrossRef]
- Nguyen, M.T.; Balduzzi, F.; Goude, A. Effect of pitch angle on power and hydrodynamics of a vertical axis turbine. Ocean Eng. 2021, 238, 109335. [Google Scholar] [CrossRef]
- Rezaeiha, A.; Montazeri, H.; Blocken, B. CFD analysis of dynamic stall on vertical axis wind turbines using Scale-Adaptive Simulation (SAS): Comparison against URANS and hybrid RANS/LES. Energy Convers. Manag. 2019, 196, 1282–1298. [Google Scholar] [CrossRef]
- He, J.; Jin, X.; Xie, S.; Cao, L.; Wang, Y.; Lin, Y.; Wang, N. CFD modeling of varying complexity for aerodynamic analysis of H-vertical axis wind turbines. Renew. Energy 2020, 145, 2658–2670. [Google Scholar] [CrossRef]
- Rossetti, A.; Pavesi, G. Comparison of different numerical approaches to the study of the H-Darrieus turbines start-up. Renew. Energy 2013, 50, 7–19. [Google Scholar] [CrossRef]
- Castelli, M.R.; Dal Monte, A.; Quaresimin, M.; Benini, E. Numerical evaluation of aerodynamic and inertial contributions to Darrieus wind turbine blade deformation. Renew. Energy 2013, 51, 101–112. [Google Scholar] [CrossRef]
- Le, T.Q.; Lee, K.-S.; Park, J.-S.; Ko, J.H. Flow-driven rotor simulation of vertical axis tidal turbines: A comparison of helical and straight blades. Int. J. Nav. Archit. Ocean Eng. 2014, 6, 257–268. [Google Scholar] [CrossRef]
- Joo, S.; Choi, H.; Lee, J. Aerodynamic characteristics of two-bladed H-Darrieus at various solidities and rotating speeds. Energy 2015, 90, 439–451. [Google Scholar] [CrossRef]
- Dessoky, A.; Bangga, G.; Lutz, T.; Krämer, E. Aerodynamic and aeroacoustic performance assessment of H-rotor Darrieus VAWT equipped with wind-lens technology. Energy 2019, 175, 76–97. [Google Scholar] [CrossRef]
- Dessoky, A.; Lutz, T.; Bangga, G.; Krämer, E. Computational studies on Darrieus VAWT noise mechanisms employing a high order DDES model. Renew. Energy 2019, 143, 404–425. [Google Scholar] [CrossRef]
- Clary, V.; Oudart, T.; Larroudé, P.; Sommeria, J.; Maître, T. An optimally-controlled RANS actuator force model for efficient computations of tidal turbine arrays. Ocean Eng. 2020, 212, 107677. [Google Scholar] [CrossRef]
- Su, J.; Chen, Y.; Han, Z.; Zhou, D.; Bao, Y.; Zhao, Y. Investigation of V-shaped blade for the performance improvement of vertical axis wind turbines. Appl. Energy 2020, 260, 114326. [Google Scholar] [CrossRef]
- Ahmad, M.; Shahzad, A.; Akram, F.; Ahmad, F.; Shah, S.I.A. Design optimization of Double-Darrieus hybrid vertical axis wind turbine. Ocean Eng. 2022, 254, 111171. [Google Scholar] [CrossRef]
- Hashem, I.; Mohamed, M. Aerodynamic performance enhancements of H-rotor Darrieus wind turbine. Energy 2018, 142, 531–545. [Google Scholar] [CrossRef]
- Asr, M.T.; Nezhad, E.Z.; Mustapha, F.; Wiriadidjaja, S. Study on start-up characteristics of H-Darrieus vertical axis wind turbines comprising NACA 4-digit series blade airfoils. Energy 2016, 112, 528–537. [Google Scholar] [CrossRef]
- Mohamed, M.; Dessoky, A.; Alqurashi, F. Blade shape effect on the behavior of the H-rotor Darrieus wind turbine: Performance investigation and force analysis. Energy 2019, 179, 1217–1234. [Google Scholar] [CrossRef]
- Bedon, G.; Betta, S.D.; Benini, E. Performance-optimized airfoil for Darrieus wind turbines. Renew. Energy 2016, 94, 328–340. [Google Scholar] [CrossRef]
- Malipeddi, A.; Chatterjee, D. Influence of duct geometry on the performance of Darrieus hydroturbine. Renew. Energy 2012, 43, 292–300. [Google Scholar] [CrossRef]
- Torresi, M.; Fortunato, B.; Camporeale, S.M. Numerical investigation of a Darrieus rotor for low-head hydropower generation. Procedia Comput. Sci. 2013, 19, 728–735. [Google Scholar] [CrossRef]
- Mohamed, M. Performance investigation of H-rotor Darrieus turbine with new airfoil shapes. Energy 2012, 47, 522–530. [Google Scholar] [CrossRef]
- Mohamed, M.; Ali, A.; Hafiz, A. CFD analysis for H-rotor Darrieus turbine as a low speed wind energy converter. Eng. Sci. Technol. Int. J. 2015, 18, 1–13. [Google Scholar] [CrossRef]
- Balduzzi, F.; Bianchini, A.; Ferrara, G.; Ferrari, L. Dimensionless numbers for the assessment of mesh and timestep requirements in CFD simulations of Darrieus wind turbines. Energy 2016, 97, 246–261. [Google Scholar] [CrossRef]
- Wang, Y.; Sun, X.; Zhu, B.; Zhang, H.; Huang, D. Effect of blade vortex interaction on performance of Darrieus-type cross flow marine current turbine. Renew. Energy 2016, 86, 316–323. [Google Scholar] [CrossRef]
- Chen, J.; Yang, H.; Yang, M.; Xu, H. The effect of the opening ratio and location on the performance of a novel vertical axis Darrieus turbine. Energy 2015, 89, 819–834. [Google Scholar] [CrossRef]
- Sengupta, A.; Biswas, A.; Gupta, R. Studies of some high solidity symmetrical and unsymmetrical blade H-Darrieus rotors with respect to starting characteristics, dynamic performances and flow physics in low wind streams. Renew. Energy 2016, 93, 536–547. [Google Scholar] [CrossRef]
- Mabrouk, I.B.; Hami, A.E.; Walha, L.; Zghal, B.; Haddar, M. Dynamic vibrations in wind energy systems: Application to vertical axis wind turbine. Mech. Syst. Signal Process. 2017, 85, 396–414. [Google Scholar] [CrossRef]
- Zamani, M.; Maghrebi, M.J.; Varedi, S.R. Starting torque improvement using J-shaped straight-bladed Darrieus vertical axis wind turbine by means of numerical simulation. Renew. Energy 2016, 95, 109–126. [Google Scholar] [CrossRef]
- Zamani, M.; Nazari, S.; Moshizi, S.A.; Maghrebi, M.J. Three dimensional simulation of J-shaped Darrieus vertical axis wind turbine. Energy 2016, 116, 1243–1255. [Google Scholar] [CrossRef]
- Qamar, S.B.; Janajreh, I. A comprehensive analysis of solidity for cambered Darrieus VAWTs. Int. J. Hydrog. Energy 2017, 42, 19420–19431. [Google Scholar] [CrossRef]
- Bianchini, A.; Balduzzi, F.; Bachant, P.; Ferrara, G.; Ferrari, L. Effectiveness of two-dimensional CFD simulations for Darrieus VAWTs: A combined numerical and experimental assessment. Energy Convers. Manag. 2017, 136, 318–328. [Google Scholar] [CrossRef]
- Shaheen, M.; Abdallah, S. Efficient clusters and patterned farms for Darrieus wind turbines. Sustain. Energy Technol. Assess. 2017, 19, 125–135. [Google Scholar] [CrossRef]
- Sobhani, E.; Ghaffari, M.; Maghrebi, M.J. Numerical investigation of dimple effects on Darrieus vertical axis wind turbine. Energy 2017, 133, 231–241. [Google Scholar] [CrossRef]
- Shaaban, S.; Albatal, A.; Mohamed, M. Optimization of H-Rotor Darrieus turbines’ mutual interaction in staggered arrangements. Renew. Energy 2018, 125, 87–99. [Google Scholar] [CrossRef]
- Ali, S.; Lee, S.-M.; Jang, C.-M. Effects of instantaneous tangential velocity on the aerodynamic performance of an H-Darrieus wind turbine. Energy Convers. Manag. 2018, 171, 1322–1338. [Google Scholar] [CrossRef]
- Patel, V.; Eldho, T.; Prabhu, S. Experimental investigations on Darrieus straight blade turbine for tidal current application and parametric optimization for hydro farm arrangement. Int. J. Mar. Energy 2017, 17, 110–135. [Google Scholar] [CrossRef]
- Barnes, A.; Hughes, B. Determining the impact of VAWT farm configurations on power output. Renew. Energy 2019, 143, 1111–1120. [Google Scholar] [CrossRef]
- Xu, W.; Li, G.; Wang, F.; Li, Y. High-resolution numerical investigation into the effects of winglet on the aerodynamic performance for a three-dimensional vertical axis wind turbine. Energy Convers. Manag. 2020, 205, 112333. [Google Scholar] [CrossRef]
- Saha, U.K.; Jain, S. On the influence of blade thickness-to-chord ratio on dynamic stall phenomenon in H-type Darrieus wind rotors. Energy Convers. Manag. 2020, 218, 113024. [Google Scholar] [CrossRef]
- Castelli, M.R.; Englaro, A.; Benini, E. The Darrieus wind turbine: Proposal for a new performance prediction model based on CFD. Energy 2011, 36, 4919–4934. [Google Scholar] [CrossRef]
- Maître, T.; Amet, E.; Pellone, C. Modeling of the flow in a Darrieus water turbine: Wall grid refinement analysis and comparison with experiments. Renew. Energy 2013, 51, 497–512. [Google Scholar] [CrossRef]
- Jacob, J.; Chatterjee, D. Design methodology of hybrid turbine towards better extraction of wind energy. Renew. Energy 2019, 131, 625–643. [Google Scholar] [CrossRef]
- Atlaschian, O.; Metzger, M. Numerical model of vertical axis wind turbine performance in realistic gusty wind conditions. Renew. Energy 2021, 165, 211–223. [Google Scholar] [CrossRef]
- Fluent, A. Ansys Fluent Theory Guide; ANSYS Inc.: Canonsburg, PA, USA, 2020; pp. 1–1026. [Google Scholar]
- Ansys Inc. Ansys Fluent 2020 R1 User’s Guide, 11.6.5. Six DOF Solver Settings, 11.6.5.1. Setting Rigid Body Motion Attributes for the Six DOF Solver. 2020. Available online: https://www.ansys.com/ (accessed on 14 February 2020).
- Ni, L.; Miao, W.; Li, C.; Liu, Q. Impacts of Gurney flap and solidity on the aerodynamic performance of vertical axis wind turbines in array configurations. Energy 2021, 215, 118915. [Google Scholar] [CrossRef]
- Hosseini, A.; Goudarzi, N. Design and CFD study of a hybrid vertical-axis wind turbine by employing a combined Bach-type and H-Darrieus rotor systems. Energy Convers. Manag. 2019, 189, 49–59. [Google Scholar] [CrossRef]
- Siddiqui, M.S.; Khalid, M.H.; Zahoor, R.; Butt, F.S.; Saeed, M.; Badar, A.W. A numerical investigation to analyze effect of turbulence and ground clearance on the performance of a roof top vertical–axis wind turbine. Renew. Energy 2021, 164, 978–989. [Google Scholar] [CrossRef]
- Mohamed, M. Criticism study of J-Shaped Darrieus wind turbine: Performance evaluation and noise generation assessment. Energy 2019, 177, 367–385. [Google Scholar] [CrossRef]
- Mabrouk, I.B.; El Hami, A. Dynamic response analysis of Darrieus wind turbine geared transmission system with unsteady wind inflow. Renew. Energy 2019, 131, 482–493. [Google Scholar] [CrossRef]
- Sengupta, A.; Biswas, A.; Gupta, R. Comparison of low wind speed aerodynamics of unsymmetrical blade H Darrieus rotors blade camber and curvature signatures for performance improvement. Renew. Energy 2019, 139, 1412–1427. [Google Scholar] [CrossRef]
- Claessens, M.C. The Design and Testing of Airfoils for Application in Small Vertical Axis Wind Turbines. Master’s Thesis, Delft University of Technology, Delft, The Netherlands, 2006. [Google Scholar]
- Sun, X.; Wang, Y.; An, Q.; Cao, Y.; Wu, G.; Huang, D. Aerodynamic performance and characteristic of vortex structures for Darrieus wind turbine. I. Numerical method and aerodynamic performance. J. Renew. Sustain. Energy 2014, 6. [Google Scholar] [CrossRef]
- Raciti Castelli, M.; Ardizzon, G.; Battisti, L.; Benini, E.; Pavesi, G. Modeling strategy and numerical validation for a Darrieus vertical axis micro-wind turbine. ASME Int. Mech. Eng. Congr. Expo. 2010, 44441, 409–418. [Google Scholar]
- Jain, P.; Abhishek, A. Performance prediction and fundamental understanding of small scale vertical axis wind turbine with variable amplitude blade pitching. Renew. Energy 2016, 97, 97–113. [Google Scholar] [CrossRef]
- Elkhoury, M.; Kiwata, T.; Aoun, E. Experimental and numerical investigation of a three-dimensional vertical-axis wind turbine with variable-pitch. J. Wind. Eng. Ind. Aerodyn. 2015, 139, 111–123. [Google Scholar] [CrossRef]
- Tunio, I.A.; Shah, M.A.; Hussain, T.; Harijan, K.; Mirjat, N.H.; Memon, A.H. Investigation of duct augmented system effect on the overall performance of straight blade Darrieus hydrokinetic turbine. Renew. Energy 2020, 153, 143–154. [Google Scholar] [CrossRef]
- Scungio, M.; Arpino, F.; Focanti, V.; Profili, M.; Rotondi, M. Wind tunnel testing of scaled models of a newly developed Darrieus-style vertical axis wind turbine with auxiliary straight blades. Energy Convers. Manag. 2016, 130, 60–70. [Google Scholar] [CrossRef]
- Jeong, H.; Lee, S.; Kwon, S.-D. Blockage corrections for wind tunnel tests conducted on a Darrieus wind turbine. J. Wind. Eng. Ind. Aerodyn. 2018, 179, 229–239. [Google Scholar] [CrossRef]
- Pereira, T.; Batista, N.; Fonseca, A.; Cardeira, C.; Oliveira, P.; Melicio, R. Darrieus wind turbine prototype: Dynamic modeling parameter identification and control analysis. Energy 2018, 159, 961–976. [Google Scholar] [CrossRef]
- Batista, N.; Melício, R.; Mendes, V.; Calderón, M.; Ramiro, A. On a self-start Darrieus wind turbine: Blade design and field tests. Renew. Sustain. Energy Rev. 2015, 52, 508–522. [Google Scholar] [CrossRef]
- Tescione, G.; Ragni, D.; He, C.; Ferreira, C.S.; Van Bussel, G. Near wake flow analysis of a vertical axis wind turbine by stereoscopic particle image velocimetry. Renew. Energy 2014, 70, 47–61. [Google Scholar] [CrossRef]

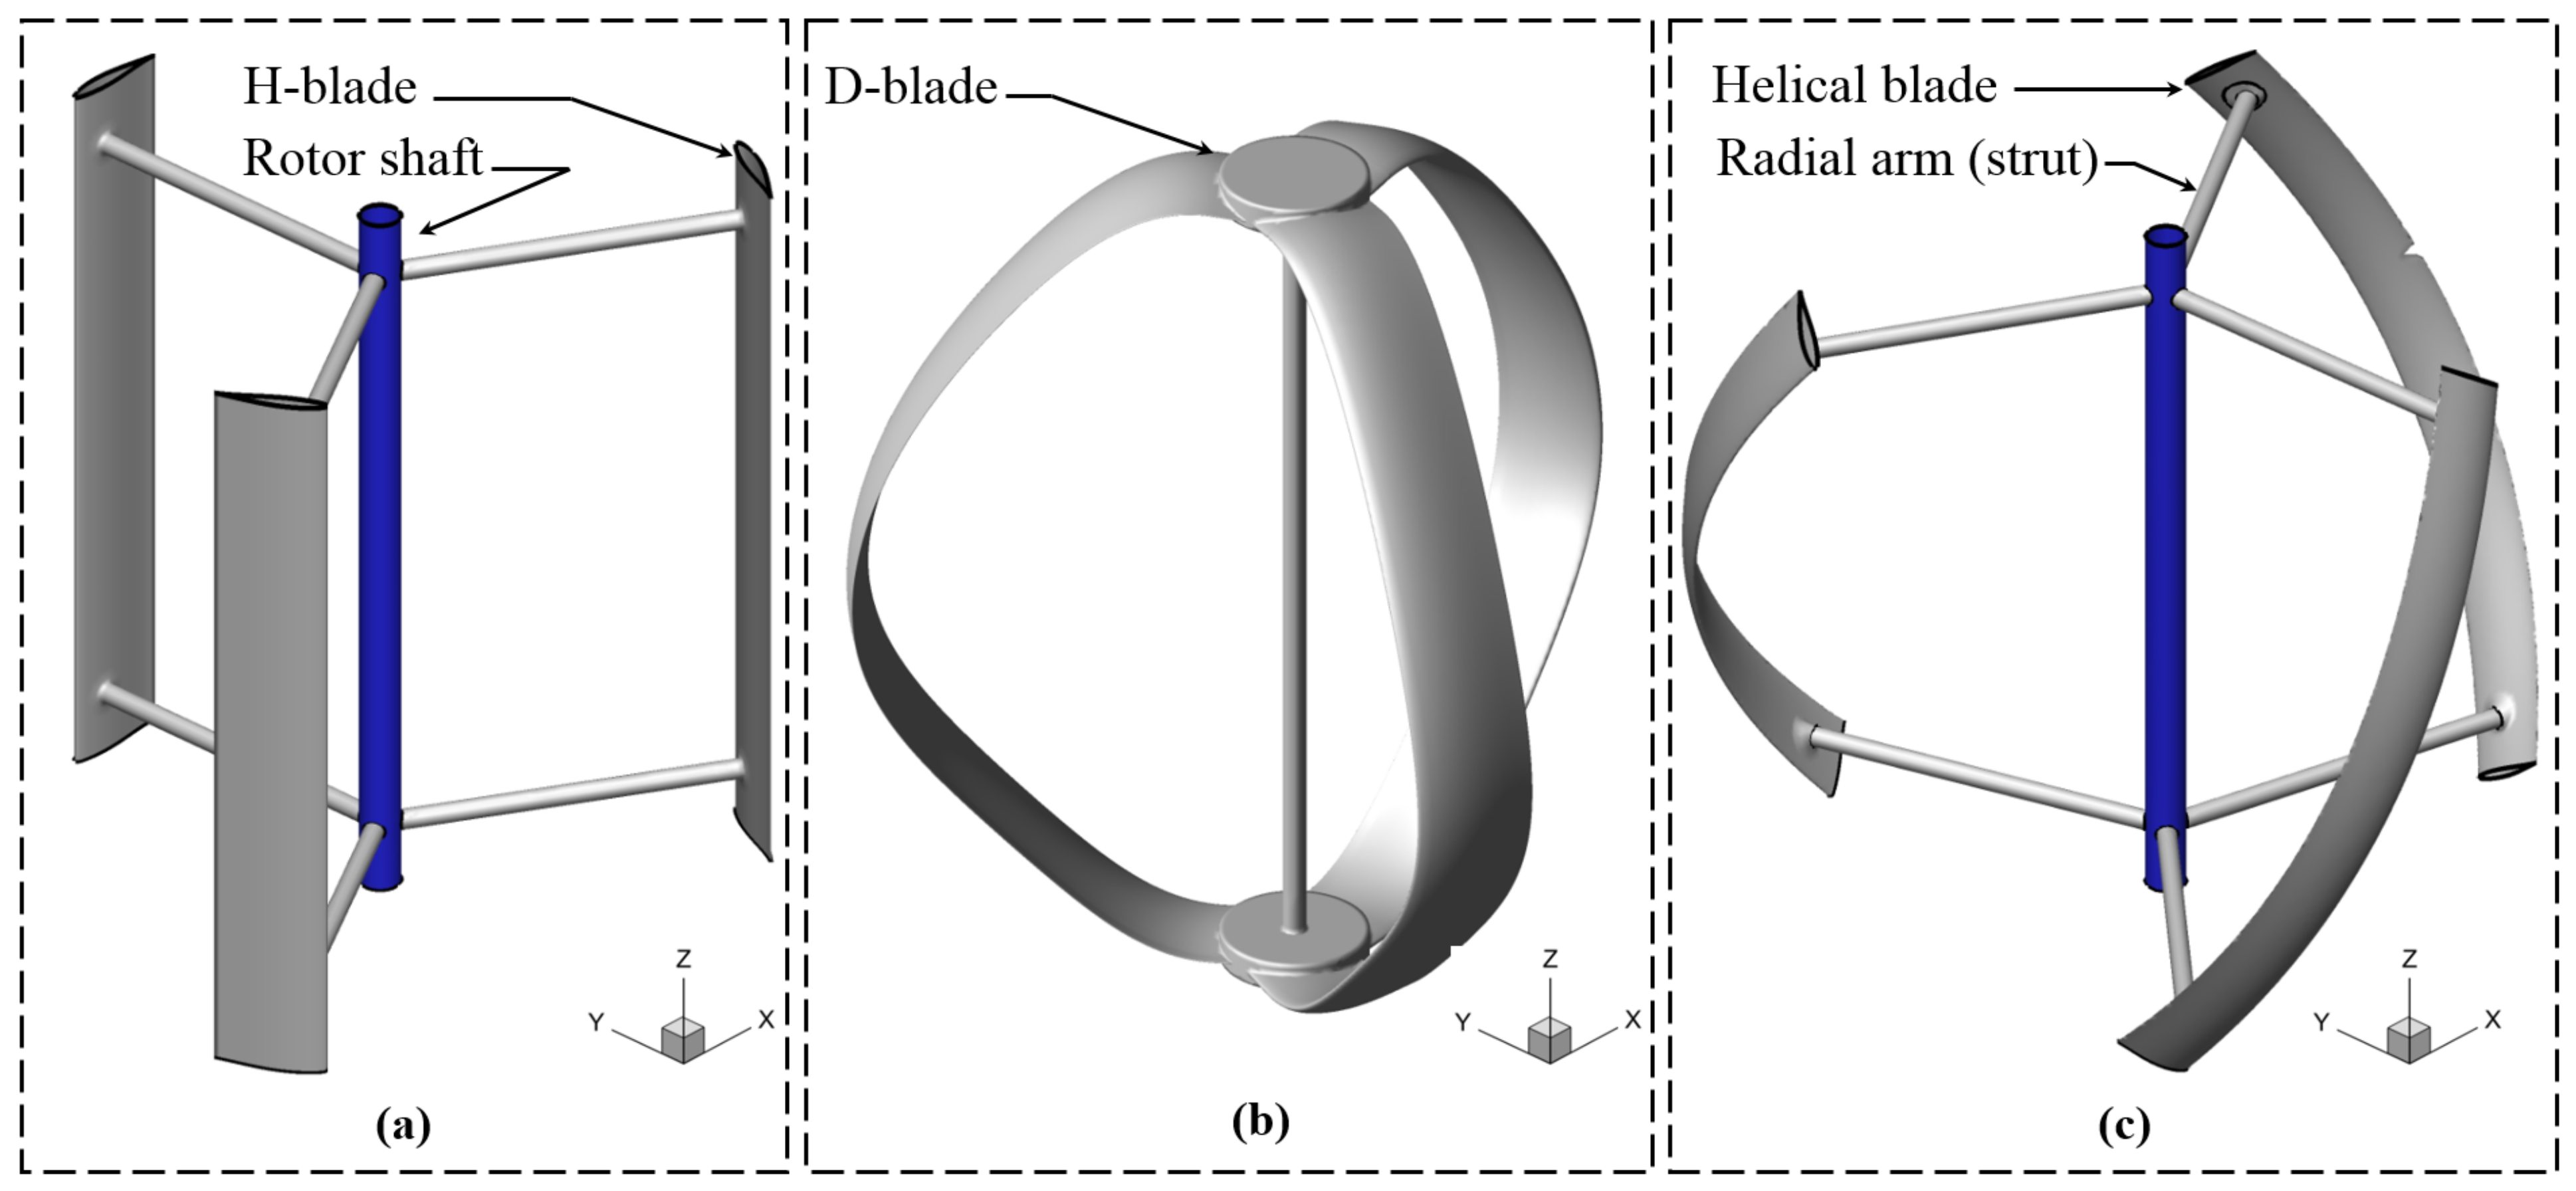
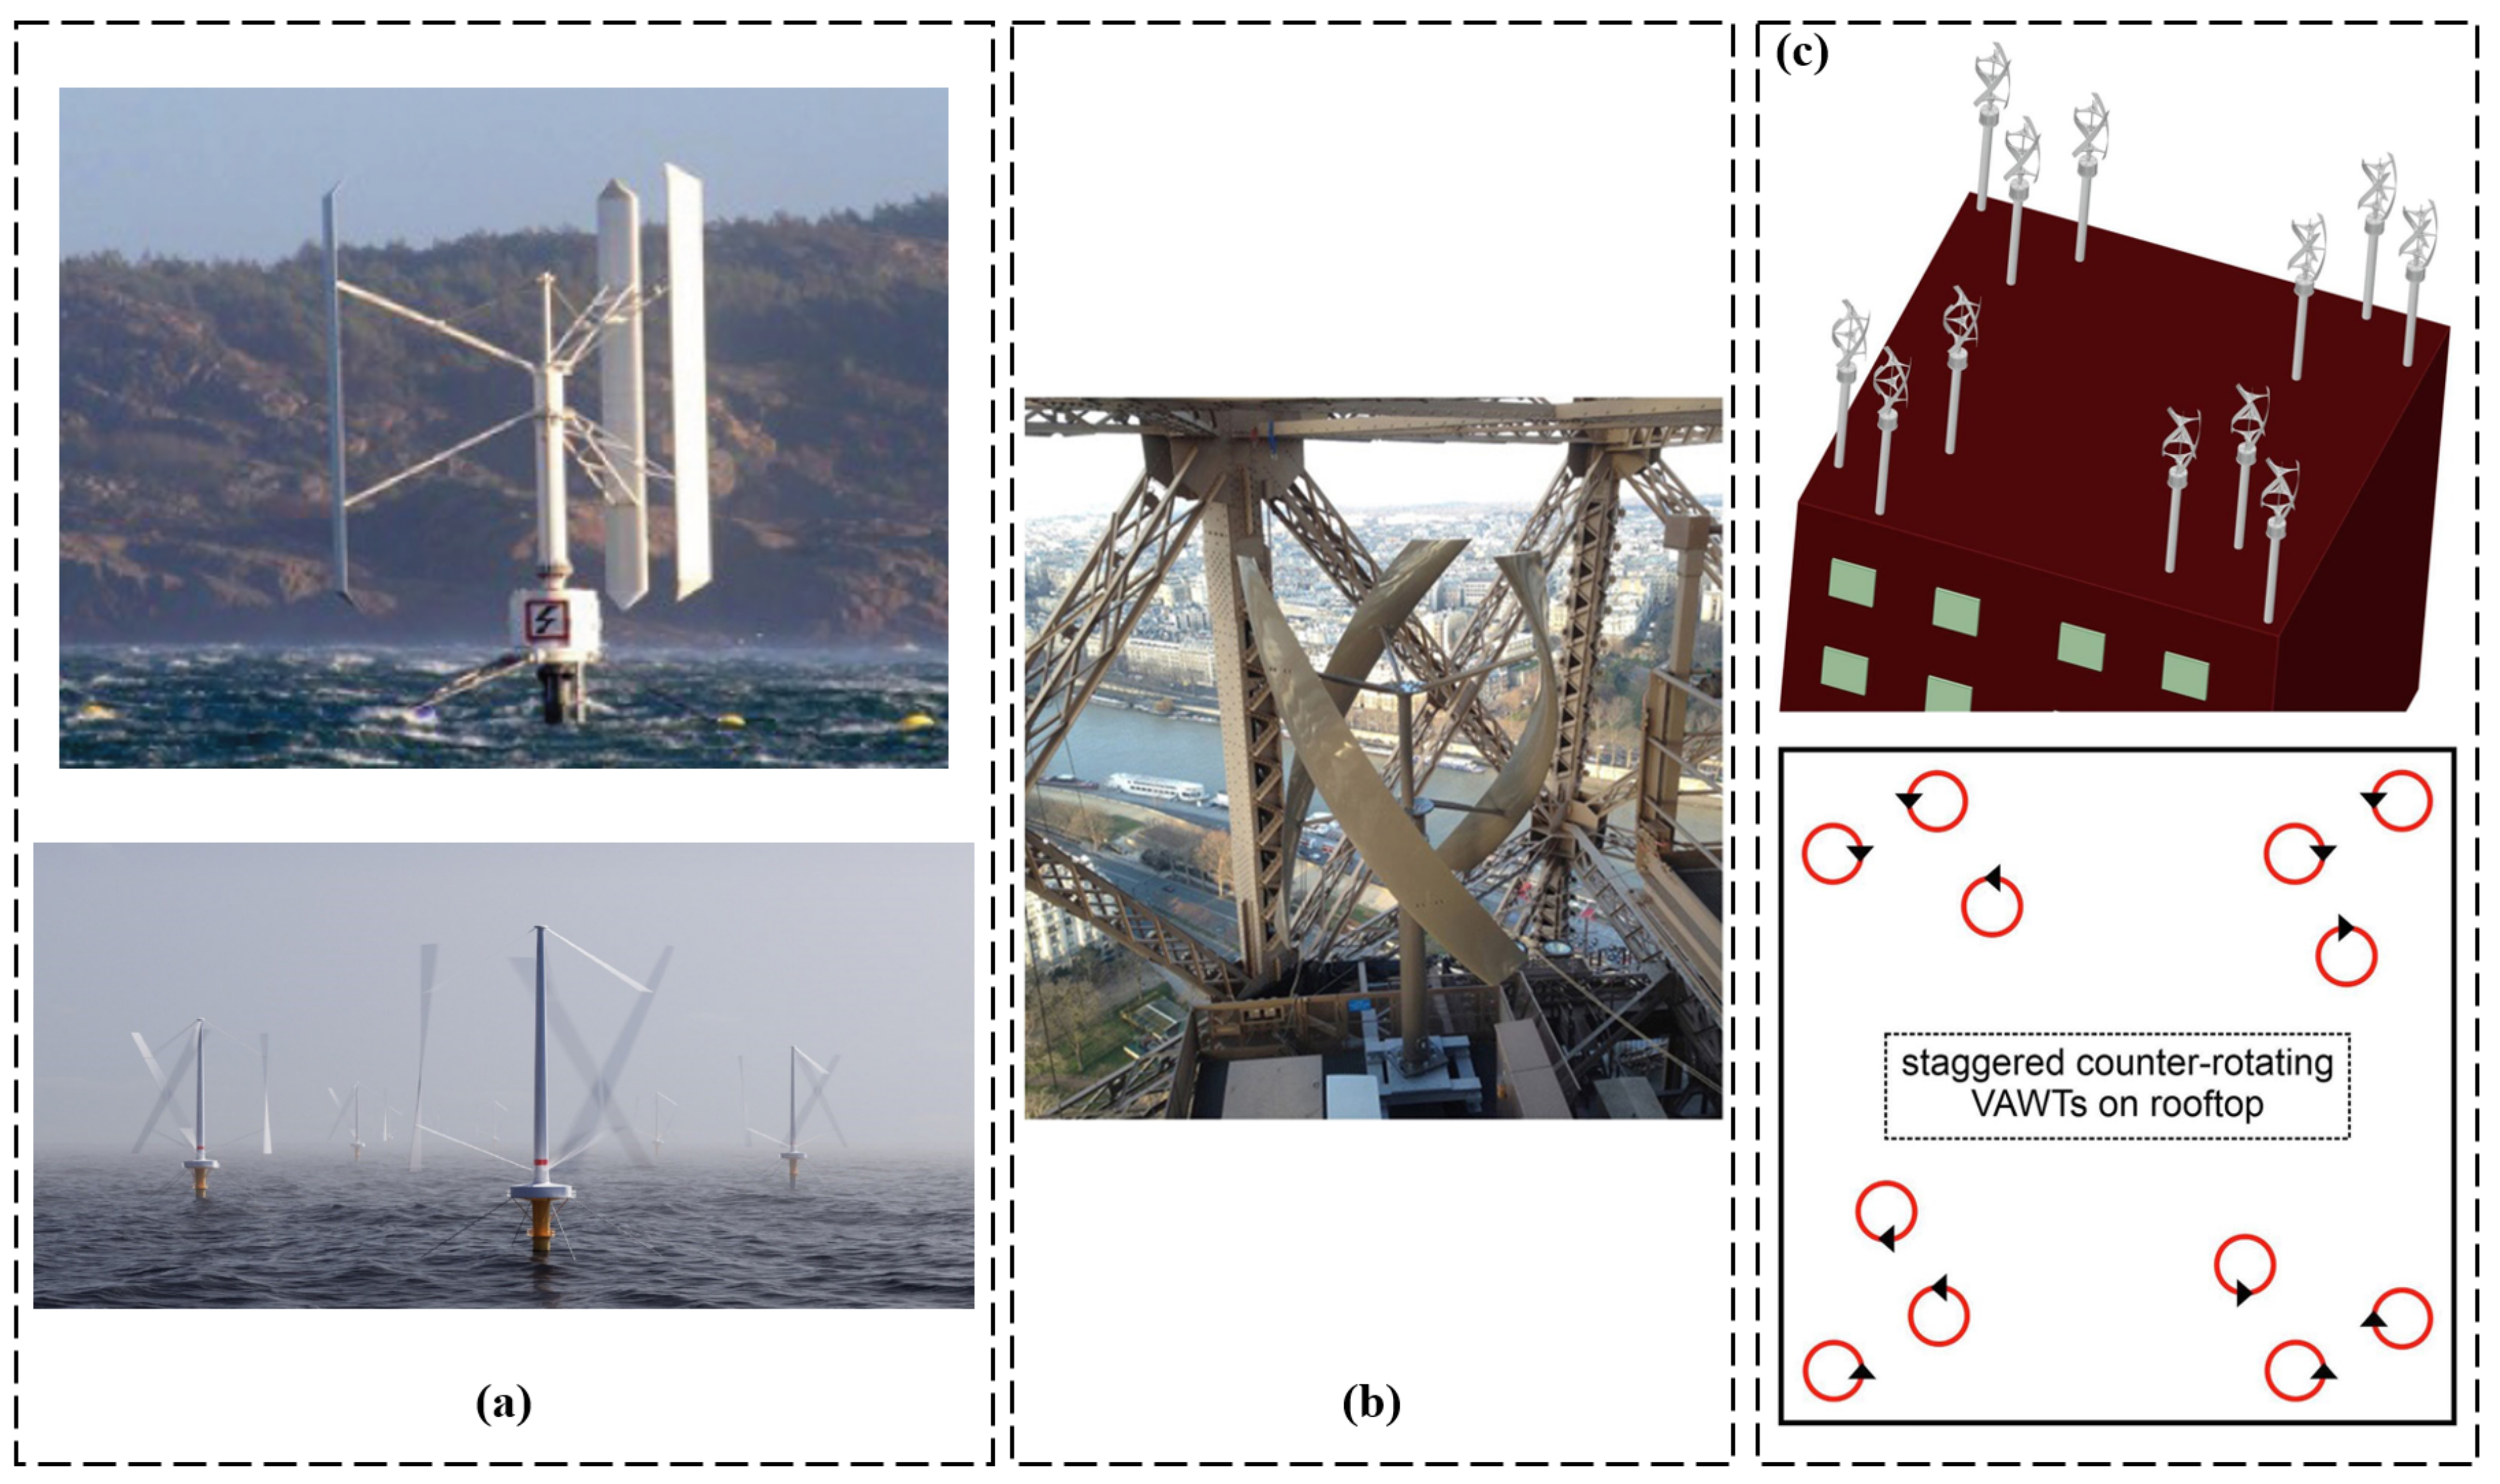
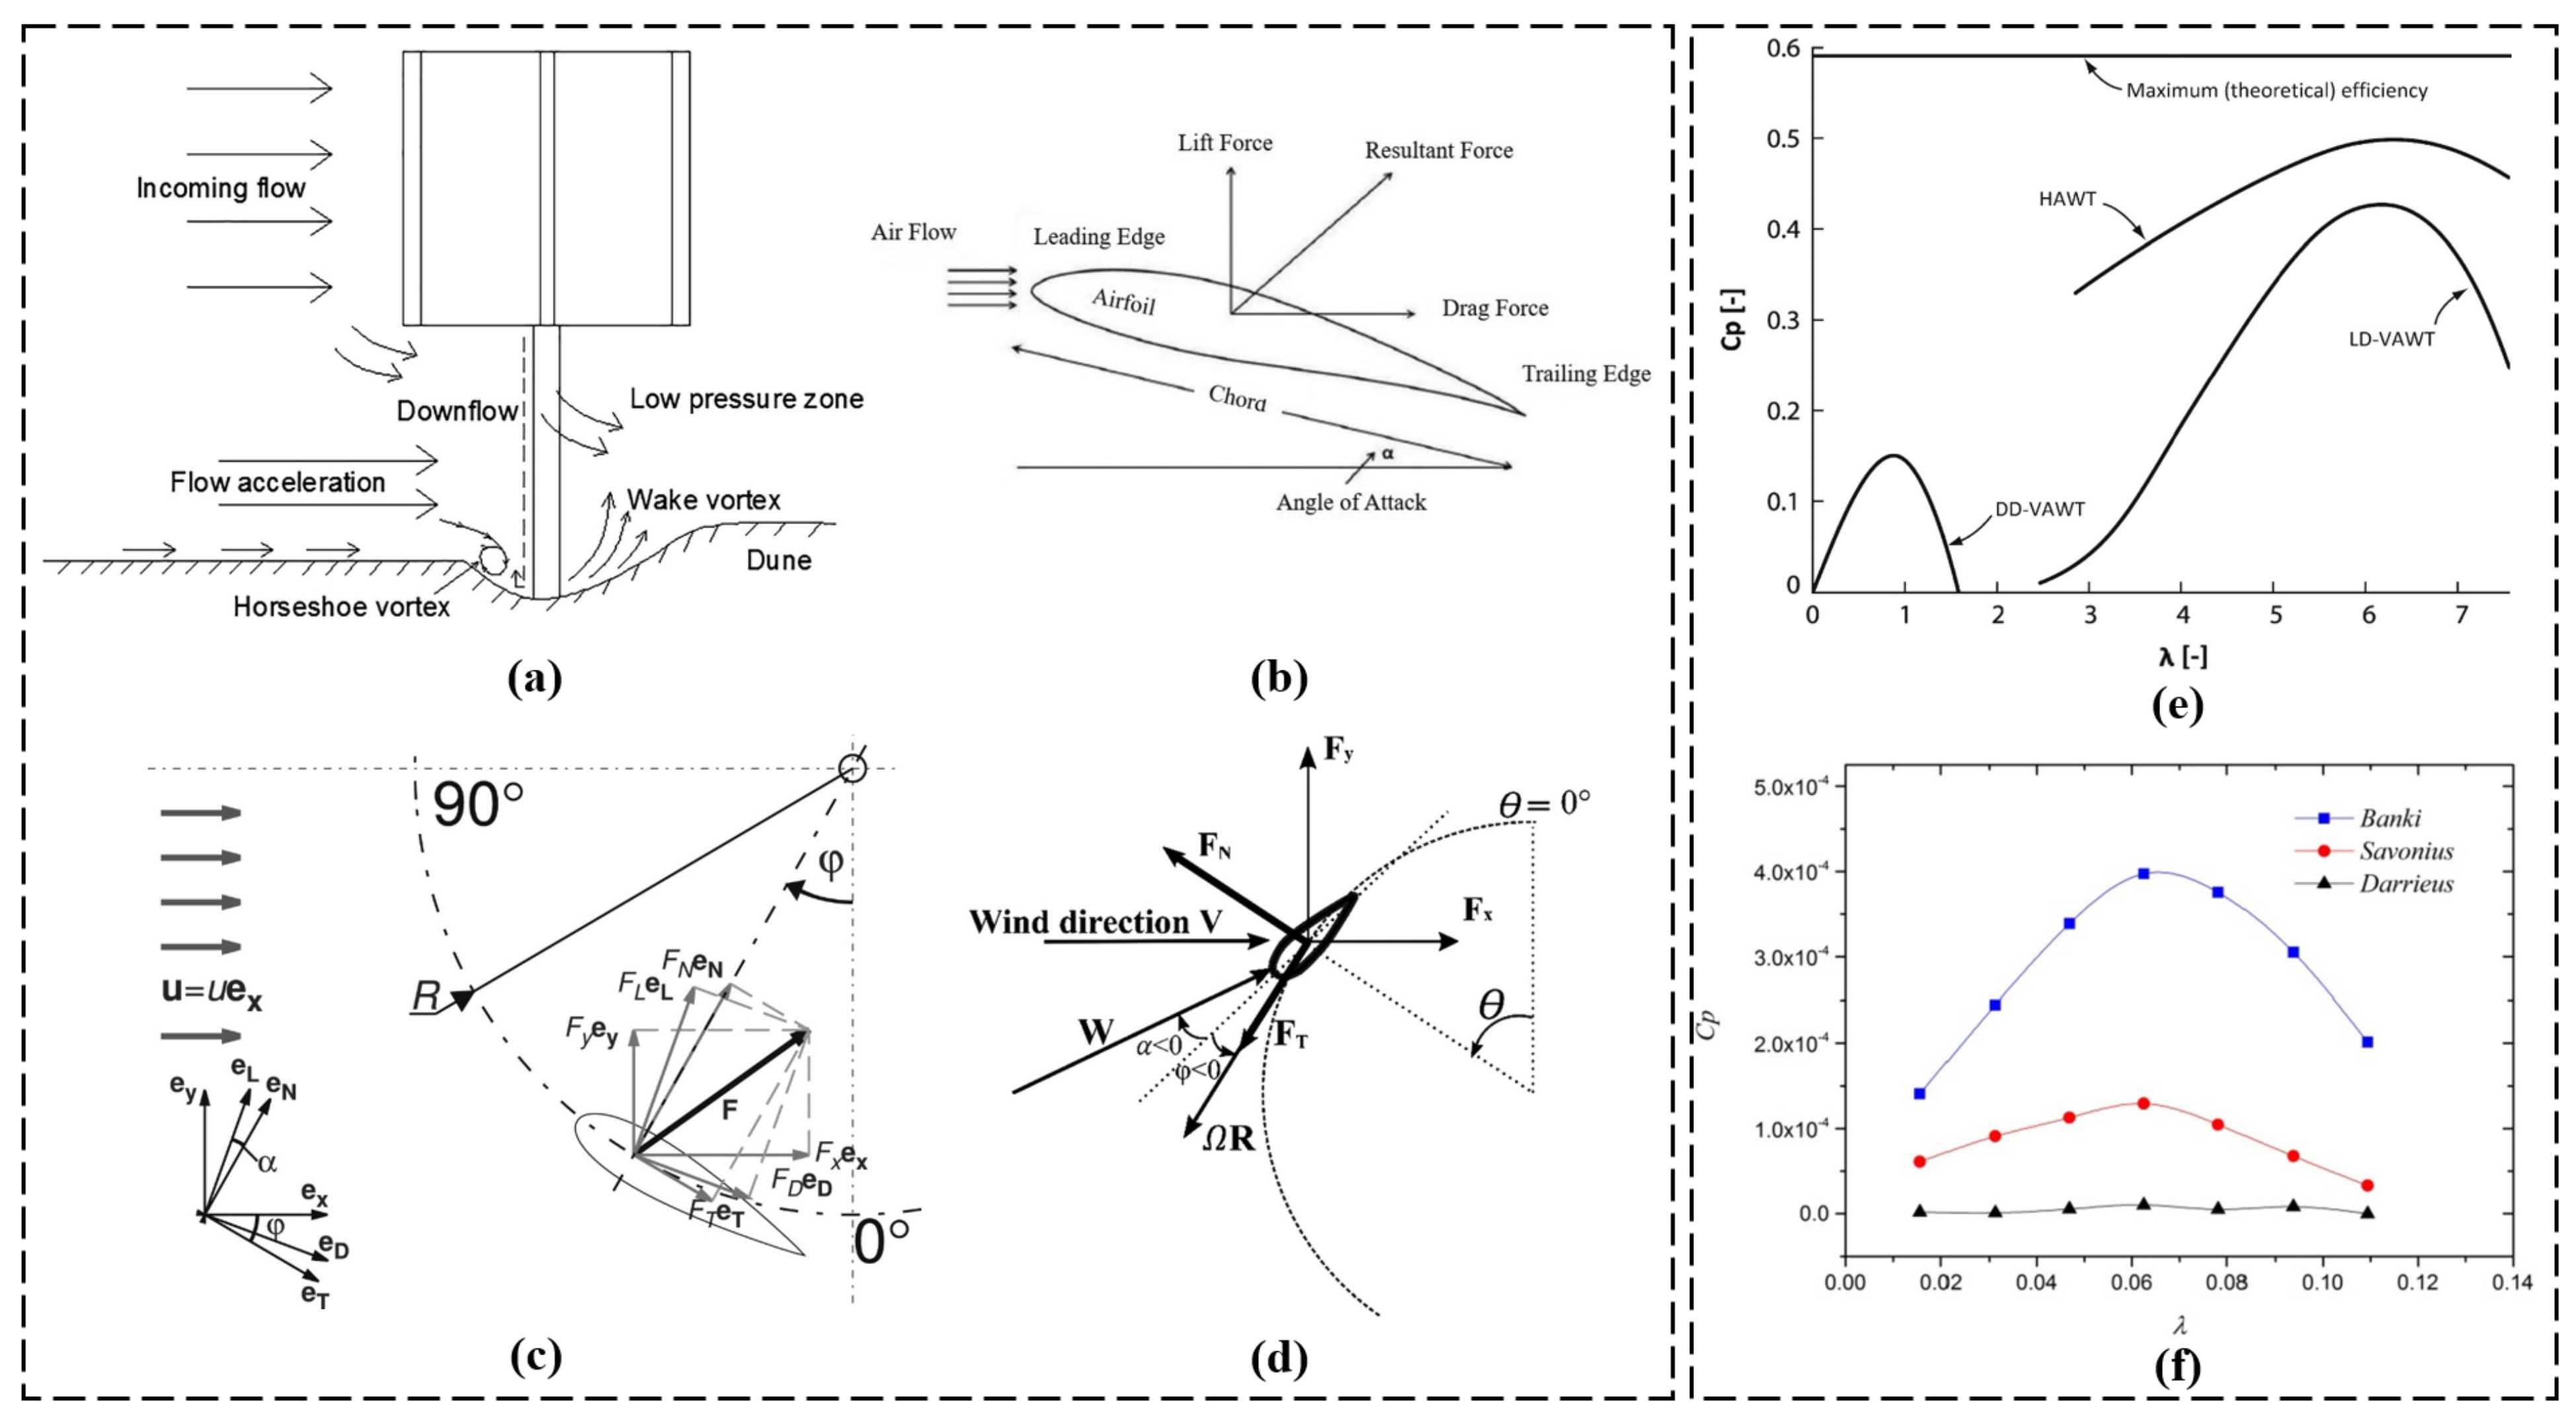
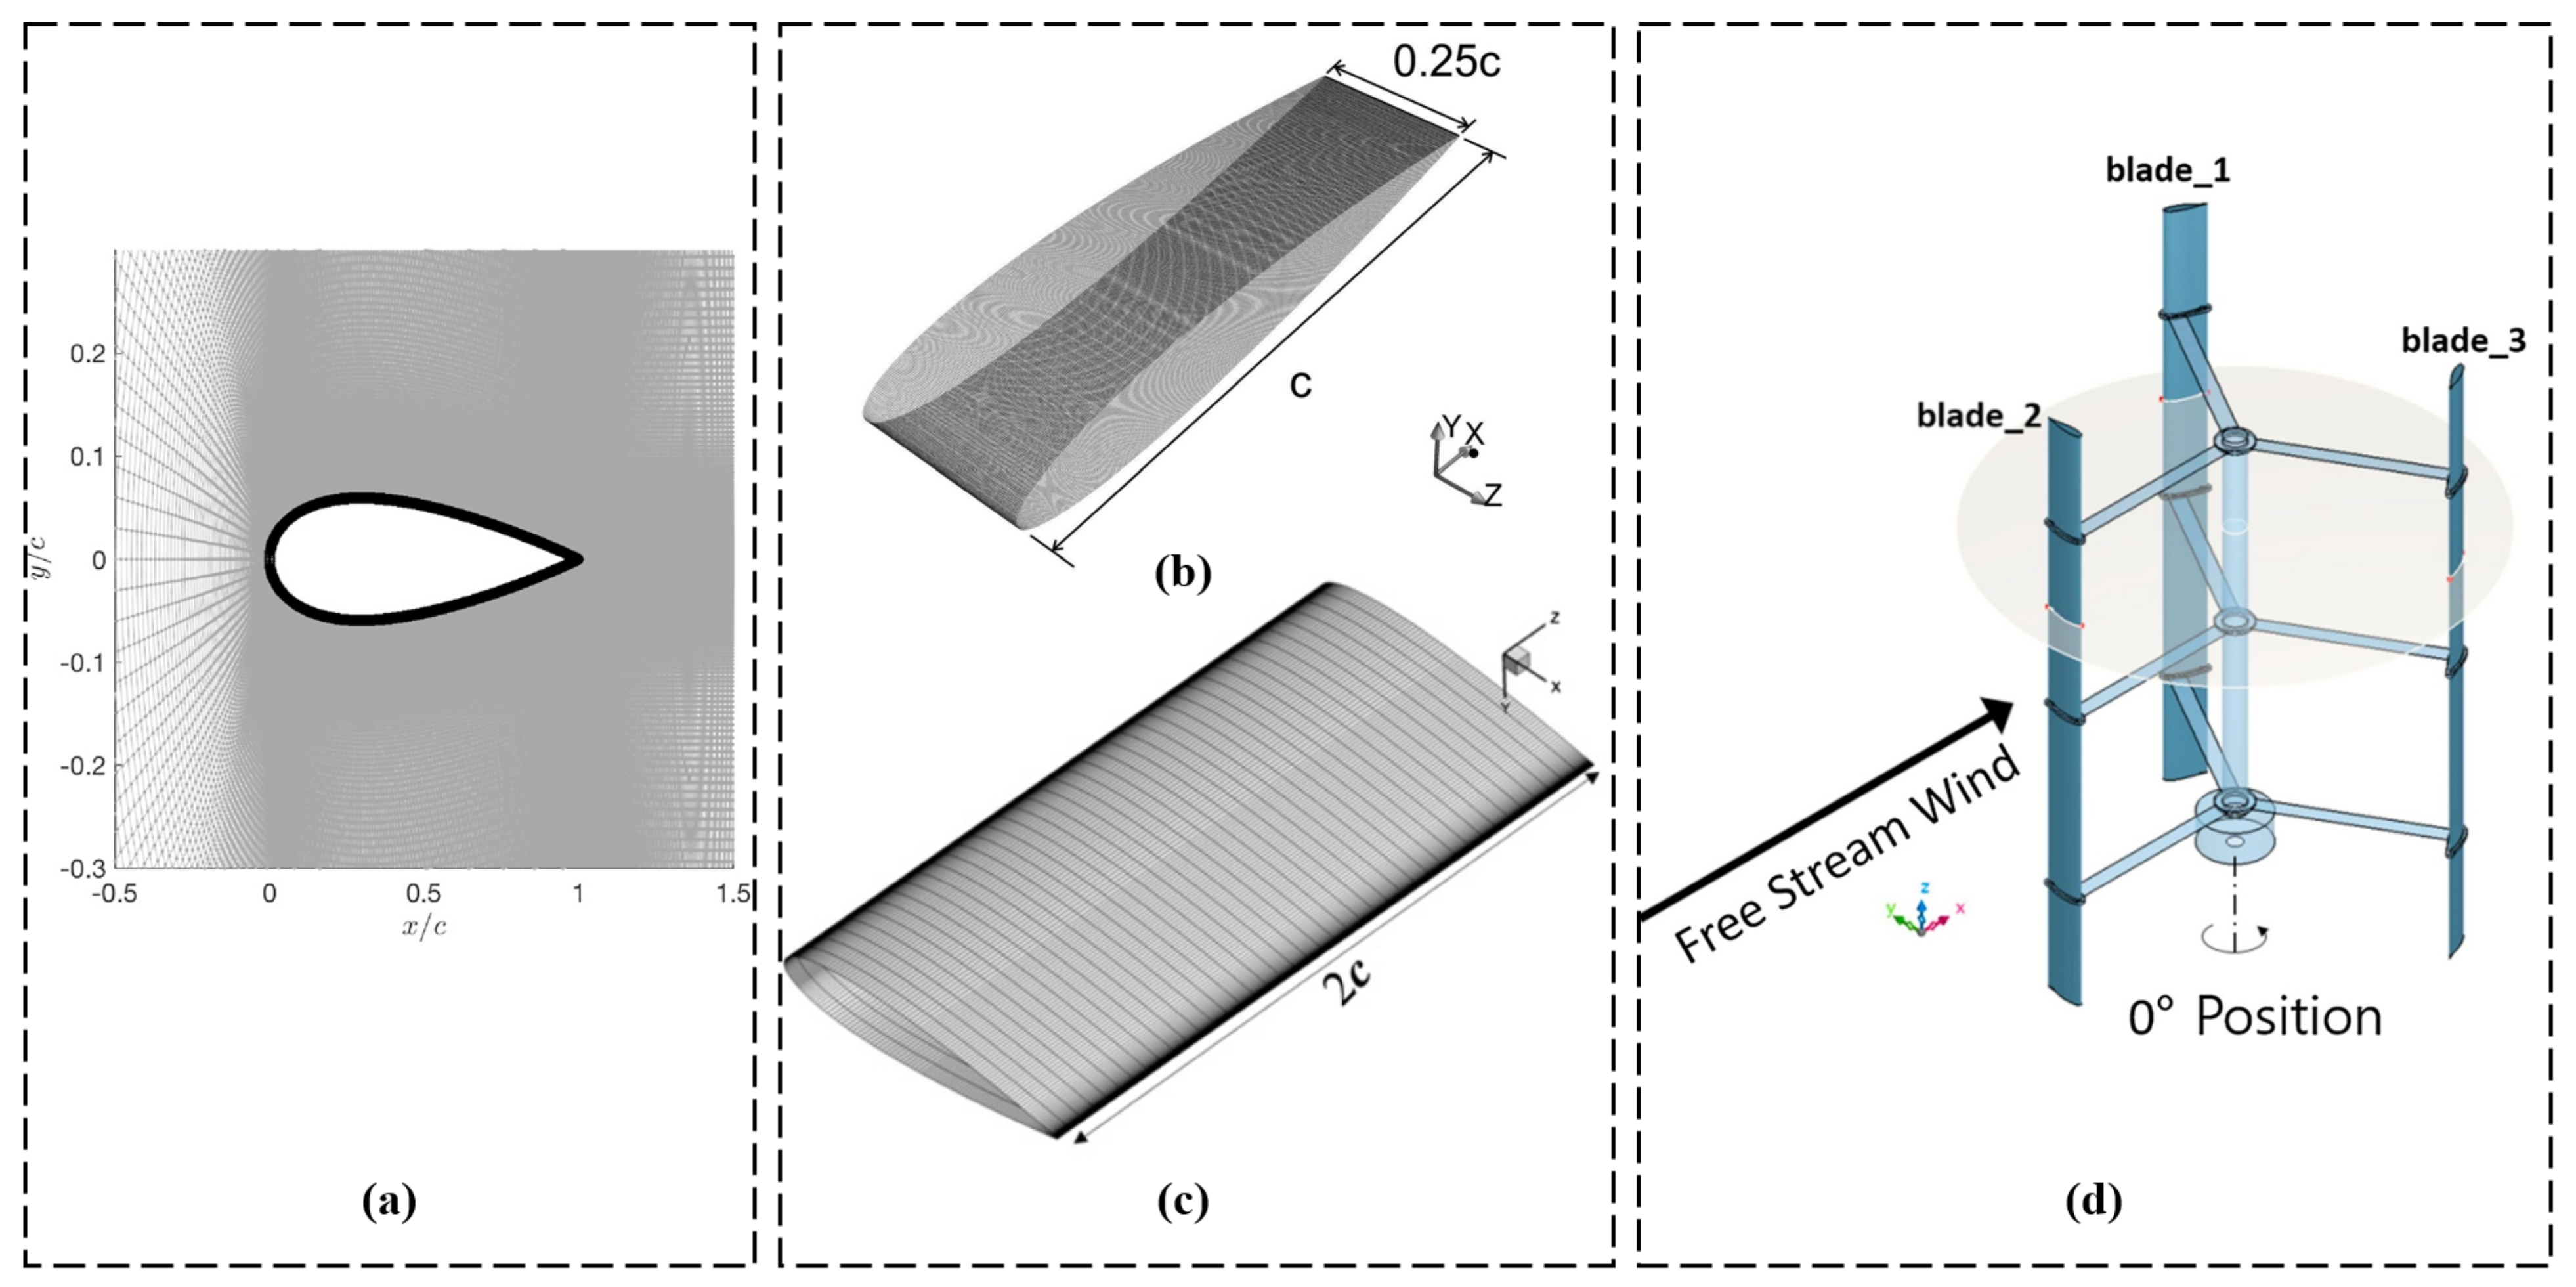
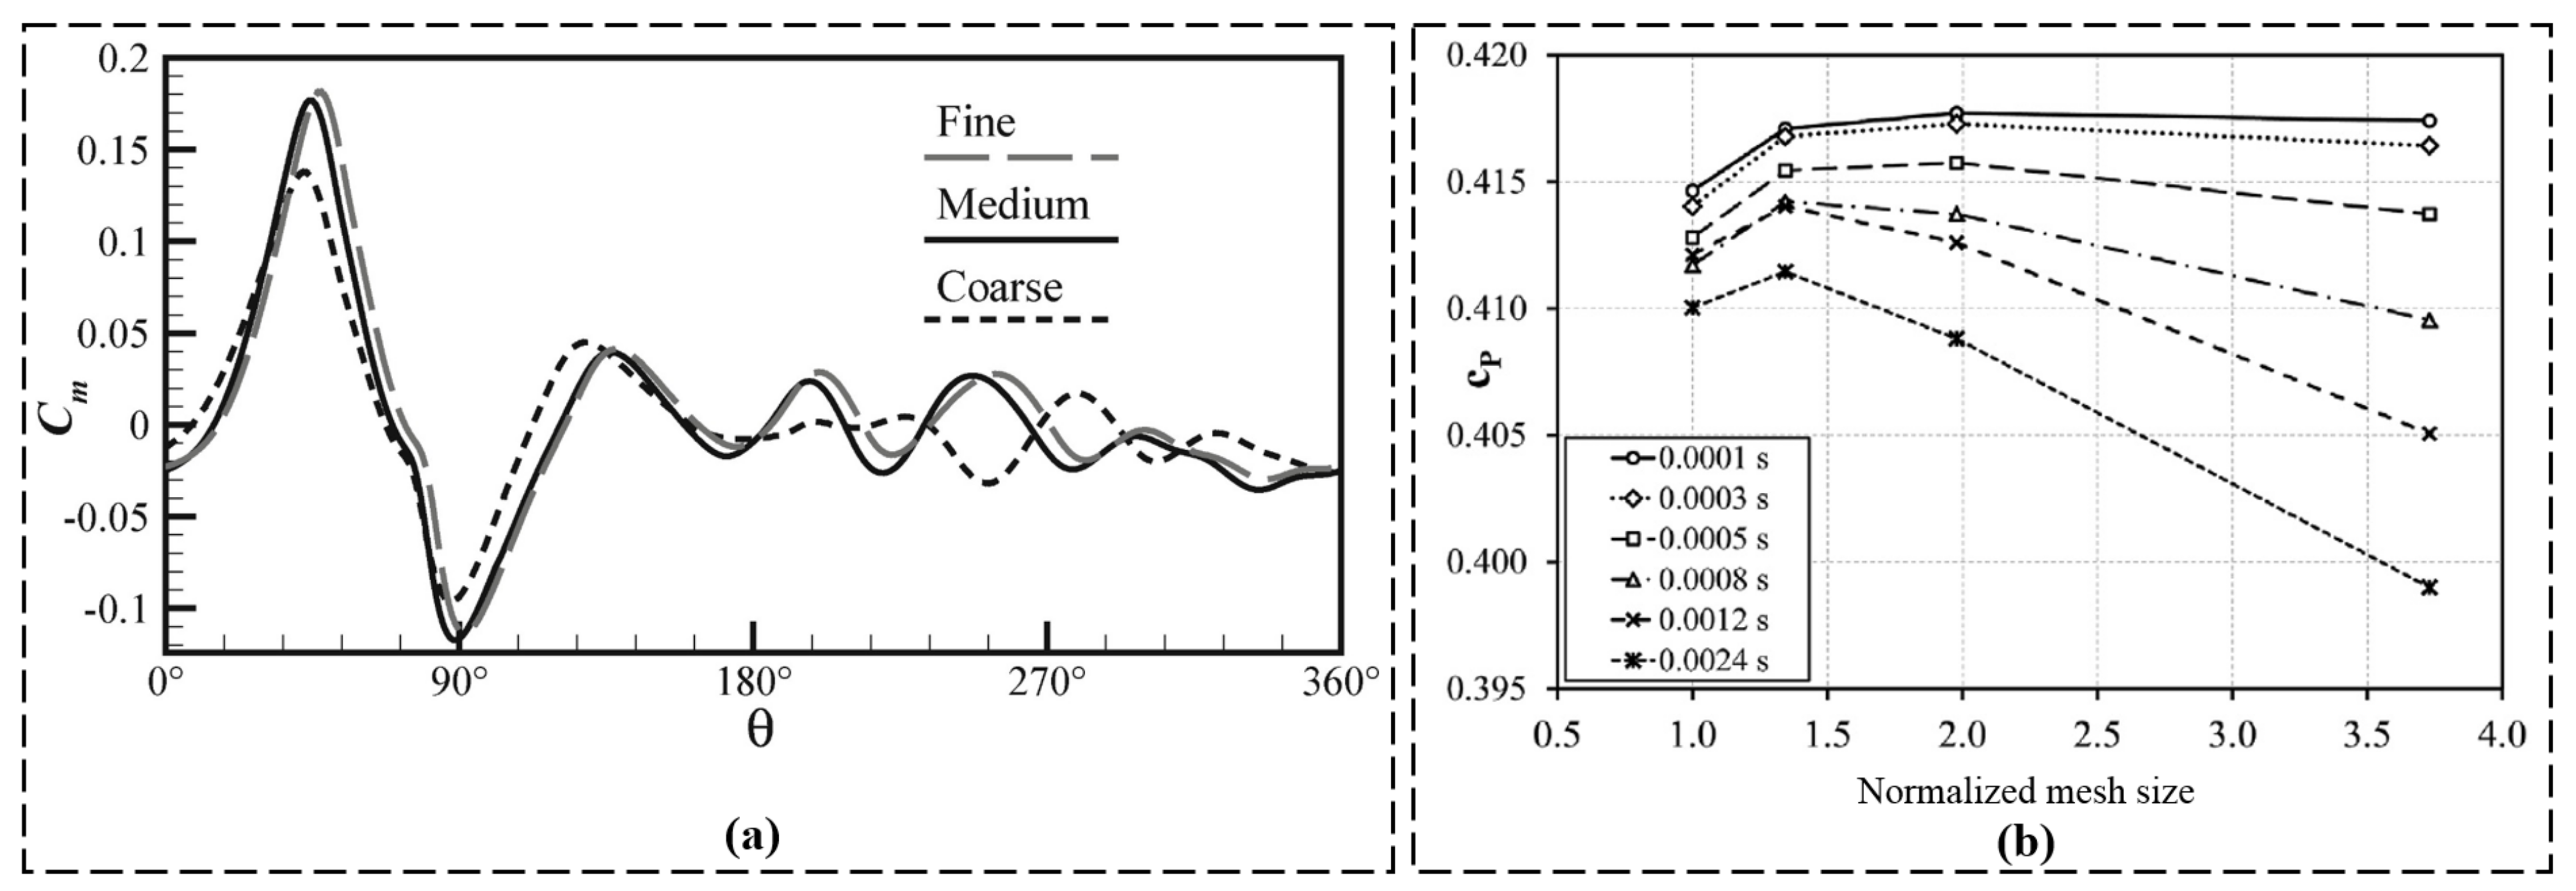
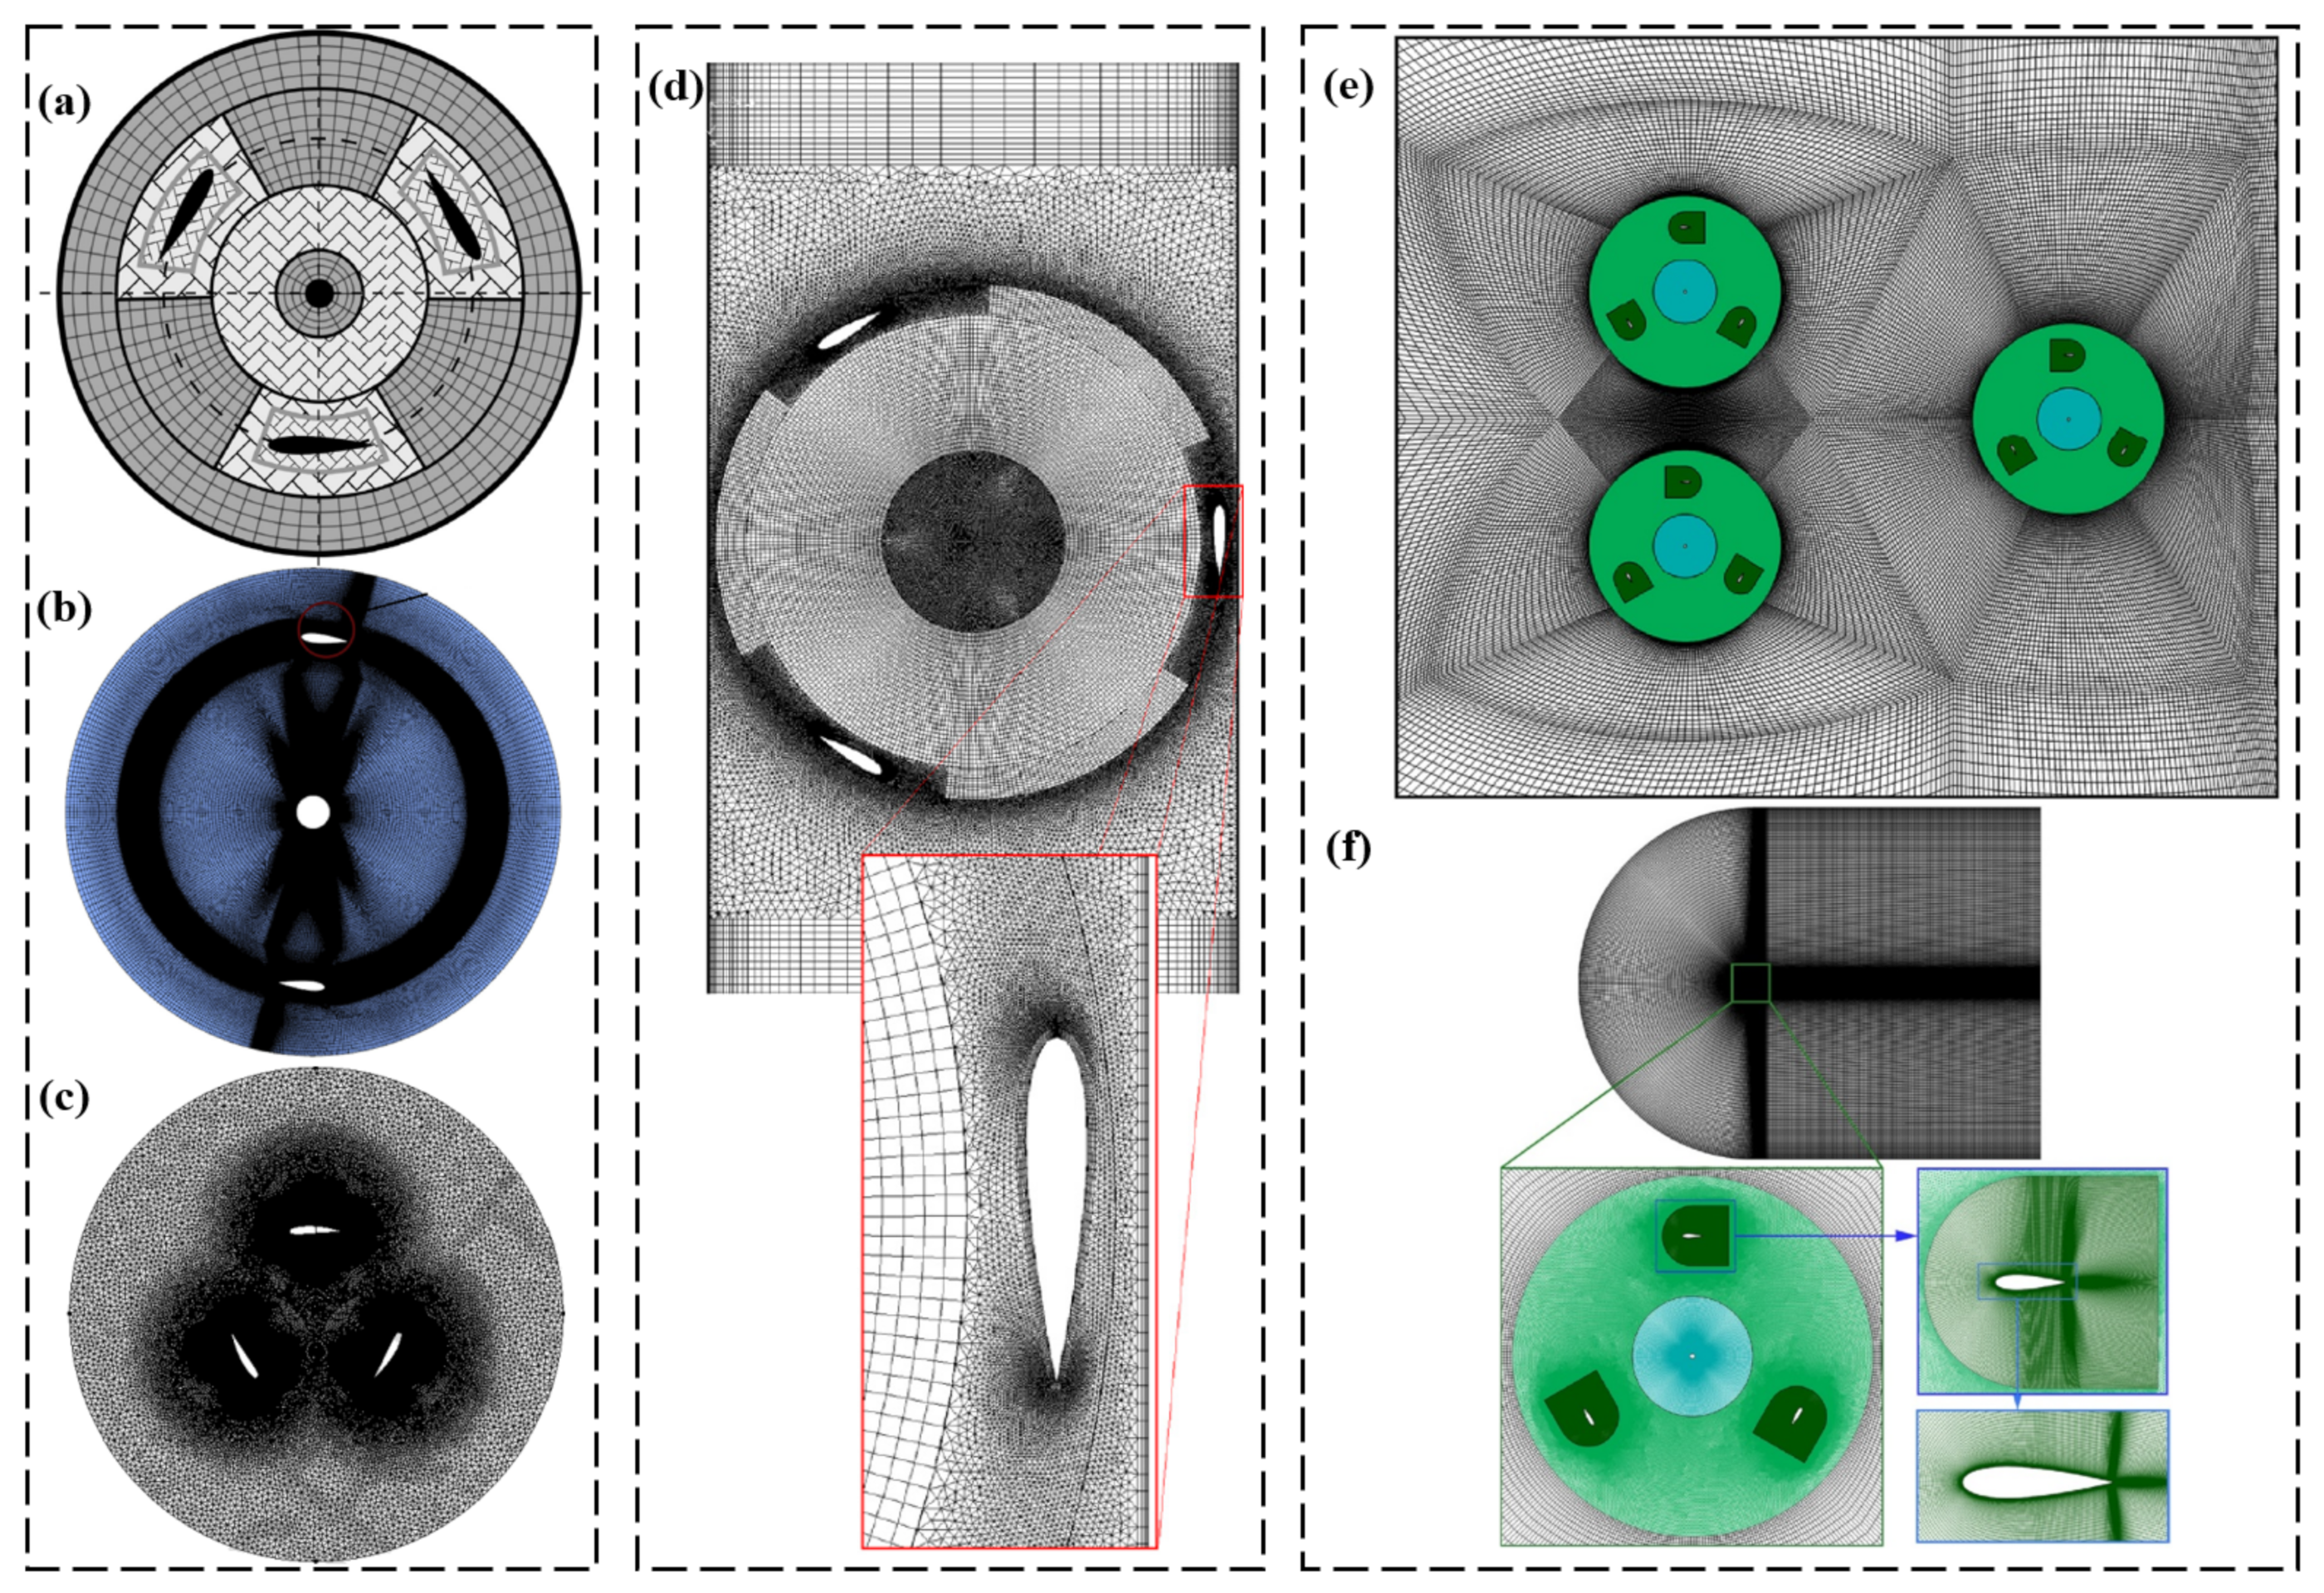
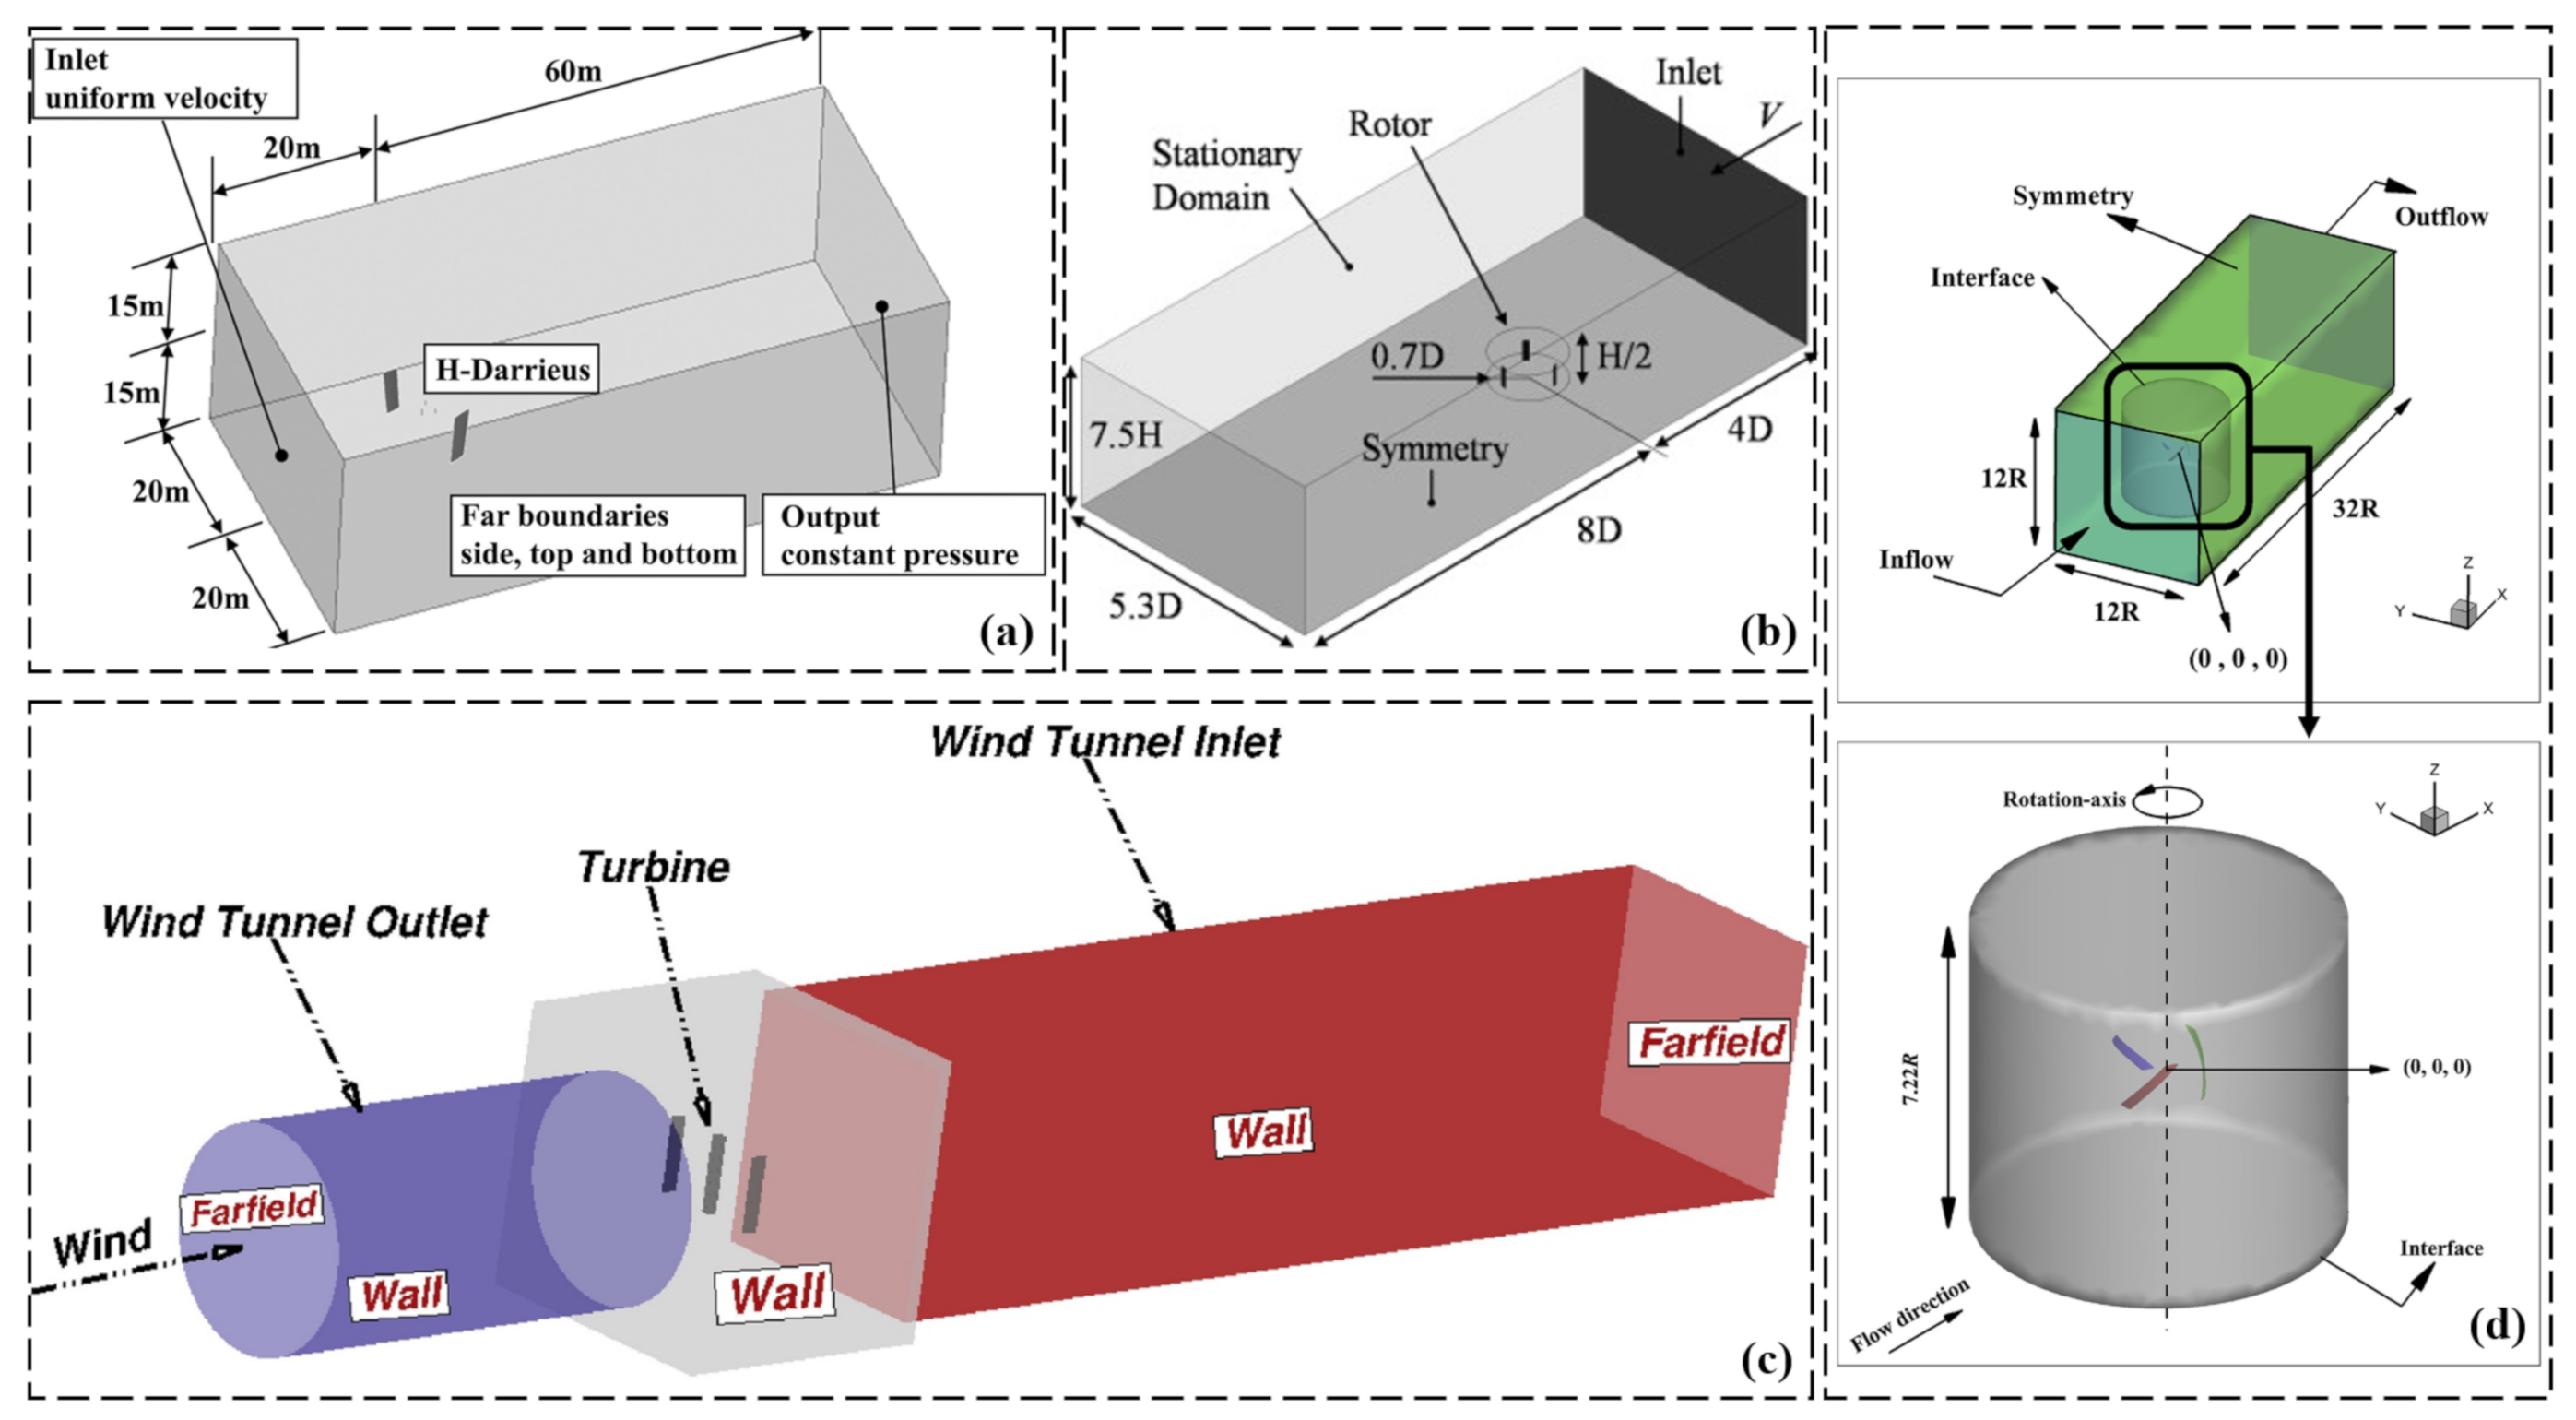
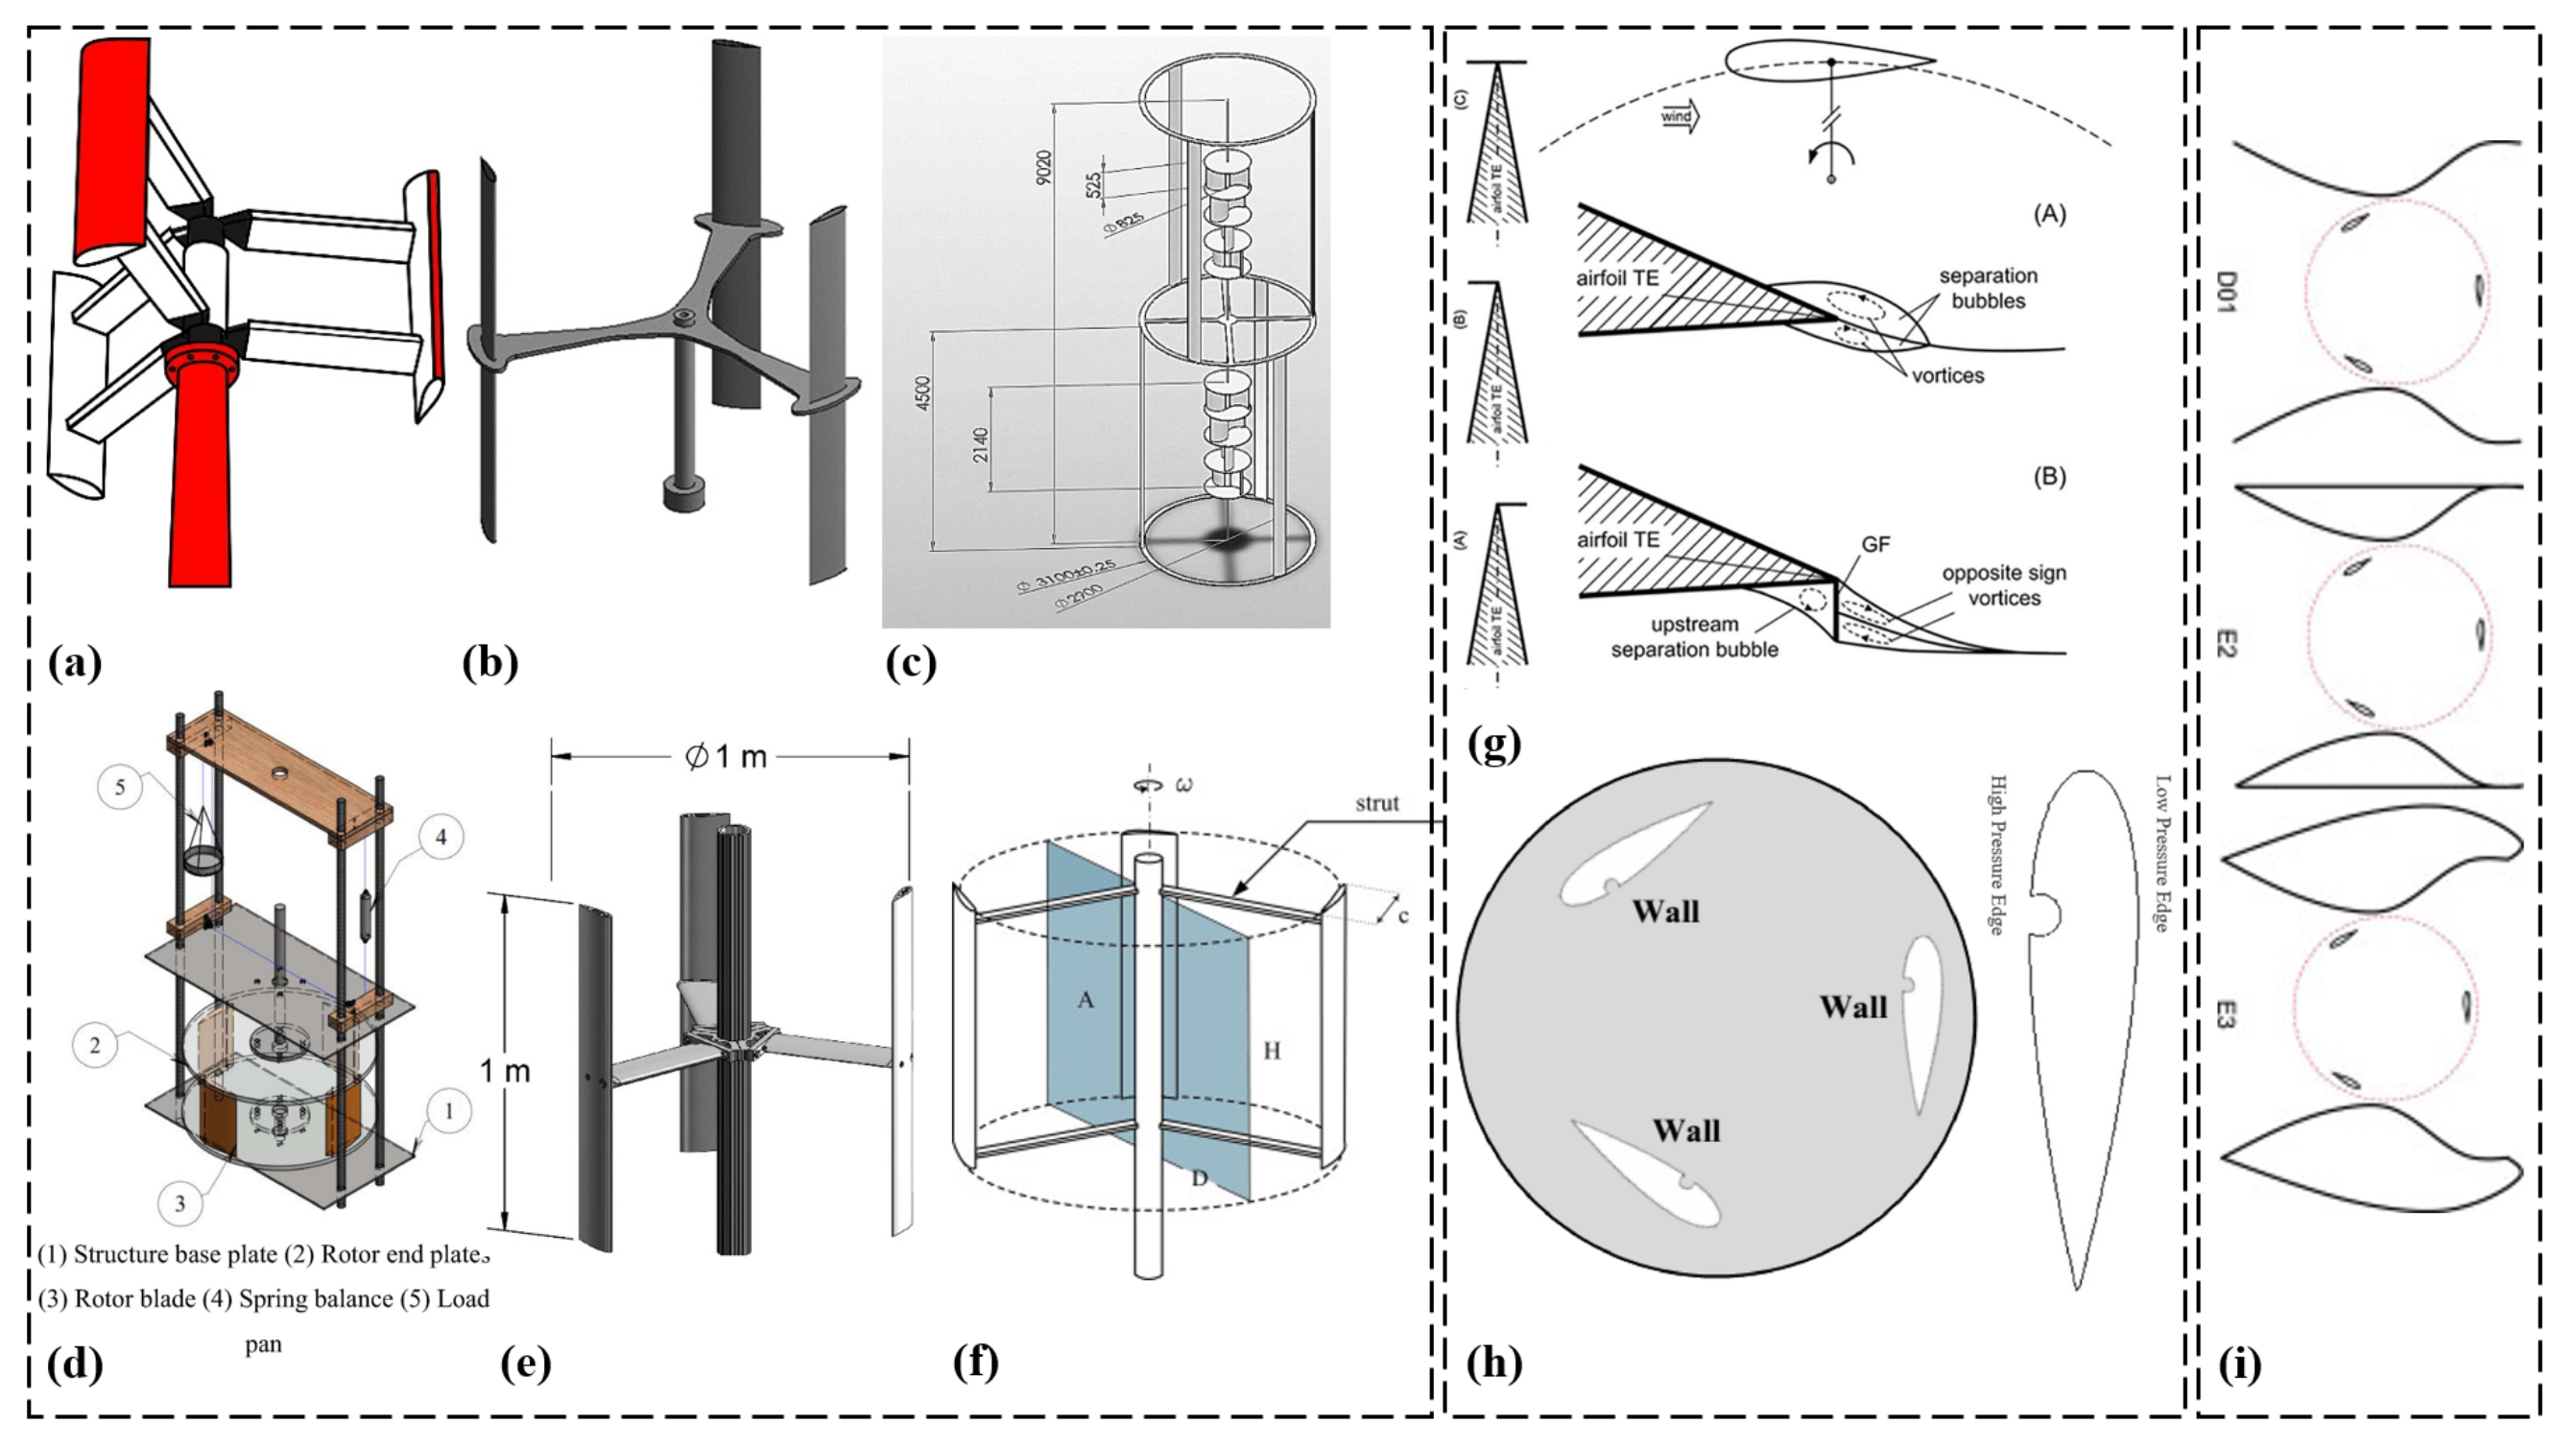
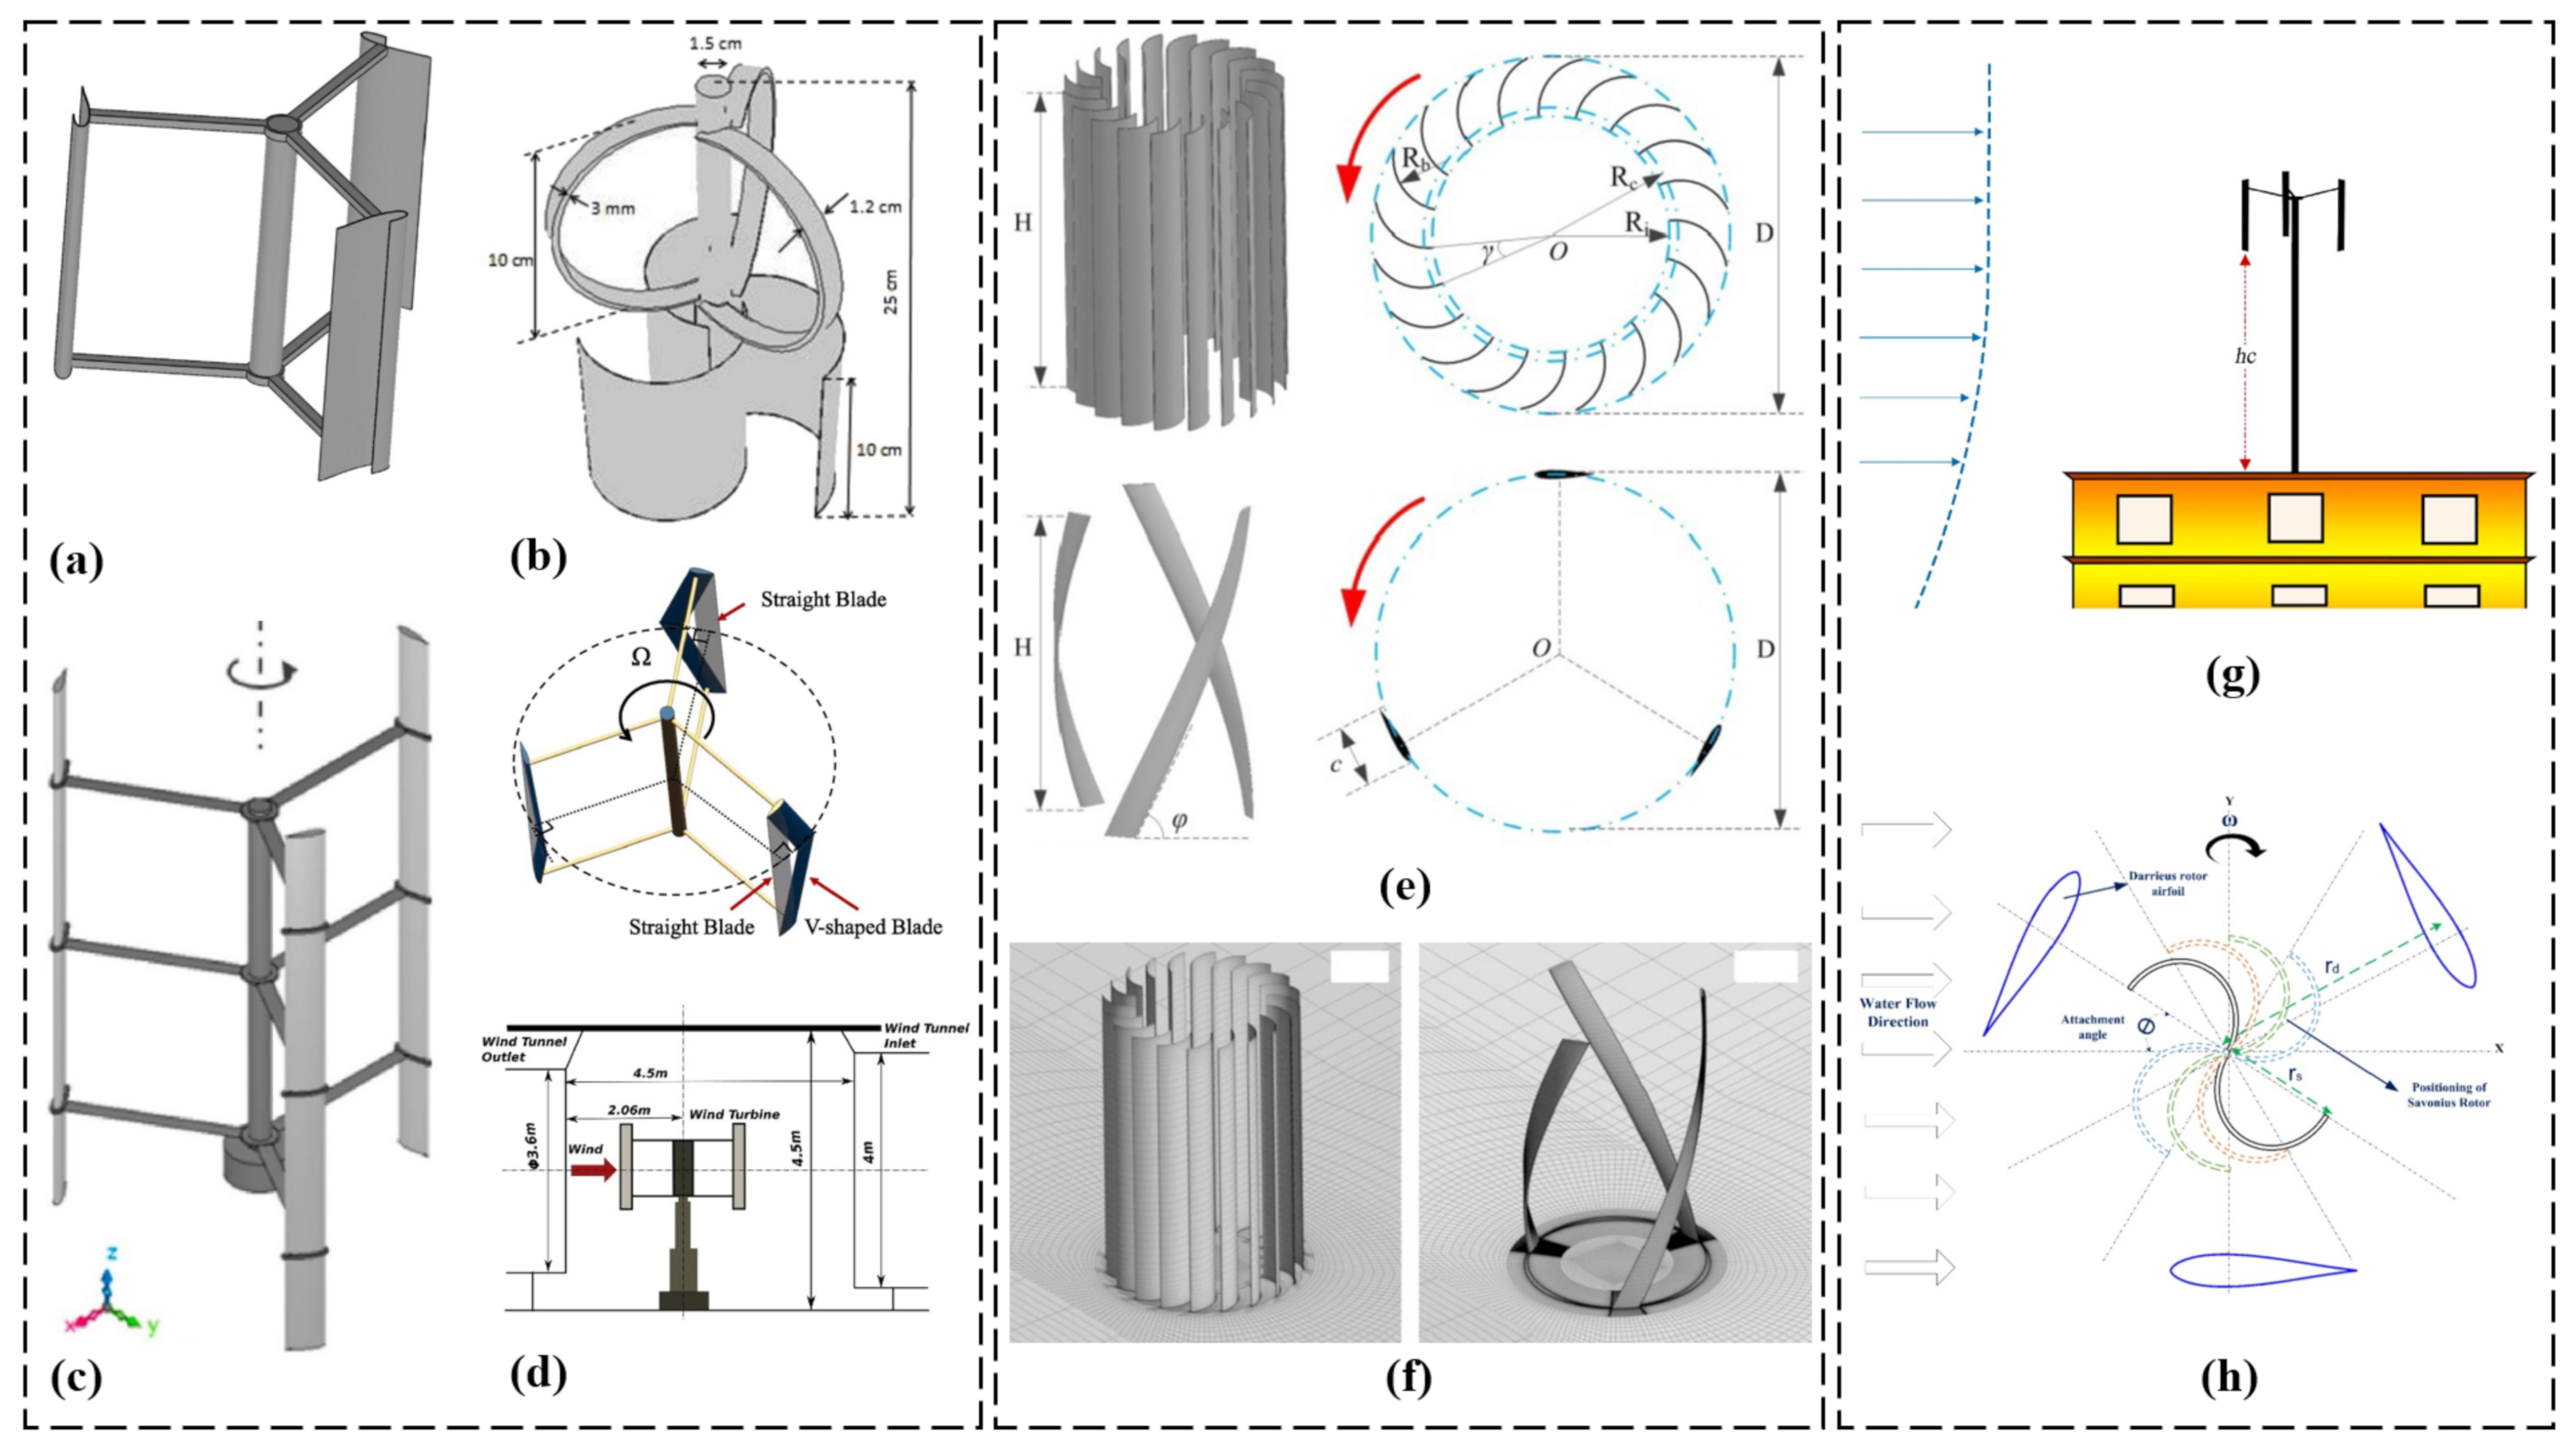
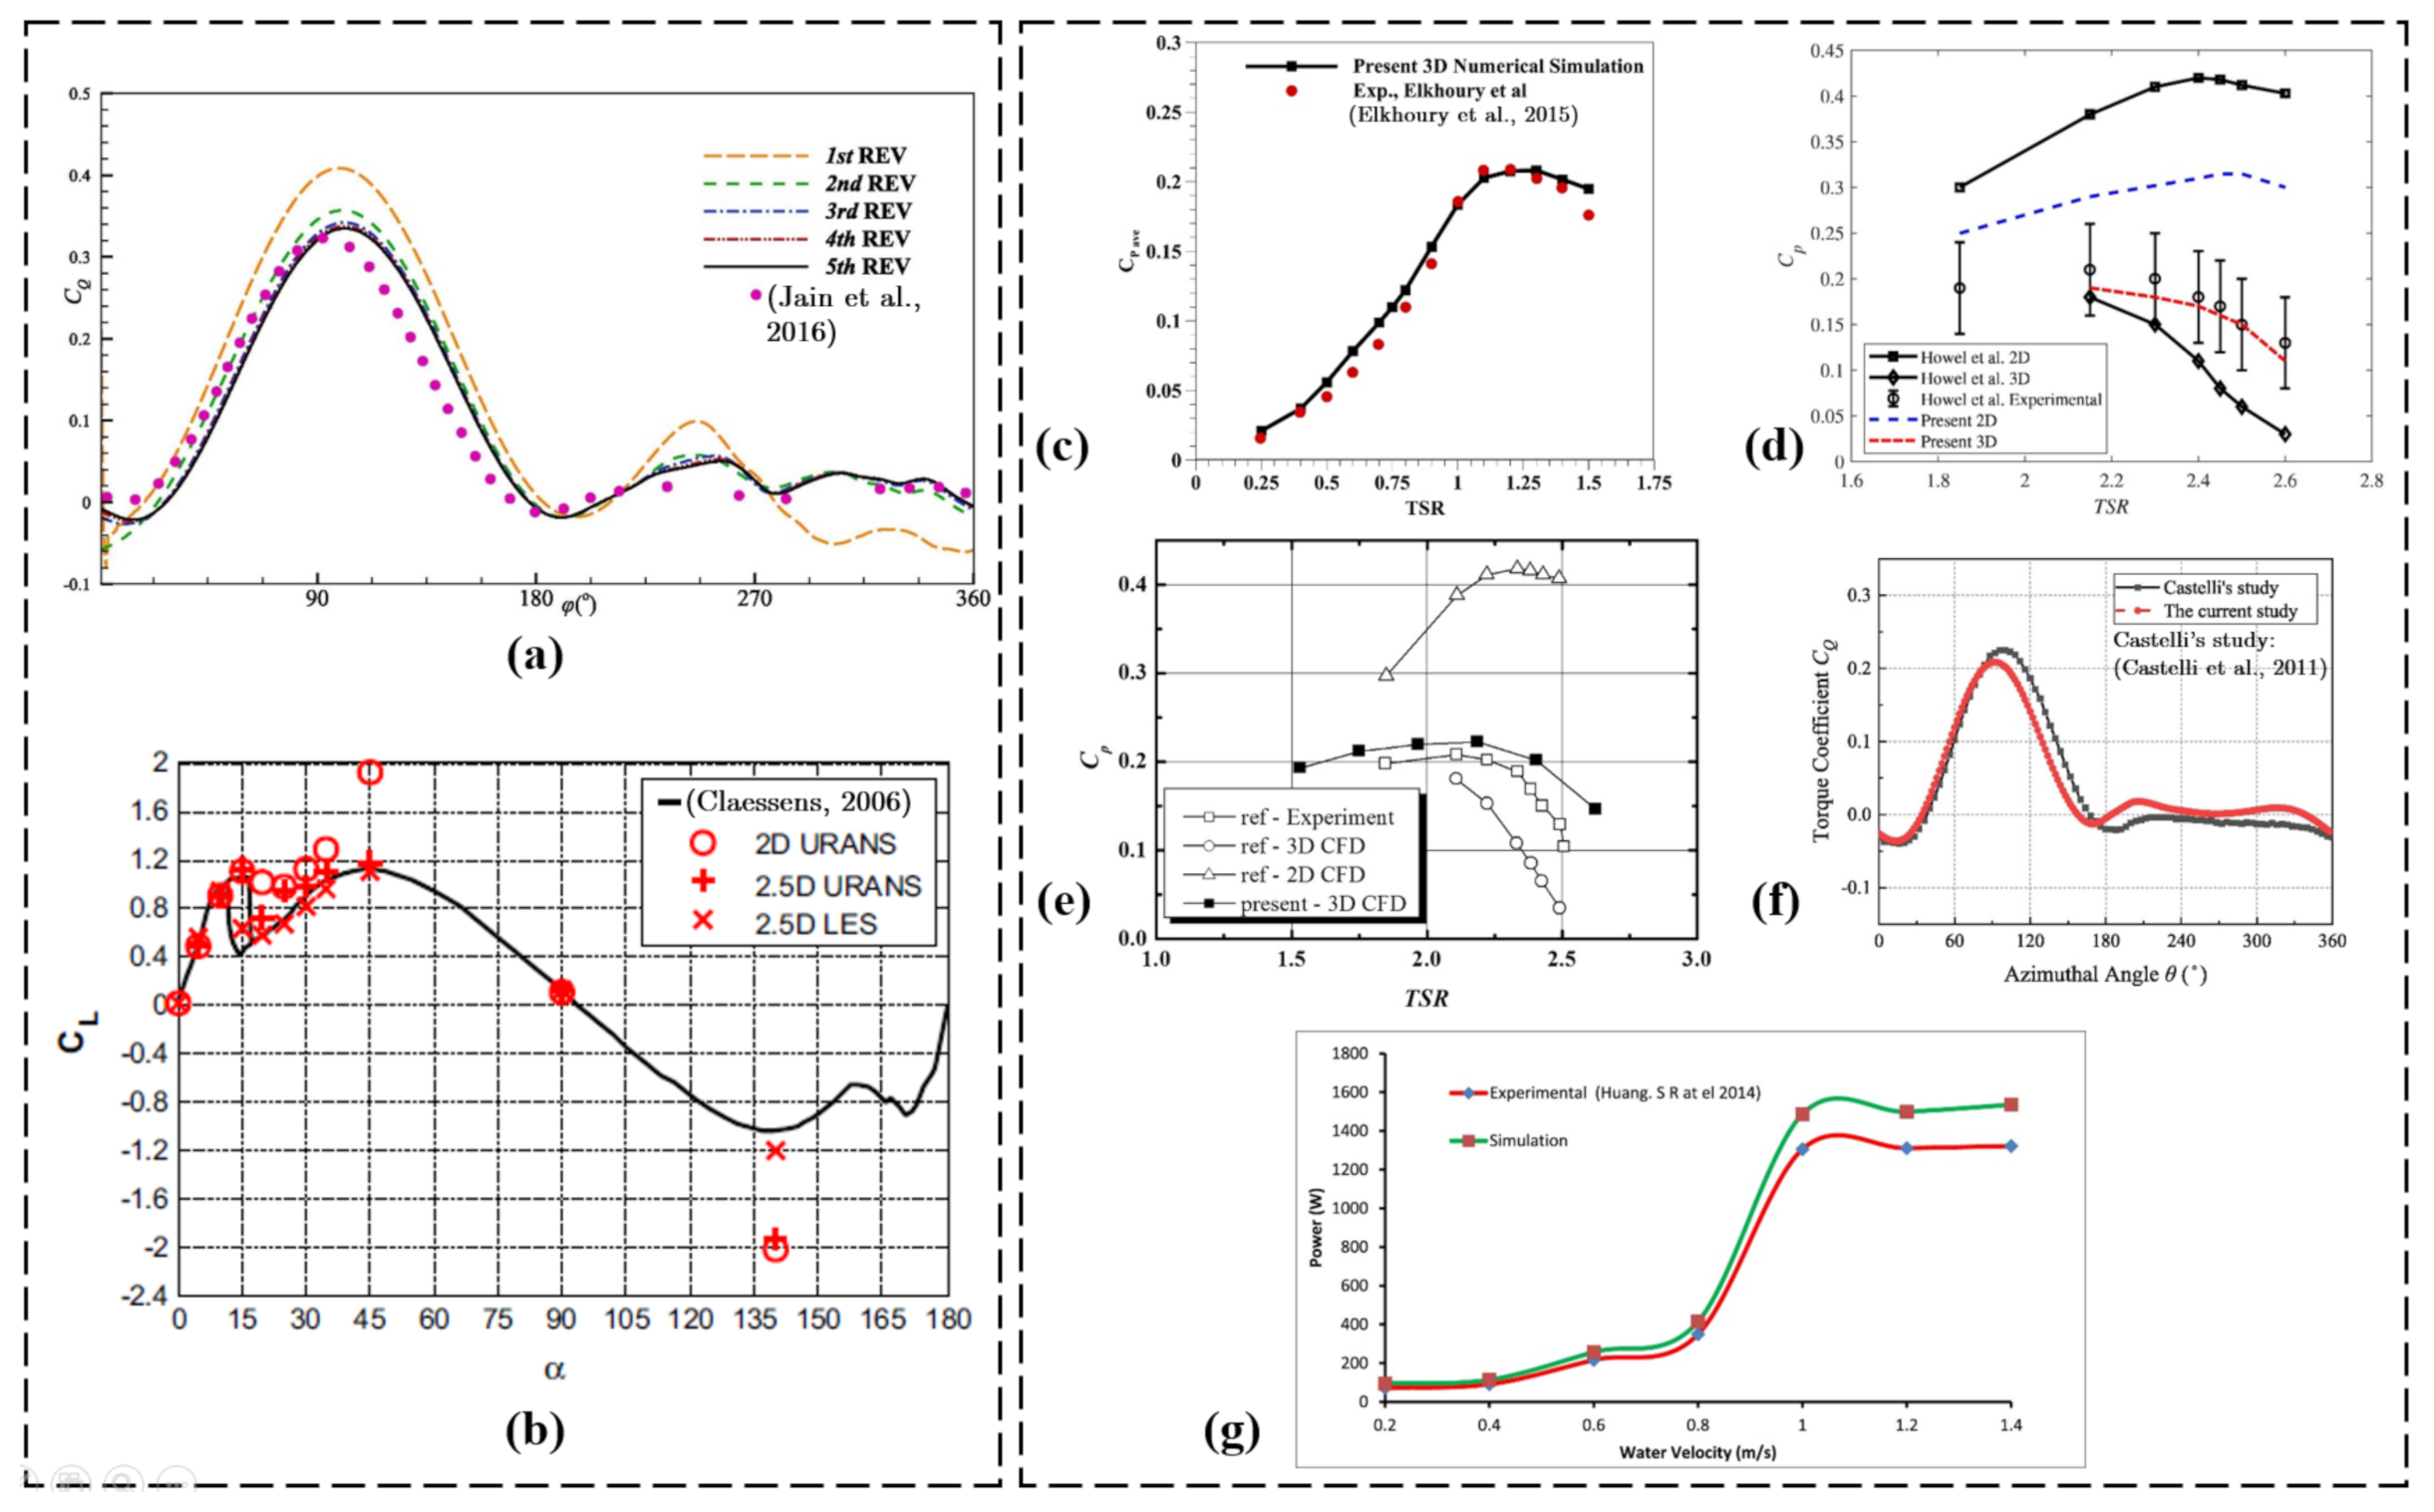
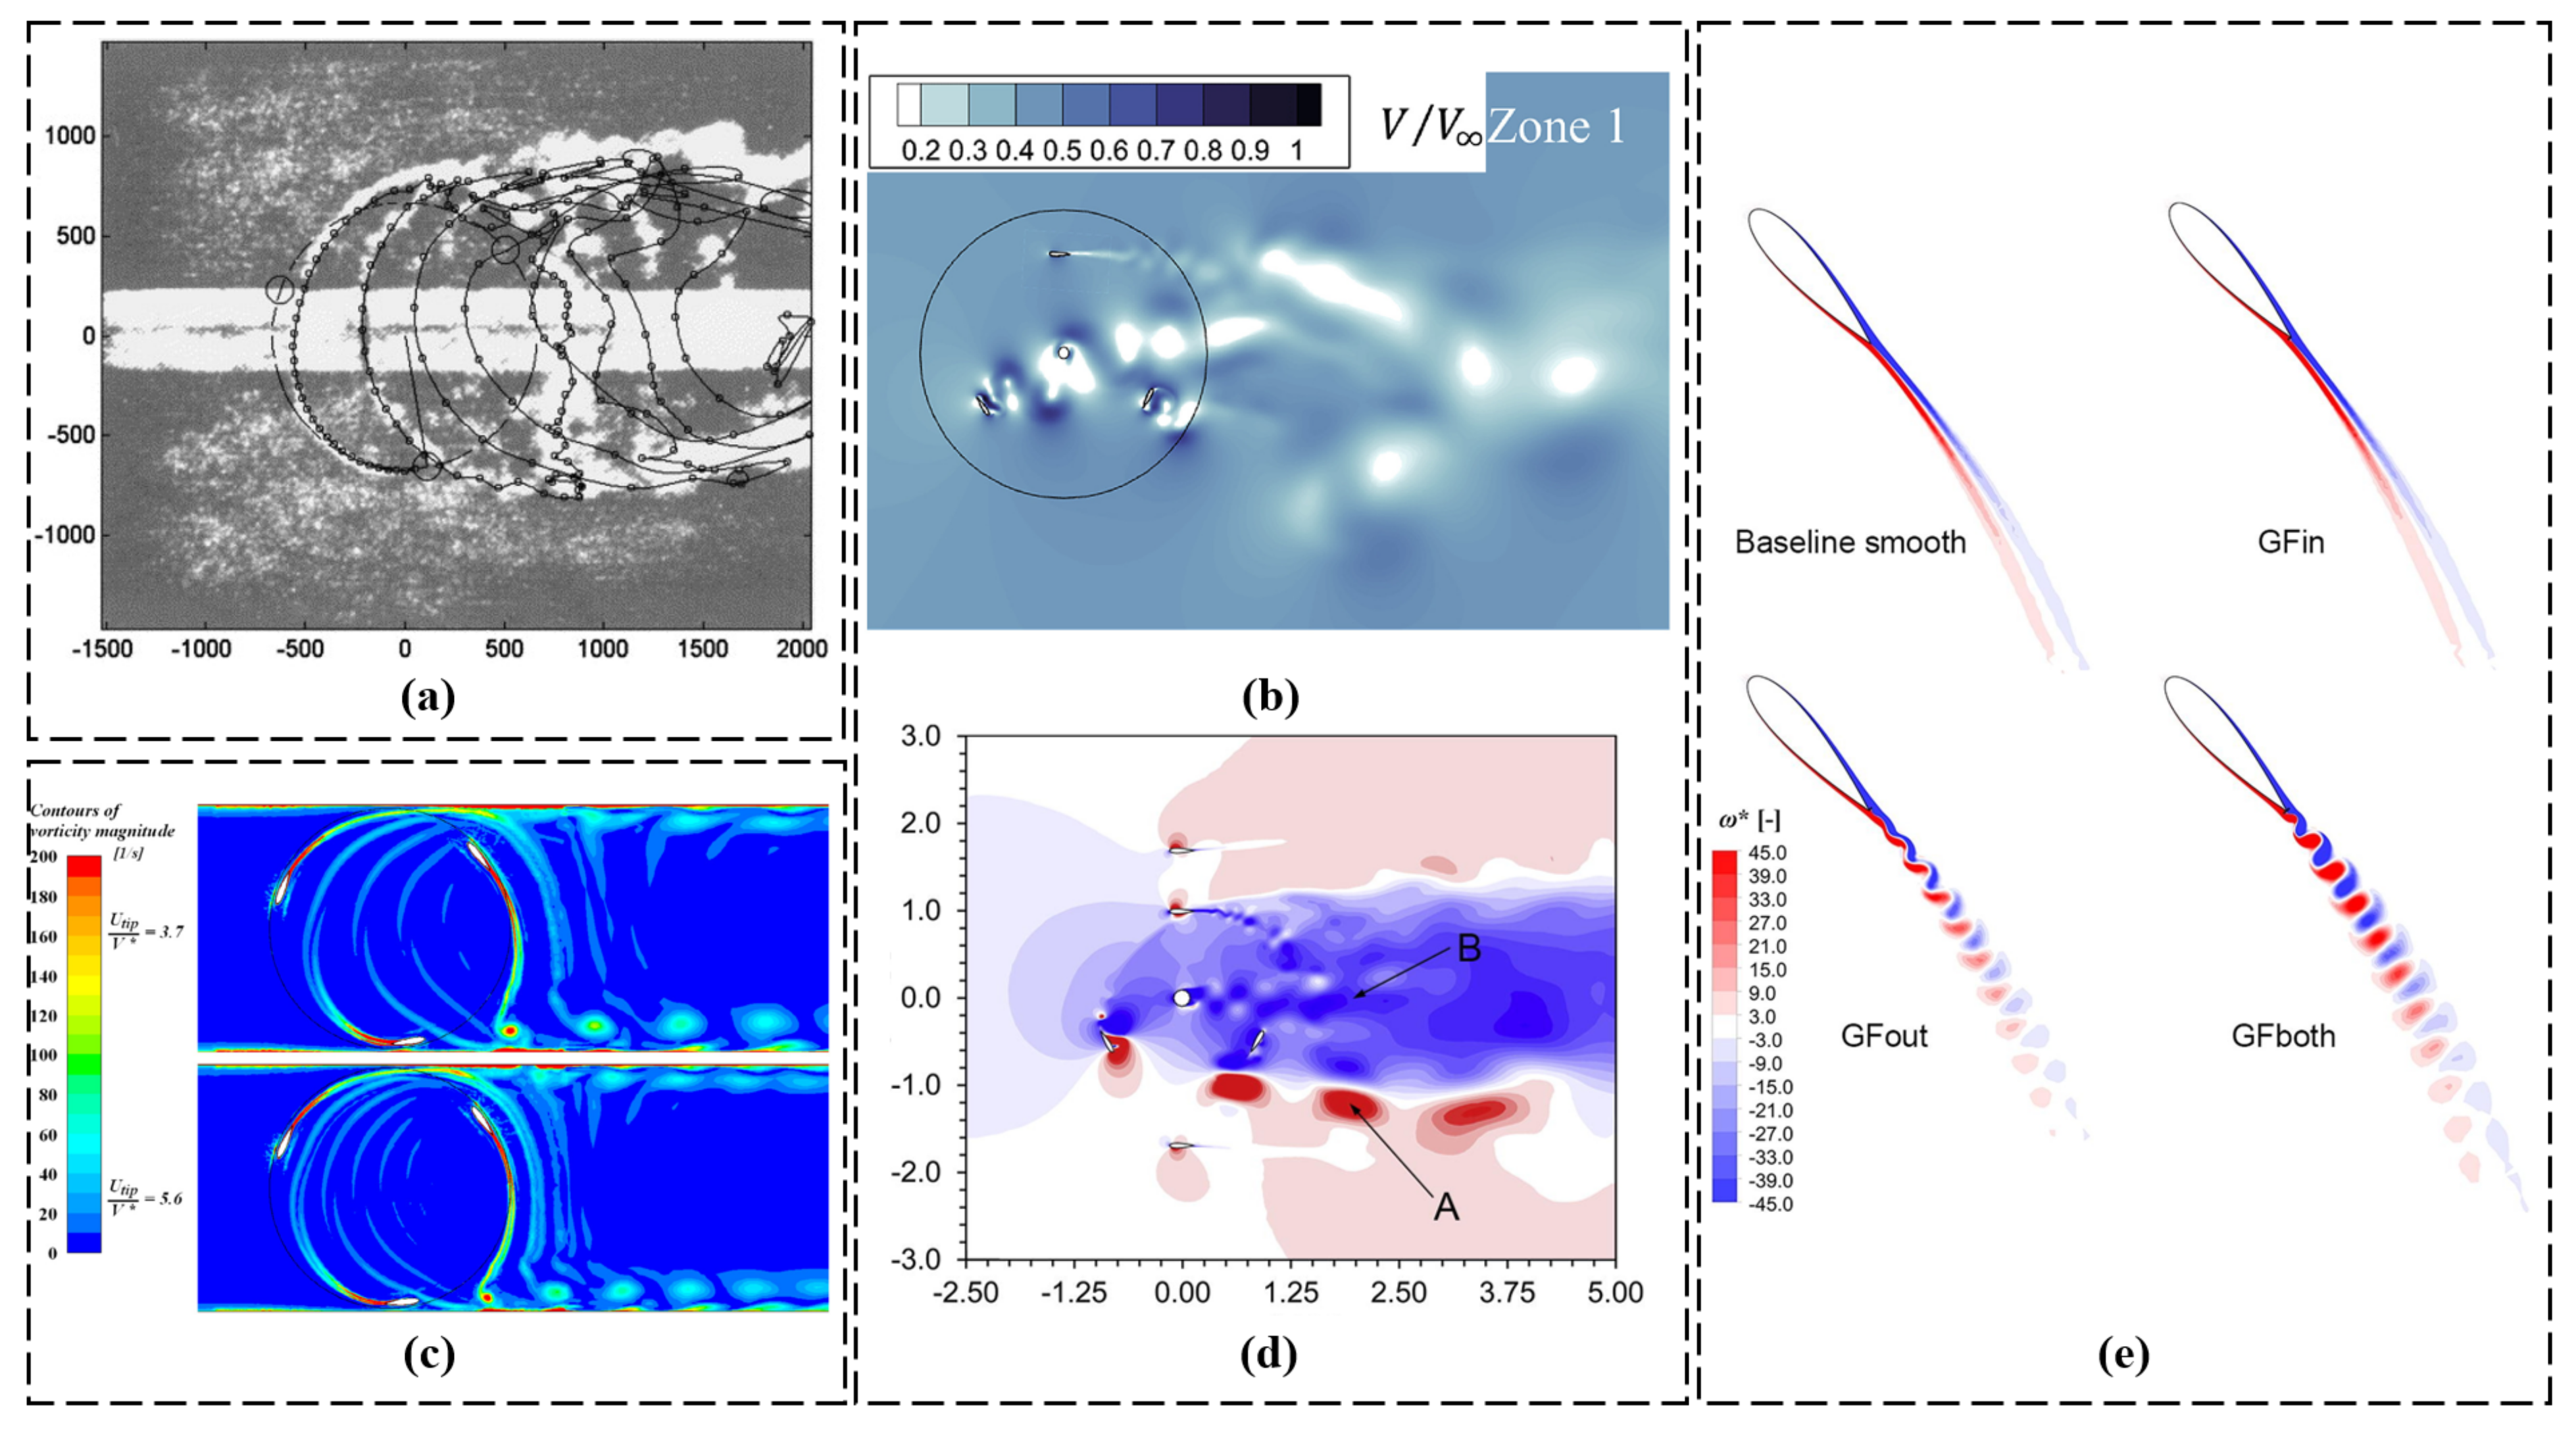

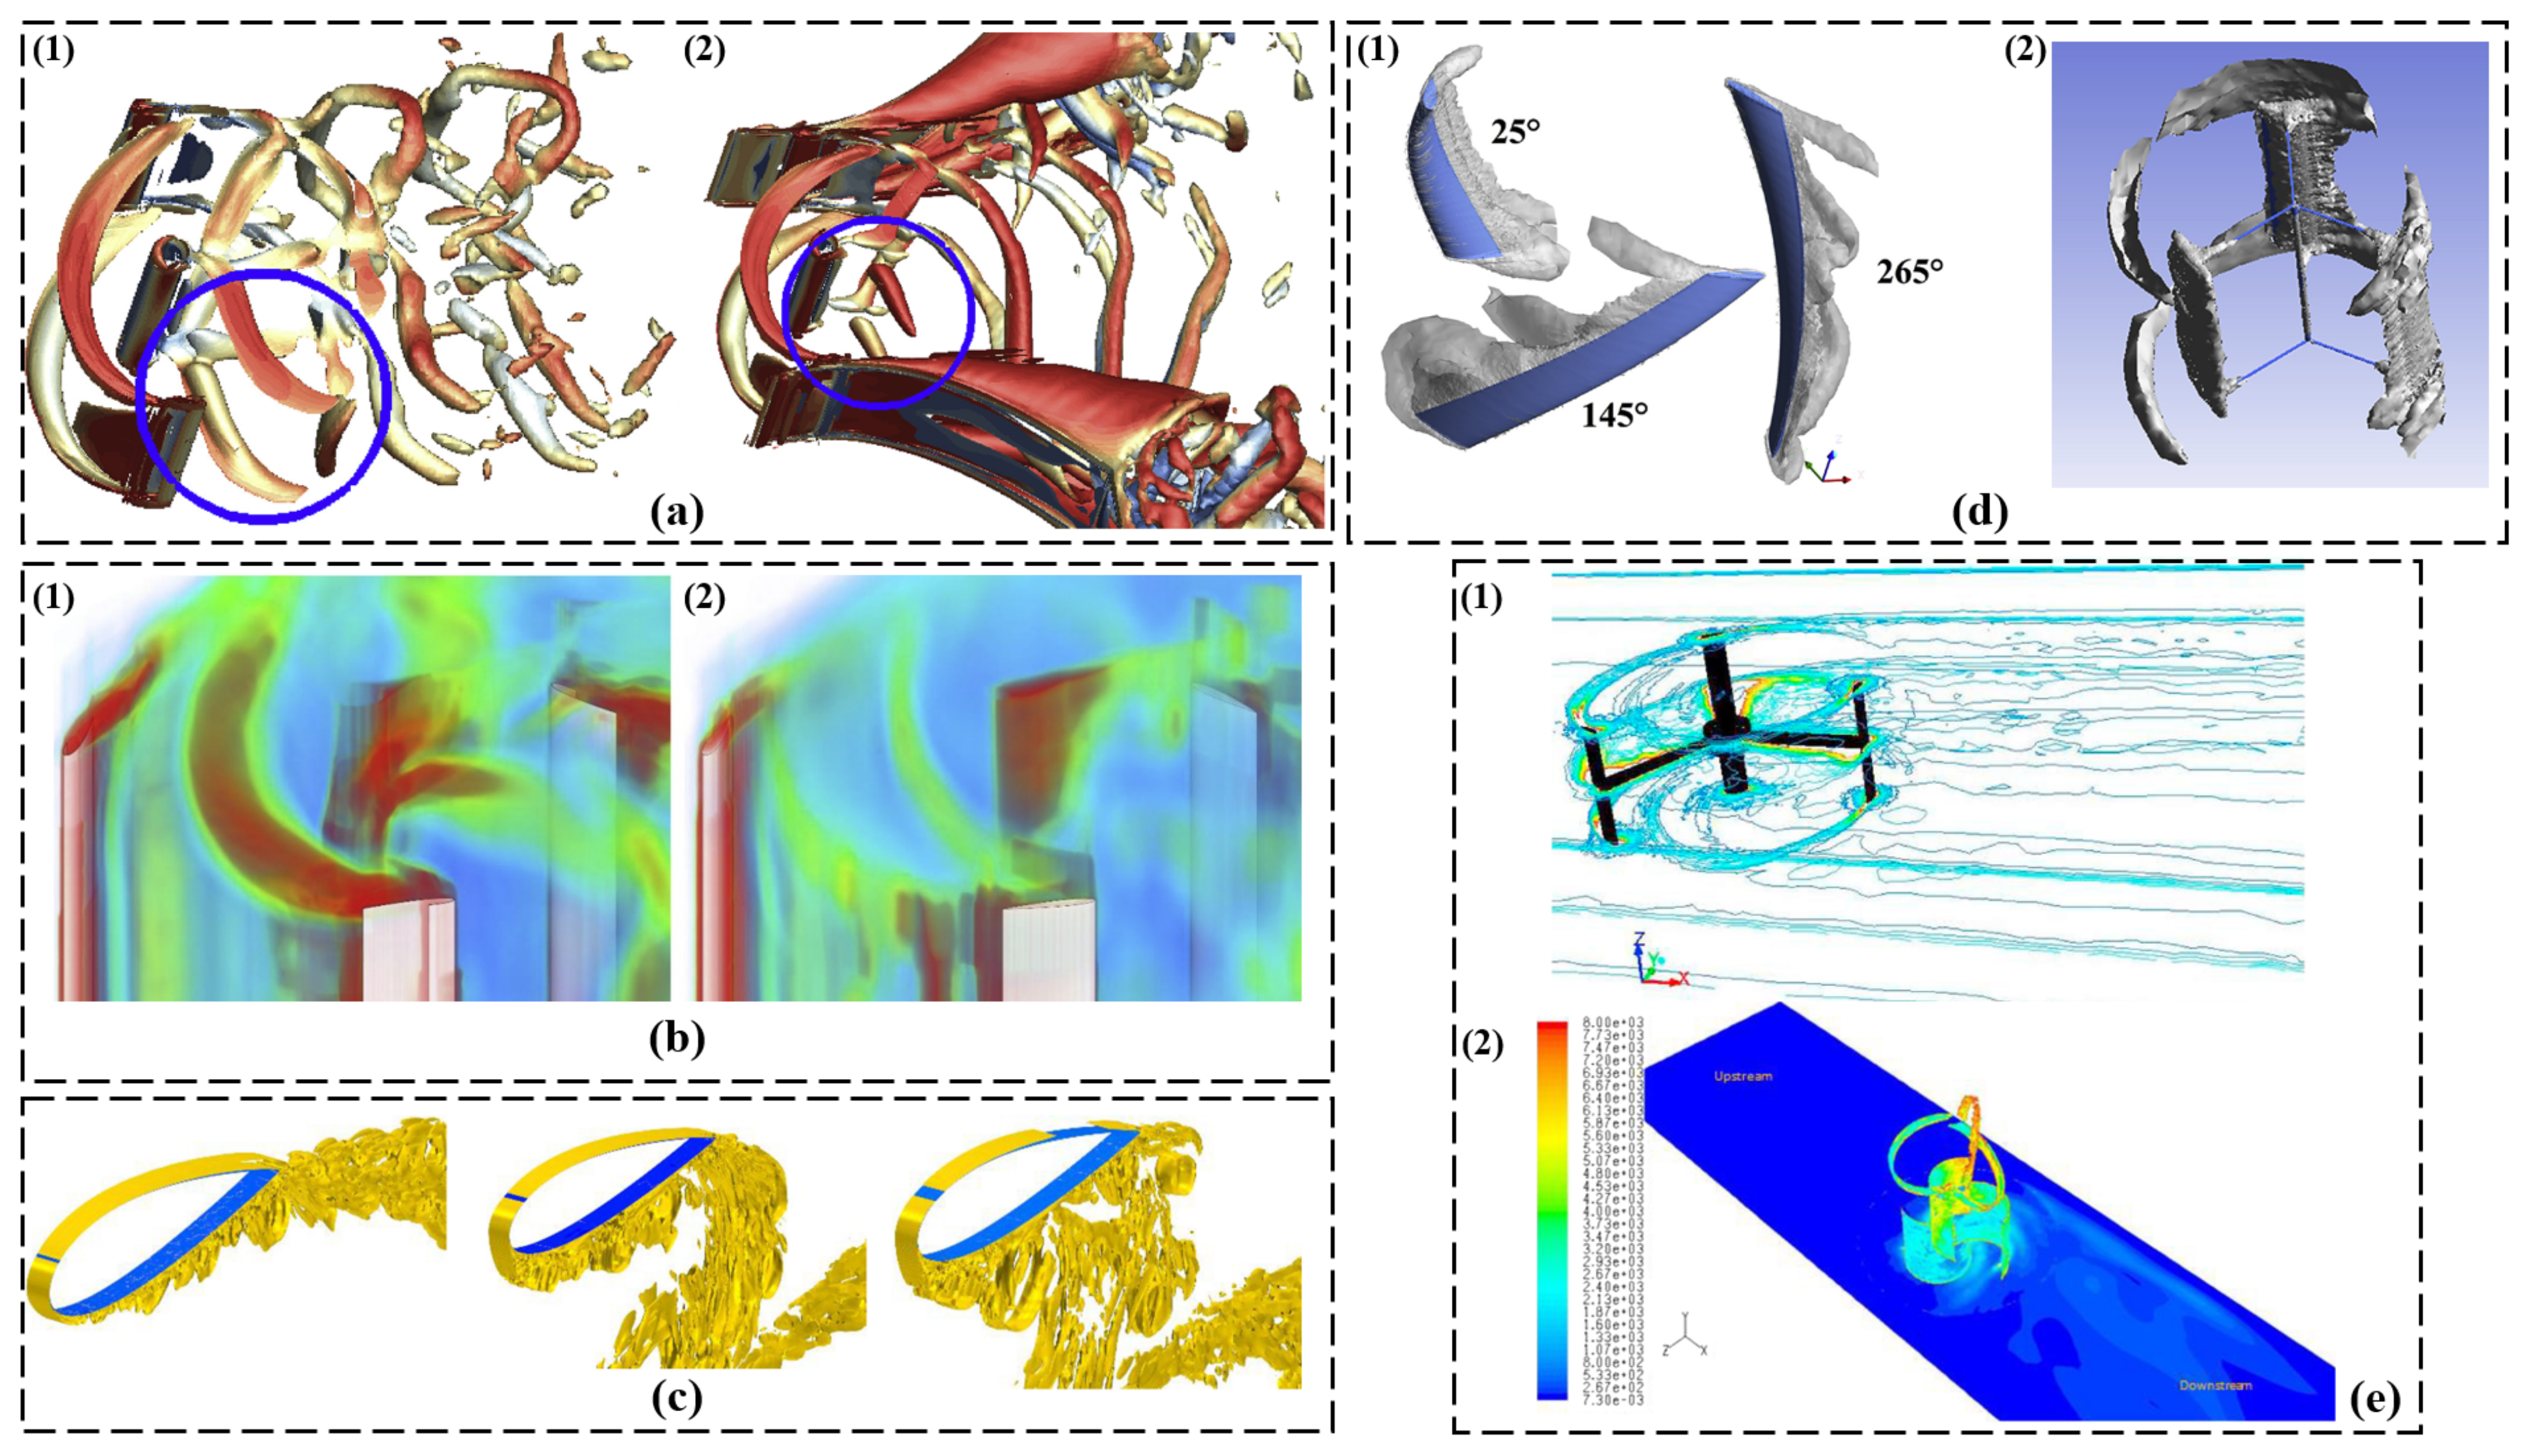
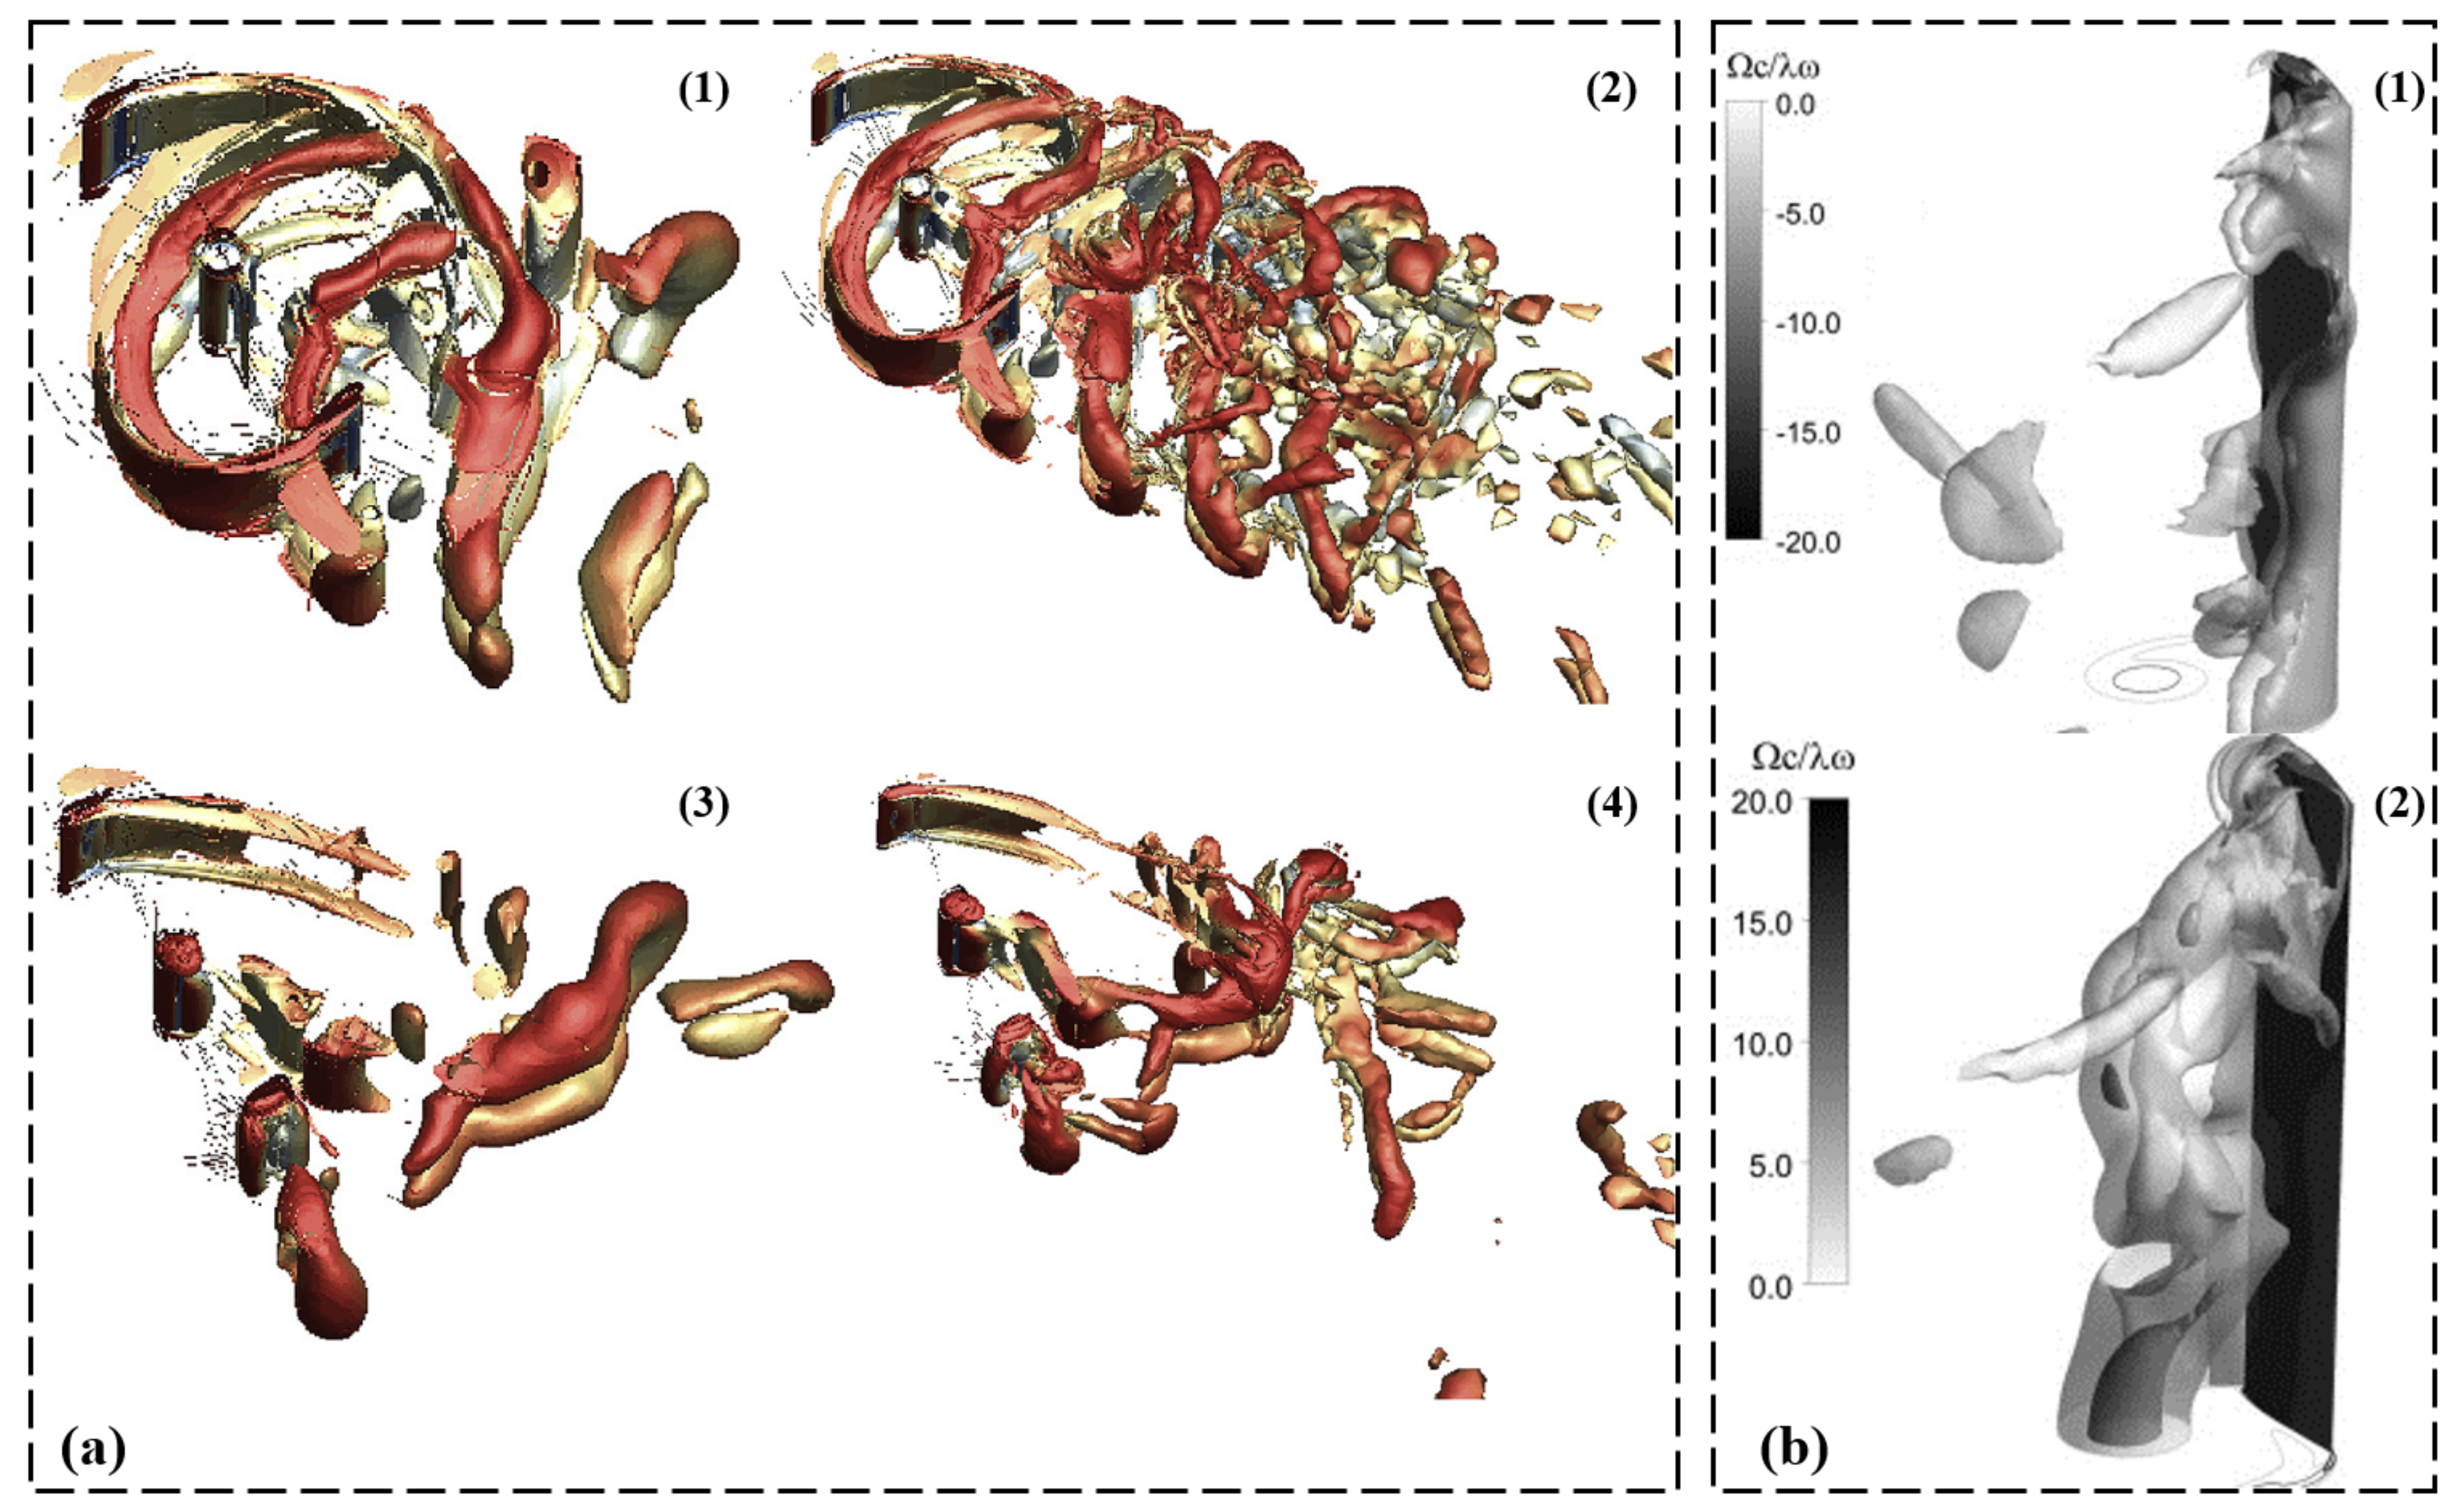
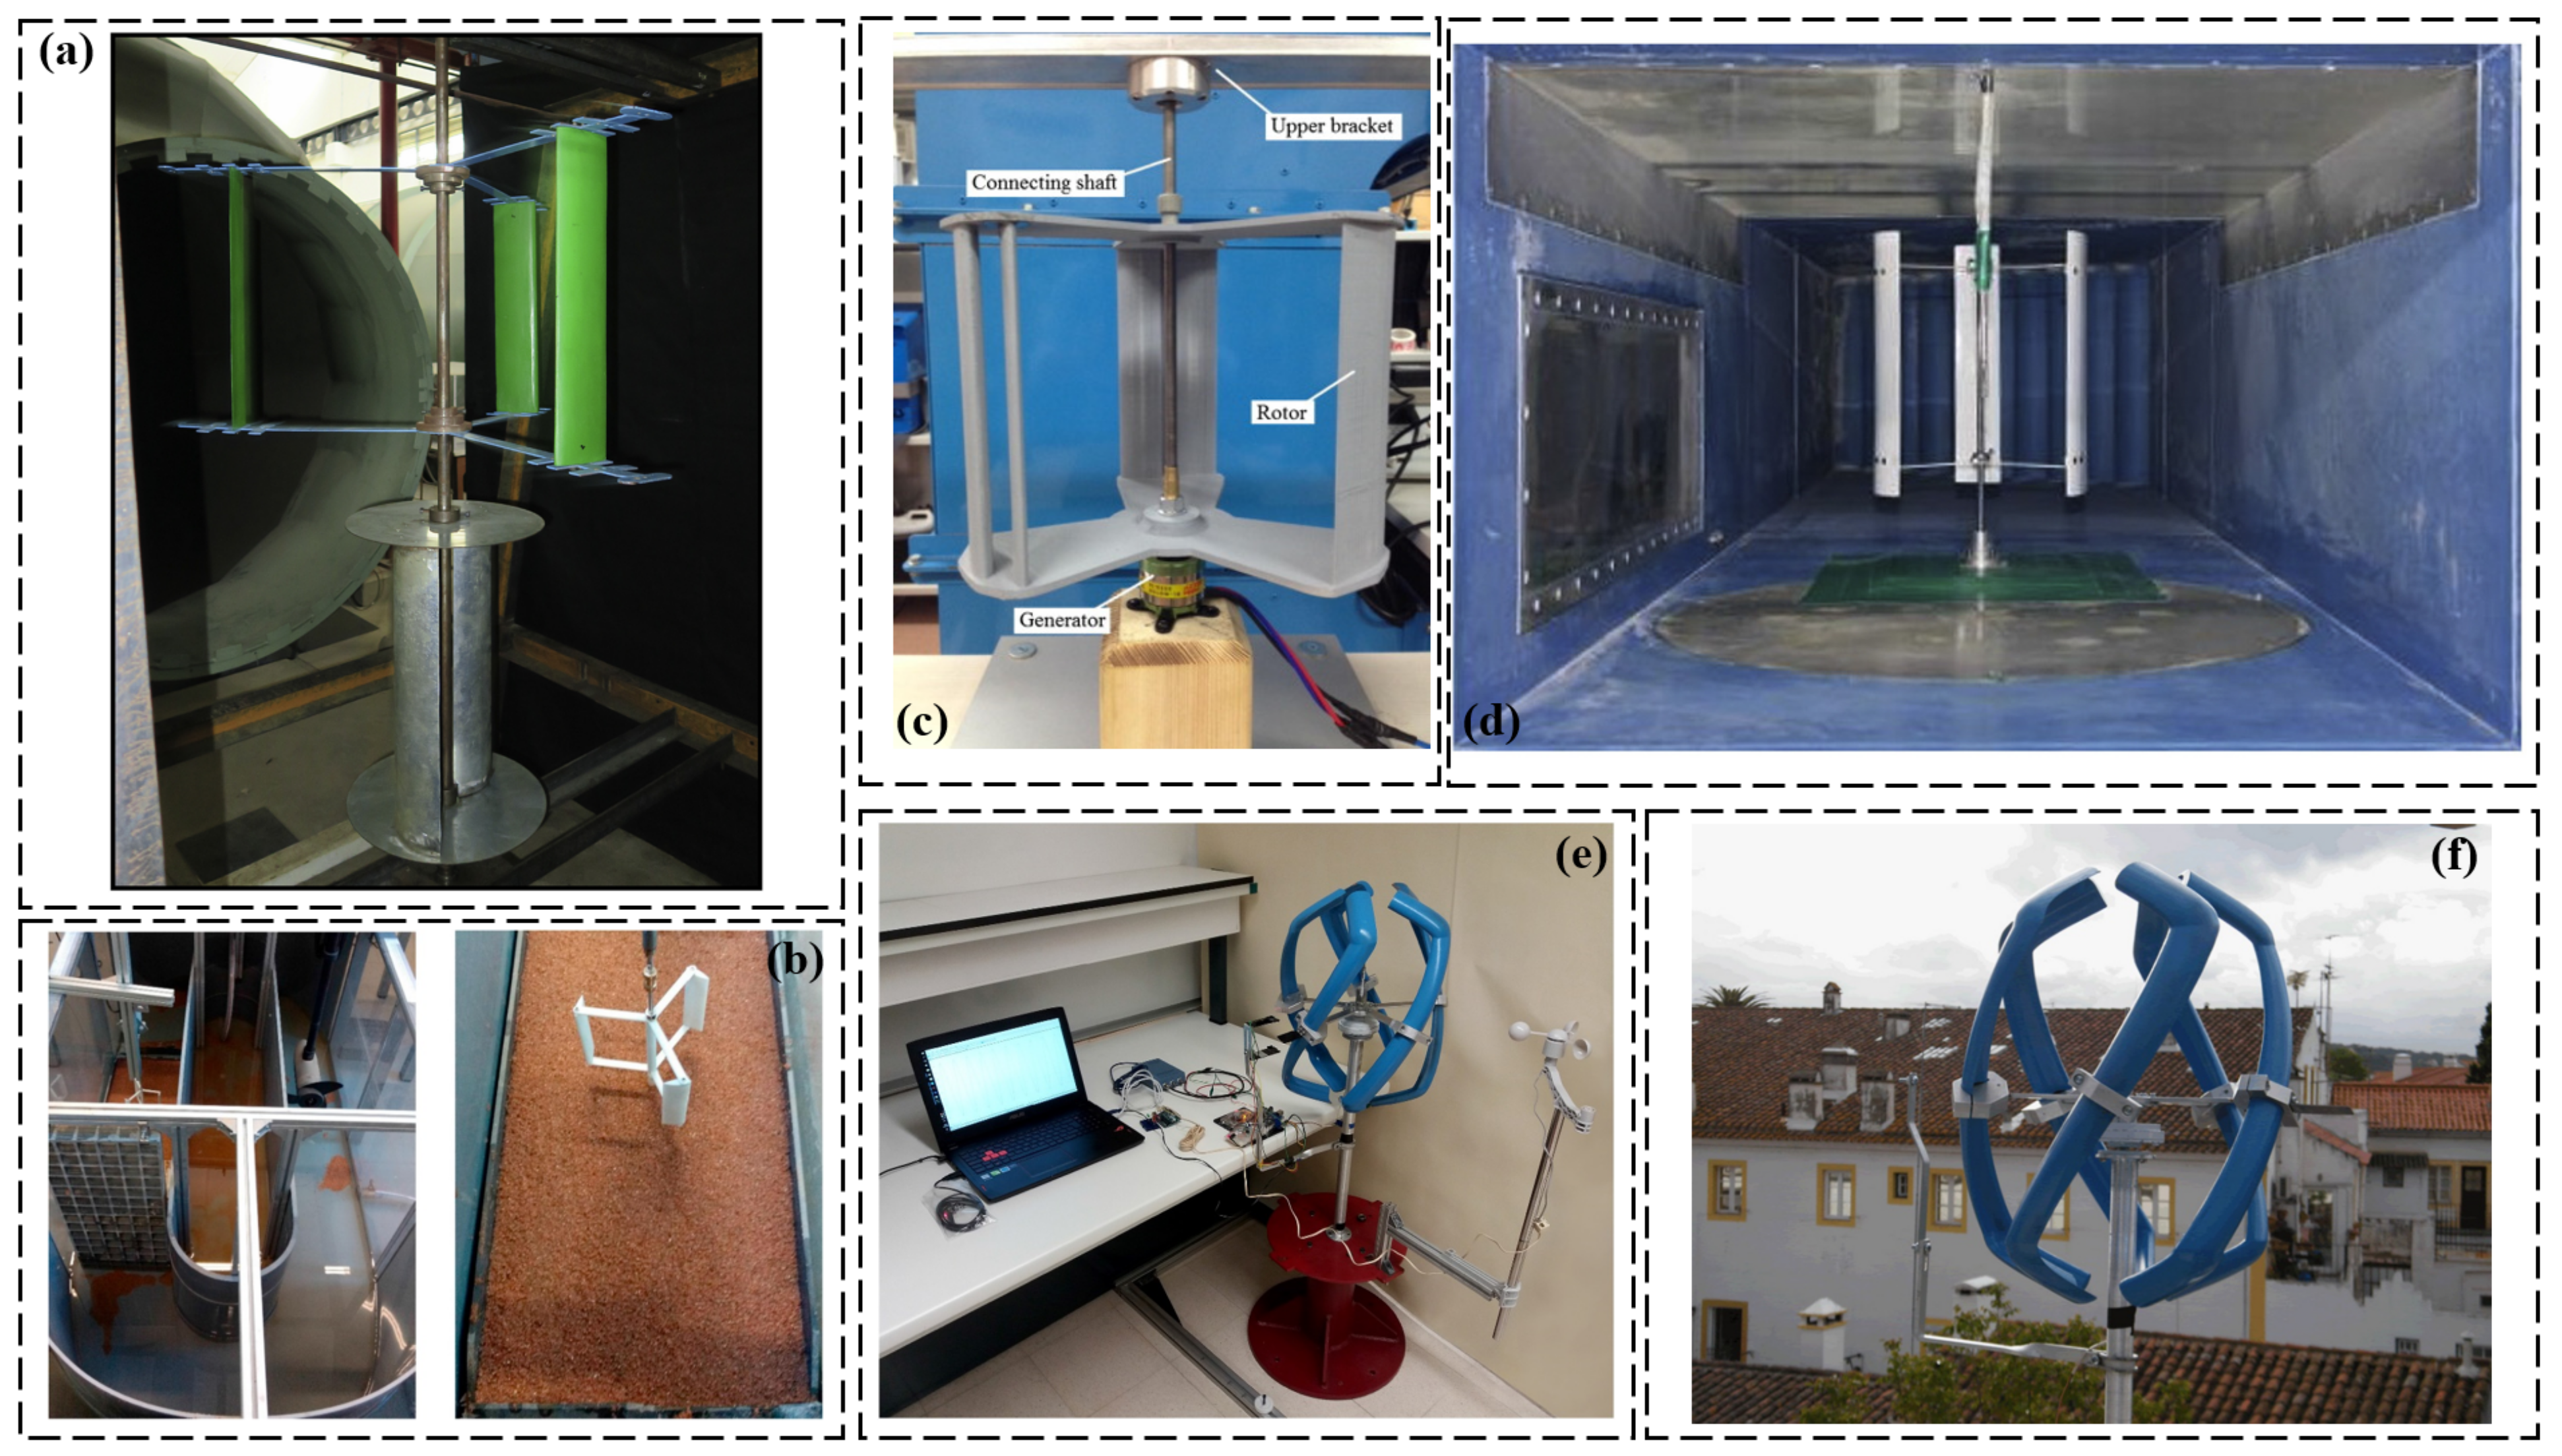
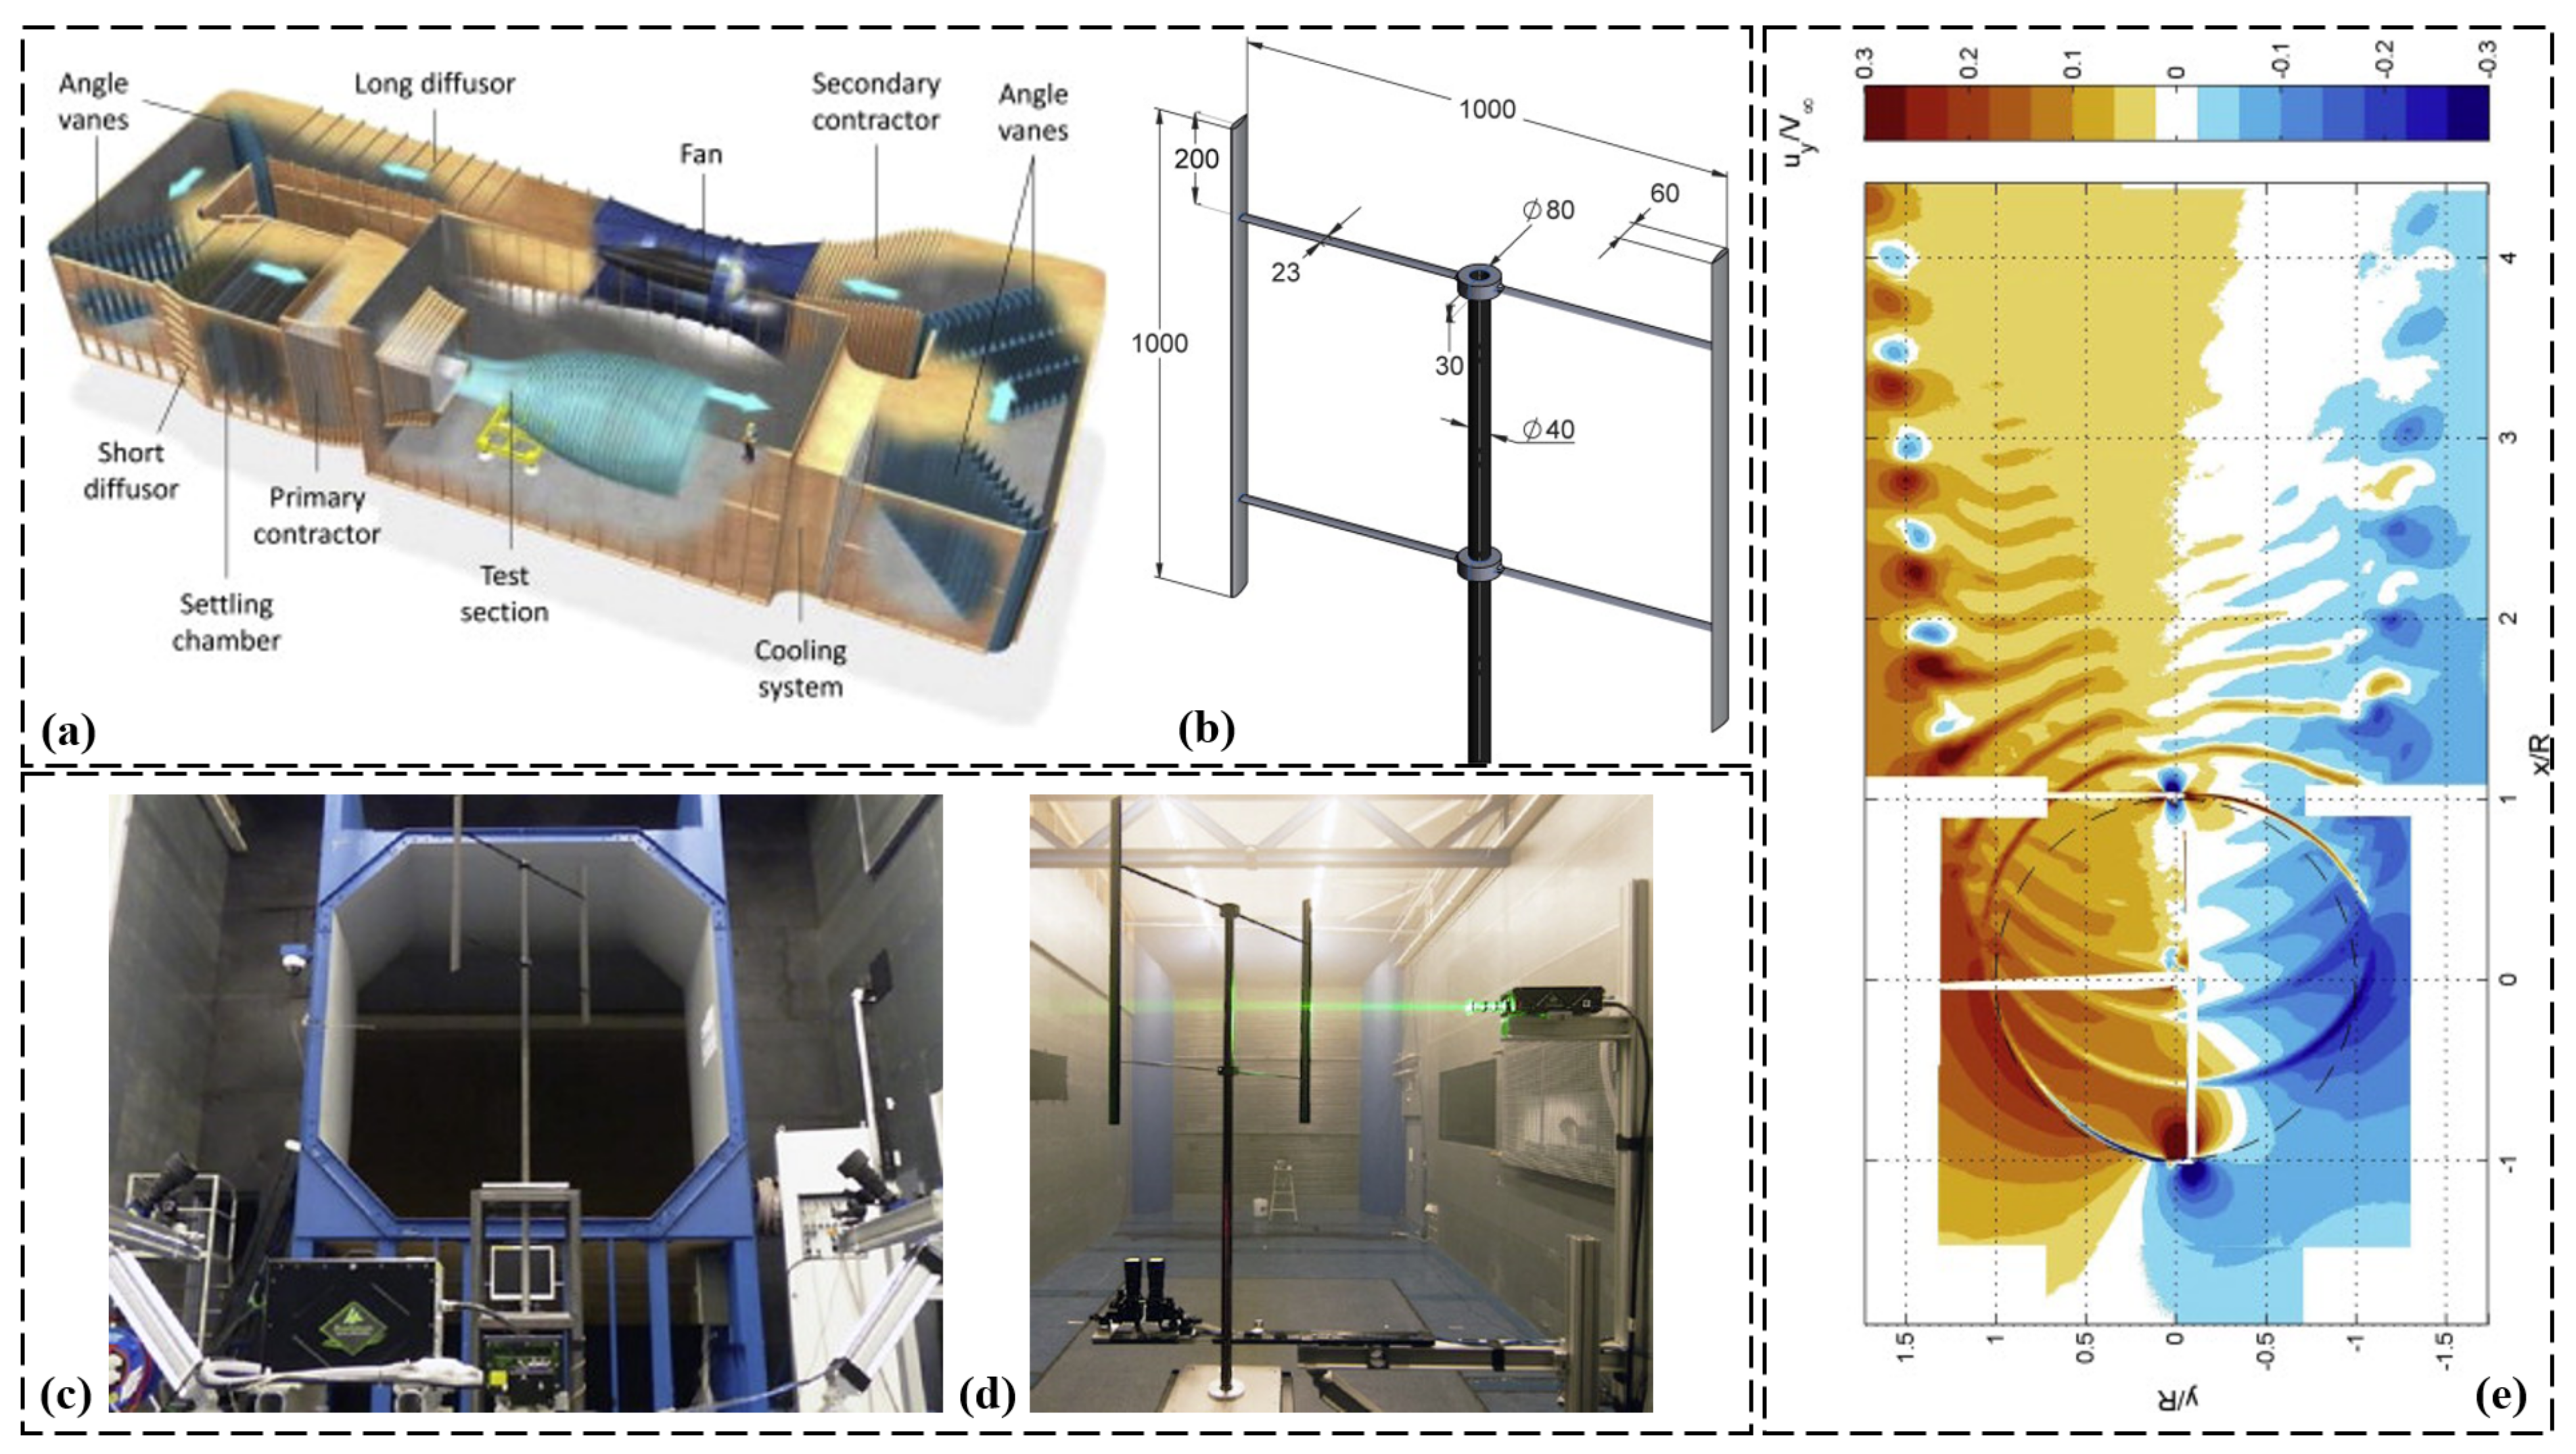
Disclaimer/Publisher’s Note: The statements, opinions and data contained in all publications are solely those of the individual author(s) and contributor(s) and not of MDPI and/or the editor(s). MDPI and/or the editor(s) disclaim responsibility for any injury to people or property resulting from any ideas, methods, instructions or products referred to in the content. |
© 2023 by the authors. Licensee MDPI, Basel, Switzerland. This article is an open access article distributed under the terms and conditions of the Creative Commons Attribution (CC BY) license (https://creativecommons.org/licenses/by/4.0/).