

Effect of Serpentine Flow Field Channel Dimensions and Electrode Intrusion on Flow Hydrodynamics in an All-Iron Redox Flow Battery
 ,
, 
Abstract
:1. Introduction
2. Materials and Methods
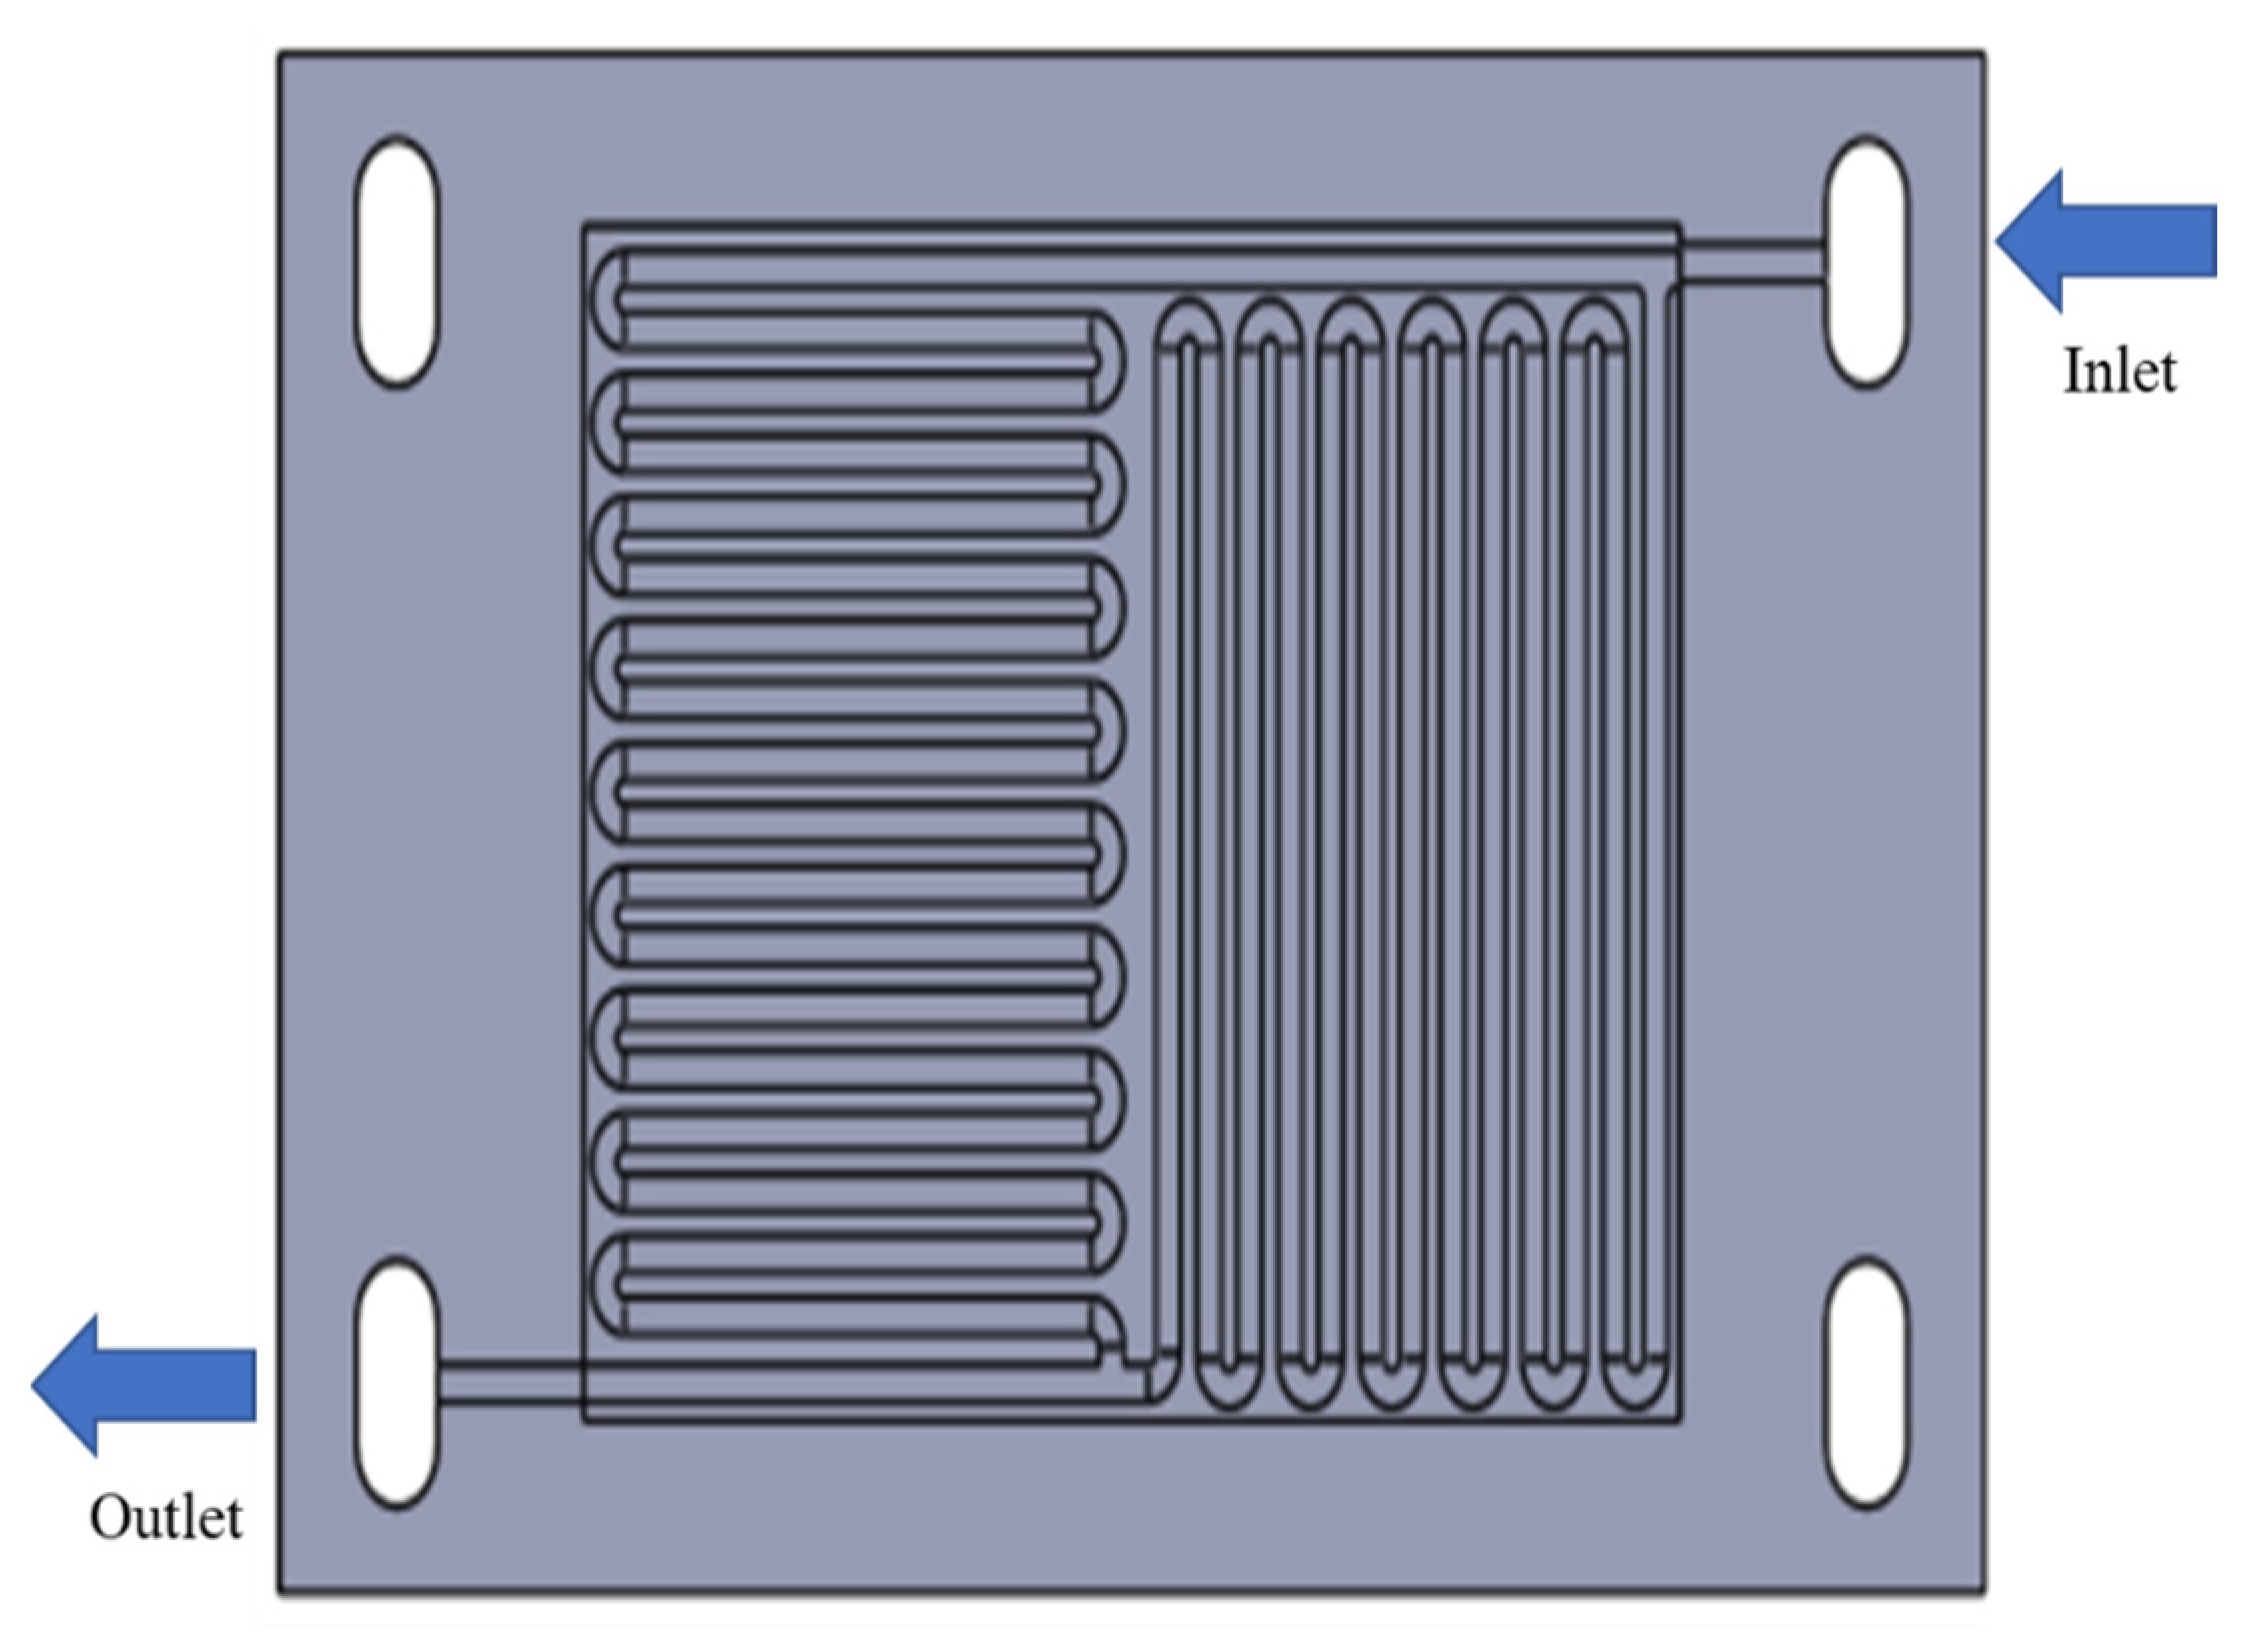
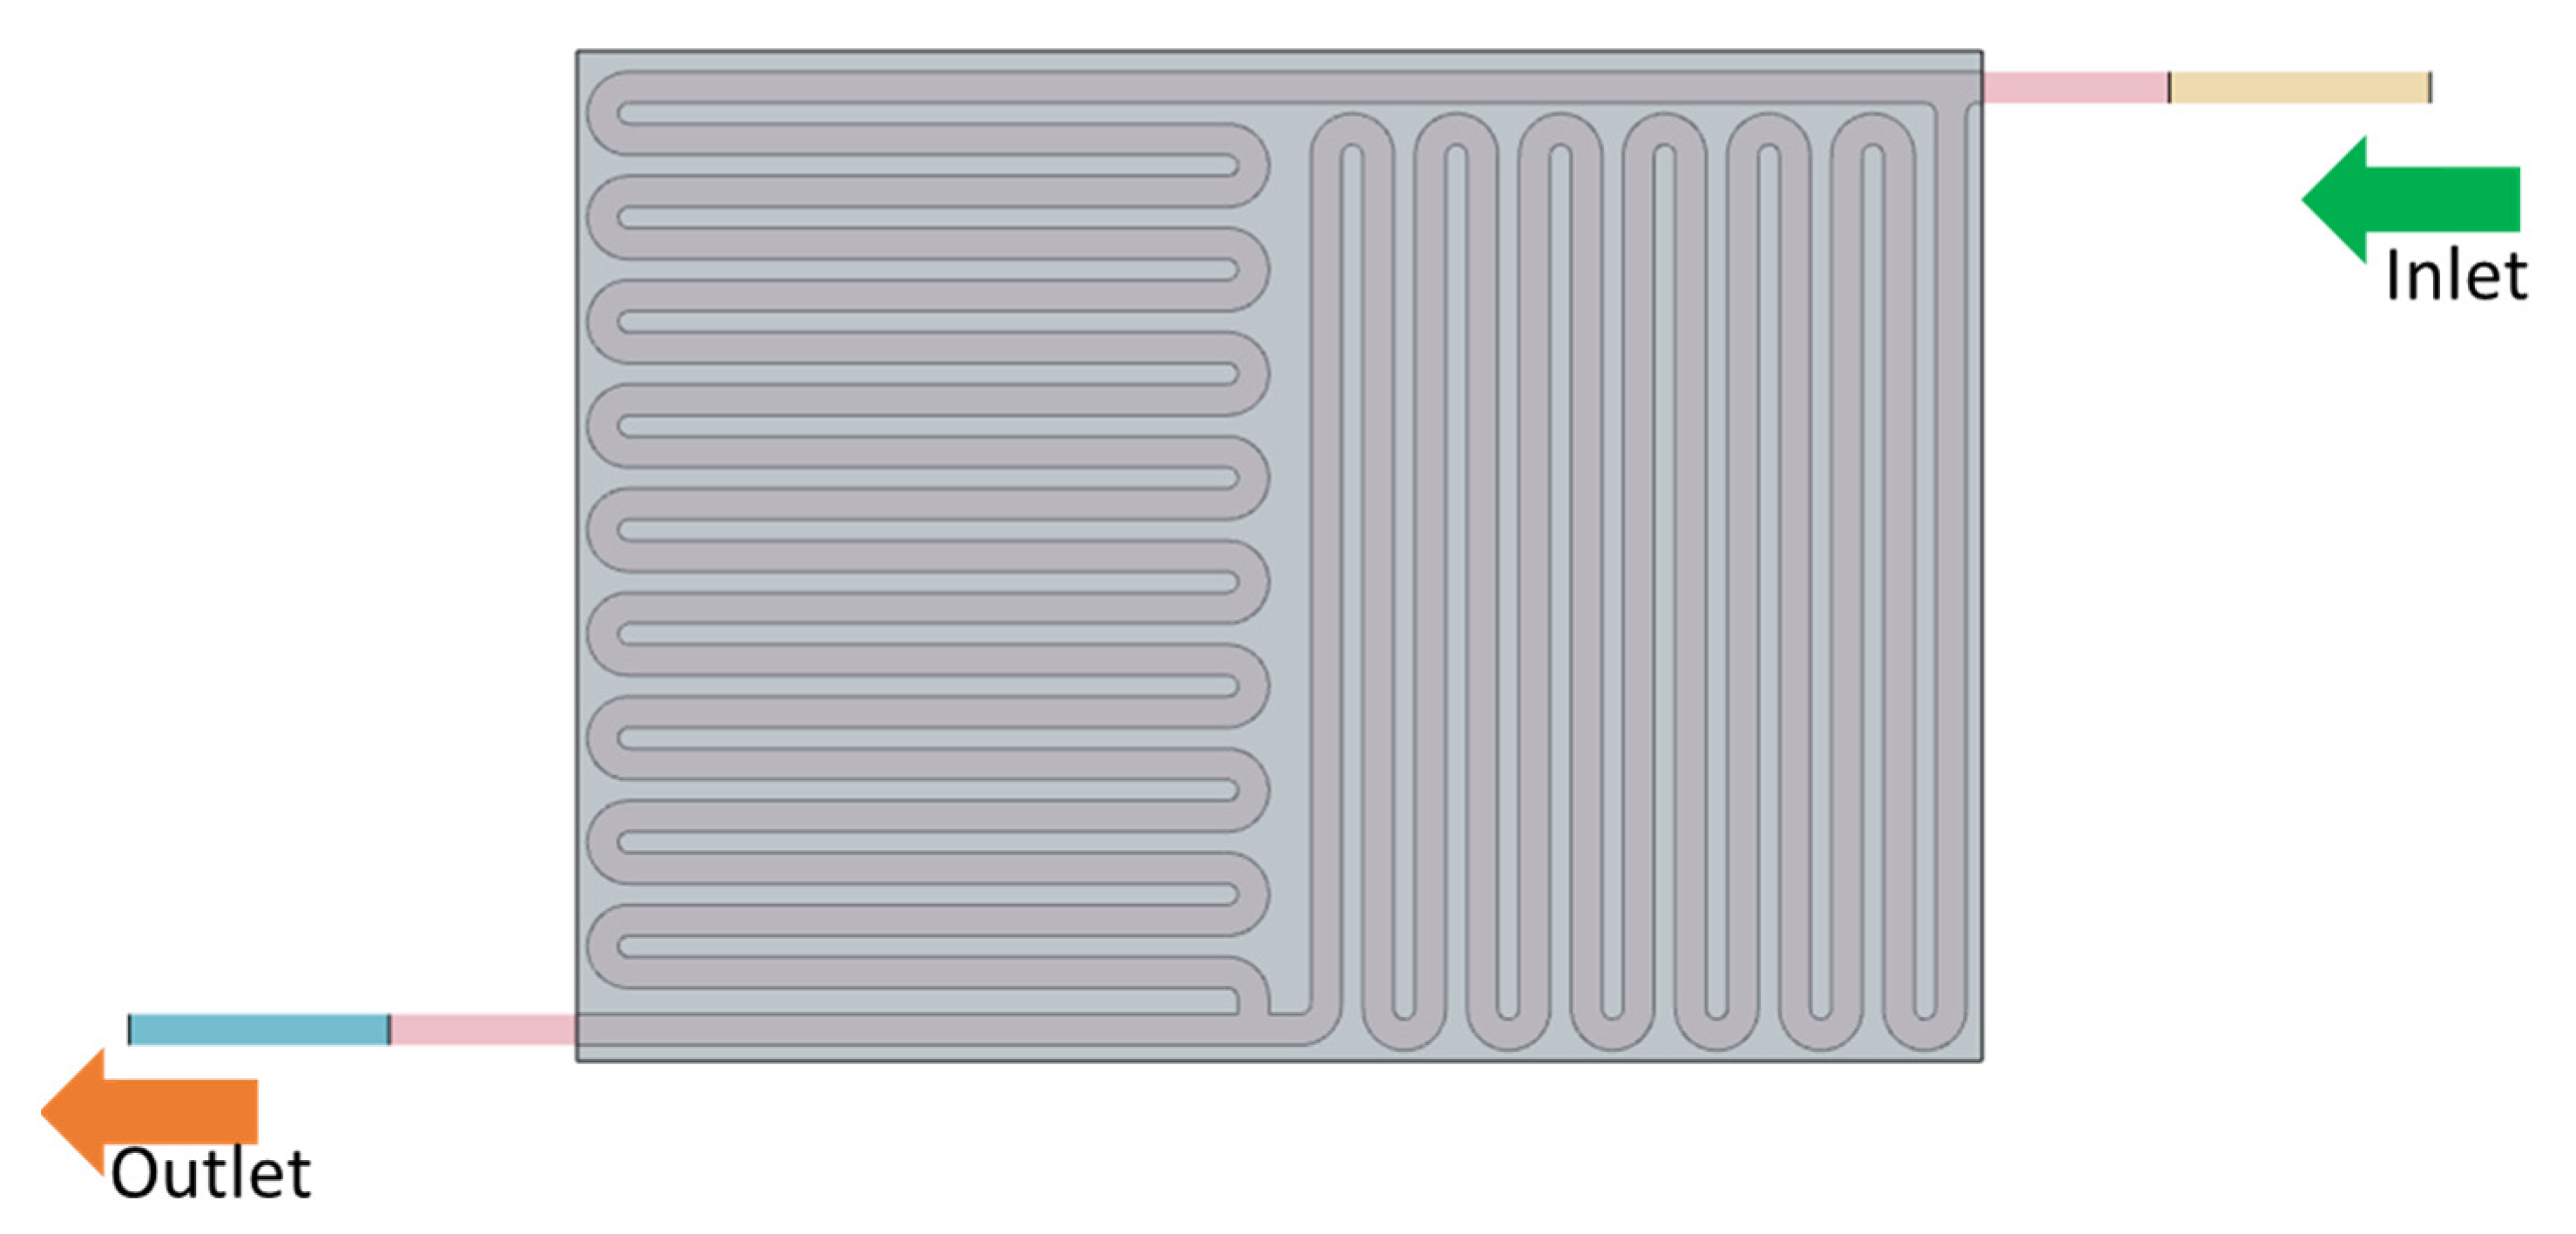
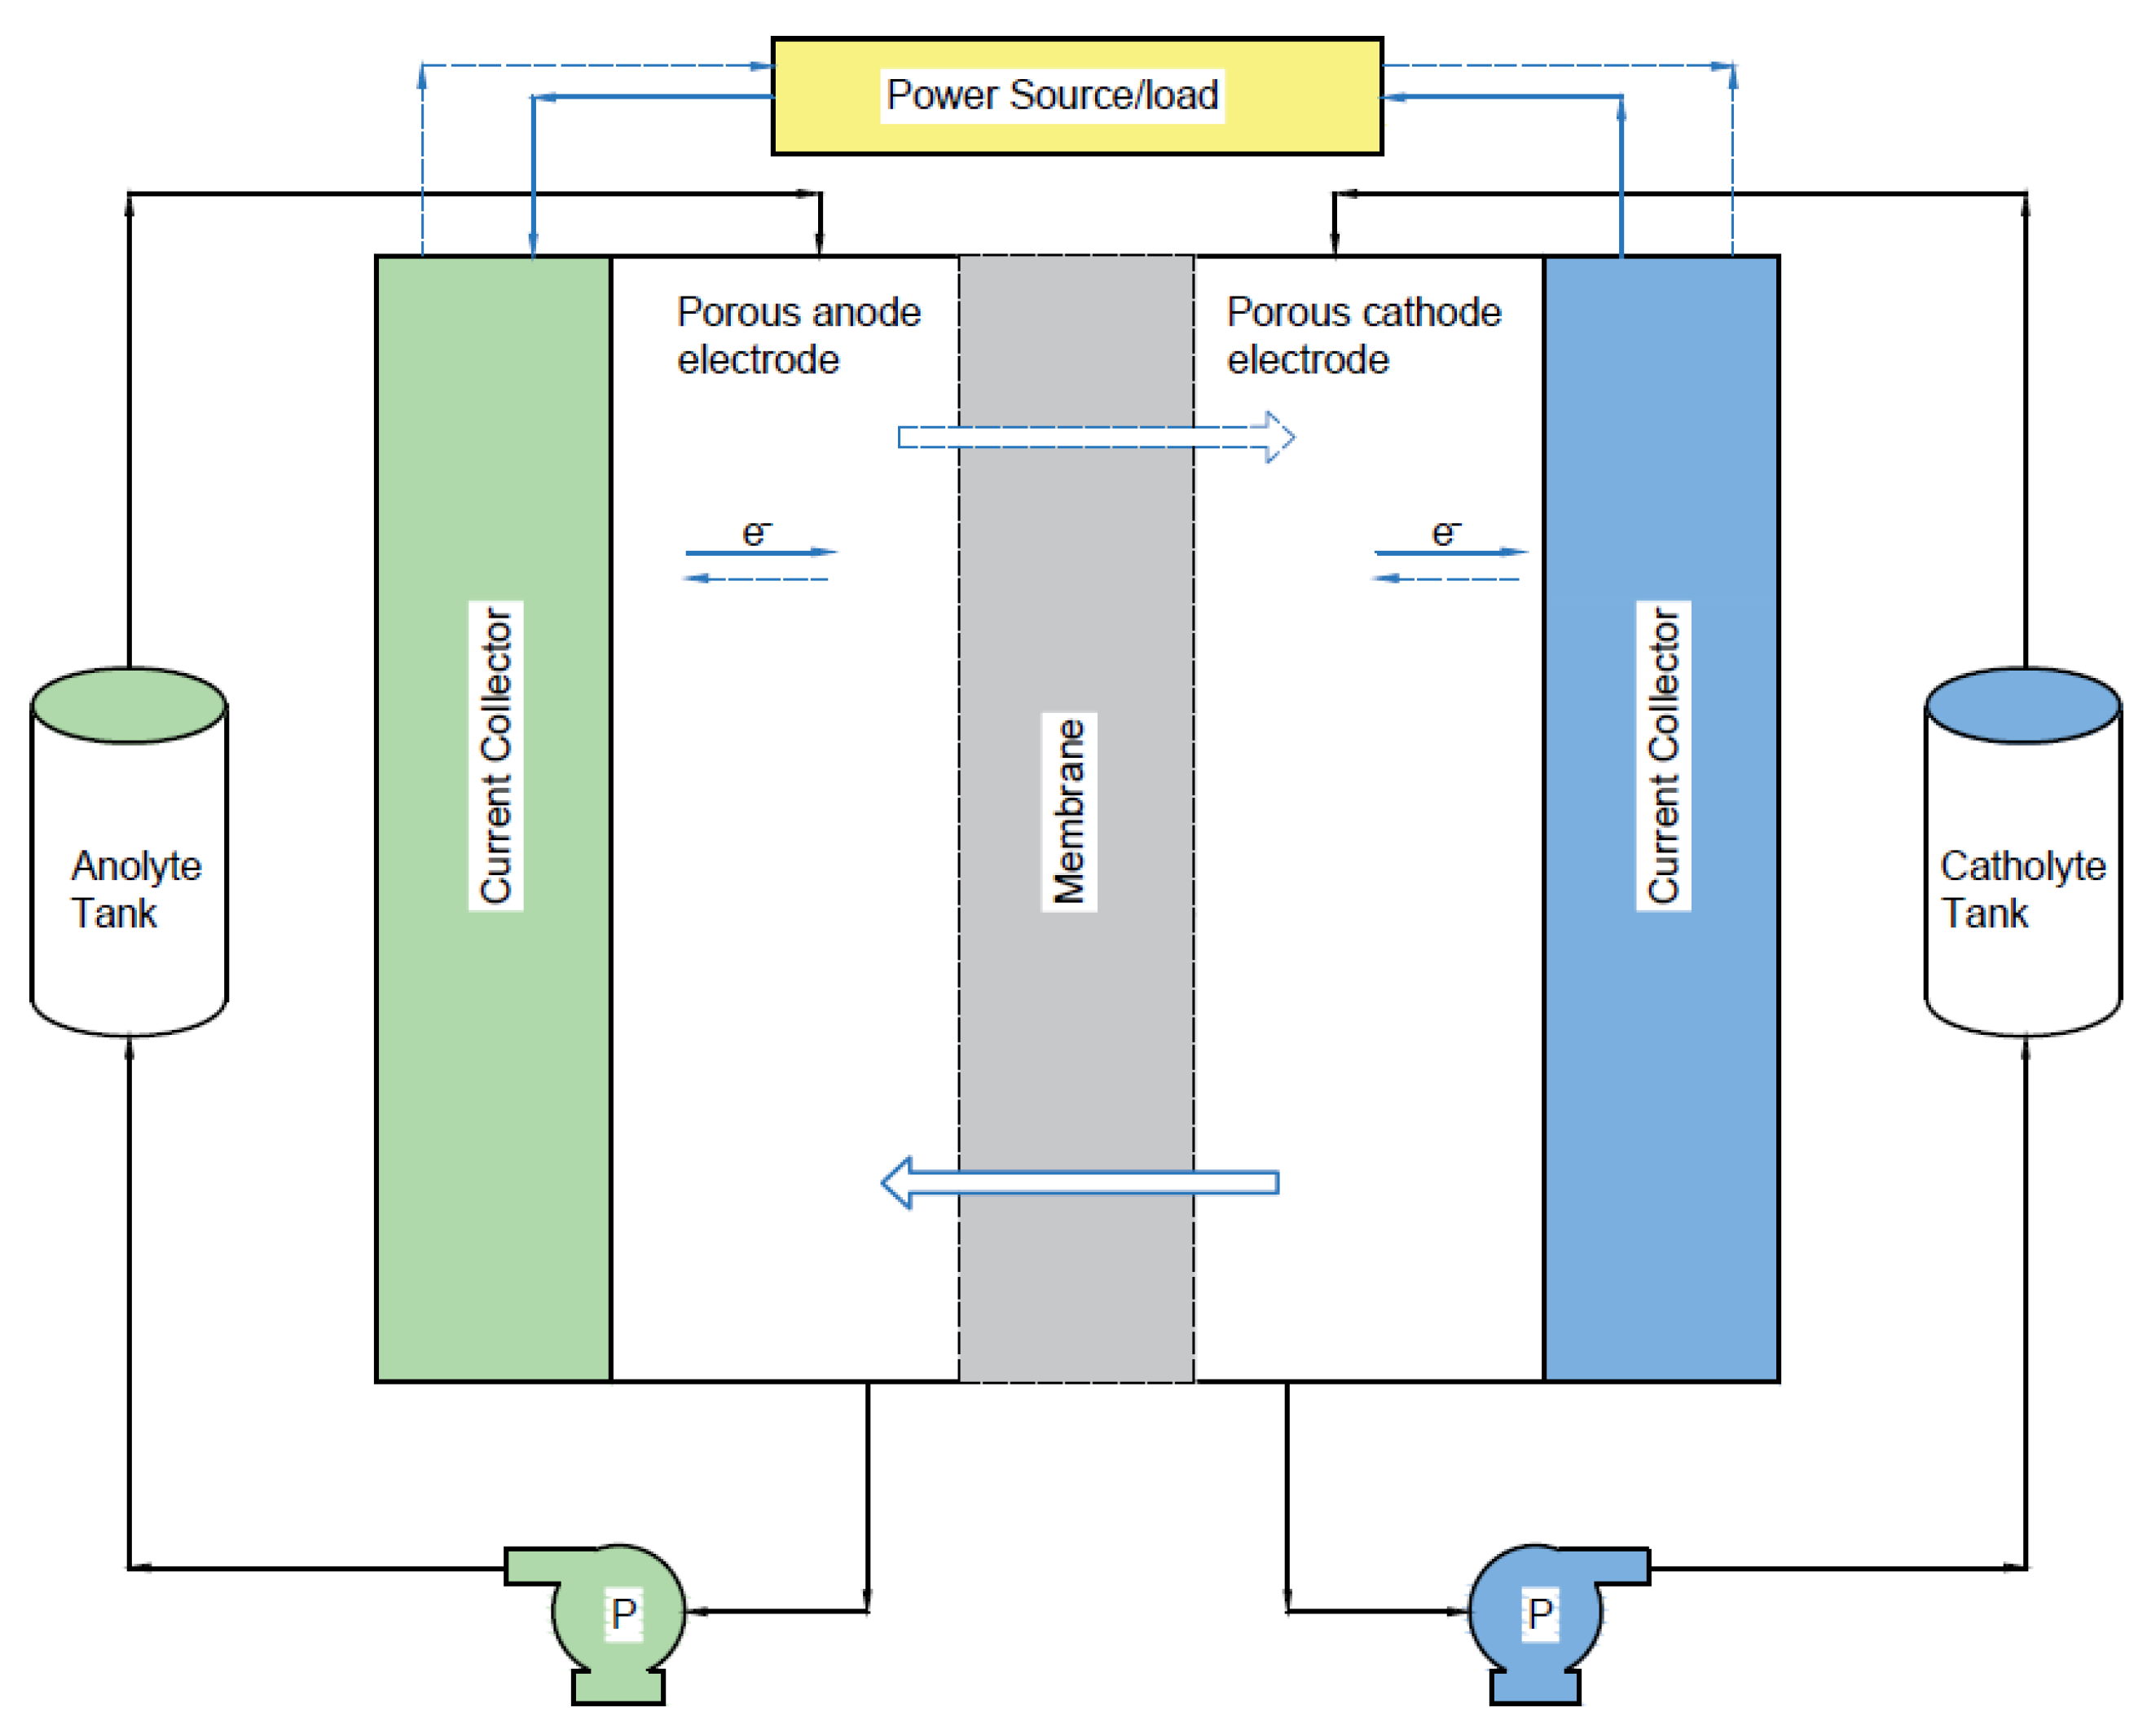
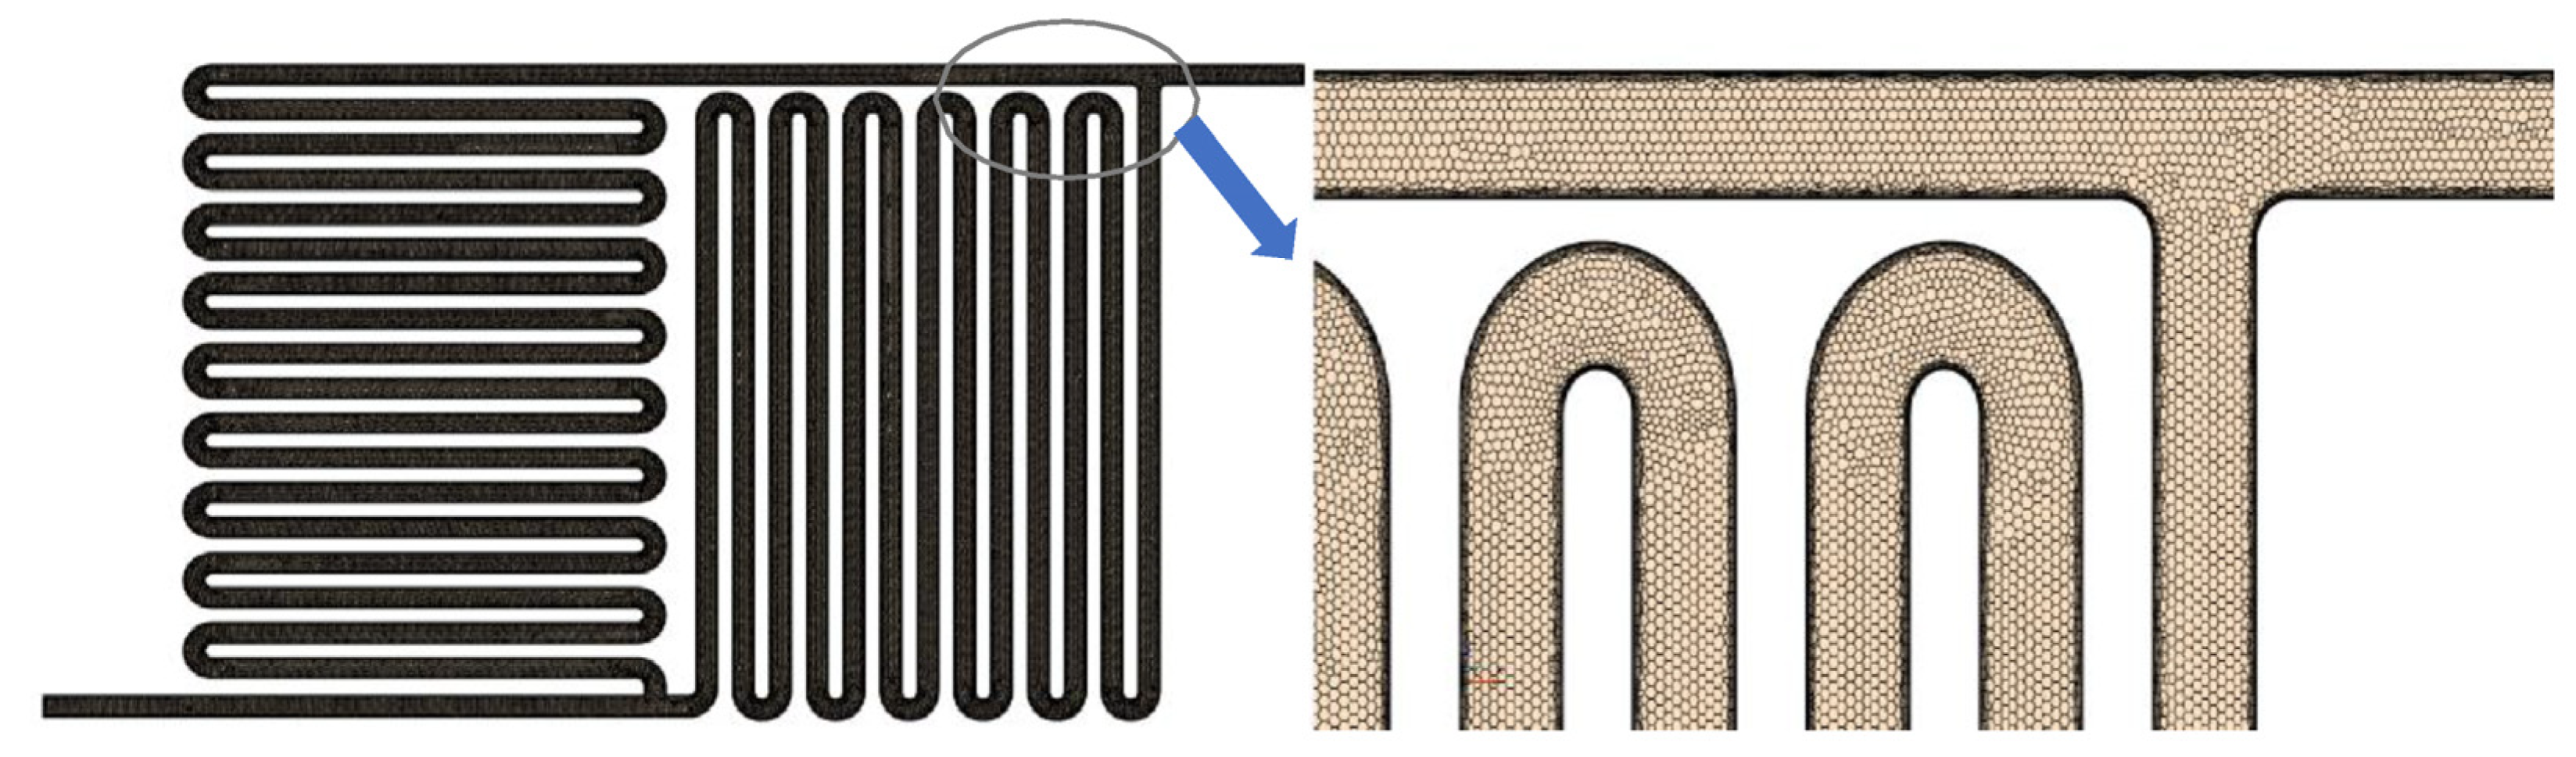
2.1. Flow Field without Felt Model
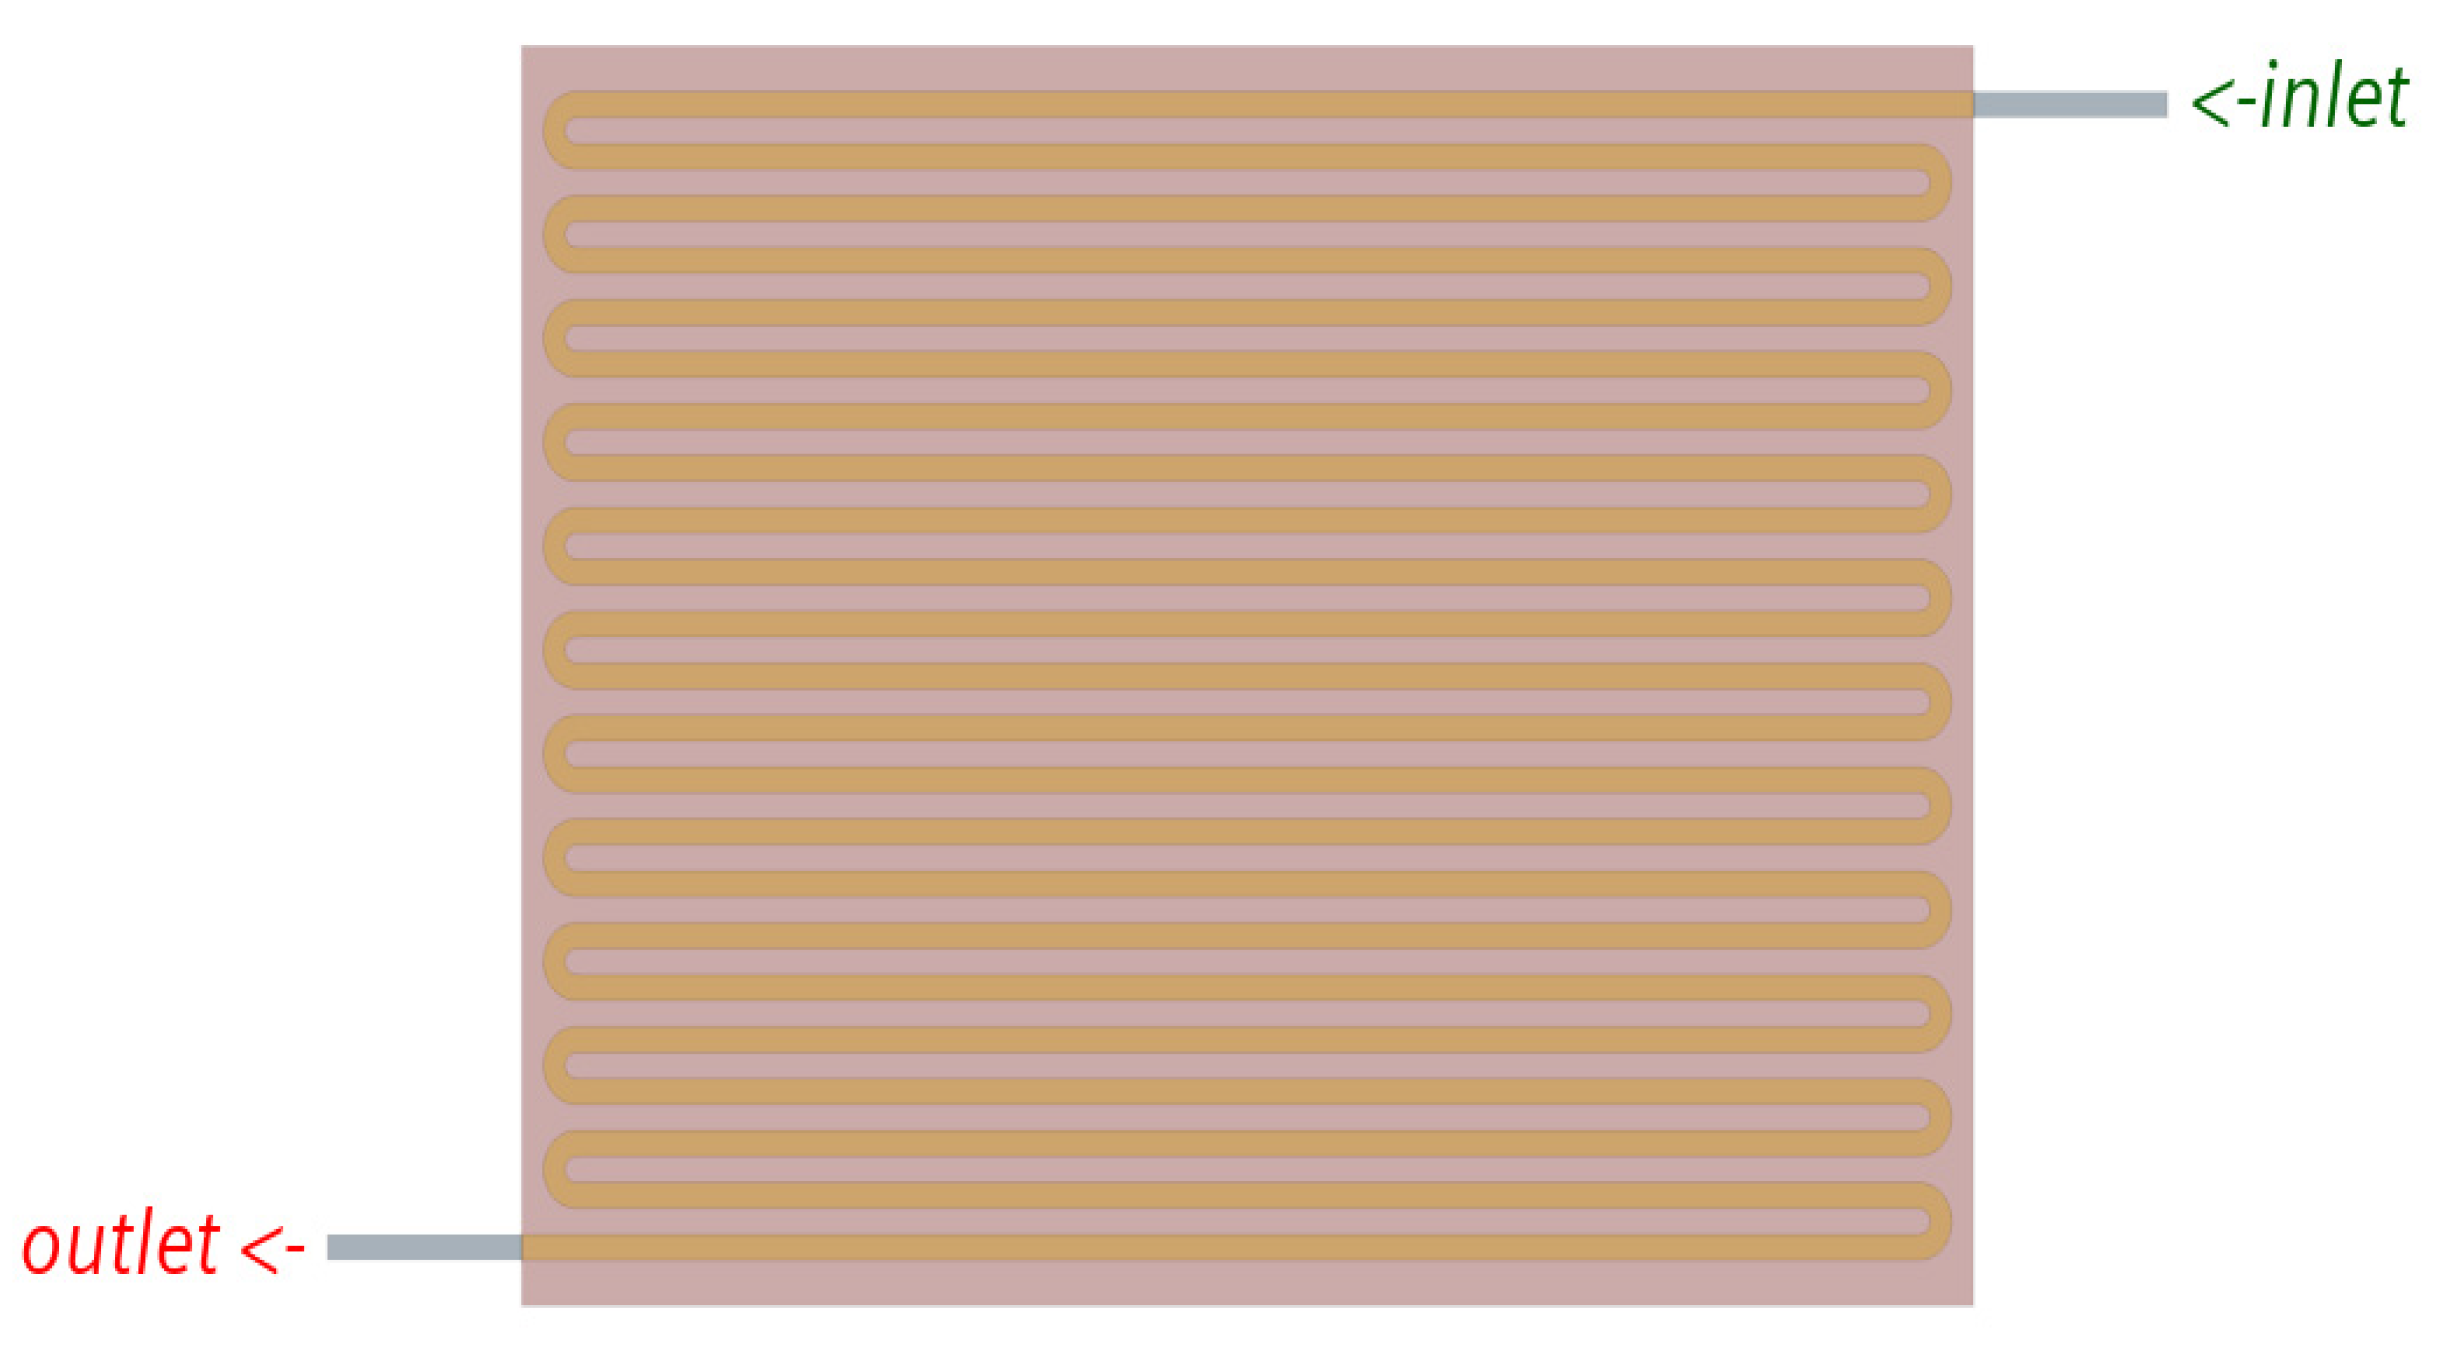
2.2. Flow Field with Felt Model
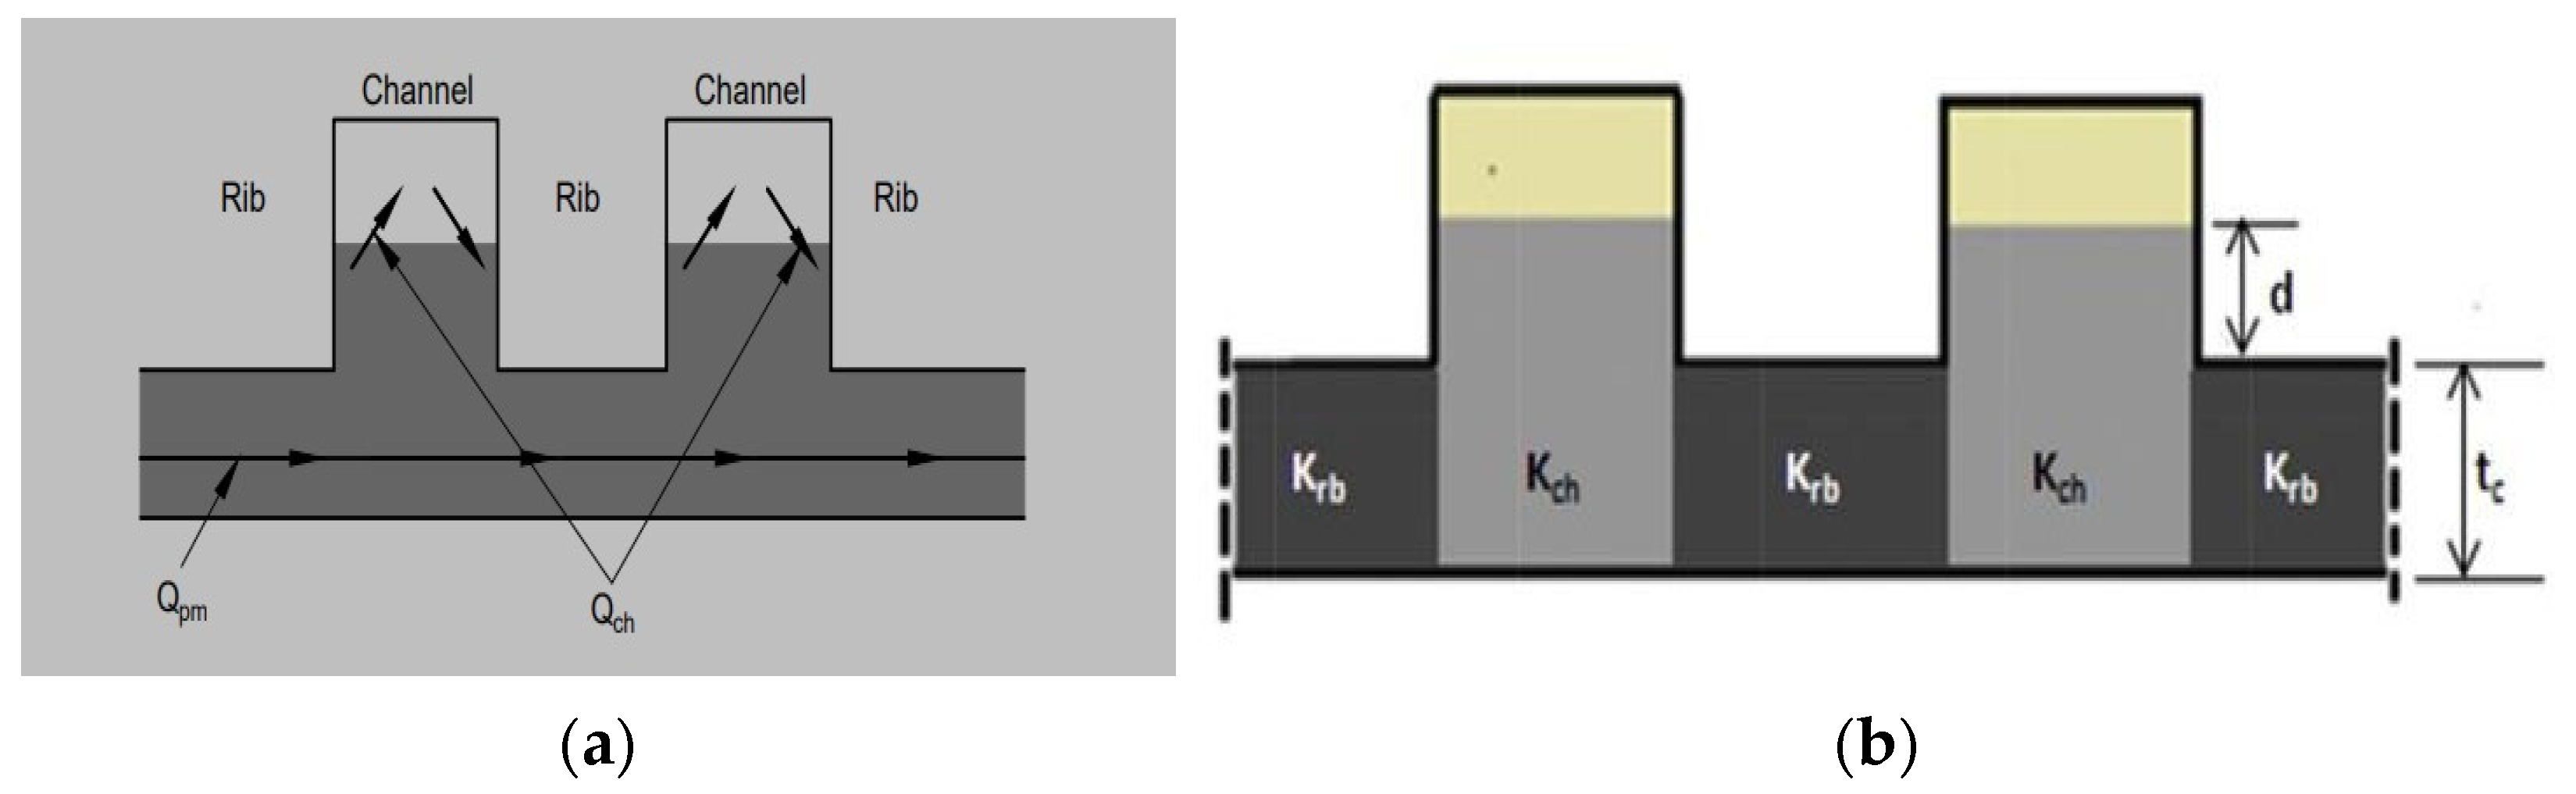
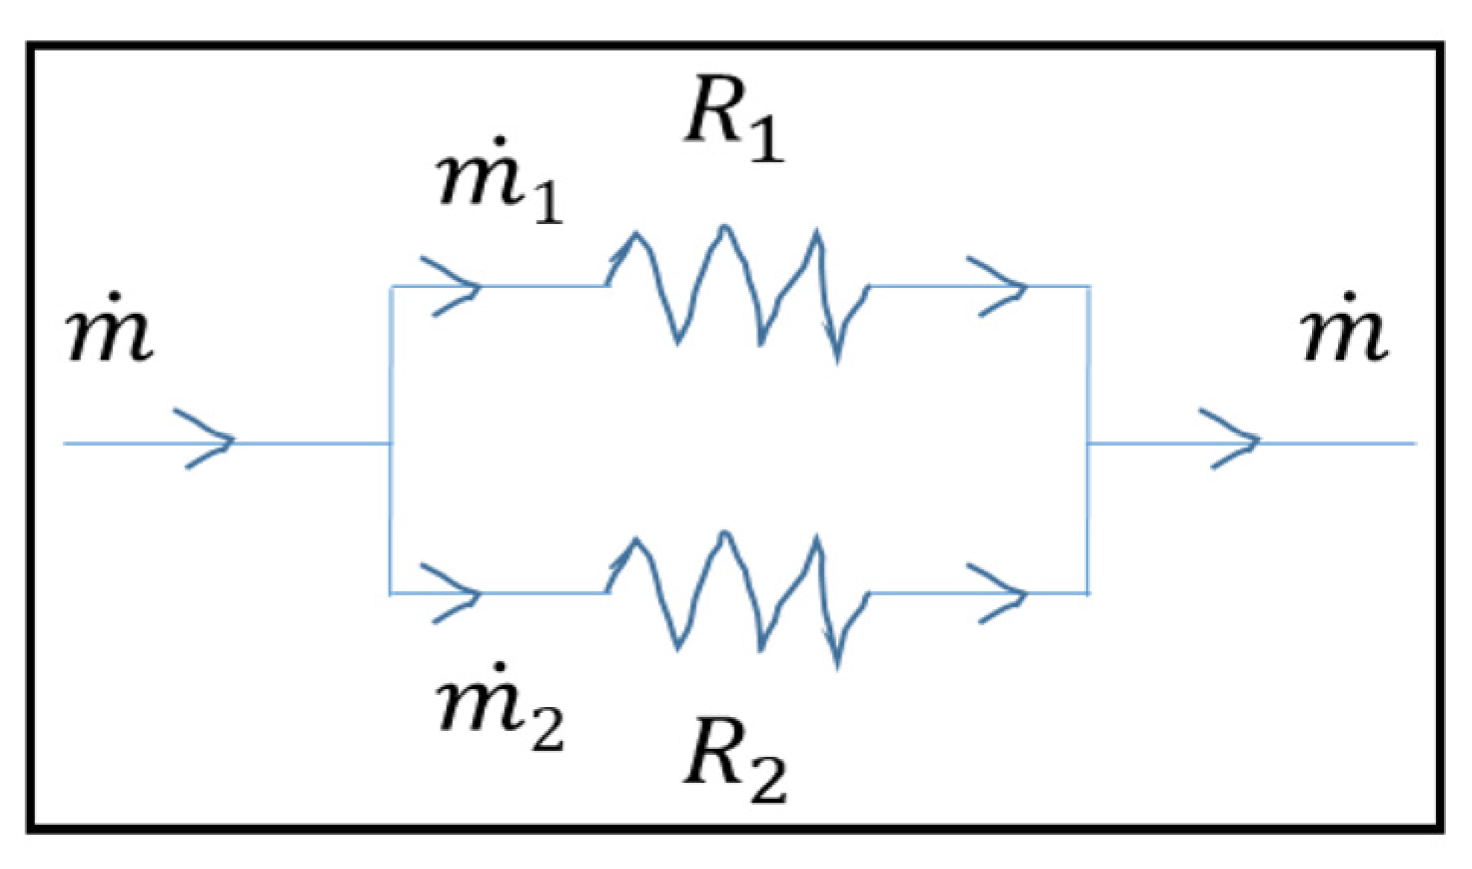
2.3. Circuit Analogy Model
3. Experimental Study
4. CFD Analysis
4.1. Flow Field Model Analysis
4.2. Flow Field with the Electrode Intrusion Model
5. Results and Discussion
5.1. Numerical Software Validation
5.2. Simulation Results
6. Conclusions
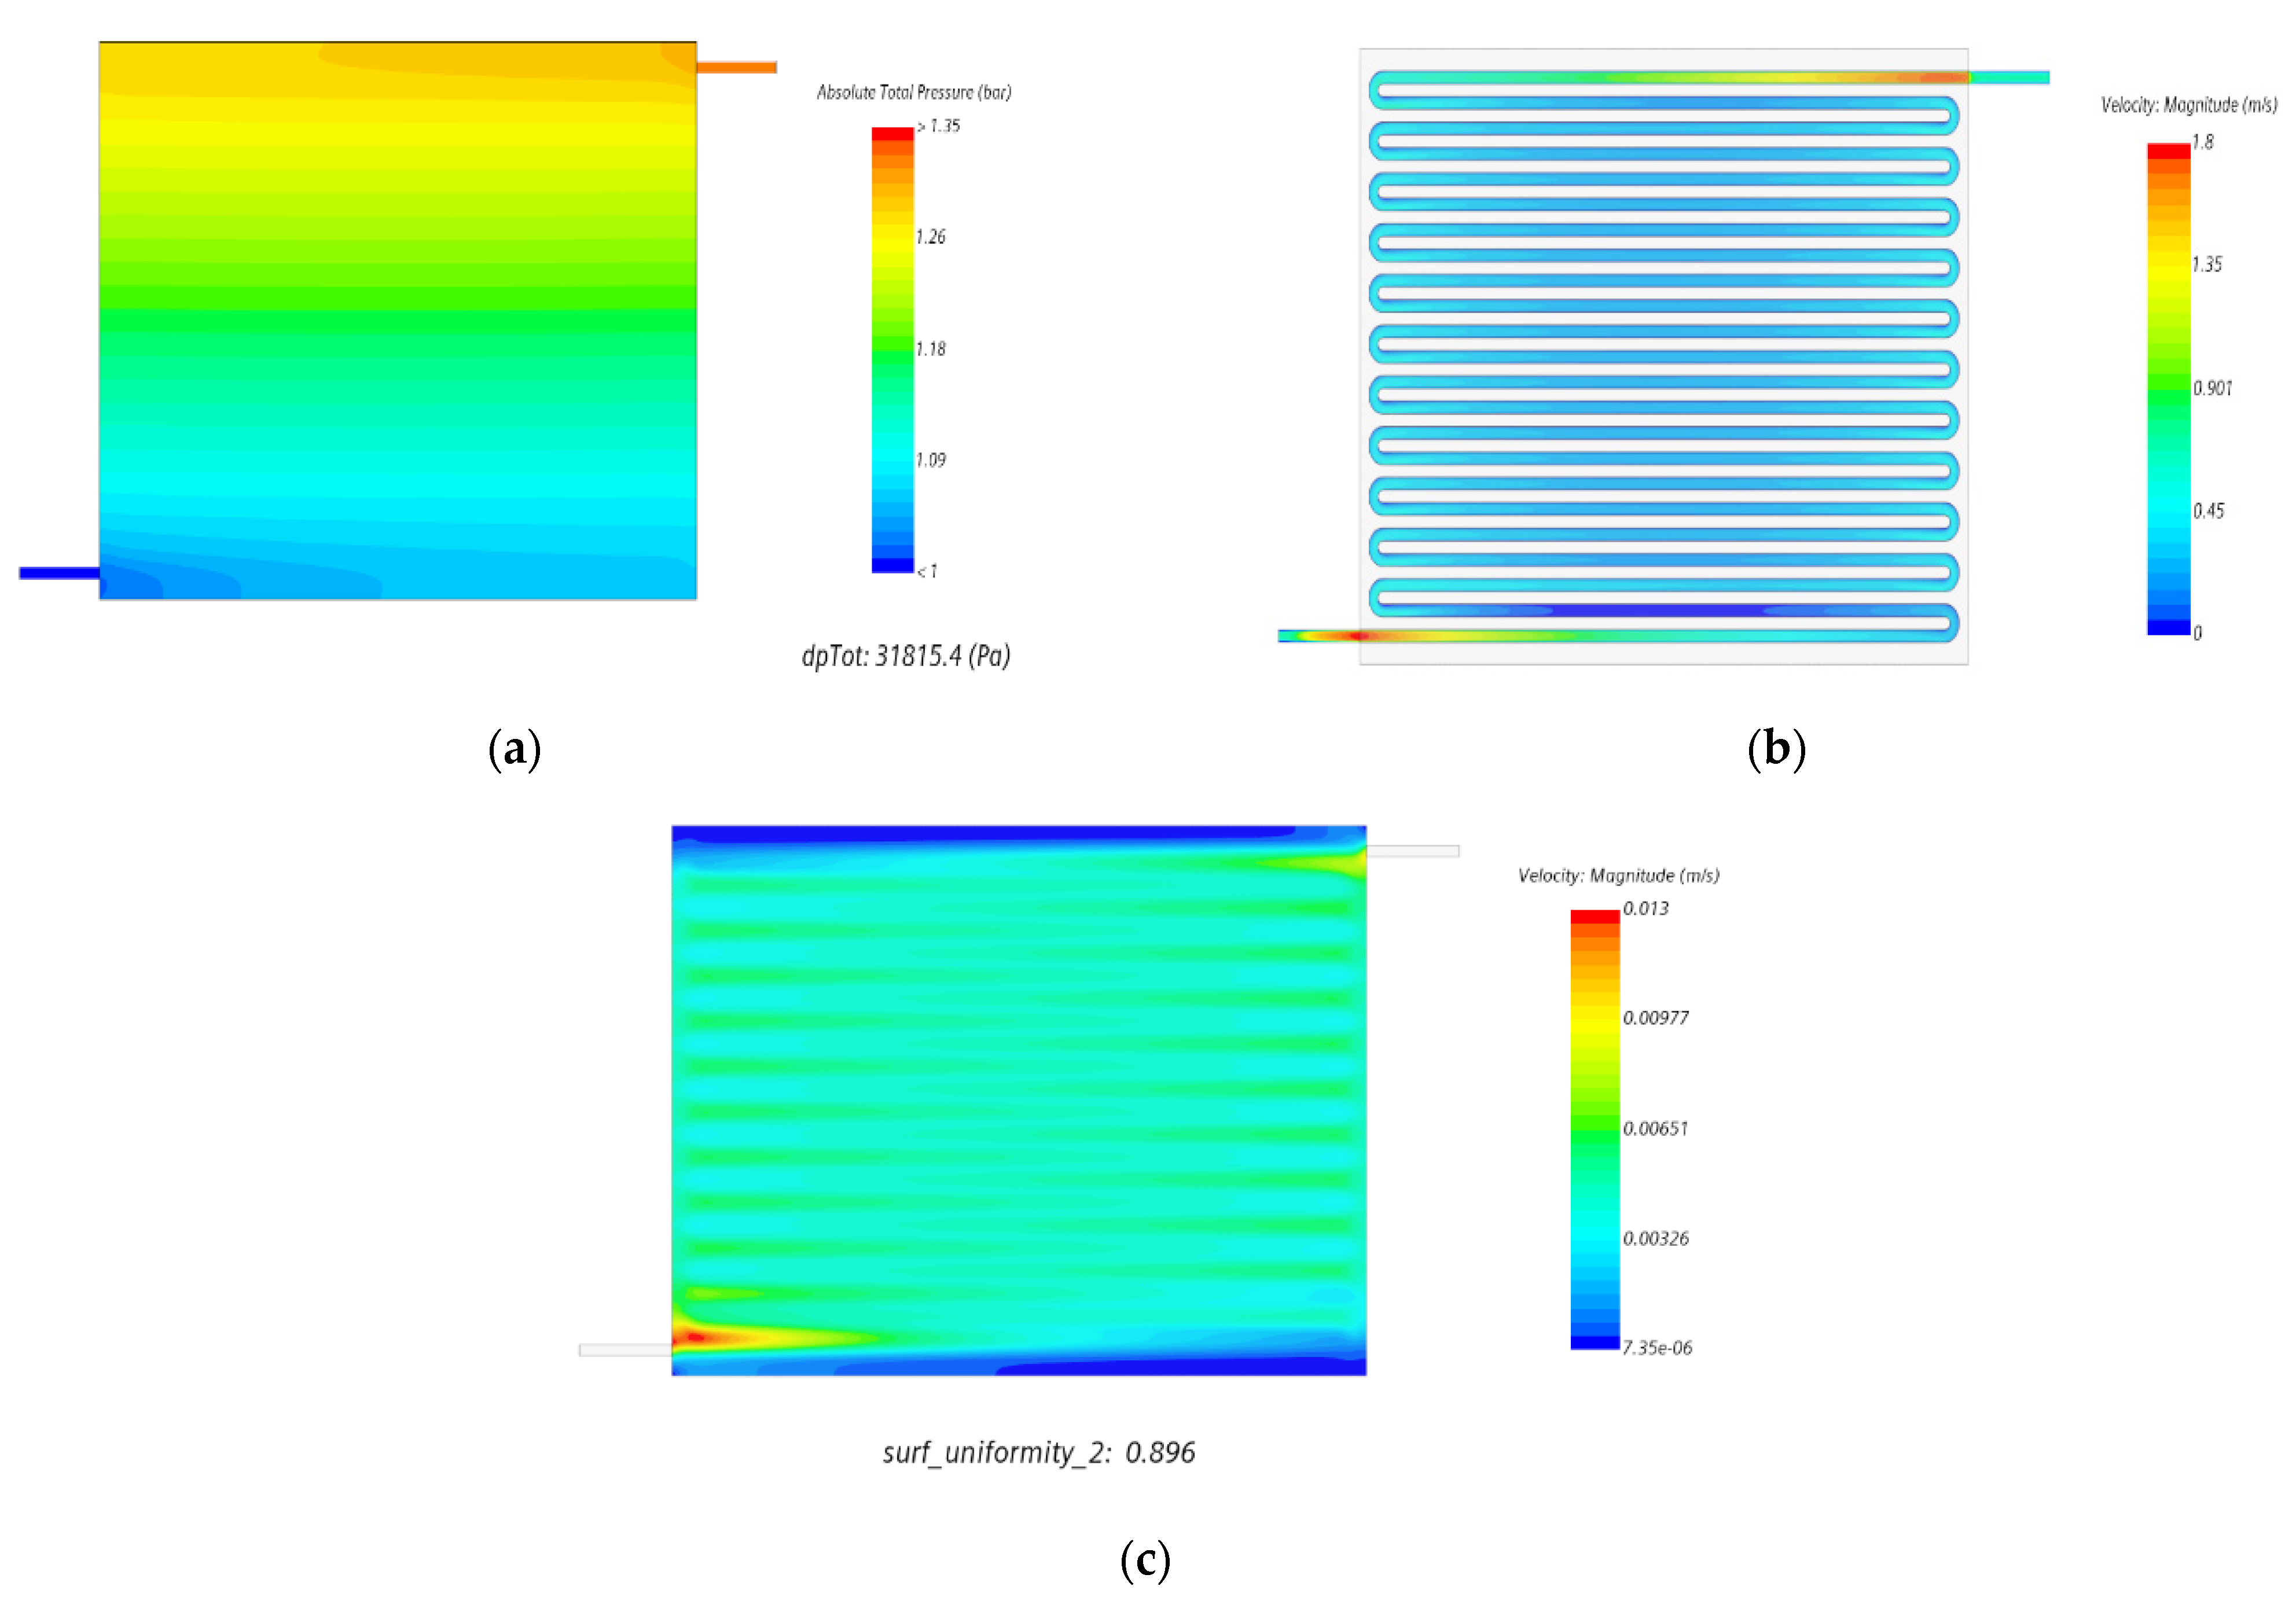
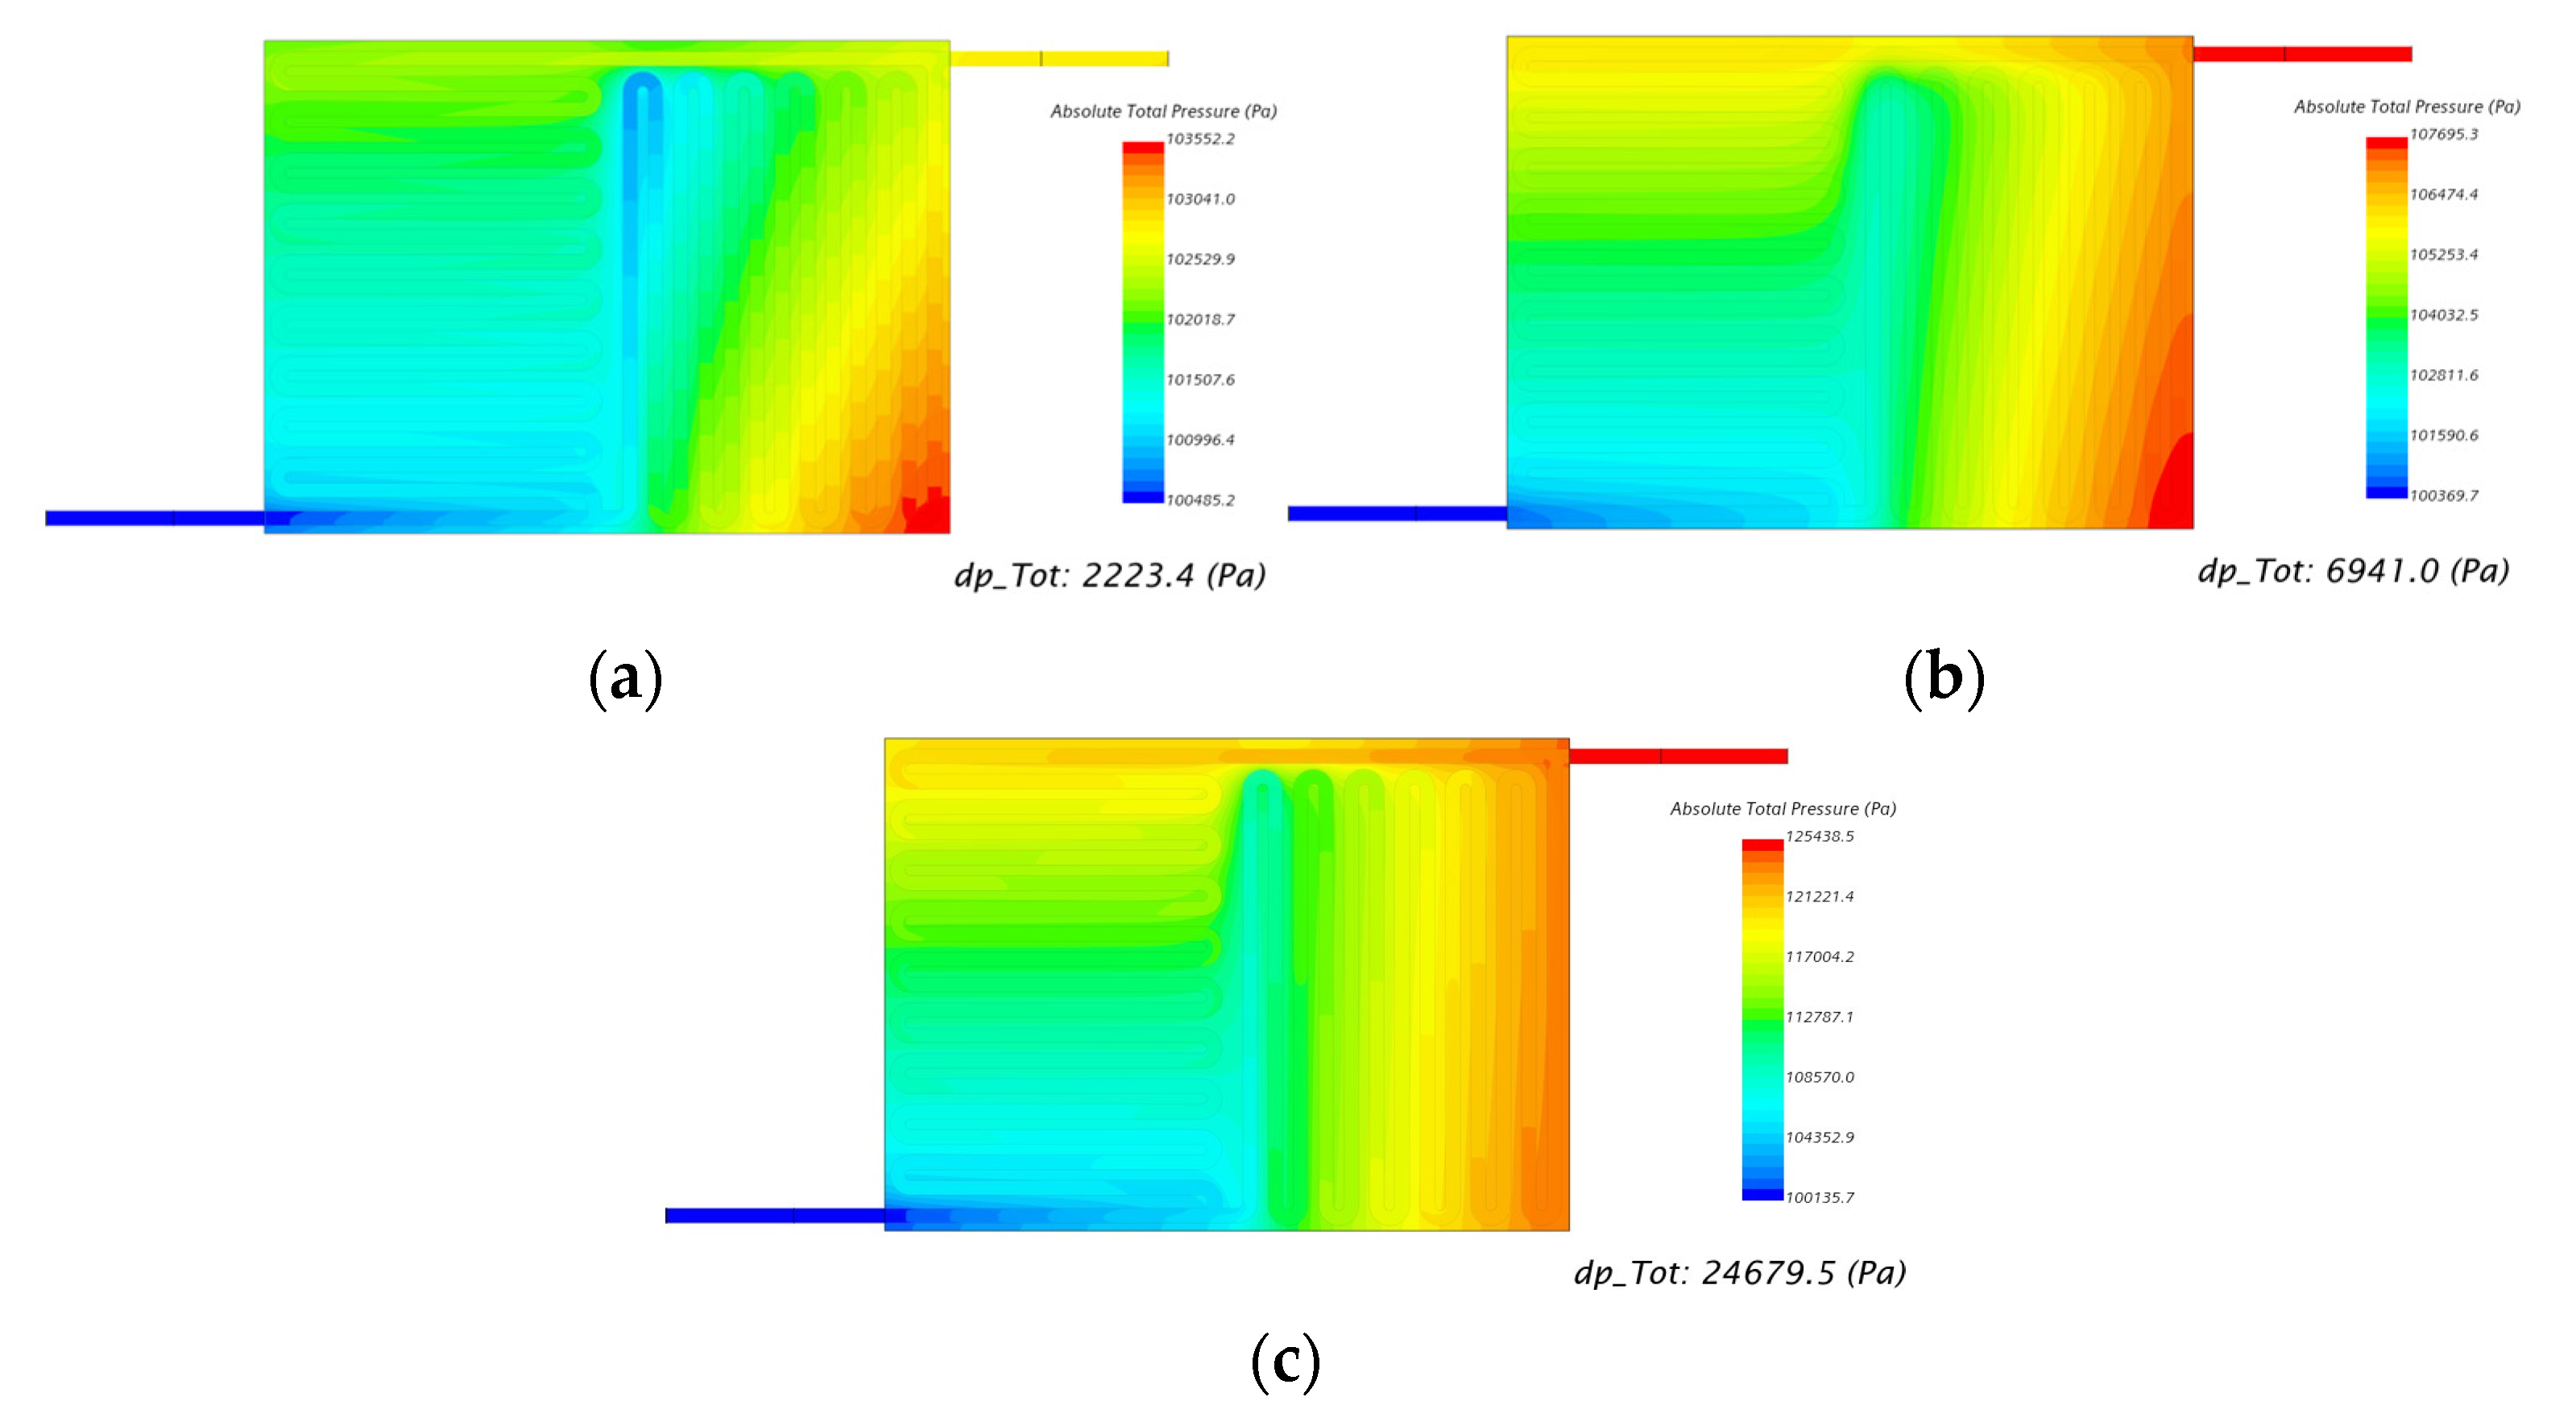
- A single-channel serpentine flow field (SCSFF) resulted in the highest pressure drop order of 31,815.35 Pa compared with a modified version of the cross-split serpentine flow field of Model D with 6941.12 Pa at CR 60% for a flow rate of 150 mL/min across an active cell area of 131 cm2.
- The compression ratio (CR) was found to be a strong function of electrode felt channel intrusion, which resulted in a reduced effective hydraulic diameter of the channel, which, in turn, reduced the effective flow area, causing an increased mean flow velocity.
- We observed that skin friction is a function of the Reynolds number and gradually increased due to a reduction in the effective hydraulic diameter, which meant the flow velocity had increased.
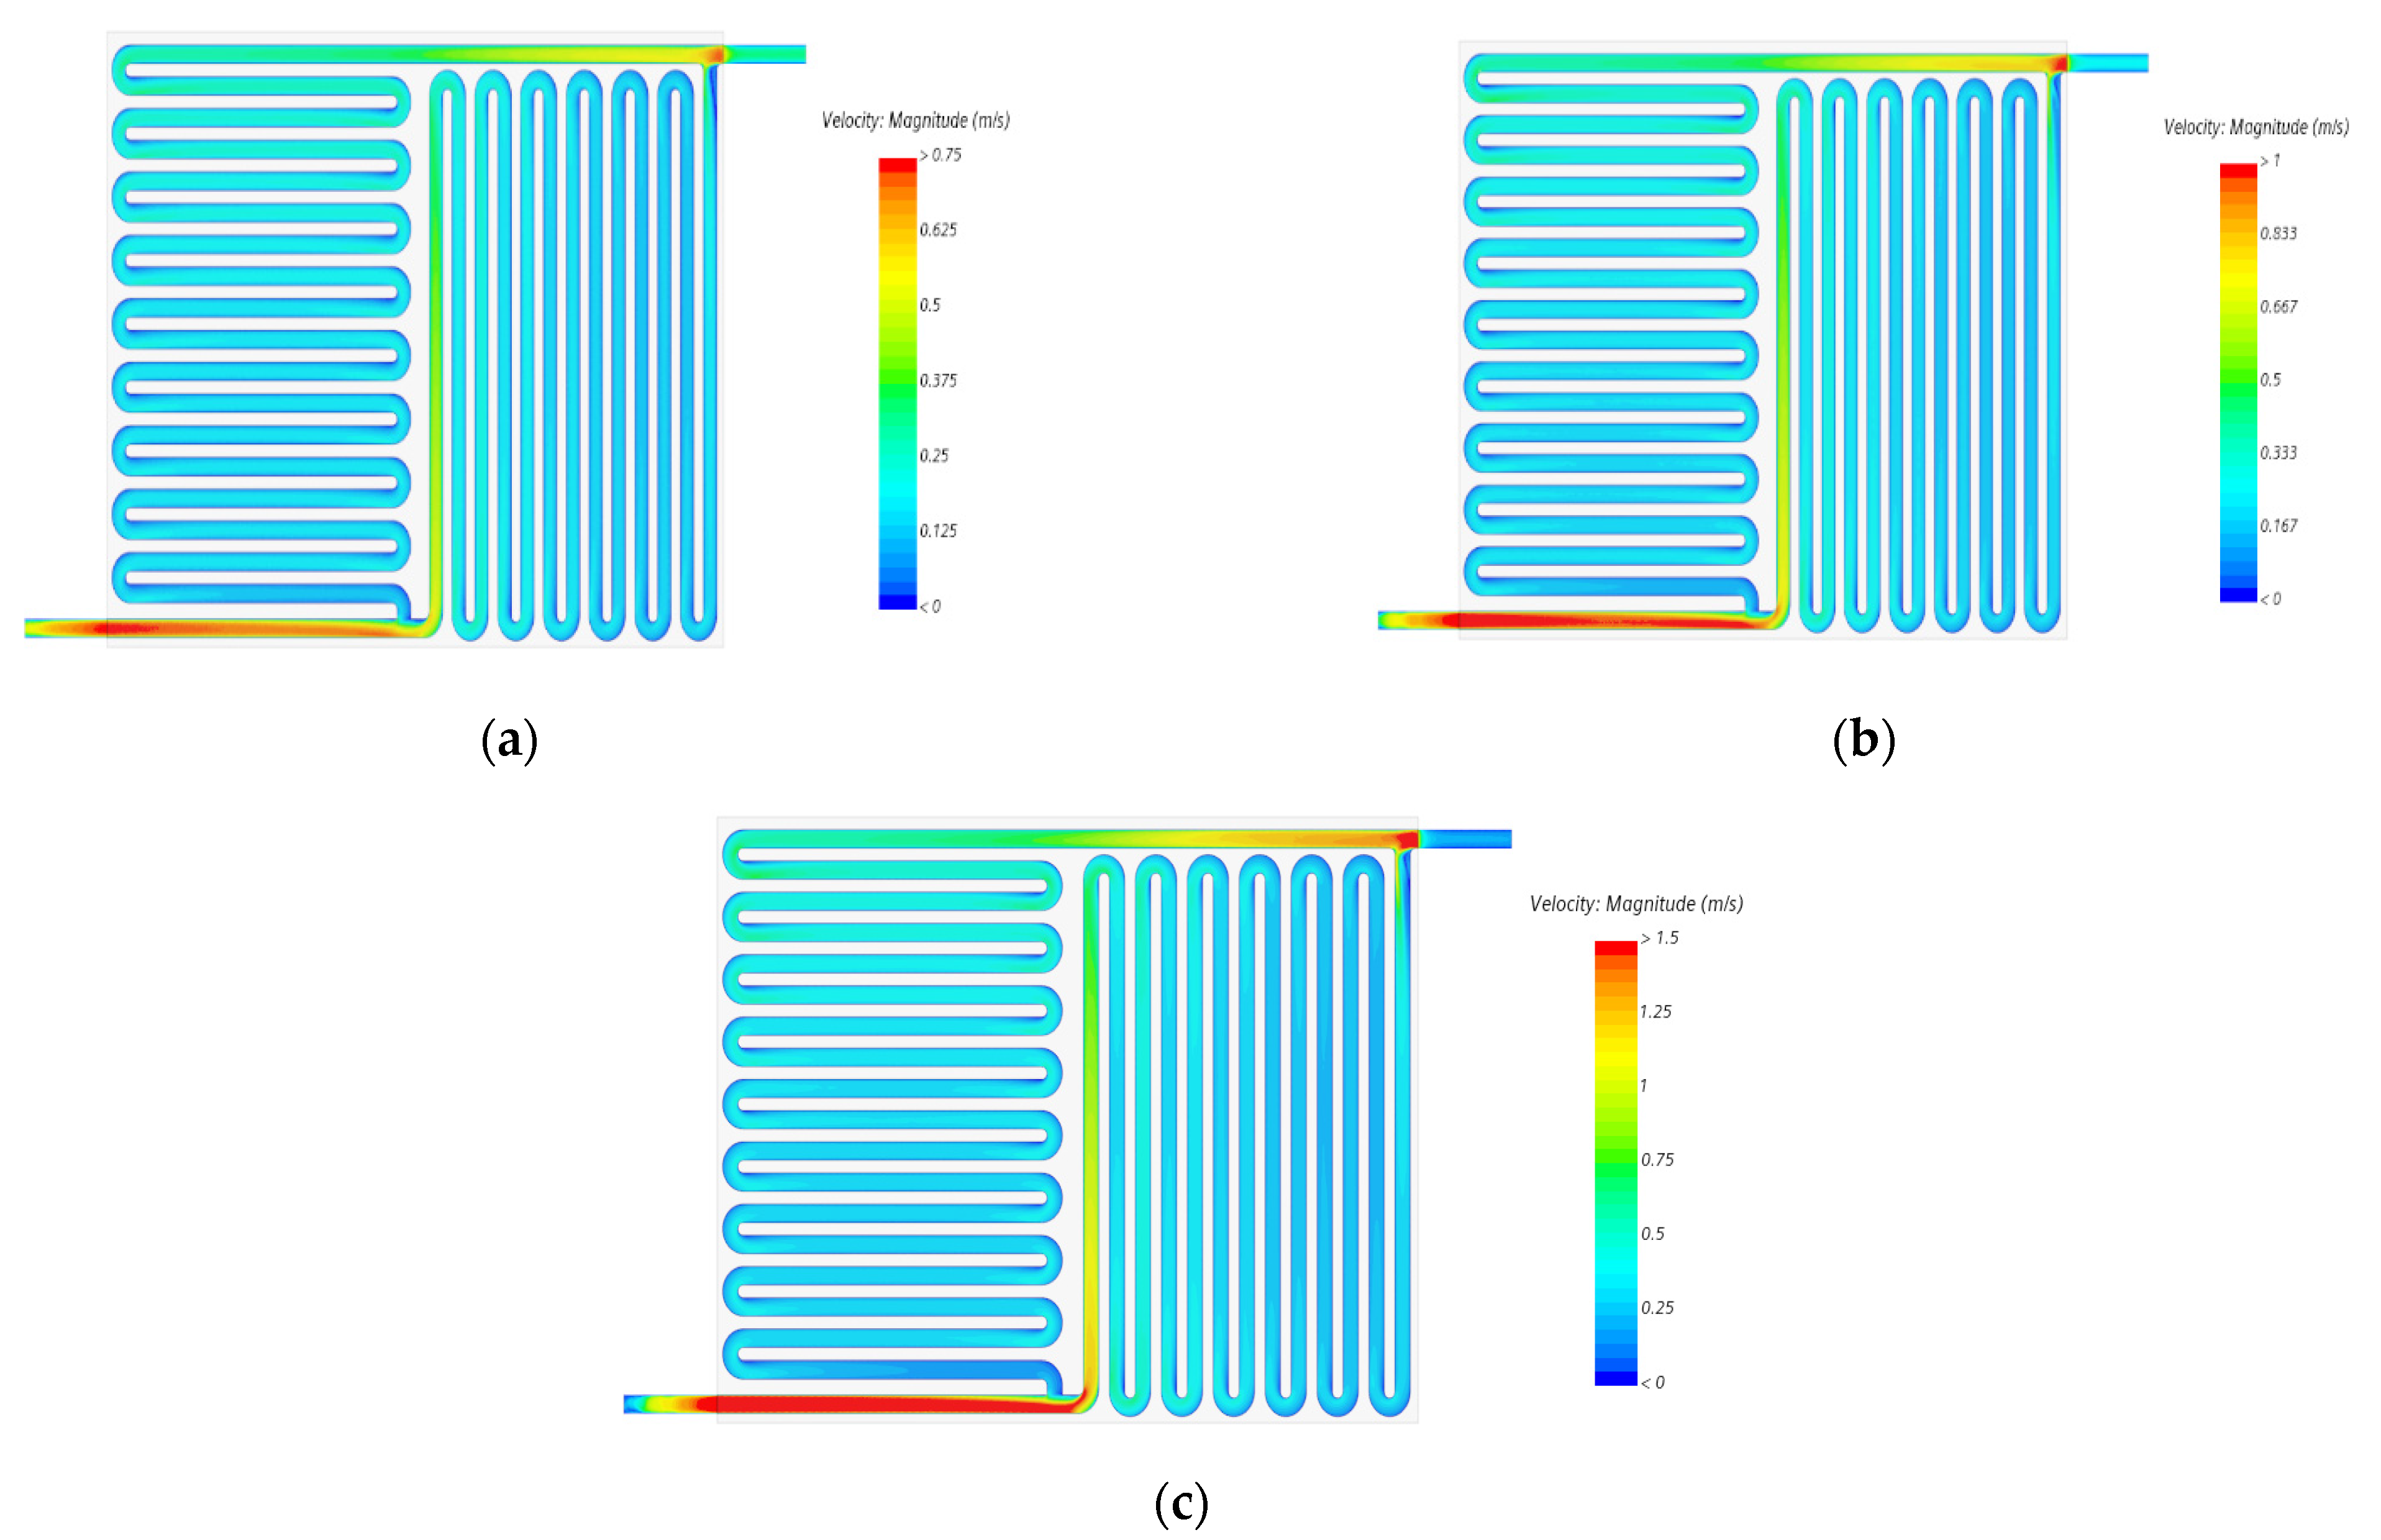
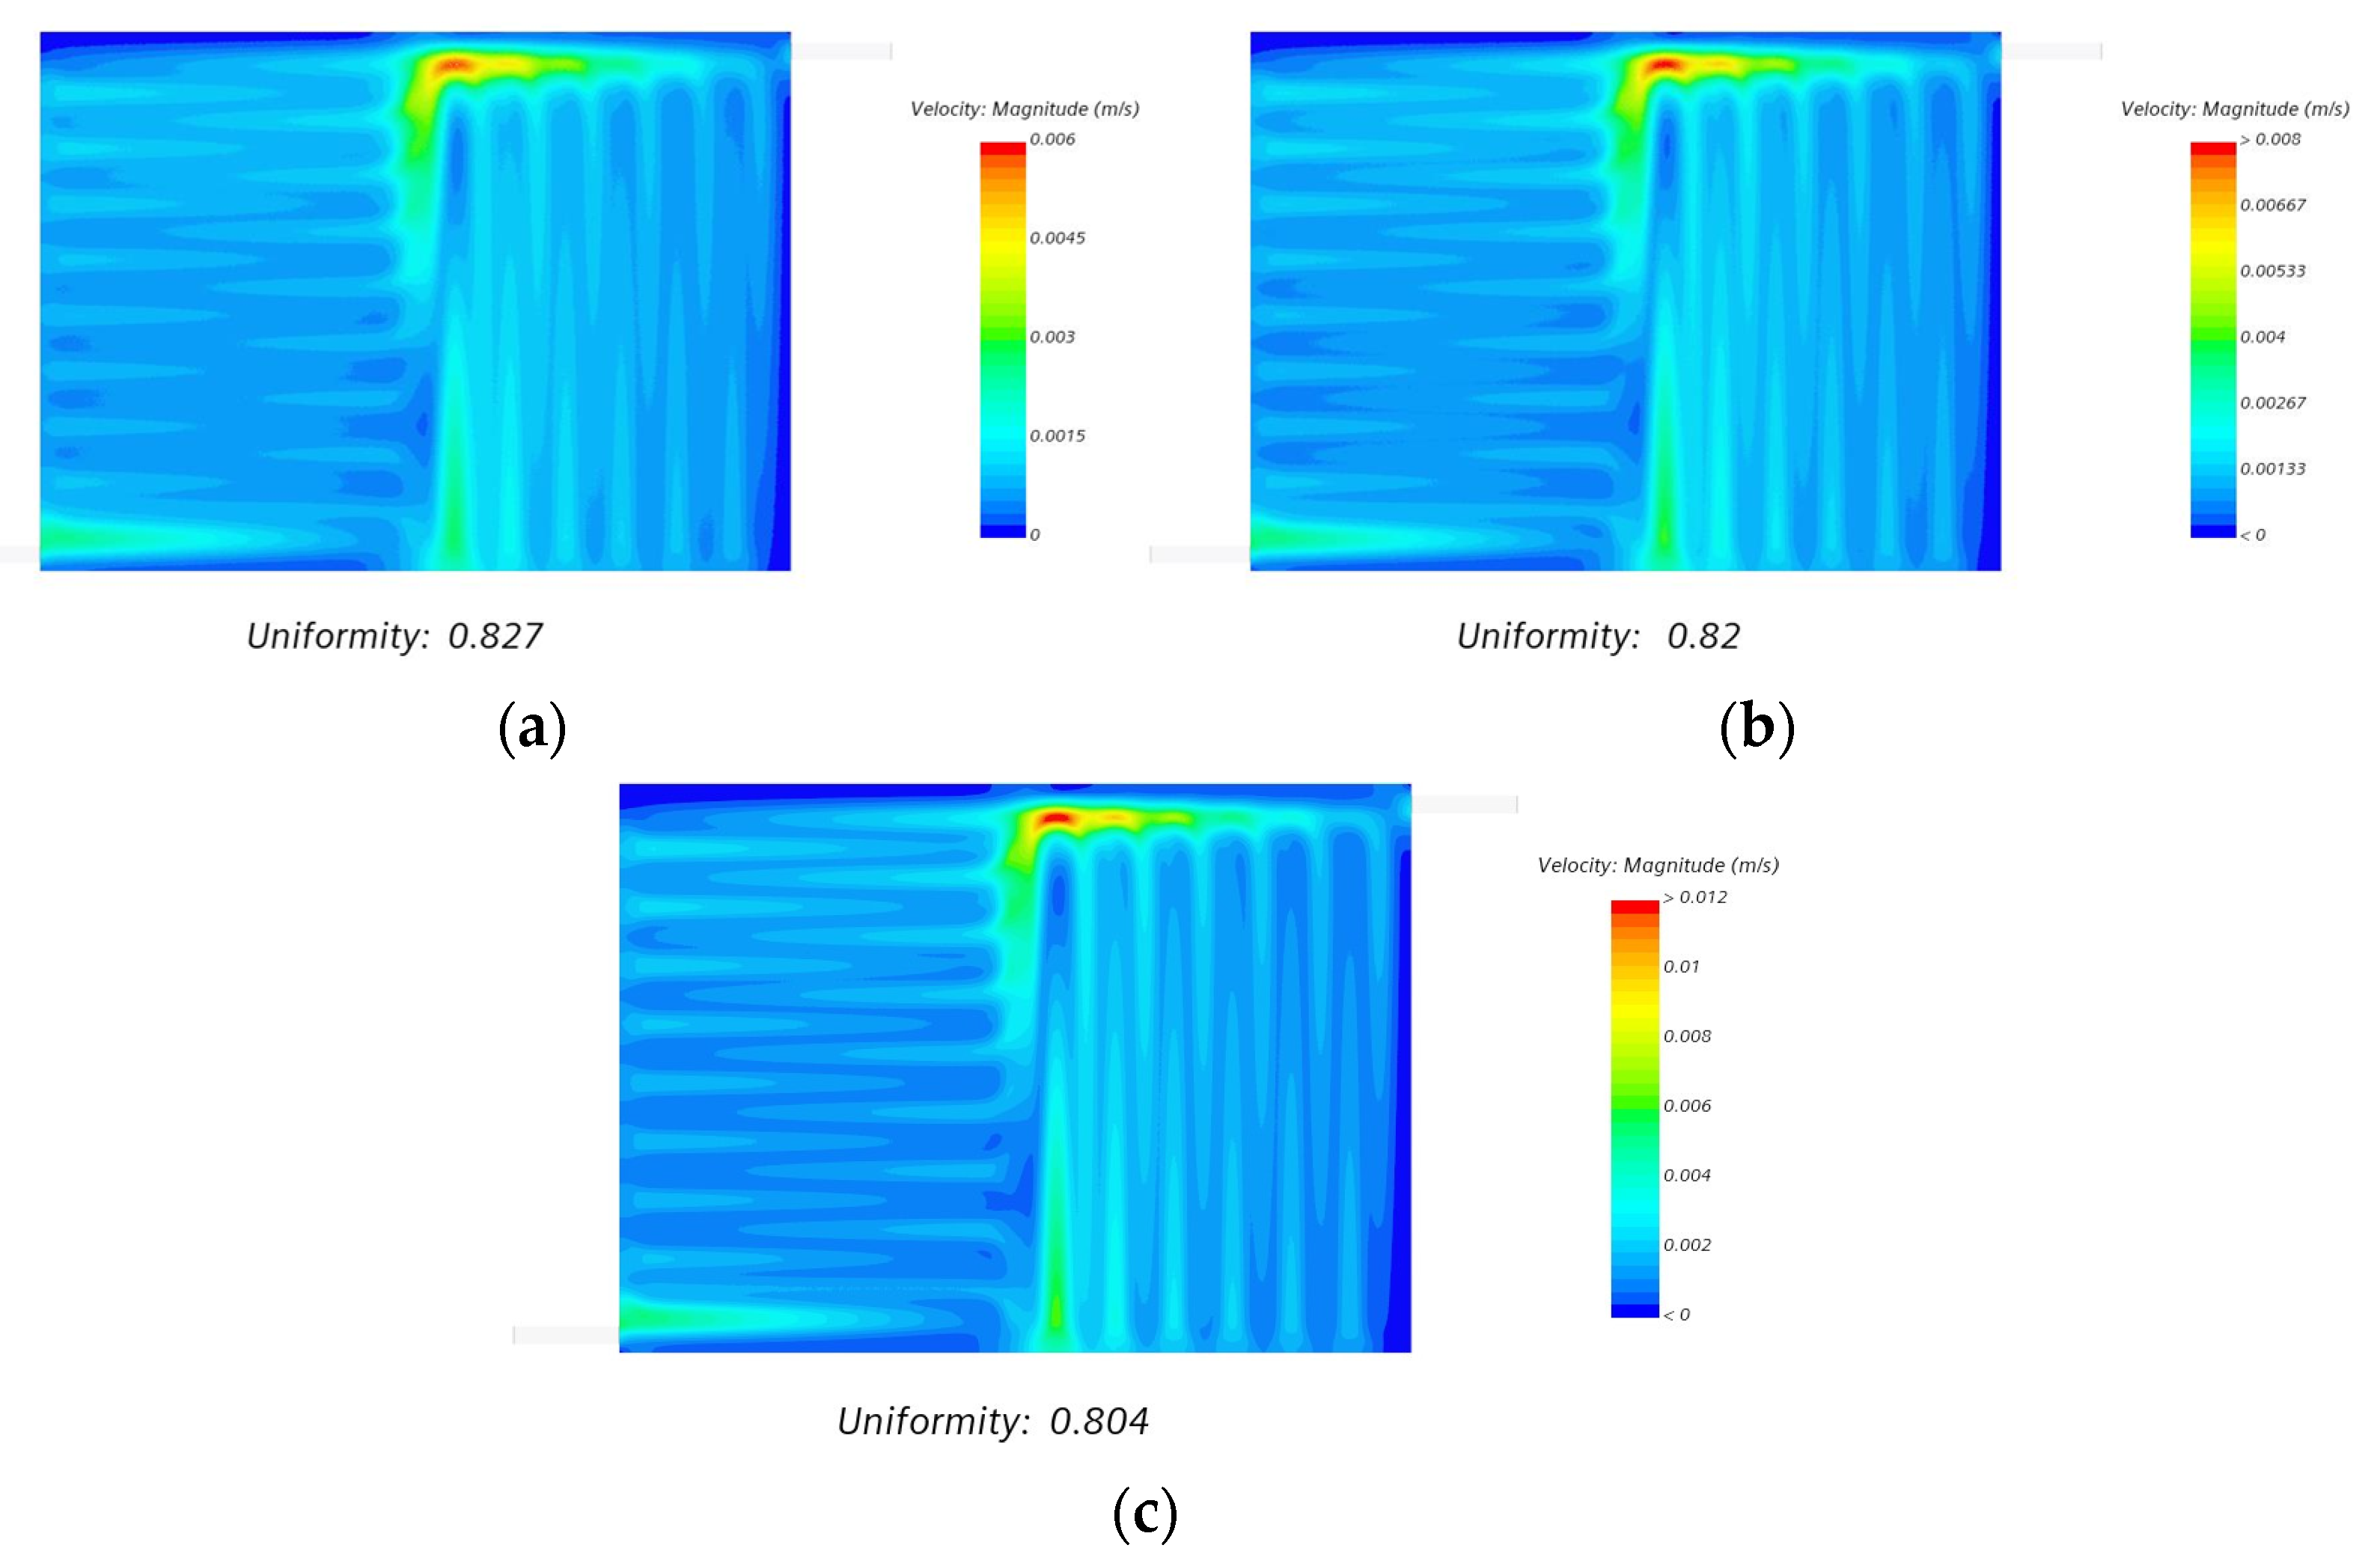
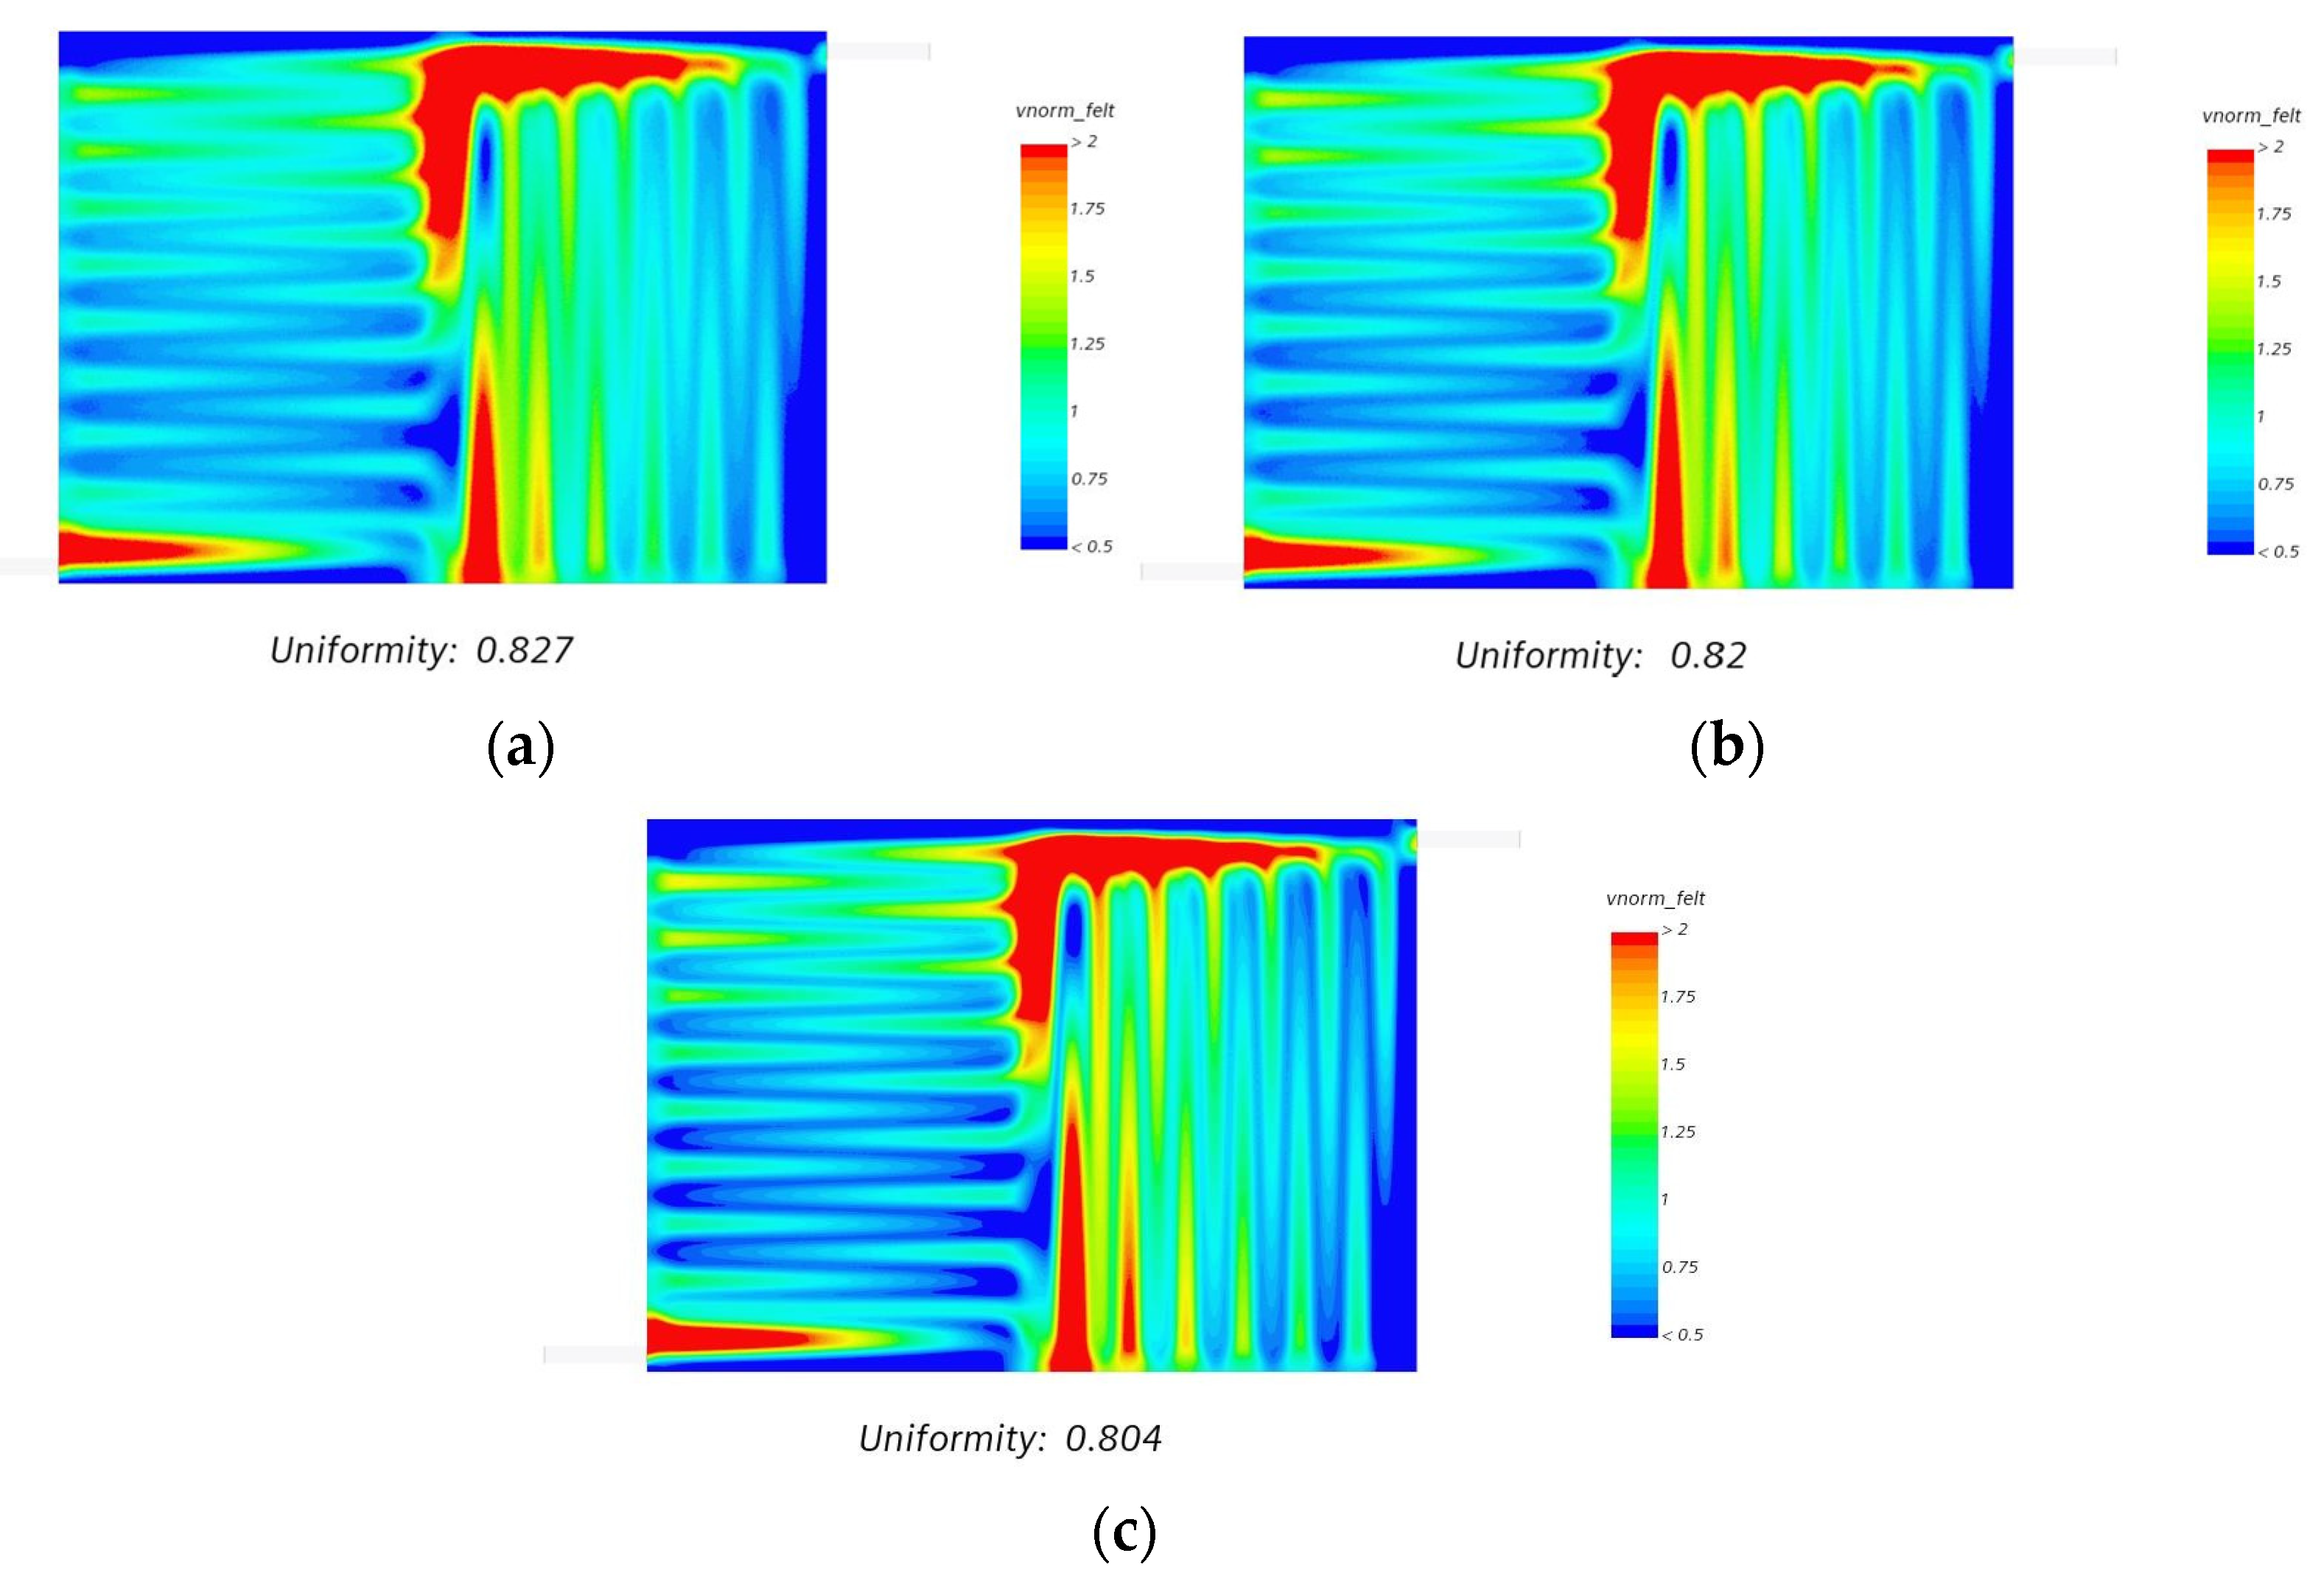
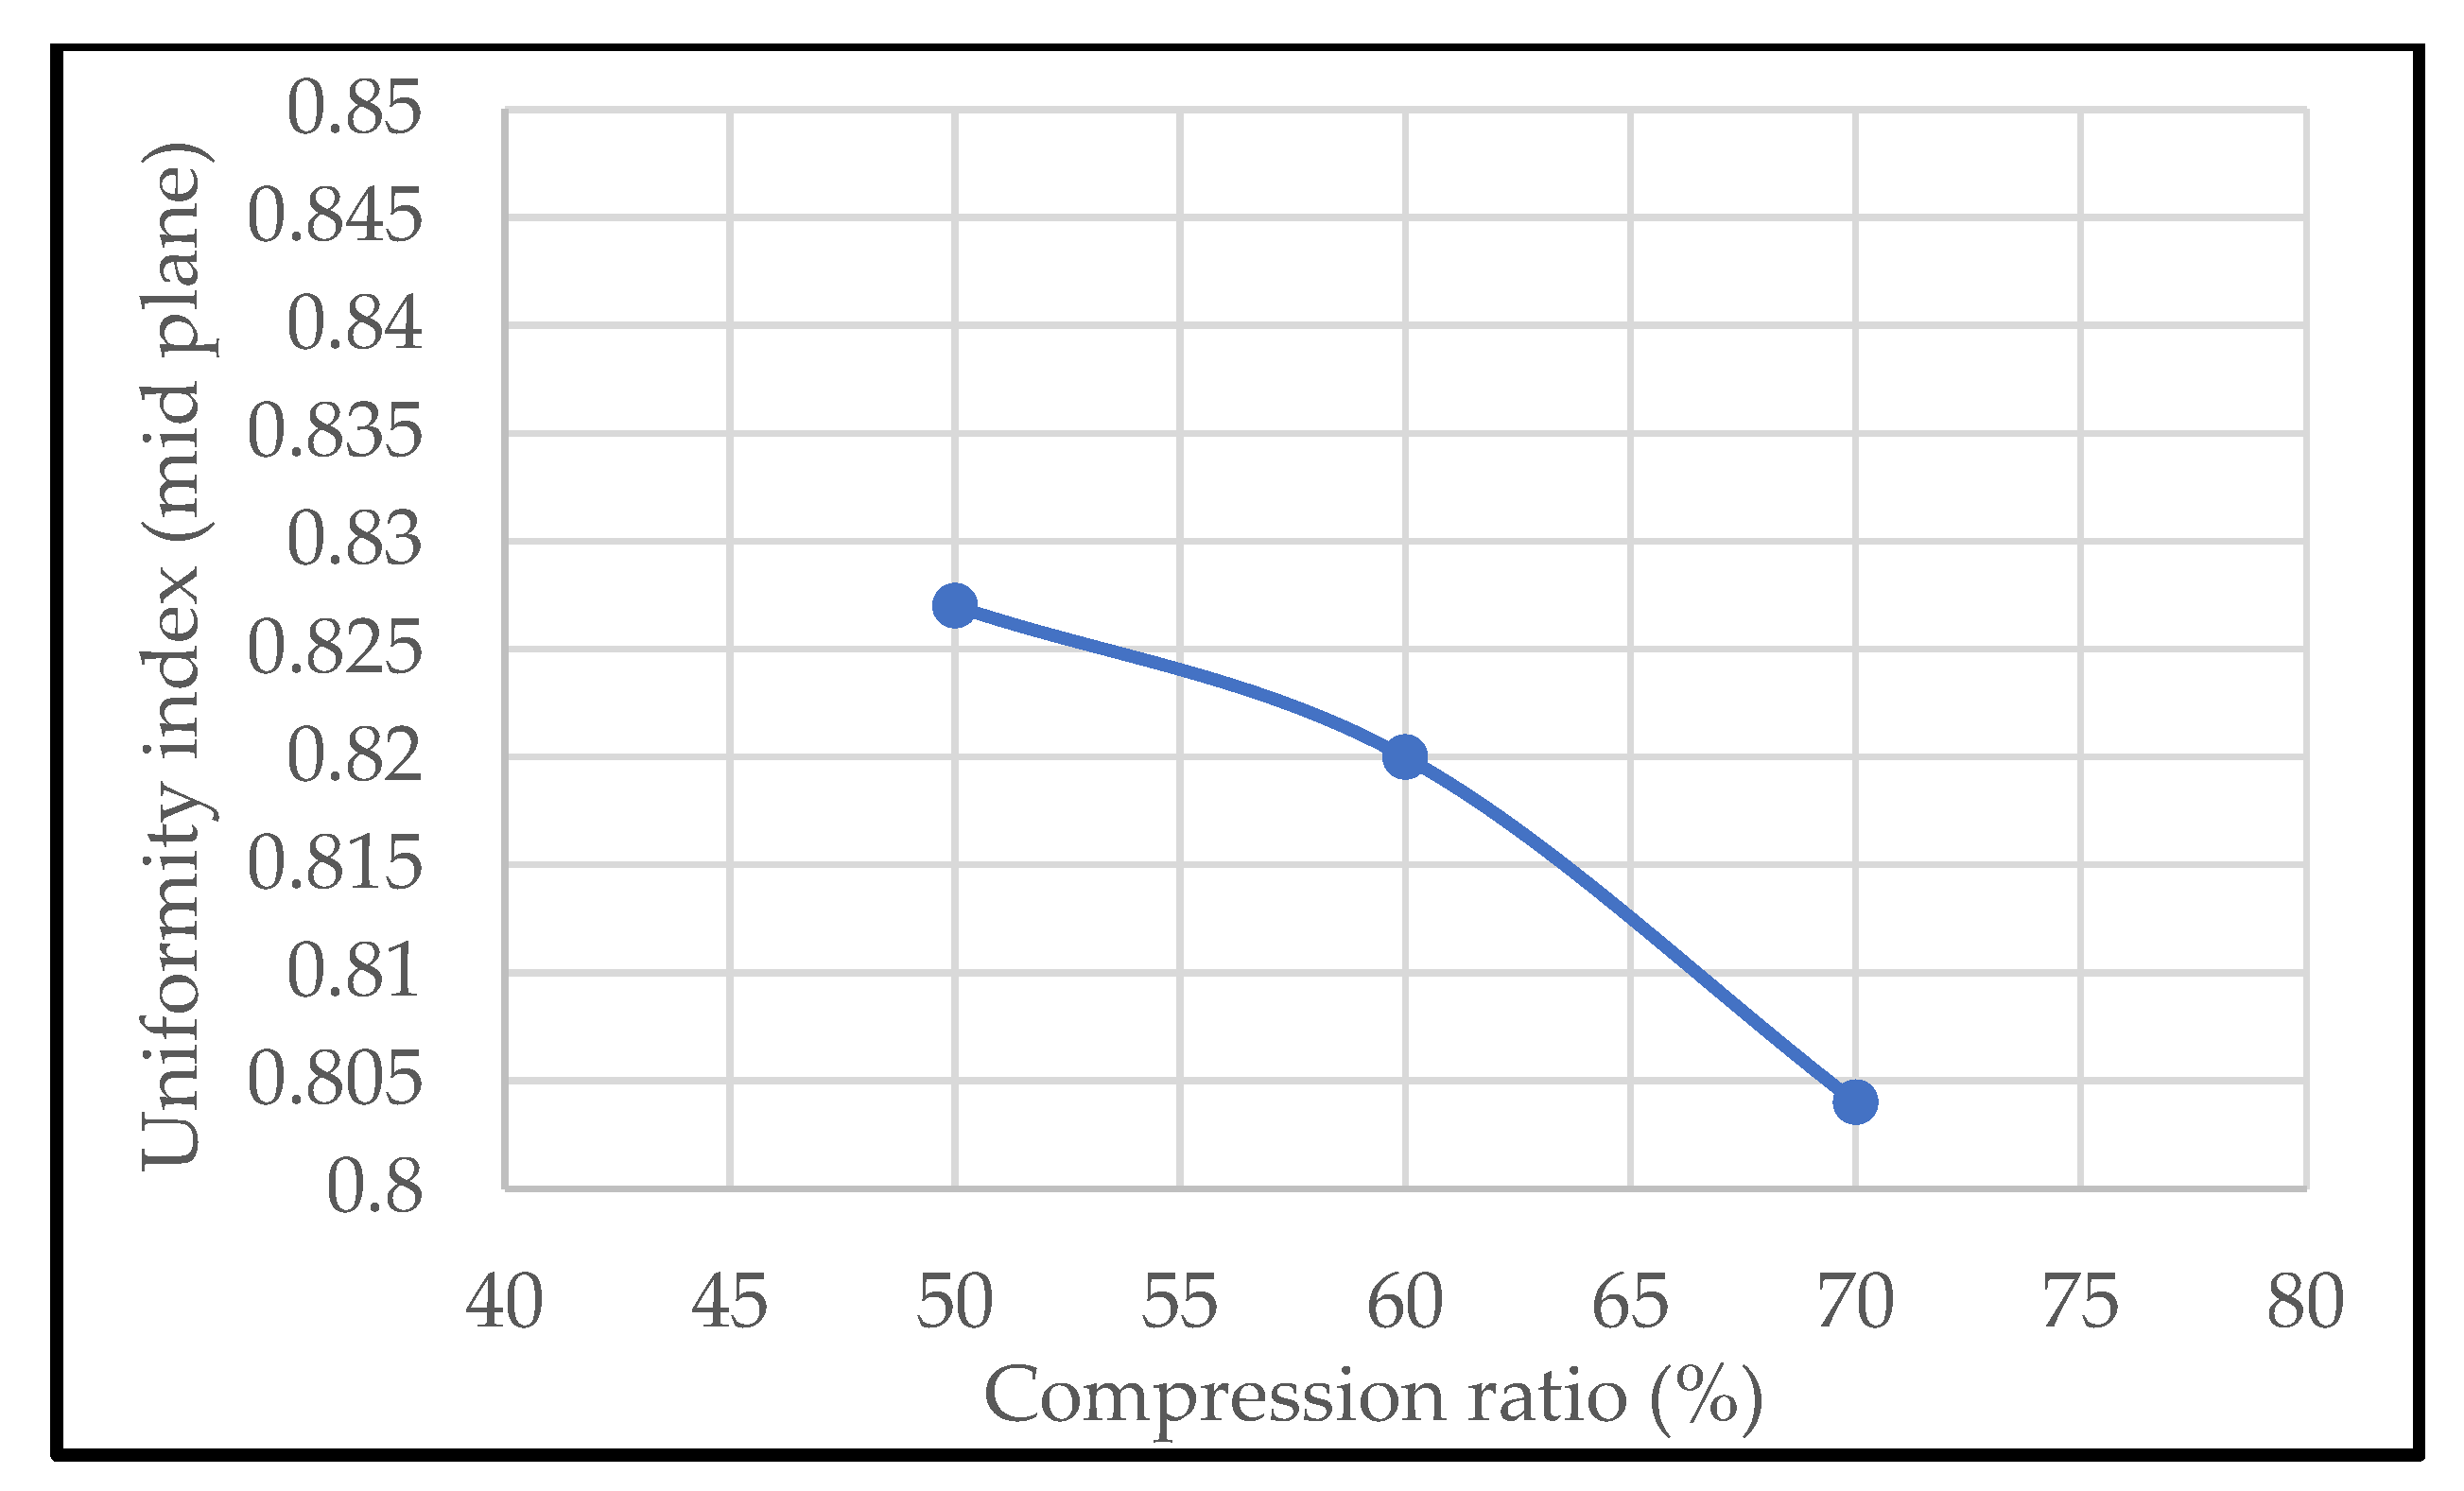
- We also observed that even with an increase in the volumetric flow uniformity index of more than 80%, the flow velocity distribution over electrode felt was relatively uniform at different compression ratios, as shown in Figure 15.
- We also noticed that the influence of an intrusion effect was marginal on the flow distribution and uniformity throughout the electrode felt region.
- The CSSFF design was found to be the better choice over SCSFF in terms of volumetric flow uniformity through electrode mid and end planes, and might also reduce the mass transport polarization behavior, establishing an ideal ionic activity rate.
- In this study, Model D, a modified version of CSSFF, was found to be an optimal design suitable for the defined active cell area of 131 cm2, at different CRs, operating at a maximum flow rate of 150 mL/min.
Author Contributions
Funding
Data Availability Statement
Acknowledgments
Conflicts of Interest
References
- Yang, Z.; Liu, J.; Baskaran, S.; Imhoff, C.H. Enabling renewable energy and future grid—With advanced electricity storage. Energy Storage Technol. 2010, 62, 14–23. [Google Scholar] [CrossRef]
- Dunn, B.; Kamath, H.; Tarascon, J.M. Electrical energy storage for the grid: A battery of choices. Science 2011, 334, 928–935. [Google Scholar] [CrossRef] [PubMed]
- Yang, Z.; Zhang, J.; Kintner-Meyer, M.C.W.; Lu, X.; Choi, D.; Lemmon, J.P.; Liu, J. Electrochemical Energy Storage for Green Grid. Chem. Rev. ACS Publ. 2011, 111, 3577–3613. [Google Scholar] [CrossRef] [PubMed]
- Emerging Technology News Customized Energy Solutions India Pvt. Ltd. Available online: https://etn.news/energy-storage/classification-of-energy-storage-technologies-an-overview (accessed on 21 September 2020).
- Hossain, E.; Faruque, H.M.R.; Sunny, M.S.H.; Mohammad, N.; Nawar, N. A Comprehensive Review on Energy Storage Systems: Types, Comparison, Current Scenario, Applications, Barriers, and Potential Solutions, Policies, and Future Prospects. Energies 2020, 13, 3651. [Google Scholar] [CrossRef]
- Skyllas-Kazacos, M.; Chakrabarti, M.H.; Hajimolana, S.A.; Mjalli, F.S.; Saleem, M. Progress in Flow Battery Research and Development. J. Electrochem. Soc. 2011, 158, 55–79. [Google Scholar] [CrossRef]
- Ponce-de-León, C.; Frías-Ferrer, A.; González-Garcia, J.; Szánto, D.A.; Walsh, F.C. Redox flow cells for energy conversion. J. Power Sources 2006, 160, 716–732. [Google Scholar] [CrossRef]
- Kumar, M.N.; Kumar, S.M.; Vijayakumar, G.C.; Kadirgama, K.; Samykano, M.; Venkatesh, K.; Murlidhara, H.B. Effect of Flow Field Geometry on Hydrodynamics of Flow in Redox Flow Battery. Energy Eng. Tech. Sci. Press 2021, 119, 201–217. [Google Scholar]
- Arenas, L.F.; de León, C.P.; Walsh, F.C. Redox flow batteries for energy storage: Their promise, achievements and challenges. Curr. Opin. Electrochem. 2019, 16, 117–126. [Google Scholar] [CrossRef]
- Di Noto, V.; Vezzu, K.; Crivellaro, G.; Pagot, G.; Sun, C.; Meda, L.; Zawodzinski, T.A. A general electrochemical formalism for vanadium redox flow batteries. Electro. Chim. Acta 2022, 408, 139937. [Google Scholar] [CrossRef]
- Zhang, H.; Chen, N.; Luo, X. Investigations on physicochemical properties and electrochemical performance of graphite felt and carbon felt for iron-chromium redox flow battery. Int. J. Energy Res. 2020, 44, 3839–3853. [Google Scholar] [CrossRef]
- Zhang, H.; Sun, C. Cost-effective iron-based aqueous redox flow batteries for large-scale energy storage application: A review. J. Power Sources 2021, 493, 229445. [Google Scholar] [CrossRef]
- Weber, A.Z.; Mench, M.M.; Meyers, J.P.; Ross, P.N.; Gostick, J.T.; Liu, Q. Redox flow batteries: A review. J. Appl. Electrochem. 2011, 41, 1137–1164. [Google Scholar]
- Gundlapalli, R.; Jayanti, S. Effect of channel dimensions of serpentine flow fields on the performance of a vanadium redox flow battery. J. Energy Storage 2019, 23, 148–158. [Google Scholar] [CrossRef]
- Lisboa, K.M.; Marschewski, J.; Ebejer, N.; Ruch, P.; Cotta, R.M.; Michel, B.; Poulikakos, D. Mass transport enhancement in redox flow batteries with corrugated fluidic networks. J. Power Sources 2017, 359, 322–331. [Google Scholar] [CrossRef]
- Arenas-Martínez, L.F.; Ponce de León, C.; Walsh, F.C. Engineering aspects of the design, construction and performance of modular redox flow batteries for energy storage. J. Energy Storage 2017, 11, 119–153. [Google Scholar] [CrossRef]
- Brown, L.D.; Tobias, P.; Neville, T.; Jervis, R.; Mason, T.J.; Shearing, P.R.; Brett, D.J.L. The effect of felt compression on the performance and pressure drop of all-vanadium redox flow batteries. J. Energy Storage 2016, 8, 91–98. [Google Scholar] [CrossRef]
- Chang, T.C.; Zhang, J.P.; Fuh, Y.K. Electrical, mechanical and morphological properties of compressed carbon felt electrodes in vanadium redox flow battery. J. Power Sources 2014, 245, 66–75. [Google Scholar] [CrossRef]
- Jyothi Latha, T.; Jayanti, S. Ex-situ experimental studies of serpentine flow fields for redox flow battery applications. J. Power Sources 2014, 248, 140–146. [Google Scholar] [CrossRef]
- Darling, R.M.; Perry, M.L. The influence of electrode and channel configurations on flow battery performance. J. Electro. Chem. Soc. 2014, 161, A1381–A1387. [Google Scholar] [CrossRef]
- Xu, Q.; Zhao, T.S.; Zhang, C. Performance of a vanadium redox flow battery with and without flow fields. Electro. Chem. Acta 2014, 142, 61–67. [Google Scholar] [CrossRef]
- Aaron, D.S.; Liub, Q.; Tanga, Z.; Grimb, G.M.; Papandrewa, A.B.; Turhanb, A.; Zawodzinskia, T.A.; Mench, M.M. Dramatic performance gains in vanadium redox flow batteries through modified cell architecture. J. Power Sources 2012, 206, 450–453. [Google Scholar] [CrossRef]
- Ke, X.; Prahl, J.M.; Alexander JI, D.; Savinell, R.F. Redox flow batteries with serpentine flow fields: Distributions of electrolyte flow reactant penetration into the porous carbon electrodes and effects on performance. J. Power Sources 2018, 384, 295–302. [Google Scholar] [CrossRef]
- Gerhardt, M.R.; Wong, A.A.; Aziz, M.J. The Effect of Interdigitated Channel and Land Dimensions on Flow Cell Performance. J. Electrochem. Soc. 2018, 165, A2625–A2643. [Google Scholar] [CrossRef]
- Kumar, S.; Jayanti, S. Effect of electrode intrusion on pressure drop and electrochemical performance of an all-vanadium redox flow battery. J. Power Sources 2017, 360, 548–558. [Google Scholar] [CrossRef]
- Kumar, S.; Jayanti, S. Effect of flow field on the performance of an all-vanadium redox flow battery. J. Power Sources 2016, 307, 782–787. [Google Scholar] [CrossRef]
- Maharudrayya, S.; Jayanti, S. Flow distribution and pressure drop in parallel-channel configurations of planar fuel cells. J. Power Sources 2004, 144, 94–106. [Google Scholar] [CrossRef]
- Moro, F.; Trovo, A.; Bortolin, S.; Del Col, D.; Guarnieri, M. An alternative low-loss stack topology for vanadium redox flow battery: Comparative assessment. J. Power Sources 2017, 340, 229–241. [Google Scholar] [CrossRef]
- Zheng, Q.; Xing, F.; Li, X.; Ning, G.; Zhang, H. Flow field design and optimization based on the mass transport polarization regulation in a flow-through type vanadium flow battery. J. Power Sources 2016, 324, 402–411. [Google Scholar] [CrossRef]
- Zhou, X.L.; Zhao, T.S.; Zeng, Y.K.; An, L.; Wei, L. A highly permeable and enhanced surface area carbon-cloth electrode for vanadium redox flow batteries. J. Power Sources 2016, 329, 247–254. [Google Scholar] [CrossRef]
- Xu, Q.; Zhao, T.S.; Leung, P.K. Numerical investigations of flow field designs for vanadium redox flow batteries. Appl. Energy 2013, 105, 47–56. [Google Scholar] [CrossRef]
- You, X.; Ye, Q.; Cheng, P. Scale-up of high power density redox flow batteries by introducing interdigitated flow fields. Int. Commun. Heat. Mass. Transf. 2016, 75, 7–12. [Google Scholar] [CrossRef]
- Prasad, K.B.S.; Jayanti, S. Effect of channel-to-channel cross flow on local flooding in serpentine flow fields. J. Power Sources 2008, 180, 227–231. [Google Scholar] [CrossRef]
- Xu, C.; Zhao, T.S. A new flow field design for polymer electrolyte-based fuel cells. Electro. Chem. Commun. 2007, 9, 497–503. [Google Scholar] [CrossRef]
- Suresh, P.V.; Jayanti, S.; Deshpande, A.P.; Haridoss, P. An improved serpentine flow field with enhanced cross-flow for fuel cell applications. Int. J. Hydrogen Energy 2011, 36, 6067–6072. [Google Scholar] [CrossRef]
- Gundlapalli, R.; Jayanti, S. Performance characteristics of several variants of interdigitated flow fields for flow battery applications. J. Power Sources 2020, 467, 228225. [Google Scholar] [CrossRef]
- Rakesh, B.K.; Gowreesh, S.S.; Deshpande, A. Numerical investigation of hydrodynamics in a flow field and porous substrate configuration for redox flow battery application. J. Mines Met. Fuels 2023, in press. [Google Scholar]
- Prumbohm, E.; Becker, M.; Flaischlen, S.; Wehinger, G.D.; Turek, T. Flow field designs developed by comprehensive CFD model decrease system costs of vanadium redox-flow batteries. J. Flow Chem. 2021, 11, 461–481. [Google Scholar] [CrossRef]
- Jyothi Latha, T.; Jayanti, S. Hydrodynamic analysis of flow fields for redox flow battery applications. J. Appl. Electro. Chem. 2014, 44, 995–1006. [Google Scholar] [CrossRef]
- Knudsen, E.; Albertus, P.; Cho, K.T.; Weber, A.Z.; Kojic, A. Flow simulation and analysis of high-power flow batteries. J. Power Sources 2015, 299, 617–628. [Google Scholar] [CrossRef]
- Tamayol, A.; McGregor, F.; Bahrami, M. Single phase through-plane permeability of carbon paper gas diffusion layers. J. Power Sources 2012, 204, 94–99. [Google Scholar] [CrossRef]


| Models | Width (mm) | Channel Depth (mm) | No of Channels | No. of Bends (Nb) | Total Flow Path Length (mm) | Active Area (mm2) | Channel Hydraulic Diameter (mm) | ||
|---|---|---|---|---|---|---|---|---|---|
| Channel | Rib | Horizontal | Vertical | ||||||
| A | 2 | 2 | 2 | 17 | 24 | 40 | 3037 | 2 | |
| B | 2 | 2 | 3 | 17 | 24 | 40 | 3037 | 2.4 | |
| C | 3 | 3 | 2 | 13 | 19 | 31 | 2364 | 2.4 | |
| D | 3 | 3 | 3 | 13 | 19 | 31 | 2364 | 13,095 | 3 |
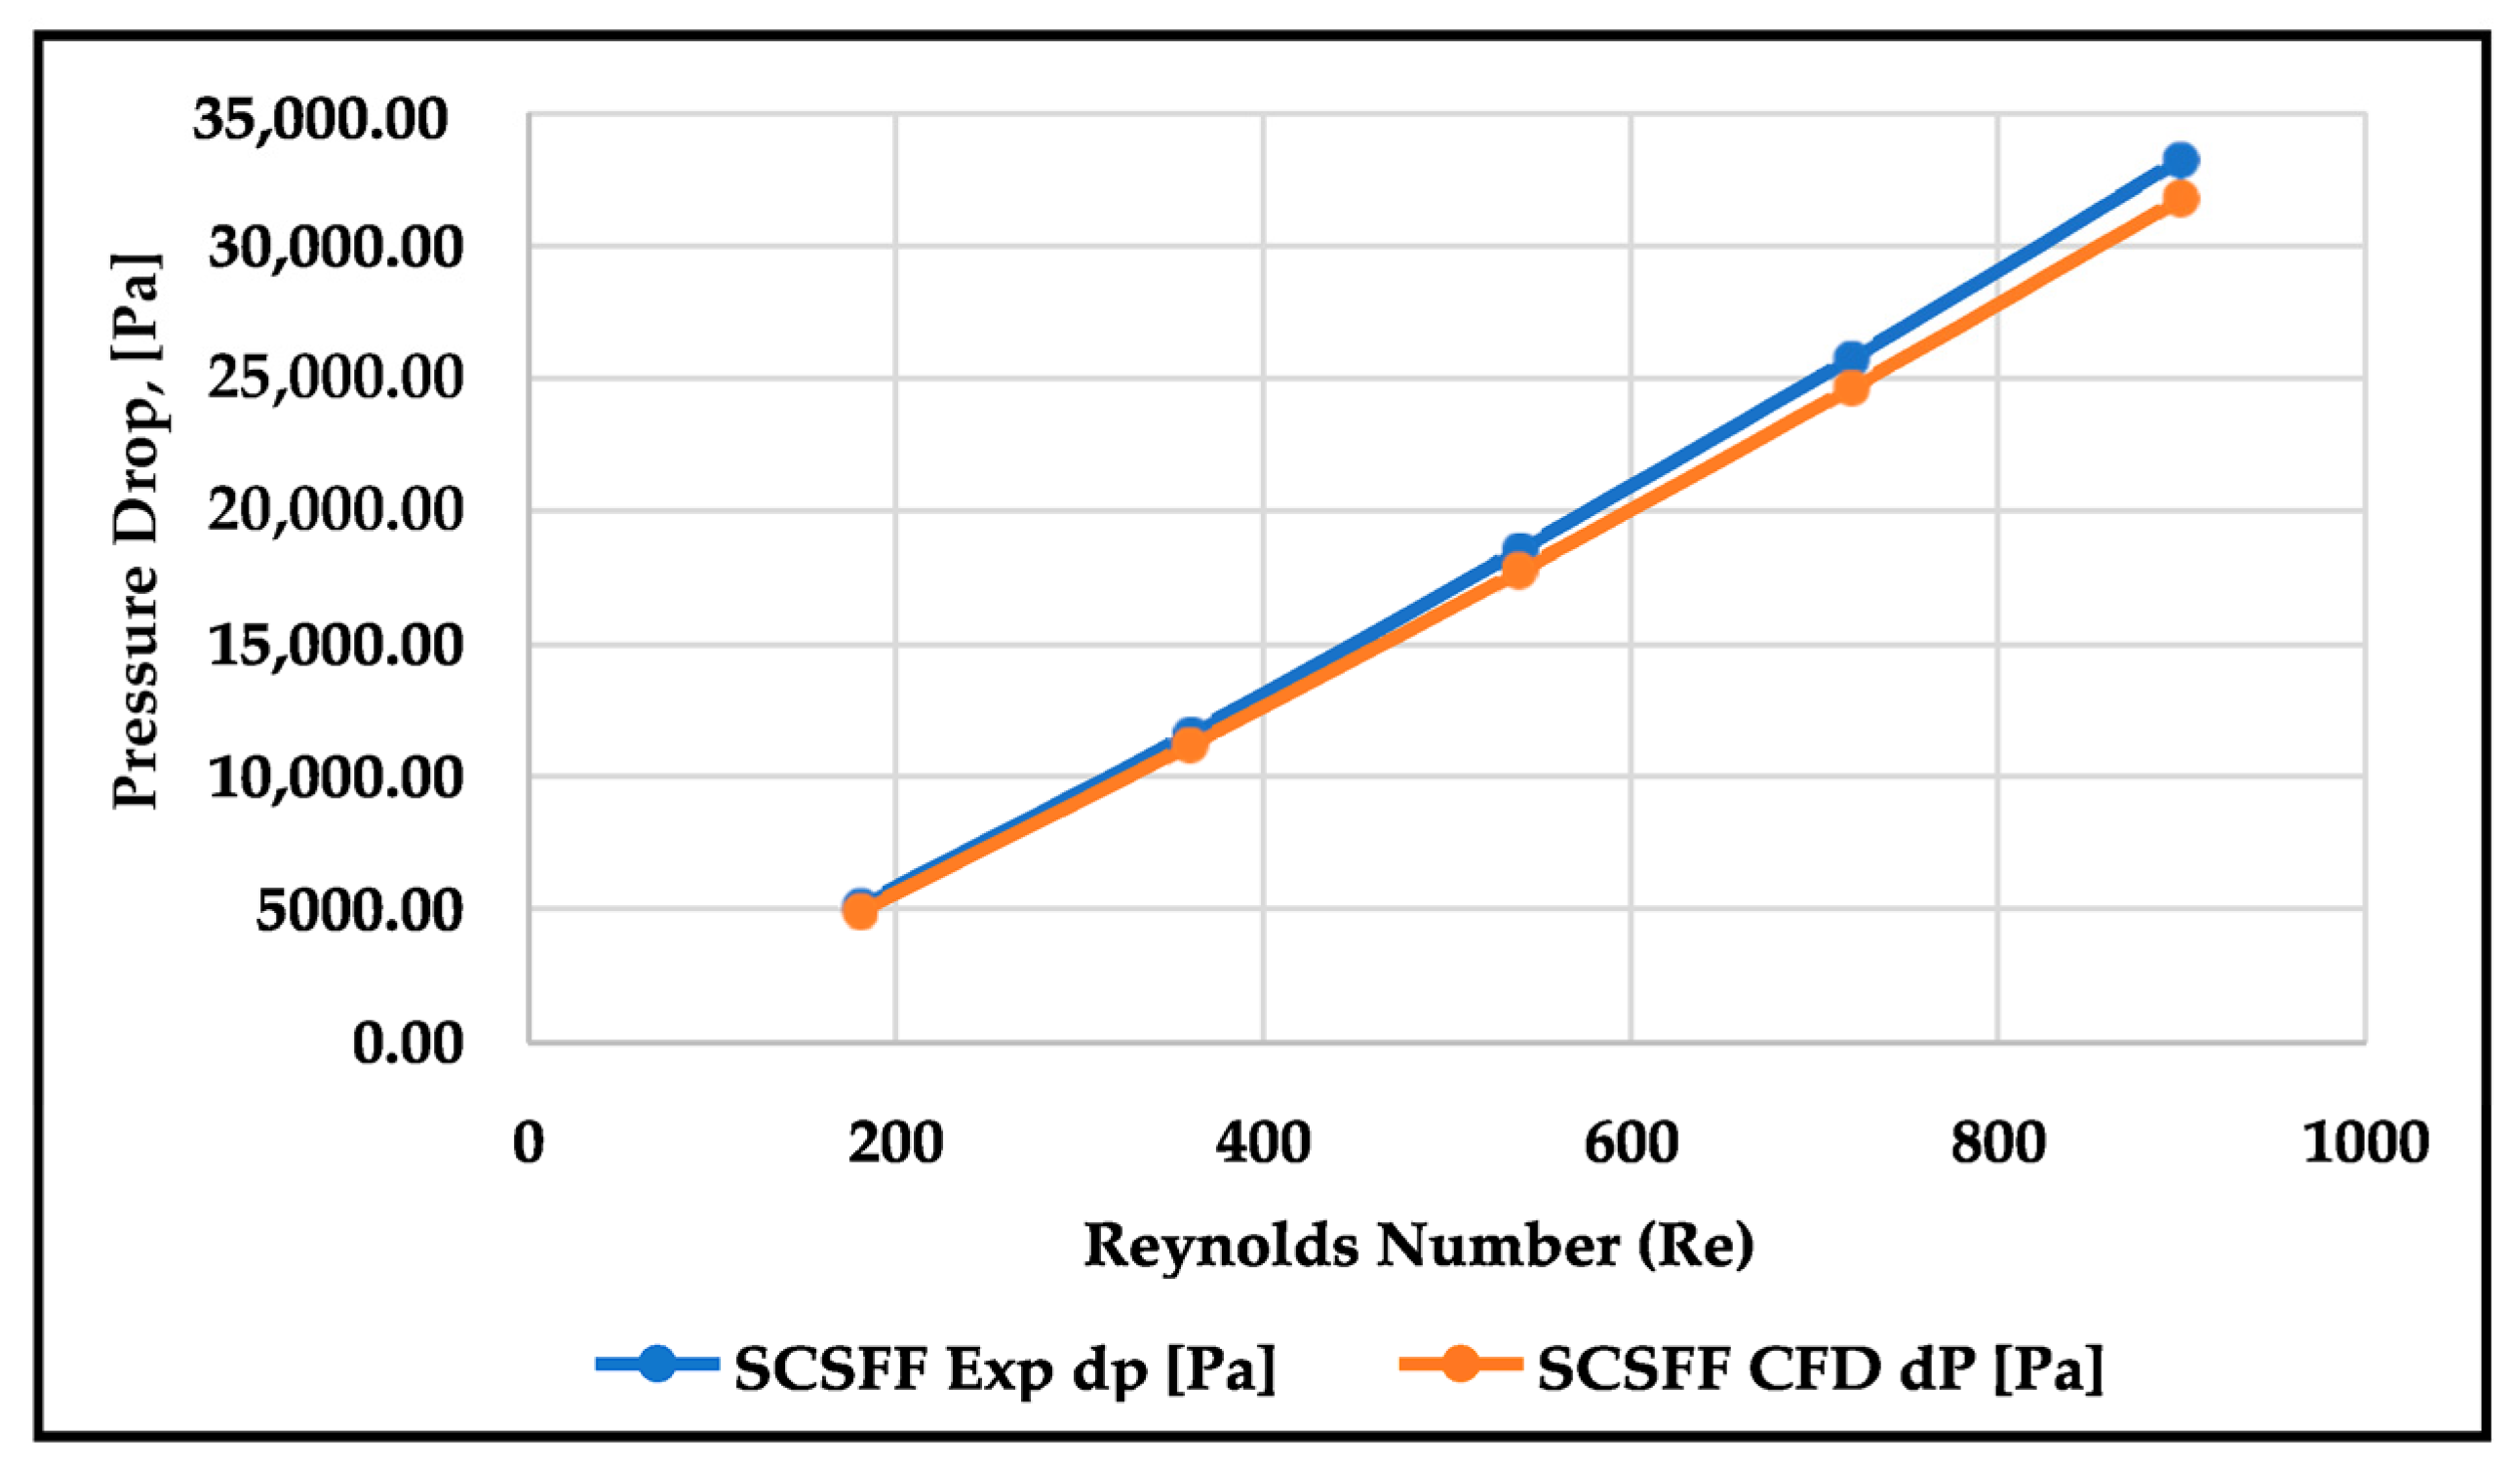
| Boundary Condition | Flow Rate mL/min | Reynold’s (Re) | CFD Pressure Drop p [Pa] | Exp Pressure Drop p [Pa] |
|---|---|---|---|---|
| 1 | 30 | 180 | 4898.61 | 5100.00 |
| 2 | 60 | 360 | 11,188.90 | 11,600.00 |
| 3 | 90 | 540 | 17,772.72 | 18,550.00 |
| 4 | 120 | 720 | 24,647.79 | 25,750.00 |
| 5 | 150 | 899 | 31,815.35 | 33,250.00 |
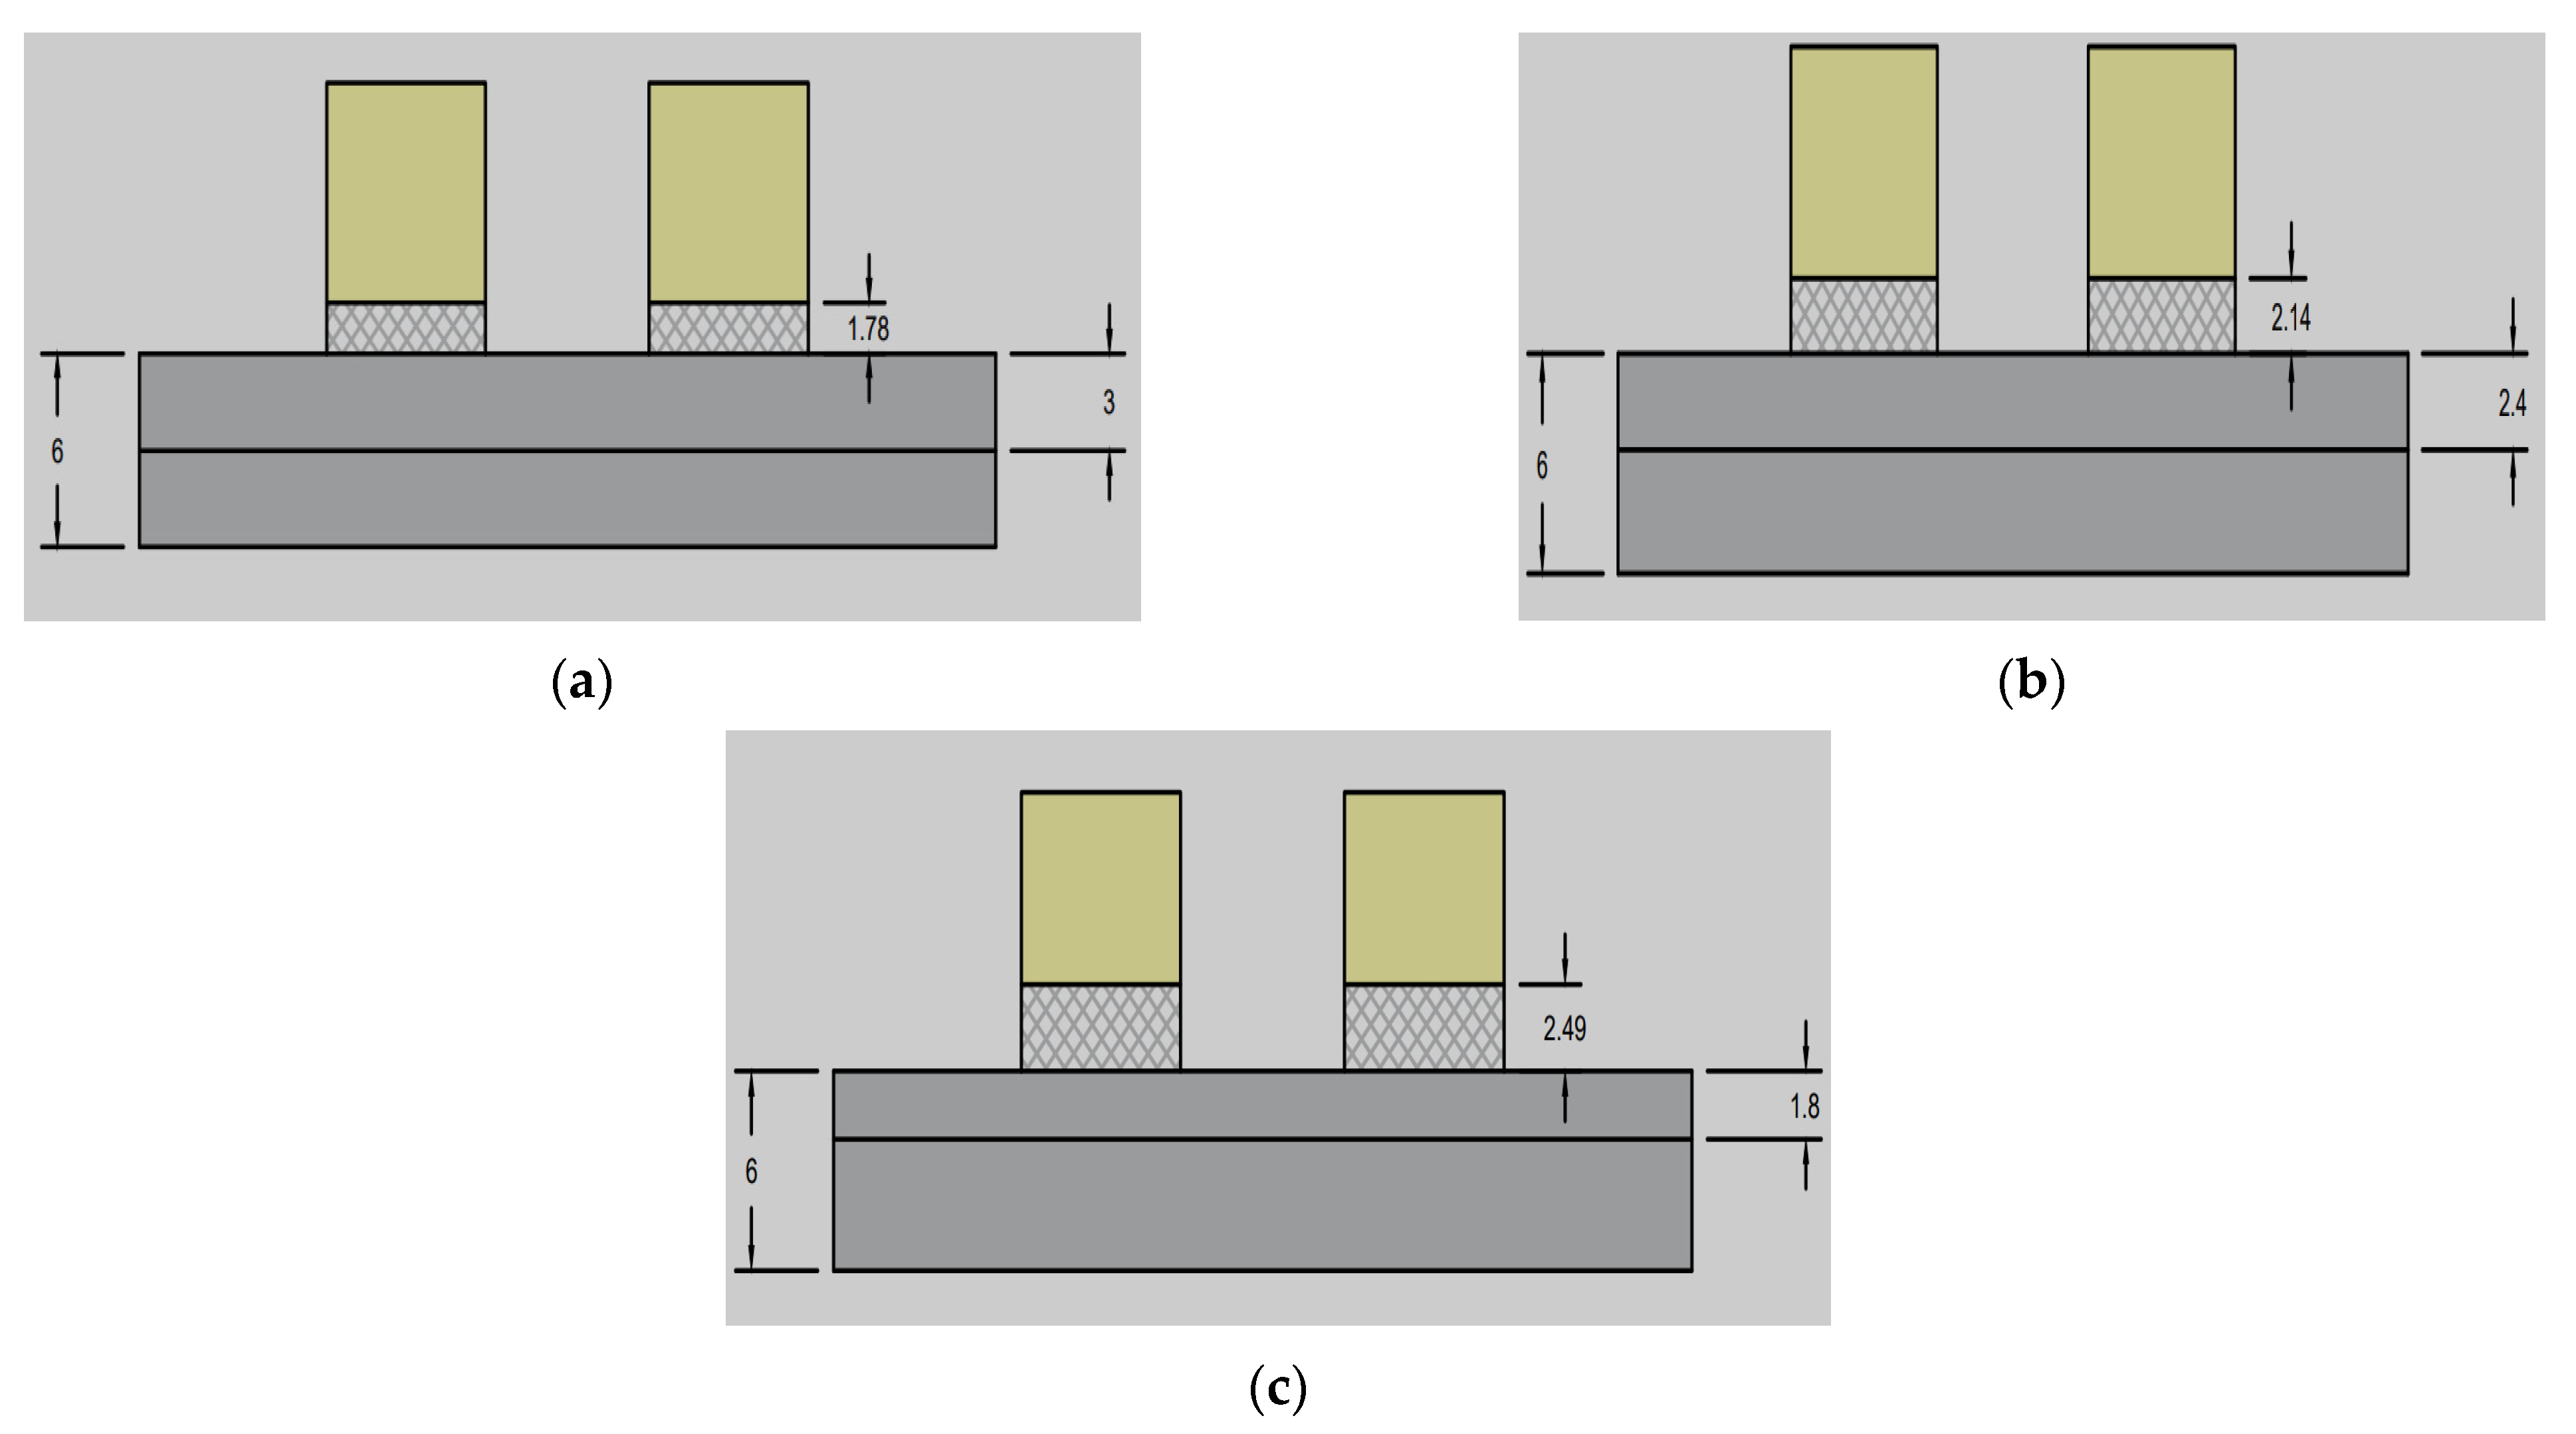
| Case | Graphite Felt Actual Thickness (mm) | CR 50% | CR 60% | CR 70% |
|---|---|---|---|---|
| Compressed value | 6 | 3 | 2.4 | 1.8 |
| Intrusion value | 1.78 | 2.14 | 2.49 |
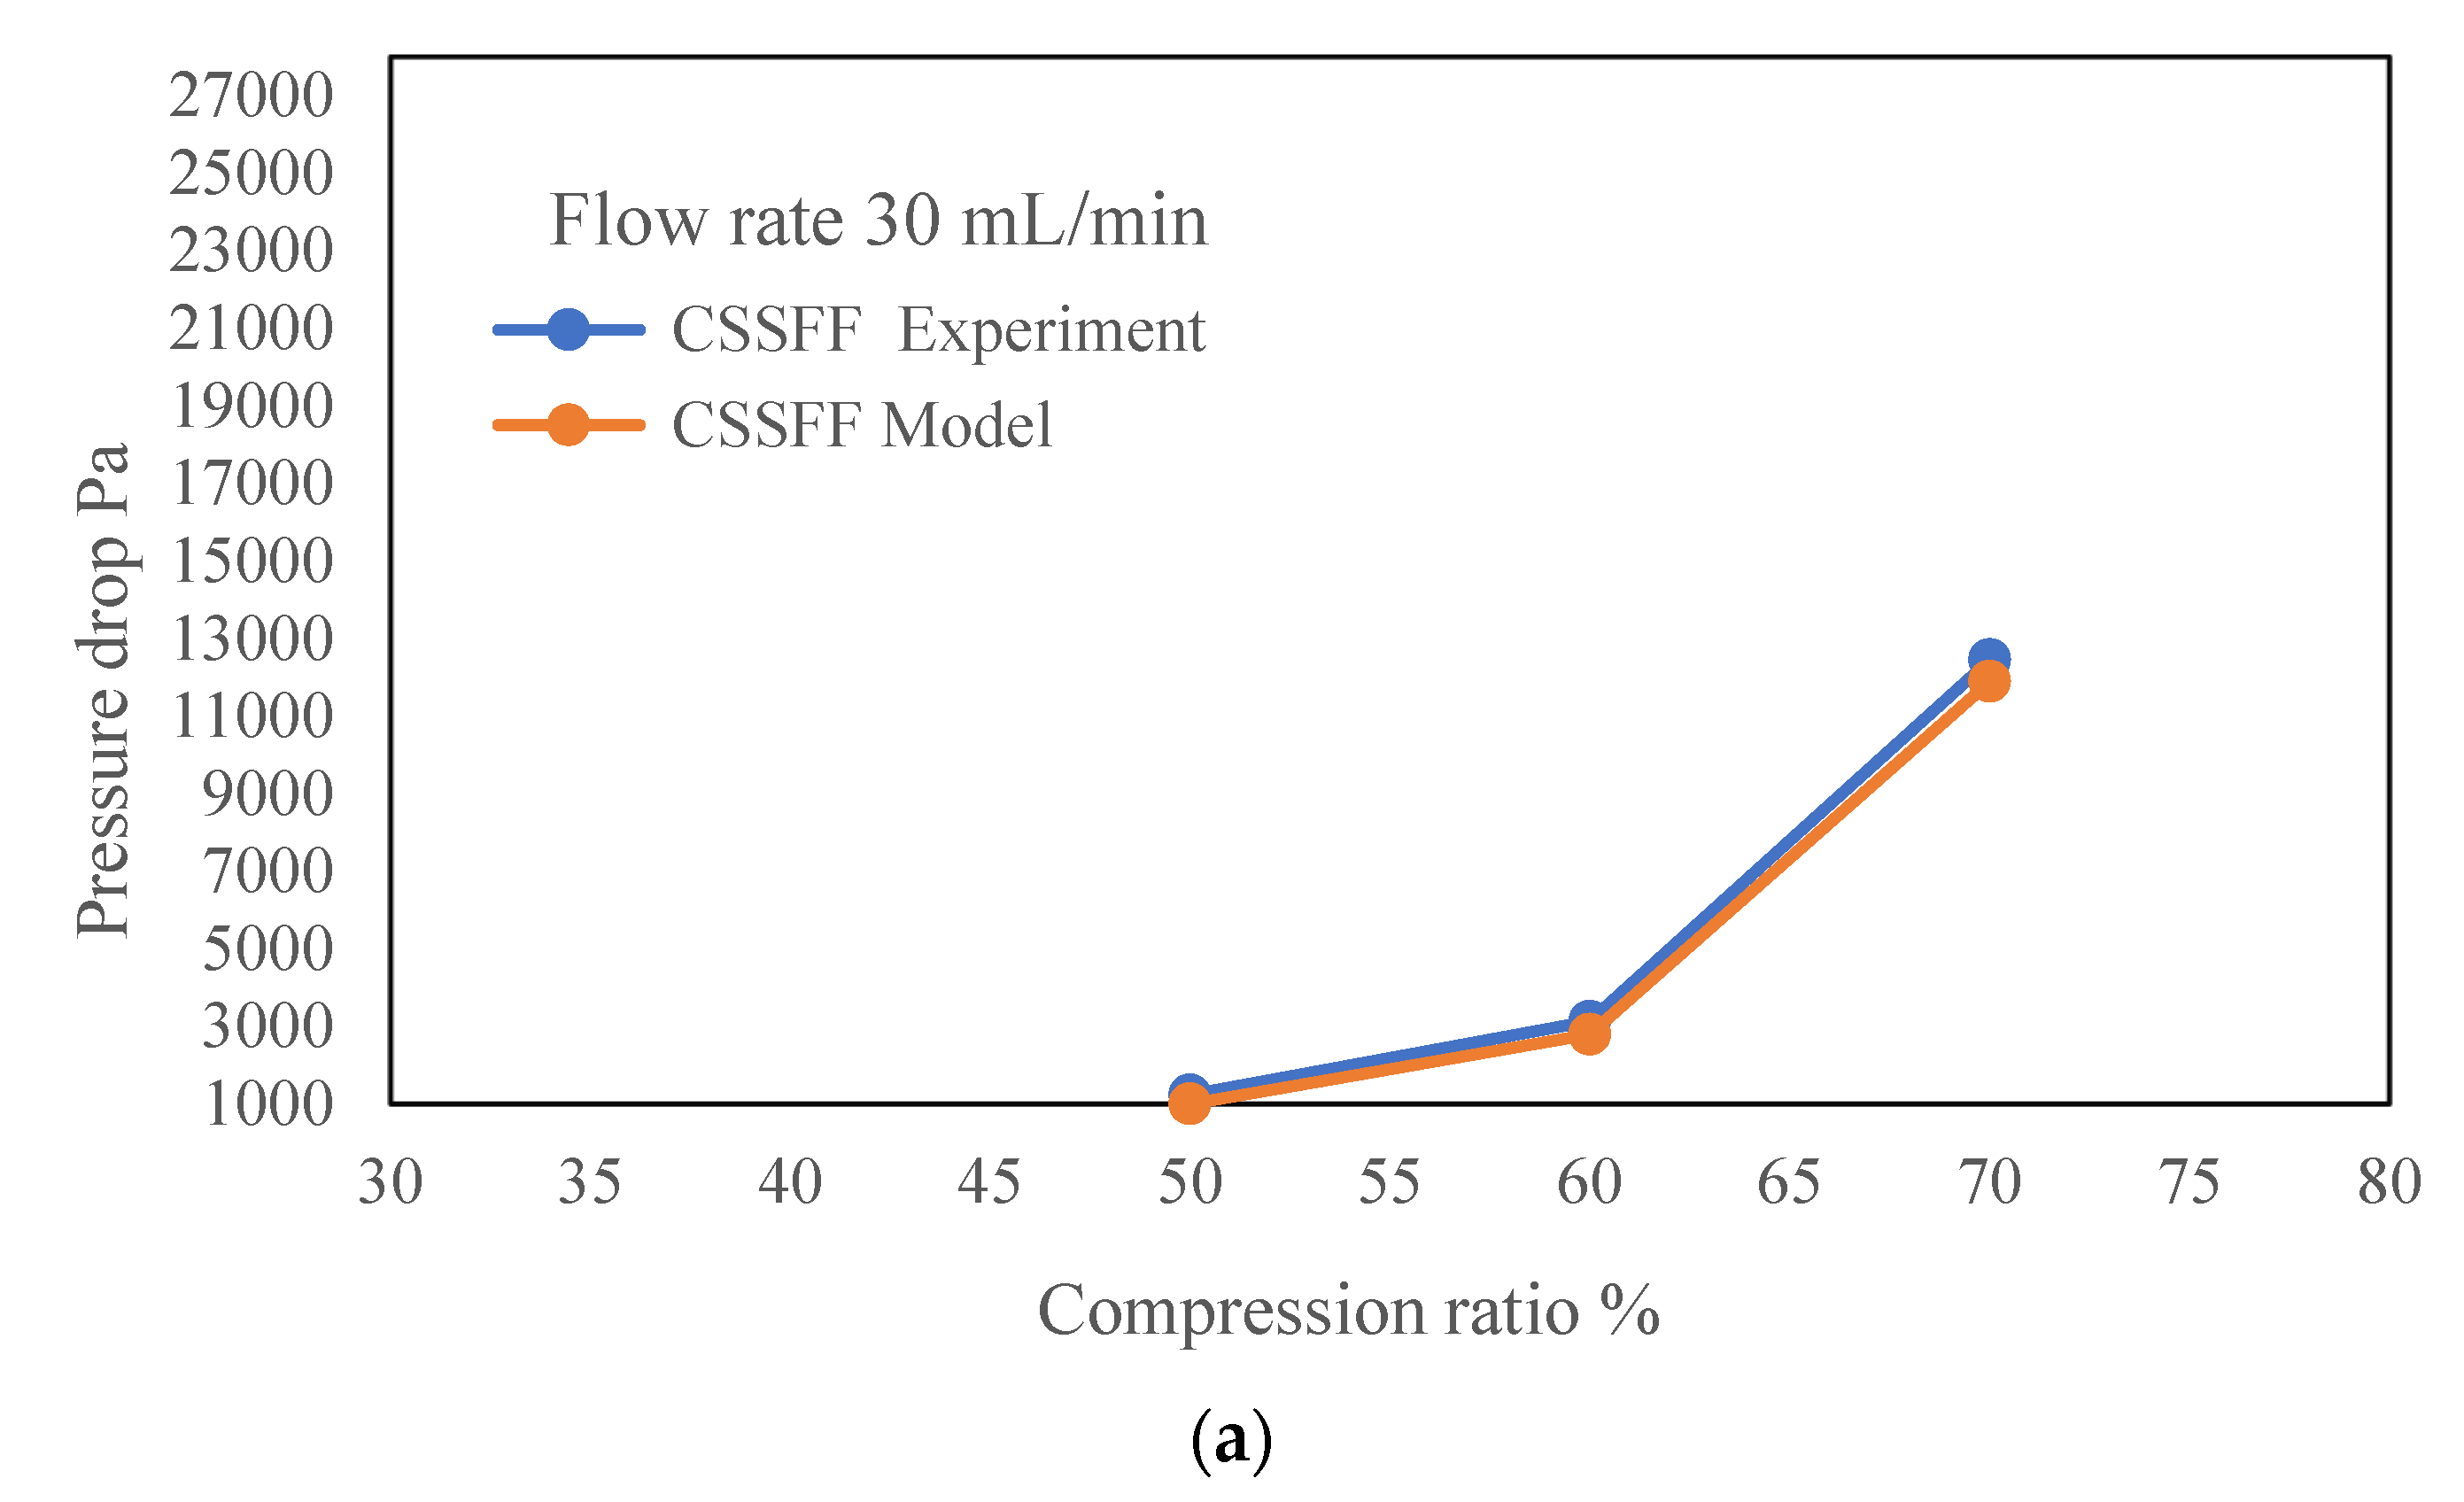
| Flow Rates mL/min | Compression Ratio % | Experimental CSSFF Pressure Drop, Pa | CFD Model CSSFF Pressure Drop, Pa |
|---|---|---|---|
| 30 | 50.00 | 1233 | 1002 |
| 60.00 | 3128 | 2789 | |
| 70.00 | 12,450 | 11,890 | |
| 90 | 50.00 | 1874 | 1560 |
| 60.00 | 4840 | 4150 | |
| 70.00 | 18,300 | 17,780 | |
| 150 | 50.00 | 2453 | 2223 |
| 60.00 | 7350 | 6941 | |
| 70.00 | 26,130 | 24,679 |
| Compression Ratio Percentage | Uniformity Index (Felt Mid) | Uniformity Index (Felt Volume) |
|---|---|---|
| 50 | 0.827 | 0.768 |
| 60 | 0.820 | 0.749 |
| 70 | 0.804 | 0.721 |
Disclaimer/Publisher’s Note: The statements, opinions and data contained in all publications are solely those of the individual author(s) and contributor(s) and not of MDPI and/or the editor(s). MDPI and/or the editor(s) disclaim responsibility for any injury to people or property resulting from any ideas, methods, instructions or products referred to in the content. |
© 2023 by the authors. Licensee MDPI, Basel, Switzerland. This article is an open access article distributed under the terms and conditions of the Creative Commons Attribution (CC BY) license (https://creativecommons.org/licenses/by/4.0/).
Share and Cite
Krishnappa, R.B.; Subramanya, S.G.; Deshpande, A.; Chakravarthi, B. Effect of Serpentine Flow Field Channel Dimensions and Electrode Intrusion on Flow Hydrodynamics in an All-Iron Redox Flow Battery. Fluids 2023, 8, 237. https://doi.org/10.3390/fluids8080237
Krishnappa RB, Subramanya SG, Deshpande A, Chakravarthi B. Effect of Serpentine Flow Field Channel Dimensions and Electrode Intrusion on Flow Hydrodynamics in an All-Iron Redox Flow Battery. Fluids. 2023; 8(8):237. https://doi.org/10.3390/fluids8080237
Chicago/Turabian StyleKrishnappa, Rakesh Basavegowda, S. Gowreesh Subramanya, Abhijit Deshpande, and Bharatesh Chakravarthi. 2023. "Effect of Serpentine Flow Field Channel Dimensions and Electrode Intrusion on Flow Hydrodynamics in an All-Iron Redox Flow Battery" Fluids 8, no. 8: 237. https://doi.org/10.3390/fluids8080237
APA StyleKrishnappa, R. B., Subramanya, S. G., Deshpande, A., & Chakravarthi, B. (2023). Effect of Serpentine Flow Field Channel Dimensions and Electrode Intrusion on Flow Hydrodynamics in an All-Iron Redox Flow Battery. Fluids, 8(8), 237. https://doi.org/10.3390/fluids8080237