Communication

Pipe Flow of Suspensions of Cellulose Nanocrystals

Department of Chemical Engineering, University of Waterloo, Waterloo, ON N2L 3G1, Canada
*
Author to whom correspondence should be addressed.
Fluids 2023, 8(10), 275; https://doi.org/10.3390/fluids8100275
Submission received: 20 September 2023 / Revised: 8 October 2023 / Accepted: 11 October 2023 / Published: 12 October 2023
(This article belongs to the Special Issue Pipe Flow: Research and Applications)

Abstract

:
The pipeline flow behavior of suspensions of cellulose nanocrystals (CNCs) was investigated over the CNC concentration range of 0.24 to 3.65 wt% in different diameter pipelines. The CNC suspensions were Newtonian below the CNC concentration of 1 wt%. At higher concentrations, the CNC suspensions were non-Newtonian power-law fluids. For Newtonian CNC suspensions, the experimental friction factor–Reynolds number data were obtained only in the turbulent regime, and the data followed the Blasius equation closely. For power-law CNC suspensions, the experimental data of friction factor–Reynolds number covered both laminar and turbulent regimes. The experimental data followed the friction factor–Reynolds number relationships for power-law fluids reasonably well.

1. Introduction

Cellulose nanocrystals (CNCs) are promising low-cost nanomaterials with unique properties [1,2,3,4,5,6,7,8,9,10,11,12,13] such as high stiffness, high aspect ratio, high surface area, low density, non-toxicity, biodegradability, and renewability. They are produced from cellulose via sulfuric acid hydrolysis of amorphous portions of cellulose fibers. When dispersed in water, they carry a negative charge due to the presence of anionic half ester groups.
The potential applications of CNCs are many. CNCs can greatly improve the gas barrier properties of packaging films when they are added to the polymeric matrix (poly lactic acid) of packaging film. CNCs act as a lubricant in reducing the coefficient of friction between surfaces and surface wear due to alignment of nanocrystals. CNCs are also good dispersants for the suspension of particles in liquids. The high aspect ratio and surface charge make CNCs excellent rheology modifiers; they thicken liquids and impart shear-thinning properties to liquids [14]. The thickening of liquids is required in many applications. For example, the texture and mouth feel properties of many food products can be manipulated using thickeners such as CNCs. For thickening purposes, the CNC is normally used at high concentrations (>1 wt%). CNCs are also excellent stabilizers for oil/water emulsions. Emulsions can be stabilized with CNC concentration anywhere in the range of 0.1 to 1.0 wt%. CNC-stabilized emulsions have potential applications in the food, pharmaceutical, and cosmetics industries. CNCs are also finding applications in the fabrication of flexible and stretchable strain sensors [15,16,17,18], stretchable electroluminescent devices [19], flexible triboelectric nanogenerators [20], and recyclable/biodegradable packaging products [21].
However, systematic studies dealing with rheology and the pumping flow behavior of suspensions of CNCs are lacking, which inspires us to explore this topic. To our knowledge, no work has been published on the flow behavior of CNC suspensions in pipelines. A good understanding of the flow behavior of CNC suspensions in pipes is important from both fundamental and practical points of view. For example, knowledge of the friction factor vs. Reynolds number relationship is required for the design and operation of pipelines and related process equipment used in the formulation and transport of CNC suspensions. The objective of this study is to systematically investigate the rheology and pipeline flow behavior of CNC suspensions over a broad range of CNC concentrations.

2. Background

The flow behavior of fluids in pipes is described in terms of friction factor–Reynolds number relationships. The friction factor ( f ) is defined as follows:
f = τ w 1 2 ρ V 2 ,
where τ w is the wall shear stress, ρ is fluid density, and V is the average fluid velocity in the pipe. For horizontal pipes, the wall shear stress is related to pressure drop as follows:
τ w = D Δ P 4 L ,
where D the is pipe internal diameter, Δ P is the pressure drop over the length L of the pipe.
Thus, friction factor in pipe flow can be measured by measuring the pressure drop as a function of flow rate.
The Reynolds number for Newtonian fluids is defined as follows:
R e = ρ D V η ,
where η is the fluid viscosity. For non-Newtonian power-law fluids, the Reynolds number is defined as follows:
R e , n = 8 n 6 n + 2 n ρ V 2 n D n K
where K and n are power-law constants, defined by the power-law model as follows:
τ = K γ ˙ n ,
where τ is the shear stress and γ ˙ is the shear rate. The power-law constants K and n are determined by fitting the power-law model to the shear stress vs. shear rate data obtained from viscometer measurements. Note that the Reynolds number for non-Newtonian fluids R e , n is also referred to as the generalized Reynolds number. For Newtonian fluids where K = η and n = 1 , R e , n reduces to the conventional Reynolds number R e .

2.1. Friction Factor vs. Reynolds Number for Newtonian Fluids

In laminar flow of Newtonian fluids, the friction factor is related to Reynolds number as follows:
f = 16 R e .
The friction factor is independent of pipe roughness in laminar flow. However, in turbulent flow of Newtonian fluids, the friction factor is a function of both the Reynolds number and the relative roughness of the pipe ϵ / D . When the pipe is a hydraulically smooth pipe ϵ / D 0 , the friction factor depends only on R e in the turbulent regime. The friction factor data for turbulent flow of Newtonian fluids in smooth pipes can be described accurately via the following semi-empirical equation, often referred to as the von Karman–Nikuradse equation:
1 /   f = 4 l o g 10 R e f 0.40 .
The von Karman–Nikuradse equation is not explicit in the friction factor. Several explicit f   v s .   R e relations are available in the literature. One of the popular ones is the following Blasius friction factor equation for turbulent flow of Newtonian fluids in smooth pipes:
f = 0.079 / R e 0.25 .

2.2. Friction Factor vs. Reynolds Number for Non-Newtonian Power-Law Fluids

For laminar flow of non-Newtonian power-law fluids in pipes, the friction factor is a function of the generalized Reynolds number Re , n , as shown below:
f = 16 Re , n .
This is the same relationship as that of Newtonian fluids with the conventional Reynolds number R e replaced by the generalized Reynolds number Re , n .
The friction factor in turbulent flow of non-Newtonian power-law fluids in hydraulically smooth pipes is given by the following Dodge–Metzner equation [22]:
1 f = 4 n 0.75 log 10 f 1 0.5 n Re , n 0.4 n 1.2 .
In the special case of Newtonian fluids ( n = 1 , K = η ), the Dodge–Metzner equation reduces to the von Karman–Nikuradse equation (Equation (7)).
The Dodge–Metzner equation (Equation (10)) is not explicit in f and has to be solved numerically. Dodge and Metzner [22] also proposed a Blasius-type equation explicit in f for non-Newtonian fluids as follows:
f = α n R e , n β n ,
where α n and β n are functions of n reported graphically [22]. Pal [23] proposed the following expressions α n and β n :
α n = 0.0077 ln ( n ) + 0.078 ,
β n = 0.25 ( n ) 0.22 .

3. Materials and Methods

3.1. Materials

The CNCs used in this work were provided by CelluForce Inc., Windsor, ON, Canada, under the trade name of NCC NCV100-NASD90. They were produced via sulfuric acid hydrolysis of wood pulp followed by spray-drying. The nanocrystals were rod-shaped with a mean length of 76 nm and mean width of 3.4 nm. The surface area of CNCs was 500 m 2 / g   and the crystallinity was 88%. The atomic force microscopy (AFM) image of the nanocrystals is shown in Figure 1. The water used throughout the experiments was deionized.

3.2. Flow Loop

The flow behavior of CNC suspensions was investigated in a closed-flow-loop system. The schematic diagram of the flow loop and the images of different portions of the flow loop are shown in Figure 2 and Figure 3, respectively. The CNC suspension was prepared in a large, jacketed mixing tank present in the flow loop (see Figure 3a). The temperature inside the tank was maintained constant at 22 ± 0.5 °C by passing cold or hot water through the tank jacket with the help of a temperature controller. Two centrifugal pumps (low and high capacities) were installed in the loop. Three straight pipe test sections (seamless, hydraulically smooth) of stainless steel with different diameters were installed horizontally (see Figure 3c). The pressure taps in the pipe test sections were made by drilling small holes through the pipe walls. The pressure taps on the pipe test sections were placed far enough from the entrance of flow to the pipe to ensure fully developed flow in the test section where pressure drop measurements were made. Three pressure transducers of different pressure ranges (Rosemount and Cole–Parmer: 0–0.5, 0–5, 0–10 psi) were installed in the flow loop. The pressure transducers were configured in such a manner that a desired pressure transducer could be easily connected to any of the pressure taps in use (see Figure 3b). The loop was equipped with a computer data acquisition system (see Figure 3d) which consisted of an electronic board for input and output signals and a computer terminal to process signals and gather data using the LABVIEW software version 7.1.
Table 1 gives further details about the dimensions of the pipeline test sections installed in the flow loop.

3.3. Viscometry

Fann and Haake co-axial cylinder-type viscometers were used for the rheological measurements. The relevant dimensions of the viscometers are given in Table 2. There were 12 speeds ranging from 0.9 to 600 rpm in the Fann viscometer where the inner cylinder was kept stationary, and the outer cylinder rotated. In the Haake viscometer, there were 30 speeds ranging from 0.01 to 512 rpm, and the inner cylinder rotated, whereas the outer cylinder was held stationary. The viscosity standards of known viscosities were used to calibrate the viscometers. The measurements were carried out at room temperature ( 22 ± 1   ° C ) .

3.4. Preparation of CNC Suspensions

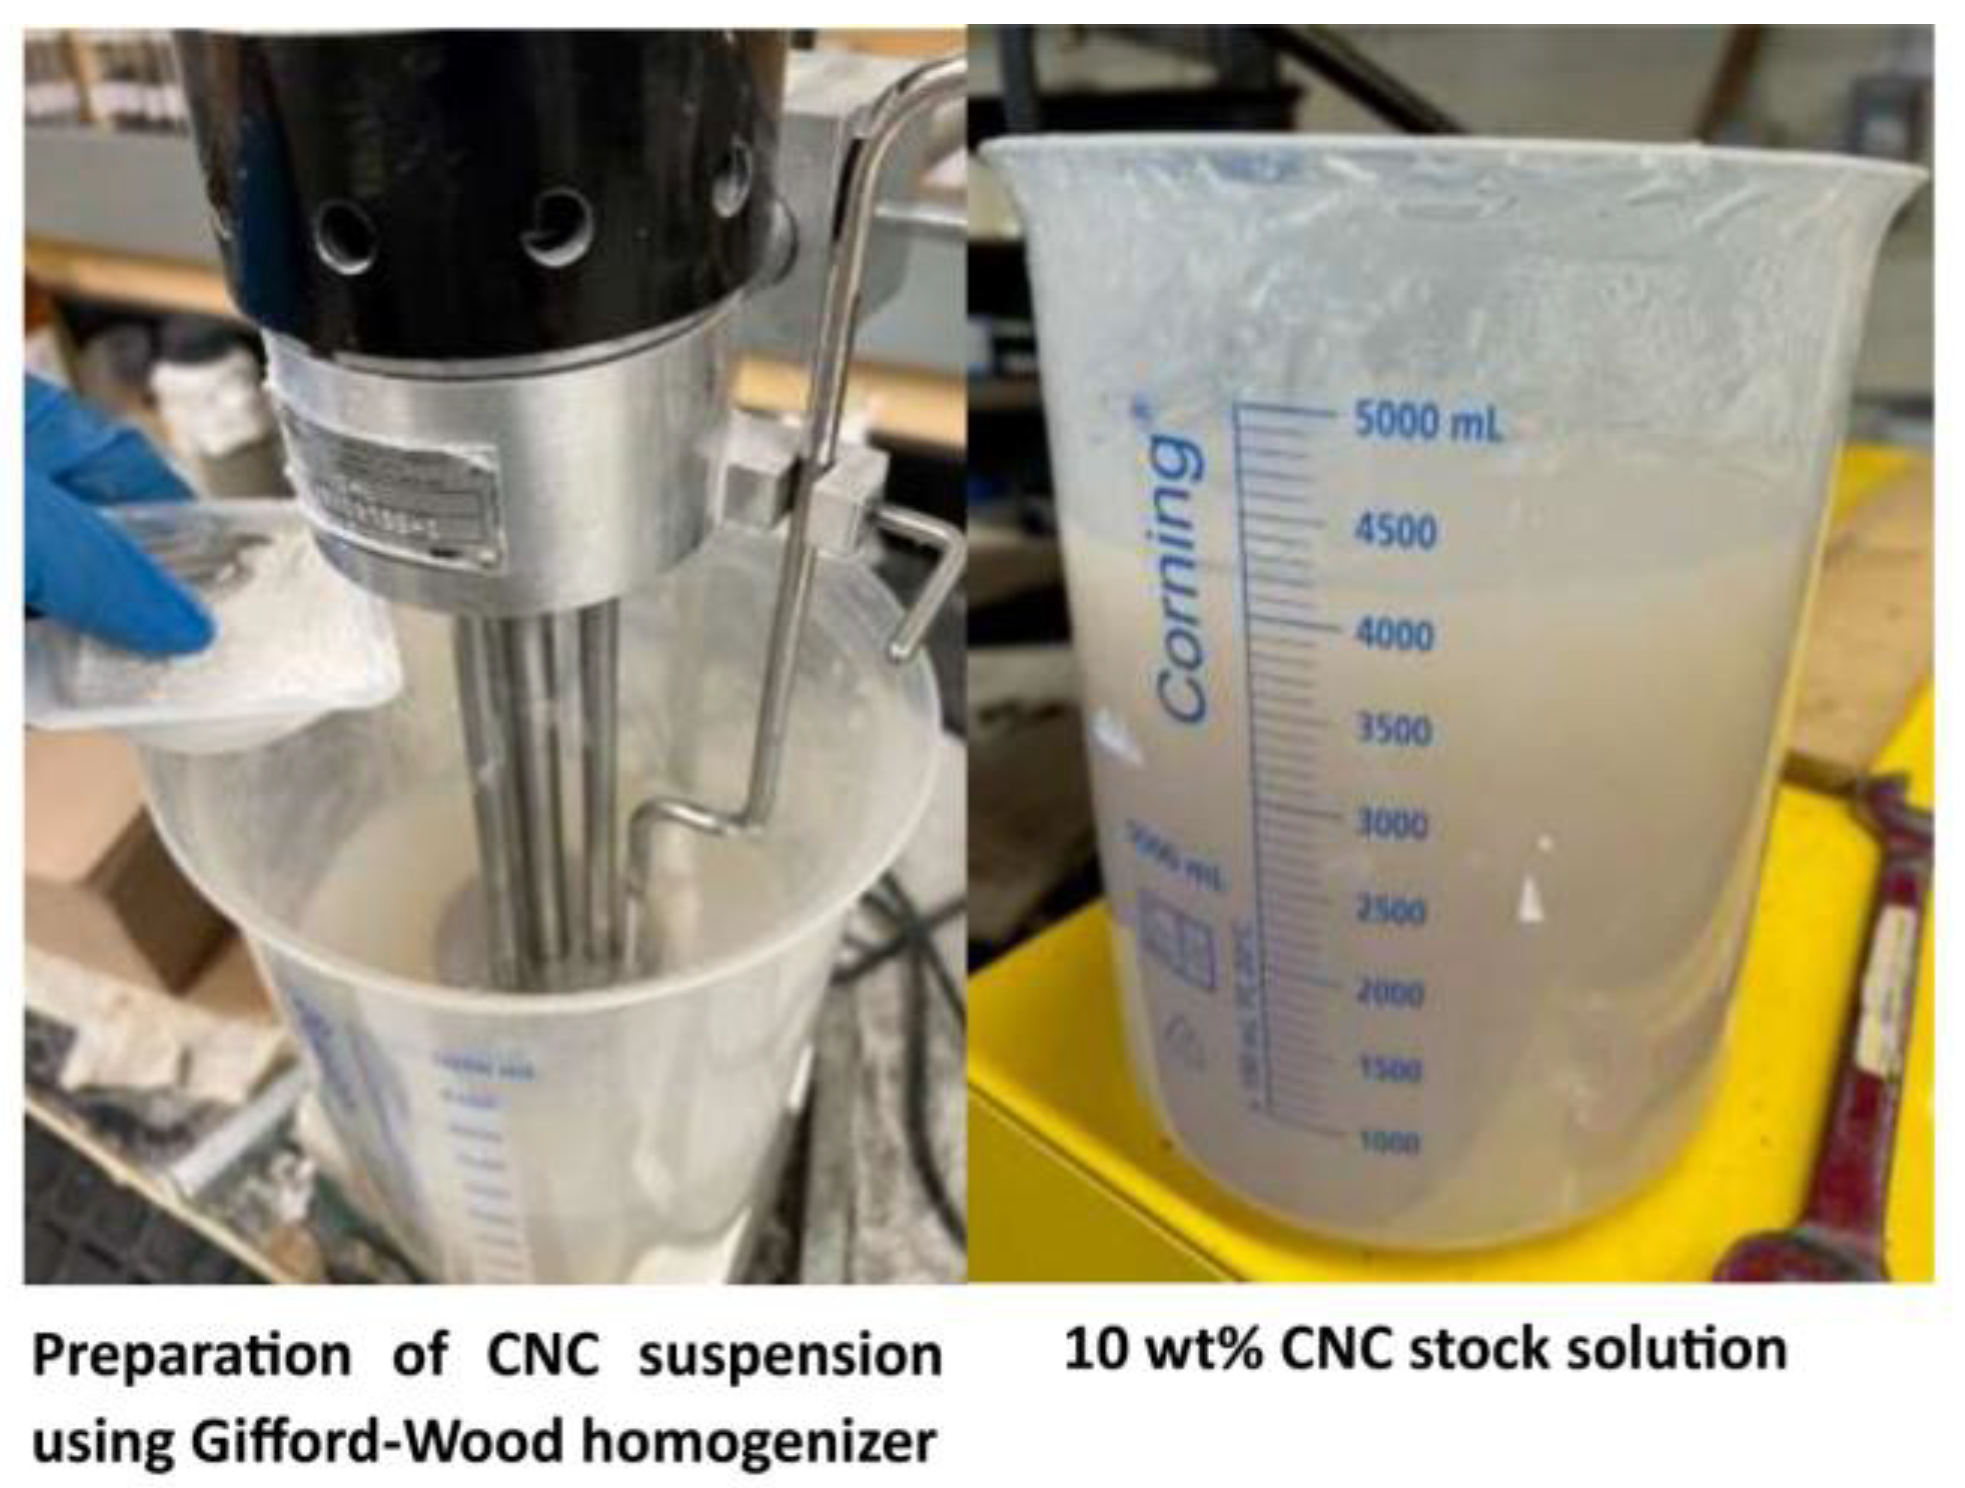
Stock solutions containing 10 wt% CNC in deionized water were first prepared in batches of approximately 4 kg in a benchtop variable-speed homogenizer (Gifford–Wood, model 1L). The mixture was sheared at high speed in the homogenizer for at least one hour. Figure 4 shows the preparation of the stock solution. The known amount of stock solution was then added to the known amount of deionized water in the flow loop tank to prepare the desired concentration of CNC suspension for the pipeline study. The suspension was thoroughly mixed in the flow loop tank with the help of an in-line mixer and pumping system for at least one hour before any pipeline data collection. Figure 5 shows the CNC suspension in the flow loop tank. To prepare a higher CNC concentration suspension, more stock solution (10 wt% CNC) was added to the existing lower CNC concentration suspension in the tank. The rheological and DLS (dynamic light scattering) measurements were carried out on CNC suspensions at each CNC concentration after collection of pipeline data in the flow loop.

3.5. Calibration of Pipeline Test-Sections

Deionized water was used to calibrate the pipeline test sections. The pressure-drop vs. flow rate data were collected over a broad range of flow rates. The pressure-drop vs. flow rate data were transformed into friction factor ( f ) vs. Reynolds number ( R e ) data. Figure 6 compares the predictions of the Blasius equation (Equation (8)) with experimental friction factor data obtained from three different diameter pipe test sections using deionized water. There is a reasonably good agreement between the experimental turbulent flow data and the prediction of the Blasius equation, indicating that the pipeline test sections were hydraulically smooth. Note that it was not possible to collect data in the laminar regime as the pressure drops were too small to be measured accurately using the available pressure transducers.

4. Results and Discussion

4.1. Particle Size Distribution of CNC Suspensions

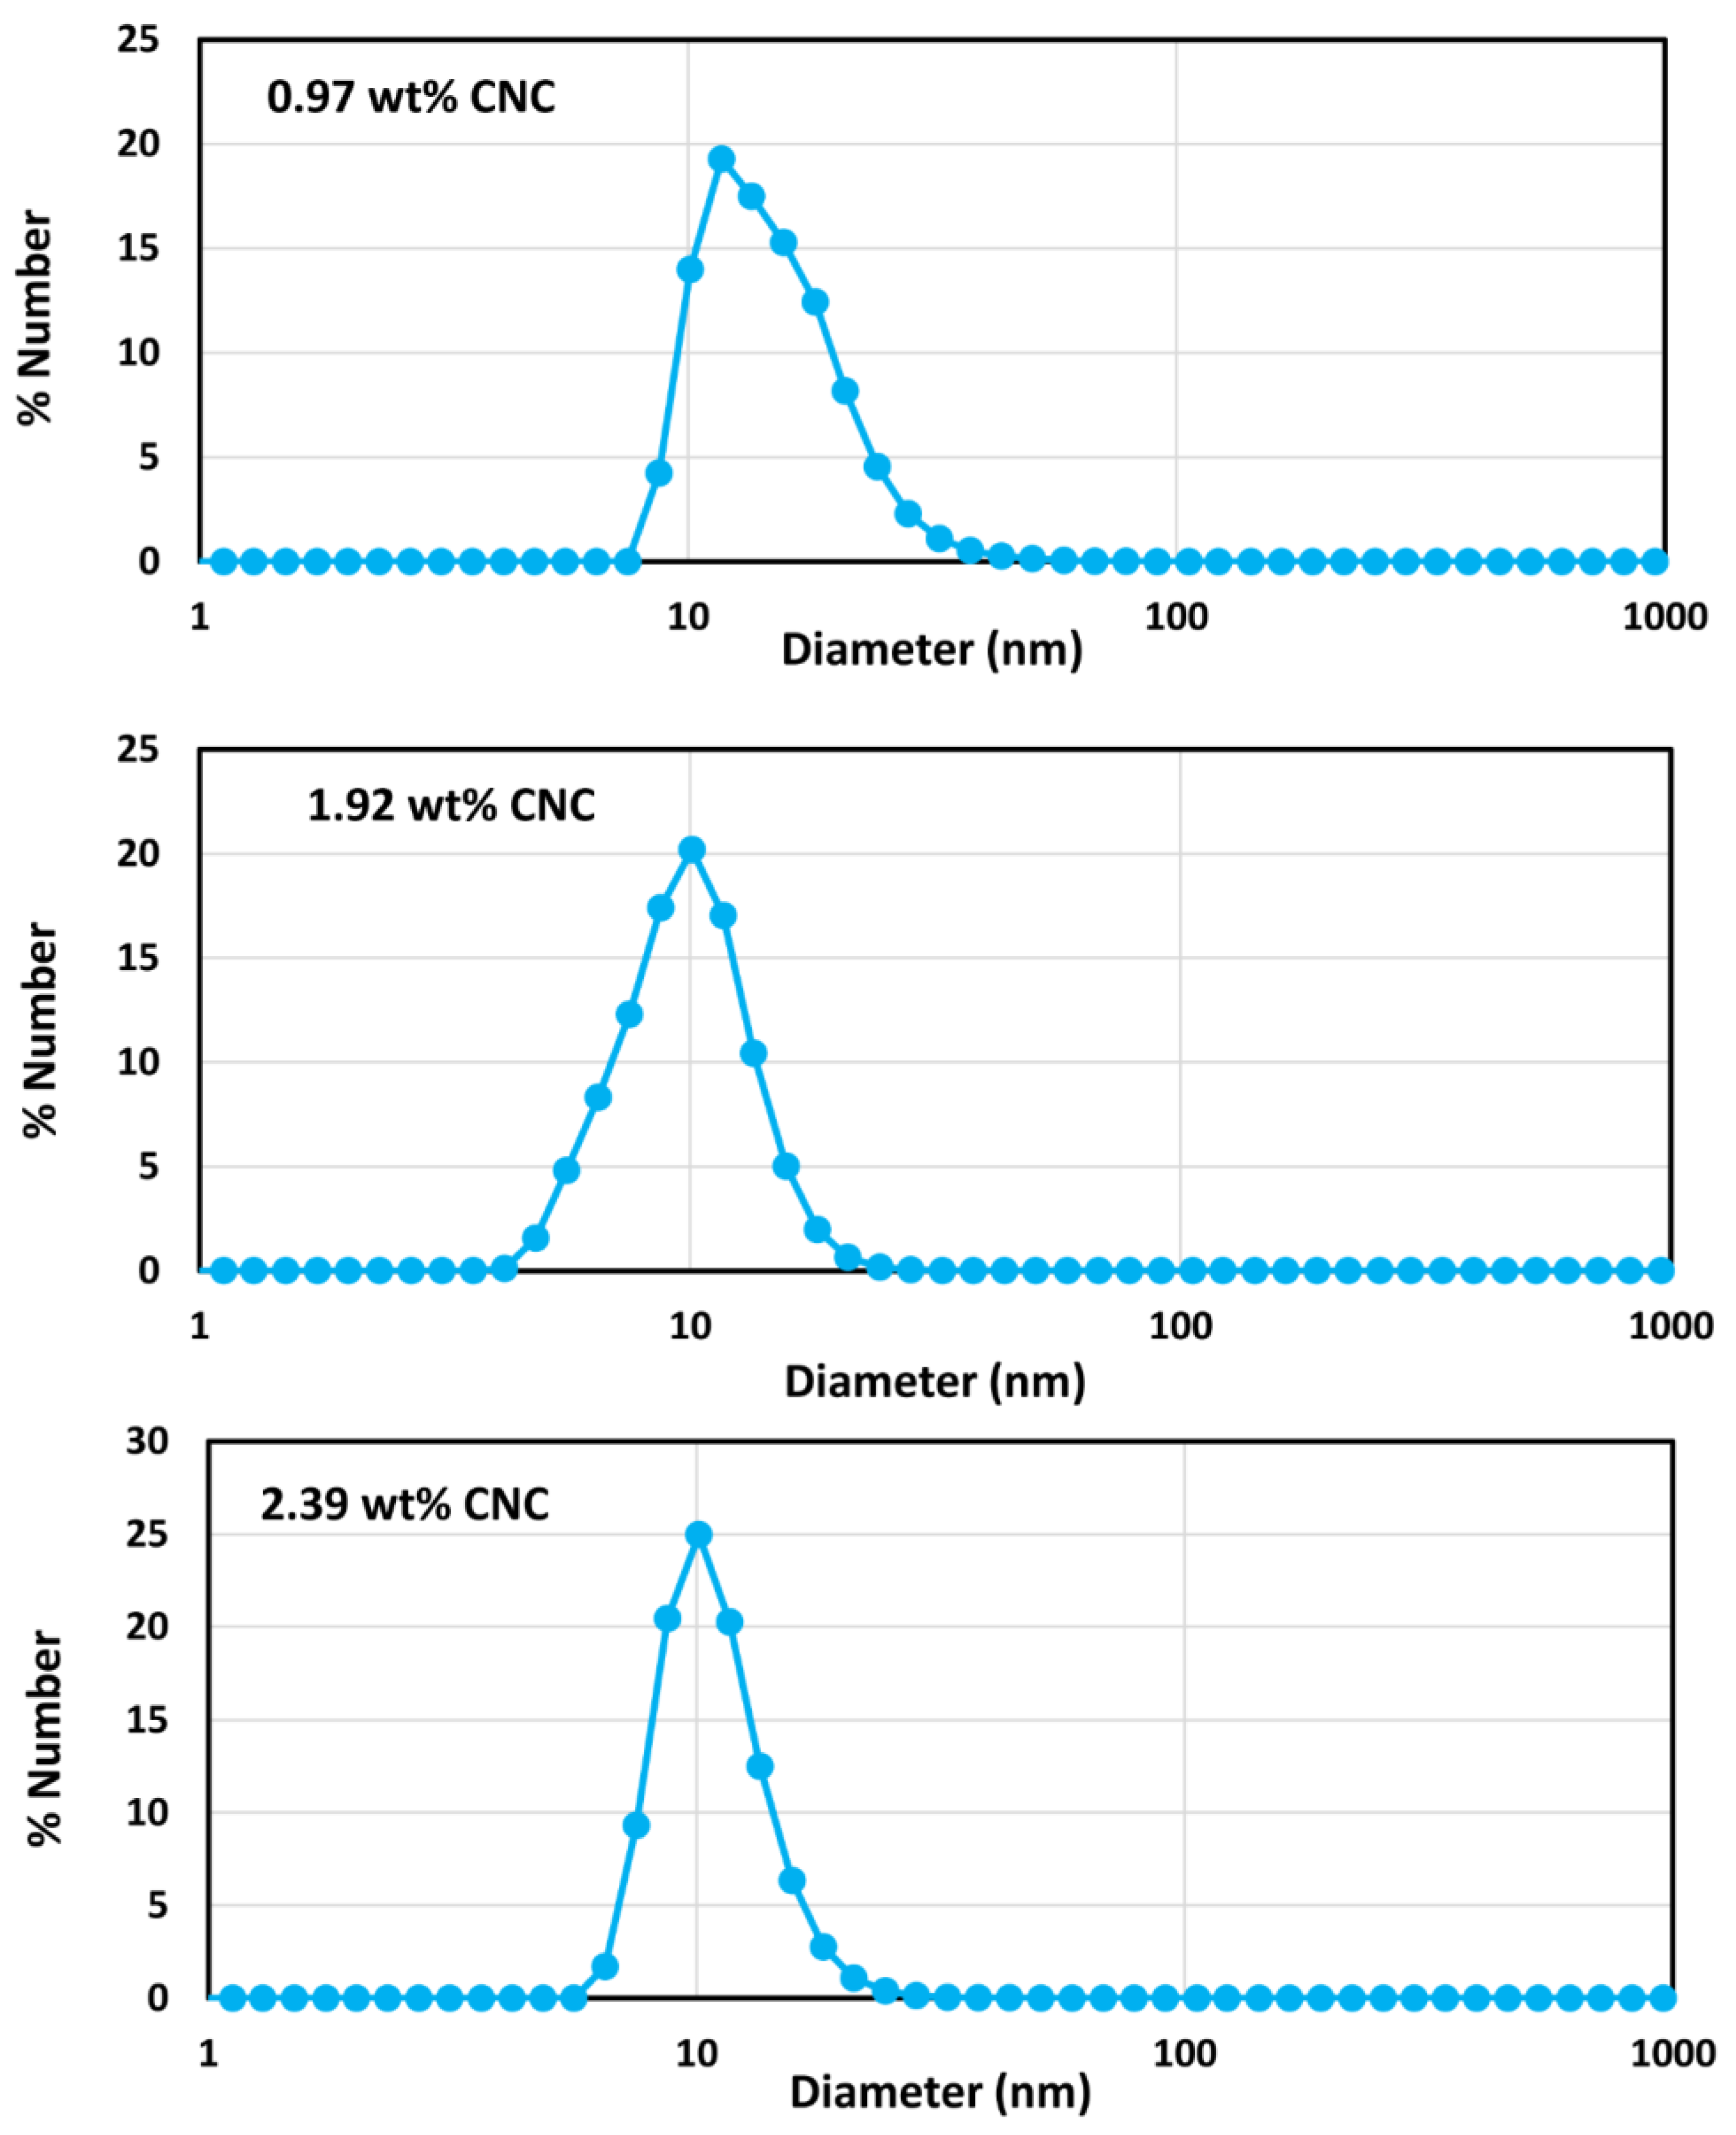
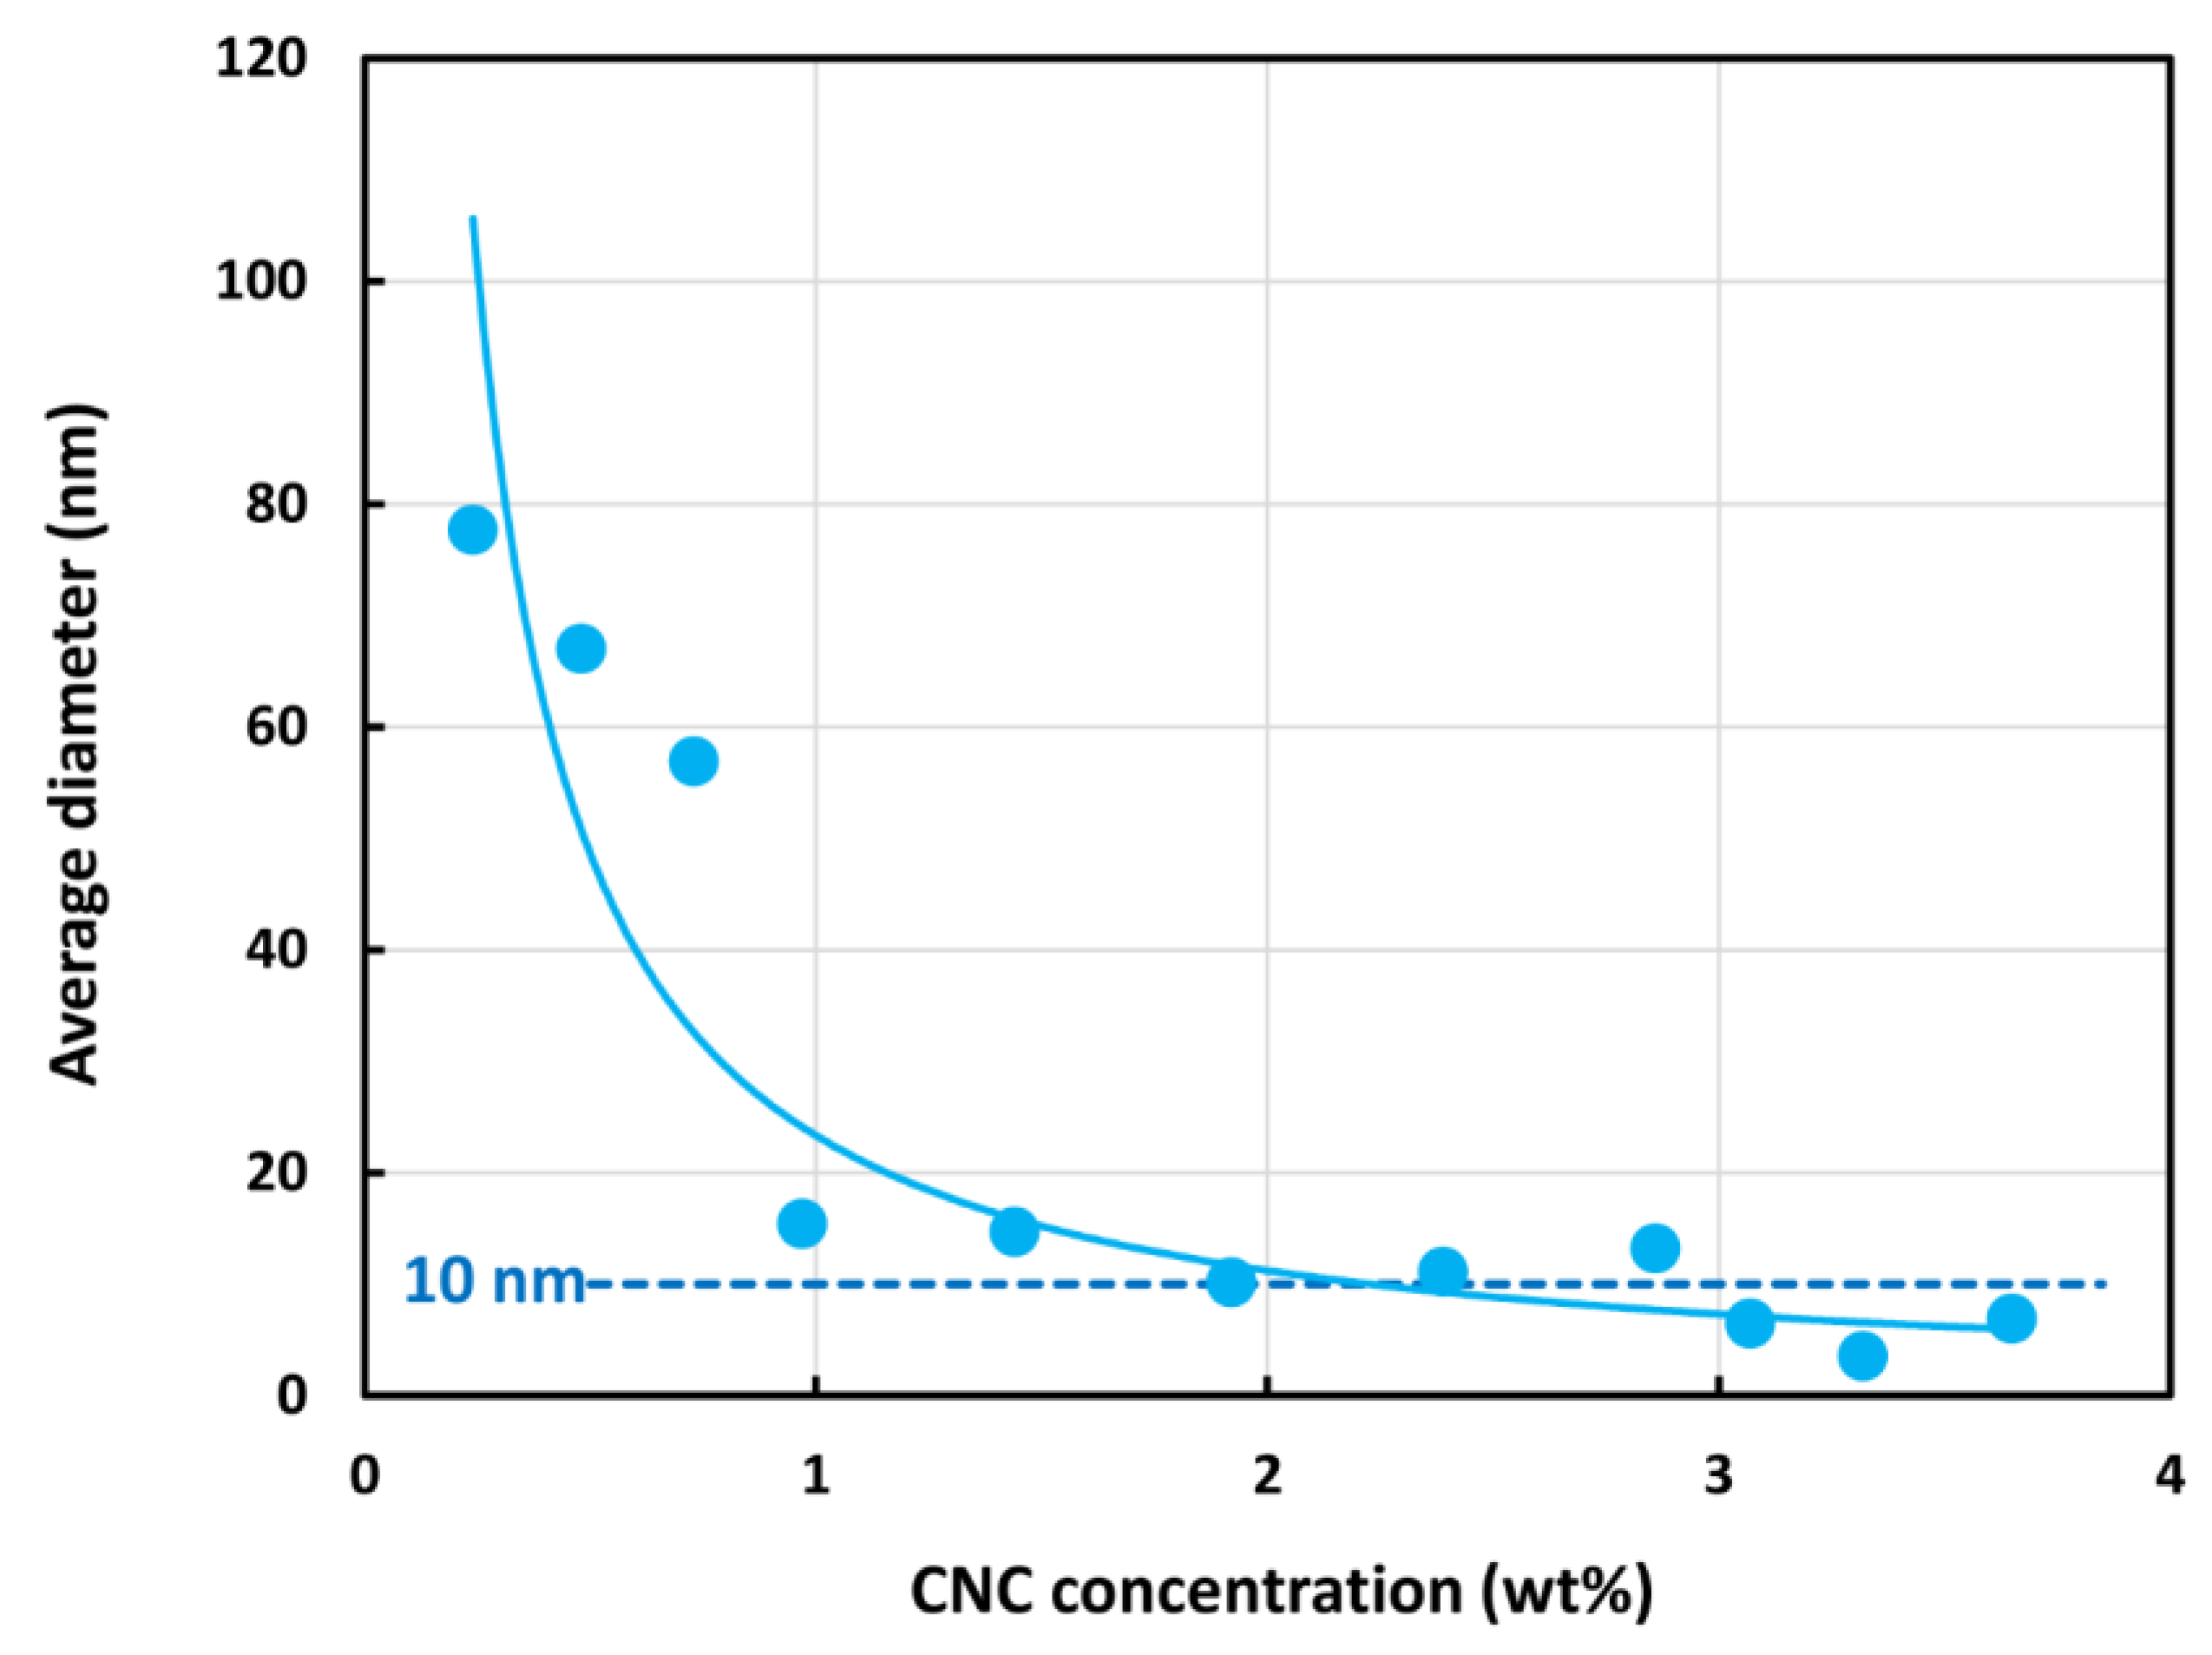
The size distribution of CNC suspension was determined via DLS using a Zetasizer Nano ZS90 with a He-Ne laser operating at 633 nm frequency. The dispersant (water) properties were specified at 25 °C as follows: viscosity = 0.8872 mPa.s; and refractive index = 1.330. For the CNCs, the refractive index specified was 1.51. This value of CNC refractive index was available in the software of the instrument and agrees with the value reported in the literature [25]. For each CNC concentration, three DLS measurements were made, and the average values were calculated. Figure 7 shows the size distributions of CNC suspensions at different CNC concentrations. The average hydrodynamic diameter of CNC at different concentrations is shown in Figure 8. The average hydrodynamic diameter of CNC (Figure 8) decreases with the increase in CNC concentration initially and then levels off at high concentrations (>1 wt%) to approximately 10 nm. The decrease in average hydrodynamic diameter of CNC is probably due to interaction of nanocrystals at high concentrations. Note that the CNC suspensions were subjected to intense shear in the pumping system of the flow loop before the DLS measurements were made.

4.2. Rheology of CNC Suspensions

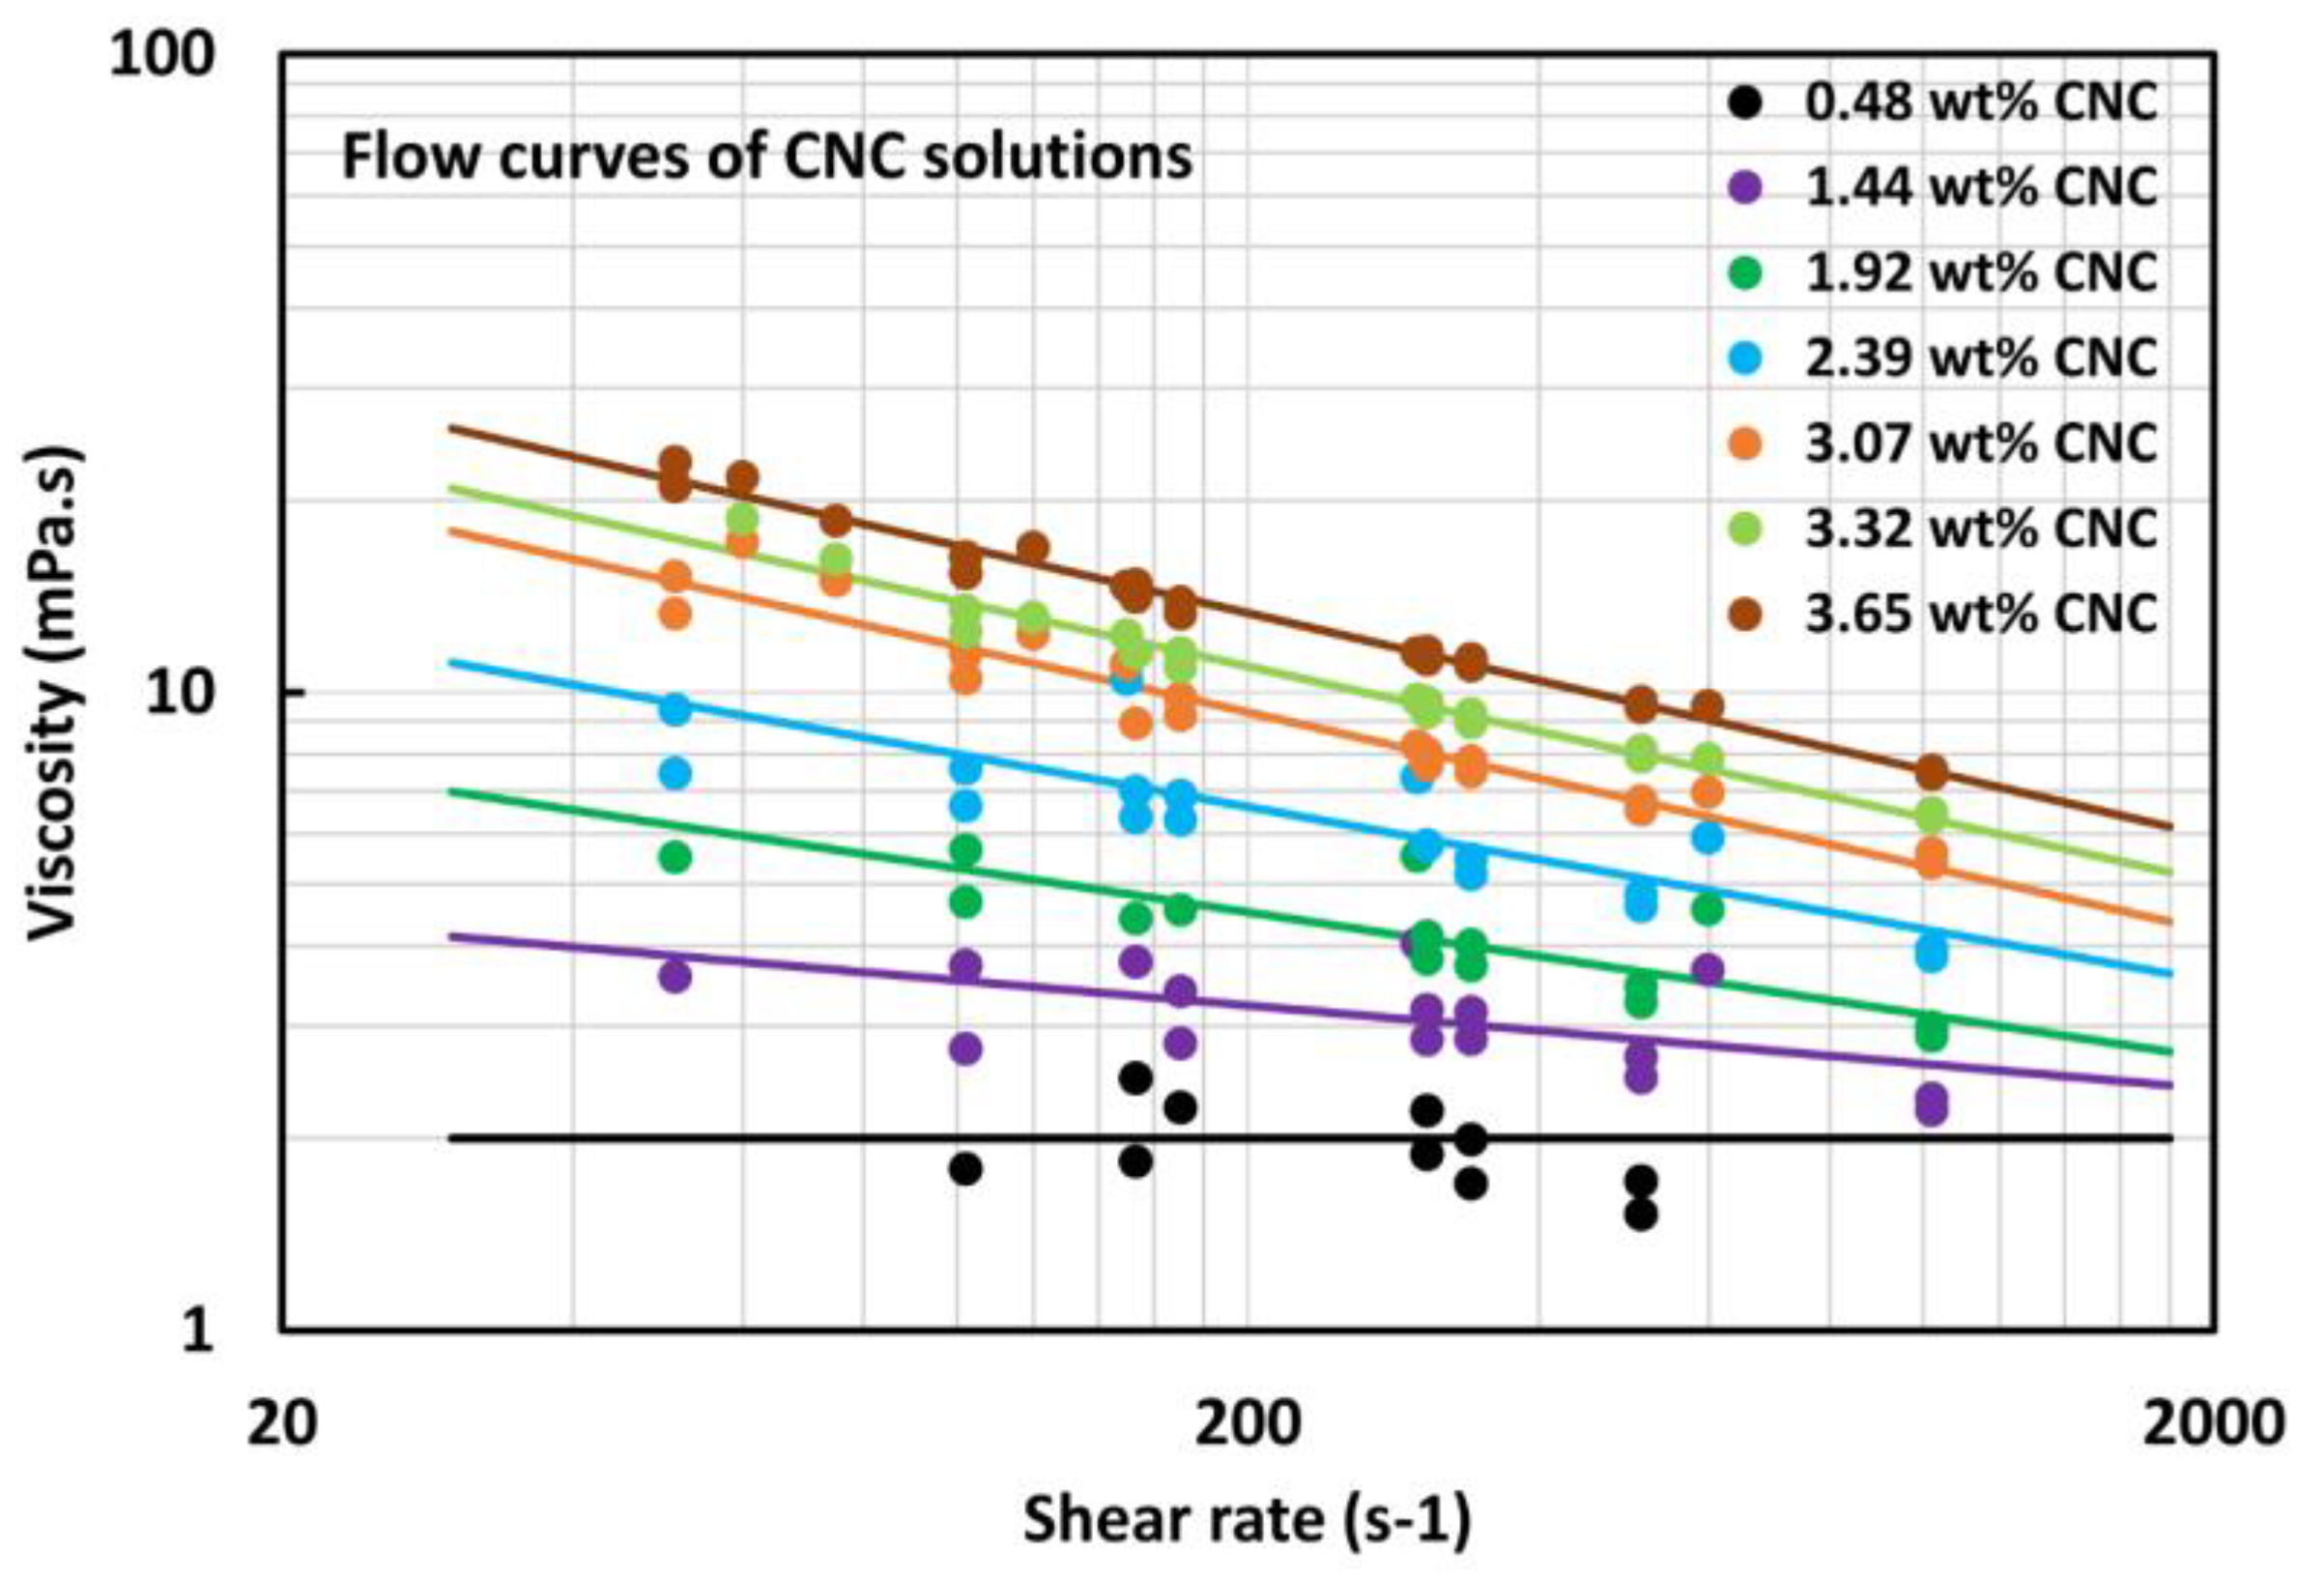
The rheology of CNC suspensions was measured at each concentration after collection of the pipeline data in the flow loop. Figure 9 shows the viscosity vs. shear rate plots of CNC suspensions at different CNC concentrations. The CNC suspensions are Newtonian at CNC concentrations lower than approximately 1 wt%; the viscosity is constant independent of the shear rate. At higher CNC concentrations, the suspensions become shear-thinning in that the viscosity decreases with the increase in shear rate. As the viscosity vs. shear rate plots are linear on a log-log scale, the CNC suspensions follow the power-law model, expressed in the form of Equation (5). The power-law model can be re-written as follows:
  η = τ / γ ˙ = K γ ˙ n 1 ,
where η is the apparent shear viscosity. From the plots of η and γ ˙ data, the power-law constants can be determined via linear regression.
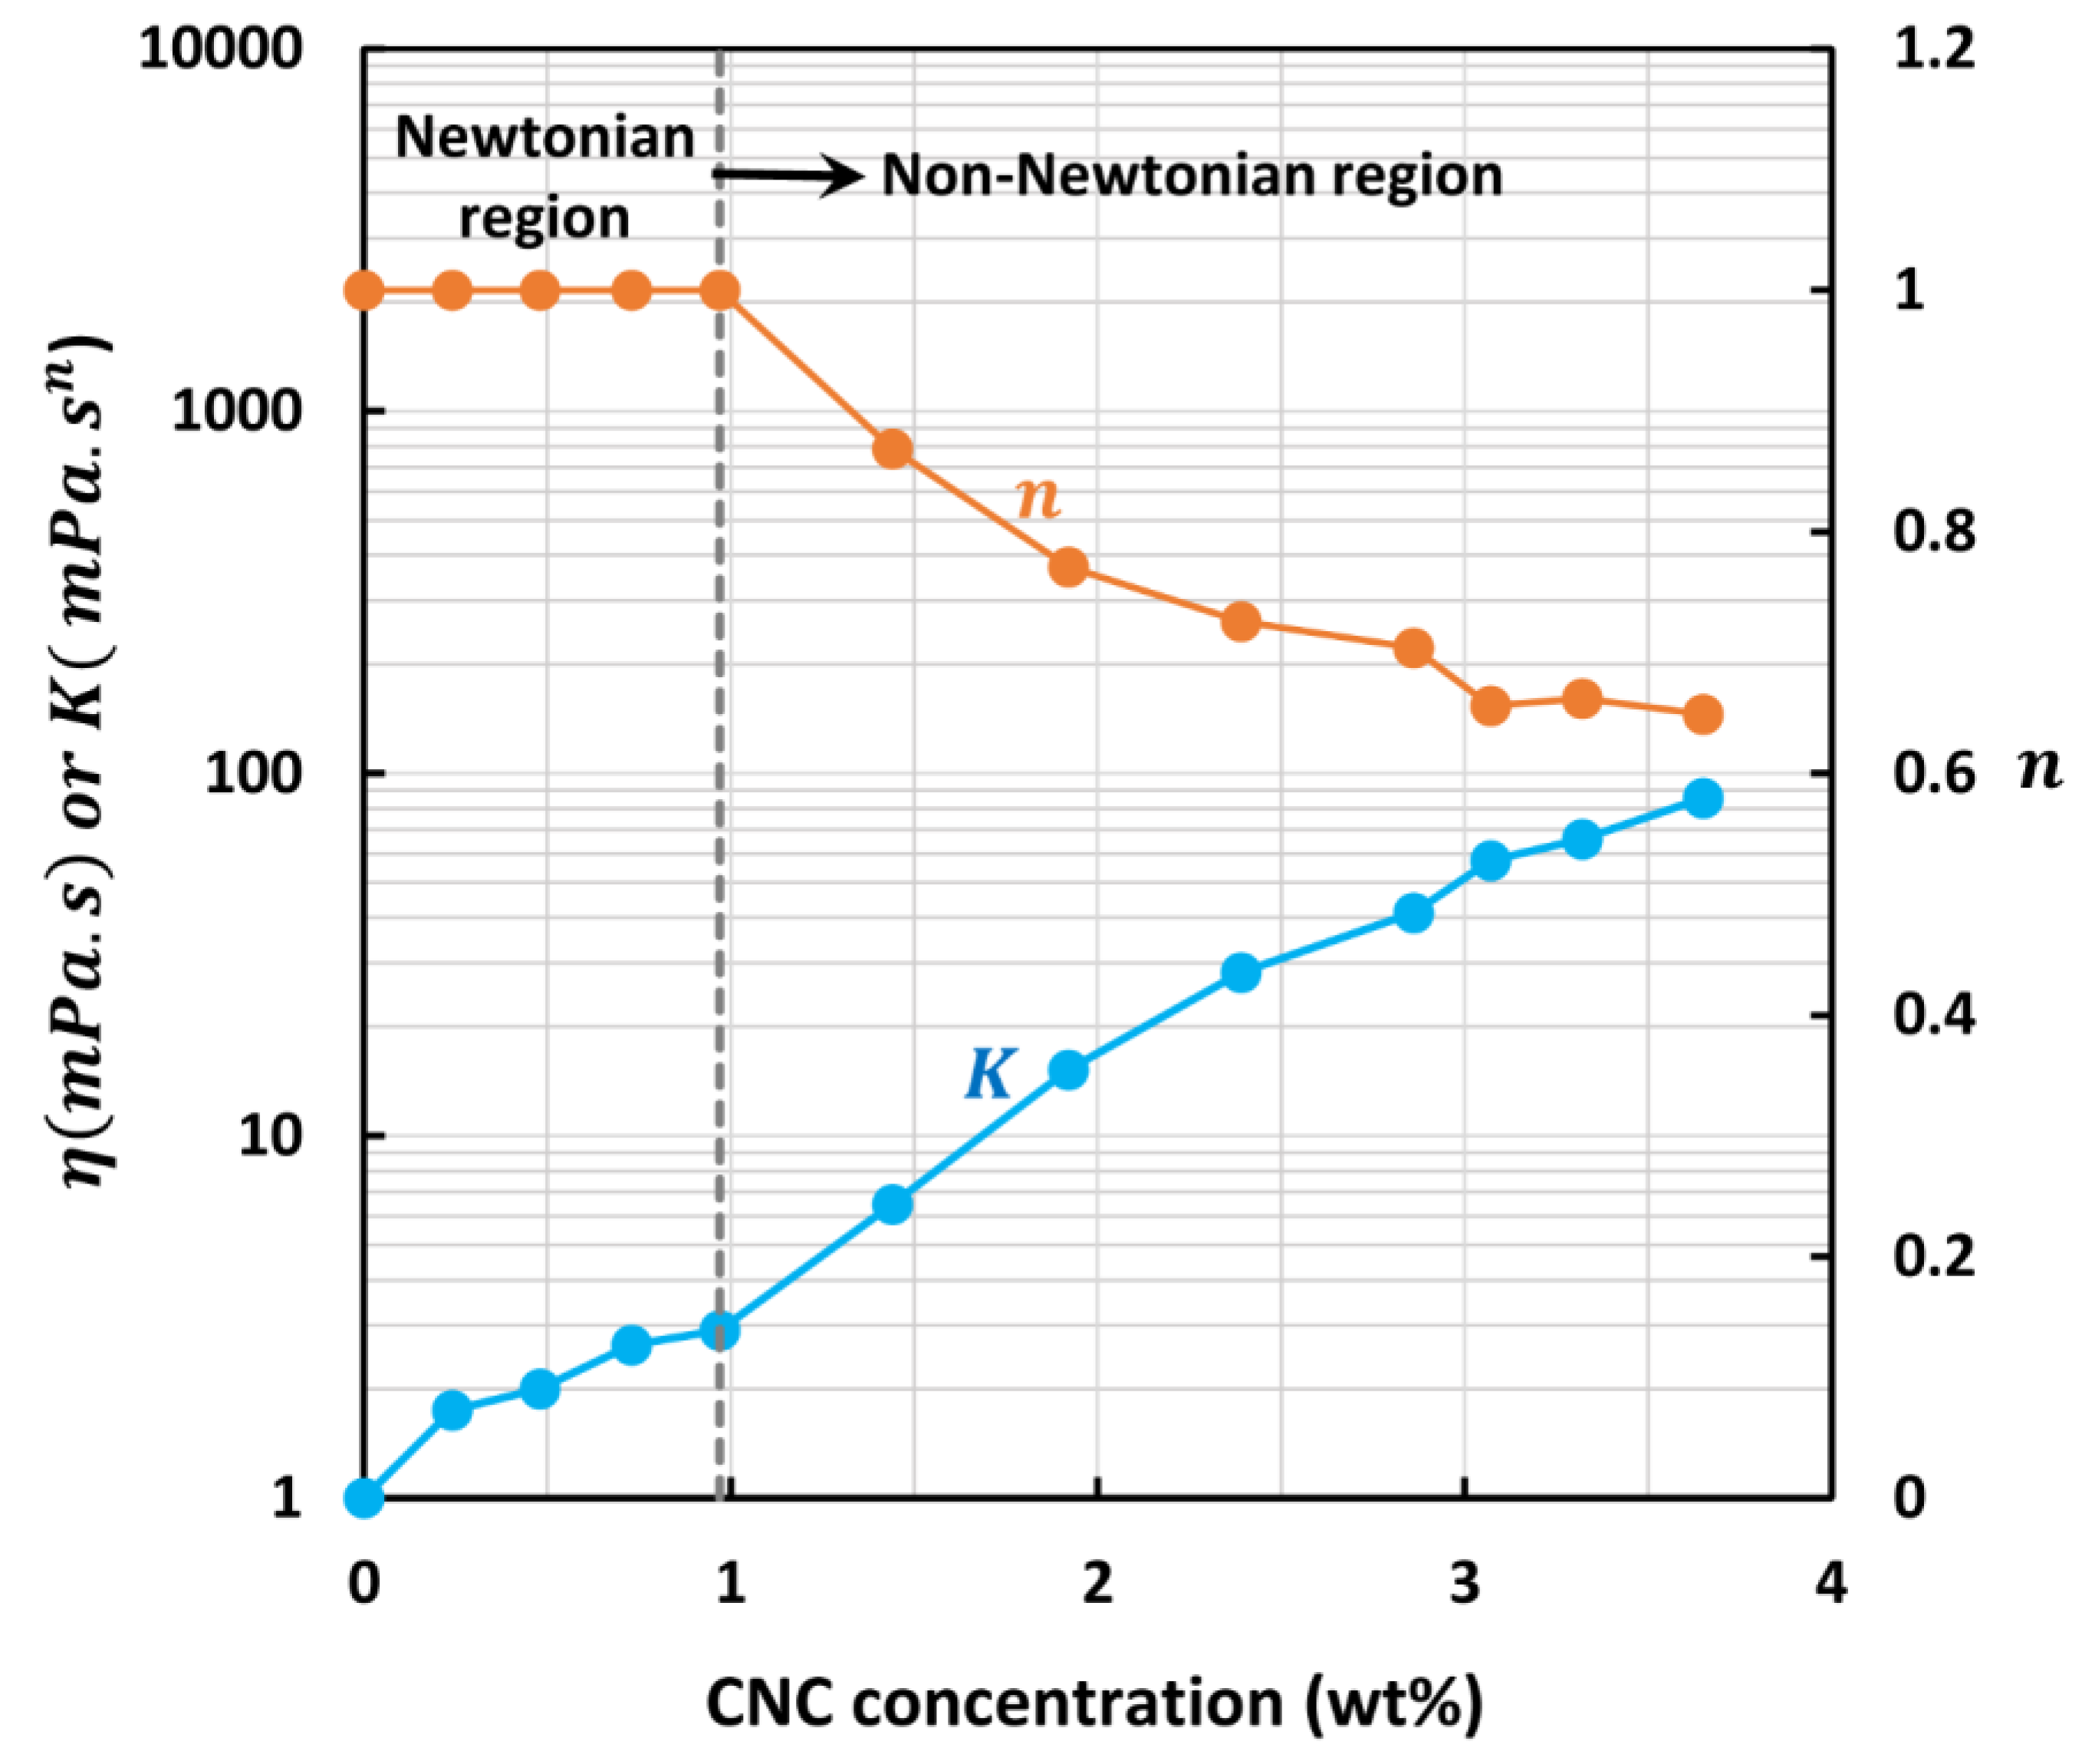
Figure 10 shows the plots of power-law constants ( K and n ) as a function of CNC concentration. The CNC suspensions are Newtonian ( n = 1 )   at CNC concentrations below 1 wt%. At higher concentrations, the CNC suspensions are shear-thinning ( n < 1 ) and the flow behavior index n decreases with the increase in CNC concentration. The consistency index ( K ) increases with the increase in CNC concentration.
The regression analysis of the power-law constants gives the following relations:
K = 1.104 e x p 1.255 C ,
n = 1.0     when   C 1   w t % ;   n = 0.9785 C 0.332   when   C > 1   w t % ,
where C is the concentration of CNC in wt%. The R-squared values are 0.97 for Equation (15) and 0.99 for Equation (16), respectively.

4.3. Pipeline Flow Behavior of CNC Suspensions

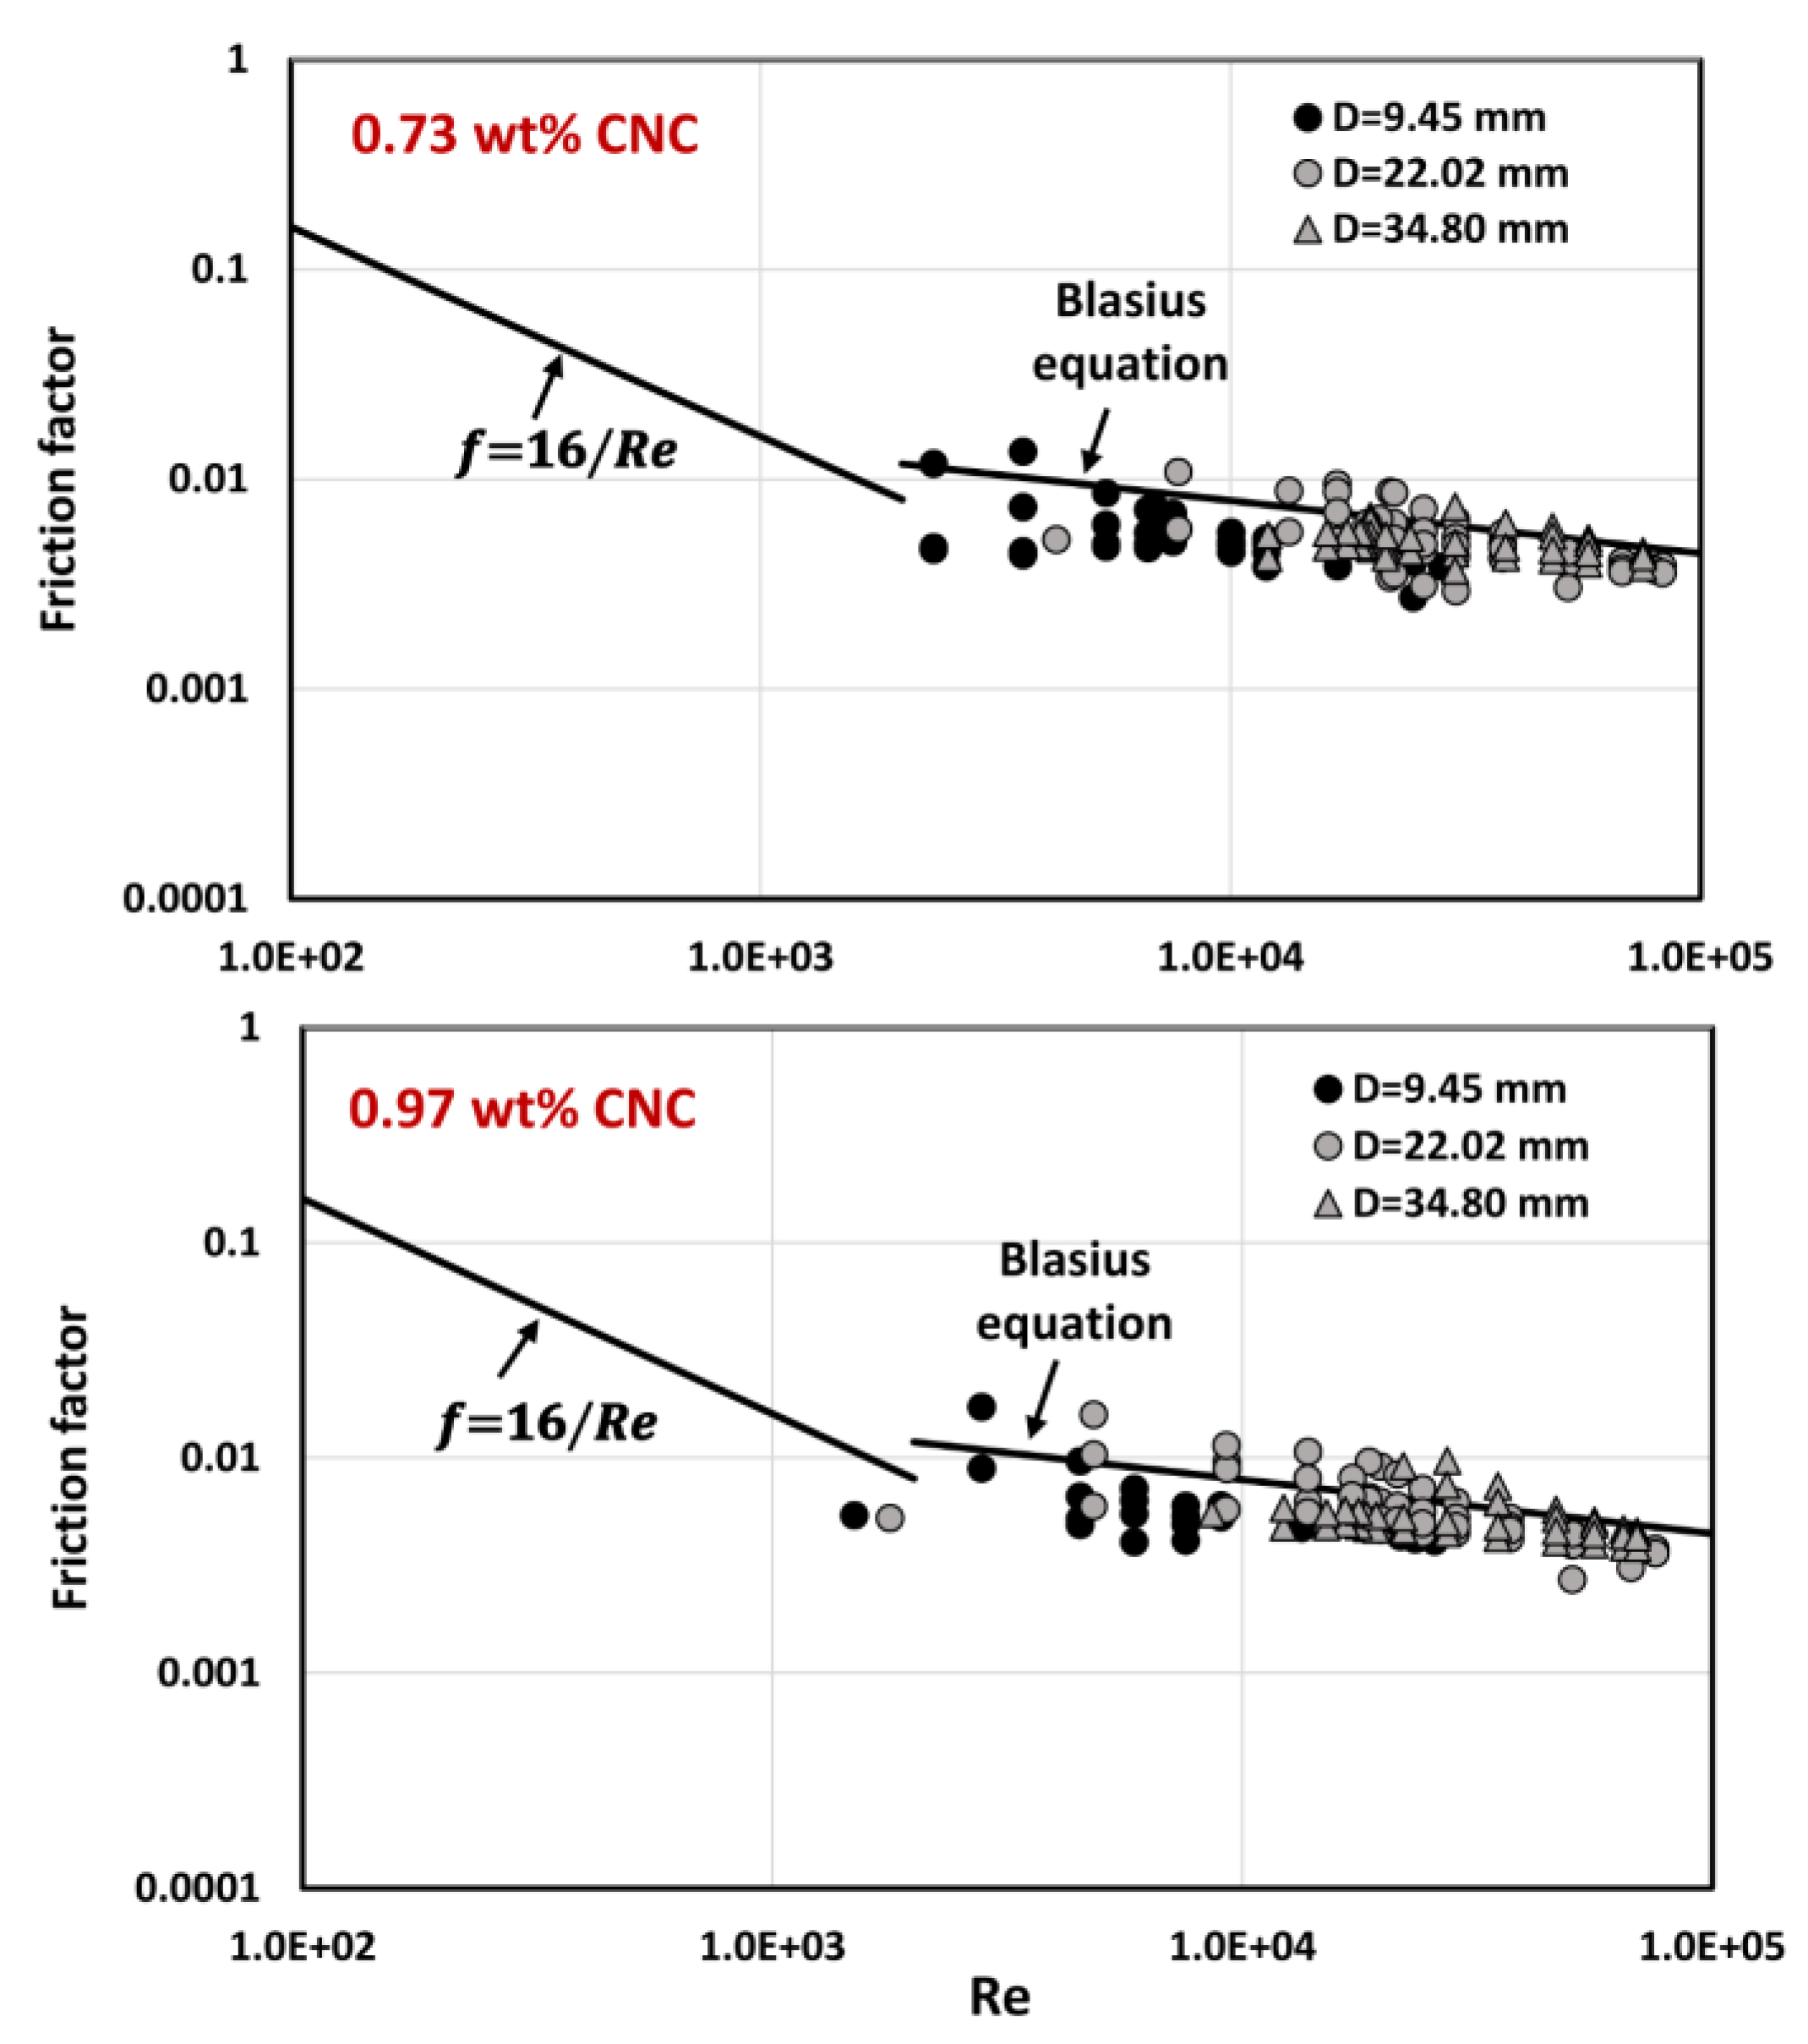
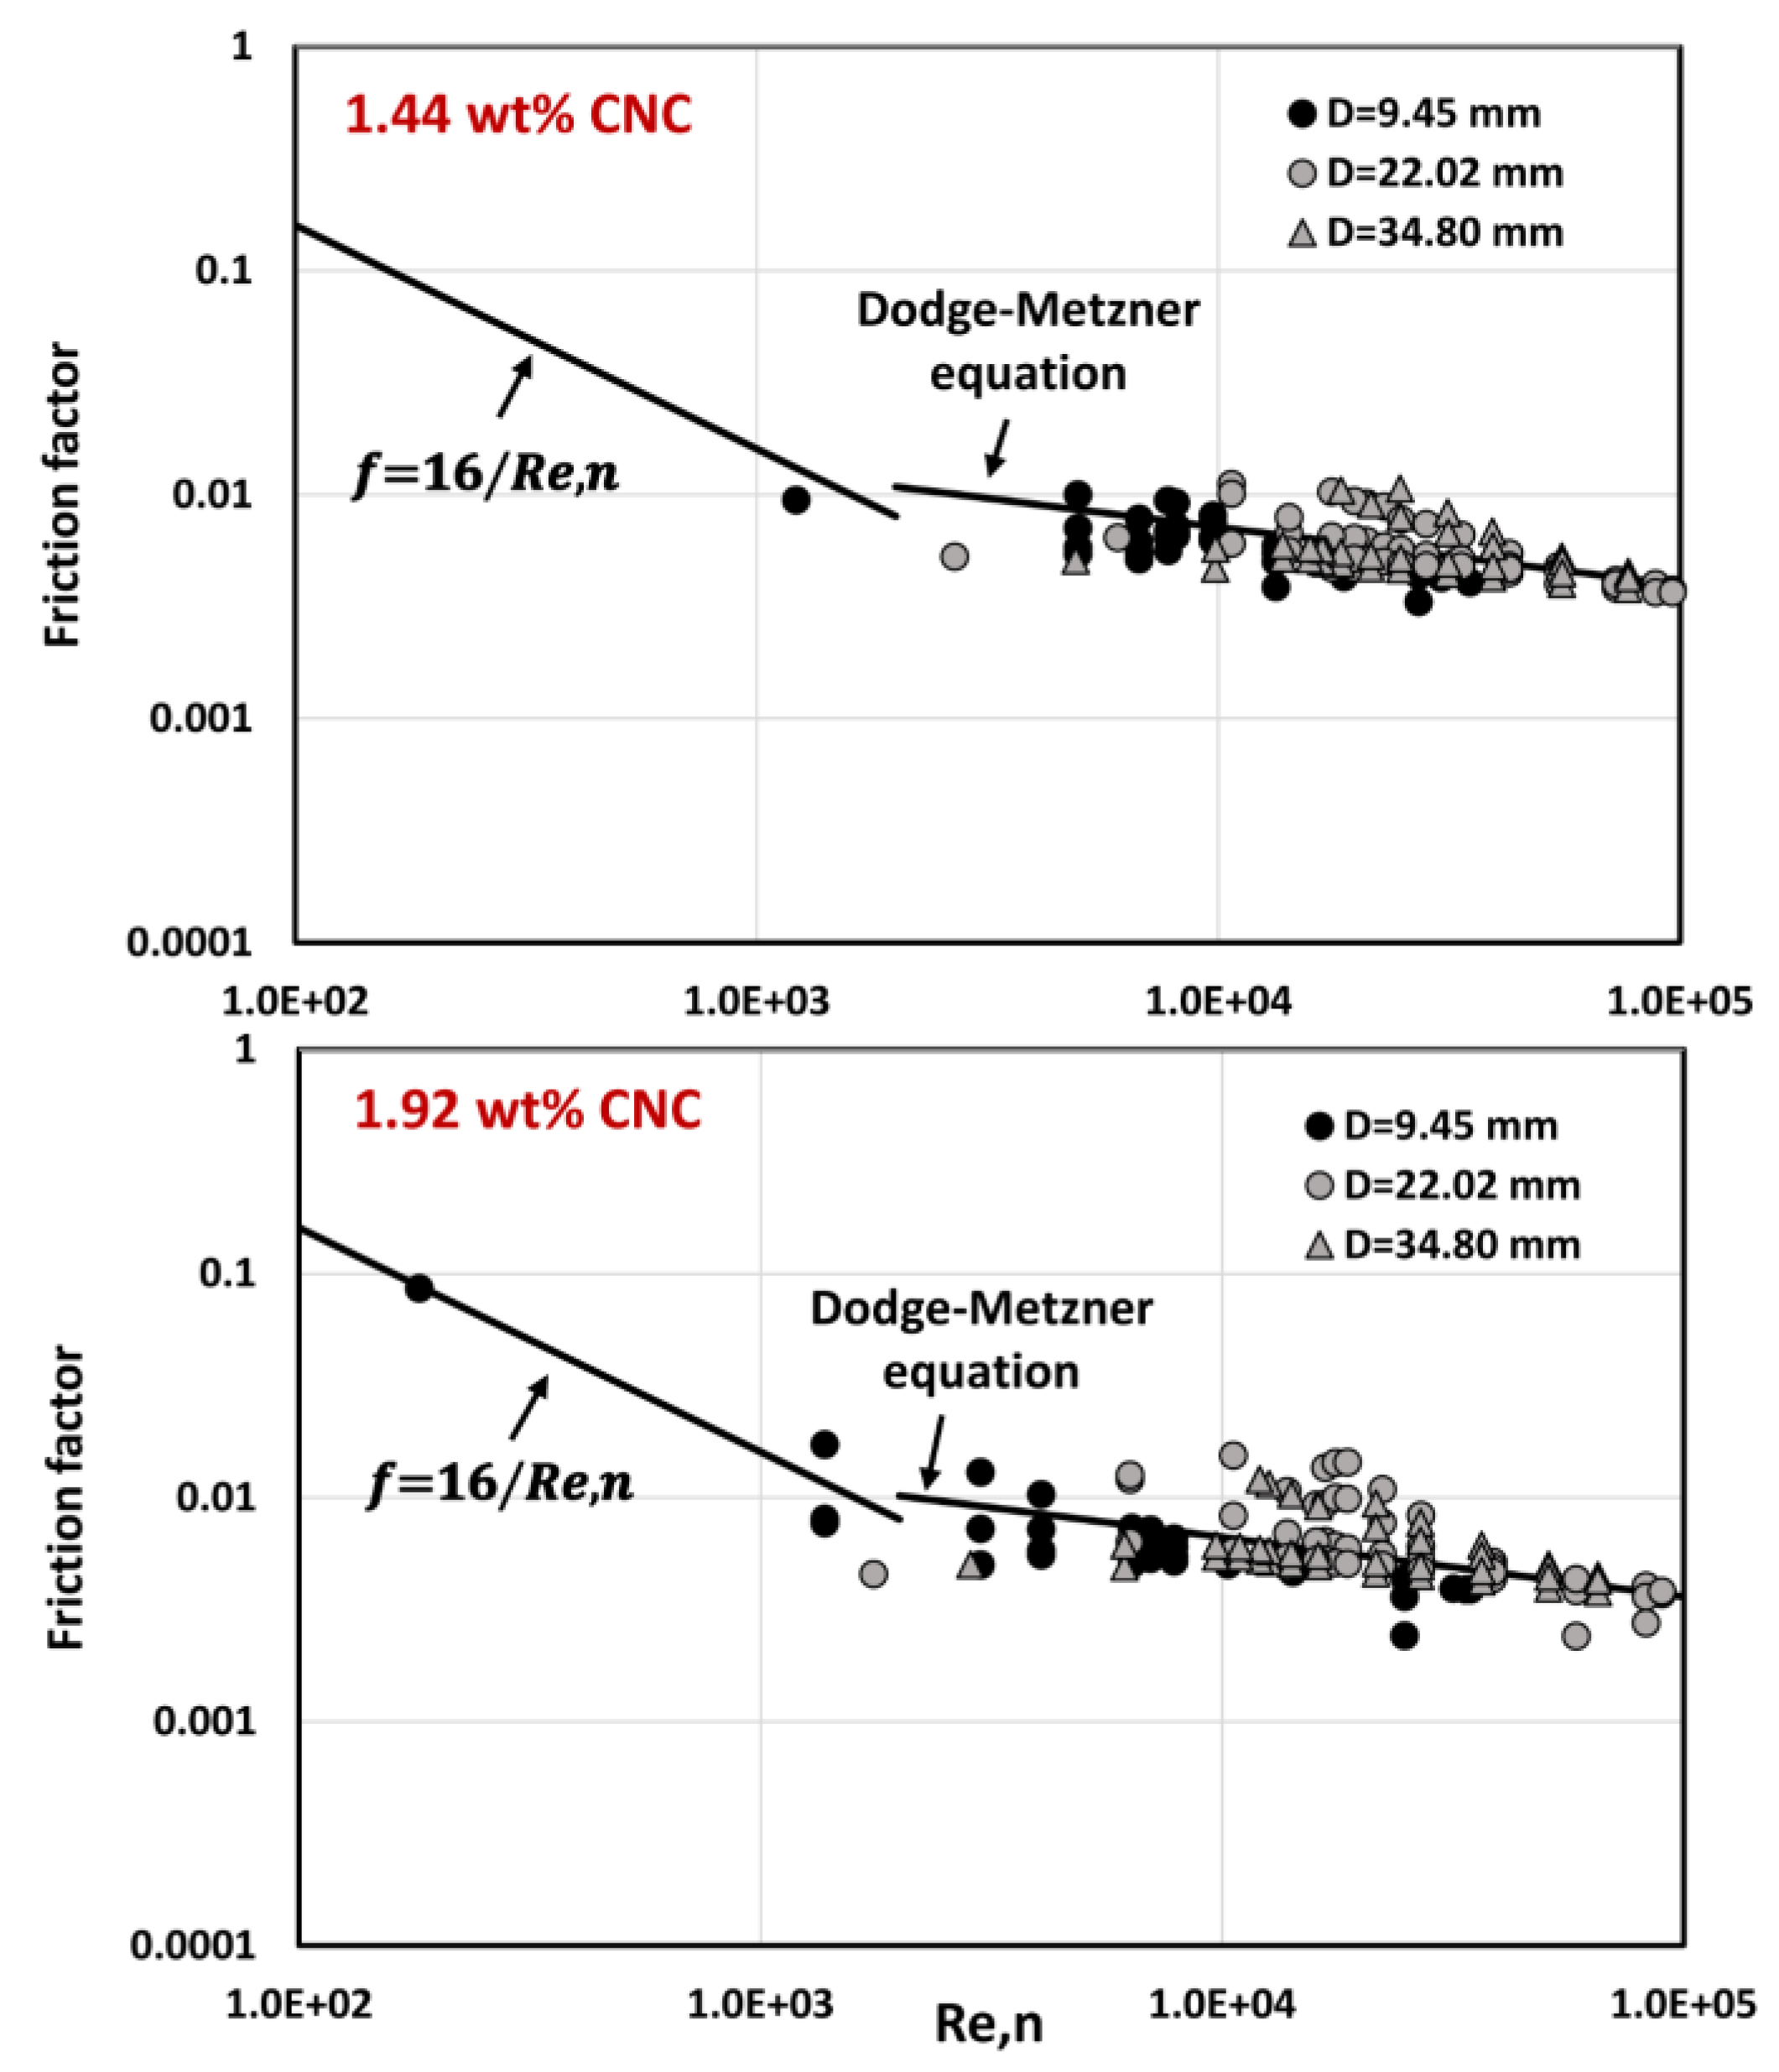
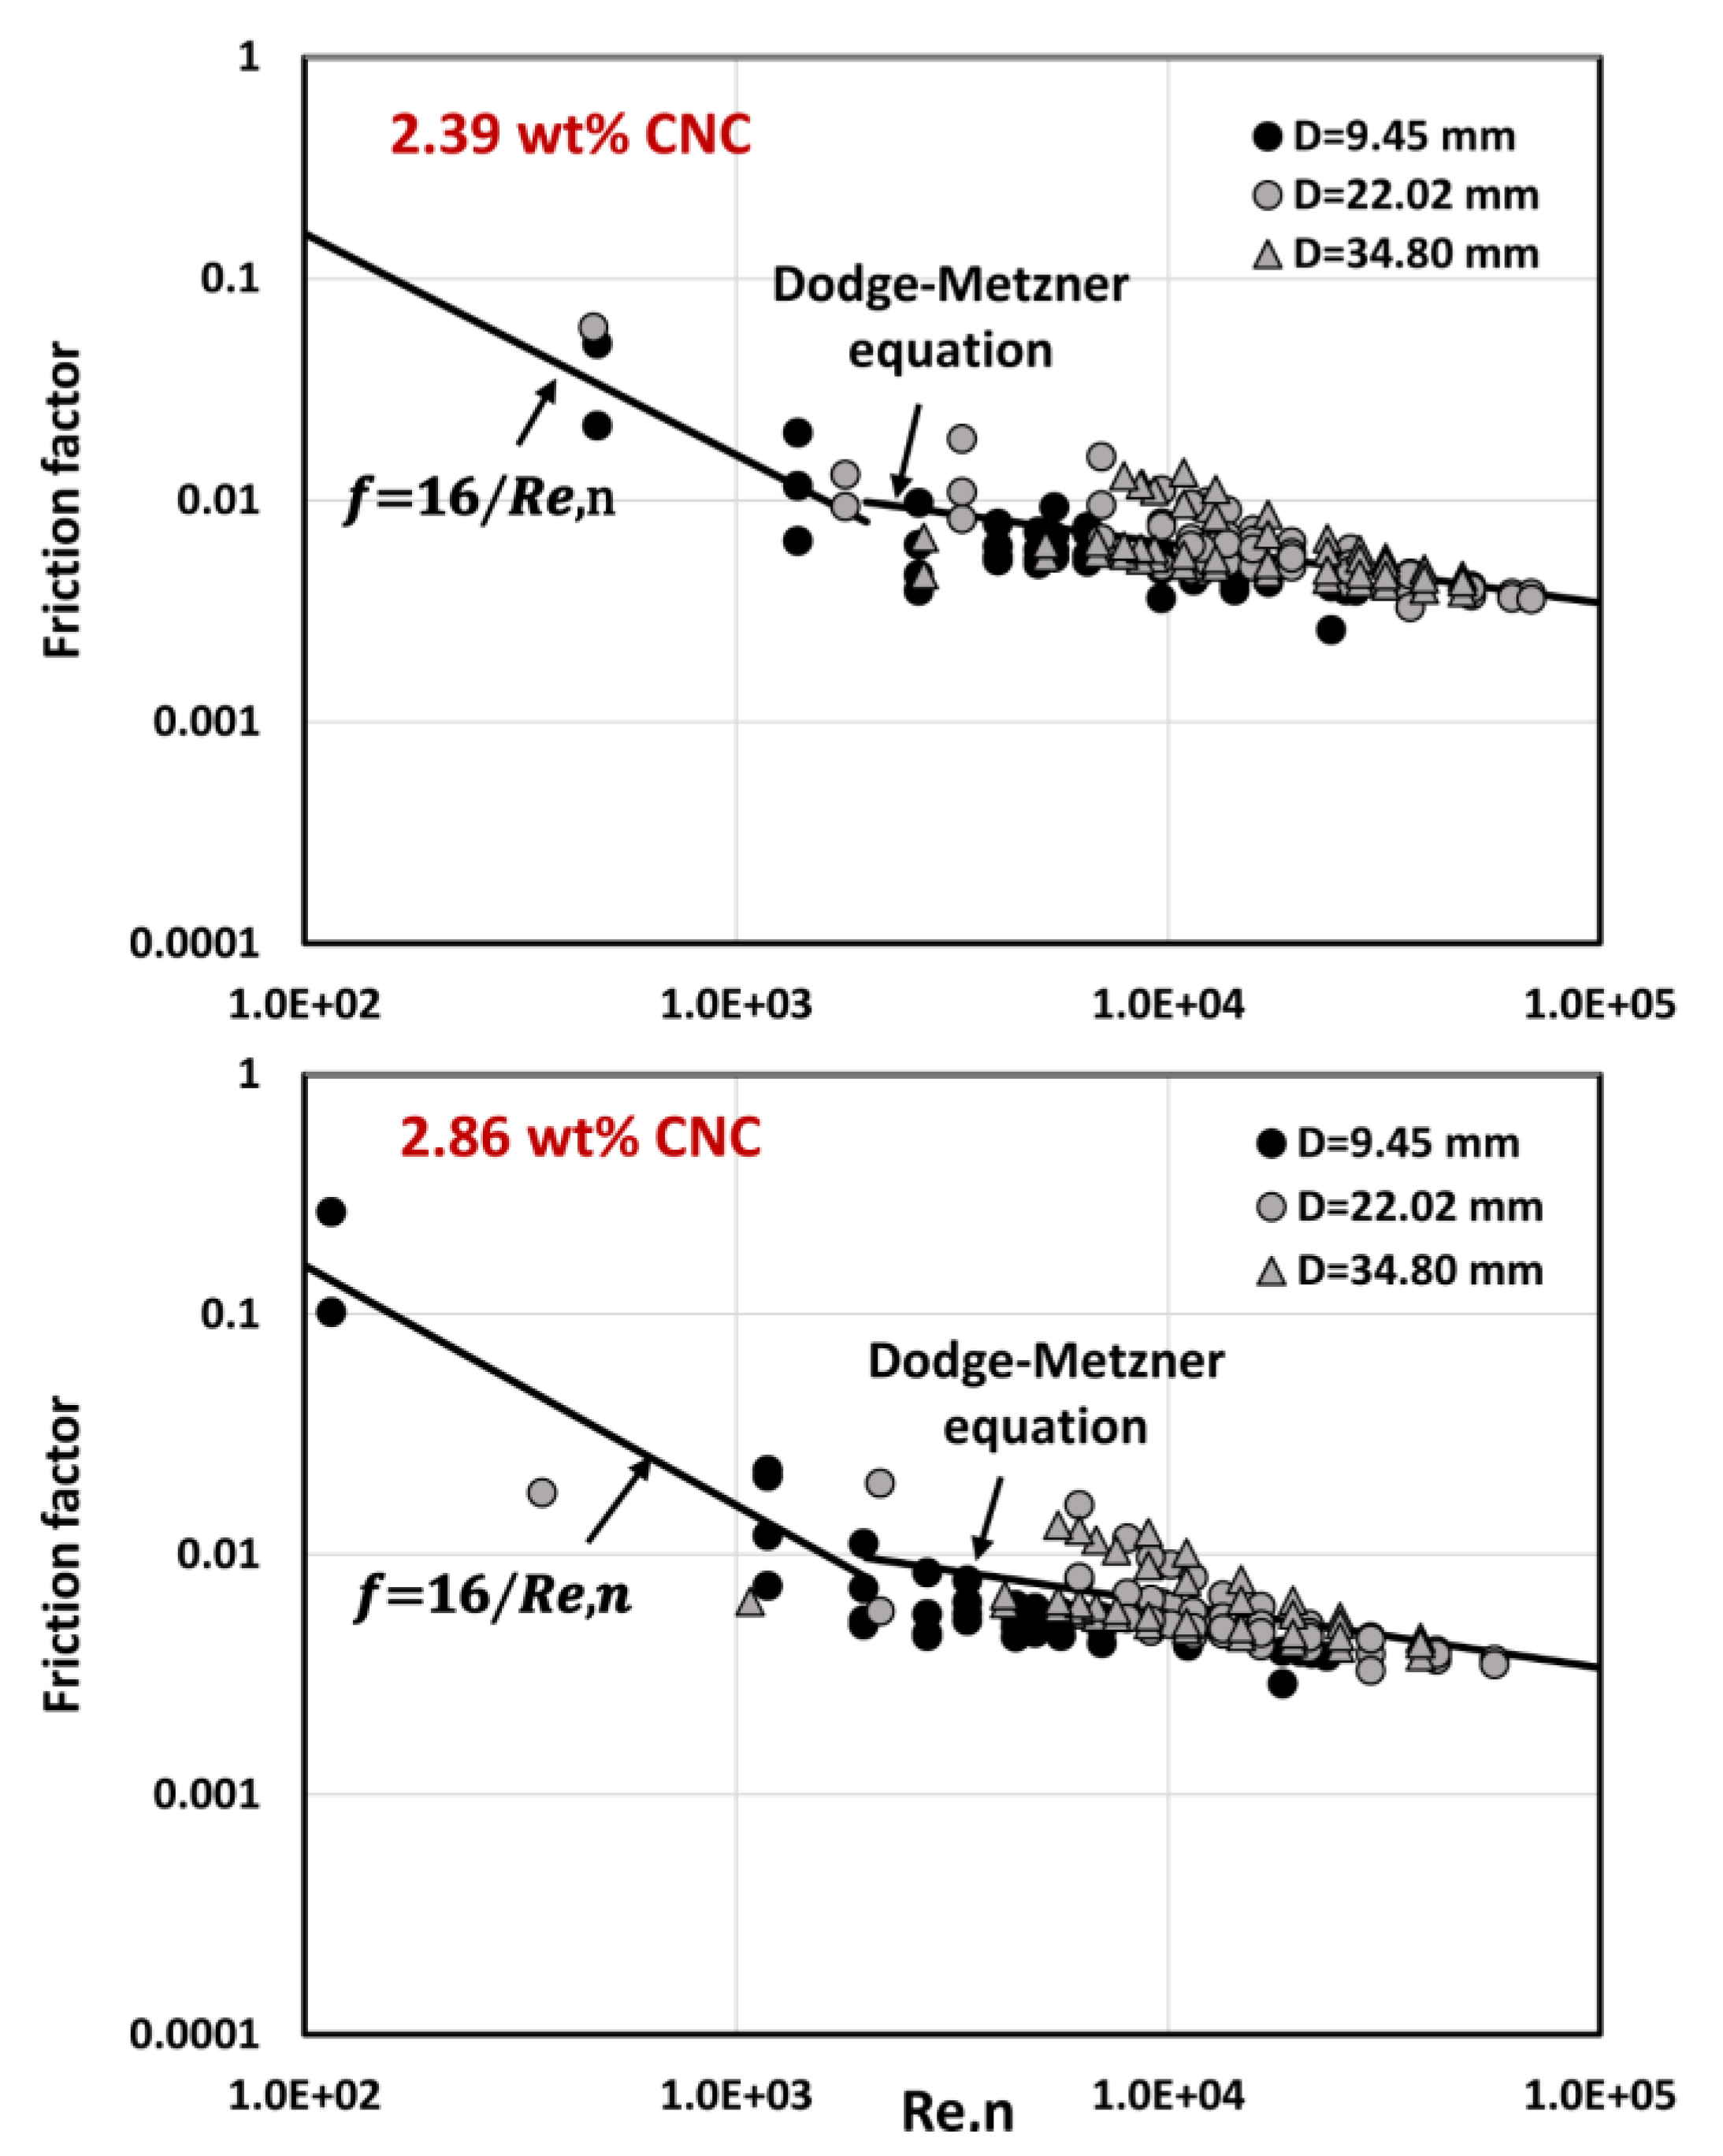
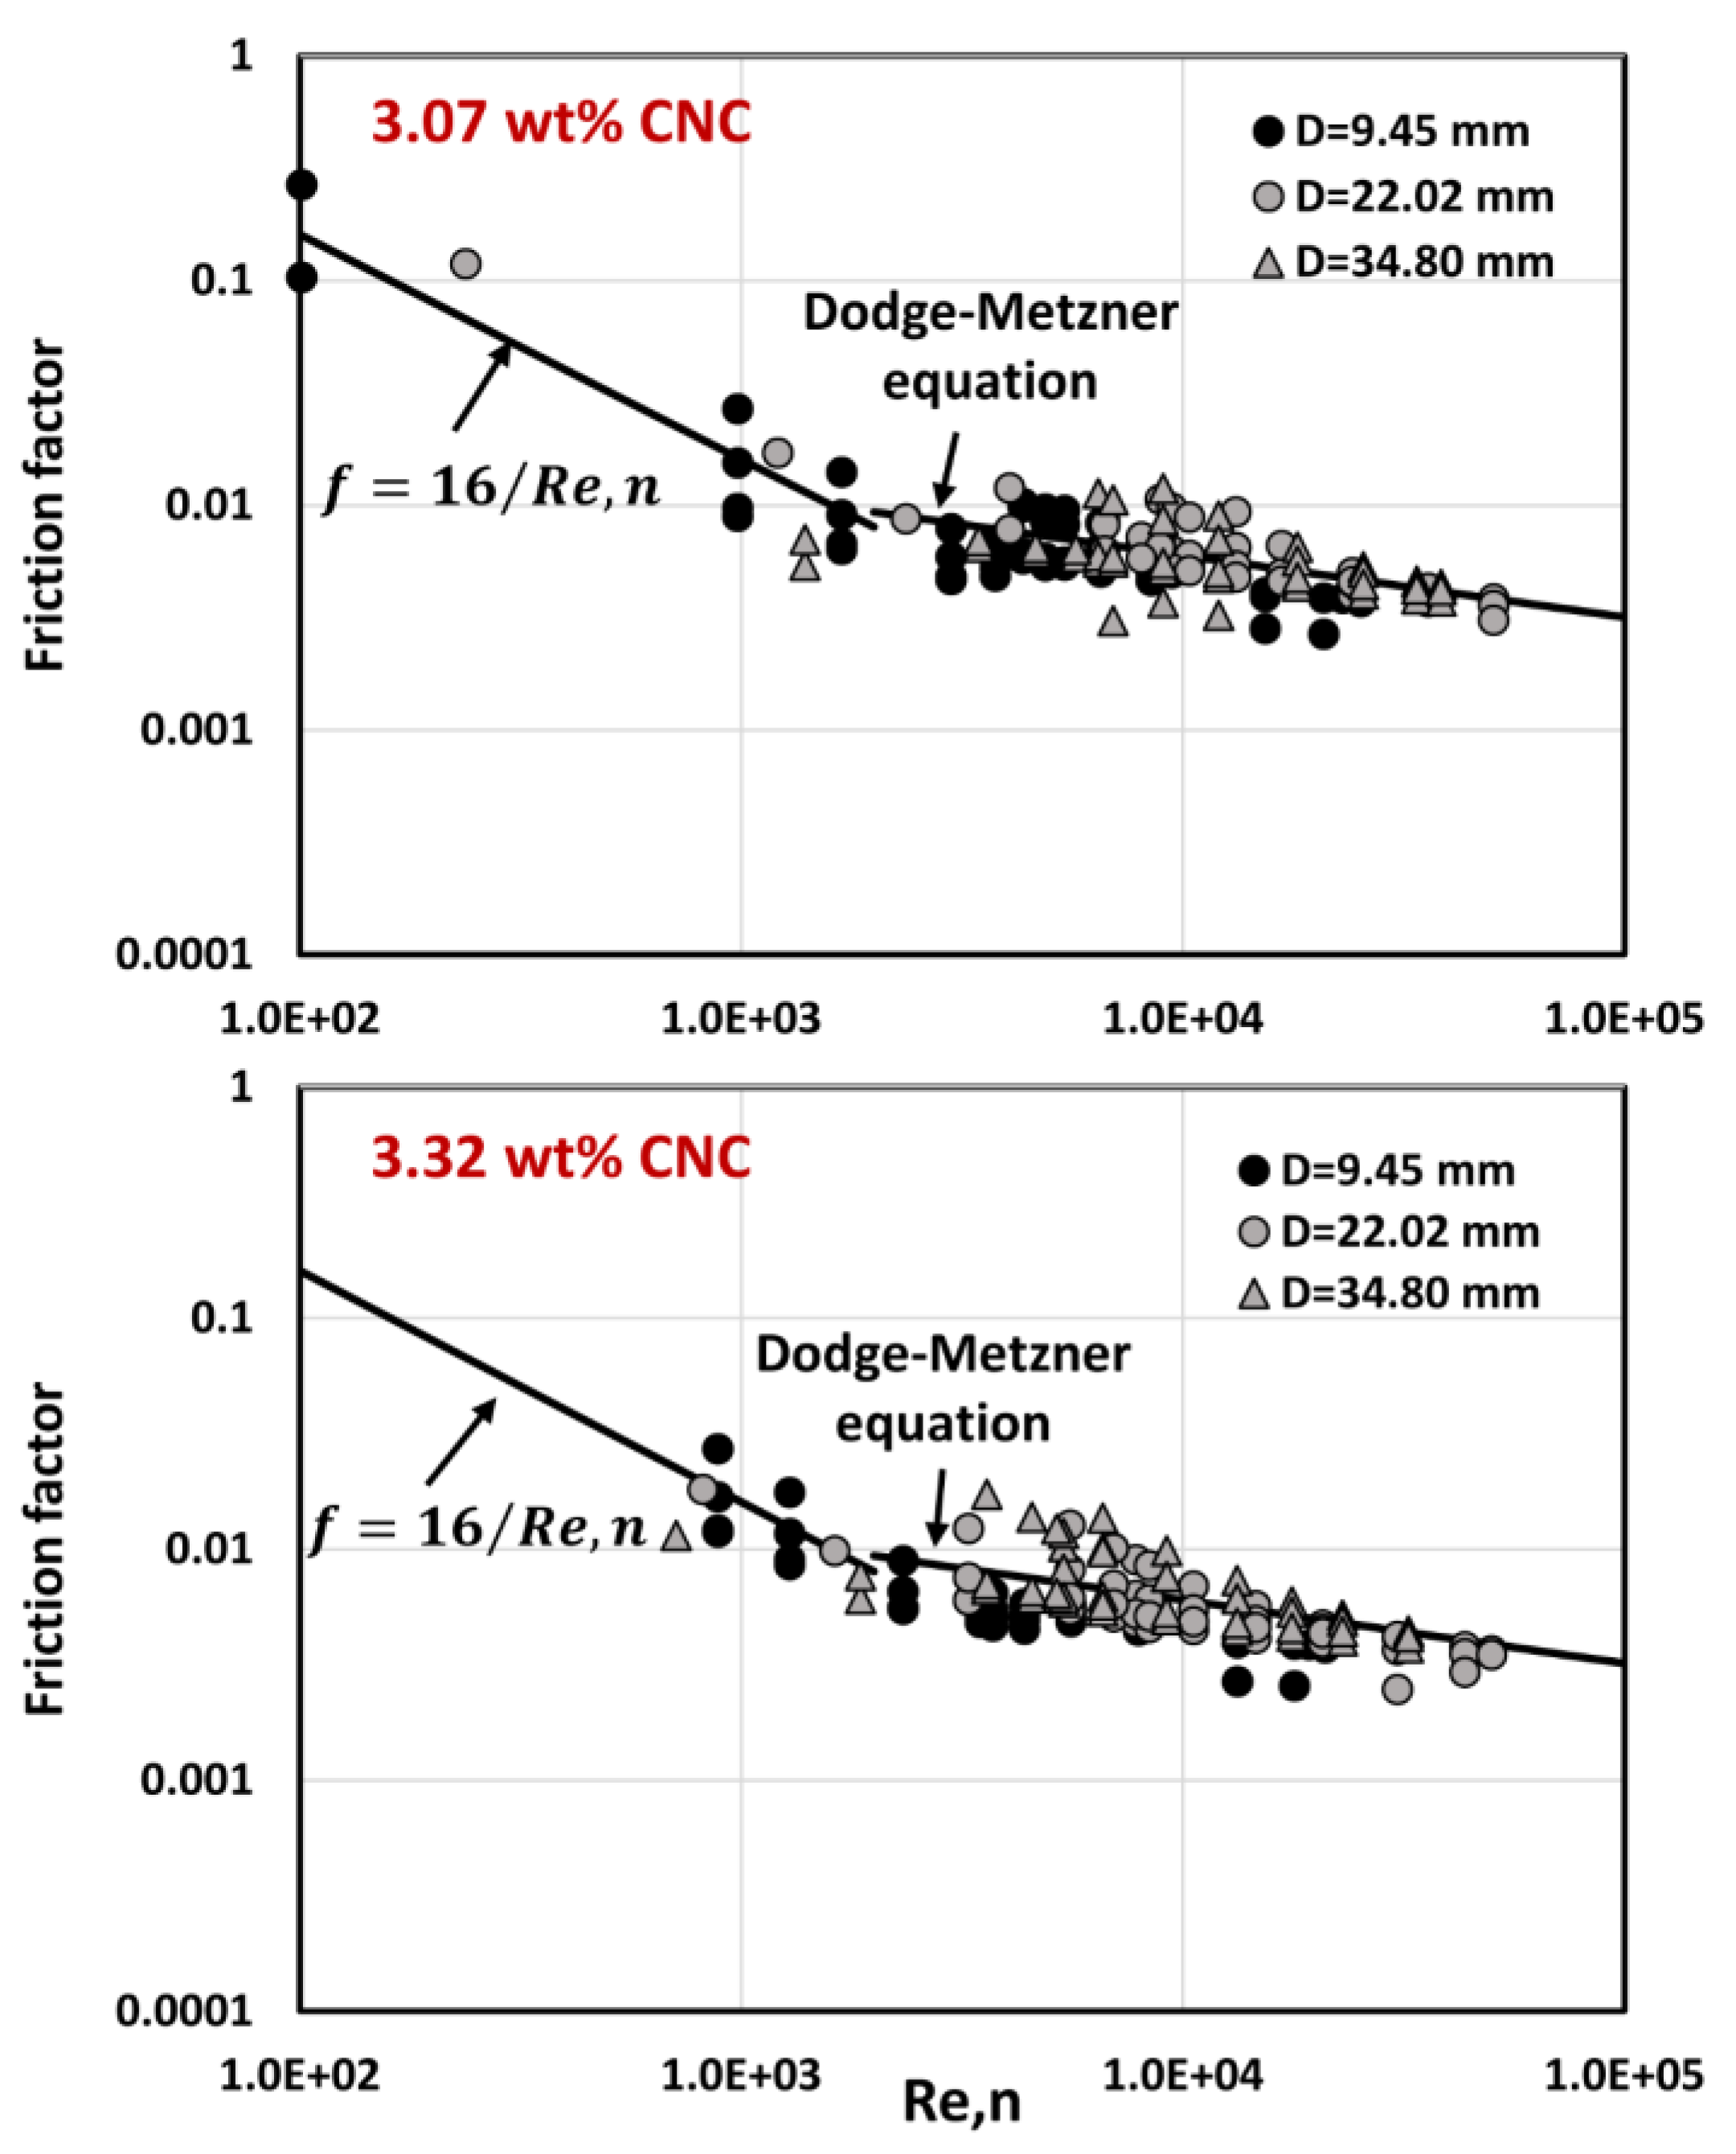
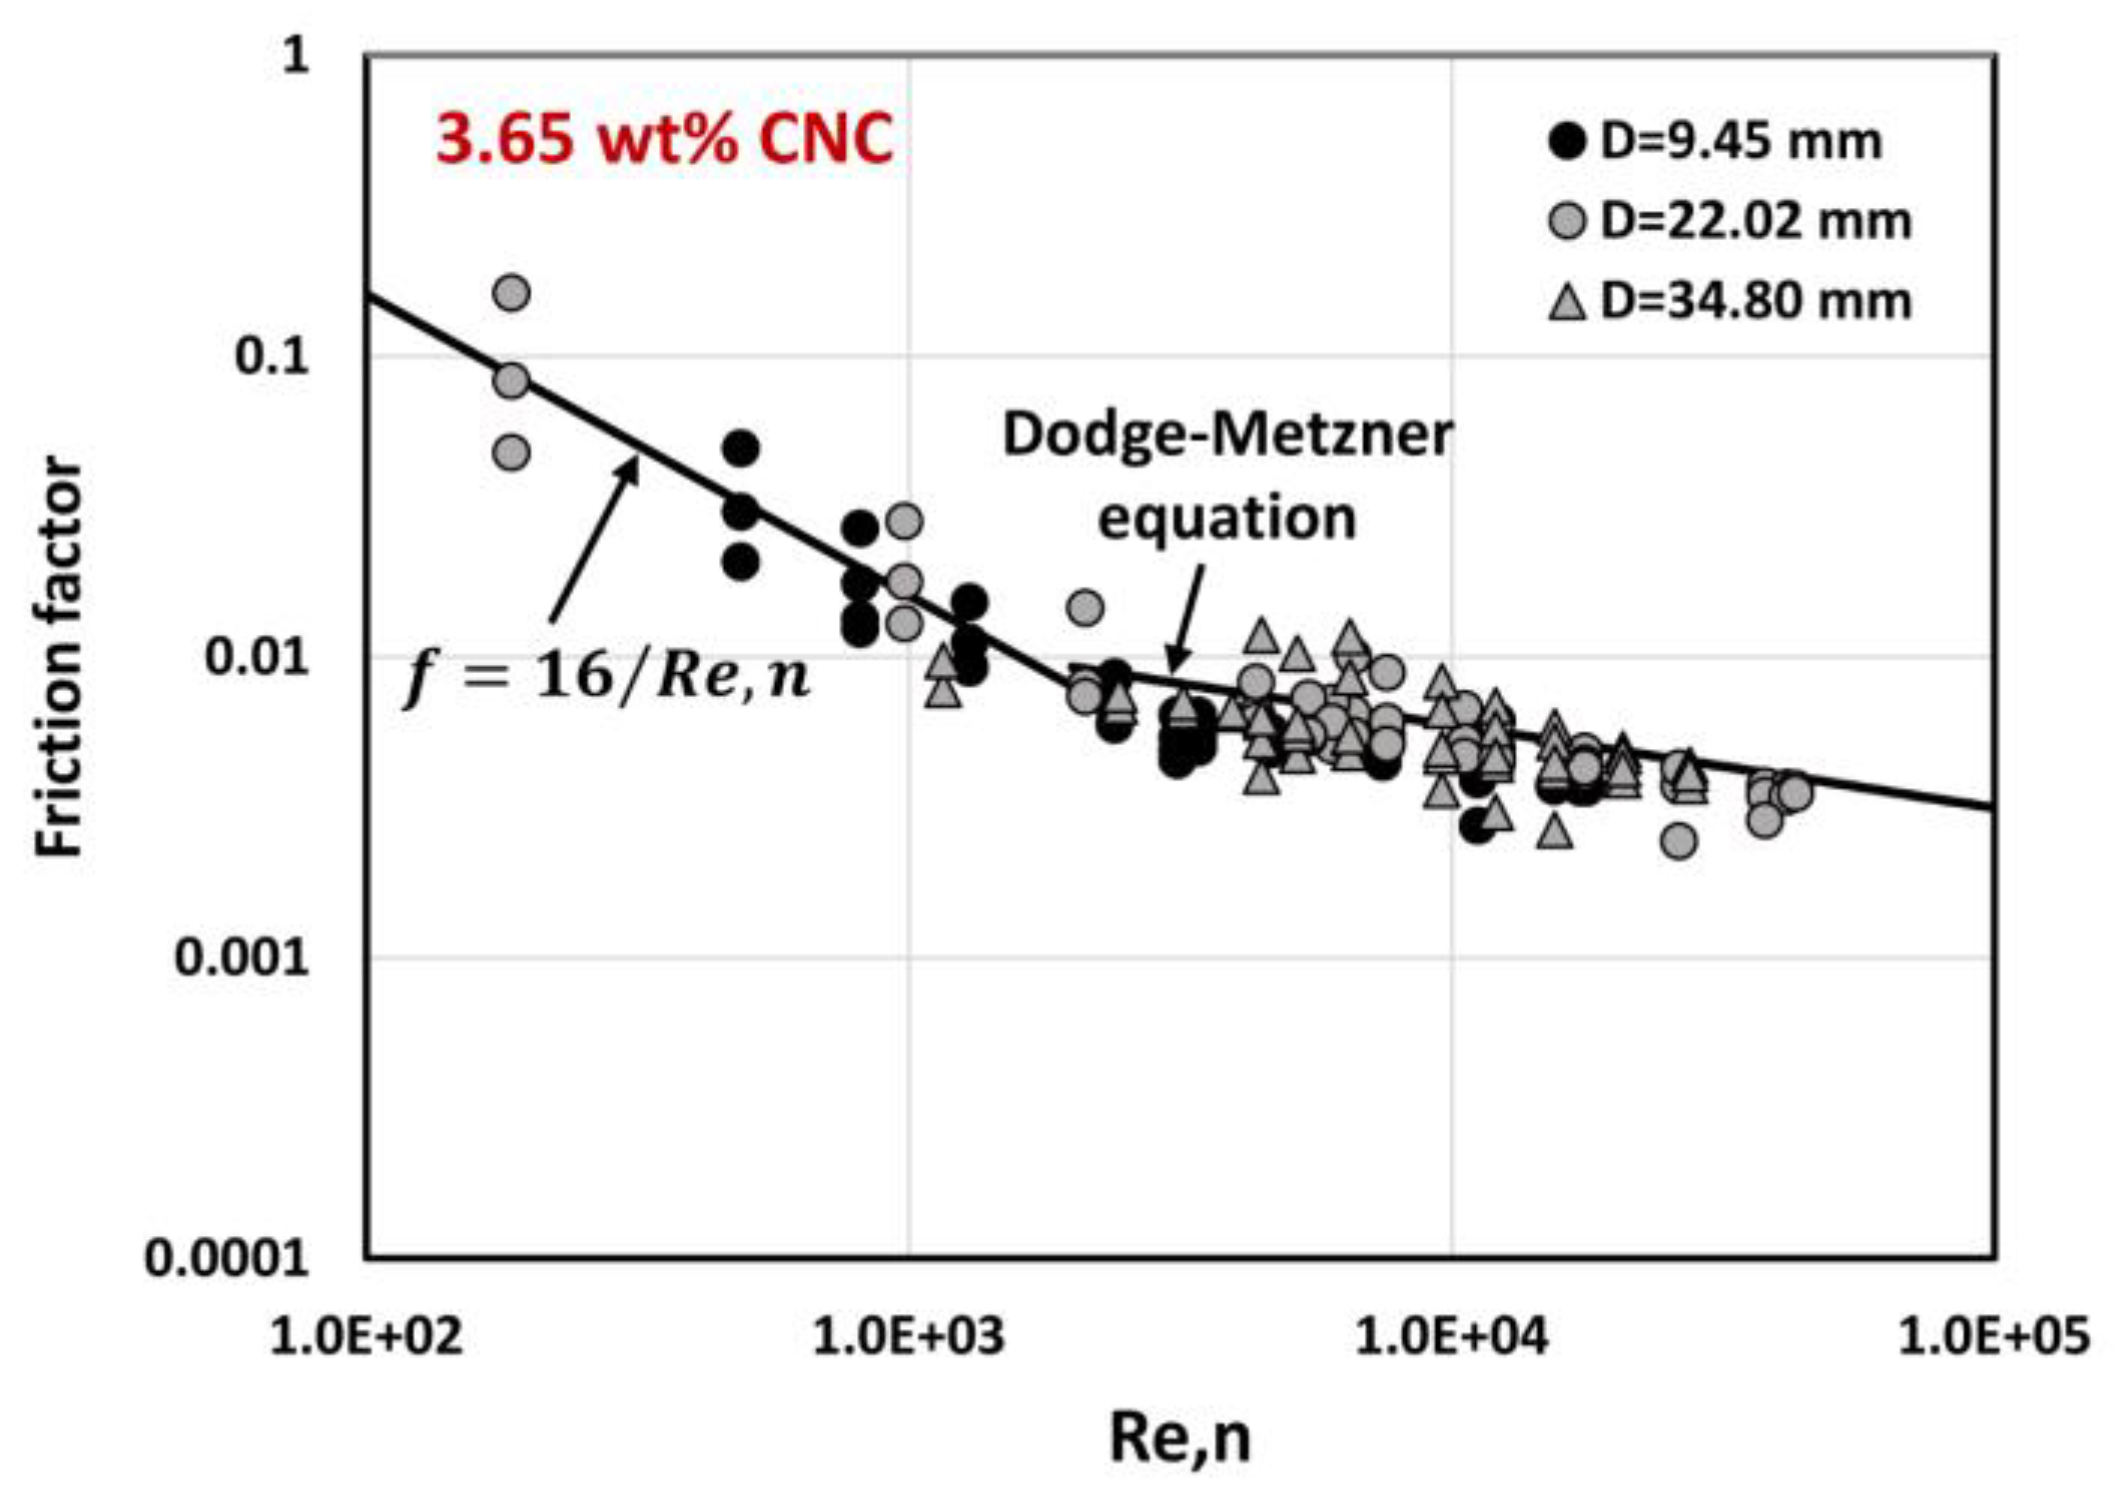
The pipeline experimental data for CNC suspensions obtained from different diameter pipes at different CNC concentrations are plotted in the form of friction factor vs. Reynolds number in Figure 11, Figure 12, Figure 13, Figure 14, Figure 15 and Figure 16. For the Newtonian CNC suspensions (CNC concentration < 1 wt%), the conventional Reynolds number (Equation (3)) is used, and for the non-Newtonian CNC suspensions, the generalized Reynolds number (Equation (4)) is used. The experimental friction factor data obtained for Newtonian CNC suspensions from different diameter pipes (Figure 11 and Figure 12) cover mainly the turbulent regime, and the data follow the Blasius equation (Equation (8)) closely. For non-Newtonian power-law CNC suspensions (CNC concentration > 1 wt%), the experimental data obtained from different diameter pipes (Figure 13, Figure 14, Figure 15 and Figure 16) cover both laminar and turbulent regimes, and the data show satisfactory agreement with the corresponding equations for non-Newtonian power-law fluids (Equation (9) for laminar flow and the Dodge–Metzner equation Equation (11) for turbulent flow). Thus, it can be concluded that the CNC suspensions investigated in this study over the CNC concentration range of 0.24–3.65 wt% follow the usual pipeline flow equations for homogeneous Newtonian and non-Newtonian flows with averaged properties. Most of the experimental data points fall within ± 30 % of the values predicted by the equations.

5. Conclusions

The laminar and turbulent flow behaviors of suspensions of cellulose nanocrystals (CNCs) were studied in three different diameter pipes. The CNC concentration varied from 0.24 to 3.65 wt%. At low concentrations of CNC (less than 1 wt%), the suspensions were Newtonian in nature. The CNC suspensions behaved as non-Newtonian pseudoplastic fluids at CNC concentrations above 1 wt%. The power-law model was able to describe the rheology of non-Newtonian CNC suspensions adequately. The pipeline data were analyzed in terms of friction factor vs. Reynolds number. For the non-Newtonian suspensions, the generalized Reynolds number was used. The experimental friction factor vs. Reynolds number data obtained for CNC suspensions were described reasonably well using the pipeline flow equations for homogeneous Newtonian and non-Newtonian flows with averaged properties.

Author Contributions

Conceptualization, R.P.; methodology, S.K. and R.P.; software, S.K.; validation, S.K. and R.P.; formal analysis, R.P.; investigation, S.K. and R.P.; resources, R.P.; data curation, S.K.; writing—original draft preparation, R.P.; writing—review and editing, R.P.; visualization, R.P.; supervision, R.P.; project administration, R.P.; funding acquisition, R.P. All authors have read and agreed to the published version of the manuscript.

Funding

This research was funded by the Discovery Grant awarded to R.P. by the Natural Sciences and Engineering Research Council of Canada.

Data Availability Statement

The data presented in this study are available on request from the corresponding author.

Conflicts of Interest

The authors declare no conflict of interest.

References

  1. Girard, M.; Vidal, D.; Bertrand, F.; Tavares, J.R.; Heuzey, M. Evidence-based guidelines for the ultrasonic dispersion of cellulose nanocrystals. Ultrason. Sonochem. 2021, 71, 105378. [Google Scholar] [CrossRef]
  2. Shojaeiarani, J.; Bajwa, D.S.; Chanda, S. Cellulose nanocrystal-based composites: A review. Compos. Part C Open Access 2021, 5, 100164. [Google Scholar] [CrossRef]
  3. Prathapan, R.; Thapa, R.; Garnier, G.; Tabor, R.F. Modulating the zeta potential of cellulose nanocrystals using salts and surfactants. Colloids Surf. A Physicochem. Eng. Asp. 2016, 509, 11–18. [Google Scholar] [CrossRef]
  4. Lu, P.; Hsieh, Y. Preparation and properties of cellulose nanocrystals: Rods, spheres, and network. Carbohydr. Polym. 2010, 82, 329–336. [Google Scholar] [CrossRef]
  5. Yang, X.; Biswas, S.K.; Han, J.; Tanpichai, S.; Li, M.; Chen, C.; Zhu, S.; Das, A.K.; Yano, H. Surface and interface engineering for nanocellulosic advanced materials. Adv. Mater. 2021, 33, 2002264. [Google Scholar] [CrossRef] [PubMed]
  6. Aziz, T.; Ullah, A.; Fan, H.; Ullah, R.; Haq, F.; Khan, F.U.; Iqbal, M.; Wei, J. Cellulose nanocrystals applications in health, medicine, and catalysis. J. Polym. Environ. 2021, 29, 2062–2071. [Google Scholar] [CrossRef]
  7. Dufresne, A. Nanocellulose processing properties and potential applications. Curr. For. Rep. 2019, 5, 76–89. [Google Scholar] [CrossRef]
  8. Trache, D.; Hussin, M.H.; Haafiz, M.K.M.; Thakur, V.K. Recent progress in cellulose nanocrystals: Sources and production. Nanoscale 2017, 9, 1763–1786. [Google Scholar] [CrossRef]
  9. Aziz, T.; Fan, H.; Zhang, X.; Haq, A.; Ullah, R.; Khan, F.U.; Iqbal, M. Advance study of cellulose nanocrystals properties and applications. J. Polym. Environ. 2020, 28, 1117–1128. [Google Scholar] [CrossRef]
  10. Vanderfleet, O.M.; Cranston, E.D. Production routes to tailor the performance of cellulose nanocrystals. Nat. Rev. Mater. 2021, 6, 124–144. [Google Scholar] [CrossRef]
  11. Zhang, H.; Dou, C.; Pal, L.; Hubbe, M.A. Review of electrically conductive composites and films containing cellulosic fibers or nanocellulose. BioResources 2019, 14, 7494–7542. [Google Scholar] [CrossRef]
  12. Panchal, P.; Ogunsona, E.; Mekonnen, T. Trends in advanced functional material applications of nanocellulose. Processes 2019, 10, 1–27. [Google Scholar] [CrossRef]
  13. Gupta, A.; Mekonnen, T.H. Cellulose nanocrystals enabled sustainable polycaprolactone based shape memory polyurethane bionanocomposites. J. Colloid Interface Sci. 2022, 611, 726–738. [Google Scholar] [CrossRef] [PubMed]
  14. Cellulose Nanocrystals (CNC). Available online: https://celluforce.com/cellulose-nanocrystals-cnc/ (accessed on 26 February 2023).
  15. Lu, Y.; Yue, Y.; Ding, Q.; Mei, C.; Xu, X.; Wu, Q.; Xiao, H.; Han, J. Self-recovery, fatigue-resistant, and multifunctional sensor assembled by a nanocellulose/carbon nanotube nanocomplex-mediated hydrogel. Appl. Mater. Interfaces 2021, 13, 50281–50297. [Google Scholar] [CrossRef] [PubMed]
  16. Zhu, S.; Sun, H.; Lu, Y.; Wang, S.; Yue, Y.; Xu, X.; Mei, C.; Xiao, H.; Fu, Q.; Han, J. Inherently conductive poly(dimethylsiloxane) elastomers synergistically mediated by nanocellulose/carbon nanotube nanohybrids toward highly sensitive, stretchable, and durable strain sensors. Appl. Mater. Interfaces 2021, 13, 59142–59153. [Google Scholar] [CrossRef] [PubMed]
  17. Zhou, J.; Yu, H.; Xu, X.; Han, F.; Lubineau, G. Ultrasensitive, stretchable strain sensors based on fragmented carbon nanotube papers. Appl. Mater. Interfaces 2017, 9, 4835–4842. [Google Scholar] [CrossRef] [PubMed]
  18. Zhu, S.; Lu, Y.; Wang, S.; Sun, H.; Yue, Y.; Xu, X.; Mei, C.; Xiao, H.; Fu, Q.; Han, J. Interface design of stretchable and environment-tolerant strain tensors with hierarchical nanocellulose-supported graphene nanocomplexes. Compos. Part A 2023, 164, 107313. [Google Scholar] [CrossRef]
  19. Sun, H.; Lu, Y.; Chen, Y.; Yue, Y.; Jiang, S.; Xu, X.; Mei, C.; Xiao, H.; Han, J. Flexible environment-tolerant electroluminescent devices based on nanocellulose-mediated transparent electrodes. Carbohydr. Polym. 2022, 296, 119891. [Google Scholar] [CrossRef] [PubMed]
  20. Niu, Z.; Cheng, W.; Cao, M.; Wang, D.; Wang, Q.; Han, J.; Long, Y.; Han, G. Recent advances in cellulose-based flexible triboelectric nanogenerators. Nano Energy 2021, 87, 106175. [Google Scholar] [CrossRef]
  21. Wang, J.; Euring, M.; Ostendorf, K.; Zhang, K. Biobased materials for food packaging. J. Bioresour. Bioprod. 2022, 7, 1–13. [Google Scholar] [CrossRef]
  22. Dodge, D.W.; Metzner, A.B. Turbulent flow of non-Newtonian systems. AIChE J. 1959, 5, 189–204. [Google Scholar] [CrossRef]
  23. Pal, R. Entropy generation in flow of highly concentrated non-Newtonian emulsions in smooth tubes. Entropy 2014, 16, 5178–5197. [Google Scholar] [CrossRef]
  24. Kinra, S.; Pal, R. Rheology of Pickering emulsions stabilized and thickened by cellulose nanocrystals over broad ranges of oil and nanocrystal concentrations. Colloids Interfaces 2023, 7, 36. [Google Scholar] [CrossRef]
  25. Niskanen, I.; Suopajarvi, T.; Liimatainen, H.; Fabritius, T.; Heikkila, R.; Thungstrom, G. Determining the complex refractive index of cellulose nanocrystals by combination of Beer-Lambert and immersion matching methods. J. Quant. Spectrosc. Radiat. Transf. 2019, 235, 1–6. [Google Scholar] [CrossRef]
Figure 1. Atomic force microscopy (AFM) image of cellulose nanocrystals [14,24].
Fluids 08 00275 g001
Figure 2. Schematic diagram of the experimental flow loop.
Fluids 08 00275 g002
Figure 3. Images of different portions of the experimental flow loop: (a) mixing tank; (b) pressure drop measuring panel; (c) three different diameter pipeline test sections; (d) computer terminal of data acquisition system.
Fluids 08 00275 g003
Figure 4. Preparation of CNC stock solution using benchtop homogenizer.
Fluids 08 00275 g004
Figure 5. CNC suspension in the flow loop mixing tank.
Fluids 08 00275 g005
Figure 6. Friction factor vs. Reynolds number data for deionized water.
Fluids 08 00275 g006
Figure 7. Size distributions of CNC suspensions at different CNC concentrations.
Fluids 08 00275 g007
Figure 8. Average hydrodynamic diameter of CNC suspensions as a function of CNC concentration.
Fluids 08 00275 g008
Figure 9. Viscosity vs. shear-rate plots of CNC suspensions at different CNC concentrations.
Fluids 08 00275 g009
Figure 10. Variation of power-law constants ( K and n ) as a function of CNC concentration.
Fluids 08 00275 g010
Figure 11. Friction factor vs. Reynolds number data for CNC suspensions at 0.24 and 0.48 wt% concentrations.
Fluids 08 00275 g011
Figure 12. Friction factor vs. Reynolds number data for CNC suspensions at 0.73 and 0.97 wt% concentrations.
Fluids 08 00275 g012
Figure 13. Friction factor vs. Reynolds number data for CNC suspensions at 1.44 and 1.92 wt% concentrations.
Fluids 08 00275 g013
Figure 14. Friction factor vs. Reynolds number data for CNC suspensions at 2.39 and 2.86 wt% concentrations.
Fluids 08 00275 g014
Figure 15. Friction factor vs. Reynolds number data for CNC suspensions at 3.07 and 3.32 wt% concentrations.
Fluids 08 00275 g015
Figure 16. Friction factor vs. Reynolds number data for CNC suspension at 3.65 wt% concentration.
Fluids 08 00275 g016
Table 1. Dimensions of the pipeline test sections.
Nominal Diameter (inch)Inside Diameter (mm)Test Section Lengths (m)
0.59.451.22, 3.667
1.022.020.92, 3.048
1.534.801.52, 3.048
Table 2. Relevant dimensions of the viscometers.
Device Inner   Cylinder   Radius ,   R i Outer   Cylinder   Radius ,   R o Length of Inner CylinderGap-Width
Fann 35A/SR-12 viscometer1.72 cm1.84 cm3.8 cm0.12 cm
Haake Roto-visco RV 12 with MV I2.00 cm2.1 cm6.0 cm0.10 cm
Disclaimer/Publisher’s Note: The statements, opinions and data contained in all publications are solely those of the individual author(s) and contributor(s) and not of MDPI and/or the editor(s). MDPI and/or the editor(s) disclaim responsibility for any injury to people or property resulting from any ideas, methods, instructions or products referred to in the content.