Abstract
For a few decades, machine learning has been extensively utilized for turbulence research. The goal of this work is to investigate the reconstruction of turbulence from minimal or lower-resolution datasets as inputs using reduced-order models. This work seeks to effectively reconstruct high-resolution 3D turbulent flow fields using unsupervised physics-informed deep learning. The first objective of this study is to reconstruct turbulent channel flow fields and verify these with respect to the statistics. The second objective is to compare the turbulent flow structures generated from a GAN with a DNS. The proposed deep learning algorithm effectively replicated the first- and second-order statistics of turbulent channel flows of 180 within a 2% and 5% error, respectively. Additionally, by incorporating physics-based corrections to the loss functions, the proposed algorithm was also able to reconstruct structures. The results suggest that the proposed algorithm can be useful for reconstructing a range of 3D turbulent flows given computational and experimental efforts.
1. Introduction
Channel flow simulations have been utilized extensively in fluid mechanics research since the pioneering work performed by Kim et al. [1], Jiménez and Moin [2], Moser et al. [3], and Kim and Adrian [4]. Since these pioneering works were published, numerous different studies have been proposed. Lee and Moser [5] generated turbulent channel flow databases for viscous Reynolds numbers () up to 5200. In addition to the pioneering work in statistics and database generation, there have been significant advancements in near-wall turbulence. Jeong and Hussain [6] and Jeong et al. [7] discussed the identification, eduction, and dynamical inference of near-wall turbulence for turbulent channel flows. Schoppa and Hussain [8,9] enhanced the dynamical inference of near-wall turbulence via an inviscid streak transient growth phenomenon in the near-wall and buffer layer regions of a turbulent channel. Additionally, other studies have discussed large-scale structures in the near-wall [10,11] and buffer layers [4,12,13].
Over the last couple of decades, machine learning (ML) has been utilized for myriad problems in academic research. Among these problems are artificial intelligence, uncertainty quantification and propagation, algorithm development, and speech recognition. There is also interest in applying ML algorithms to fluid mechanics problems. These algorithms provided the foundation to deep learning, which applies a neural network (NN) with multiple layers to create hierarchical representations of data as a means of replacing a physical model. This means of substituting a physical model with a mathematical model (i.e., a machine-learning-based algorithm) is also known as surrogate modeling. For more information, Brunton et al. [14] reviewed each of the different ML algorithms utilized in fluid mechanics research in more detail.
Recently, there has been increasing interest in utilizing ML for problems in fluid mechanics and turbulence research. These include synthetic inlet flow generation, super-resolution of turbulent flows, and physics-informed neural networks for turbulent flows.
Synthetic inlet flow generation, a problem reviewed extensively by Tabor and Baba-Ahmadi [15], is a methodology that reconstructs 2D snapshots of the expected turbulence at the boundary condition in which flow enters the system; this is accomplished to reduce the dependence on precursor simulations, which can be computationally expensive. This study reviewed the pioneering works on inlet flow generation in large eddy simulations (LES). Wu [16] also reviewed the different methods utilized for inlet flow generation. This paper focused on the inflow–outflow turbulence generation for direct numerical simulation (DNS) and LES simulations. Because these simulations rely on non-periodic streamwise boundary conditions, the training of these generation methods requires some back-propagation or recycling technique. These techniques take the flow downstream of the inlet, and feed information back to the inlet to appropriately train the inlet to become and remain turbulent. These methods have been applied to homogeneous isotropic turbulence (HIT), incompressible and supersonic boundary layers, flows over rough surfaces, and mesoscale weather forecasting. Fukami et al. [17] discussed utilizing ML to generate time-dependent turbulent inflow generation for low-Reynolds-number channel flows. The authors utilized a convolutional neural network (CNN) encoder and decoder coupled with a multi-layer perceptron (MLP) classifier model to accomplish a priori and a posteriori studies of turbulence inflow generation. The a priori study was accomplished to train the model with respect to the DNS output. By using only one DNS snapshot at the initial timestep, the model was able to effectively predict the DNS results at subsequent timesteps. The a posteriori study took the results from the a priori study and applied a recursive input to investigate whether or not the turbulence was maintained in the simulation. While low-Reynolds-number flows were effectively predicted with the ML-based generator, the proposed method requires a higher-order resolution to train the model. This indicates that the proposed CNN-MLP generator needs to be significantly improved to tackle turbulent boundary layer and channel flow simulations in the future. Maulik et al. [18] discussed inlet flow generation using ML based on Reynolds-averaged Navier–Stokes (RANS) equations. The proposed framework utilizes a neural network as a surrogate model to interpolate the closure models (Spalart–Allmaras (SA), , and ) for RANS simulations. By applying this surrogate model, the authors were able to converge results up to sevenfold faster than using RANS with a closure model directly. The authors concluded that surrogate models of the closure problem in RANS garner accurate results in less time. However, this method is limited by the presence of sub-grid quantities in the simulation, meaning this surrogate model is good enough for lower-Reynolds-number simulations and the type of closure problem for the turbulence model. Kim and Lee [19] discussed synthetic inlet flow generation for a turbulent channel flow using neural networks. The study applied an ML technique utilizing a recurring neural network (RNN) coupled with a generative adversarial network (GAN) algorithm to generate inflow conditions of . The model inputted temperature and velocity data to predict velocity, vorticity, and temperature. By applying this ML algorithm, the ML prediction accounts for the stochasticity of the DNS simulation. Additionally, the authors do not take into account that GANs and RNNs are semi-supervised and supervised models, meaning it was partially unsupervised. This shows that unsupervised models in turbulent flows still require supervision for optimization, regression, and classification purposes. These studies show that synthetic inflow generation is best served using multiple different types of NNs. However, because synthetic inflow generation depends on the type of simulation utilized, a CNN or GAN is recommended for DNS, but an ANN for LES and RANS simulations.
The super-resolution of turbulent flows involves using an ML algorithm as a surrogate model to recreate a high-resolution dataset to a similar quality as DNS from a low-resolution dataset. Fukami et al. [17] discussed the super-resolution of two-dimensional (2D) HIT. The authors utilized two different NNs to reconstruct the 2D HIT for laminar and turbulent flows over a cylinder as well as decaying isotropic turbulence. The study proposed a CNN and a hybrid downsampling connection and multi-scale (hDSC/MS) model to capture the physics of low-Reynolds-number DNS simulations. The authors concluded that utilizing the hDSC/MS model, which was a modification of a conventional CNN, enabled faster and more efficient convergence than DNS results in as little as 50 2D snapshots of data. The authors also claimed that the model was able to reconstruct the flow effectively without using a priori methods, which construct the flow using prior knowledge of the DNS simulations. However, the study showed that the deviation in the energy spectrum at higher wavenumbers indicates that the model is effective in capturing large-scale structures, and may need to be improved to capture small-scale structures. Liu et al. [20] improved on the work performed by Fukami et al. [17] by developing a CNN-based model that incorporates temporal information from consecutive snapshots to discuss the super-resolution of turbulent flows. Conventional CNNs are considered to be “static” NNs because they do not extract time-dependent information from the snapshots. The NN that the authors proposed extracted the features from each snapshot, and incorporated three parallel snapshot reconstruction modules in terms of forward-, central-, and backward-differencing. By applying weights to each parallel module, the outputs of each module were averaged to effectively produce a final output at the same timestep as the DNS simulation. However, like the study by Fukami et al. [17], the authors were unable to reproduce the kinetic energy at higher wavenumbers, meaning the small-scale structures also were not captured properly. Fukami et al. [21] discussed supervised machine learning techniques applied to super-resolution. The authors determined that utilizing basic ML algorithms such as MLP, random forest (RF), support vector regression (SVR), and extreme learning machine (ELM) (a simplified version of the MLP) can easily reproduce laminar flows. However, for turbulent flow data, the authors recommend that CNNs are effective in handling the large datasets that turbulent flows incur during DNS simulations. The study also suggests that CNNs are only effective within the distributions that the model trains and tests data from, meaning they should not be used for extrapolation. Because NNs are effective approximators of data resolution studies, future studies should focus on training data based on the available information. Kim et al. [22] accomplished this by applying unsupervised deep learning for super-resolution of paired and unpaired datasets for 2D snapshots of turbulent flows. Based on the results from these papers, it is clear that utilizing a CNN-based model that can capture the small-scale structures in turbulence from the DNS is of particular interest in future research.
Additionally, there has been increasing interest in physics-informed neural networks (PINNs), which incorporate the governing equations, statistics, and/or physical intuition into the neural network. Raissi and Karniadakis [23] and Raissi et al. [24] first introduced PINNs to solve different governing equations, such as Burger’s equation and the Navier–Stokes equations. This has also been applied to super-resolution studies. Yousif et al. [25] applied PINNs to inlet flow generation. Sachin Venkatesh et al. [26] performed spatio-temporal super-resolution analysis on turbulent flow fields to reconstruct high-resolution flow fields from low-resolution flow field data. Bode et al. [27] used a physics-informed super-resolution GAN for sub-filter modeling of turbulent reactive flows. Yousif et al. [28] and Yousif et al. [29] applied physics-informed super-resolution to predict turbulent flows at different Reynolds numbers. Eivazi and Vinuesa [30] used PINNs to reconstruct turbulent flows from noisy datasets. Du et al. [31] also compared PINNs with four-dimensional adjoint-variational data assimilation in reconstructing turbulent channel flows from sparse data. Linqi et al. [32] then used PINNs in an enhanced super-resolution GAN to reconstruct turbulent channel flows from sparse data generated from upsampling via tri-linear interpolation. These studies indicate that there is a need for PINNs combined with the super-resolution capabilities of GANs to reconstruct turbulent flow fields and structures.
The novelty of this work lies in the combination of a GAN with physics-informed constraints to achieve the super-resolution of three-dimensional turbulence datasets. Previous work on super-resolution has typically relied on deep learning models that are trained on large datasets, but these models can struggle with capturing the complex physical processes that govern turbulent flows. By incorporating physics-informed constraints into the proposed GAN model, this work aims to improve the accuracy and reliability of the super-resolution results while maintaining computational efficiency. The physics-informed constraints are derived from first principles and are incorporated into the GAN loss function to ensure that the generated flow fields satisfy the laws of physics. This approach allows the model to capture important physical features of turbulence, such as vortices and energy spectra, while still achieving high-resolution results. The results show that the proposed physics-informed GAN approach achieves superior performance in terms of both accuracy and computational efficiency, making it a promising approach for super-resolution of three-dimensional turbulence datasets.
The goal of this work is to investigate the reconstruction of turbulence from minimal or lower-resolution datasets as inputs using reduced-order models. This work seeks to effectively reconstruct high-resolution 3D turbulent flow fields using unsupervised physics-informed deep learning. The first objective of this study is to reconstruct turbulent channel flow fields and verify these with respect to the statistics. The second objective is to compare the turbulent flow structures generated from the GAN with the DNS.
This paper is organized in the following structure. Section 2 describes the numerical set-up of the DNS data utilized for training the GAN, and explains the methodology of the proposed GAN. This section describes in detail the deep learning algorithm implemented, such as the generator and discriminator architecture, as well as the chosen values of the hyperparameters. Section 3.1 demonstrates the turbulent flow statistics generated from the GAN with respect to the DNS, and verifies the performance of the GAN compared to other models. Section 3.2 compares the reconstructed turbulent flow structures with respect to the DNS data. The conclusions from this study are stated in Section 4.
2. Methodology
DNS simulations were conducted to determine the training data utilized in this study, which used the POONPACK code developed by Lee and Moser [5]. For this study, the streamwise, wall-normal, and spanwise coordinates are denoted by x, y, and z, respectively. Additionally, the streamwise, wall-normal, and spanwise velocities are denoted by u, v, and w, respectively. The incompressible Navier–Stokes equations, which are determined as
are solved using the methodology from Kim et al. [1].
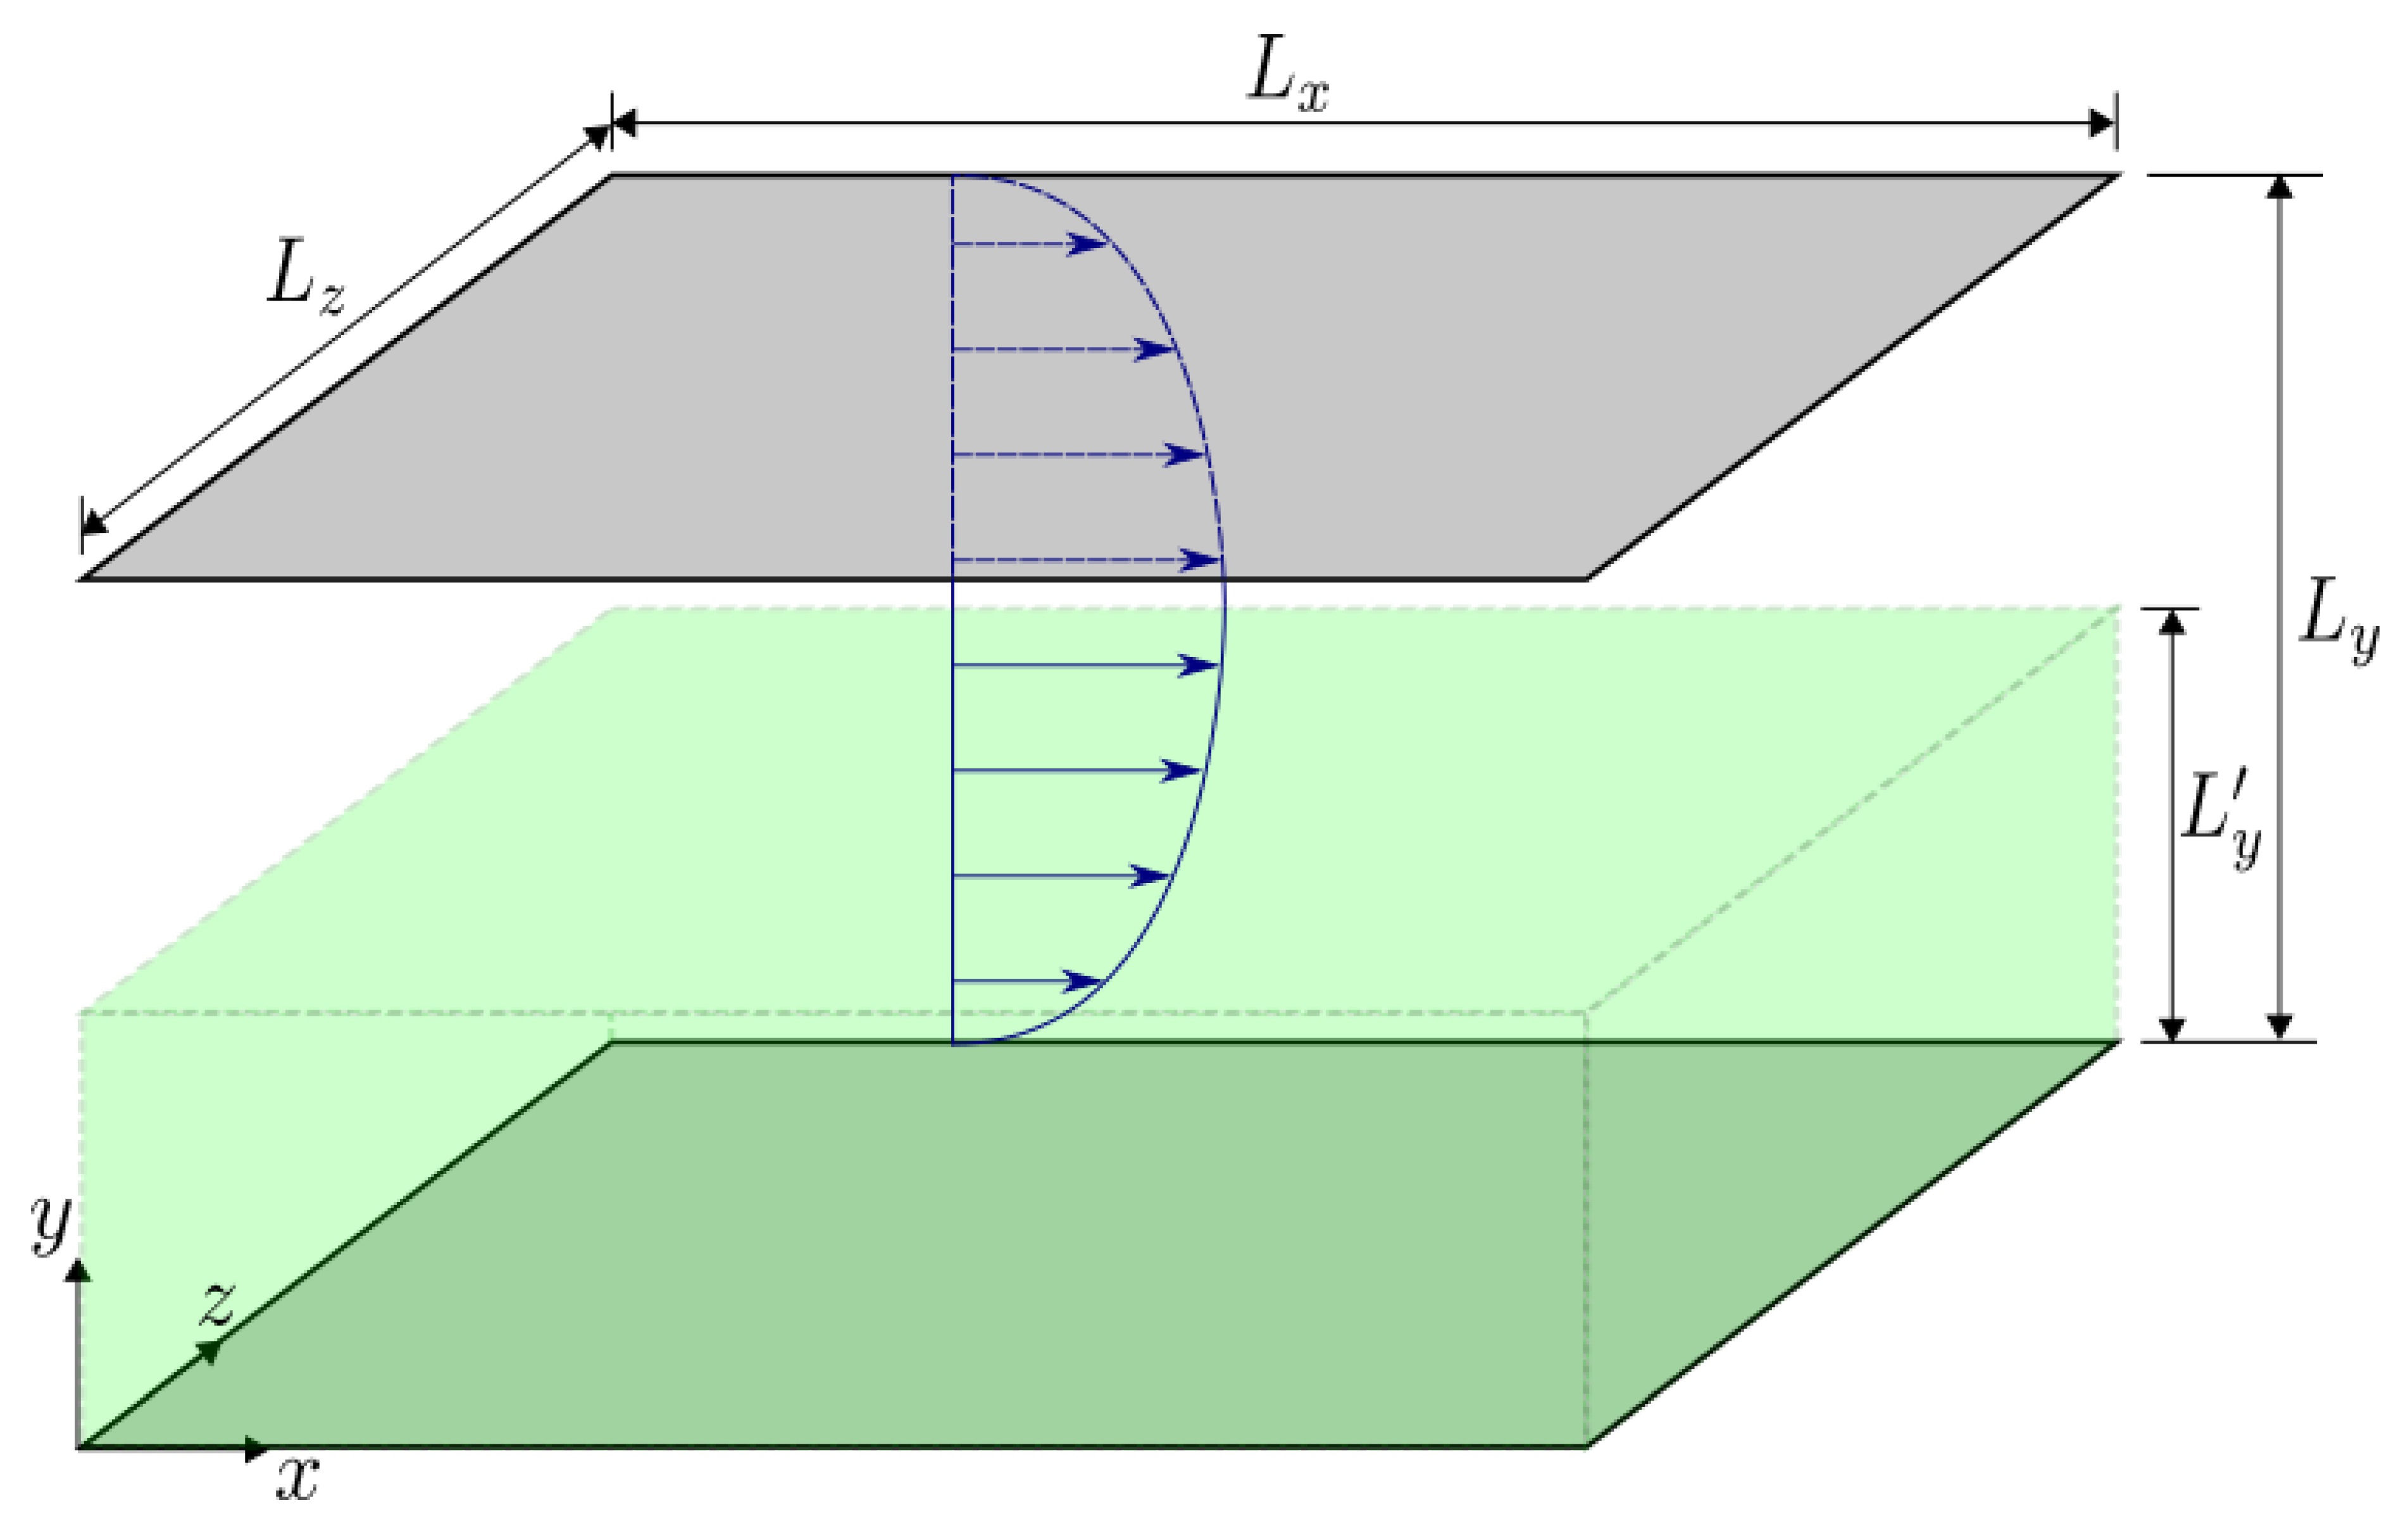
For the turbulent channel flows used in this study, the diagram and the numerical discretization details are shown in Figure 1 and Table 1. In this study, the DNS simulation was conducted at a bulk Reynolds number of 2857. This corresponds to a viscous Reynolds number of 180, where , h, and are the friction velocity, channel half-height, and kinematic viscosity, respectively.
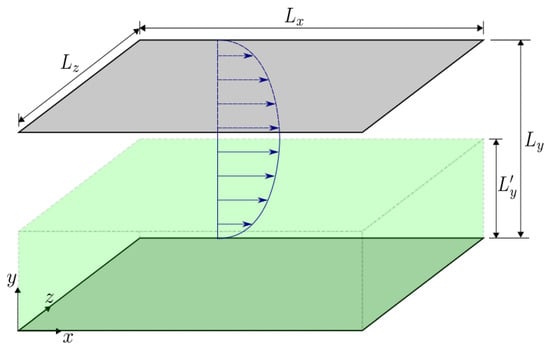
Figure 1.
Sketch of the turbulent channel flow simulation used in this study. The DNS simulation encompasses the flow between both stationary walls. The proposed ML algorithm trains the bottom half of the channel, indicating that .

Table 1.
Details of the numerical discretization employed for the simulations of the turbulent channel flow. The computational grid size is , and , , and are the domain dimensions in each direction.
For the surrogate model used in this study, a machine learning algorithm was developed to effectively capture the flow physics in a turbulent channel flow without directly solving the Navier–Stokes equations. To effectively capture low-Reynolds-number turbulent channel flows, a GAN [33] was constructed. The GAN is comprised of a generator, which reconstructed the flow fields at each timestep using a random noise vector as an input, and a discriminator, which provided feedback to the generator to either accept or reject the outputted flow fields with respect to the real (DNS) data. Because the GAN is an unsupervised deep learning model [14,19,22], it takes a random input vector at each timestep and generates a three-dimensional (3D) flow field at an accuracy close to the DNS simulation.
To ensure that it worked effectively, the GAN model required a significant number of samples, because increasing the number of samples enabled reduced errors between the generated samples and the DNS data. For the simulations, 10,000 samples of data were used to reconstruct the turbulent channel flow. The size of the training dataset does have an impact on the training results. Generally, a larger training set can lead to more accurate and reliable model predictions. With a smaller training set, there may be less information for the model to learn from, which could result in lower accuracy or overfitting. For the purposes of this study, 10,000 samples was considered to be an appropriate balance between having enough data to train the model effectively without overwhelming the model with too much data, which causes overfitting. By utilizing these DNS samples as inputs into the discriminator, the GAN model was able to generate the new data for each respective timestep. DNS simulation is not necessarily needed for the training of the GAN to reconstruct turbulence datasets. However, having access to DNS data can help to improve the accuracy and realism of the generated flow fields. The primary purpose of the GAN is to learn the underlying statistical distribution of a dataset, which can then be used to generate new data that is similar to the training data. In the case of turbulence datasets, the training data can come from a variety of sources, such as experimental measurements or LES. If DNS data are available, it can be used as part of the training dataset for the GAN. This can help to ensure that the generated flow fields accurately capture the complex physical processes that govern turbulent flows. However, if DNS data are not available, other sources of turbulence data can still be used for training the GAN. It is worth noting that while DNS data can be useful for improving the accuracy and realism of GAN-generated flow fields, it is also computationally expensive and may not always be practical or feasible to obtain. Therefore, alternative sources of turbulence data may need to be used for training the GAN in some cases. The GAN model accomplished this by training for 40,000 training iterations. Additionally, the training and testing split for this study was 80% and 20%, respectively.
In addition to the number of samples and training iterations, the GAN model required loss functions for both the generator and the discriminator. These loss functions provided the GAN model with two functions to optimize during each training iteration. The selection of the loss function depends on the type of problem being solved. For example, for a regression problem, the mean squared error (MSE) loss function is commonly used, while for a binary classification problem, the binary cross-entropy loss function is often used. The choice of loss function can have a significant impact on the training process and the resulting model. Different loss functions have different properties and can optimize for different aspects of the model performance. For example, using a mean absolute error (MAE) loss function instead of MSE may result in a model that is more robust to outliers, but also less accurate overall. In addition to selecting an appropriate loss function, it is important to consider how the loss function is optimized during training. This is typically achieved by using an optimization algorithm such as stochastic gradient descent (SGD) or adaptive moment (Adam). The choice of optimization algorithm can also affect the training process and result in different model performance. In summary, selecting an appropriate loss function is important for achieving good model performance, and different loss functions can optimize for different aspects of model performance. However, it is also important to consider how the loss function is optimized during training and choose an appropriate optimization algorithm.
The loss functions were determined from the cycle-consistency GAN (CycleGAN) because this DL method is able to map between two unpaired datasets using two generators and two discriminators [34]. In this case, the two unpaired datasets are the low-resolution (LR) and high-resolution (HR) inputs to the two generators: G and F. The generator G takes an LR input and generates an HR output, and generator F does the opposite (HR input to LR output). The outputs from generators G and F are sent back through the other generators to create a cycle-consistency loss, such that and is satisfied. The two discriminators, and , then process the generated outputs from G and F, respectively, to determine a probability of how real or fake the outputs are versus the real datasets. The loss functions for the discriminators ( and ) as well as for the generators ( and ) are, respectively, defined as
where is the binary cross-entropy (BCE) loss, is the expected value, X is the real data, is the data outputted from generator G, is the data outputted from generator F, is a coefficient of the gradient penalty, is the interpolated data between the real and generated data, is a uniform distribution of values between 0 and 1 for the purposes of determining the interpolated data, and is the L2 matrix norm. The BCE loss is defined as
where is the discriminator output. A gradient penalty (GP) term was added to the discriminator loss functions because this loss term has proven to prevent mode collapse during the training, as well as to enable the discriminator to not overpower the generator [19,35]. For this study, was set to 10. To improve the predictions generated from the proposed algorithm, six additional loss function terms were introduced: a cycle-consistency loss function [34], a divergence loss function , an NSE loss function based on the material derivative, a structural similarity index measure (SSIM) loss , a downsampling loss , and an upsampling loss [36]. These loss functions are defined as
and represent the mean squared error and mean absolute error loss terms in the generator, which are defined as
and
respectively. The parameter is a constant that was set to 0.5 because that was determined to have the best fit to the data without over-powering the GP loss term in the discriminator loss functions. Equations (9)–(13) were added as additional regression losses to Equations (5) and (6) to penalize the generators more severely for larger errors between the generated samples and the DNS data. Each of these additional loss functions were able to significantly improve the training without increasing the computational expense. This is because the loss functions accounted for both the non-linearities in the governing equations, which is characteristic of the advection term in the material derivative, and the quality of the images reconstructed at both resolutions using the BCE, MSE, and MAE functions in the generator and discriminator. By utilizing both the governing equations as constraints to the GAN model and the data-driven image reconstruction techniques, the number of training iterations required to obtain visually similar datasets was reduced. Using the MSE or the MAE as an additional loss term to the generators has proven to be an effective constraint in previous studies [19,37]. The MAE is a better optimization function for image reconstruction purposes; however, unlike the MAE, the MSE enforces statistical constraints better because it accounts for any outliers in the predicted datasets.
For the CycleGAN, the conditions and are then satisfied using an identity loss [34]. This identity loss initially required the resolutions of both input datasets to be the same. Because the input datasets are not the same resolution, the identity losses for the generators are modified using the SSIM and either upsampling or downsampling losses. The SSIM [38] is a metric that measures the similarity between two datasets, and is defined as
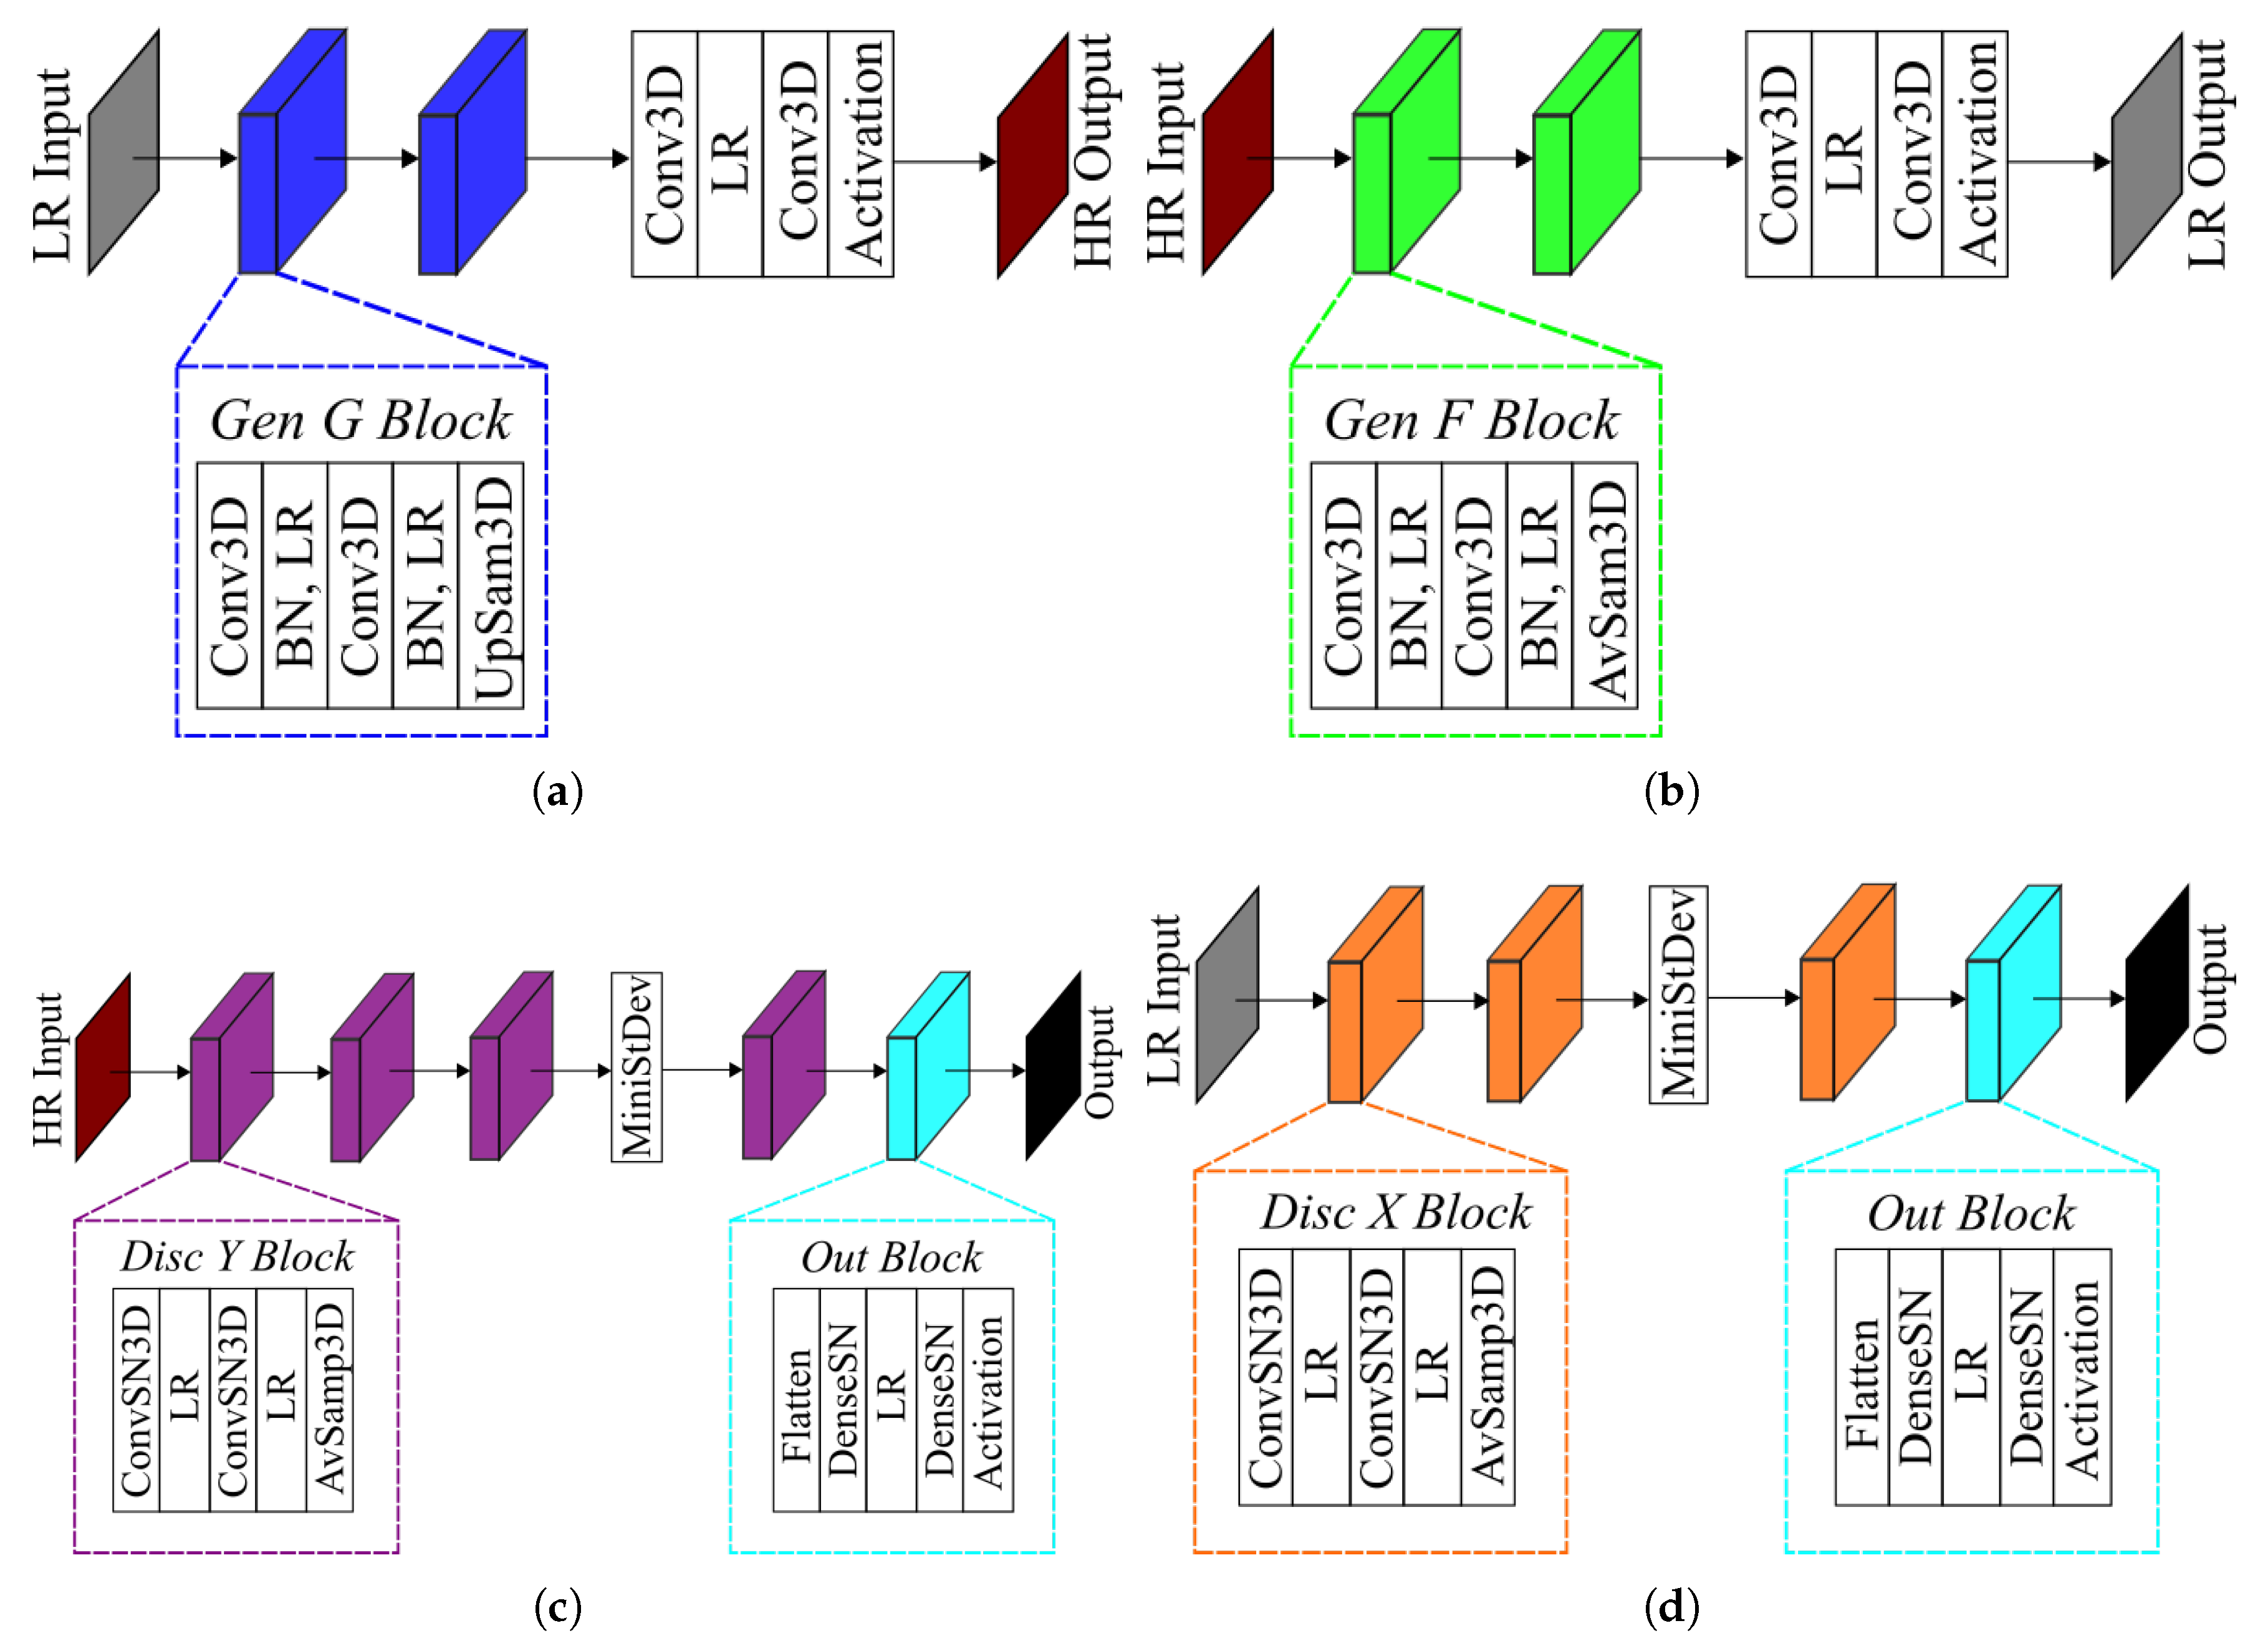
As shown in Equation (16), is a function of the mean , the standard deviation , and the covariance . The constants and are set to small values to prevent the discriminator from going to zero. Additionally, it is recommended by Wang et al. [38] to evaluate the SSIM function on an 11 × 11 patch, but it was found that a 5 × 5 patch was a better choice for this study due to the relative size of the patch versus the final resolution size. The upsampling and downsampling losses incorporated the and functions, which are then defined as an upsampling and average sampling layer, as demonstrated in Figure 2 and Table 2.
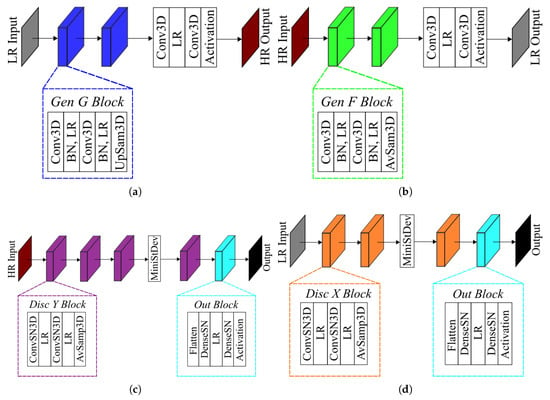
Figure 2.
3D GAN architecture utilized for this study at resolution ratio . The generator G and F are shown in (a,b), and the discriminator and are shown in (c,d).

Table 2.
Description of each layer used in the generators and discriminators of the proposed GAN model.
After determining the appropriate loss functions, the GAN model then required objective functions to be utilized to provide optimized parameters to the loss functions during each training iteration. This indicated that an optimizer needed to be defined for the GAN model. Numerous optimizers have been proposed in previous works, such as RMSProp [39], Adam [40,41], etc. However, these optimizers suffer from warm-up constraints in learning rate optimization. To prevent this problem, the Rectified Adam (RAdam) optimizer was utilized for adaptive learning rate optimization [42]. This optimizer added an additional variance rectification method to enable faster convergence in less training iterations. By inputting the initial learning rate l, as well as the decay rates in calculating the first and second moments (i.e., the mean and variance) and , the variance rectification and adaptive learning rate functions were determined at each timestep, as [42]:
where is the maximum length of the moving average, is the gradient of the objective function f, is the variance at time t, is the mean, is the mean corrected for bias, is the length of the moving average, is the variance rectification, and is the adaptive learning rate. For the purposes of this study, the input learning rates for the generator and discriminator were both set to 0.0001. The decay rates for both the generator and discriminator were set to 0.0 and 0.9 for and .
The architecture that was utilized for this study is shown in Figure 2. Additionally, the description of each layer presented in Figure 2 is indicated in Table 2. The input that was used as an input into the generator was pre-processed to represent a normal distribution. This input was then inputted into the generator block, which is comprised of a fully connected layer with one activation layer, one reshape layer, and one normalization layer. The first activation layer was a leaky rectified linear unit (LeakyReLU), defined as
with a slope coefficient of 0.2. The LeakyReLU layer has been proven to perform well in both generators and discriminators for GAN models. The output from this layer was then sent to either an upsampling or average sampling layer, depending on the generator or discriminator, which is useful for preventing overfitting when using larger datasets.
The output of the input block in the generator was then sent to a convolution block, which contained upsampling, 3D convolution, batch normalization, and LeakyReLU activation layers. The upsampling doubled the resolution of the input data, which was then sent to a transpose convolutional layer. The transpose convolutional layer applied an inverse convolution method to generate output feature maps that were greater than the inputs. To ensure that its output maintained a normal distribution, batch normalization, which is defined as
was applied, where is the mean, is the input sample at each instance i, is the standard deviation, is the normalized input, is a constant () to ensure the denominator does not go to 0, and is the modified input based on a constant multiplier and a bias term , and averaged in each training batch. For this study, the batch size was set to 16. Each convolutional block was then repeated three more times. The output block applied the transpose convolutional layer and a hyperbolic tangent () activation function, defined as
For the discriminator, the activation and normalization layers remained the same, except the output activation function, which was chosen to be a linear activation function. The convolution layers applied in the discriminator were similar to previous studies; however, because of the computational expense and training instability associated with 3D GAN architectures, the convolutional layers required additional normalization to ensure faster convergence and more stabilized training. For this reason, spectral normalization [43] was applied to improve the performance of the discriminator without compromising accuracy and stability. The spectral normalization method applied a weight normalization to the discriminator by normalizing it with respect to the Lipschitz constraint (, where W is the weight matrix), such that
Additionally, a mini-batch standard deviation layer was applied to the last convolutional block of the discriminator. This layer, which was introduced by Karras et al. [44], calculated the standard deviation of each feature in each activation map, averaged the standard deviation over the mini-batch, and then added at the end of the discriminator network. This is calculated as
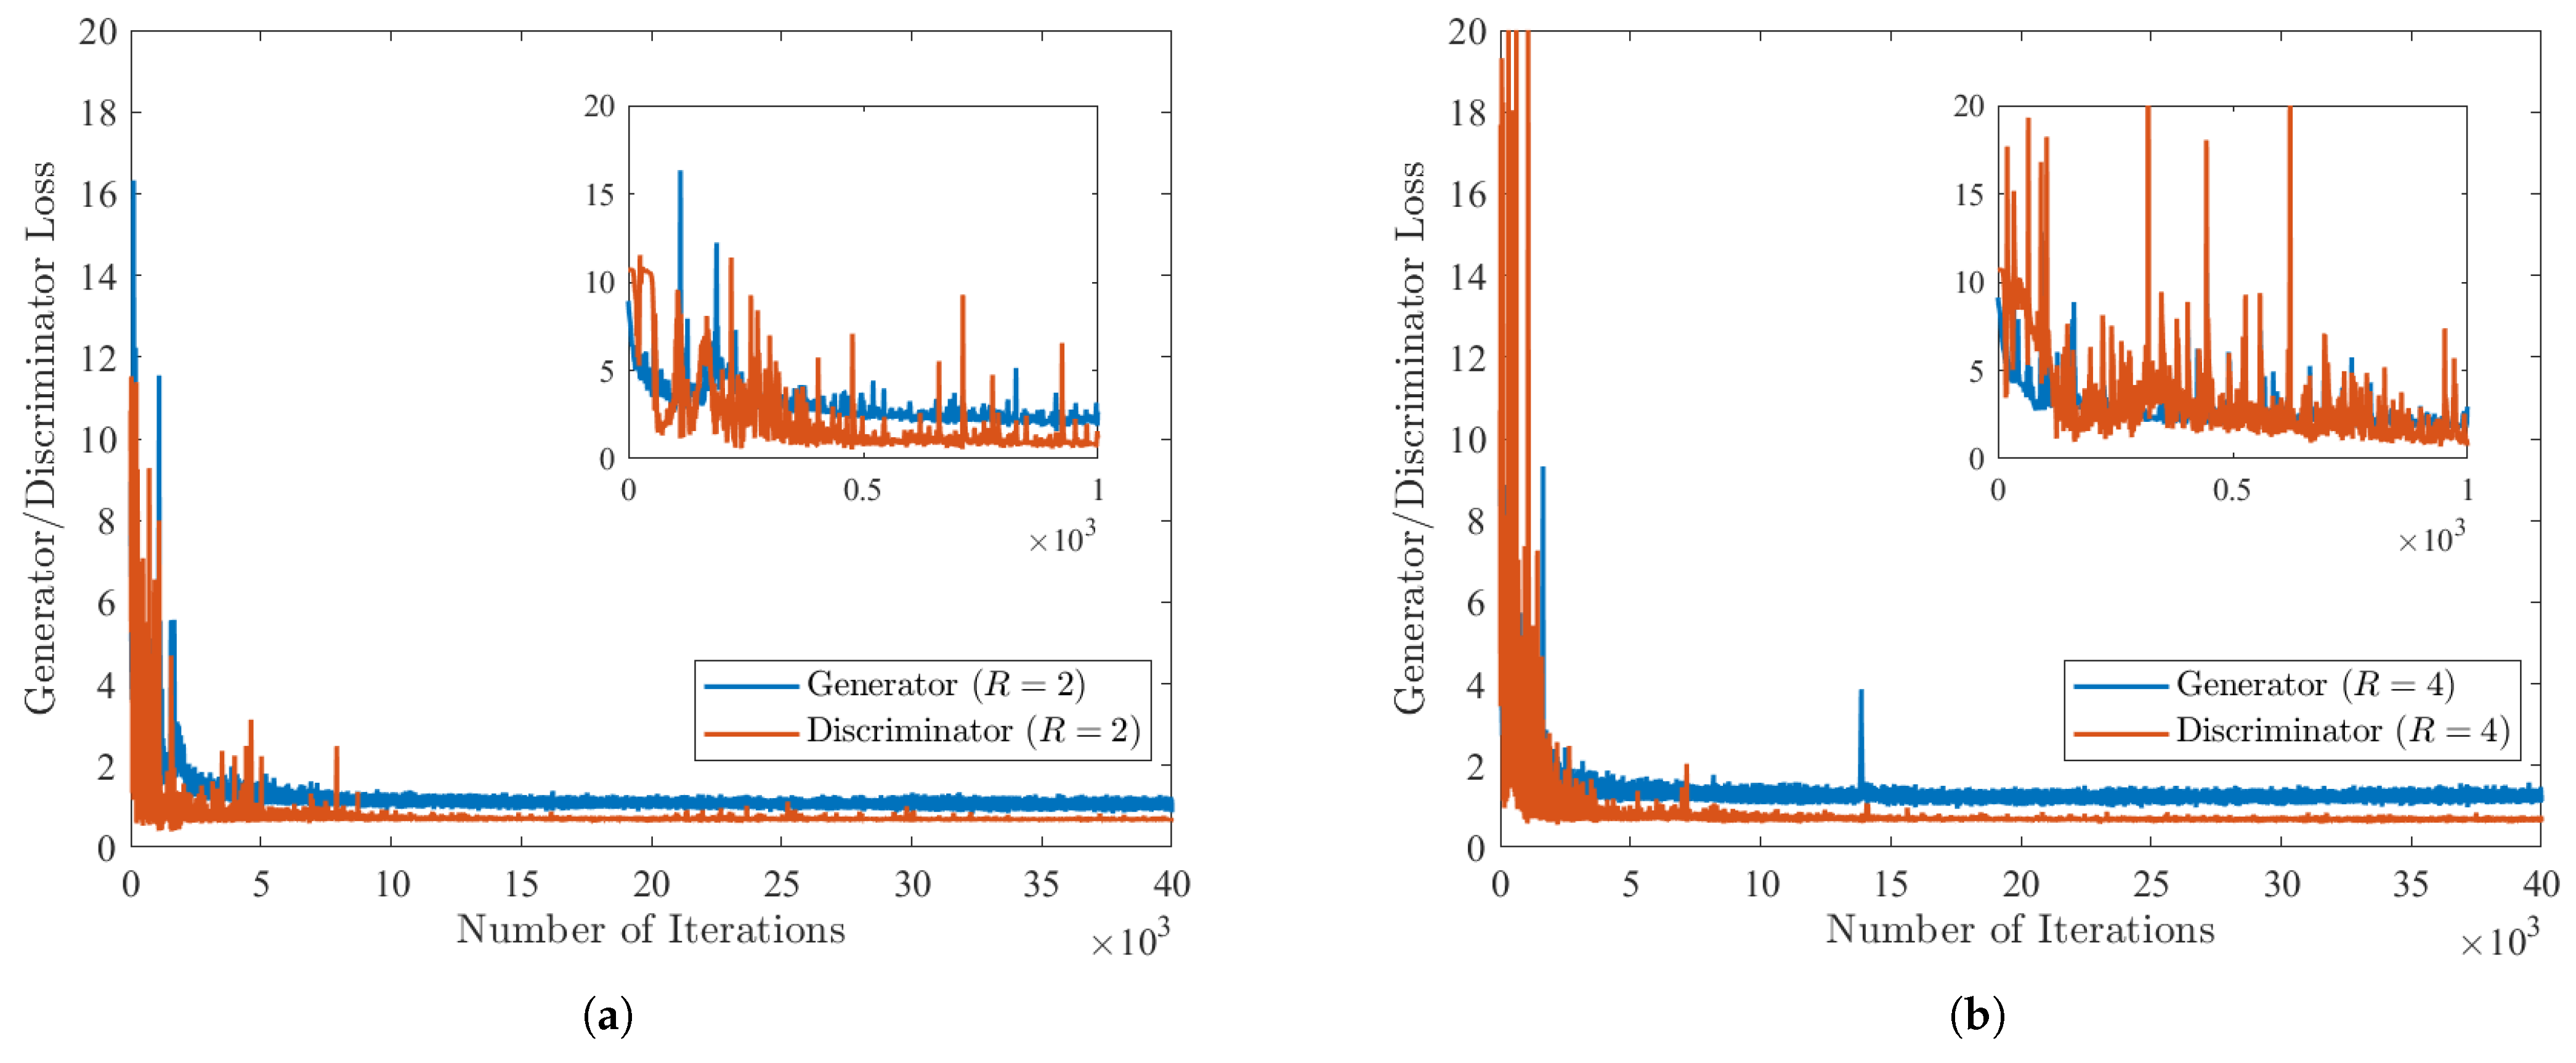
The losses for the generator and discriminator at each iteration are displayed in Figure 3 for each resolution ratio R considered in this study. For the purposes of this study, generator G was optimized to be able to reconstruct a high-resolution dataset from a low-resolution input. This, therefore, meant that the discriminator was utilized to improve the generated datasets from G. The losses for each generator and discriminator are initialized to zero, but are then at their respective maxima within the first 500 iterations. This is because the GAN has not had enough iterations to minimize the regression problem associated with the combined losses. For both Reynolds numbers, Figure 3a,b indicate that the minimum number of iterations required for the GAN model to converge well-enough with the DNS results was 2000. However, this enables only the first-order statistics to converge to the DNS results within an error tolerance of 1%. To enable the higher-order statistics to converge to the DNS results, the number of iterations was, therefore, extended to 40,000 iterations for .
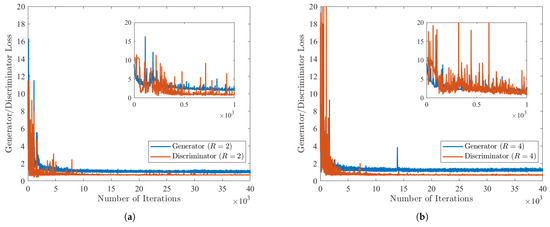
Figure 3.
Losses from the generator and discriminator as a function of the number of training iterations for the proposed GAN model at (a) and (b) .
It is also important to note several reasons why testing a higher-turbulence dataset using a lower-turbulence training dataset could be problematic. If the GAN model is trained on a low-turbulence dataset, it may not generalize well to a higher-turbulence dataset. The model may have learned to generate flow fields that are specific to the low-turbulence conditions, and may not be able to accurately generate flow fields for higher-turbulence conditions. If the GAN model is only trained on low-turbulence data, it may have limited applicability to real-world scenarios that involve higher-turbulence conditions. This could limit the usefulness of the model in practical applications. Additionally, if the GAN model is tested on a higher-turbulence dataset that is significantly different from the training dataset, there is a risk of overfitting. The model may have learned to generate flow fields that closely match the training data, but may not be able to accurately generate flow fields for new and different conditions. Therefore, it is important to carefully consider the range of turbulence conditions that the GAN model will be expected to generate flow fields for, and to train and test the model on datasets that are representative of these conditions. This can help to ensure that the model is accurate and reliable across a range of different turbulence conditions.
3. Results and Discussion
3.1. Super-Resolution Statistics
This section discusses the super-resolution reconstruction statistics of the ML algorithm compared to DNS. In order for the data to be properly read by the GAN, the data were normalized to be between −1 and 1. Therefore, the data needed to be normalized to fit within the bounds of the GAN, which was accomplished via
where is the normalized input suitable for the GAN training. After the training was completed and the GAN data were generated, the data were un-normalized to determine the velocity components at the appropriate scale for the DNS data.
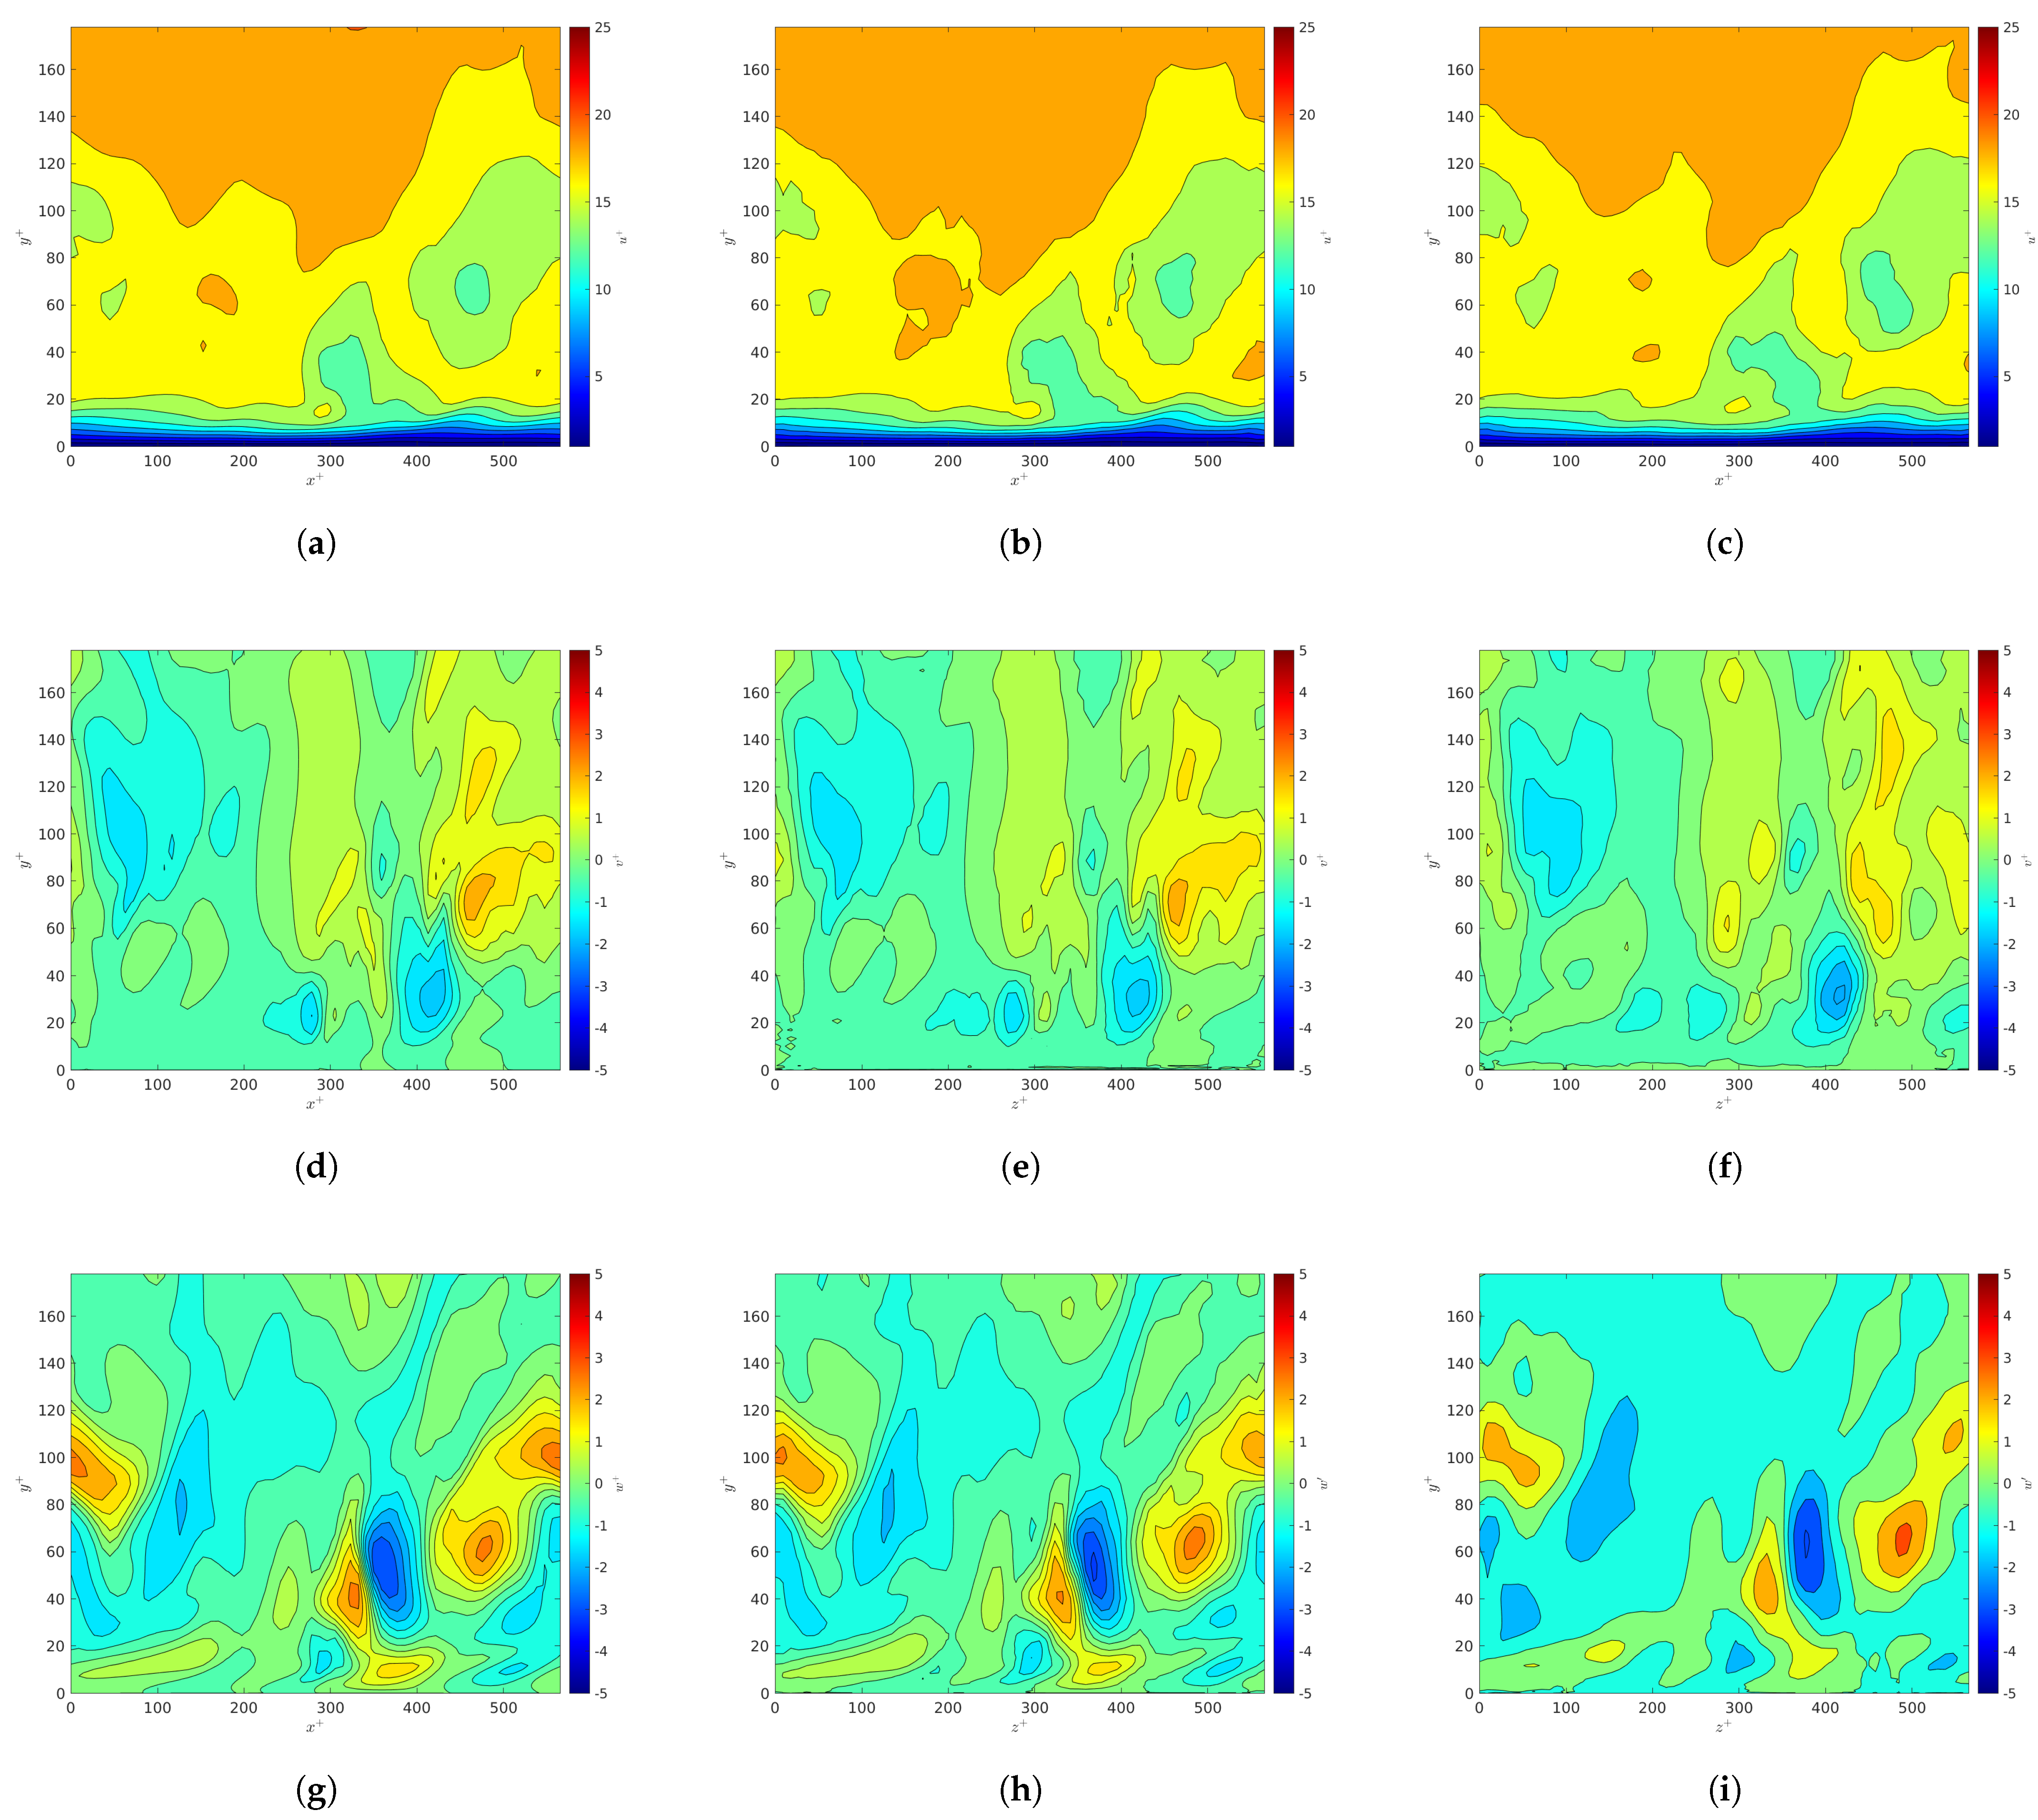
Figure 4 indicates the velocity profiles for the u, v, and w components from the DNS or GAN models. The velocity profiles shown in Figure 4a,d,g correspond to the data from the DNS dataset. It is demonstrated that the GAN model is able to capture the flow in the bottom half of the channel within 5% of the DNS data instantaneously at the channel center. This also indicates that the GAN model is able to capture both the mean flow and the turbulent fluctuations for each velocity component. The differences in these snapshots based on visual inspection are attributed to the high turbulent fluctuations in the log-law region of the channel, as well as the information loss associated with higher resolution ratios. These differences are most present in the wall-normal and spanwise components v and w because the turbulent fluctuations for those components are not as strong or dominant as the streamwise velocity u.
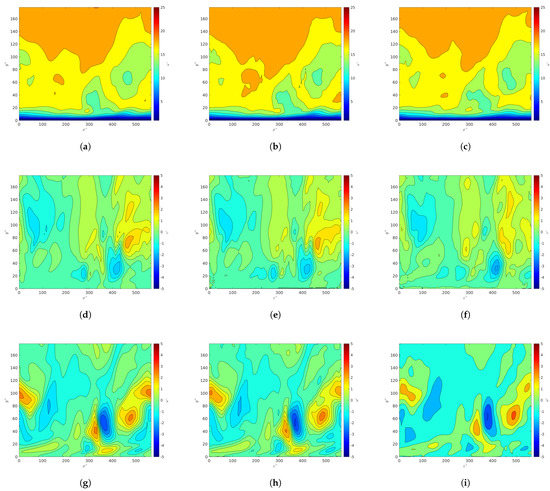
Figure 4.
Instantaneous velocity components in the -plane at the channel center for : DNS (a,d,g), GAN predictions for (b,e,h), and GAN predictions for (c,f,i). The top row (a–c), the middle row (d–f), and the bottom row (g–i) correspond to u, v, and w, respectively.
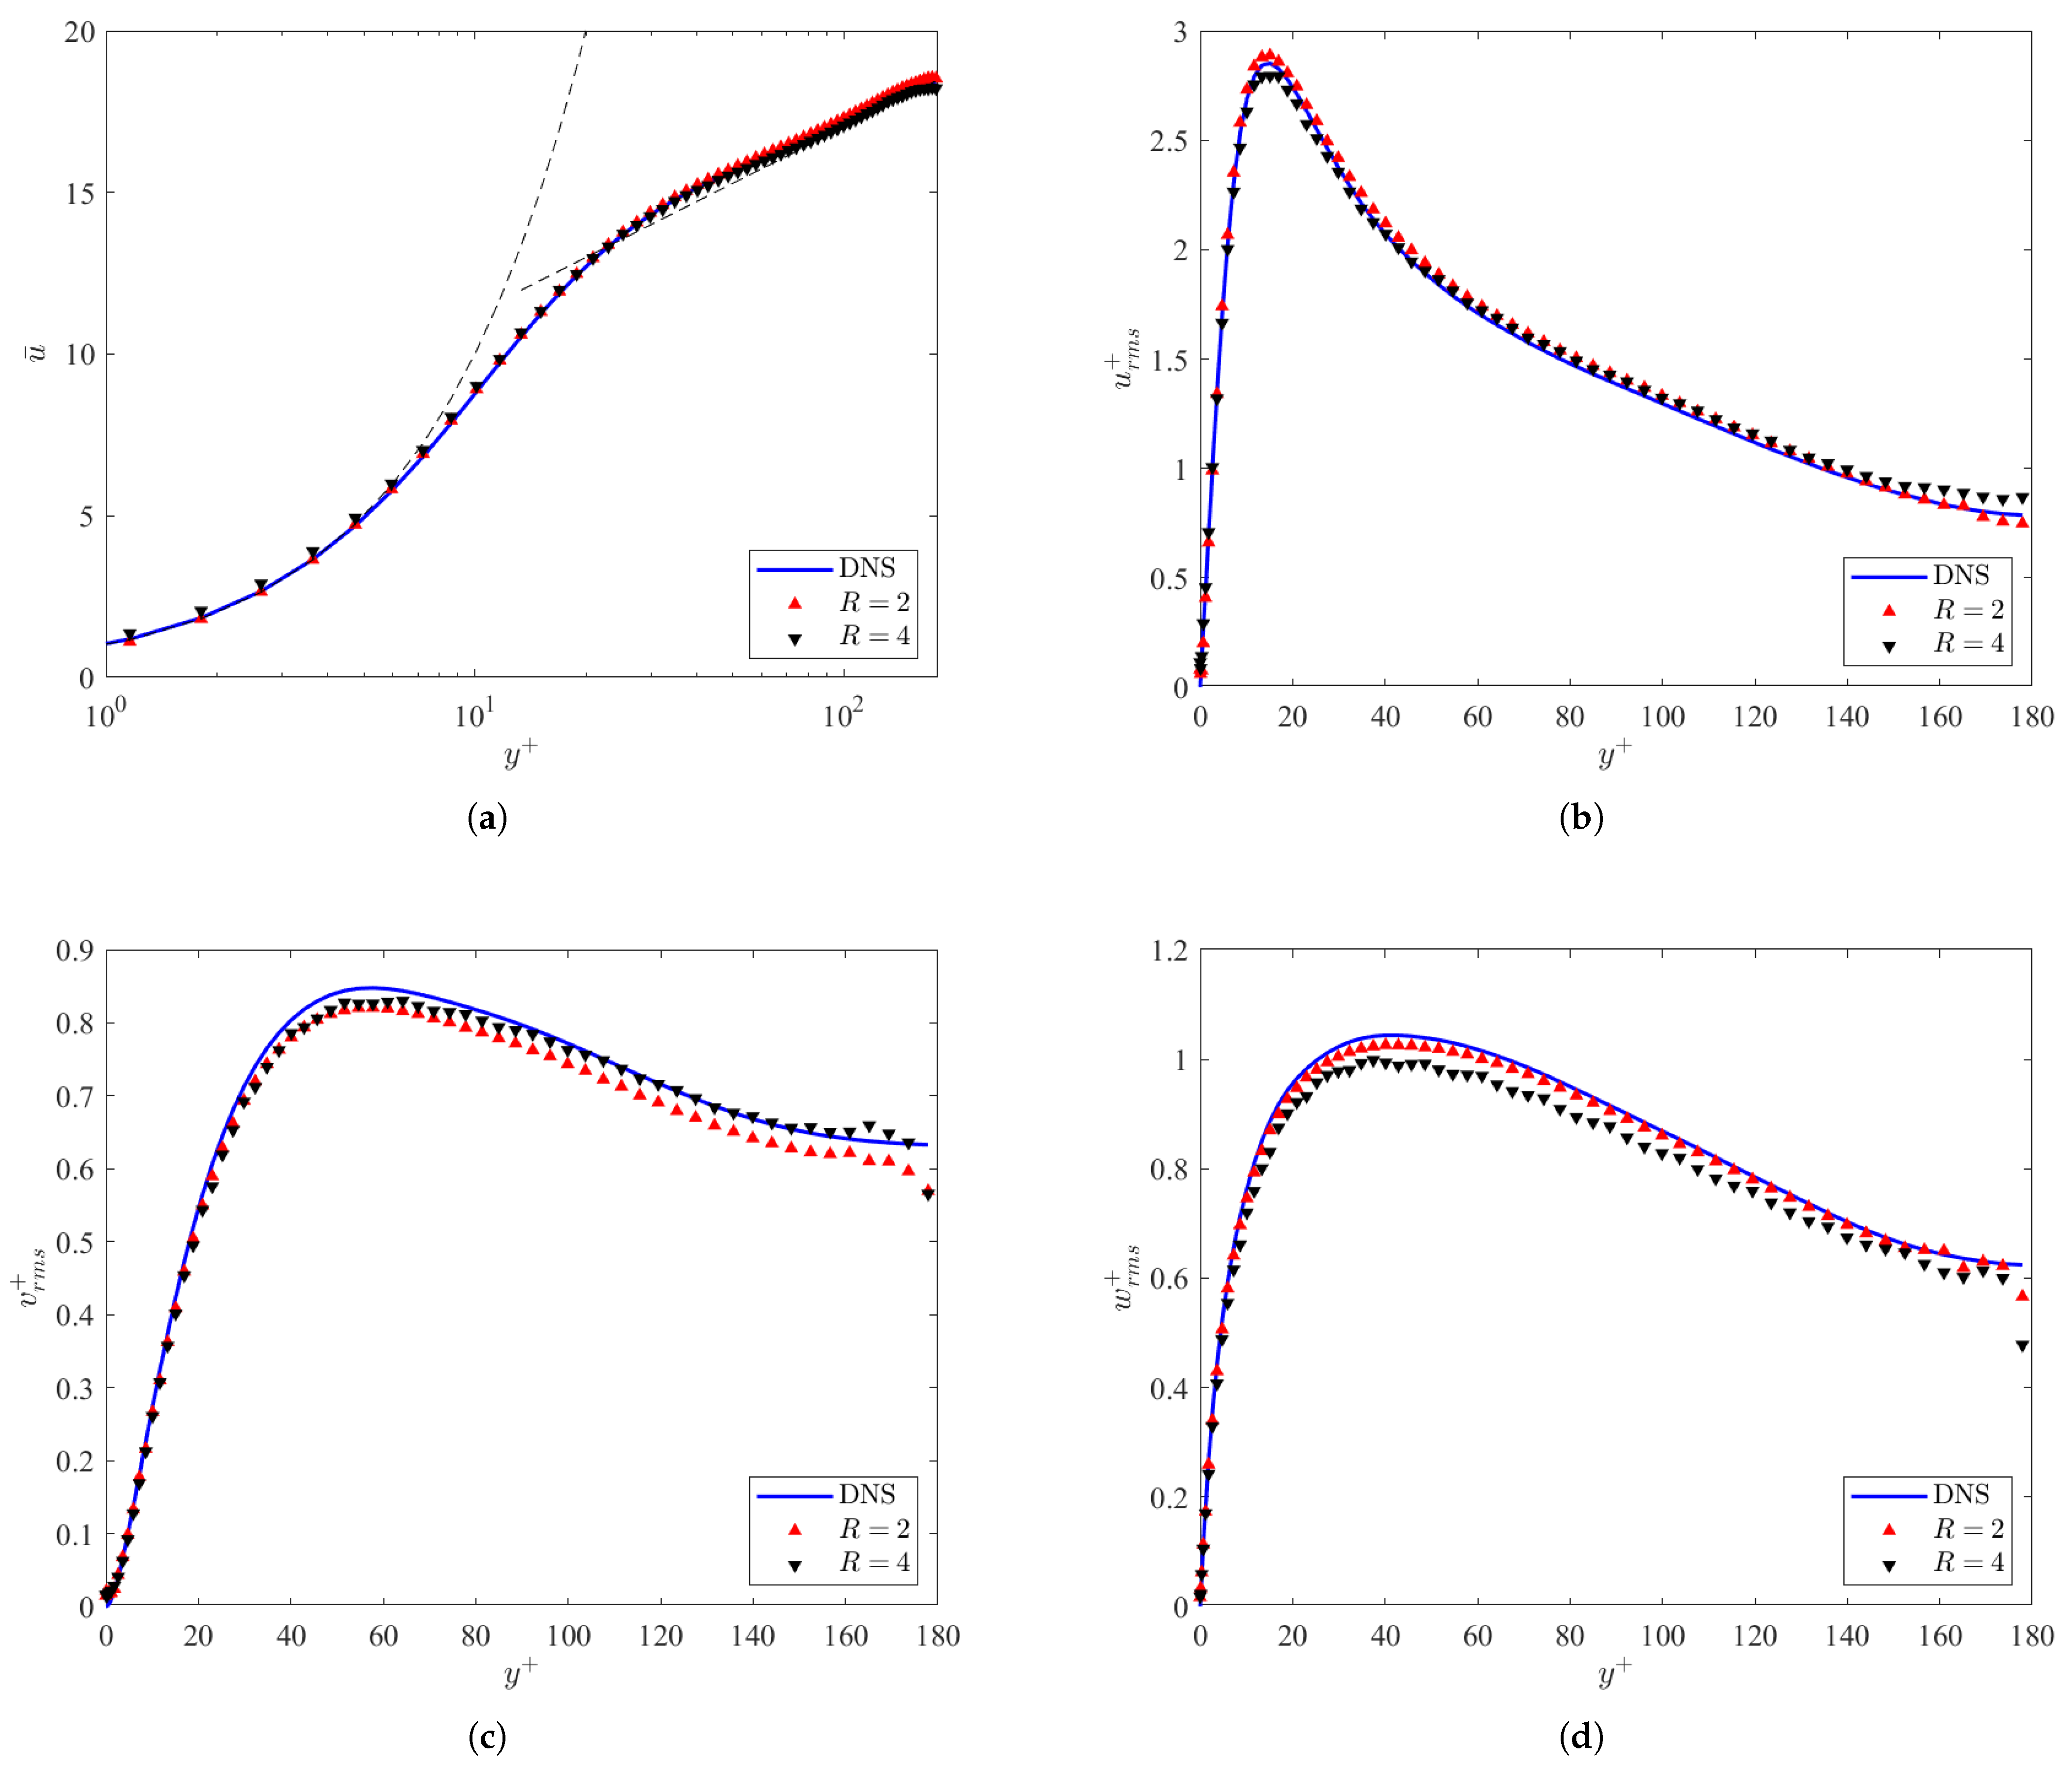
Figure 5 indicates the mean velocity profile and the velocity fluctuations for each of the resolution ratios considered in the study, as well as the DNS data. The mean velocity profile shown in Figure 5a indicates that the GAN model is able to capture the mean flow in the bottom half of the channel within 2% of the DNS data. This also indicates that the GAN model is able to satisfy both the near-wall region, where , and the log-law region, where (given that is the von Karman constant and is the y-intercept for a smooth wall at ). Additionally, the velocity fluctuations are determined within a 5% error for a simulation with only 40,000 training iterations. The lowest variability was in the component of the velocity fluctuations in Figure 5b, whereas the highest variability was in , from Figure 5d. This indicates that the GAN is able to recover the mean velocity profiles for the channel flow in less iterations than the velocity fluctuations at both resolution ratios. Likewise, the velocity fluctuations are more sensitive to the resolution ratios, meaning that increased resolution ratios reduce the ability of the GAN to capture the fluctuations effectively. Overall, the resolution ratio performs the best because less information about the turbulent flow was lost. However, it was determined that the model was able to perform better at a lower resolution ratio for the wall-normal fluctuations . Despite that, the velocity fluctuations are more sensitive to the boundary conditions of the channel, especially at .
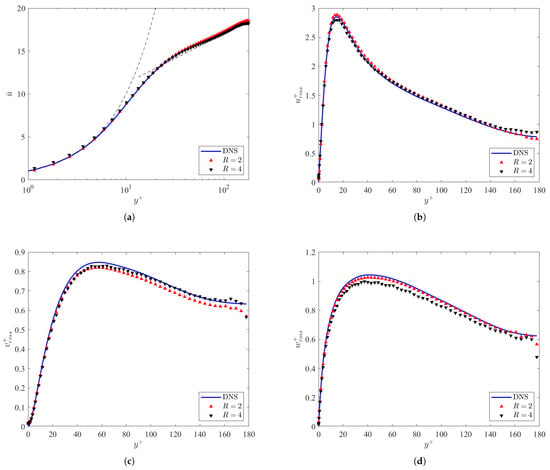
Figure 5.
Mean velocity profile () (a) and velocity fluctuations (b–d) as a function of the normalized wall-normal position for the DNS and ML models at .
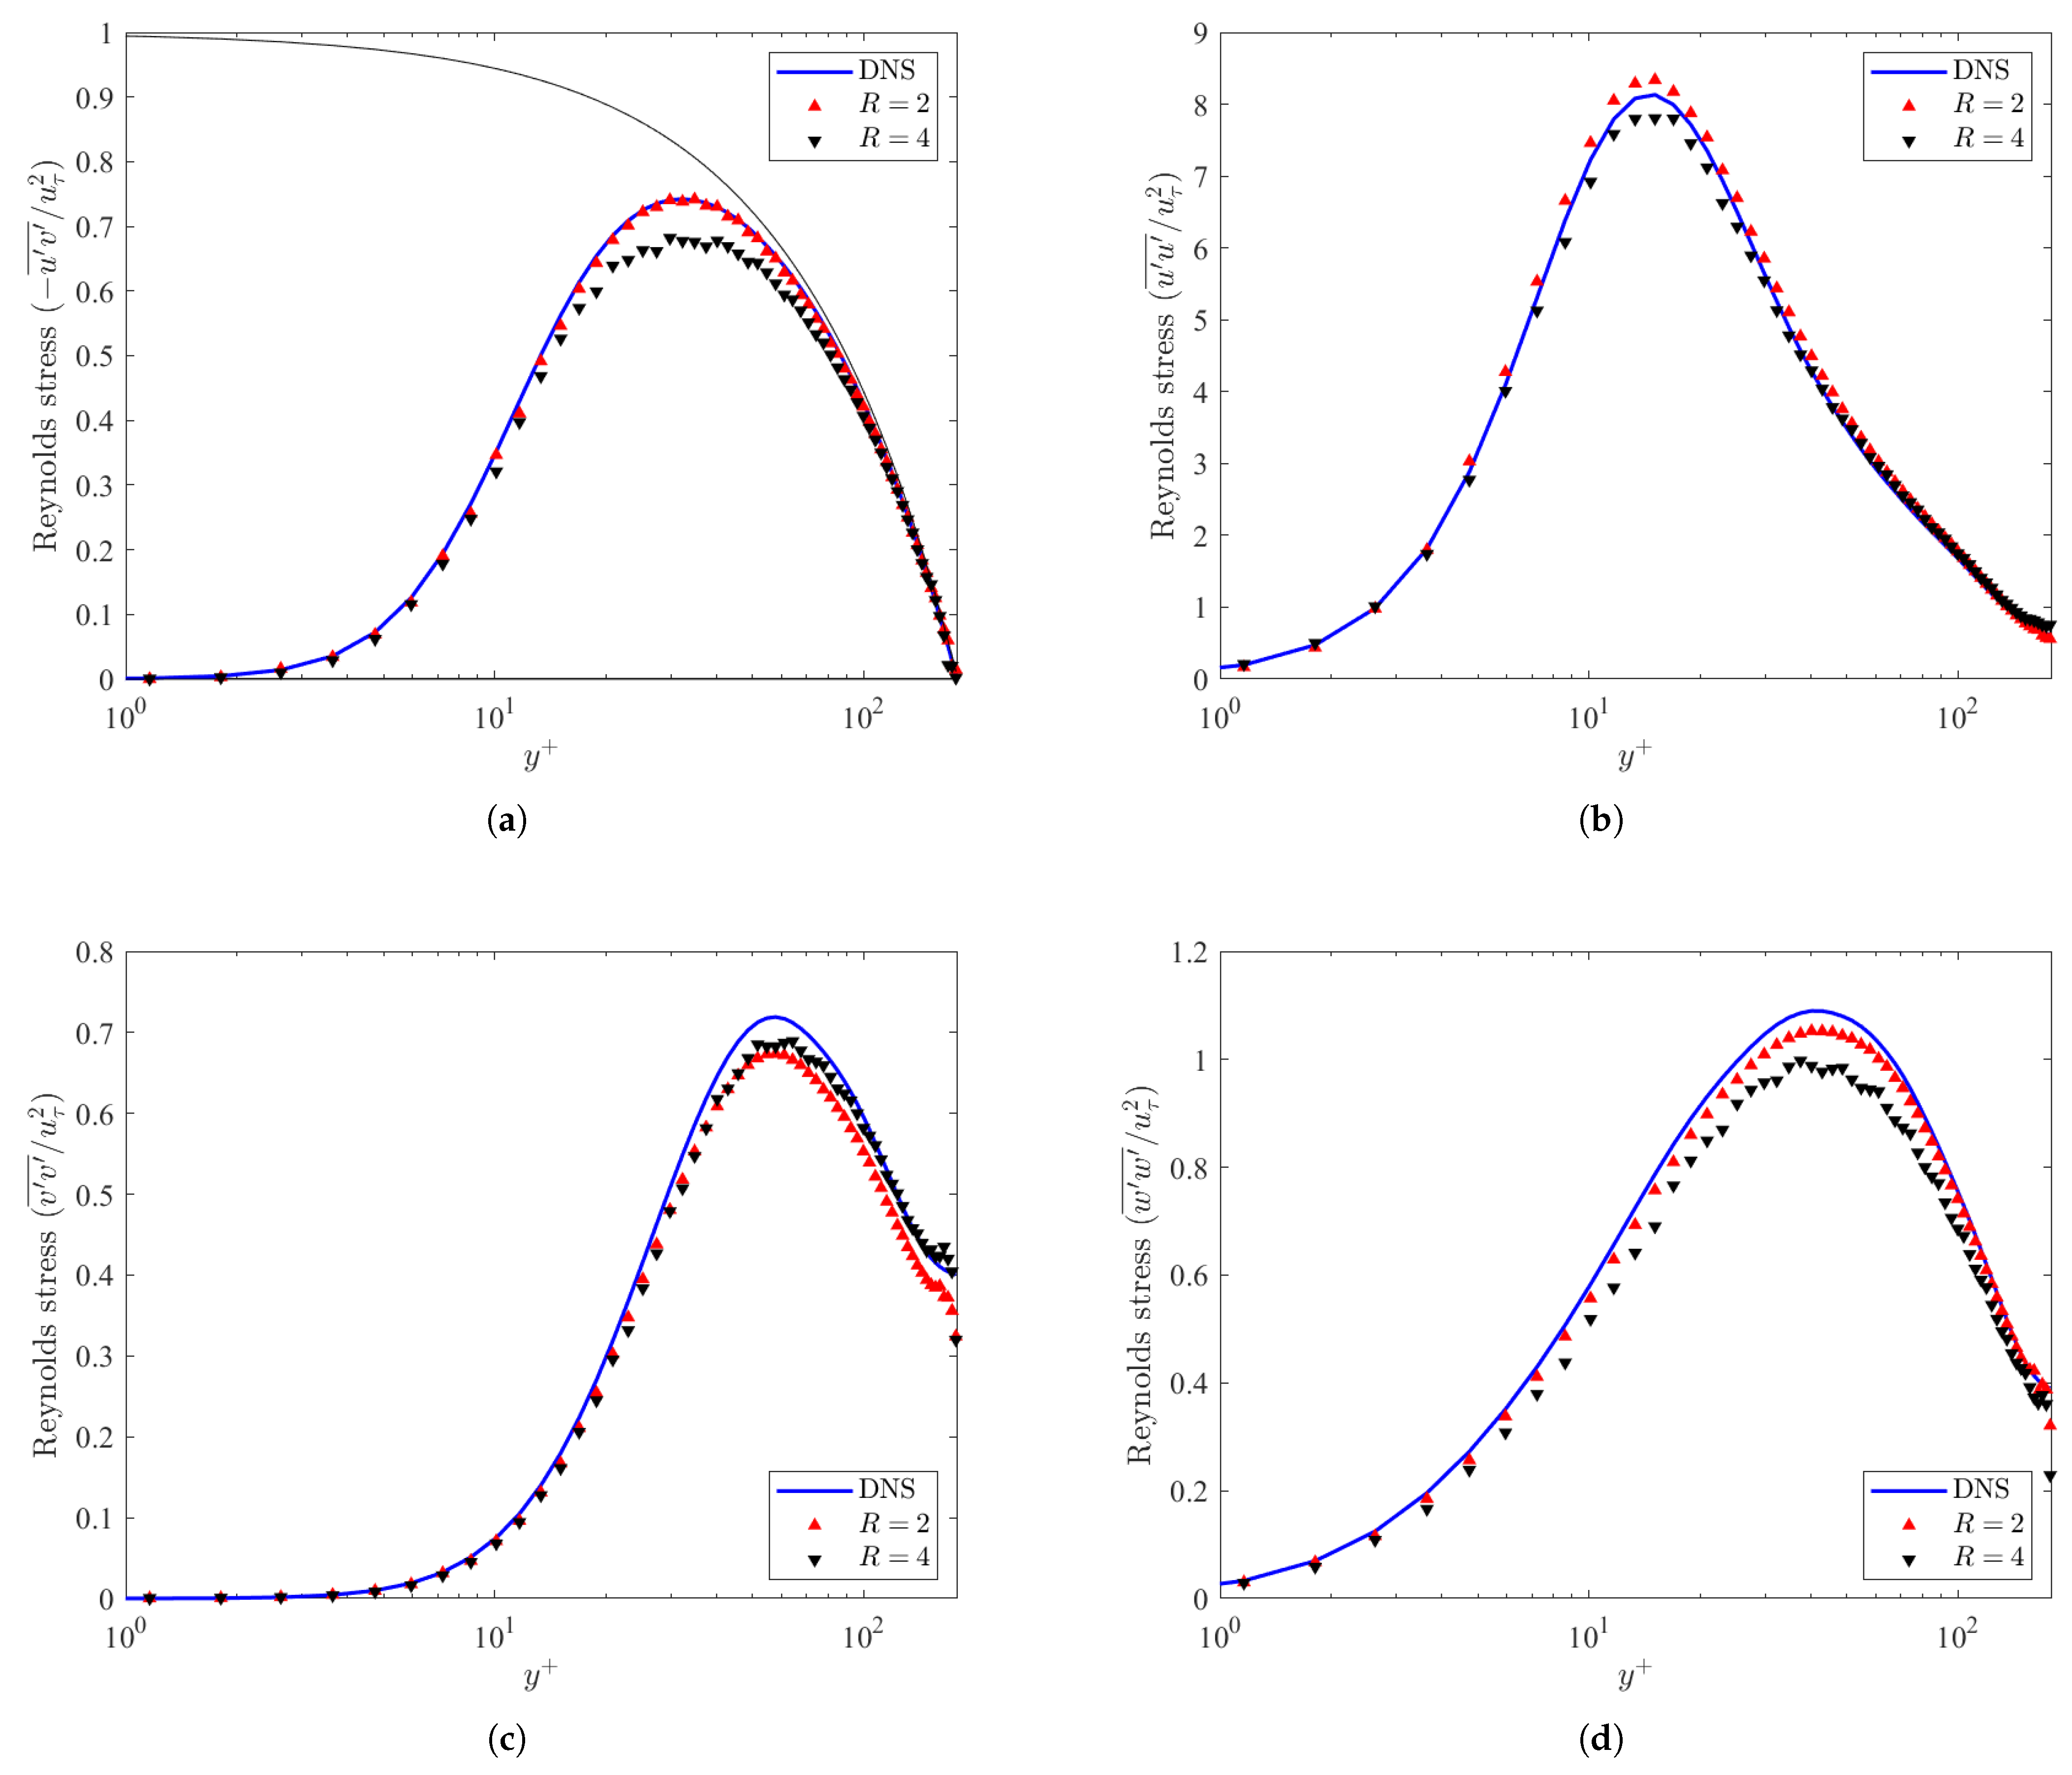
Figure 6 demonstrates the Reynolds stresses in the channel. The Reynolds shear stress is shown in Figure 6a. The black line in the figure corresponds to , which is the theoretical limit which the Reynolds shear stress cannot exceed [3]. For both resolution ratio cases, the predicted Reynolds stresses did not exceed that limit, and also collapsed within 5–10% of the DNS data. For the case, the peak of the Reynolds shear stress is less than the peak for the DNS. This indicates that the GAN does not fully recover the total turbulent fluctuations in the fluid momentum, but captures generally the behavior of the Reynolds shear stress.
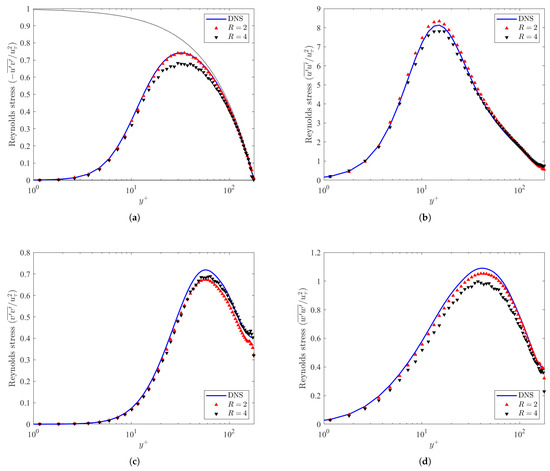
Figure 6.
Reynolds shear stress fluctuations () (a) and Reynolds normal stress (b–d) as a function of the normalized wall-normal position for the DNS and ML models at .
Likewise, the Reynolds normal stresses in the streamwise, wall-normal, and spanwise directions are displayed in Figure 6c,d. The peaks for each of the Reynolds normal stresses are , , and for the streamwise, wall-normal, and spanwise directions, respectively. Both the DNS and the predicted GAN normal stresses correspond to the same peak, indicating the consistence of the GAN with incompressible channel flow. Like the cases in Figure 5, the cases generally outperform the cases, with the exception of the wall-normal component of the Reynolds normal stresses, shown in Figure 6c.
3.2. Turbulent Structures
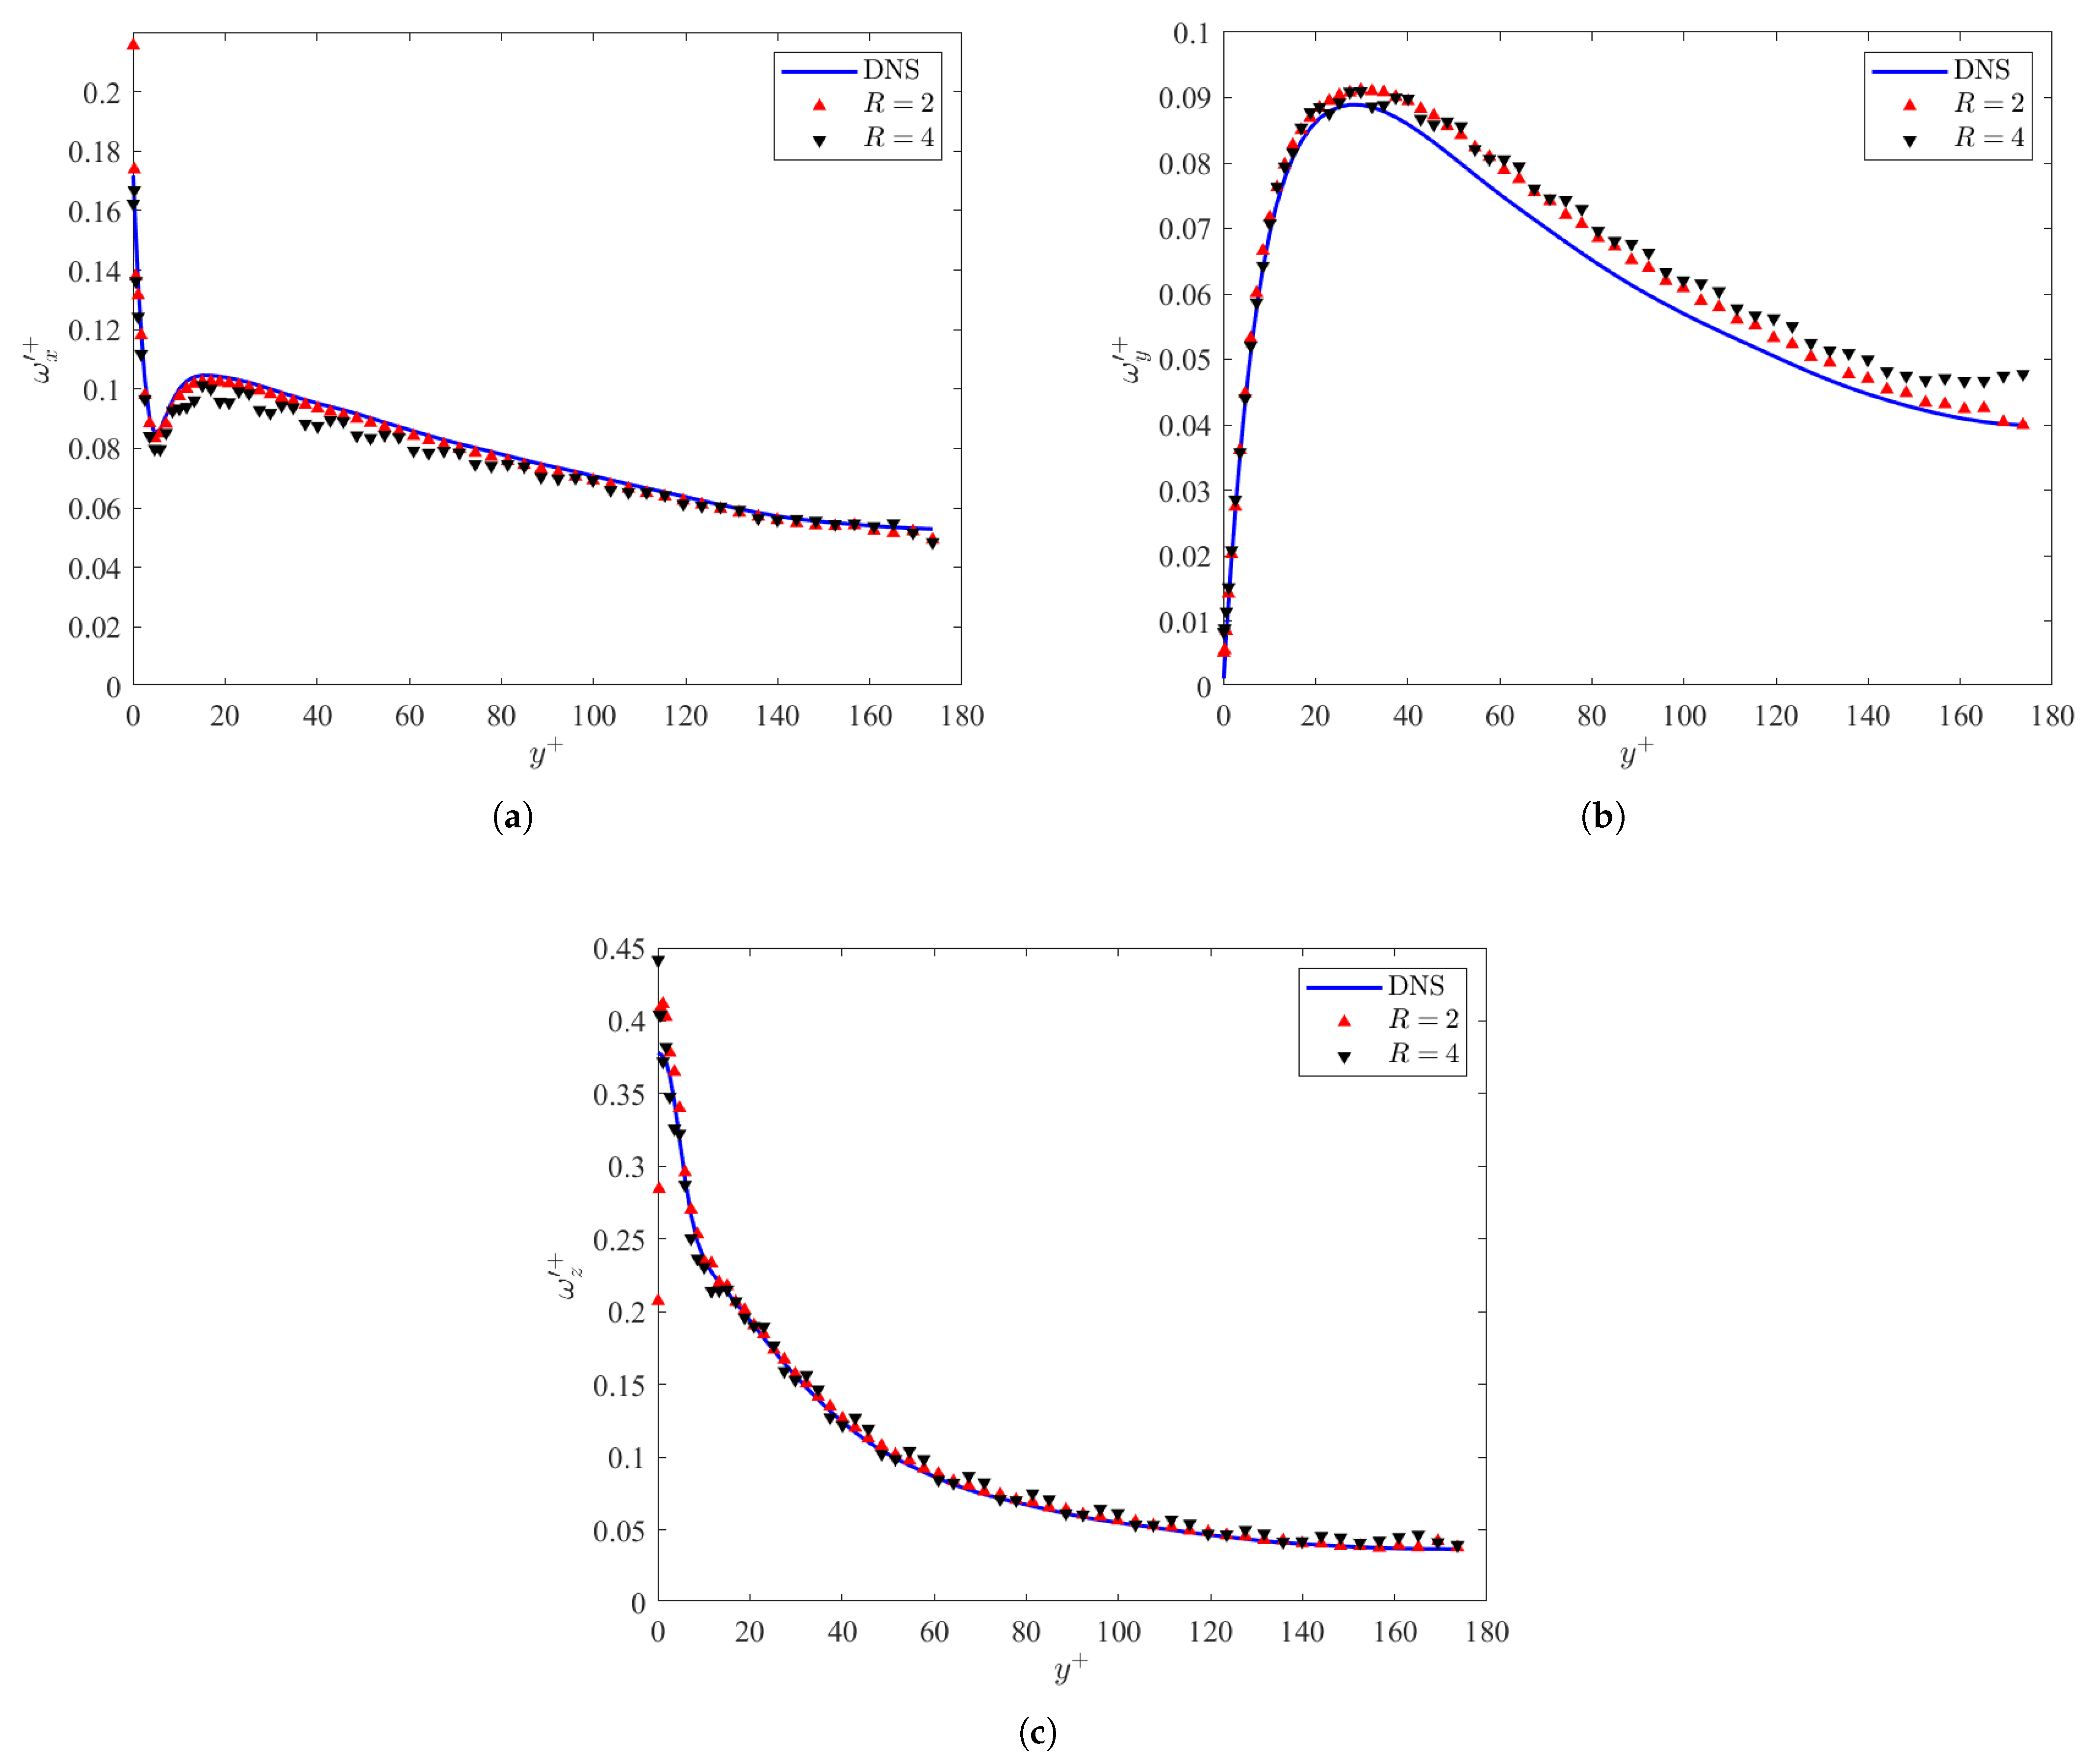
This section discusses the turbulent structures from the data generated by the ML algorithm compared to DNS. Figure 7a–c display the vorticity fluctuations in the channel for the DNS and predicted GAN datasets. The vorticity fluctuations predicted by the GAN in Figure 7a,c are in good agreement with the DNS throughout the channel. However, the wall-normal vorticity fluctuations are in good agreement until the peak at . This is due to the fact that near the wall, is dominated by the spanwise gradient of the streamwise velocity . This can be confirmed visually via Figure 5a–c. The deviations in at then demonstrate high sensitivity to the boundary conditions at the channel half-height .
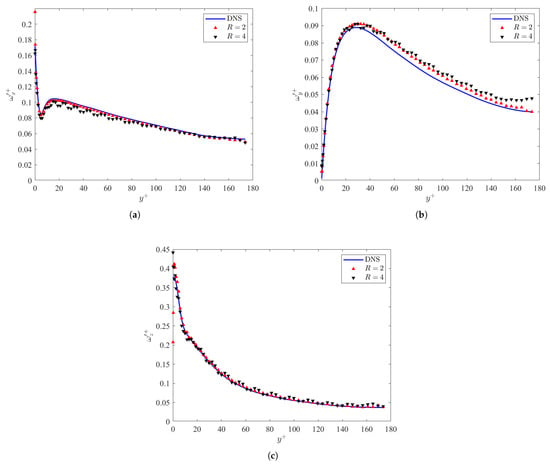
Figure 7.
Vorticity fluctuations () in the (a) streamwise, (b) wall-normal, and (c) spanwise directions as a function of the normalized wall-normal position for the DNS and ML models at .
To determine the turbulent structures in the channel, a vortex identifier was needed [45,46]. Numerous methods have been proposed before, such as the Q-criterion [47], the criterion [48], as well as the Omega and Rortex [49,50]. However, one of the most commonly accepted vortex identifiers is the criterion, which was chosen for this analysis. The vortex identification was defined in Jeong and Hussain [6] as the second eigenvalue of the tensor , which is a function of the symmetric and asymmetric components of the velocity gradient tensor , where T denotes the transpose of the tensor. A turbulent structure is, therefore, present when [6,7]. It is demonstrated that the peak of the rms plots occur at , which confirms that the turbulent structures of interest are concentrated in the buffer region. The mean is primarily negative, which indicates that, on average, there are vortical structures at each layer of the channel.
The streamwise energy spectra indicate the distribution of energy in the streamwise direction at different scales. For each of the resolution ratios considered in this analysis, the large- and small-scale structures would not be able to be effectively captured in the streamwise direction. This is because the peak of the turbulent kinetic energy in the streamwise direction is approximately 1000 wall units for a turbulent channel flow [10], which is greater than the domain size for the configuration in this study. The large-scale structures in the buffer and log-law layer region of the channel would, therefore, not be captured as effectively, so only the spanwise energy spectra were considered in this analysis.
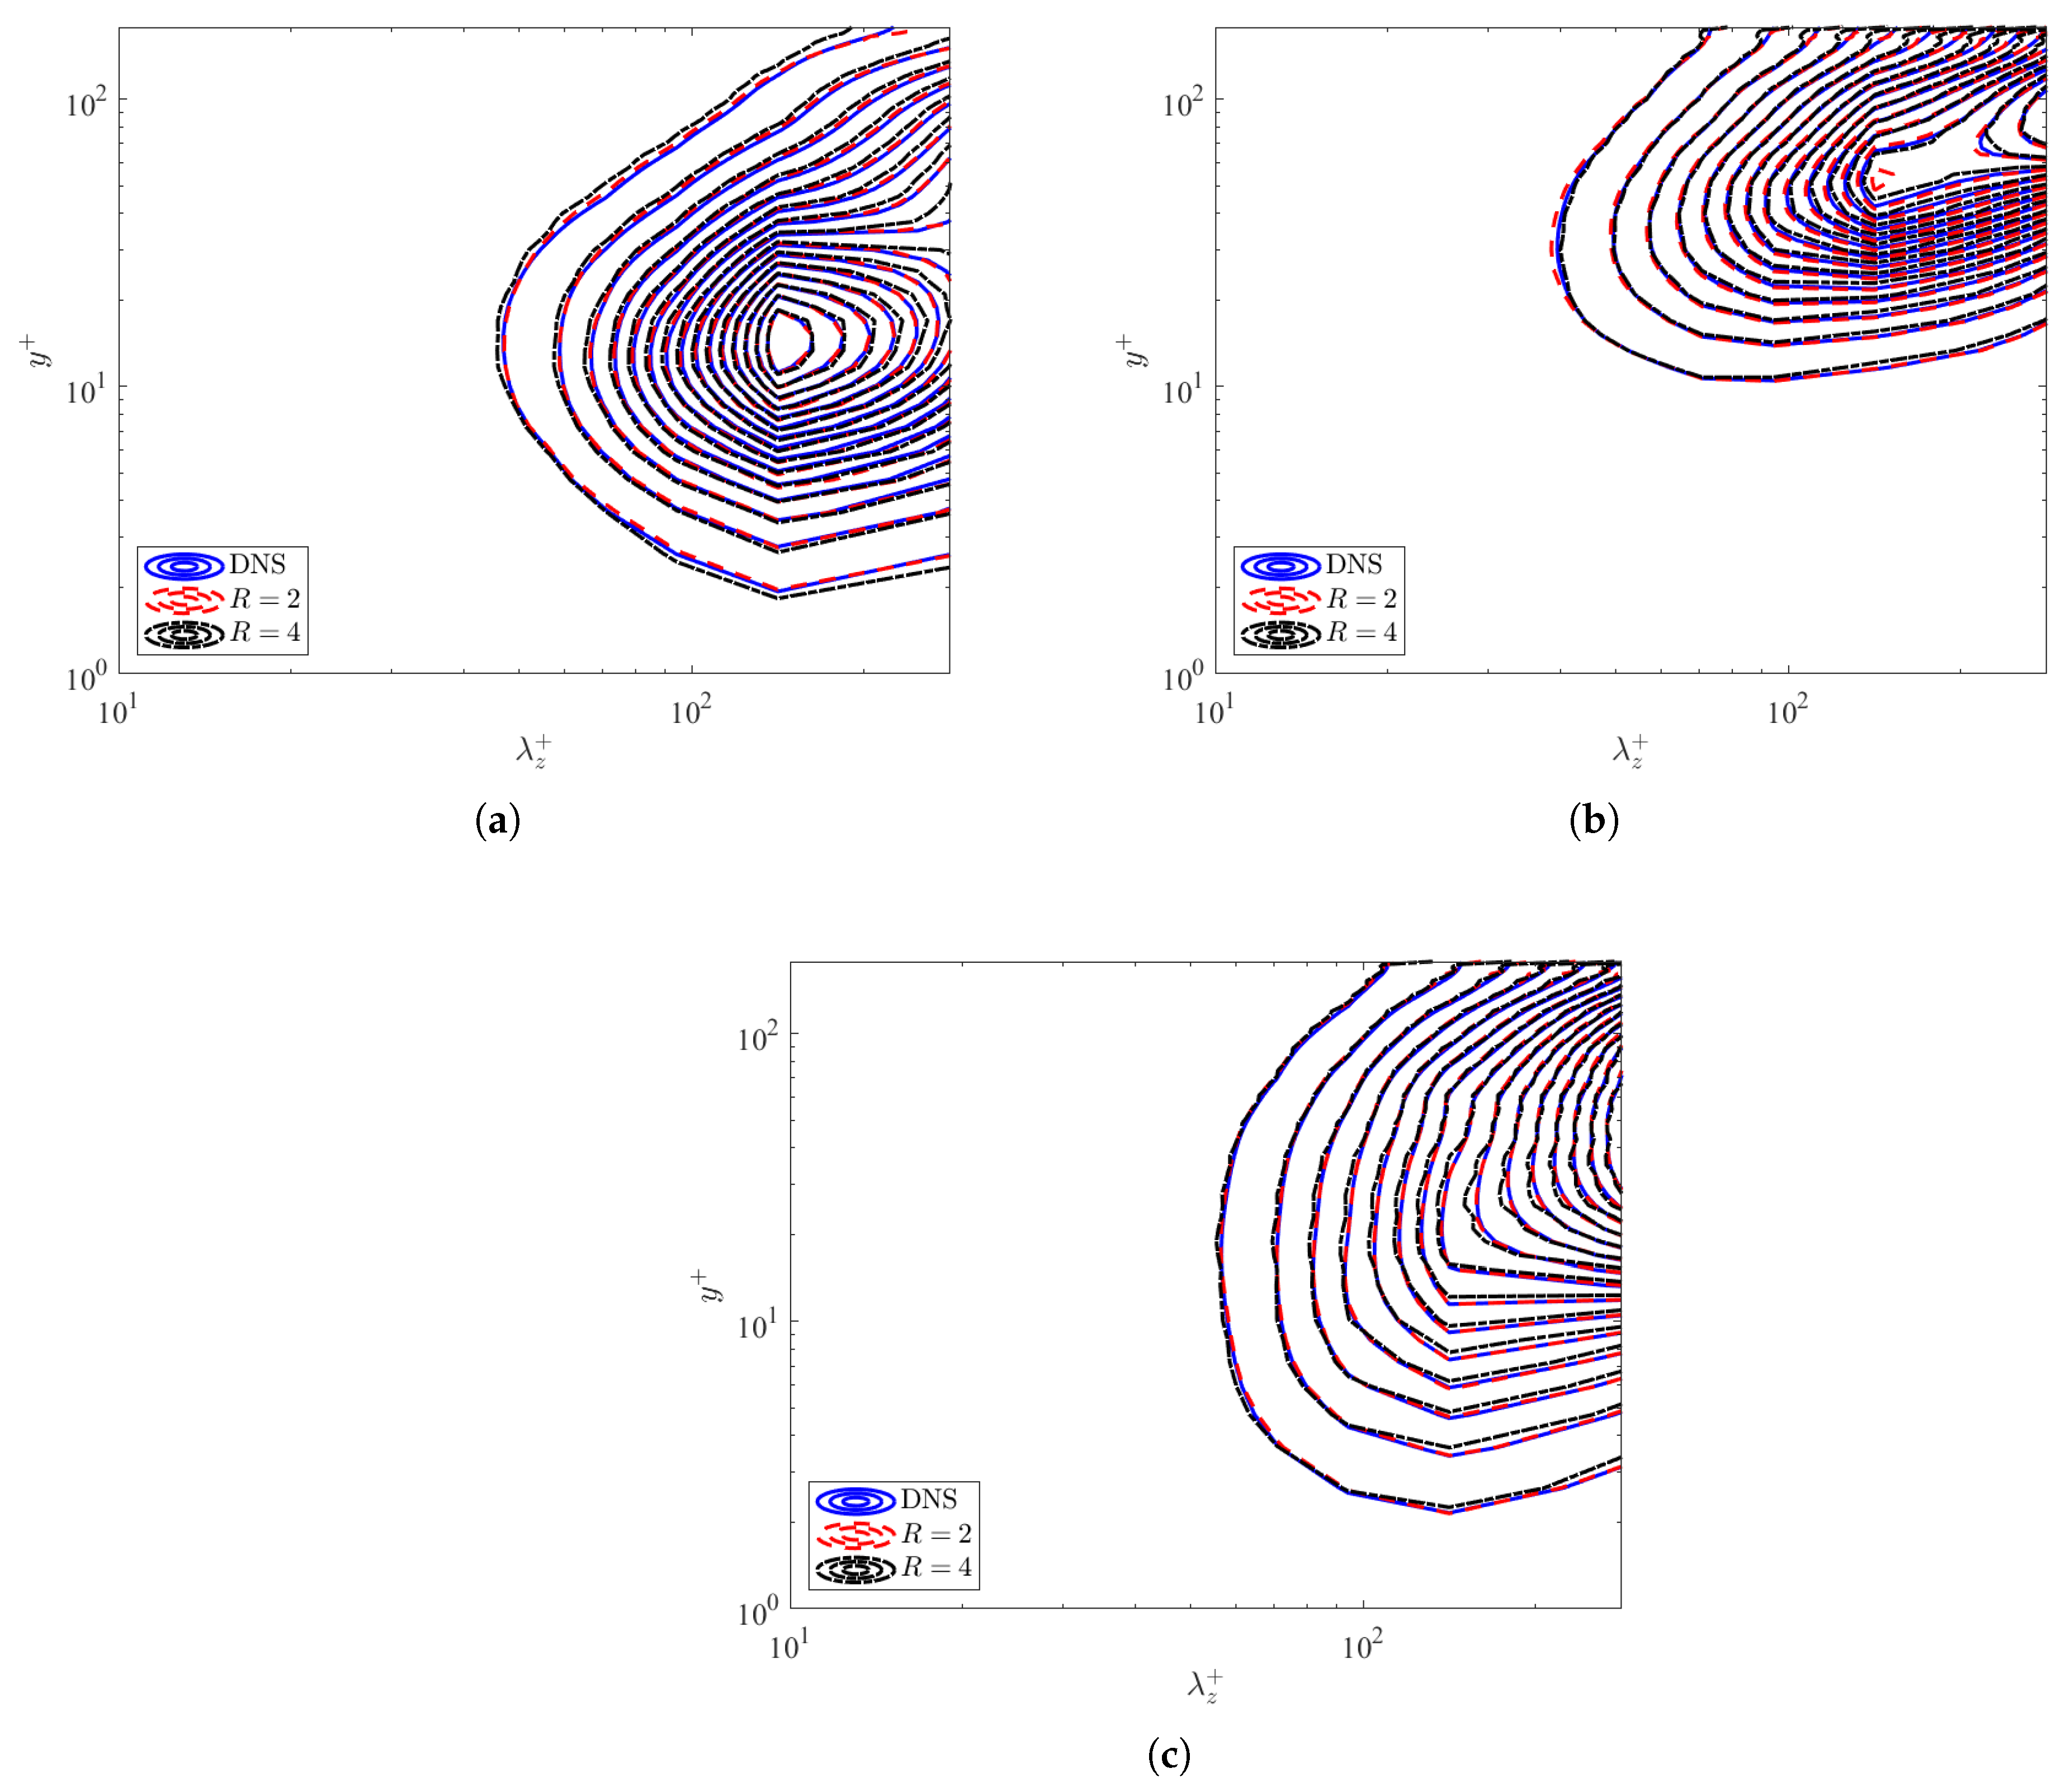
Like the streamwise spectra, the spanwise energy spectra demonstrate the distribution of energy in the spanwise direction at different scales. The spanwise energy spectra for the streamwise, wall-normal, and spanwise velocities are displayed in Figure 8a–c. The large- and small-scale structures are effectively captured in the spanwise direction for the streamwise and wall-normal velocities, as shown in Figure 8a,b. Unlike the streamwise spectra, the spanwise energy spectra for the streamwise velocity in Figure 8a occurs at , which corresponds to the peak of the turbulent energy production in a turbulent channel [1,4]. However, the large-scale structures in the buffer and log-law layer region of the channel are not as effectively captured in Figure 8 because of possible boundary artifacts affecting the energy distributions at the channel center.
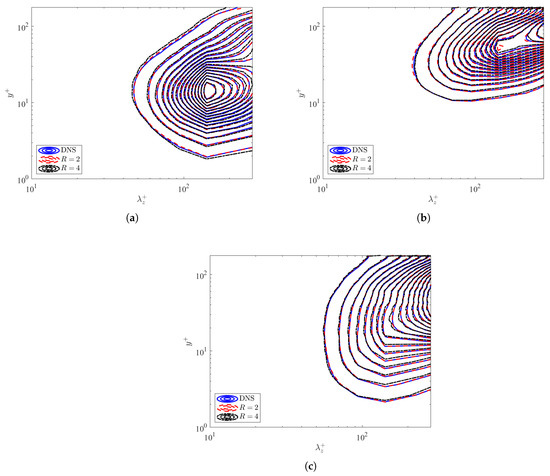
Figure 8.
Premultiplied spanwise energy spectra as a function of wall-normal position and wavenumber for both the DNS and predicted data from the GAN: (a) , (b) , and (c) .
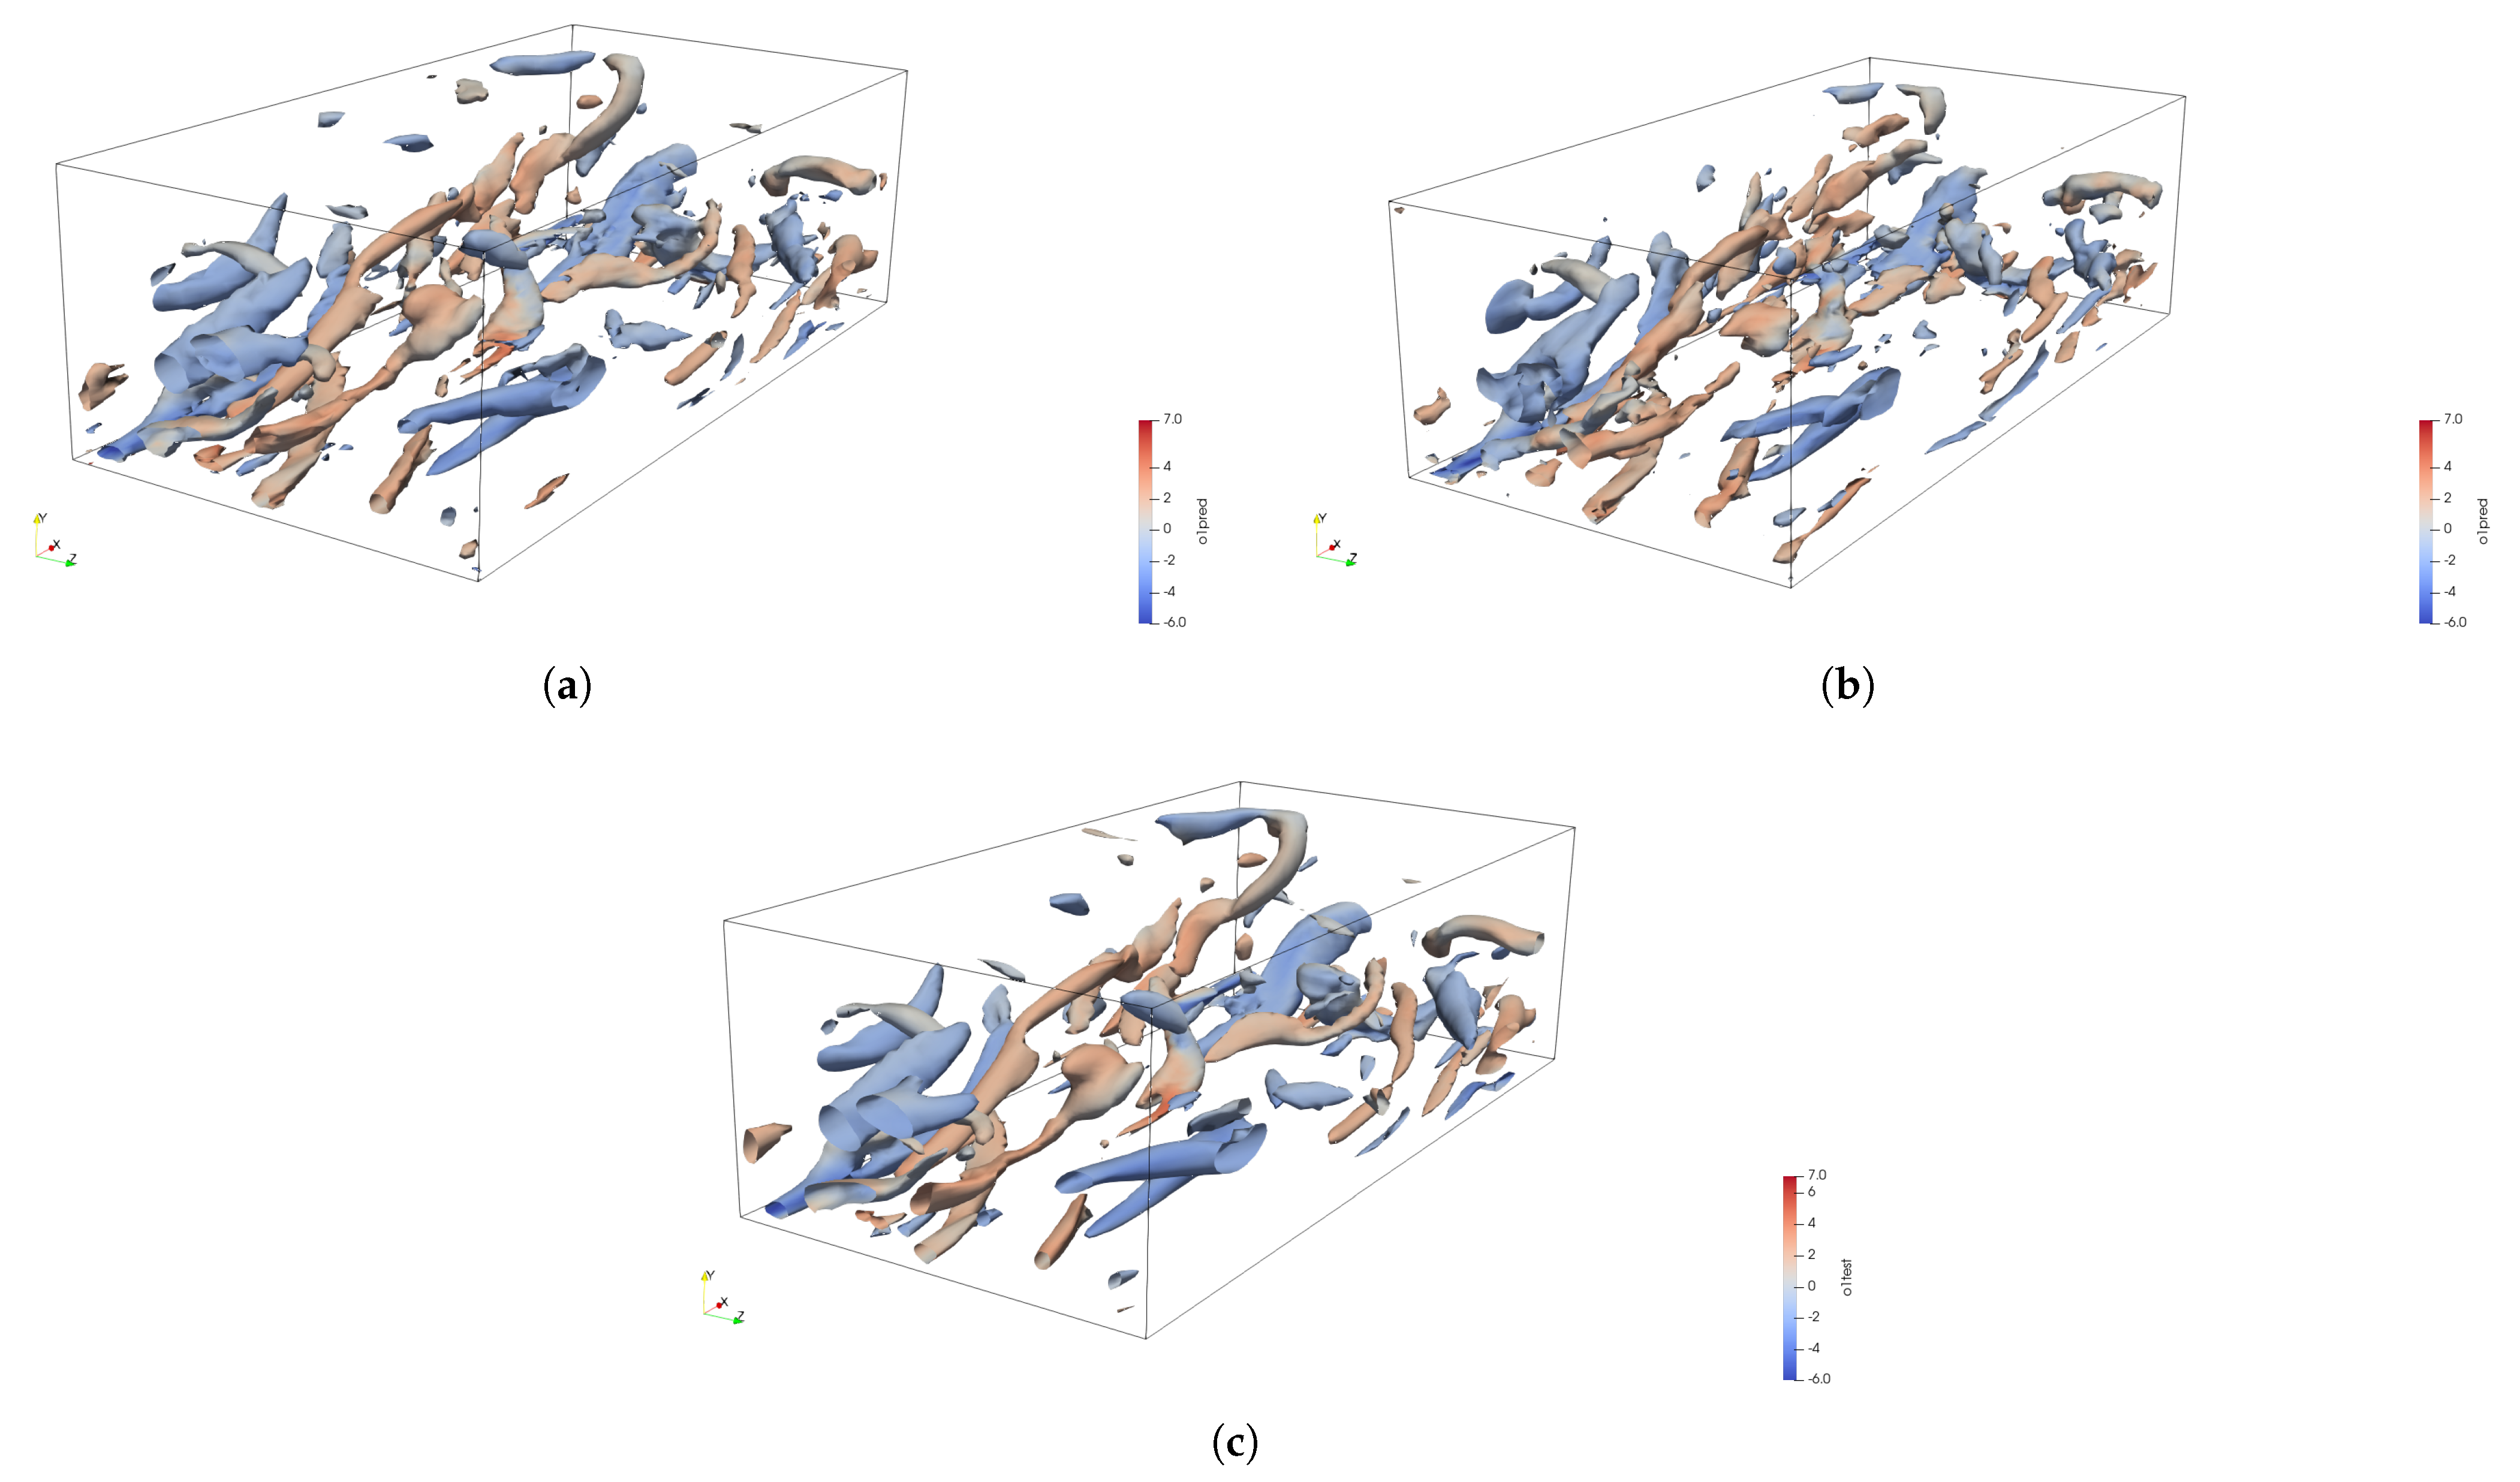
The instantaneous structures are displayed in Figure 9. The structures constructed by the GAN at and are shown in Figure 9a and Figure 9b, respectively, while the DNS data are shown in Figure 9c. For reference, the turbulent structures are colored with respect to the streamwise vorticity . For each of the resolution ratios considered, the GAN is able to accurately reconstruct the large- and small-scale turbulent structures in the channel. Based on the high-resolution dataset size, it can be determined that the resolution ratio is the lowest input resolution dataset that can be utilized in the GAN model in order to generate both the large and small scales of the turbulence in the channel. For resolution ratios , such as , too much information loss has occurred between the input and output datasets, so that accurate recovery for this channel flow configuration is not accomplished.
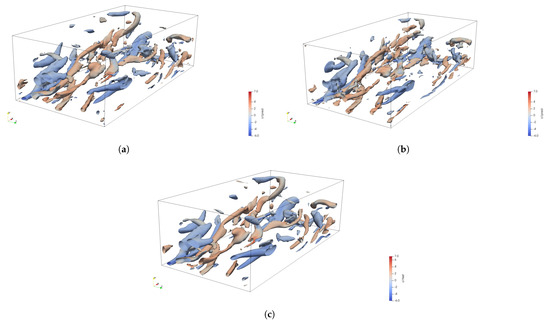
Figure 9.
Instantaneous turbulent structures in the bottom half of the channel for : (a) GAN (), (b) GAN (), and (c) DNS.
4. Conclusions
This work sought to effectively reconstruct high-resolution 3D turbulent flow fields using unsupervised physics-informed deep learning. In particular, by combining physics-informed loss functions with other data-driven techniques, the GAN was able to reconstruct a turbulent channel flow dataset without the need for introducing any additional supervised learning, such as interpolation, to the input dataset. The first objective of this study was to reconstruct turbulent channel flow fields and verify these with respect to the statistics. It is demonstrated that the velocity profiles are able to be captured by the GAN within 5% of the DNS data instantaneously at the channel center. The GAN model is also able to capture each component of the velocity mean and fluctuations within 2% of the DNS data at the same Reynolds number. Additionally, for both resolution ratio cases, the predicted Reynolds stresses were predicted within 5–10% of the DNS data. This meant that the GAN was able to capture the general behavior of the turbulent channel flow, as well as recover most of the total turbulent fluctuations. The second objective was to compare the turbulent flow structures generated from the GAN with the DNS. In order to compare the turbulent flow structures, the general information about the vorticity, energy spectrum, and the vortex identifier needed to be determined. The GAN was able to accurately predict the vorticity fluctuations in the channel which indicated how effective the GAN was at determining the asymmetric components of the velocity gradient tensor. In addition, both the symmetric and asymmetric components of the velocity gradient were tested using the vortex identifier, and the GAN was able to predict those well at both resolution ratios. Then, to determine whether or not the large- and small-scale structures were captured, the energy spectra and the instantaneous structures were reconstructed. The GAN was able to effectively reconstruct both the large- and small-scale turbulent structures at each wall-normal position.
A GAN model trained on flow field data can potentially be used for other flow field calculations, such as HIT, turbulent boundary layers, and pipe flows. The primary purpose of GANs is to generate new data that is similar to the training data, so if the GAN has learned to accurately generate flow field data, then it could be used to generate new flow field data for other applications. However, it is important to note that the accuracy and generalizability of the GAN model will depend on the quality and diversity of the training data. If the training data does not represent a wide range of flow field scenarios, then the GAN may not be able to accurately generate new flow field data for other applications. Furthermore, it is important to carefully evaluate the performance of the GAN-generated flow field data for other applications, as it may not be as accurate or reliable as actual experimental or simulation data. Therefore, while a GAN model trained on flow field data may have potential uses in other applications, it should be used with caution and its performance should be carefully evaluated.
Funding
This research received no external funding.
Data Availability Statement
The data presented, as well as the code developed in this study are available on request from the corresponding author.
Acknowledgments
The author appreciates Prof. Stephen Ekwaro-Osire and Prof. Fazle Hussain for helpful discussion related to this study. The author thanks Prof. Ekwaro-Osire for reading the final version of the manuscript. Computational resources provided by the Texas Tech University High-Performance Computing Center are acknowledged.
Conflicts of Interest
The author declares no conflict of interest.
References
- Kim, J.; Moin, P.; Moser, R. Turbulence statistics in fully developed channel flow at low Reynolds number. J. Fluid Mech. 1987, 177, 133–166. [Google Scholar] [CrossRef]
- Jiménez, J.; Moin, P. The minimal flow unit in near-wall turbulence. J. Fluid Mech. 1991, 225, 213–240. [Google Scholar] [CrossRef]
- Moser, R.D.; Kim, J.; Mansour, N.N. Direct numerical simulation of turbulent channel flow up to Reτ = 590. Phys. Fluids 1999, 11, 943–945. [Google Scholar] [CrossRef]
- Kim, K.C.; Adrian, R.J. Very large-scale motion in the outer layer. Phys. Fluids 1999, 11, 417–422. [Google Scholar] [CrossRef]
- Lee, M.; Moser, R.D. Direct numerical simulation of turbulent channel flow up to Reτ≈ 5200. J. Fluid Mech. 2015, 774, 395–415. [Google Scholar] [CrossRef]
- Jeong, J.; Hussain, F. On the identification of a vortex. J. Fluid Mech. 1995, 285, 69–94. [Google Scholar] [CrossRef]
- Jeong, J.; Hussain, F.; Schoppa, W.; Kim, J. Coherent structures near the wall in a turbulent channel flow. J. Fluid Mech. 1997, 332, 185–214. [Google Scholar] [CrossRef]
- Schoppa, W.; Hussain, F. Coherent structure dynamics in near-wall turbulence. Fluid Dyn. Res. 2000, 26, 119–139. [Google Scholar] [CrossRef]
- Schoppa, W.; Hussain, F. Coherent structure generation in near-wall turbulence. J. Fluid Mech. 2002, 453, 57–108. [Google Scholar] [CrossRef]
- Hutchins, N.; Marusic, I. Large-scale influences in near-wall turbulence. Philos. Trans. R. Soc. A Math. Phys. Eng. Sci. 2007, 365, 647–664. [Google Scholar] [CrossRef]
- Hutchins, N.; Marusic, I. Evidence of very long meandering features in the logarithmic region of turbulent boundary layers. J. Fluid Mech. 2007, 579, 1–28. [Google Scholar] [CrossRef]
- Jiménez, J. Near-wall turbulence. Phys. Fluids 2013, 25, 101302. [Google Scholar] [CrossRef]
- Jiménez, J. Coherent structures in wall-bounded turbulence. J. Fluid Mech. 2018, 842, P1. [Google Scholar] [CrossRef]
- Brunton, S.L.; Noack, B.R.; Koumoutsakos, P. Machine Learning for Fluid Mechanics. Annu. Rev. Fluid Mech. 2020, 52, 477–508. [Google Scholar] [CrossRef]
- Tabor, G.R.; Baba-Ahmadi, M.H. Inlet conditions for large eddy simulation: A review. Comput. Fluids 2009, 39, 553–567. [Google Scholar] [CrossRef]
- Wu, X. Inflow Turbulence Generation Methods. Annu. Rev. Fluid Mech. 2017, 49, 23–49. [Google Scholar] [CrossRef]
- Fukami, K.; Fukagata, K.; Taira, K. Super-resolution reconstruction of turbulent flows with machine learning. J. Fluid Mech. 2019, 870, 106–120. [Google Scholar] [CrossRef]
- Maulik, R.; Sharma, H.; Patel, S.; Lusch, B.; Jennings, E. Accelerating RANS turbulence modeling using potential flow and machine learning. arXiv 2019, arXiv:1910.10878. [Google Scholar]
- Kim, J.; Lee, C. Prediction of turbulent heat transfer using convolutional neural networks. J. Fluid Mech. 2020, 882, 1–37. [Google Scholar] [CrossRef]
- Liu, B.; Tang, J.; Huang, H.; Lu, X.Y. Deep learning methods for super-resolution reconstruction of turbulent flows. Phys. Fluids 2020, 32, 025105. [Google Scholar] [CrossRef]
- Fukami, K.; Fukagata, K.; Taira, K. Assessment of supervised machine learning methods for fluid flows. Theor. Comput. Fluid Dyn. 2020, 34, 497–519. [Google Scholar] [CrossRef]
- Kim, H.; Kim, J.; Won, S.; Lee, C. Unsupervised deep learning for super-resolution reconstruction of turbulence. J. Fluid Mech. 2021, 910, A29. [Google Scholar] [CrossRef]
- Raissi, M.; Karniadakis, G.E. Hidden physics models: Machine learning of nonlinear partial differential equations. J. Comput. Phys. 2018, 357, 125–141. [Google Scholar] [CrossRef]
- Raissi, M.; Perdikaris, P.; Karniadakis, G.E. Physics-informed neural networks: A deep learning framework for solving forward and inverse problems involving nonlinear partial differential equations. J. Comput. Phys. 2019, 378, 686–707. [Google Scholar] [CrossRef]
- Yousif, M.Z.; Yu, L.; Lim, H.; Yousif, M.Z.; Yu, L.; Lim, H.C. Physics-guided deep learning for generating turbulent inflow conditions. J. Fluid Mech. 2022, 936, A21. [Google Scholar] [CrossRef]
- Sachin Venkatesh, T.S.; Srivastava, R.; Bhatt, P.; Singh, R.K. A Comparative Study of Various Deep Learning Techniques For Spatio-Temporal Super-Resolution Reconstruction of Forced Isotropic Turbulent Flows. In Proceedings of the ASME 2021 International Mechanical Engineering Congress and Exposition, Online, 1–5 November 2021. [Google Scholar]
- Bode, M.; Gauding, M.; Lian, Z.; Denker, D.; Davidovic, M.; Kleinheinz, K.; Jitsev, J.; Pitsch, H. Using physics-informed enhanced super-resolution generative adversarial networks for subfilter modeling in turbulent reactive flows. Proc. Combust. Inst. 2021, 38, 2617–2625. [Google Scholar] [CrossRef]
- Yousif, M.Z.; Yu, L.; Lim, H.C. Super-resolution reconstruction of turbulent flow at various Reynolds numbers based on generative adversarial networks. arXiv 2021, arXiv:2110.05047v1. [Google Scholar] [CrossRef]
- Yousif, M.Z.; Yu, L.; Lim, H.C. High-fidelity reconstruction of turbulent flow from spatially limited data using enhanced super-resolution generative adversarial network. arXiv 2021, arXiv:2109.04250v2. [Google Scholar] [CrossRef]
- Eivazi, H.; Vinuesa, R. Physics-informed deep-learning applications to experimental fluid mechanics. arXiv 2022, arXiv:2203.15402v1. [Google Scholar]
- Du, Y.; Wang, M.; Zaki, T.A. State estimation in minimal turbulent channel flow: A comparative study of 4DVar and PINN. arXiv 2022, arXiv:2210.09424. [Google Scholar] [CrossRef]
- Linqi, Y.; Yousif, M.Z.; Zhang, M.; Hoyas, S.; Vinuesa, R.; Lim, H.C. Three-dimensional ESRGAN for super-resolution reconstruction of turbulent flows with tricubic interpolation-based transfer learning. Phys. Fluids 2022, 34, 125126. [Google Scholar] [CrossRef]
- Radford, A.; Metz, L.; Chintala, S. Unsupervised Representation Learning with Deep Convolutional Generative Adversarial Networks. arXiv 2016, arXiv:1511.06434v2. [Google Scholar]
- Zhu, J.Y.; Park, T.; Isola, P.; Efros, A.A. Unpaired Image-to-Image Translation using Cycle-Consistent Adversarial Networks. In Proceedings of the IEEE International Conference on Computer Vision, Venice, Italy, 22–29 October 2017; Institute of Electrical and Electronics Engineers Inc.: Piscataway, NJ, USA, 2017; pp. 2242–2251. [Google Scholar] [CrossRef]
- Gulrajani, I.; Ahmed, F.; Arjovsky, M.; Dumoulin, V.; Courville, A. Improved Training of Wasserstein GANs. arXiv 2017, arXiv:1704.00028v3. [Google Scholar]
- Zheng, T.; Oda, H.; Hayashi, Y.; Moriya, T.; Nakamura, S.; Mori, M.; Takabatake, H.; Natori, H.; Oda, M.; Mori, K. SR-CycleGAN: Super-resolution of clinical CT to micro-CT level with multi-modality super-resolution loss. J. Med. Imaging 2022, 9, 024003. [Google Scholar] [CrossRef] [PubMed]
- Wu, J.L.; Kashinath, K.; Albert, A.; Chirila, D.; Xiao, H. Enforcing Statistical Constraints in Generative Adversarial Networks for Modeling Chaotic Dynamical Systems. J. Comput. Phys. 2020, 406, 109209. [Google Scholar] [CrossRef]
- Wang, Z.; Bovik, A.C.; Sheikh, H.R.; Simoncelli, E.P. Image quality assessment: From error visibility to structural similarity. IEEE Trans. Image Process. 2004, 13, 600–612. [Google Scholar] [CrossRef] [PubMed]
- Tieleman, T.; Hinton, G. RMSProp: Divide the Gradient by a Running Average of Its Recent Magnitude. COURSERA Neural Netw. Mach. Learn. 2012, 4, 26–31. [Google Scholar]
- Kingma, D.P.; Lei Ba, J. Adam: A method for stochastic optimization. In Proceedings of the International Conference on Learning Representations, San Diego, CA, USA, 7–9 May 2015; pp. 1–15. [Google Scholar]
- Reddi, S.J.; Kale, S.; Kumar, S. On the convergence of Adam and Beyond. In Proceedings of the International Conference on Learning Representations, Vancouver, BC, Canada, 30 April–3 May 2018; pp. 1–23. [Google Scholar]
- Liu, L.; Jiang, H.; He, P.; Chen, W.; Liu, X.; Gao, J.; Han, J. On the Variance of the Adaptive Learning Rate and Beyond. In Proceedings of the Eighth International Conference on Learning Representations (ICLR), Addis Ababa, Ethiopia, 26–30 April 2020. [Google Scholar]
- Miyato, T.; Kataoka, T.; Koyama, M.; Yoshida, Y. Spectral Normalization for Generative Adversarial Networks. In Proceedings of the International Conference on Learning Representations, Vancouver, BC, Canada, 30 April–3 May 2018; pp. 1–26. [Google Scholar]
- Karras, T.; Aila, T.; Laine, S.; Lehtinen, J. Progressive Growing of GANs for Improved Quality, Stability, and Variation. In Proceedings of the 6th International Conference on Learning Representations, ICLR 2018—Conference Track Proceedings. International Conference on Learning Representations, ICLR, Toulon, France, 24–26 April 2017. [Google Scholar]
- Chakraborty, P.; Balachandar, S.; Adrian, R.J. On the relationships between local vortex identification schemes. J. Fluid Mech. 2005, 535, 189–214. [Google Scholar] [CrossRef]
- Liu, C.; Gao, Y.S.; Dong, X.R.; Wang, Y.Q.; Liu, J.M.; Zhang, Y.N.; Cai, X.S.; Gui, N. Third generation of vortex identification methods: Omega and Liutex/Rortex based systems. J. Hydrodyn. 2019, 31, 205–223. [Google Scholar] [CrossRef]
- Hunt, J.C.R.; Wray, A.A.; Moin, P. Eddies, streams, and convergence zones in turbulent flows. In Proceedings of the Studying Turbulence Using Numerical Simulation Databases, 2. Proceedings of the 1988 Summer Program, Stanford, CA, USA, 1 December 1988; pp. 1–16. [Google Scholar]
- Chong, M.S.; Perry, A.E.; Cantwell, B.J. A general classification of three-dimensional flow fields. Phys. Fluids A Fluid Dyn. 1990, 2, 777. [Google Scholar] [CrossRef]
- Dong, X.; Gao, Y.; Liu, C. New normalized Rortex/vortex identification method. Phys. Fluids 2019, 31, 011701. [Google Scholar] [CrossRef]
- Liu, J.; Liu, C. Modified normalized Rortex/vortex identification method. Phys. Fluids 2019, 31, 061704. [Google Scholar] [CrossRef]
Disclaimer/Publisher’s Note: The statements, opinions and data contained in all publications are solely those of the individual author(s) and contributor(s) and not of MDPI and/or the editor(s). MDPI and/or the editor(s) disclaim responsibility for any injury to people or property resulting from any ideas, methods, instructions or products referred to in the content. |
© 2023 by the author. Licensee MDPI, Basel, Switzerland. This article is an open access article distributed under the terms and conditions of the Creative Commons Attribution (CC BY) license (https://creativecommons.org/licenses/by/4.0/).

