Article

Numerical Analysis of Cambered Plate Configurations under Low Reynolds Numbers and at a Low-Density Condition

1
Department of Mechanical Engineering, University of North Texas, Denton, TX 76207, USA
2
Mechanical Engineering Department, South Dakota State University, Brookings, SD 57006, USA
*
Author to whom correspondence should be addressed.
Fluids 2023, 8(7), 194; https://doi.org/10.3390/fluids8070194
Submission received: 22 May 2023 / Revised: 22 June 2023 / Accepted: 23 June 2023 / Published: 27 June 2023

Abstract

:
After one year of operation, the Ingenuity rotorcraft and the Perseverance rover continue their exploration missions on Mars. Succeeding the technology demonstration phase, by proving its flight capabilities, Ingenuity transitioned to a new mission stage to explore modes of flight exploration for future scouting missions. This research intends to analyze, using numerical simulations, the aerodynamic conditions such as those experienced by Ingenuity during its flight missions. For this work, ANSYS Fluent software was used to simulate the flow around the cambered plates, and a three-equation intermittency (γ) shear stress transport turbulence model with compressible formulation was implemented. The influence of the camber and its position for the cambered plates were explored, and a sensitivity analysis with respect to the Mach number was performed. The objective of this project was to determine the optimal configuration to produce the optimal lift-to-drag ratio for the range of analysis. The results were in line with the ones shown by NASA (OVERFLOW). Moreover, this analysis showed the ANSYS Fluent applicability for assessing aerodynamic surfaces for unmanned aerial systems operating at low density and low Reynolds number regimes.

1. Introduction

Unmanned aerial systems (UAS) have been employed for different applications ranging from agriculture, civil, mechanical, and space exploration fields [1,2,3,4,5,6,7,8,9,10,11].
This work intends to explore the airfoil shapes aerodynamic performance under Martian conditions to improve the range or increase the payload of rotary wing UAS. Notably, such effort was inspired by the sequence of NASA’s exploratory missions. The 2020 Mars Mission was deployed in July 2020, and the Ingenuity Mars Helicopter (MH) and the perseverance rover landed on Mars on February 2021. The first flight of the MH took place in April of that year, proving atmospheric vertical flight on an extraterrestrial planet. One year after that, the Ingenuity rotorcraft achieved over fifteen flights surpassing its designed endurance and range parameters. The MH was designed to sustain a flight endurance up to 90 s and cover approx. 300 m of range during each deployment at approx. 10 to 4 m above the ground [12].
After the technological demonstration, Ingenuity transitioned into a new operation demonstration phase from the sixth flight onwards, reaching a maximum traveled distance of 625 m and a maximum groundspeed of 5 m/s during flight #9. A maximum altitude of 12 m was reached during fight #10 and the longest operation took place during flight #12, reaching 450 m [13]. According to the Håvard Grip in [14], the flights on Mars are become more challenging as the density on Mars drops below the design point regime of the Ingenuity rotorcraft. In turn, the rotor speed has progressively increased to 2800 rpm, which reflects the drag increment and extra vibration. This flight scenario variability begs the exploration of different aircraft configurations as well as airfoil shapes to deliver improved aerodynamic performance under critical Martian conditions to expand scouting capabilities. Further aerial vehicle initiatives for Mars exploration include the Mars science helicopter (MSH) and the Advanced Mars Helicopter (AMH), among others described in [15,16,17,18]. Similarly, the Dragonfly rotorcraft is expected to achieve the same endeavors as Ingenuity by the mid-2030s, but on Titan, the largest moon of Saturn [4].
Mars presents atmospheric conditions that vary rapidly depending on the location, altitude, and season of the planet. The air density is about 1% of the average density on Earth, consequently causing a reduced lift generation when using the same aerodynamic surfaces and rotor speeds that suffice on Earth [19]. Figure 1 shows a color scale of the density (left) and temperature (right) during the Martian summer at noon at 10 m over the surface. The range of variation is summarized in Table 1, alongside the additional atmospheric properties [20,21].
The challenge of lift generation due to thin air (low density) can be summarily addressed by using larger aerodynamic surfaces and/or by increasing the rotational speed. Obviously, this approach reflects a higher electrical power need and, in turn, an increased weight for the onboard batteries. Additionally, due to the thin atmosphere, the speed of sound on Mars is reduced compared to Earth (Table 1), thereby reaching critical Mach numbers earlier in the proximity of the tips of the blades for relatively high rotational speeds when compared to standard conditions [16]. The lift generation becomes a tradeoff between the size of the blade’s surfaces and the rotational speed of the rotors. Ultimately, both approaches describe a low Reynolds number flow regime where the velocities over the blades roughly approximate to sonic conditions closer to the blade’s tip.
In this research effort, we aimed to develop a framework to perform a numerical analysis and assess the airfoil performance that would enable a sensitivity analysis for the variation of the critical sizing parameters under different conditions on Mars. In this work, the influence of the camber height and the location of the camber height (f and xc, respectively) of the cambered plates were explored by varying f between a 3% to 7% chord distance and three different values of xc (30%, 50%, and 70% of the chord distance). The analyzed Mach number stations were M = 0.2 and M = 0.5. Ultimately, our goal is to provide an assessment of the lift-to-drag ratio performance and provide insight into the applicability of the ANSYS Fluent formulations that were used to simulate these scenarios to establish a baseline for further analysis.

2. Methodology

For the case of Mars atmospheric flight, the propellers of small-size rotorcraft operate within a very low Reynolds number (Re ≈ 103–104). The air composition, density, temperature, and rotor operation (Up to 2800 RPM) reflect the transonic flow at the tip of the blade, which might transition into a sonic flow with a large drag wake.
Under these atmospheric conditions, the boundary layer (BL) over the blade’s surface may separate toward the trailing edge (TE) with no reattachment, consequently promoting a larger pressure drag [22,23,24]. A higher angle of attack (AoA) will lead to separated BL closer to the leading edge (LE). After the separation of the BL, the flow may experience unsteady flow and recirculation, allowing for the BL reattachment while generating a laminar separation bubble (LSB). The reattachment may occur due to turbulent transition as well. A more extended explanation of the BL configuration in a large range of Reynolds numbers is given by Koning et al. [23,24].
These changes over the aerodynamic performances of the airfoil sections were simulated using a Reynolds-averaged Navier–Stokes (RANS) formulation with the use of the commercial multiphysics solution software ANSYS Fluent.

2.1. Governing Equations

Turbulent modeling is commonly described using RANS formulations due to its easier implementation and low to moderate computational cost when compared to large eddy scale models (LES) and direct numerical simulations (DNS). Turbulent modeling formulation begins by considering the flow properties as a combination of a time mean quantity and a turbulent fluctuating component [25]. This yields to Equations (1) and (2), as shown below. Notably, the third component in the right part of the momentum equation (Equation (2)) is known as the Reynolds stress tensor, which needs to be modeled to solve this system of equations.
Continuity Equation (Cartesian Tensor form):
ρ t + x i ρ u i = 0 ; w h e r e   i = 1,2 , 3 .
Momentum Equation (Cartesian Tensor form):
t ρ u i + x j ρ u i u j = p x i + x j μ u i x j + u j x i 2 3 δ i j u l x l + x j ρ u i u j ; ( i = 1 , 2 , 3 ;   j = 1 , 2 , 3 ;   l = 1 , 2 , 3 ;   i j l ) .
Energy Equation:
t ρ E + . v ρ E + p = . k e f f T j h j J j + τ ¯ e f f . v + S h
In addition to the continuity and momentum equations, ANSYS Fluent uses the energy equation in the form of Equation (3), where k e f f is the effective conductivity and J j is the diffusion flux of the species j. The first three terms on the right-hand side of Equation (3) represent the energy due to conduction, species diffusion, and viscous dissipation, respectively, and S h includes the heat of the chemical reactions and any other volumetric heat sources. For the case of this work, no species diffusion or chemical reactions were considered. Therefore, J j and S h were considered to be zero.
The Reynolds stress tensor is commonly solved using the Boussinesq approximation [26] by expressing it in terms of two new variables, k, the turbulent kinetic energy, and vt, the turbulent eddy viscosity. A numerical analysis was, therefore, carried out by solving for k and vt using different turbulence models to approximate these quantities. One-equation and two-equation turbulence models were not appropriate for low-Reynolds flow modeling ( R e ~ 10 5 ) due to their inability to model the transition from a laminar to a turbulent flow [27,28,29].
In general, the Spalart–Allmaras (SA) and regular k−ω shear stress transport (SST) models were not appropriate for low-Reynolds flow modeling (Re~105) due to their inability to model the transition from a laminar to a turbulent flow [28,29,30]. In consequence, to confidently simulate the pressure gradients, separated flows, possible flow regime transition or LSB, and leading-edge vortex (LEV) formation, the three-equation intermittency (γ) shear stress transport (SST) model with a low Reynolds correction was used. The low-Reynolds intermittency (γ) SST model coupled the equations solved in the k−ω SST model (the turbulent kinetic energy, k, and the turbulent mean frequency or specific dissipation rate, ω) with an additional equation for the intermittency, γ . The descriptions of these models are available in ANSYS Fluent and the parameters used to solve the system of differential equations are given in the ANSYS Fluent theory guide [31]. The numerical comparison between the turbulence models is provided in [27,28,30,32].

2.2. Model Verification

To complement the efforts made by NASA to develop and improve the Ingenuity rotorcraft, this work used the Mars condition 2 (MC2), which is summarized and compared with the Earth sea level (ESL) properties in Table 2. The MC2 was also used in [12,18,23,24,33,34,35,36].
The geometry used for the solver selection and subsequent model validation is shown in Figure 2: a cambered plate with a chord length c; a camber of 5% of the chord length, f, located at 50% of the chord length, xc; and thickness of 1% of the chord length with a beveled leading edge (bottom surface) of 20% of the chord length.
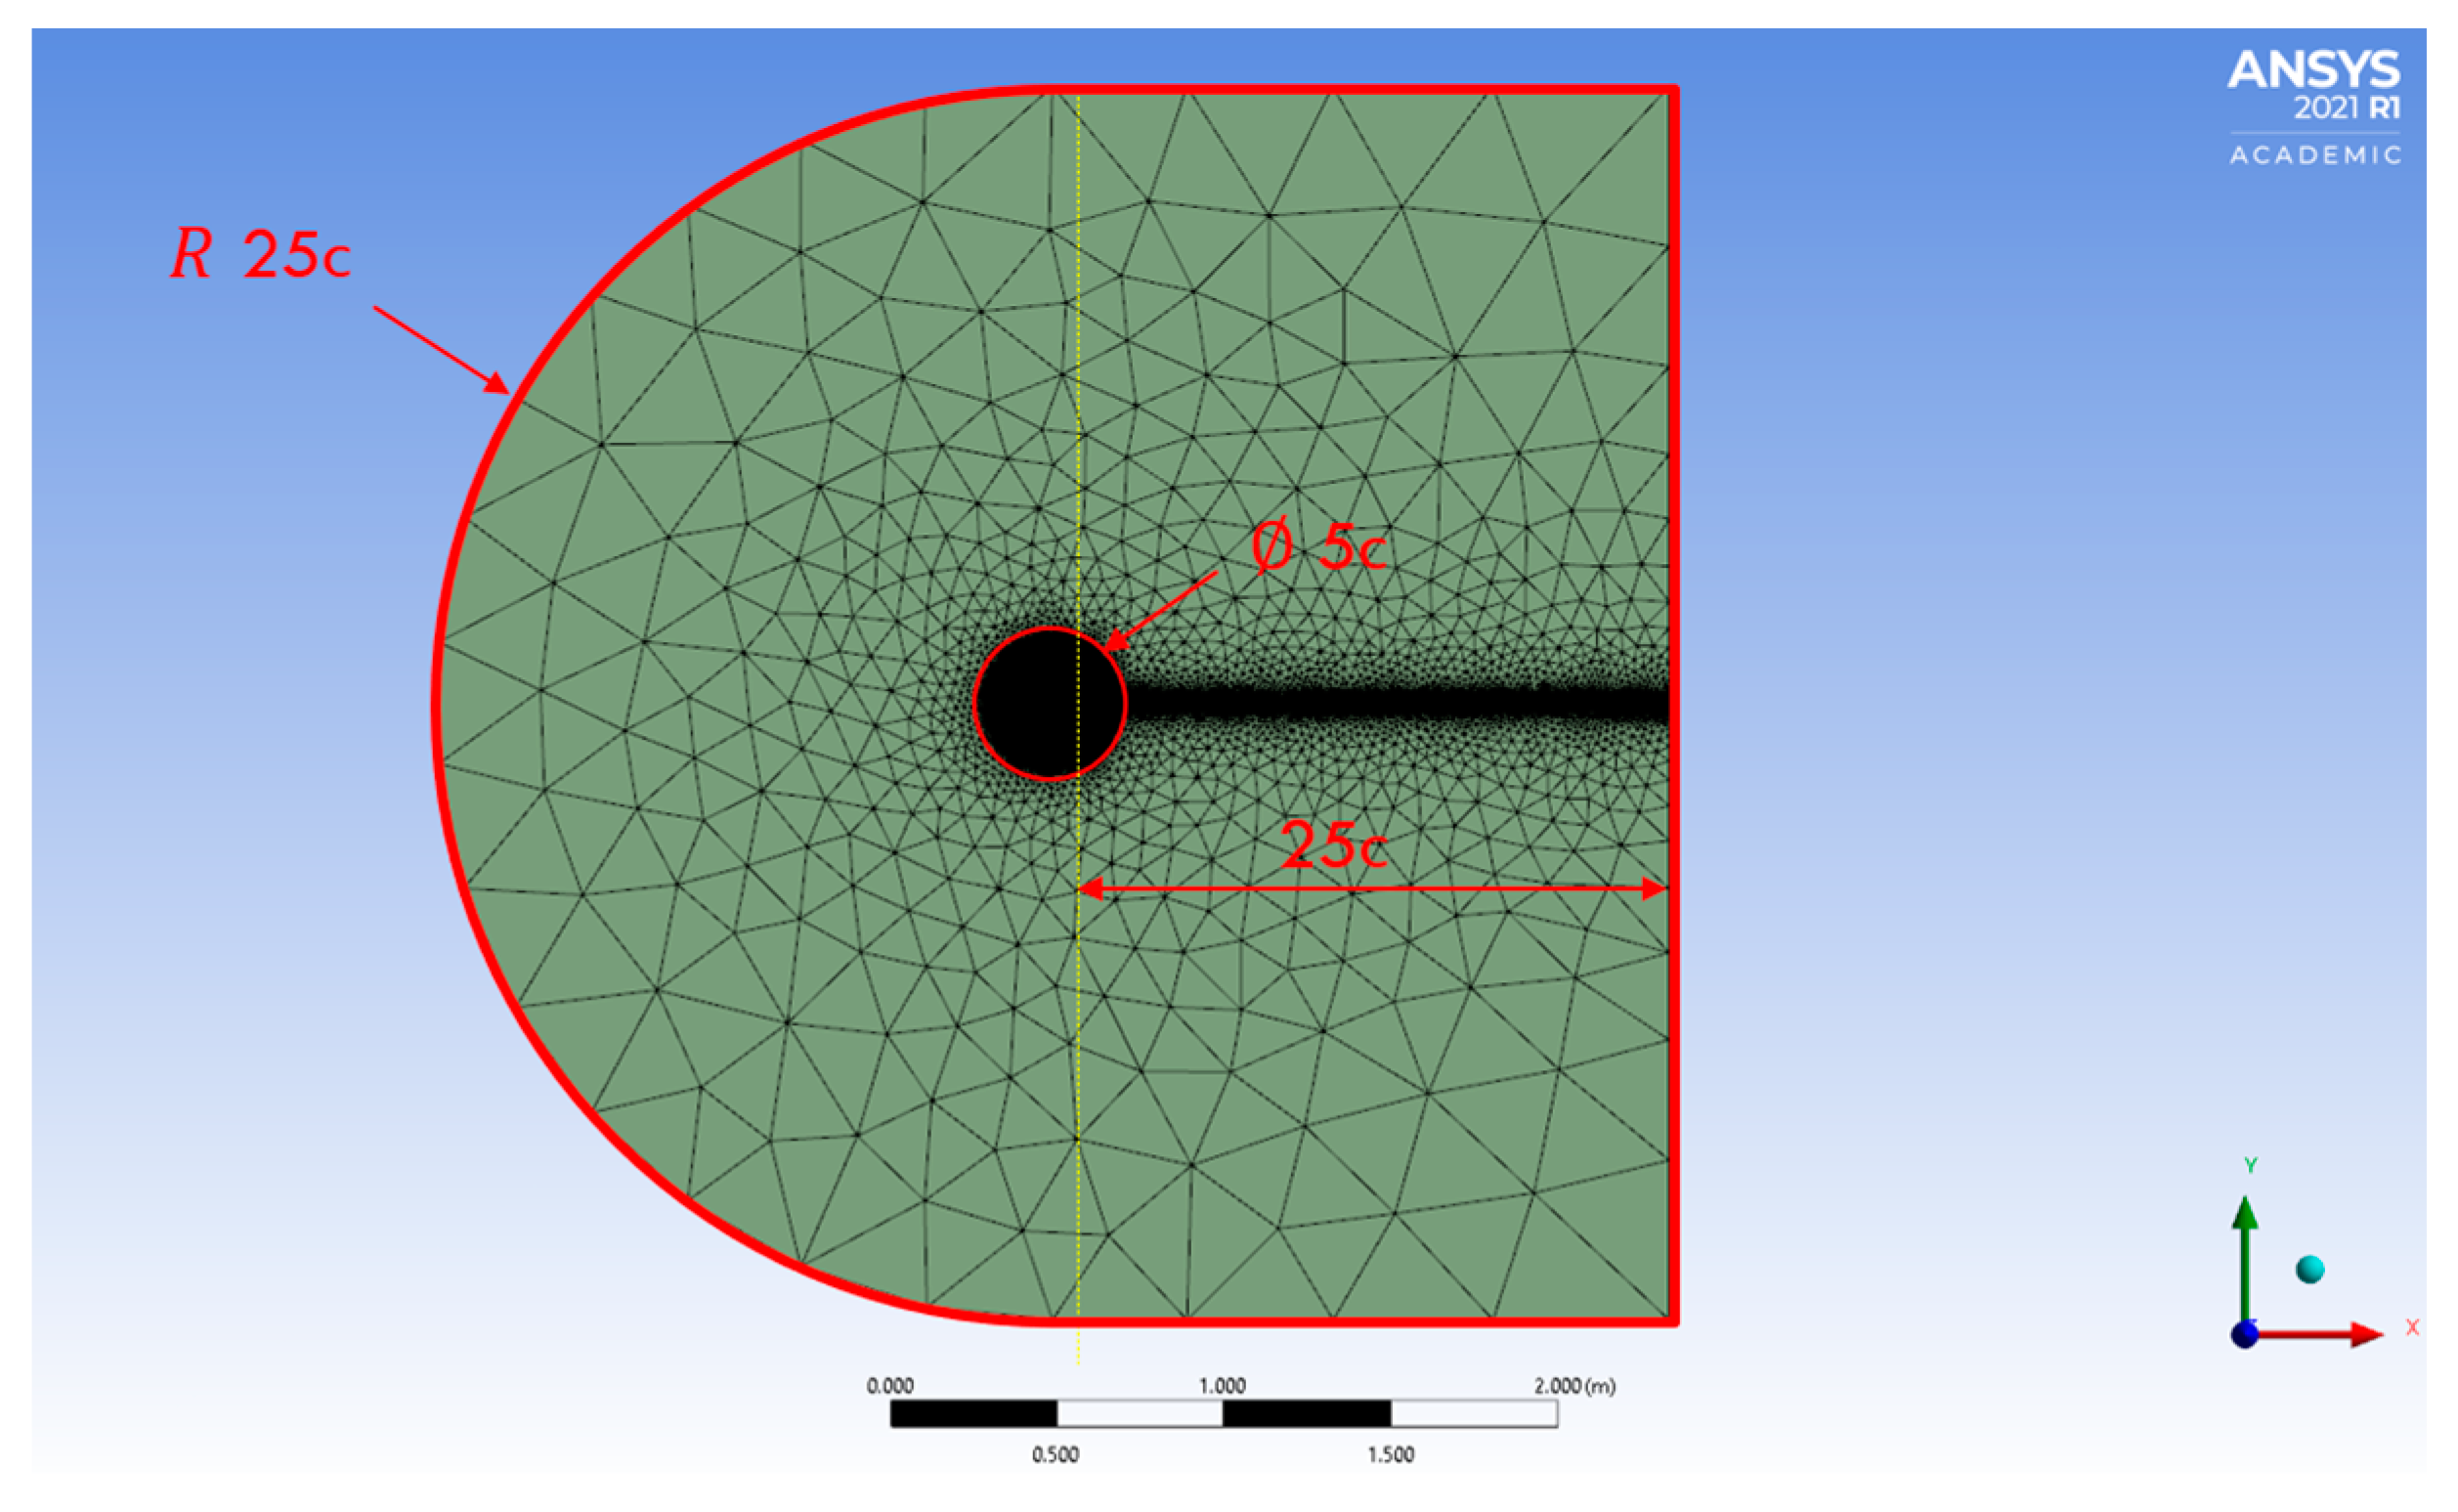
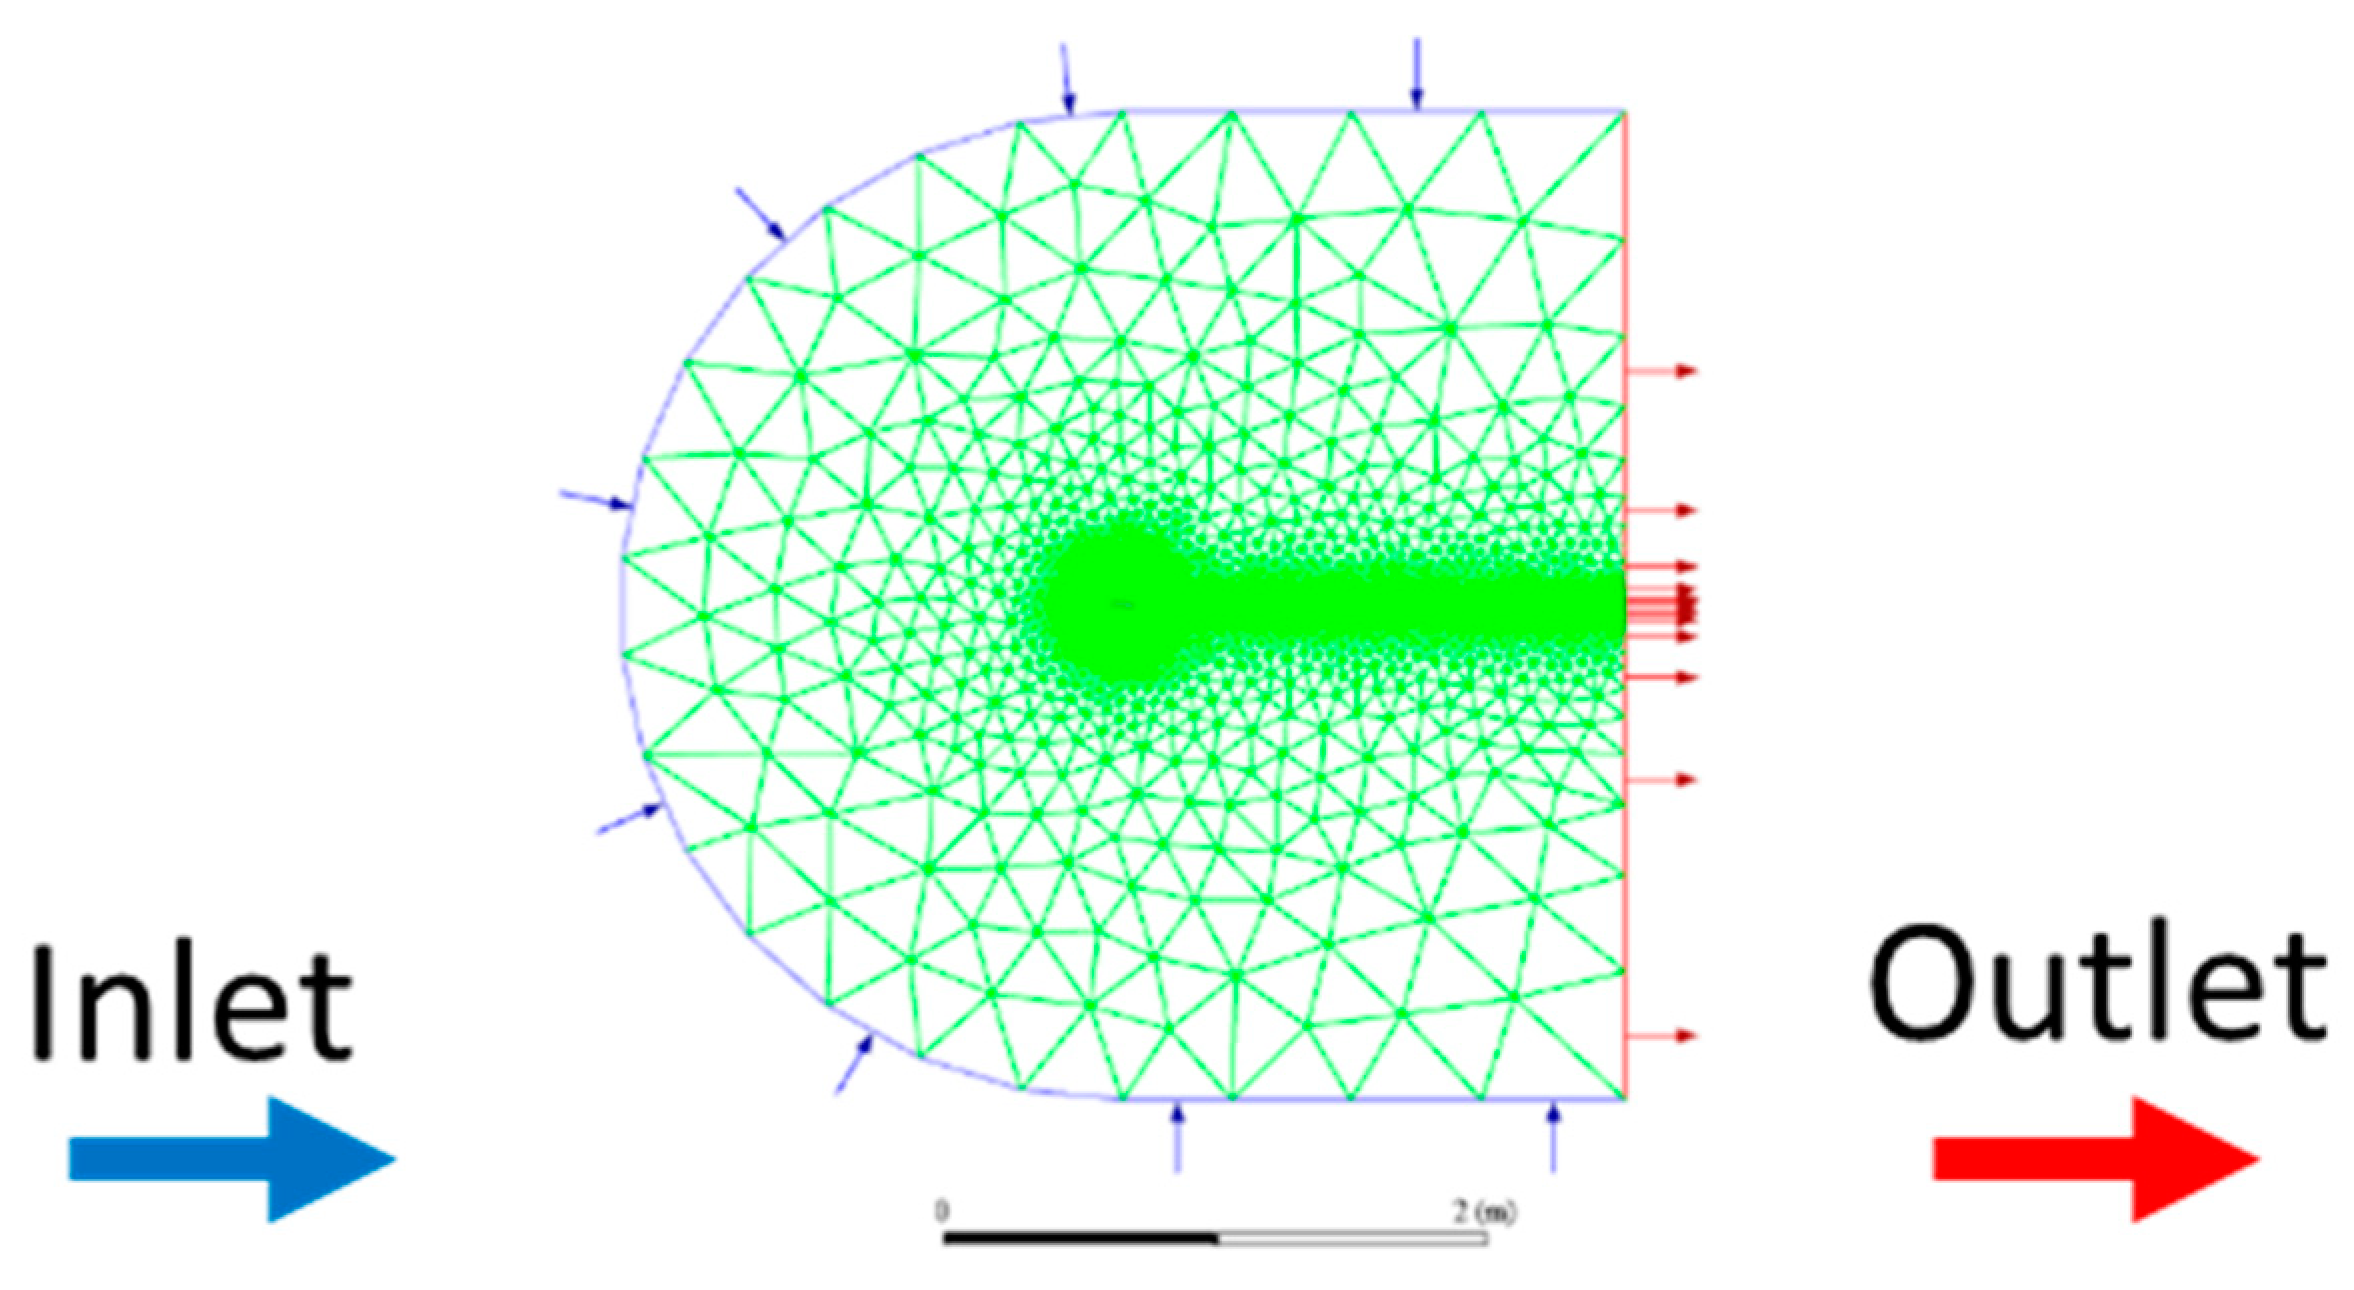
Due to the lack of experimental data under Mars atmospheric conditions, in an effort to validate the results obtained using ANSYS Fluent, only the numerical results were cross validated. The numerical data using the same Martian atmospheric conditions in [17] (cambered plate airfoil lift and drag characteristics (Re/M = 26,000)) were used. The flow velocity used (116.77 m/s) yielded a Mach number of 0.5 and a R e = 1.3 × 10 4 with a c = 74   m m . The flow around the airfoil was discretized using an unstructured C-shape fluid domain with a 25c radius for the inlet arc, 25c for the backward flow, and an inner circle with a diameter of 5c, as shown in Figure 3. The boundary conditions were set, as shown in Figure 4. The same turbulence intensity (TI) consistently used by Koning et al. in their work [23,36,37] was used in the following 2D simulations (TI = 0.082%).
Given the Martian speed of sound of 233 . 55 m s , the inlet velocities used for each station were 46.71 m s ( M = 0.2 ) , 116.77 m s ( M = 0.5 ) , and 163.48 m s ( M = 0.7 ) . These stations were modeled as the flow conditions at specific portions of a rotor blade, as shown in Figure 5. The outlet conditions were set as a zero-gauge pressure. For the inlet boundary conditions, the velocity inlet magnitude was set depending on the Mach number. The supersonic/initial gauge pressure as the outflow gauge pressure was left as zero with a temperature of 223.2 K. The outlet condition used was a pressure outlet with a zero-gauge pressure, a backflow direction that was the same as the boundary, and the same temperature as the inlet. All the wall boundary conditions were set with a no-slip condition with a standard roughness.
A preliminary convergence analysis was conducted at M = 0.5 using a density-based (DB) solver with a steady state formulation to estimate the refinement level required to achieve a dimensionless wall distance that was less than the unity (y+ < 1) to assure the best performance from the turbulence model. To achieve this during all the iterations, y+ was defined in ANSYS Fluent as the facet maximum over the airfoil surfaces, i.e., the suction side, pressure side, and trailing edge. A facet value is an averaged value from two adjacent cells. Therefore, the maximum facet will report the maximum facet value over the entire airfoil.
Two parameters were used to iterate in the grid analysis, the near-wall element size, Δ1 (the suction side, pressure side, and trailing edge), and the element size inside the inner circle, Δ2 (Figure 3 and Figure 6). The outer elements were set with a default element size of 10c and a growth rate of 1.1. The near-wall element size varied between 10−1c to 10−4c. However, when the near-wall element size was Δ1~O−4 c yielded to y+ < 1, then the Δ1 range was focused to 3 × 10 5   m < Δ 1 < 6 × 10 5   m and 0.06   m < Δ 2 < 0.0028   m with a total of 54 mesh combinations. The grid quality of the set of meshes evaluated were analyzed in terms of the averaged element quality, aspect ratio, skewness, and orthogonal quality. These mesh quality values were organized into three groups and summarized in Table 3, i.e., coarse mesh (~100 × 103 elements), medium mesh (~250 × 103 elements), and fine mesh (~500 × 103 elements). From this analysis, Δ1 = 4 × 10⁻⁵ m or smaller resulted in a consistent y+ < 1 for all the mesh groups.
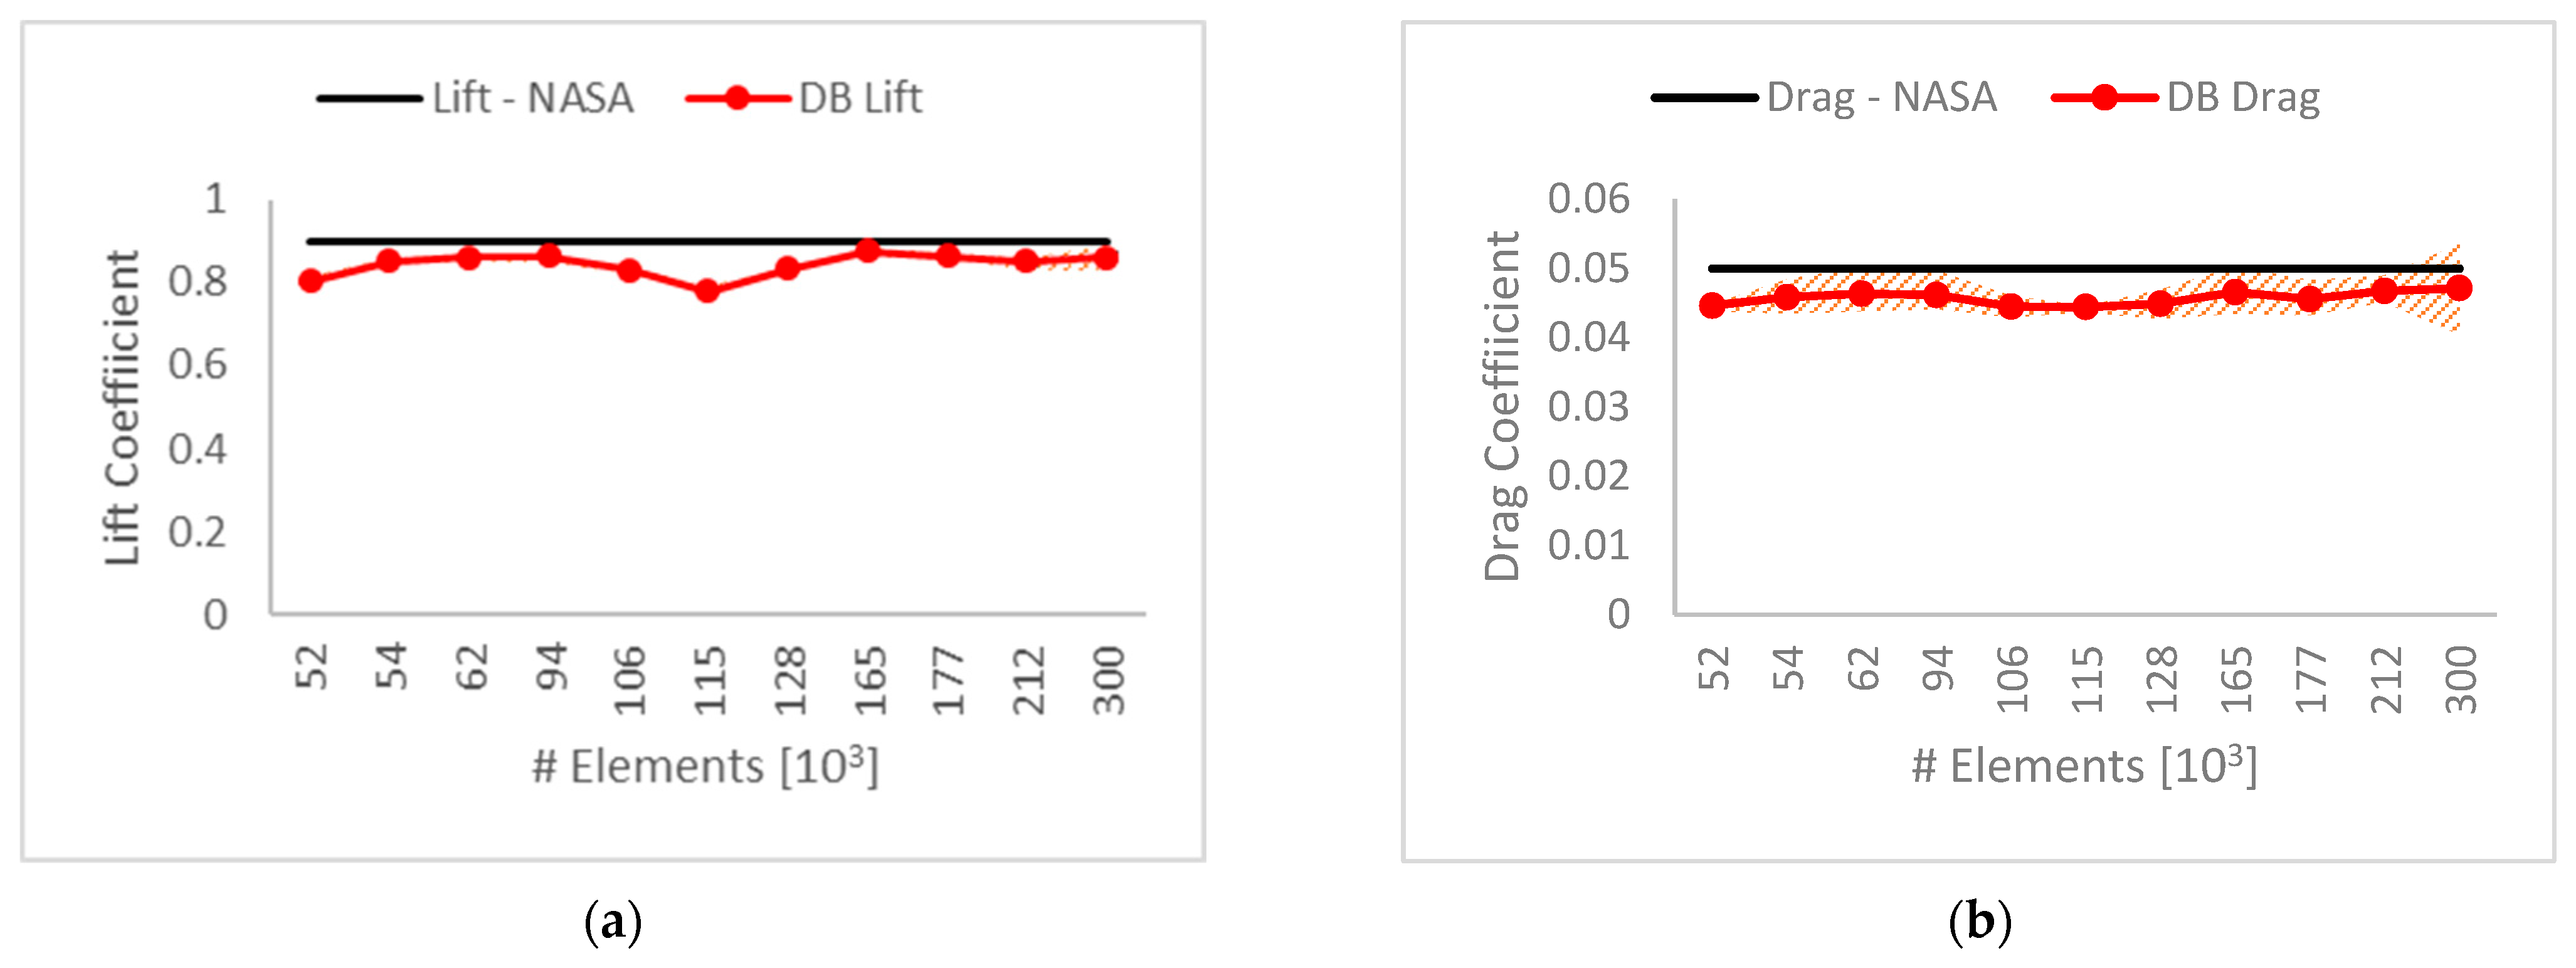
The next convergence analysis was conducted using a transient DB configuration (time step of Δt = 1 × 10⁻⁵ s) with the intermittency (γ) SST turbulence model where Δ1 = 4 × 10⁻⁵ m was maintained and Δ2 varied from 0.5m to 0.001m resulting in unstructured meshes of 50 × 103 to 300 × 103 elements. Each simulation was solved using 3000 time steps with 15 iterations per time step (0.03s of the total flow simulation). For this mesh convergence analysis, the data reported were averaged values calculated from a sample of the last 1000 time step estimations (where the convergence was assumed). Figure 7 shows the averaged force coefficient estimations produced by the model with different spatial grid refinements. All the simulations yielded a y+ < 1, as evidenced in Figure 8. The hatch area represents the standard deviation for the converged sample.
As shown in Figure 9, the cl estimations (a) showed a fluctuating relative error with a maximum of 6% up to 165 × 103 grid elements, where the cl stabilized to 1%. The maximum relative standard deviation from all the datasets regarding the cl predictions were 1%. Similarly, the cd estimation (b) showed a fluctuation in the relative error of approx. 2%. The final two iterations marginally obtained the same prediction. Moreover, the maximum relative standard deviation was 5%. Both trends showed how the force coefficient predictions became less dependent on the spatial grid. All the grid configurations with 165 × 103 elements (medium quality or finer, Table 3) obtained a relative error smaller than 5%. However, the finer meshes also experienced an increased standard deviation. In consequence, the grid configuration with 165 × 103 elements was selected.
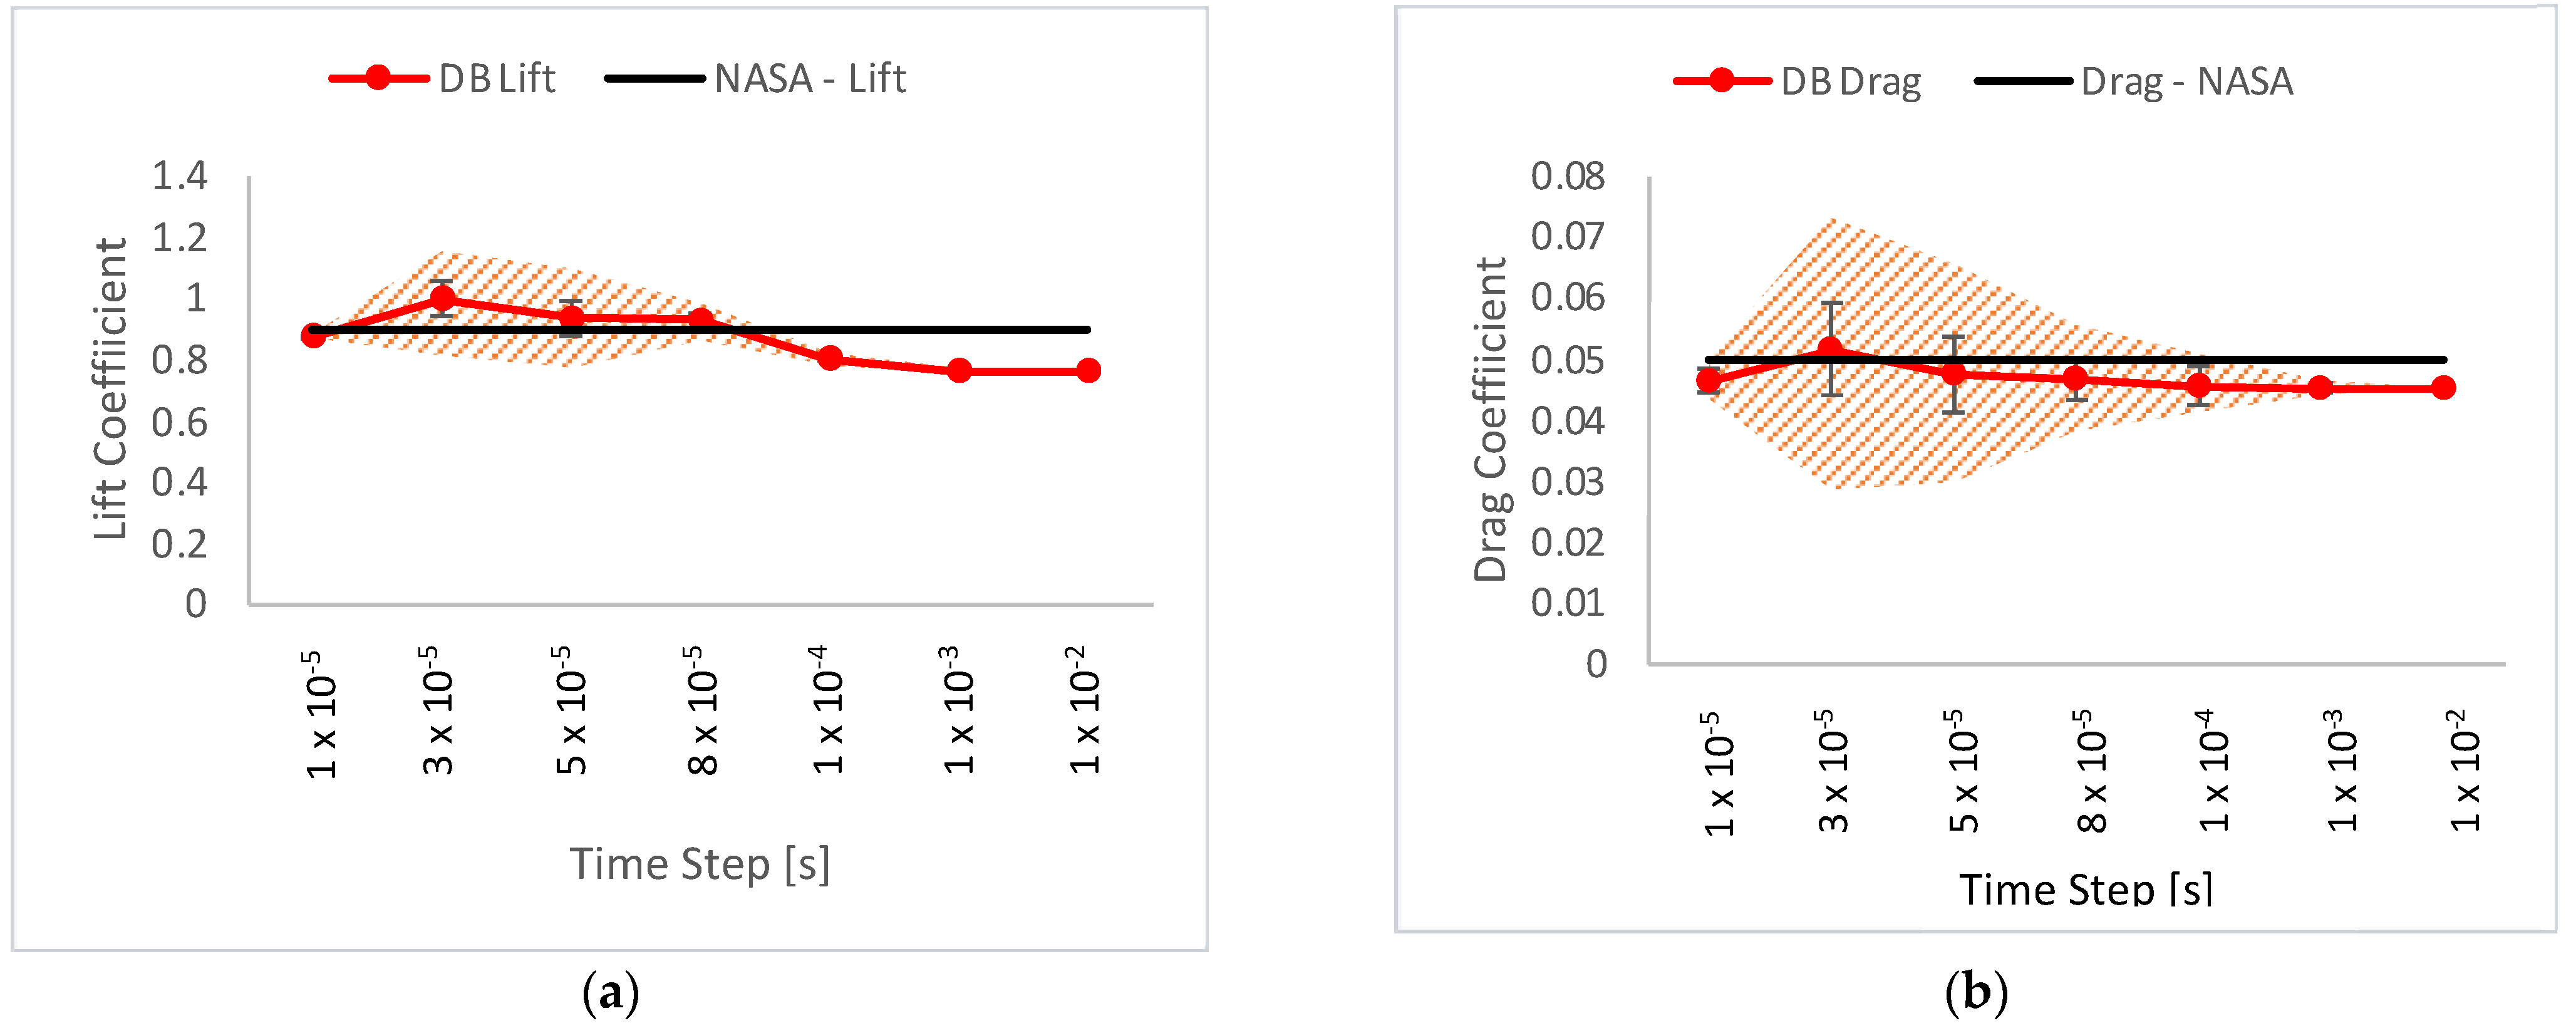
Similarly, the time step influence over the force coefficients was evaluated. Using the medium grid and 3000 time steps, the reported force coefficients were averaged values using the last 1000 data points from each run. It was evidenced that the lift generation was more prominent while using Δt < 1 × 10⁻⁴ s, whereas the simulations using Δt > 1 × 10⁻⁴ s marginally reached the same steady-state (SS) response. Figure 9 shows the averaged force coefficients and the response to a larger Δt. A smaller Δt showed a larger deviation. This might be due to the non-convergent results or the periodic response. To reduce the computational expense and to capture the early lift and drag generation, the Δt = 1 × 10⁻⁵ with 3000 time steps was used and the convergence was assumed after 2500 time steps.

2.3. Model Validation

As discussed previously, a turbulence model capable of describing the flow transitions is necessary to describe the BL configurations developed using low Reynolds numbers and a compressible flow. Among others, the intermittency (γ) SST model was a good candidate for this task, which also exhibited a smaller computational cost than the four-equation turbulence models. The numerical prediction of this three-equation turbulence model was enhanced using a low Reynolds correction available in ANSYS Fluent. Moreover, a compressible, transient formulation of governing equations using 3000 time steps (Δt = 1 × 10⁻⁵ s, and 15 iterations per time step) was implemented, and an unstructured grid with 165 × 103 elements was selected for the spatial discretization.
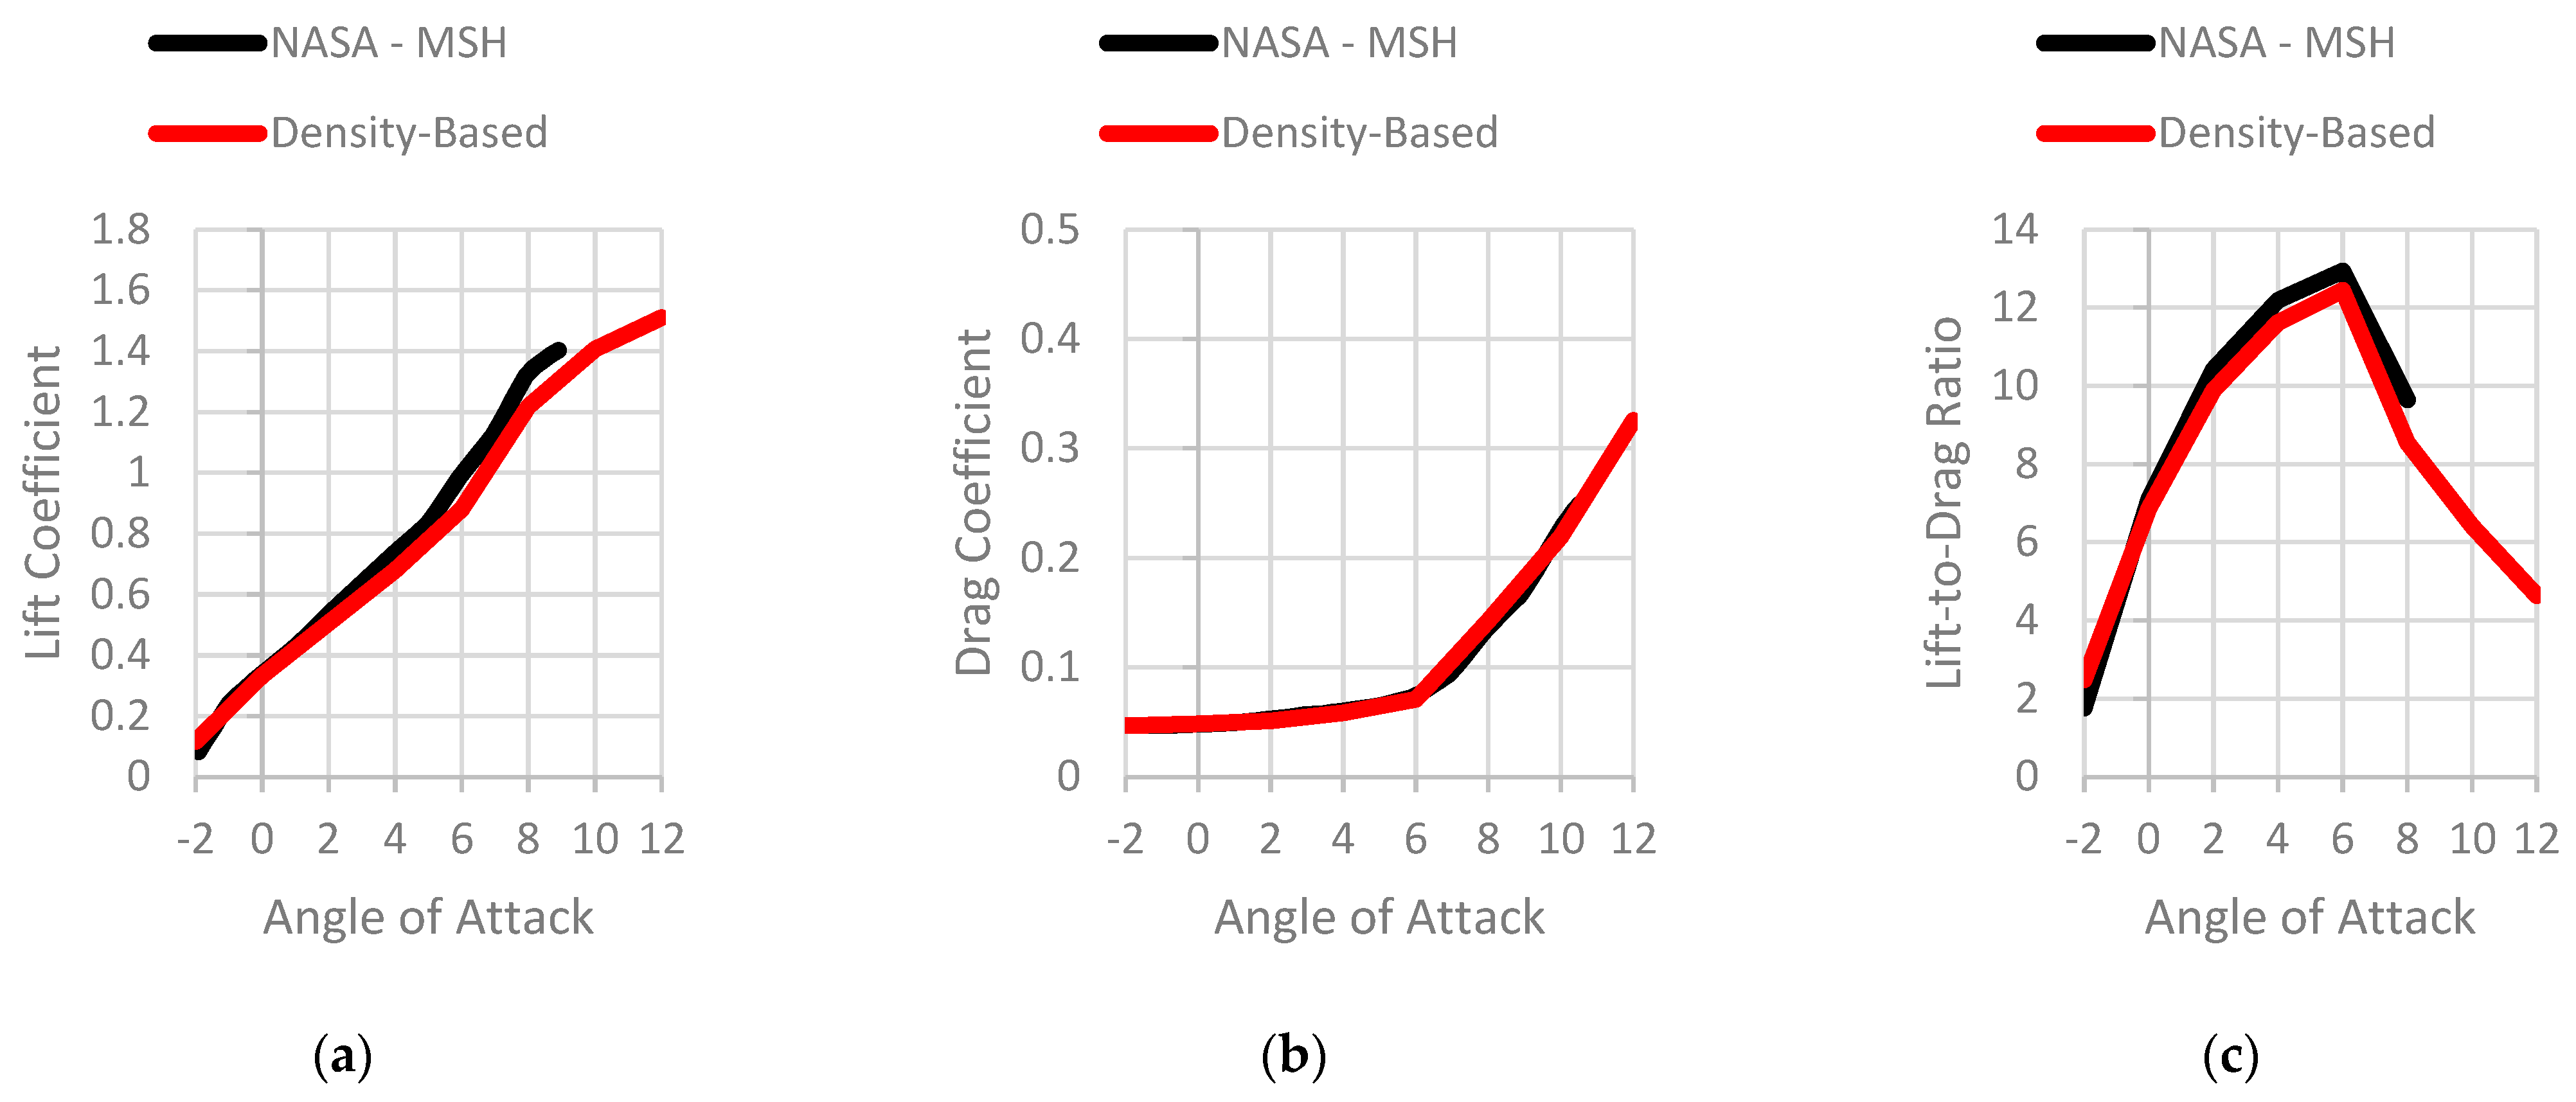
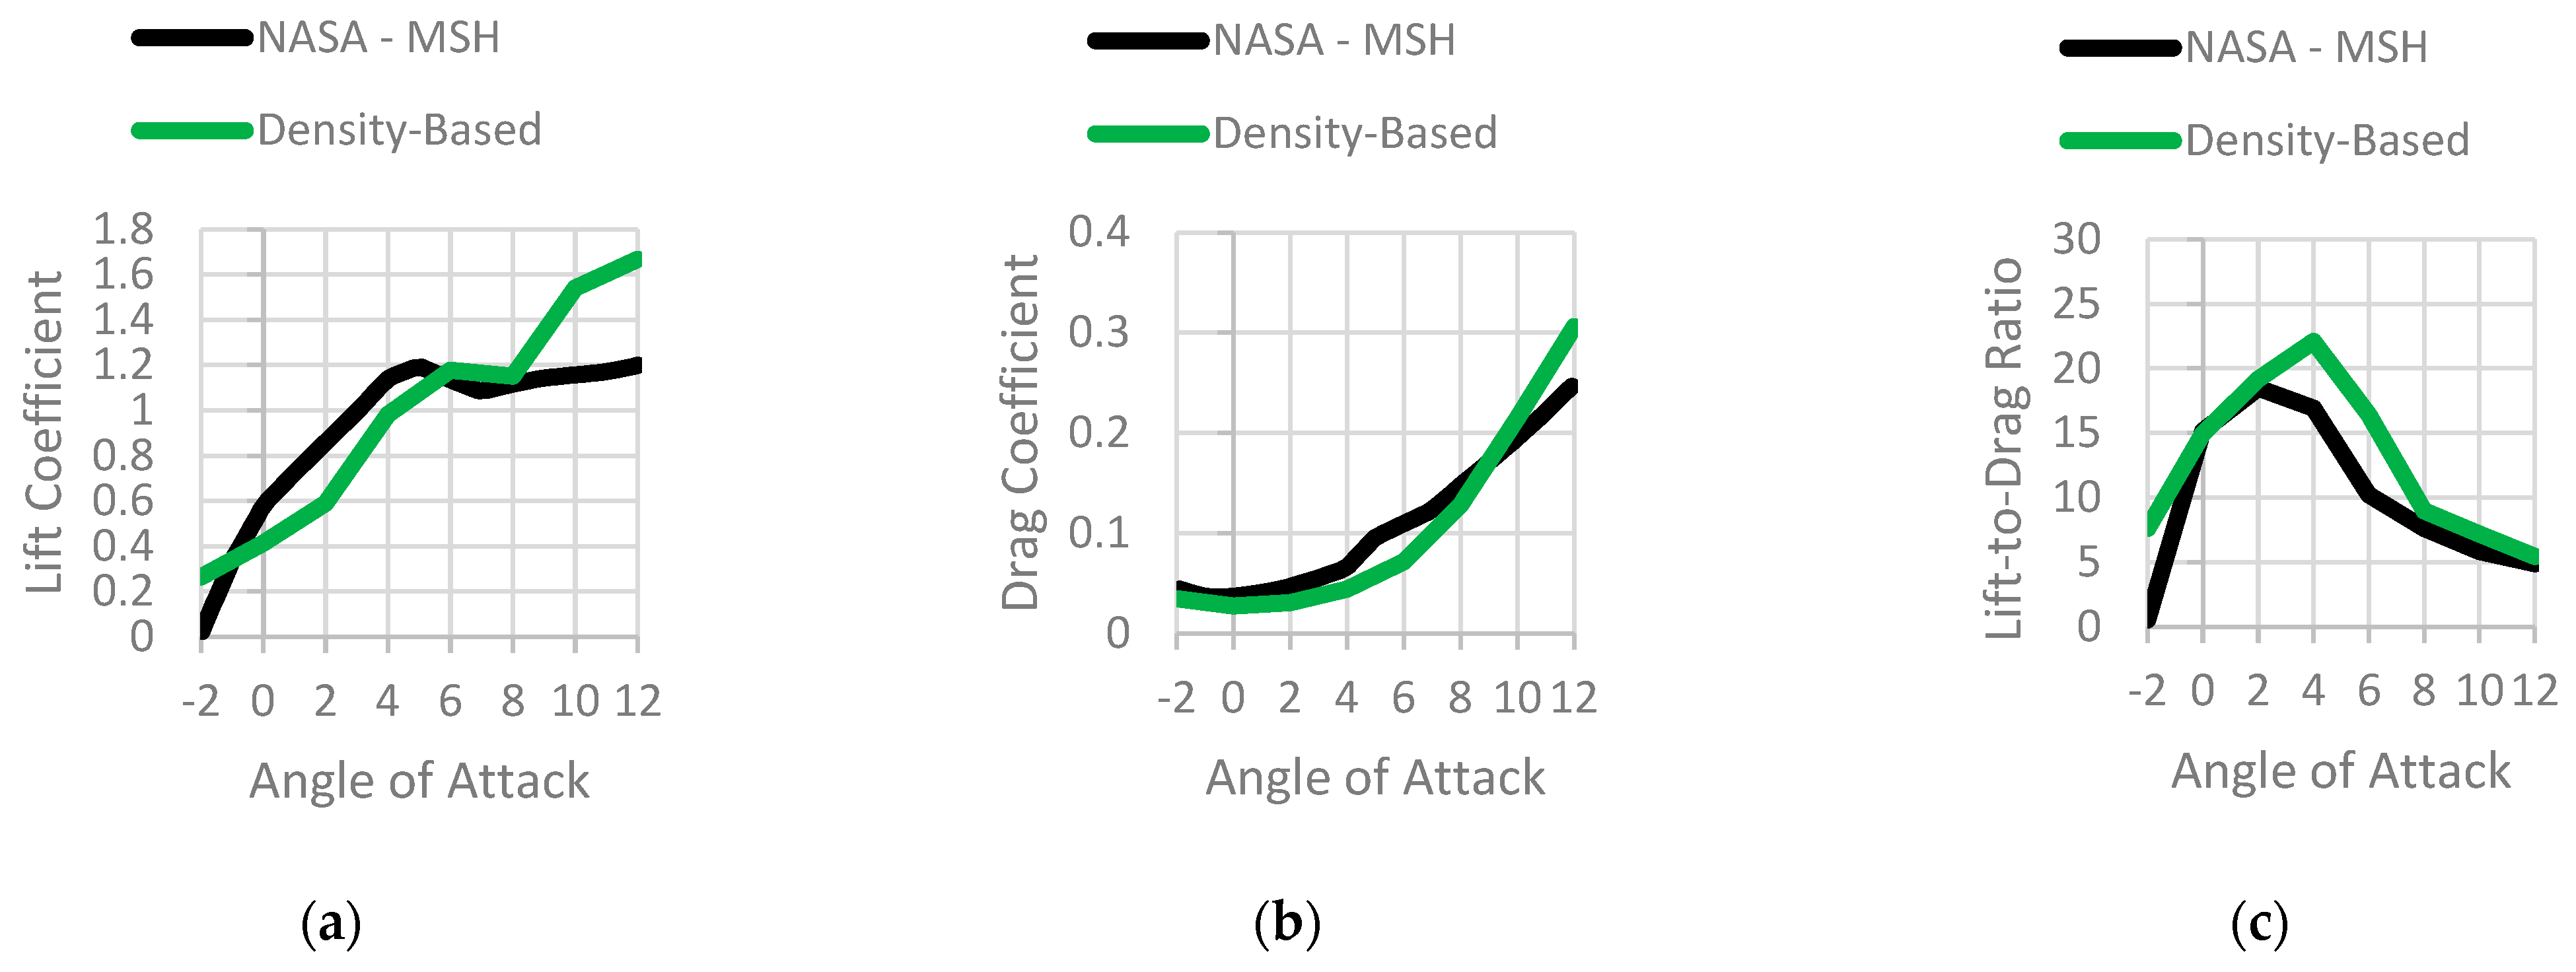
The circular arc cambered plate was the reference geometry (Figure 2). The airfoil was simulated under M = 0.2, M = 0.5, and M = 0.7. The force coefficients and the lift-to-drag ratio were compared with the results reported in [17] for a range of the AoA. The results of the comparison are plotted in Figure 10, Figure 11 and Figure 12 at M = 0.2, M = 0.5, and M = 0.7, respectively.
At M = 0.2, as shown in Figure 10, the force coefficients maintained a good proximity to the NASA predictions for the full range and recreated the same curve shape for a higher AoA [17]. In the range AoA: 0°–6°, the global error for the averaged ANSYS Fluent predictions and the MSH values oscillated close to 7%. However, the precision worsened as the airfoil reached a 6° AoA, causing this range to be a less reliable portion of the measured AoA range. These curves showed that the transient convergence assumption conducted at M = 0.5 was also maintained at M = 0.2 for the whole range but could be improved for a higher AoA if a longer simulation was performed.
At M = 0.5, as shown in Figure 11, the model provided close estimations of the MSH within a low AoA. For an AoA larger than 6°, the ANSYS Fluent curve developed a different shape for both force coefficients. This could be due to poor transition modeling at a high AoA. As suggested for M = 0.2, longer simulations for the cases with an AoA > 6° improved the transition modeling and alleviated the curve difference. However, the computational cost using the current model rendered that route unworthy. Nonetheless, the lift and drag coefficients estimations at a low AoA were in good agreement with the MSH values.
In contrast to the previous cases, as the flow became transonic, neither the boundary conditions nor the transient convergence assumption were maintained, resulting in a larger error, as expected (Figure 12) and rendering any other simulation with the current model at M = 0.7 as unreliable. However, the model was verified for the cases with Mach numbers between 0.2 and 0.5 for an AoA in the range of 0°–6°, which was the outboard angle of attack used in the ingenuity rotorcraft.

3. Results

For a four-bladed hexacopter, each rotor had a diameter of 1.28 m and the hover operational condition was modeled using 2800 rpm. This rotational speed implied a Mach number at the tip of the blade of ~0.8 (Mtip = 0.805). The stations of interest were located at 25%R and at 62%R. These stations experienced a Mach number of 0.2 and 0.5, respectively. Each airfoil simulation covered an AoA range from −2° to 12° with a step of 2°. The parametric study of the cambered plate was performed by modifying the camber, f, and the camber position, xc.

3.1. Parametric Study

Three xc locations along the blade were considered (30%c, 50%c, and 70%c) and were referred to as the forward, circular arc, and backward camber, respectively. Similarly, three values for f were used (3%c, 5%c, and 7%c) and were named as low, medium, and high camber, respectively. A total of nine airfoil shape combinations were enumerated and are listed in Table 4. The 20%c beveled bottom corner of the leading edge was retained for all the configurations. These values were selected to numerically evaluate the range in which the cambered plates showed a better performance according to [37].

3.2. M = 0.2 Results

The nine shapes were simulated and the lift-to-drag ratio was plotted against the AoA range for each case, as shown in Figure 13. From the results shown in Figure 13, two shapes stood out over the rest at this station, which were the medium circular arc (#5) and the high backward cambered plate (#9). Both shapes reached a lift-to-drag ratio of 12.45 and 12.82 at a 6° AoA, respectively. It was also noted that the shapes with a low camber performed poorly at a higher AoA compared to the shapes with a medium and high camber. The peak performance of the low camber shapes was at 4°, whereas shapes #5 and #9 showed a maximum at 6°, extending the operational range.
A closer view of each camber level is plotted in Figure 14, which shows the influence of the camber position at each camber level. A low camber (a) seemed to be unaffected by x. Shapes 1, 2, and 3 showed virtually the same lift-to-drag ratio performance with their respective peaks at 4° followed by a decrease of 5% at 6°. In contrast, the medium camber (b) and high camber shapes (c) were influenced by x. The forward and circular arc medium cambers showed respective peak lift-to-drag ratios at 6°. Meanwhile, the backward medium camber showed a lower peak at 4°. Inversely, the high camber shapes (c) gained a better performance from the backward and circular arc cambers at 6°, while the forward camber lost its efficiency at 4°.
Ultimately, the behavior obtained using the 3% fc level was unaffected by the camber position since the camber height was not prominent enough to vary the BL development (see later discussion, where results are presented in Figures 17 and 18). Similarly, a flat plate BL behavior showed similar shapes but different separation points.

3.3. M = 0.5 Results

Similarly, Figure 15 provides a performance overview of the nine shapes considered. This station presented a more competitive scenario; however, the medium circular arc (#5) and the high circular arc (#8) showed a better performance compared to all the other shapes. Shape #5 showed a peak lift-to-drag ratio of 18.9 at 4° with a decrease of 22% at 6°, whereas shape #8 showed a lift-to-drag ratio of 16.9 at 4° with a peak efficiency of 18.5 at 6°. The forward low camber cambered plate (#1) exhibited a lower but comparable performance to shape #5.
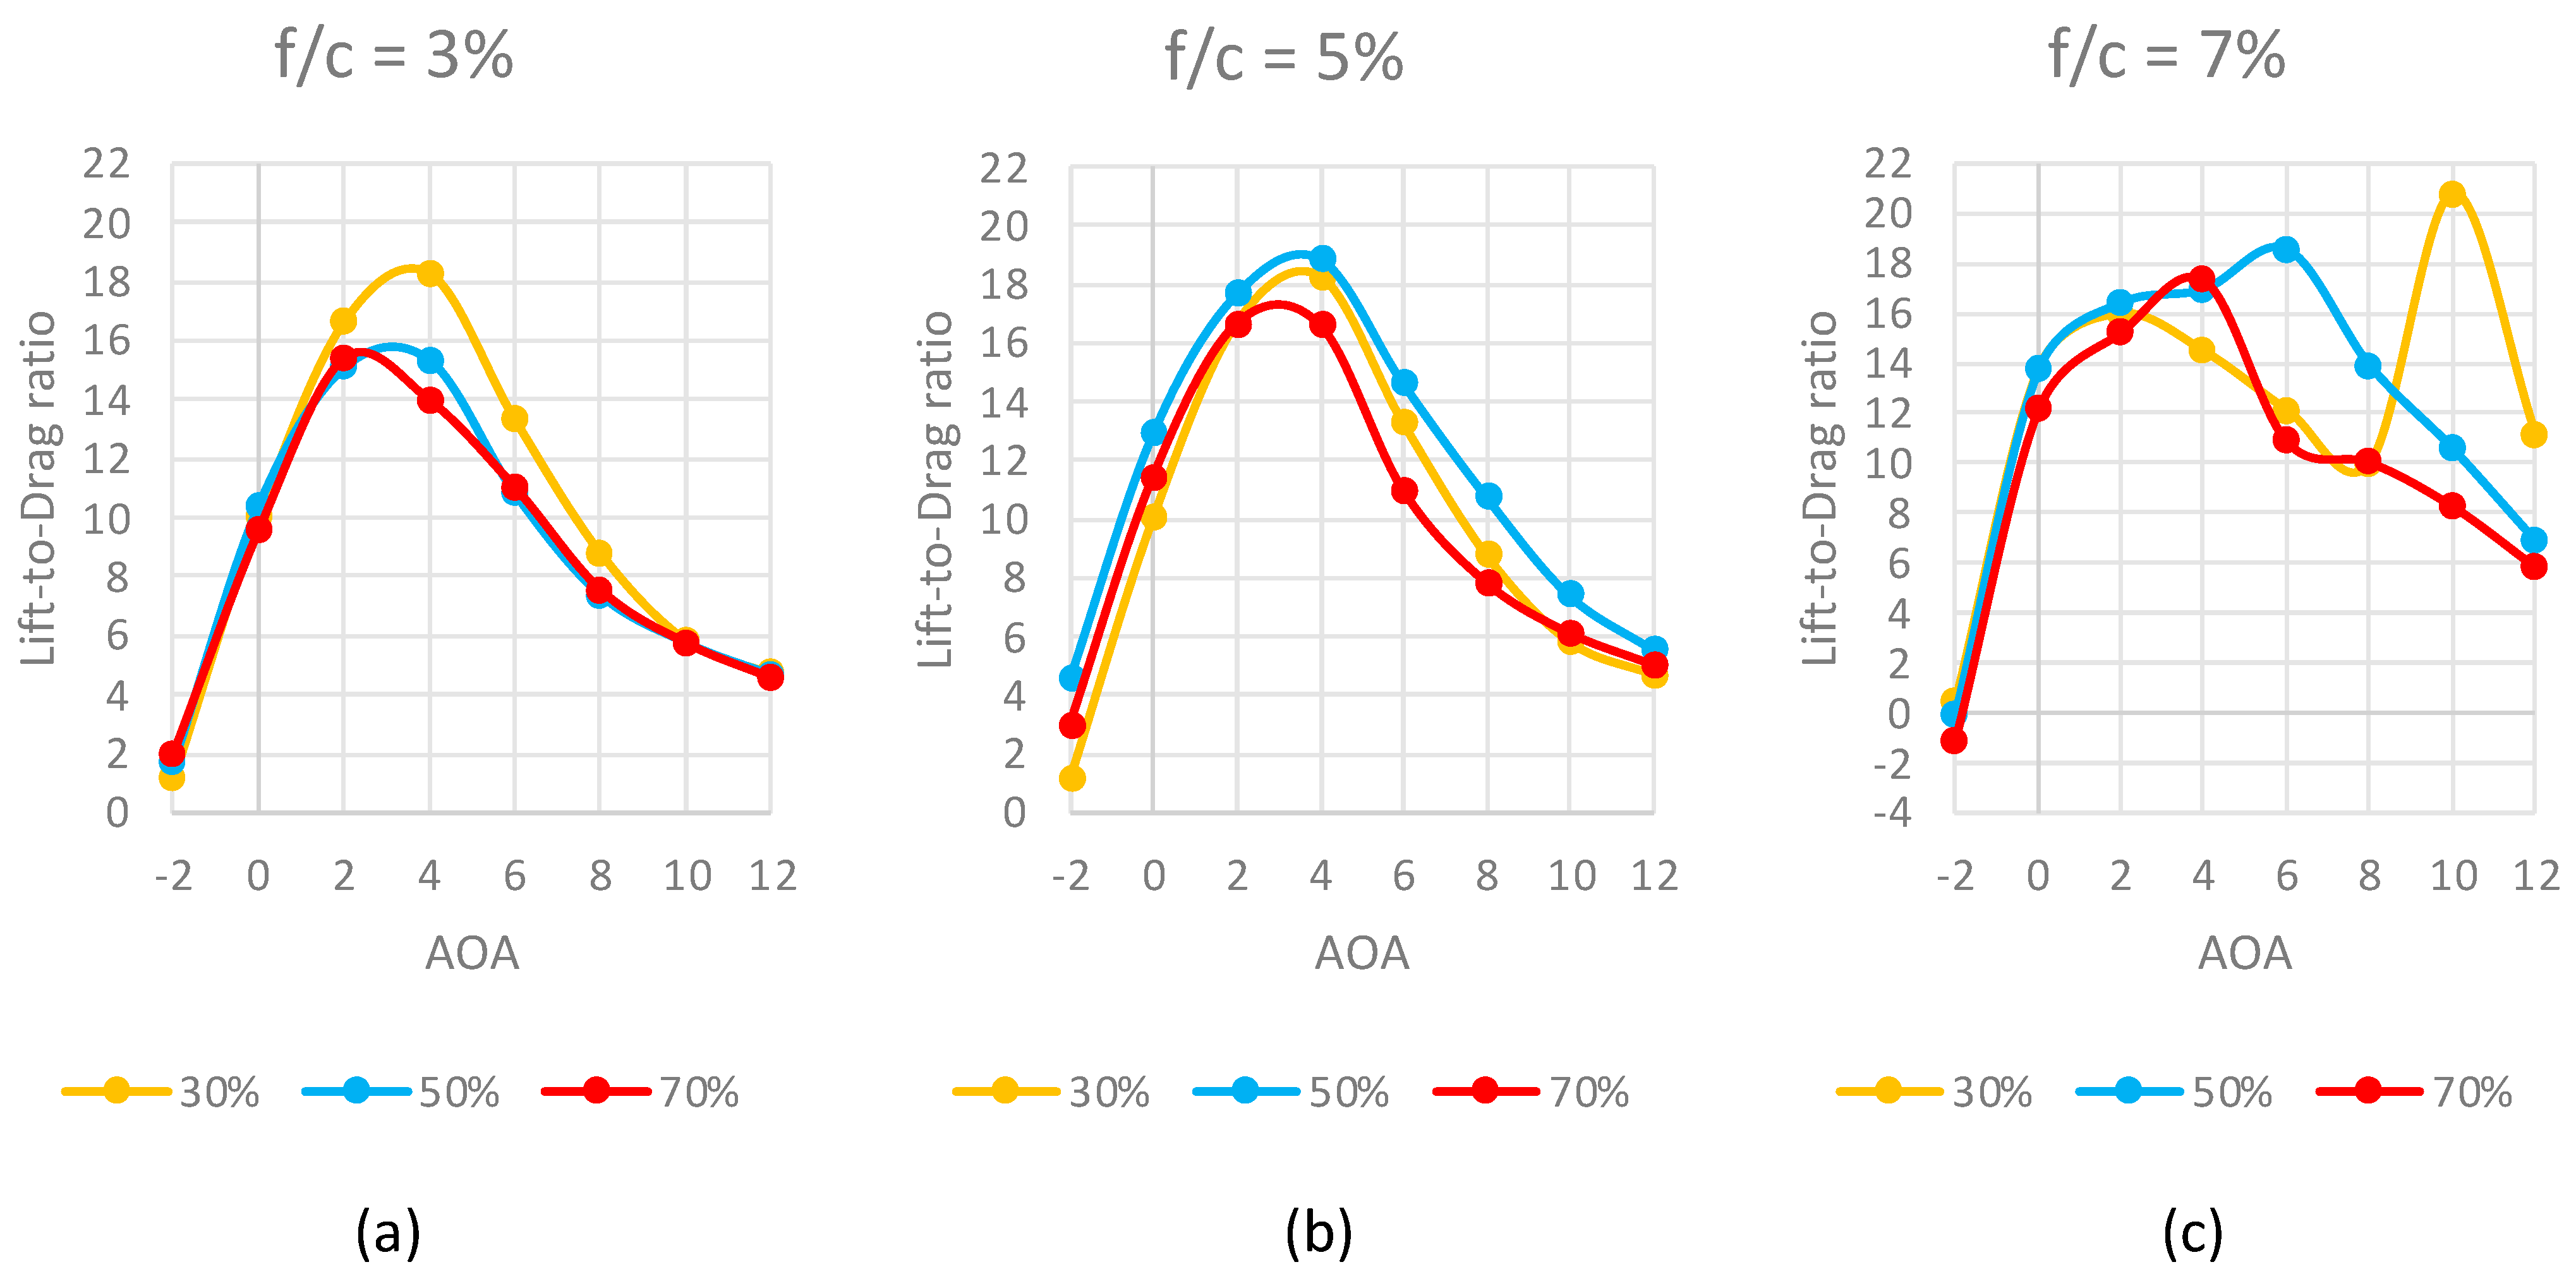
Figure 16 shows the influence of the camber position at each camber level for the M = 0.5 case. The low camber (a) was positively influenced by a camber location closer to the leading edge. Shapes 1 and 2 showed respective lift-to-drag ratio peaks at 4°, while shape 3 showed a lower performance with a peak at 2°. Similarly, the medium camber (b) was influenced by the camber location, but the effect was not linear (low cambers exhibited a linear behavior) with a peak efficiency at 4°. The circular arc seemed to promote a better performance for the medium and high camber shapes. Finally, the high camber shapes (c) showed an interesting outcome as the camber position was changed. Depending on the camber location, the peak lift-to-drag ratio was developed at a different AoA. The backward (#9) position developed a peak at 4°, whereas the circular arc (#8) and forward (#7) camber showed efficiency peaks at 6° and 10°, respectively. Although shape #7 has a higher efficiency (20.75) at a higher AoA, the overall efficiency (the area under the lift-to-drag ratio vs. the AoA curve) was lower when compared with the efficiency obtained using shape #8. The non-monotonic behavior, as shown in Figure 16c, could be due to the numerical model’s limitation for configuration #6. For this reason, our discussion takes the AoA range from −2 to 6 degrees into consideration.
In general, as the airfoil rotated to the higher AoA, the backward camber forced the onset of the BL separation to approach the trailing edge, thereby reducing drag. Additionally, the concavity towards the trailing edge would function as a “parachute” device, obtaining increased lift.

4. Discussion

4.1. Cambered Plate at M = 0.2

At 25%R of the rotor’s blade, the airfoil section experienced M = 0.2. All the shapes marginally exhibited the same lift-to-drag performance over the AOA range. However, as f increased, the efficiency of the cambered plate improved due to a higher lift generation, as expected. The variable x showed an increased nuance. A lower f seemed to benefit from forward x, slightly increasing the efficiency, while a higher f took advantage of the backward x. At M = 0.2, two airfoil configurations provided the best lift-to-drag ratio compared to the examined set of shapes #5 and #9. Both shapes shared a similar lift-to-drag ratio curve (Figure 14) over the AOA range. However, the backward high camber (#9) surpassed the efficiency of the medium circular arc described in [17] over the whole range, except for the negative AoA. The maximum lift-to-drag ratio obtained by shape #9 was 12.8 at 6°.
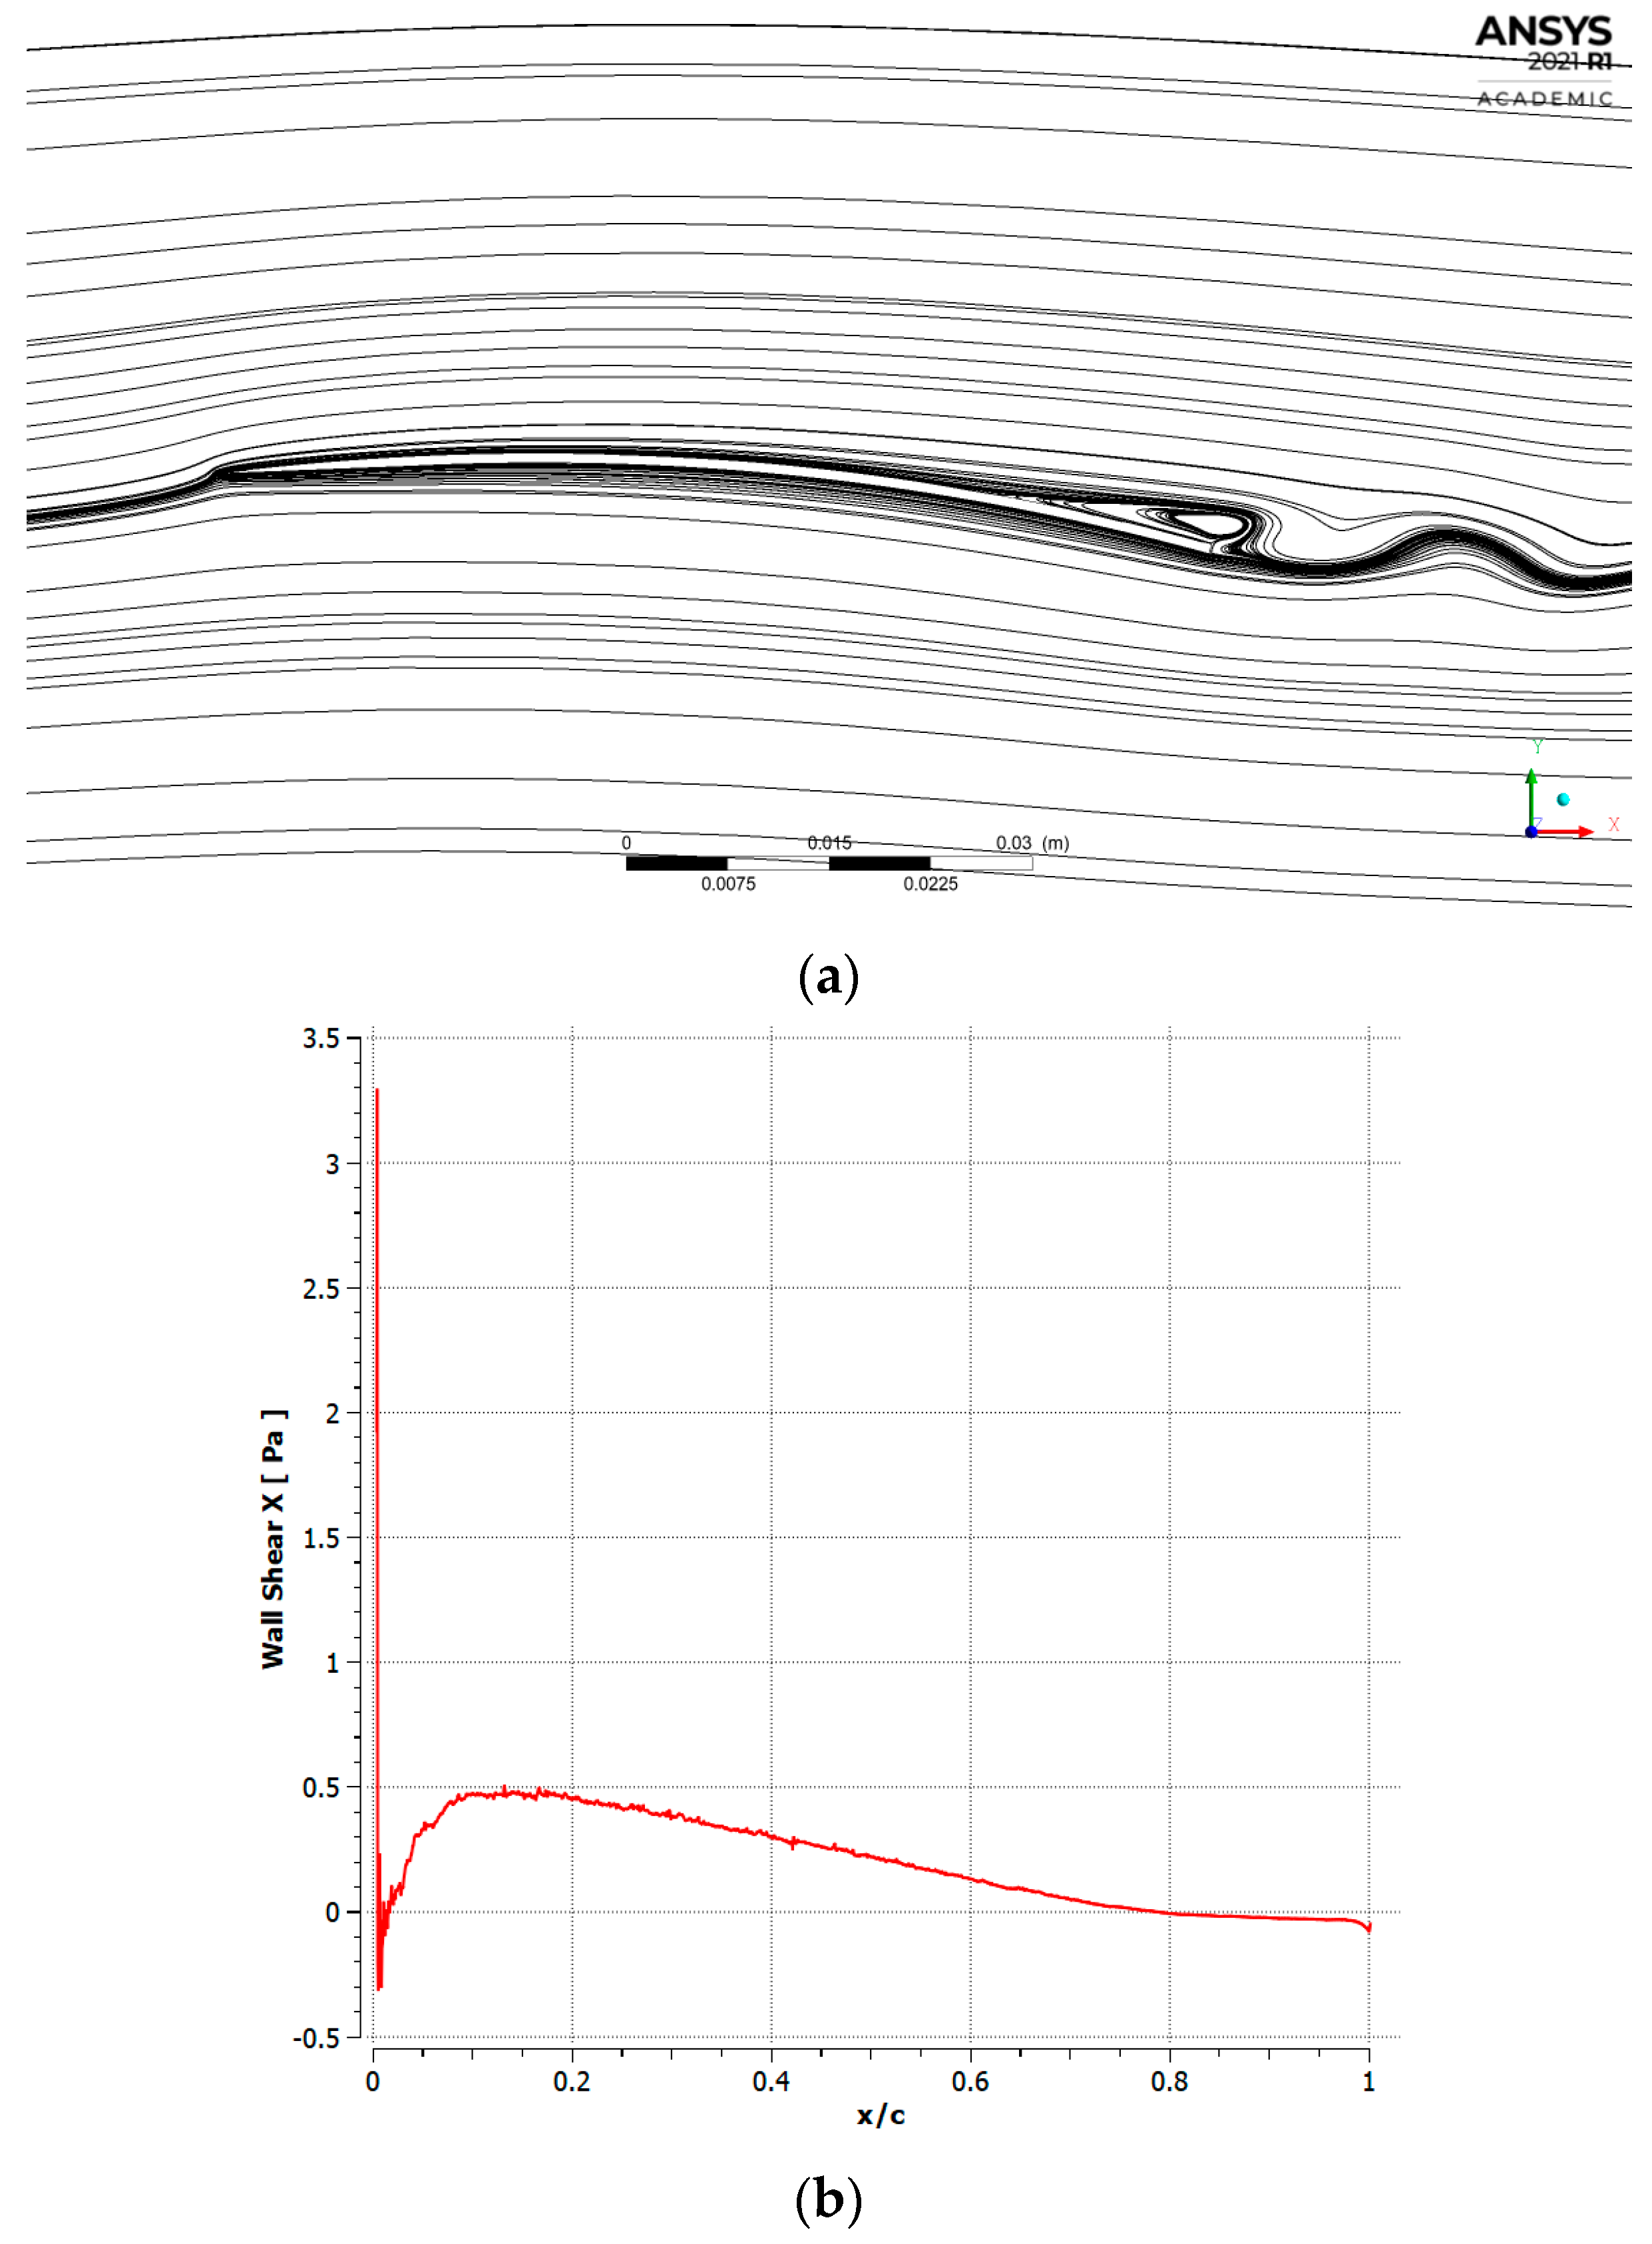
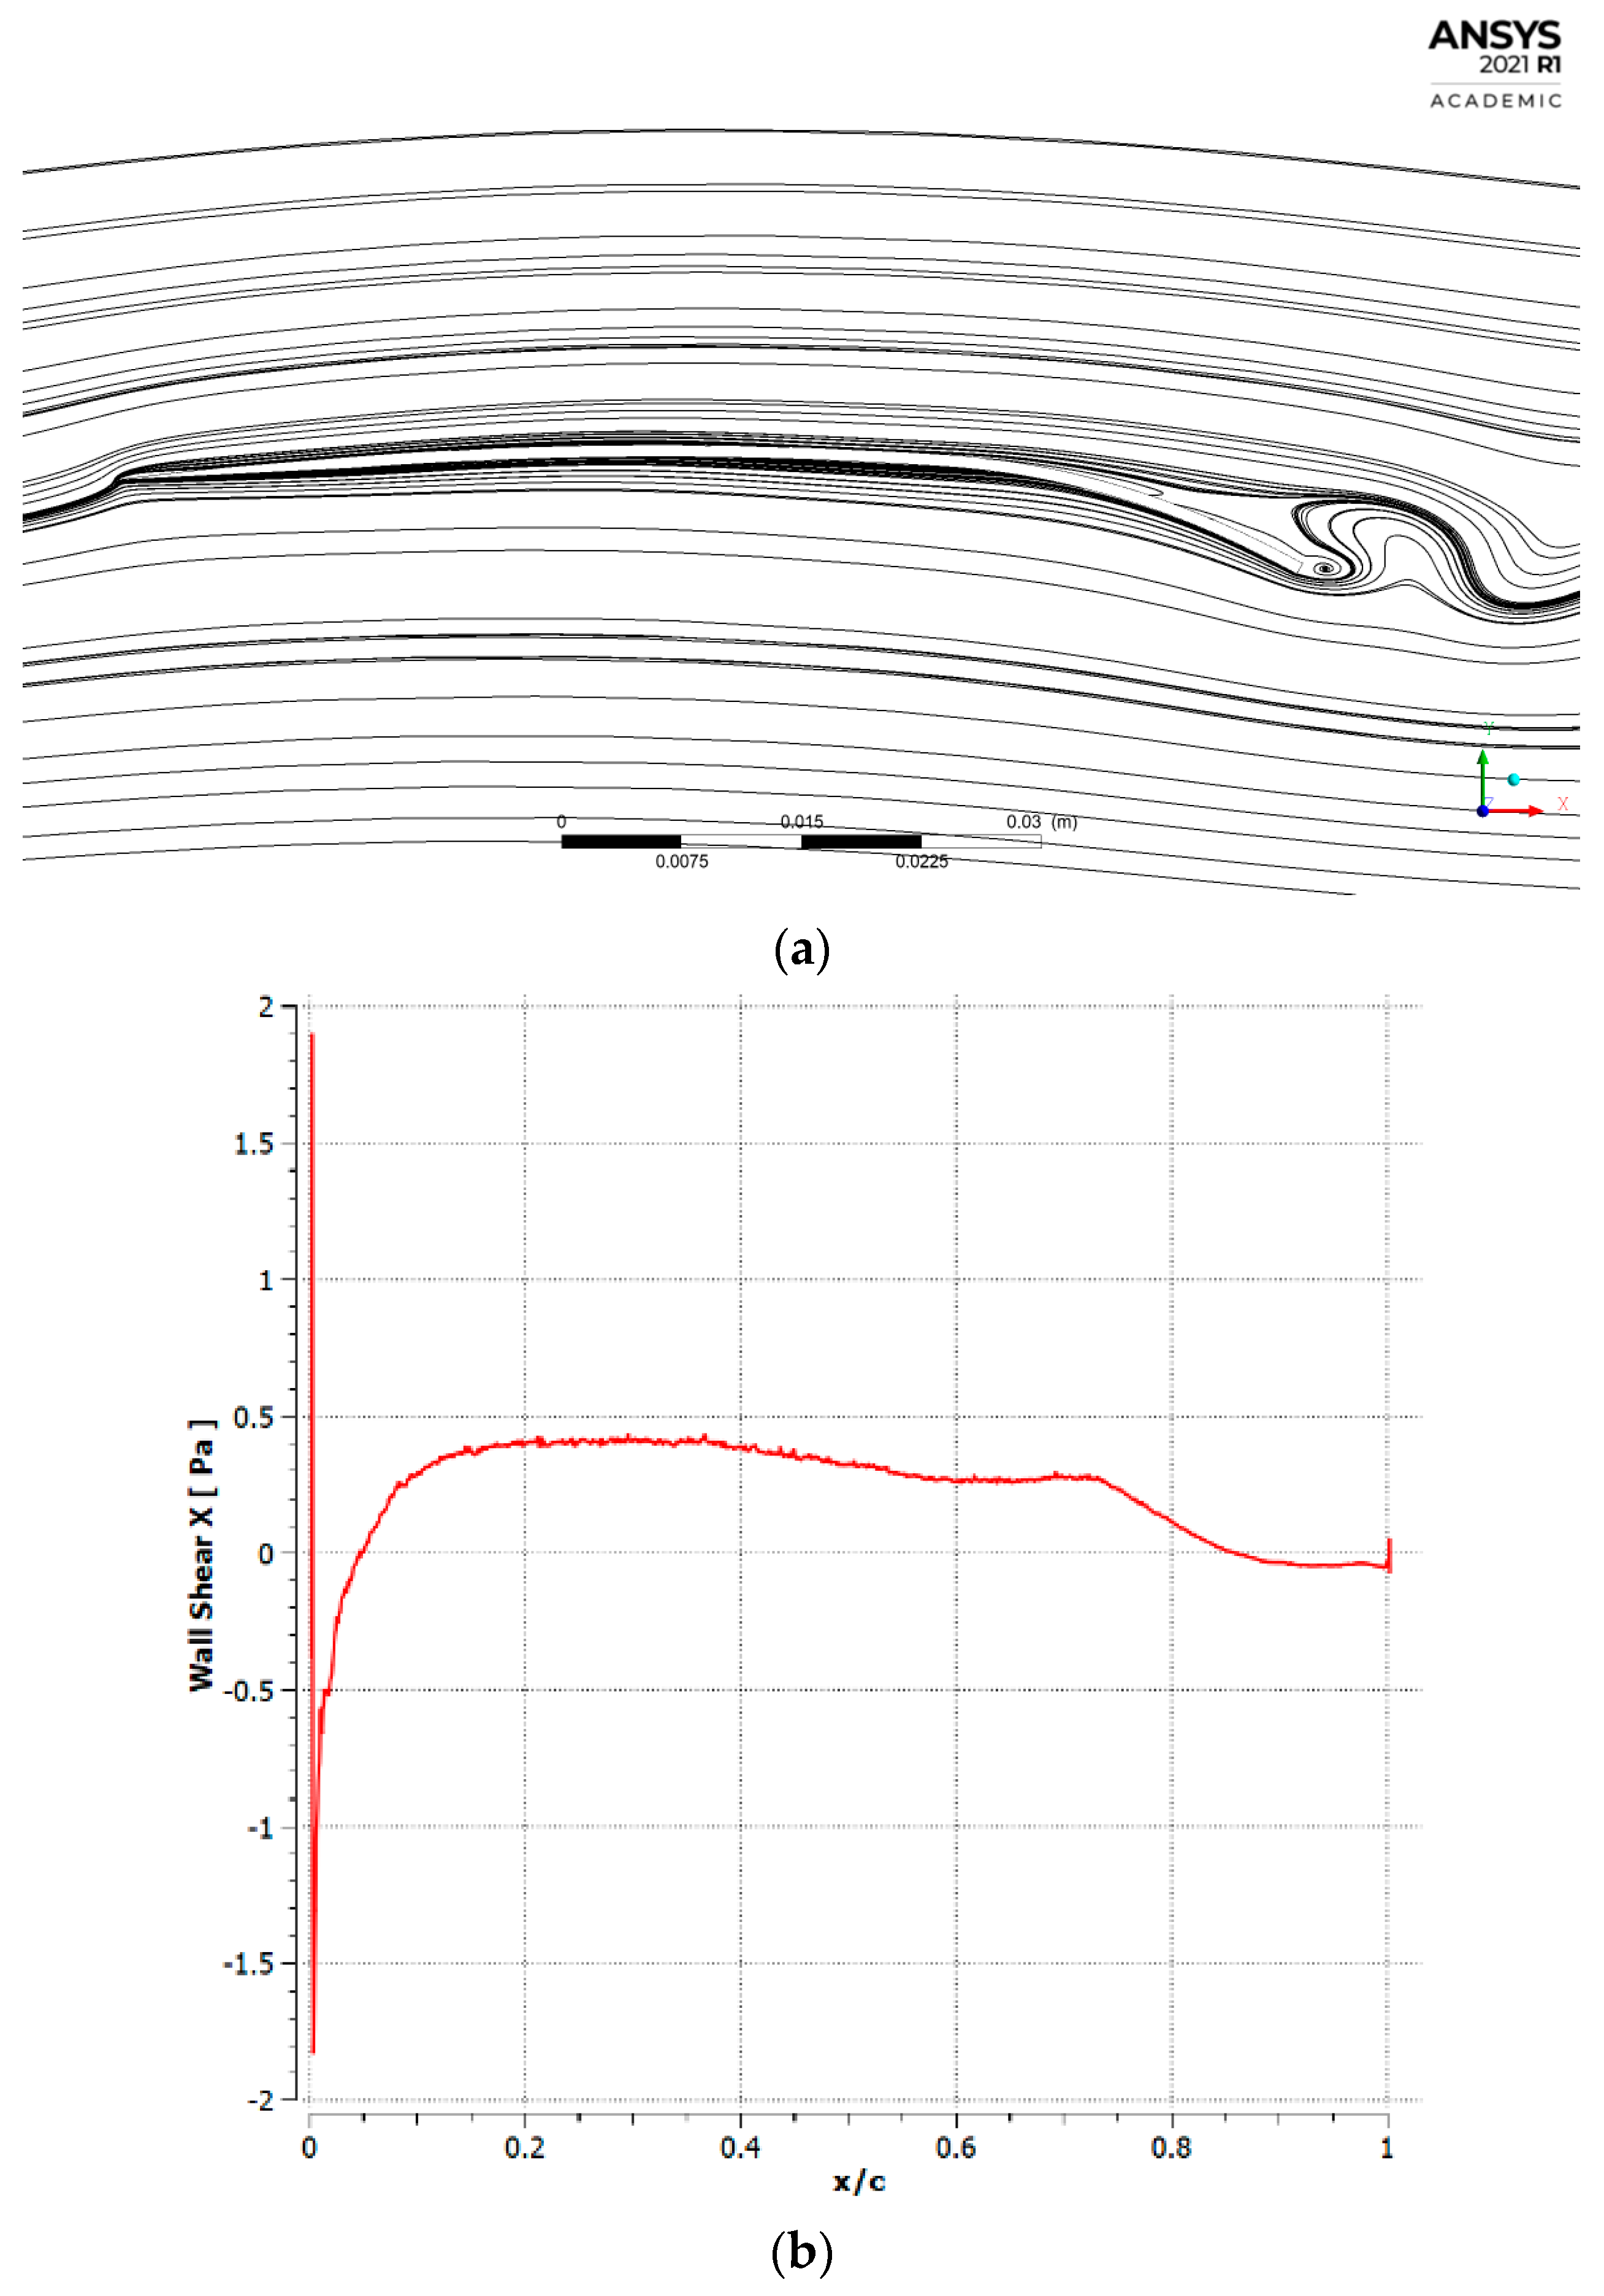
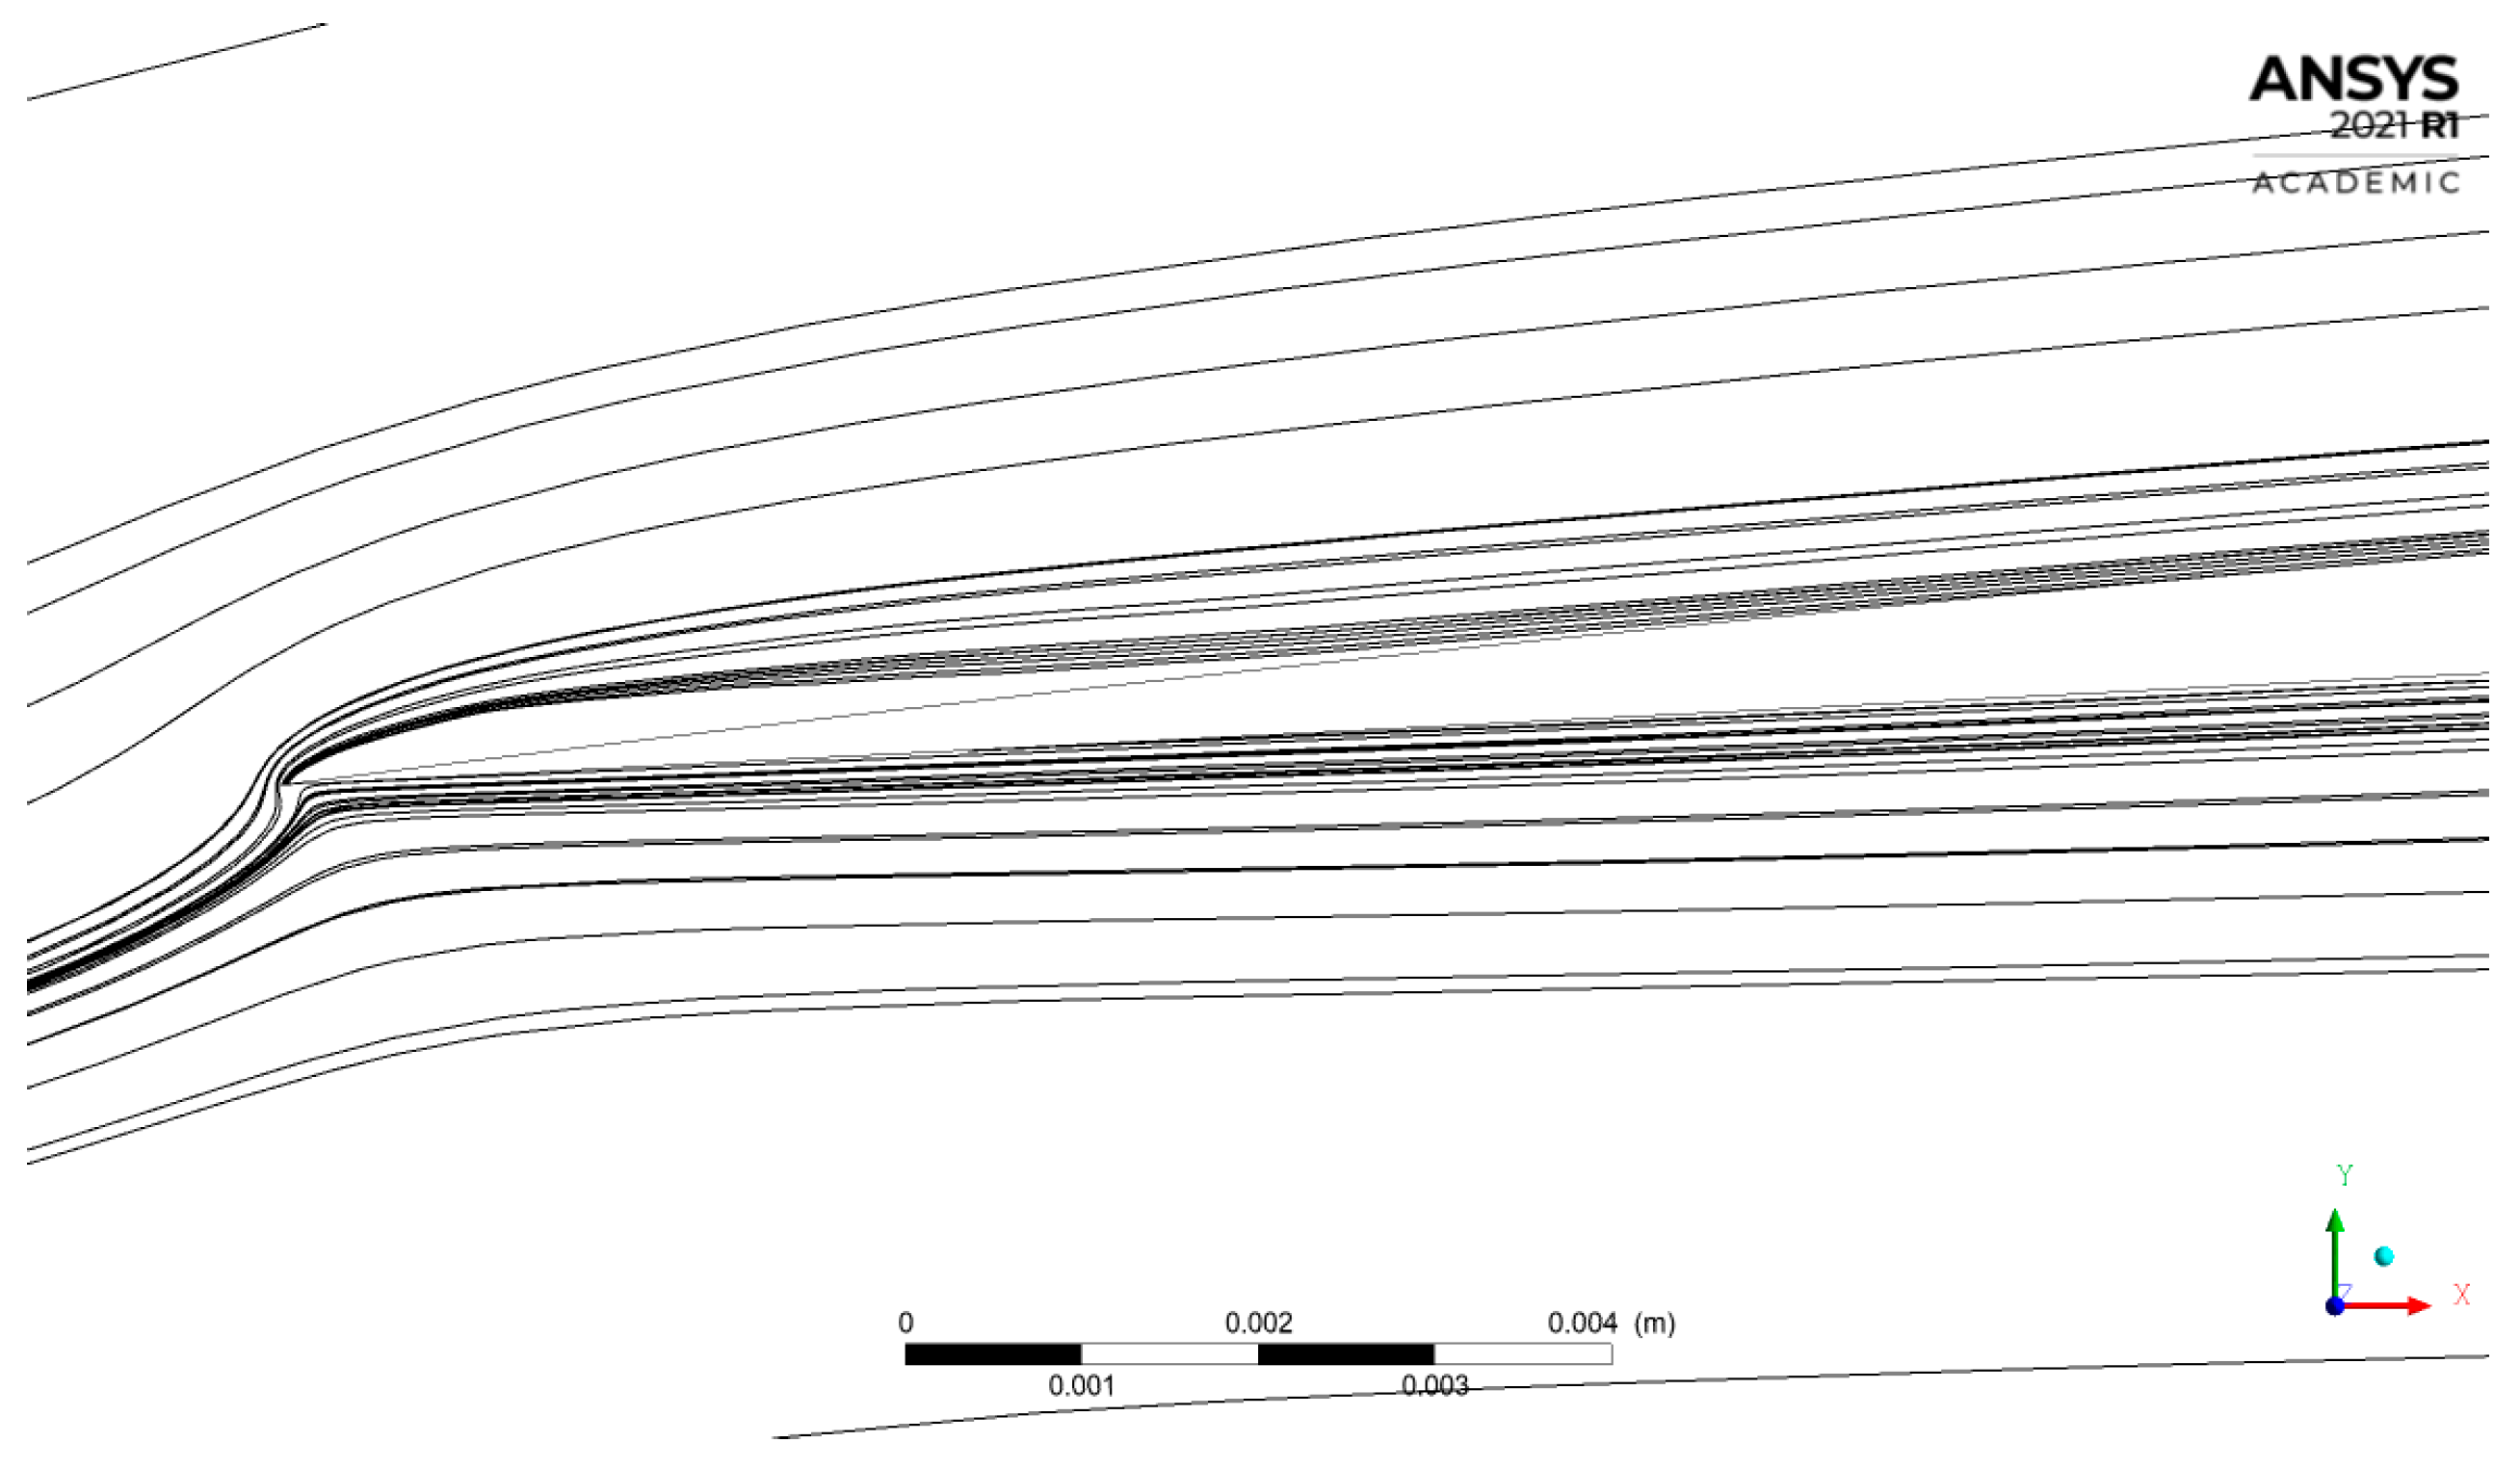
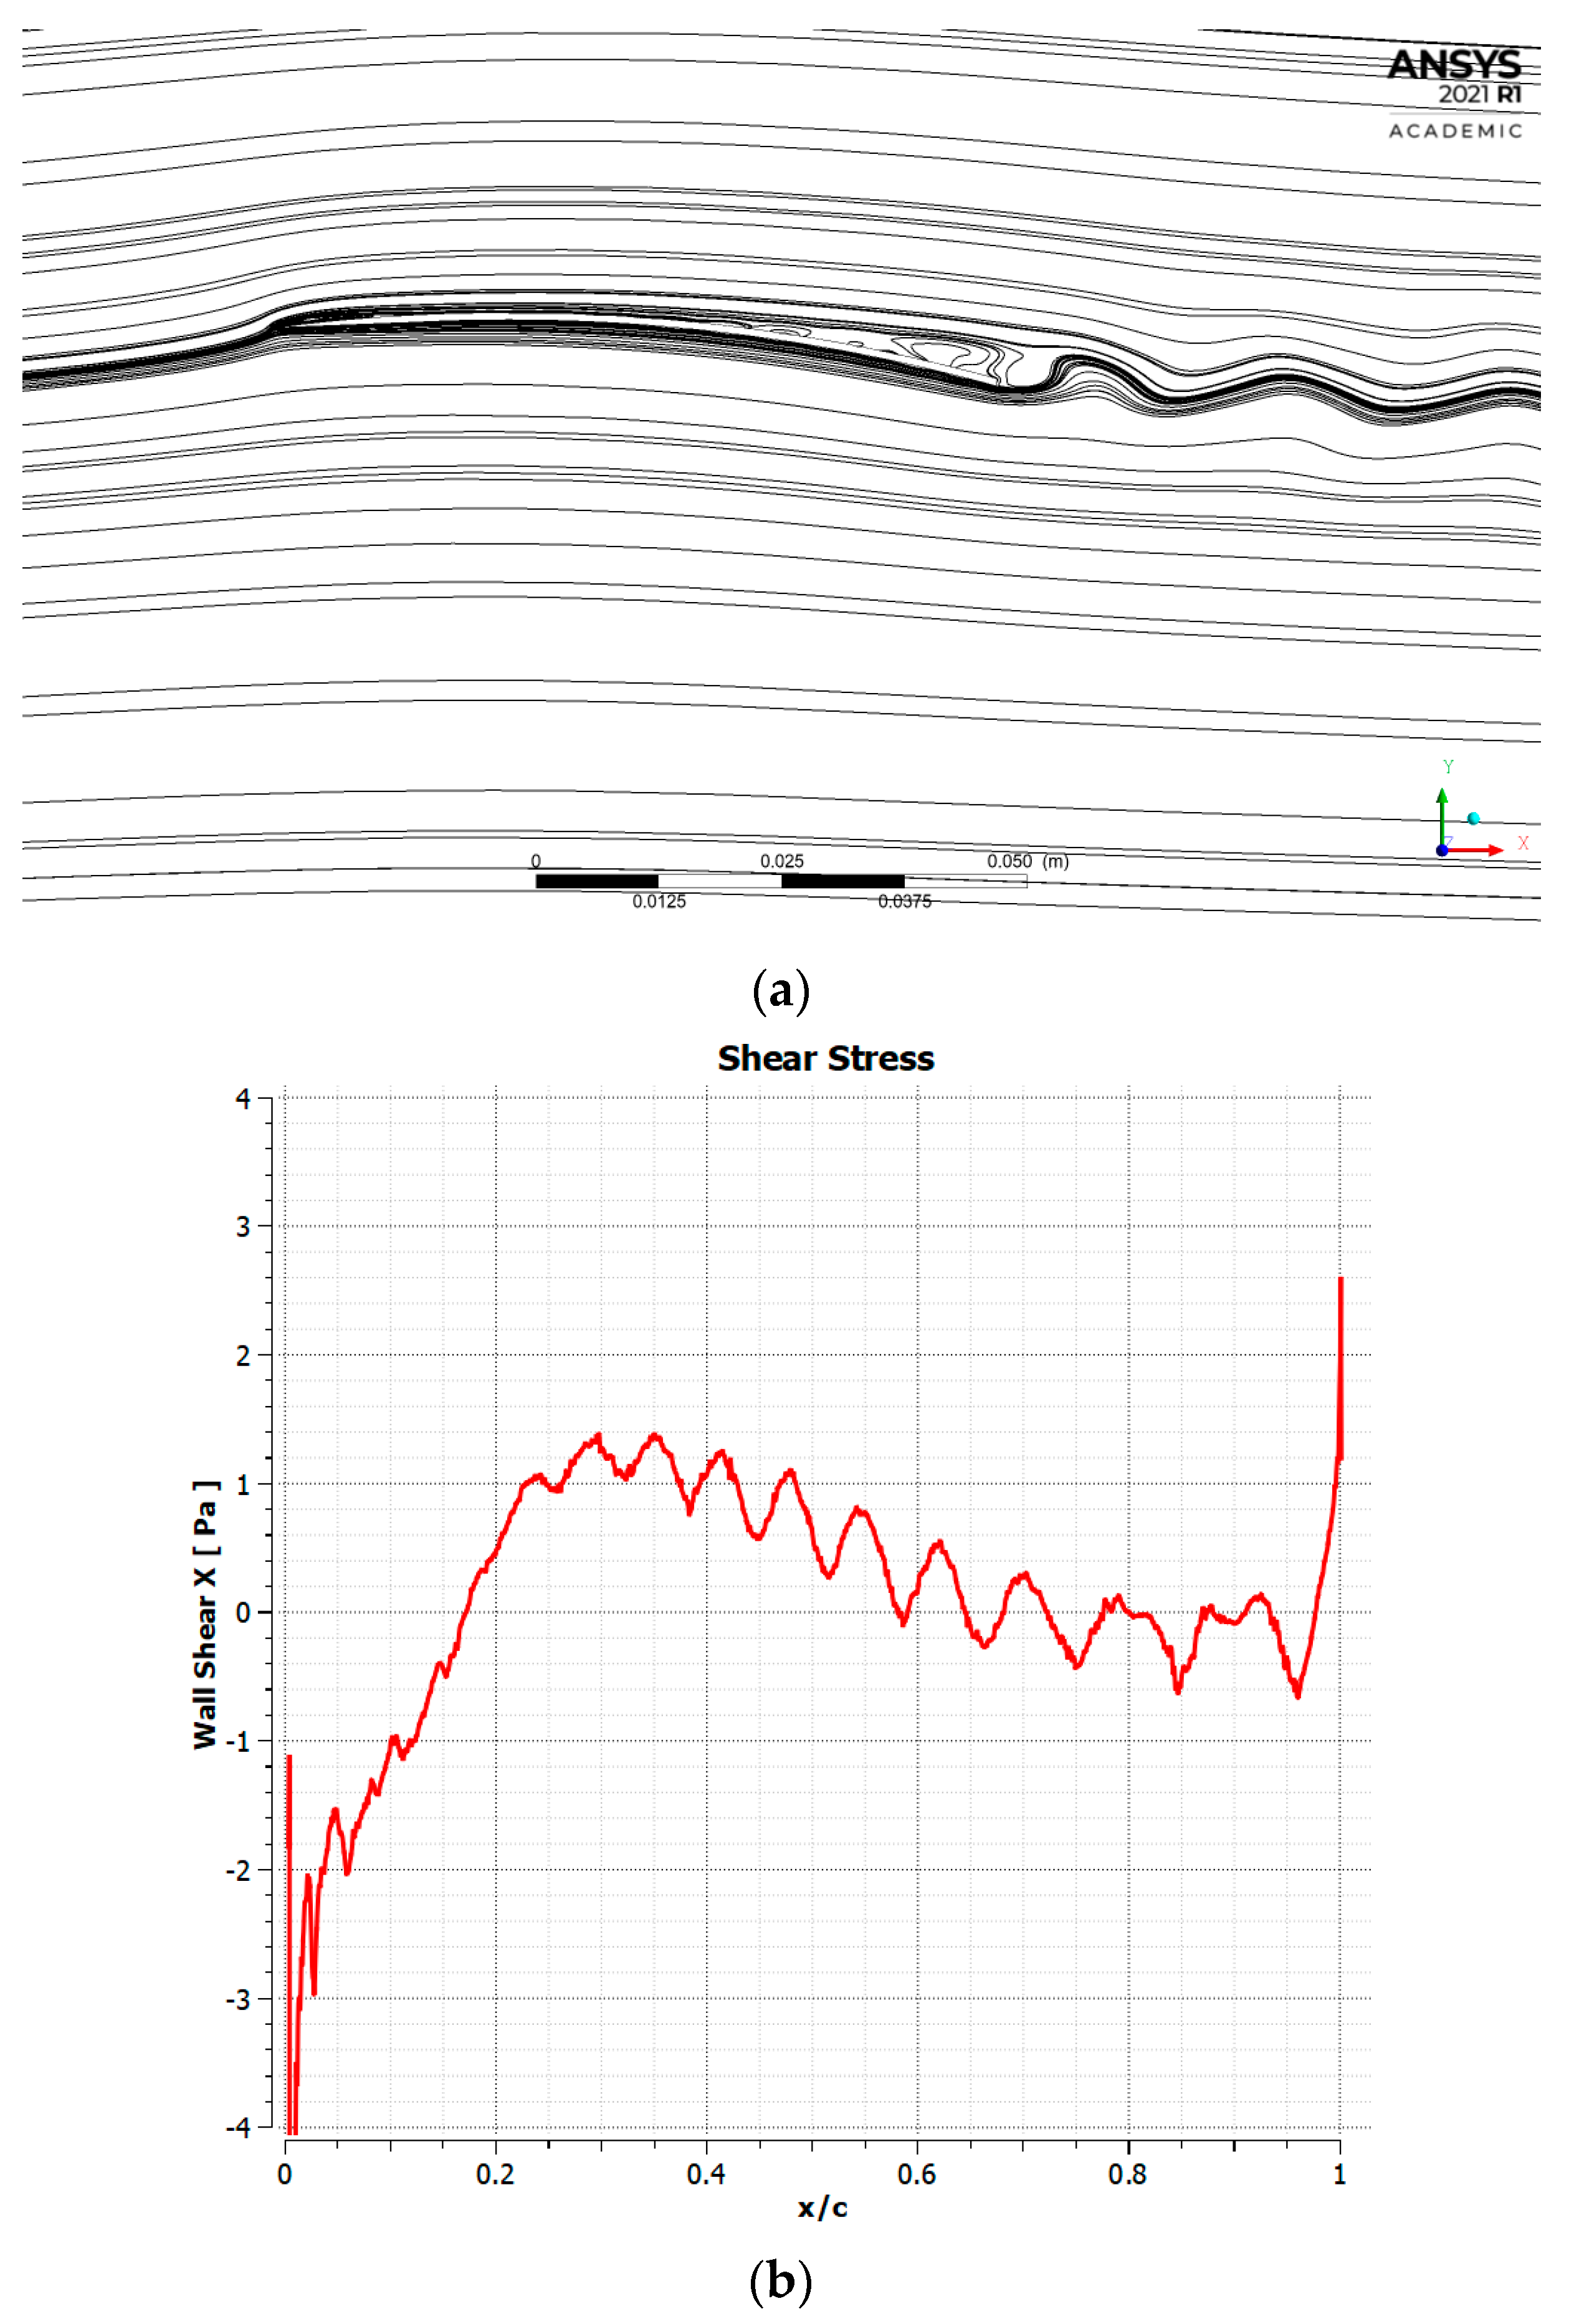
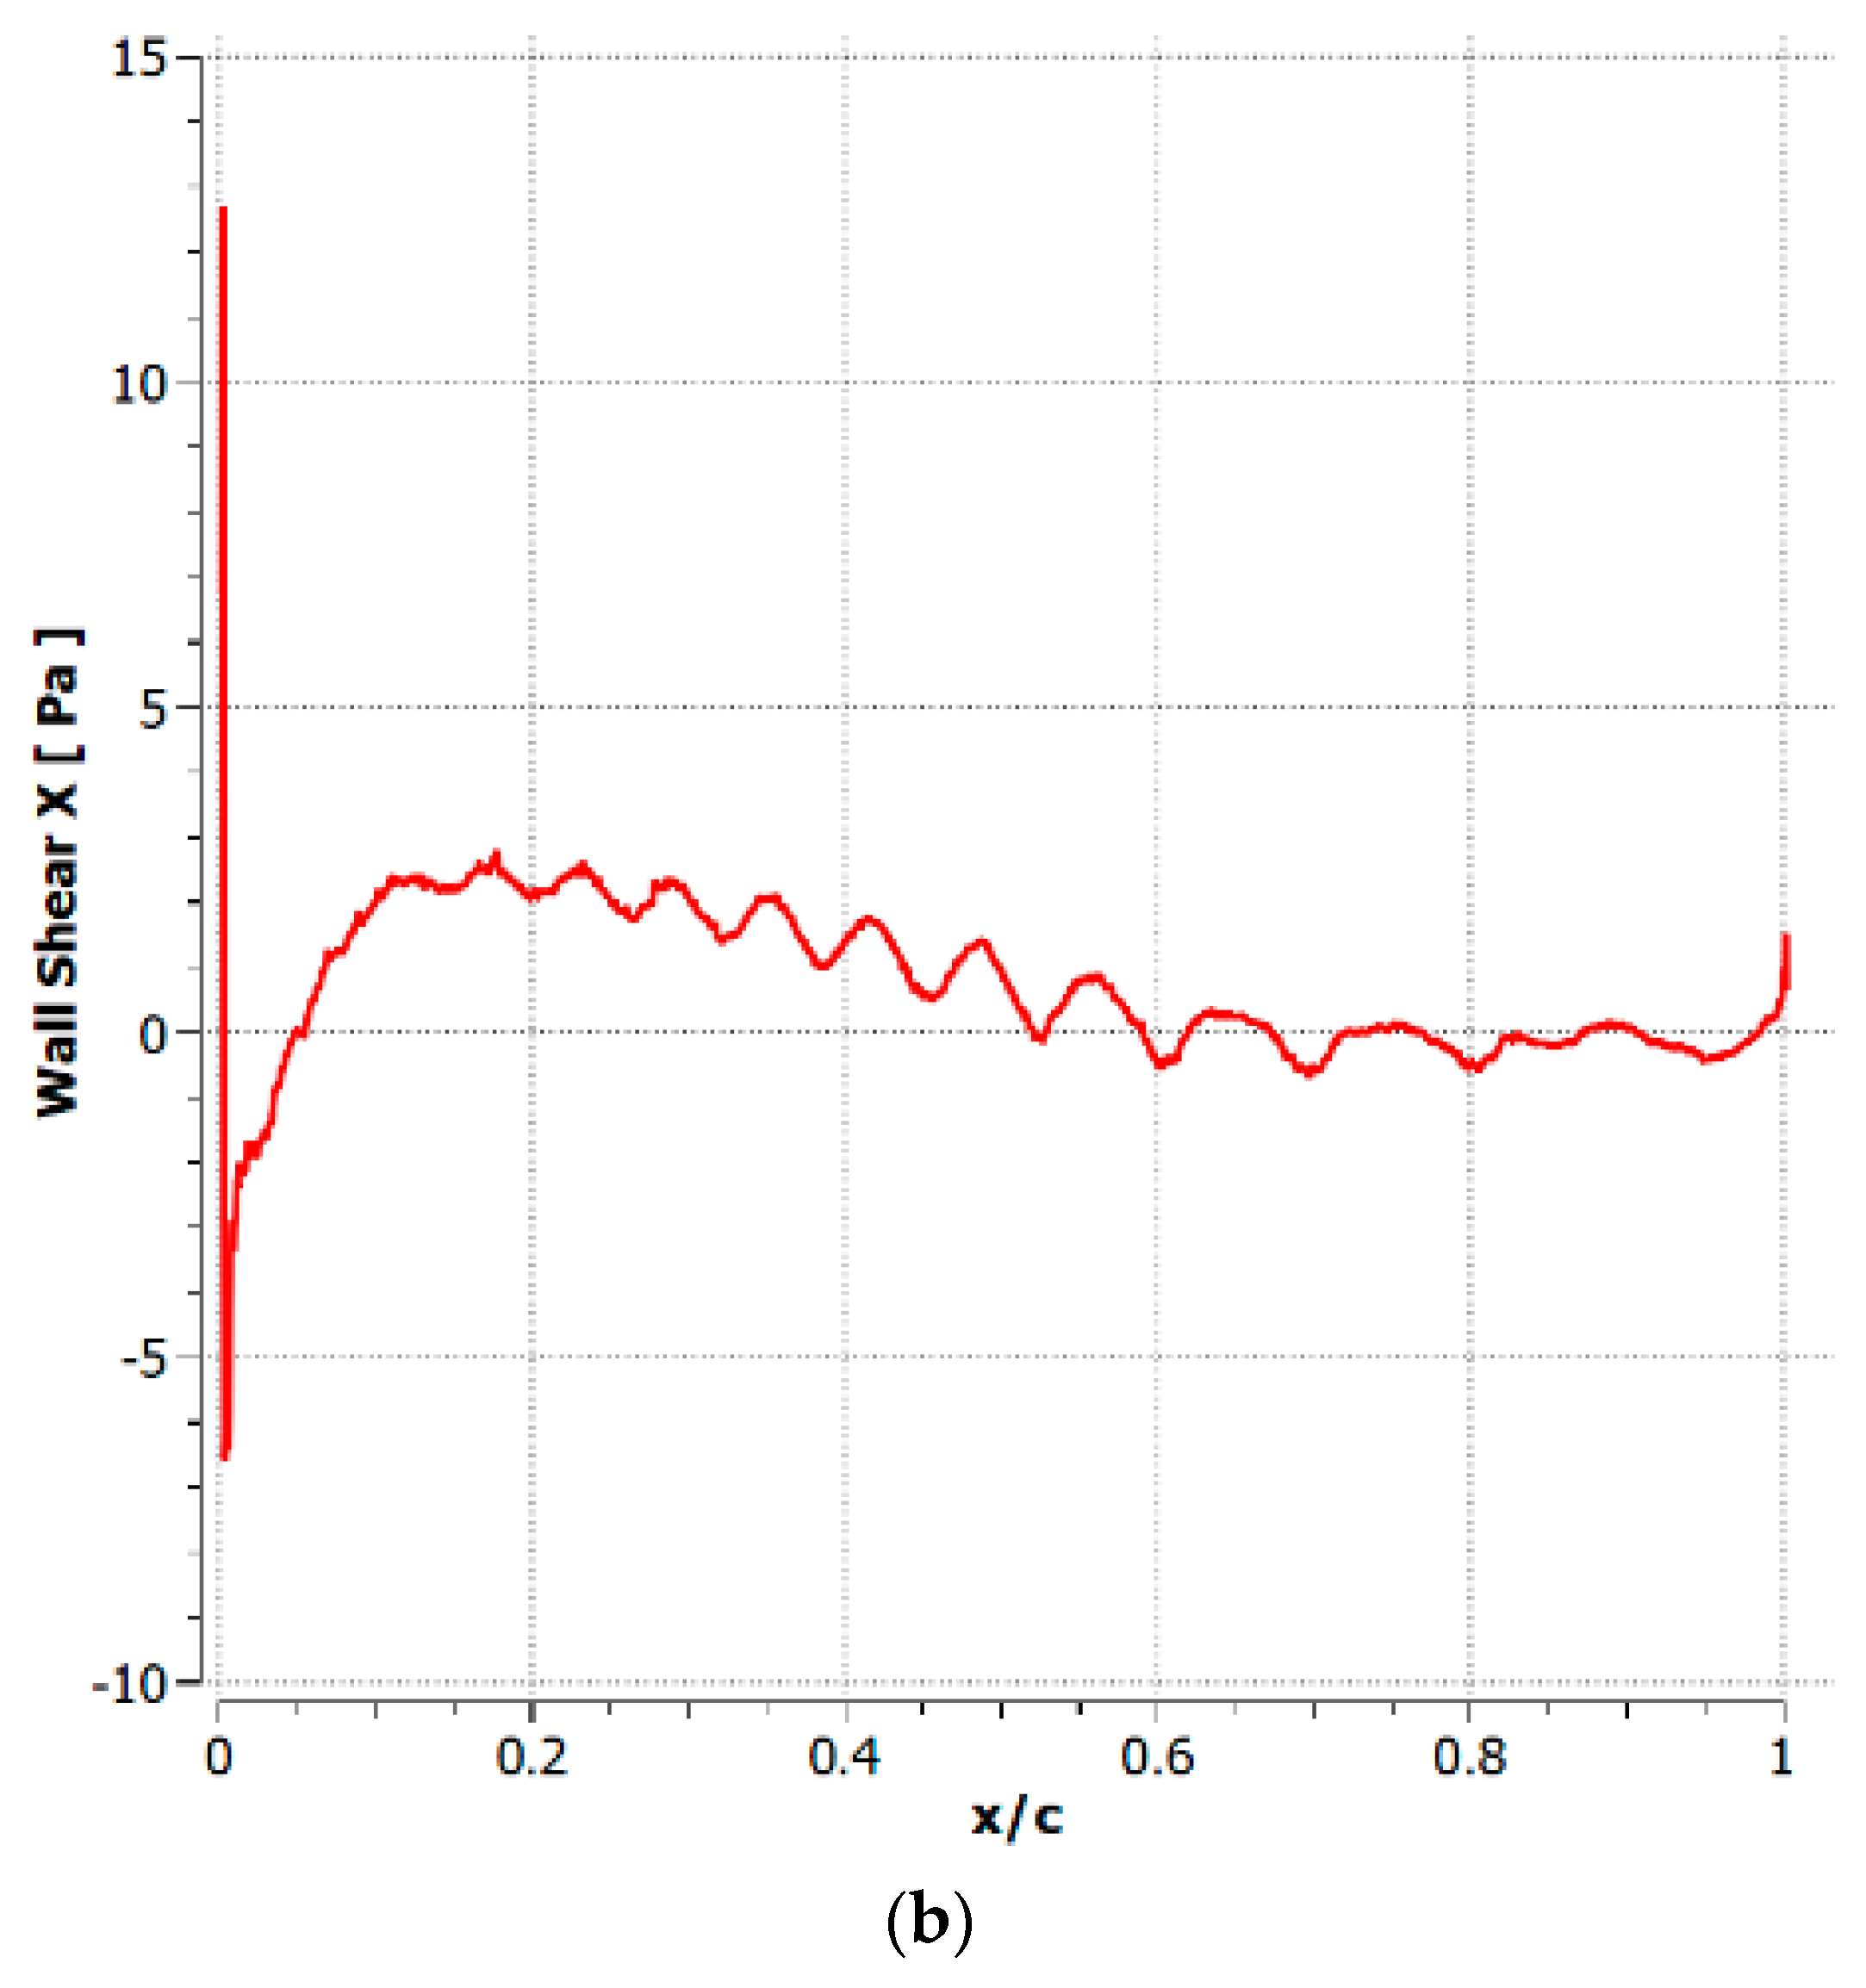
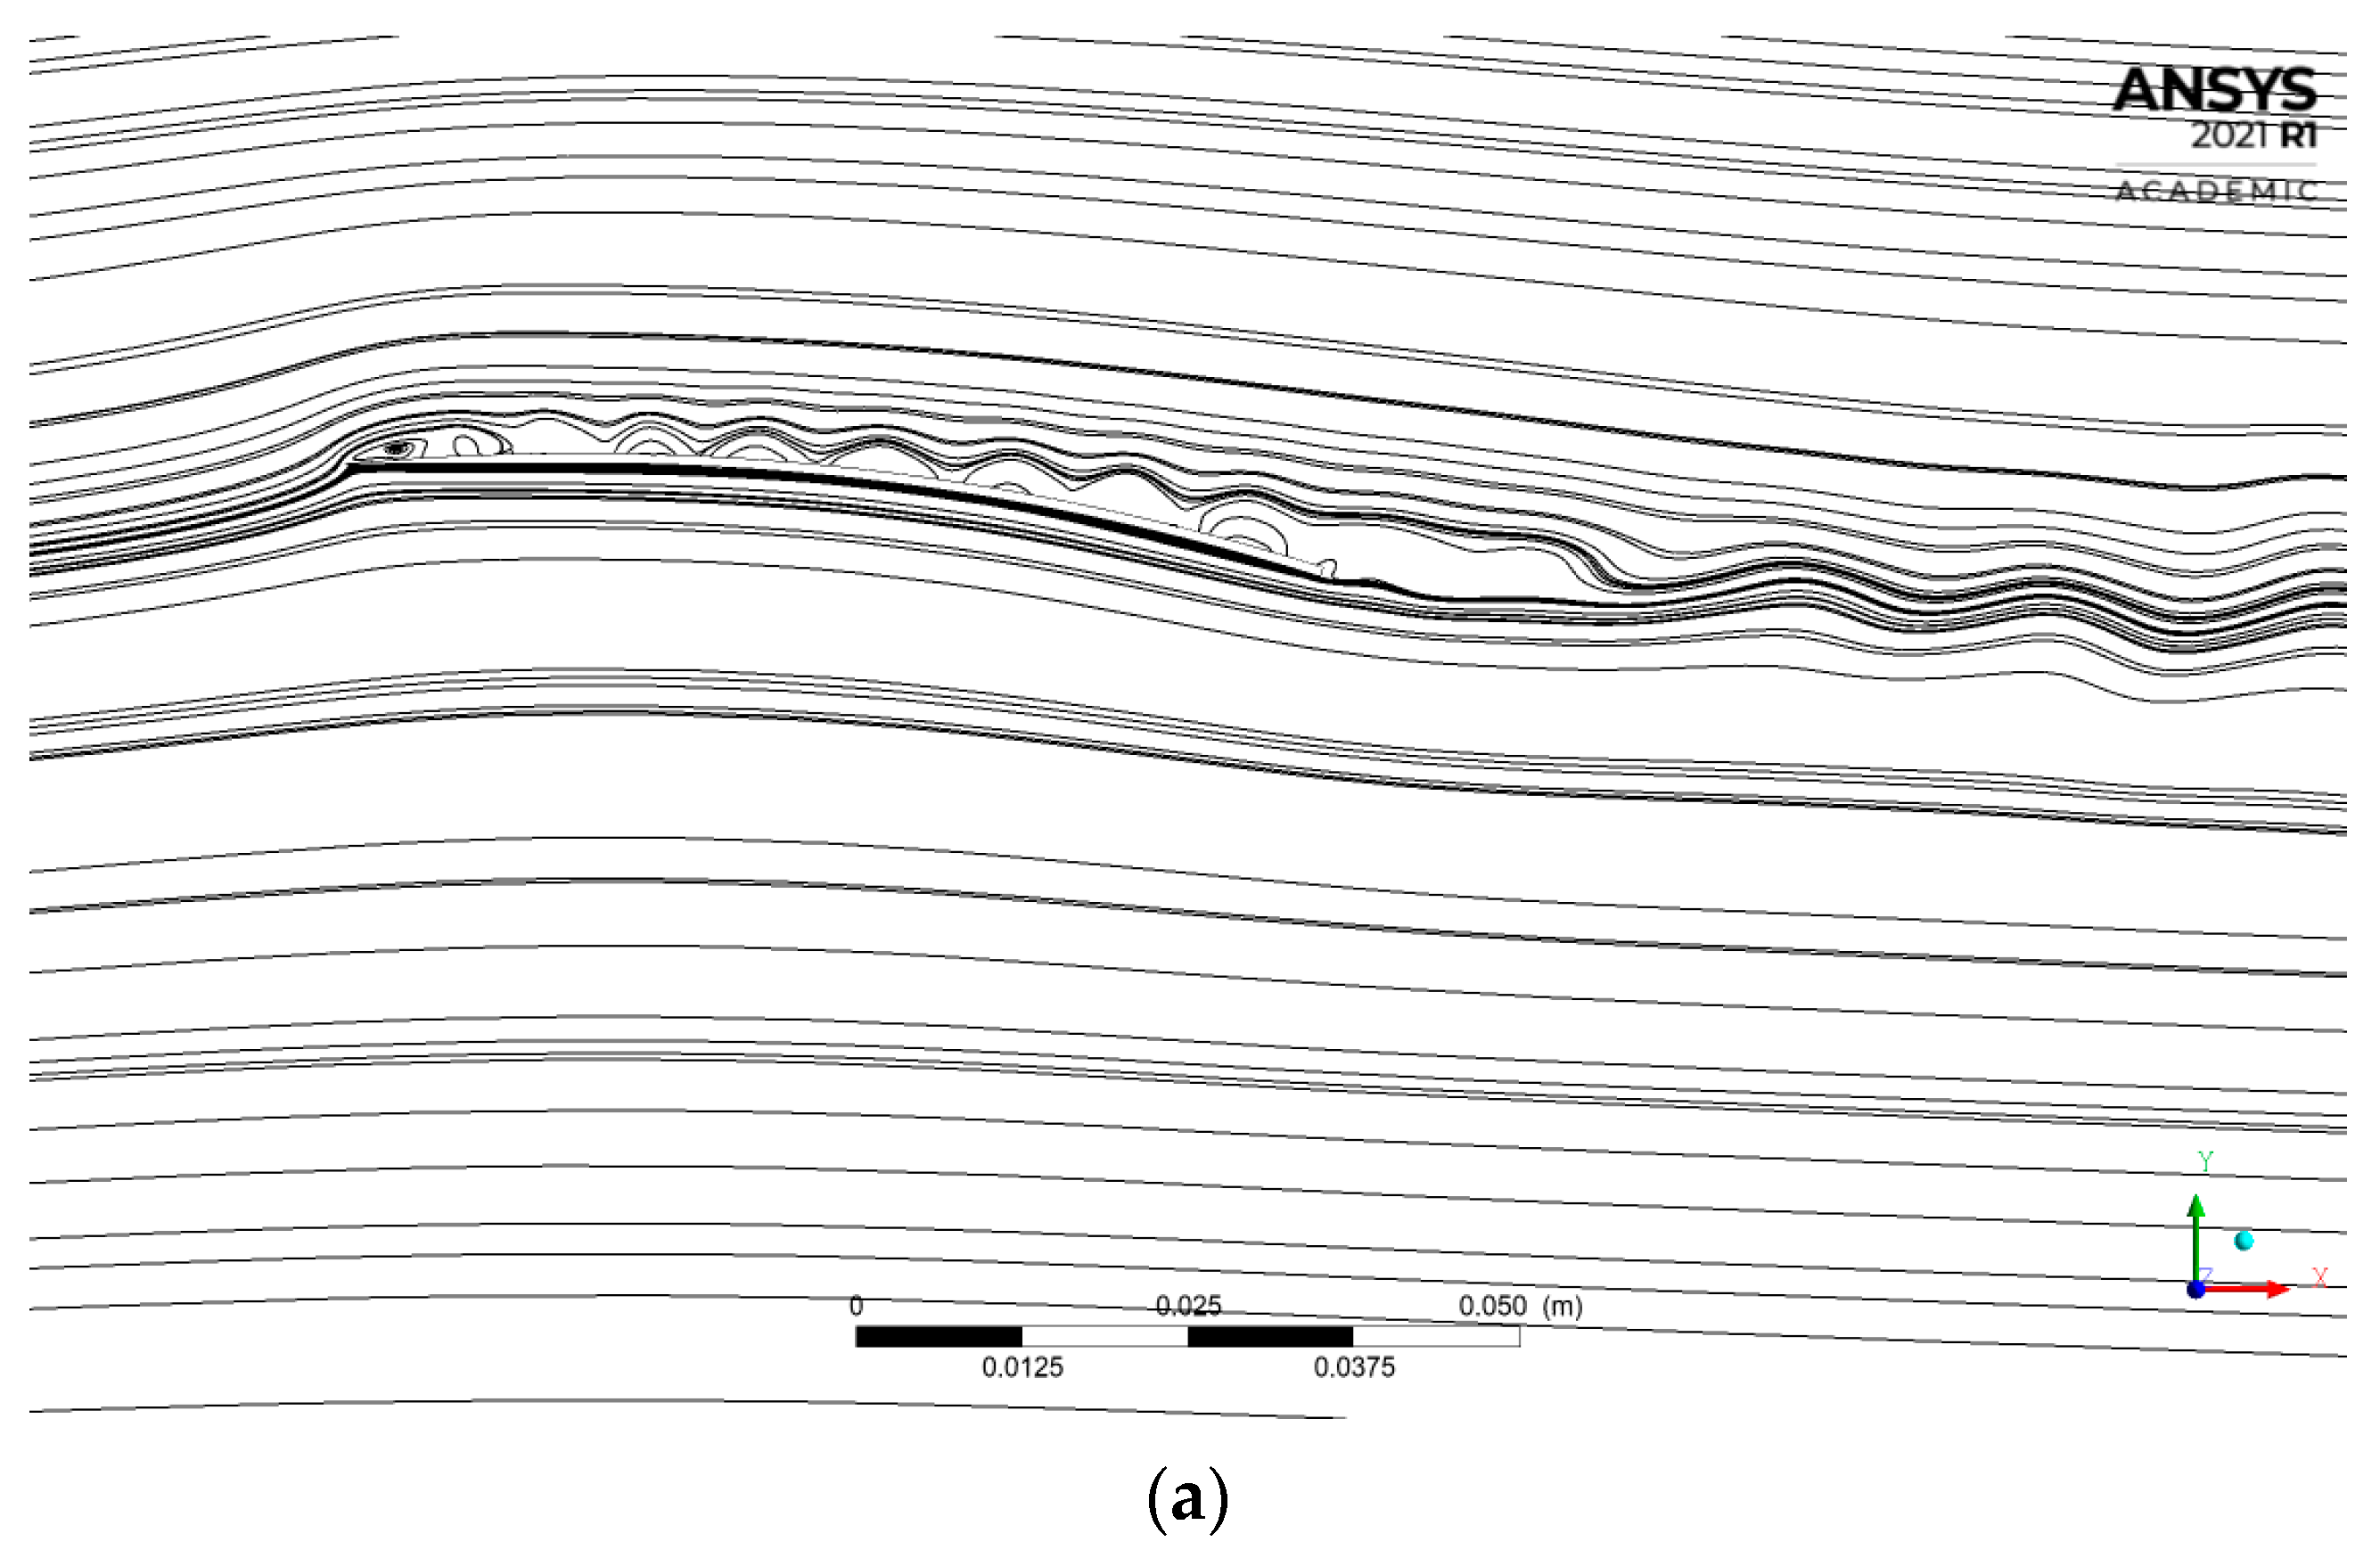
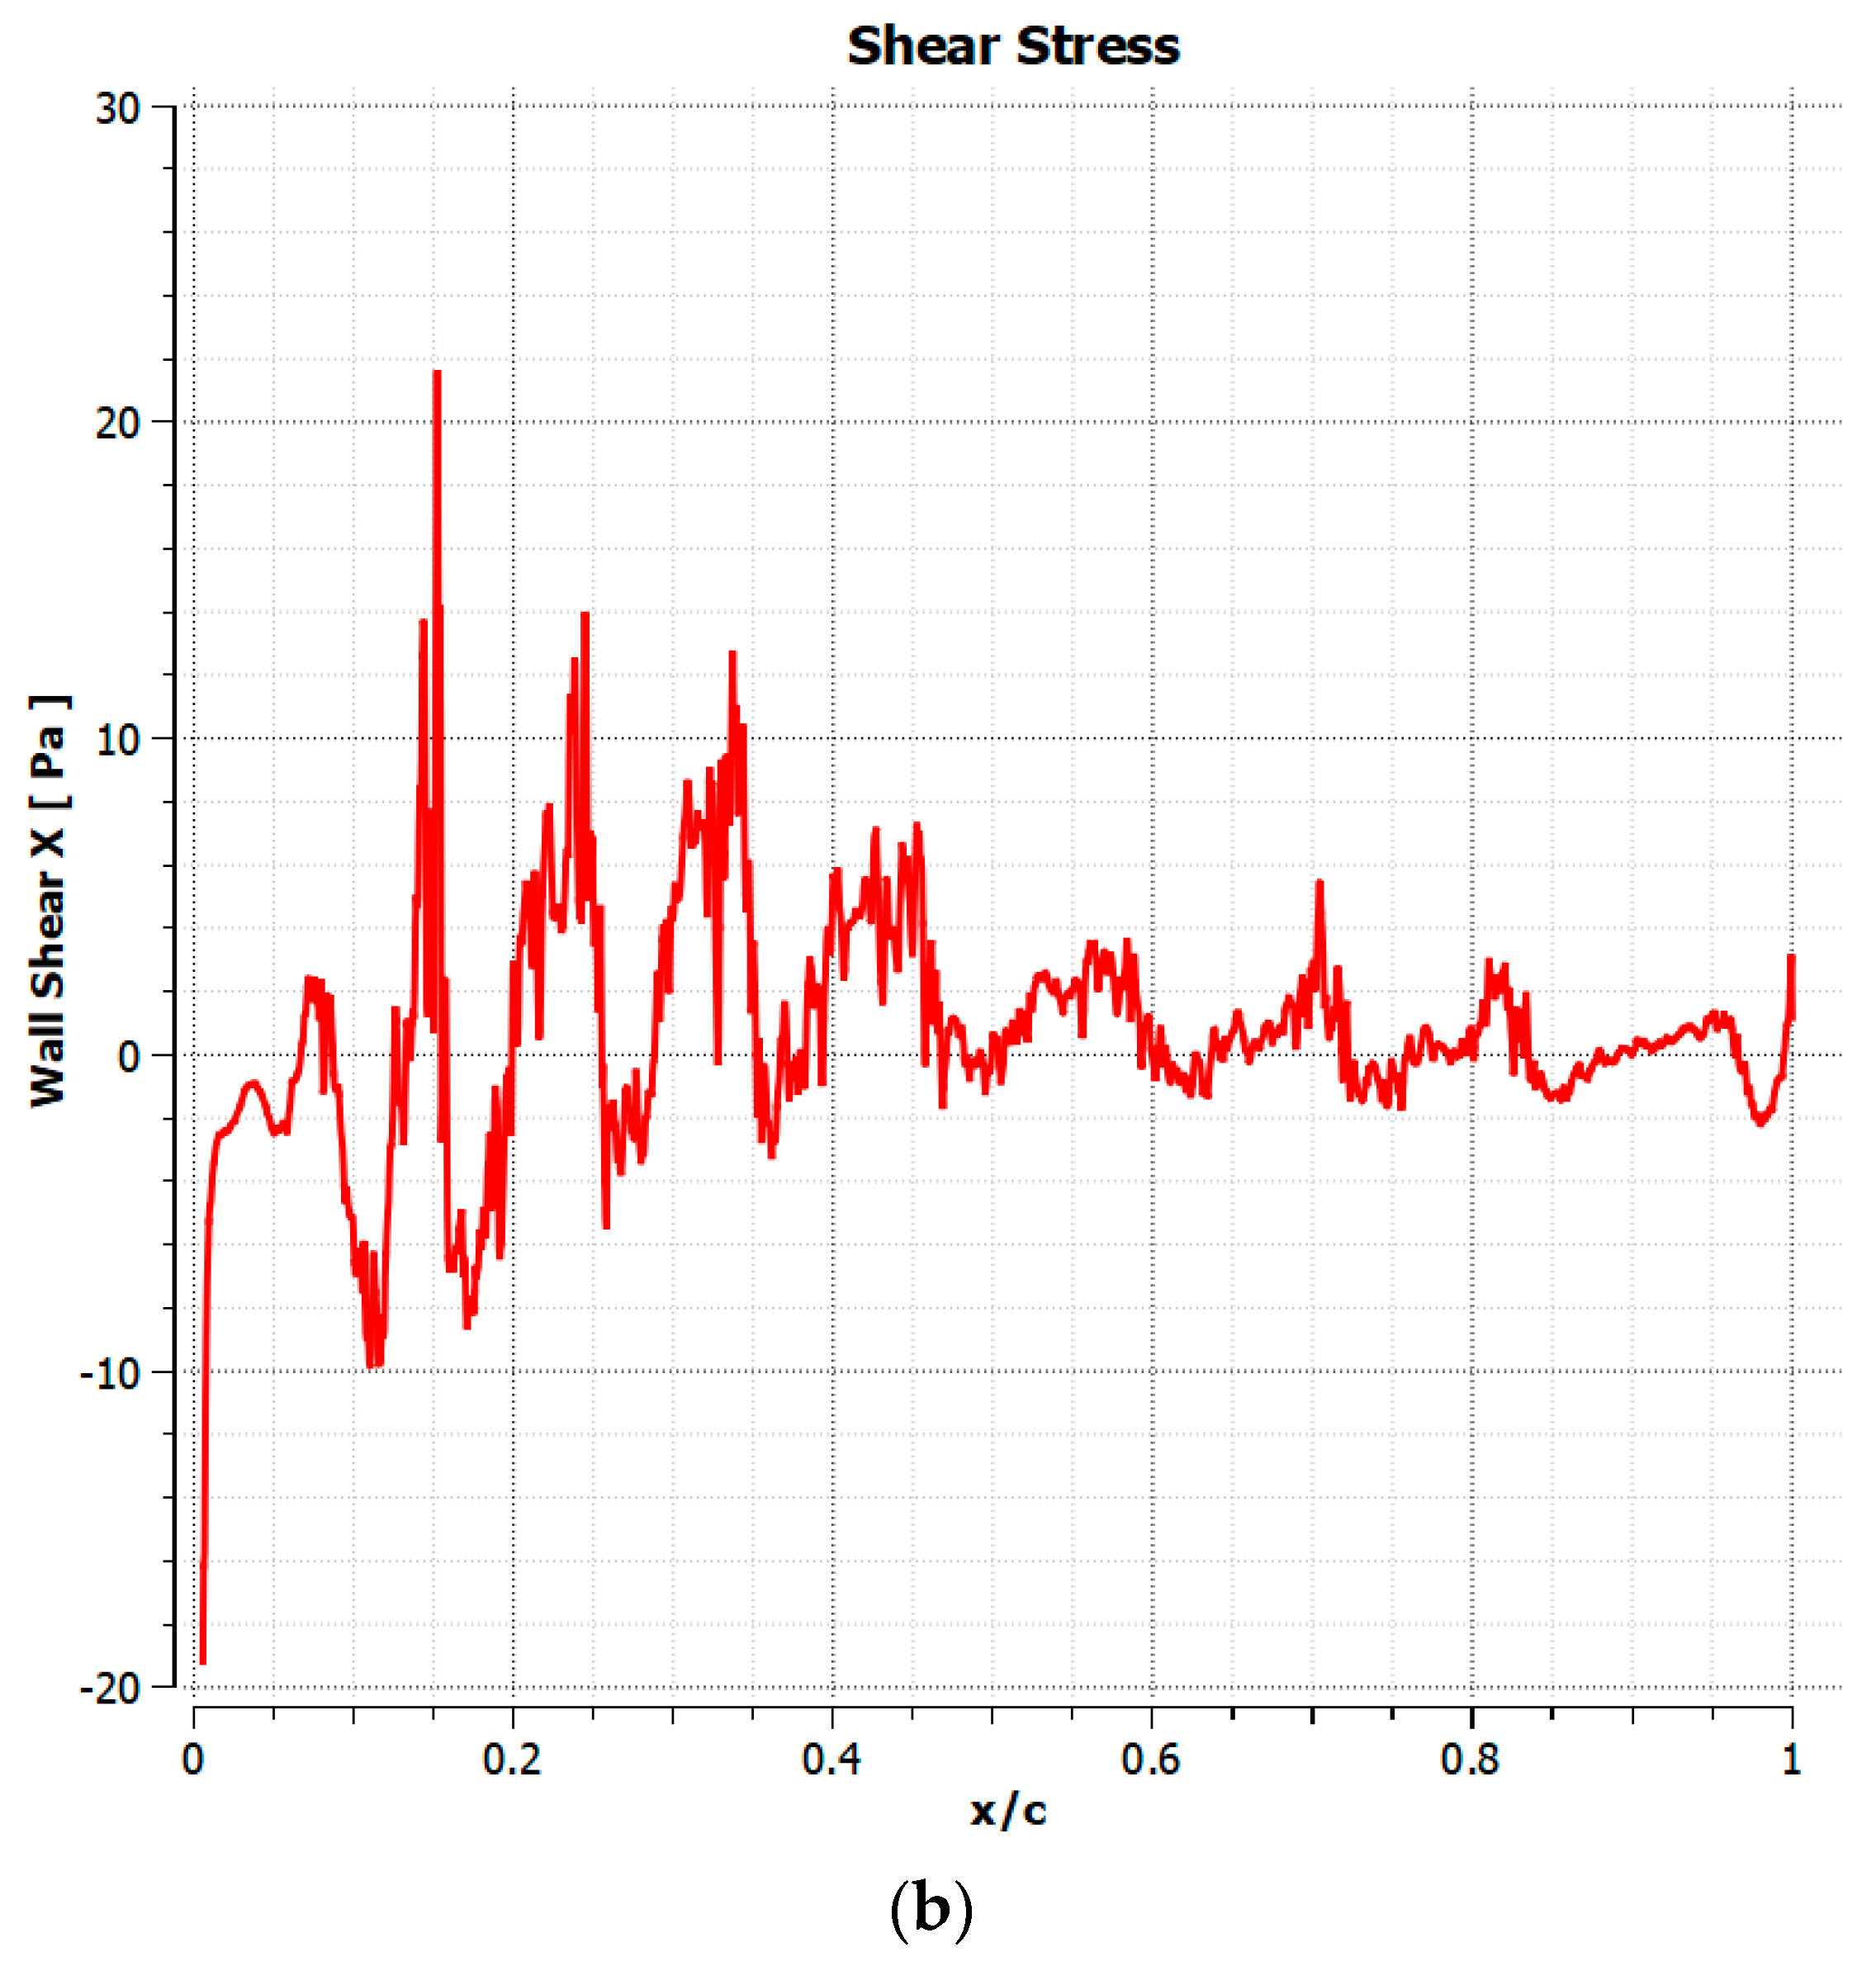
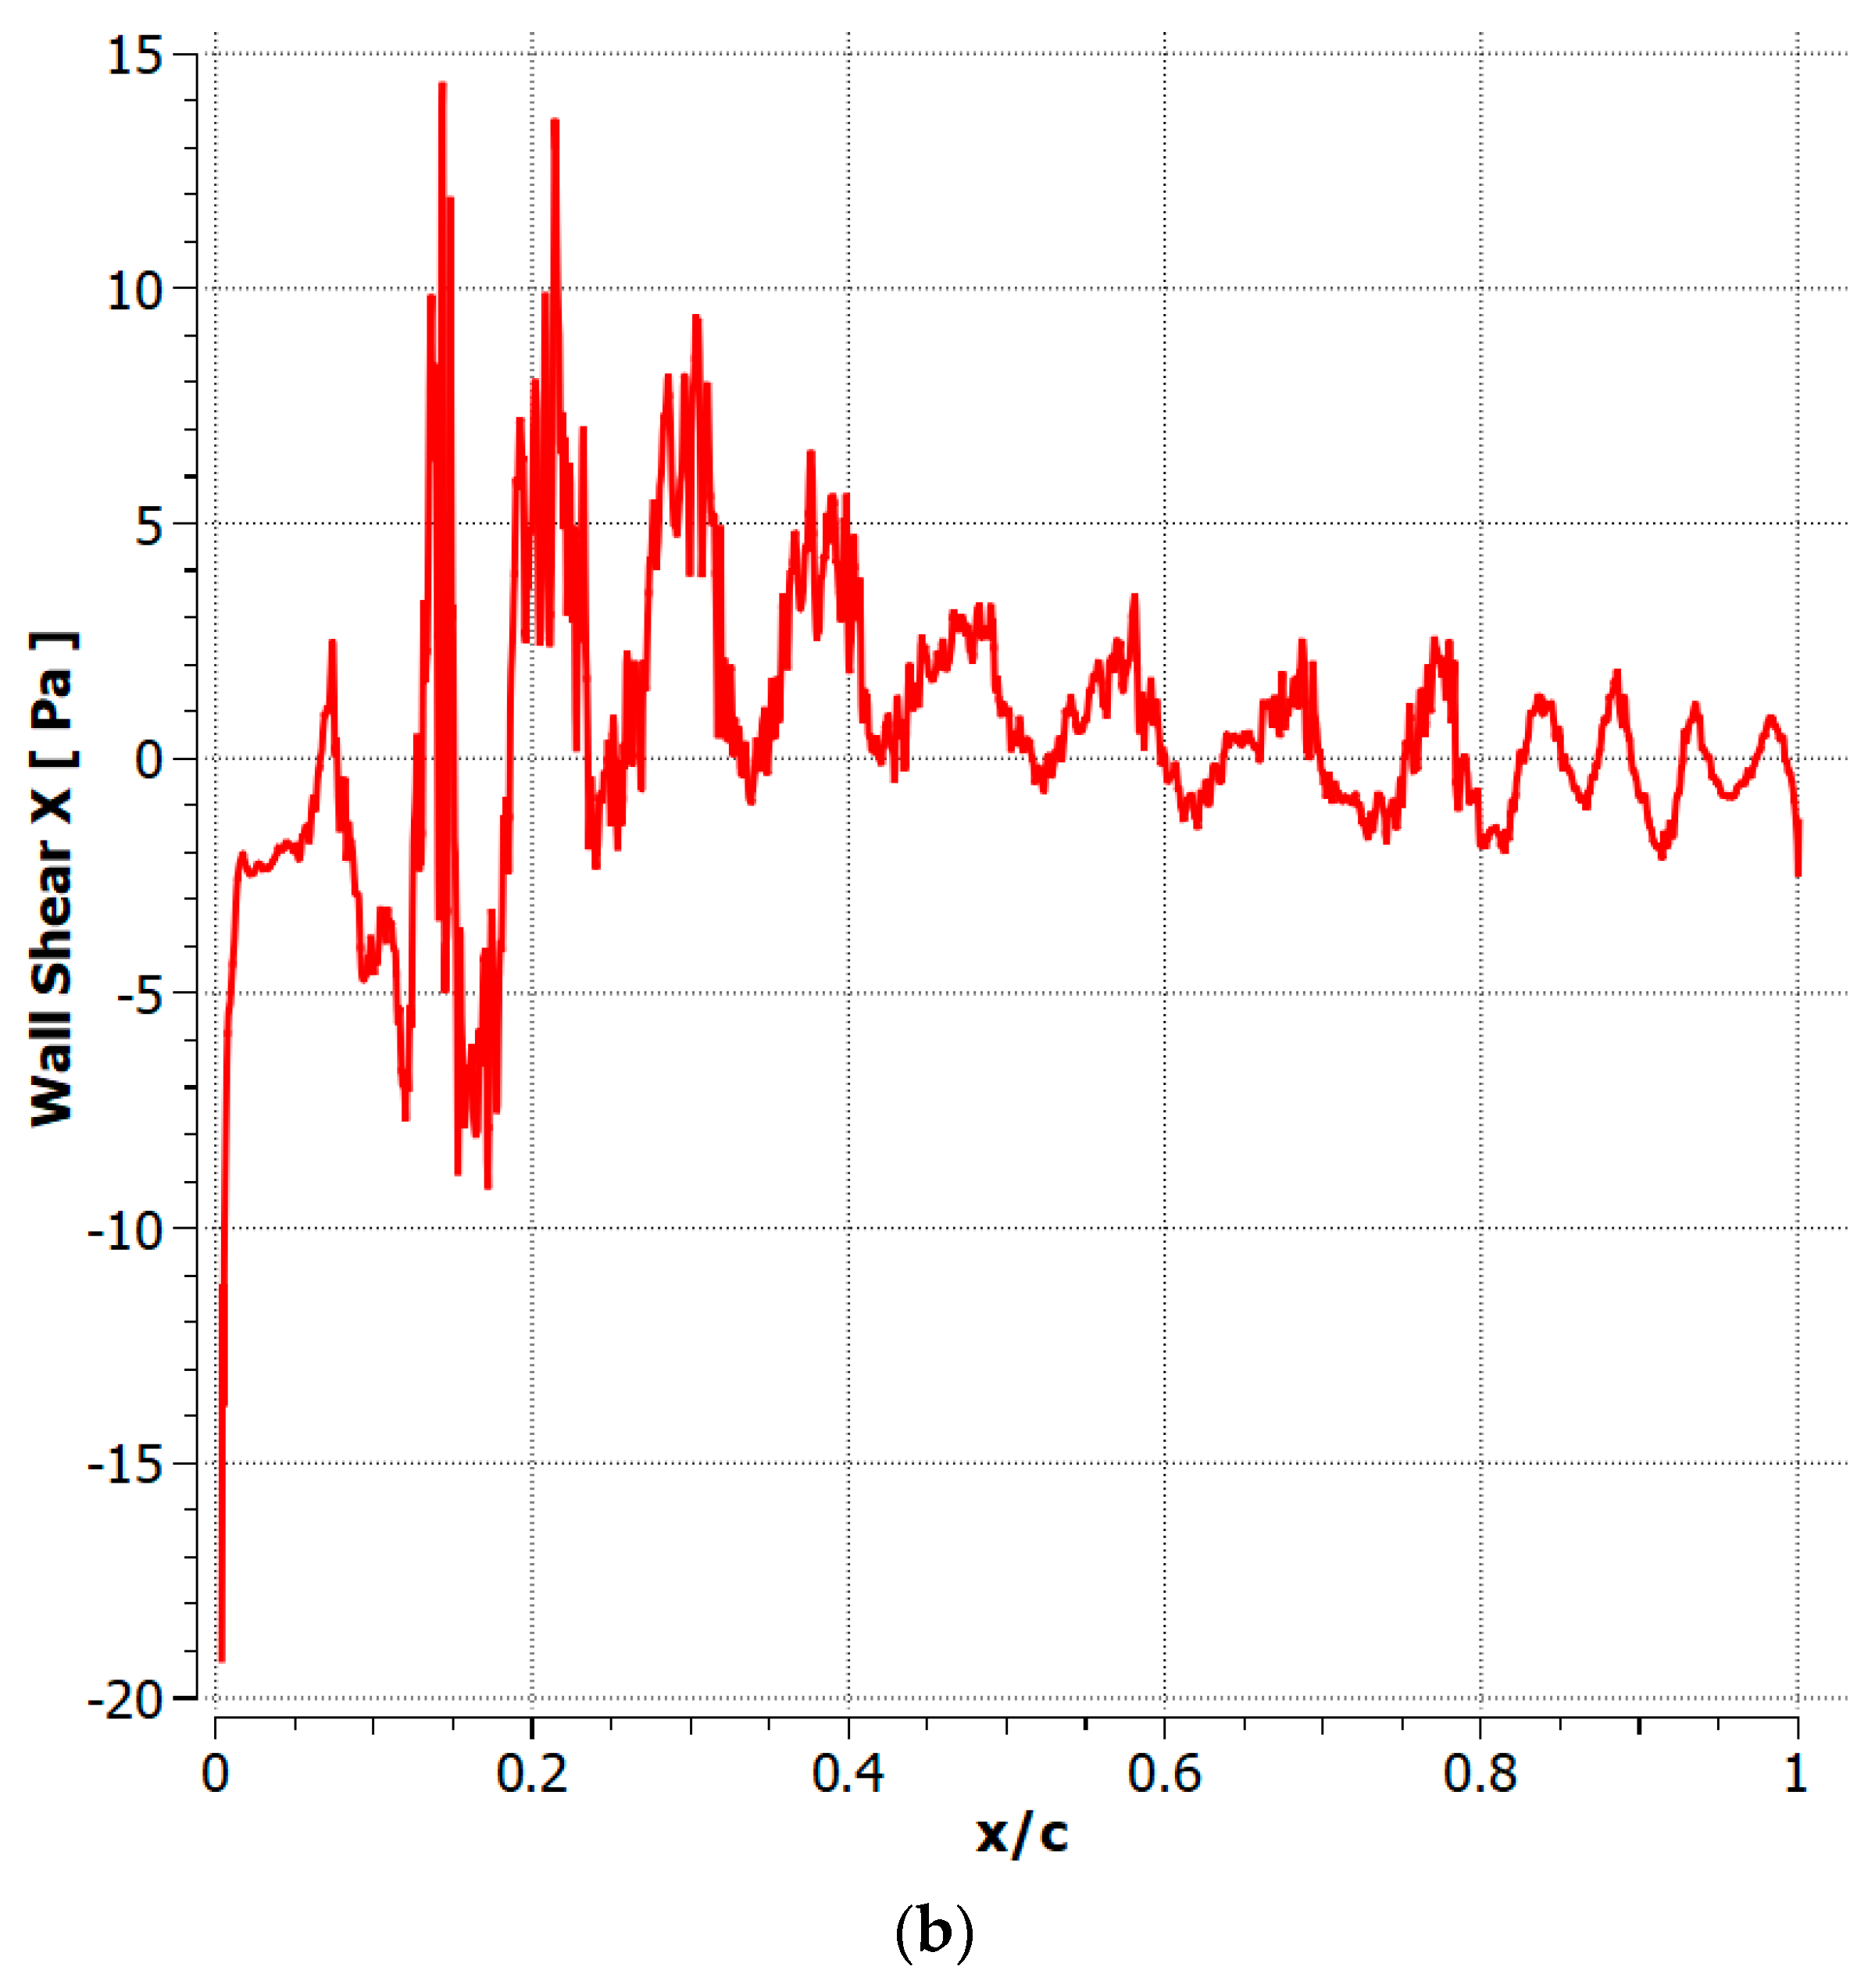
As shown in Figure 17, the BL configuration developed over shape #5 at 4°. As the flow reached the LE, the flow separated but instantly reattached and remained attached up to x/c = 78% over the airfoil. This value was extracted from the shear stress in the suction surface (Figure 17b). After this location, the flow began recirculating, forming a LSB that broke into a vortex shedding after the trailing edge. On the other hand, as the flow reached the LE of shape #9, the flow separated and was reattached at x/c = 4.8%, developing a LEV (Figure 18a). It remained attached up to x/c = 85% where it then separated near the trailing edge, generating a vortex shedding pattern behind the airfoil. At this AOA, the LEV in shape #9 (Figure 19) penalized the performance with increased drag, which explains the slightly lower lift-to-drag ratio compared to shape #5 at 4°. Similarly to shape #5, the vortex shedding formed behind shape #9 is evidenced in Figure 18.
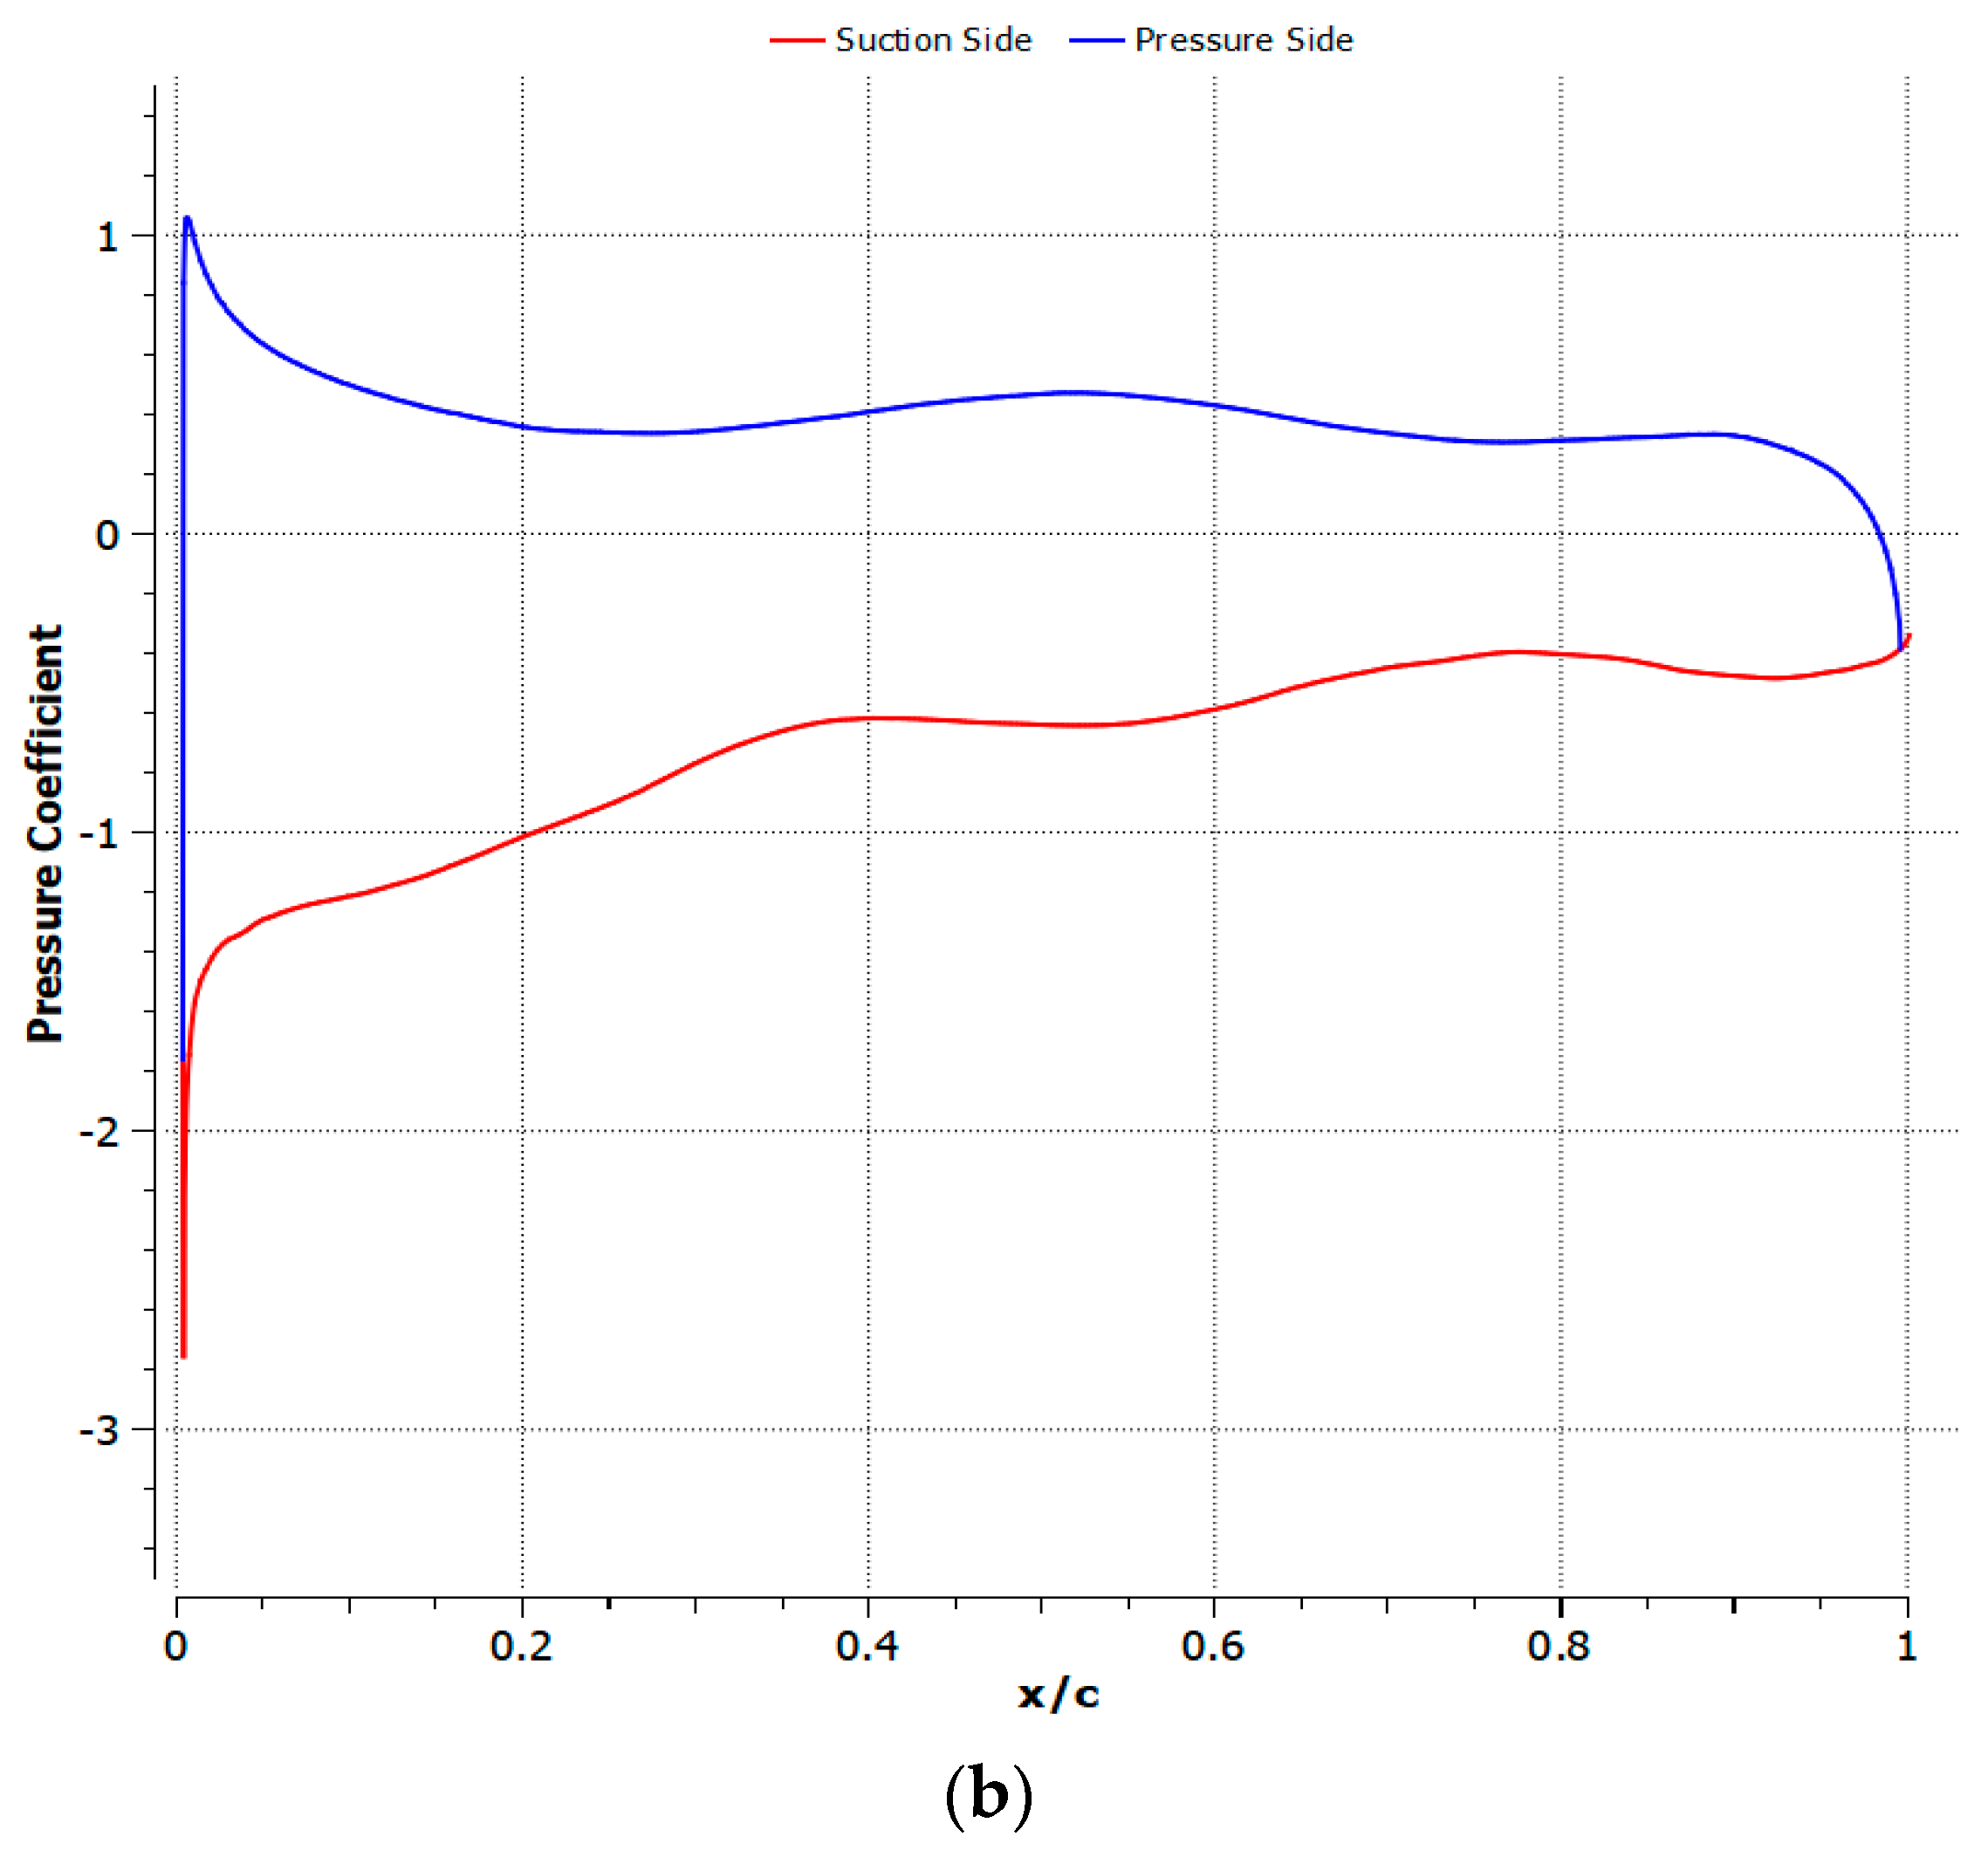
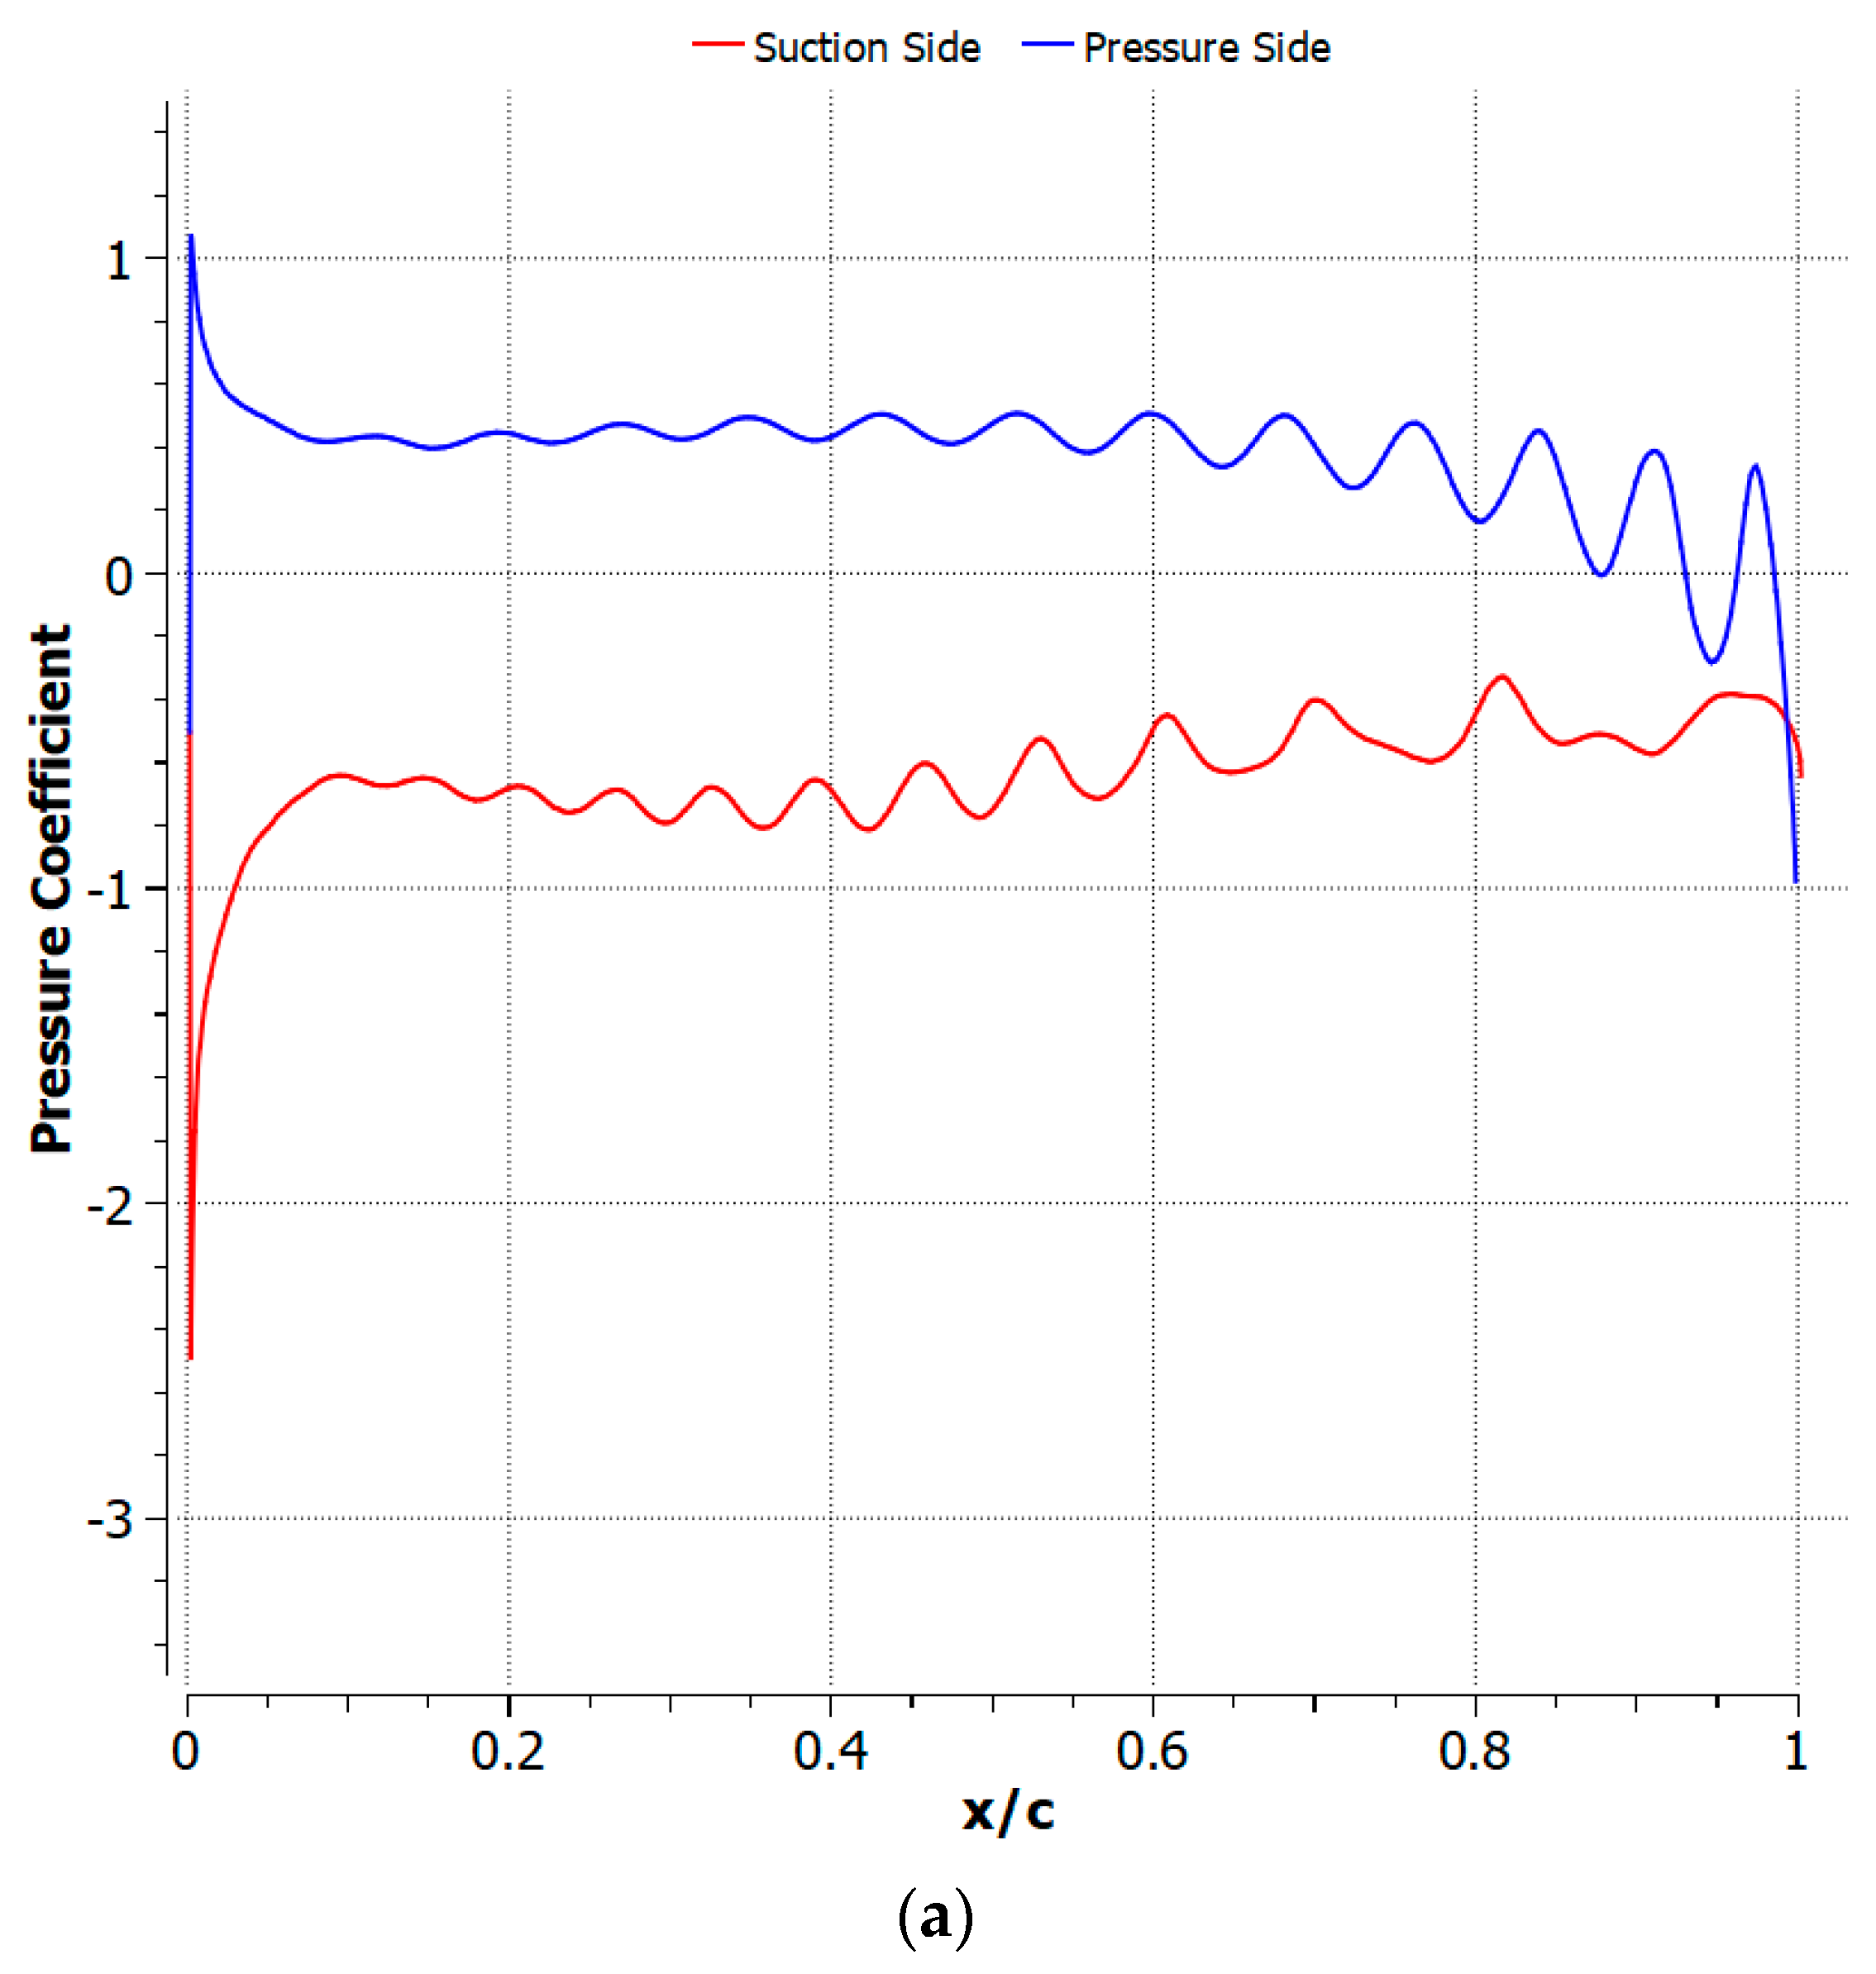
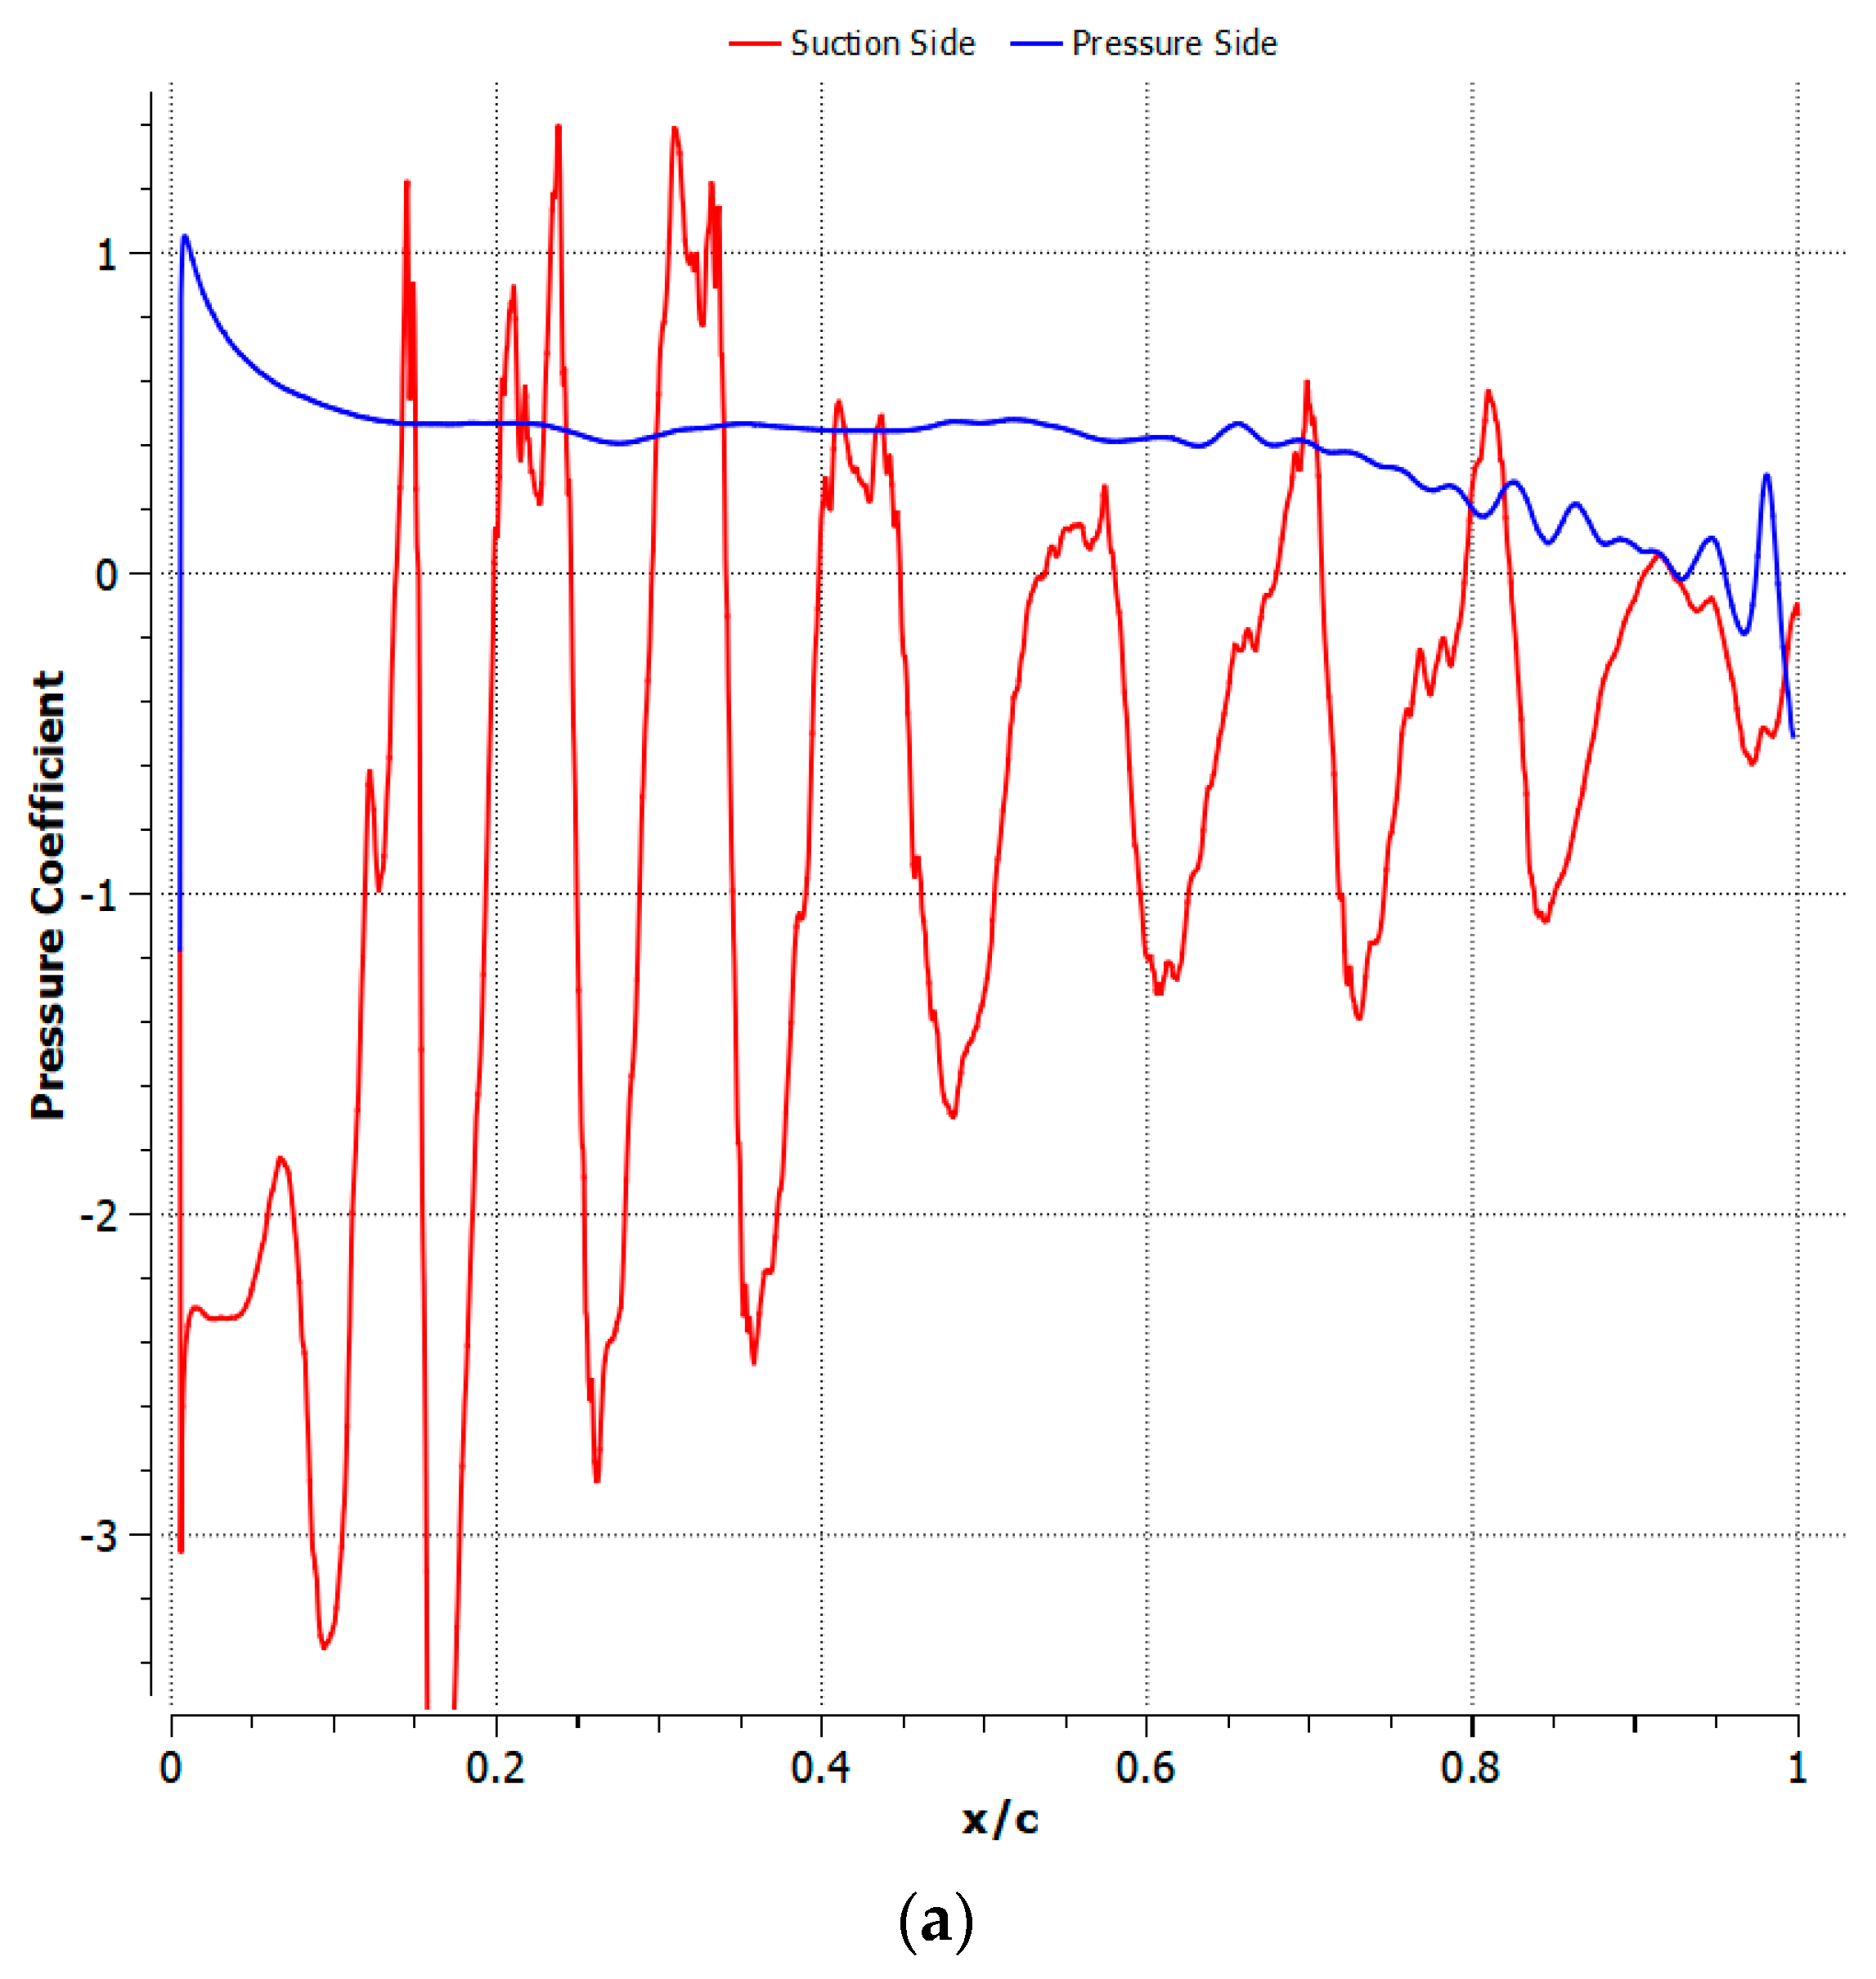
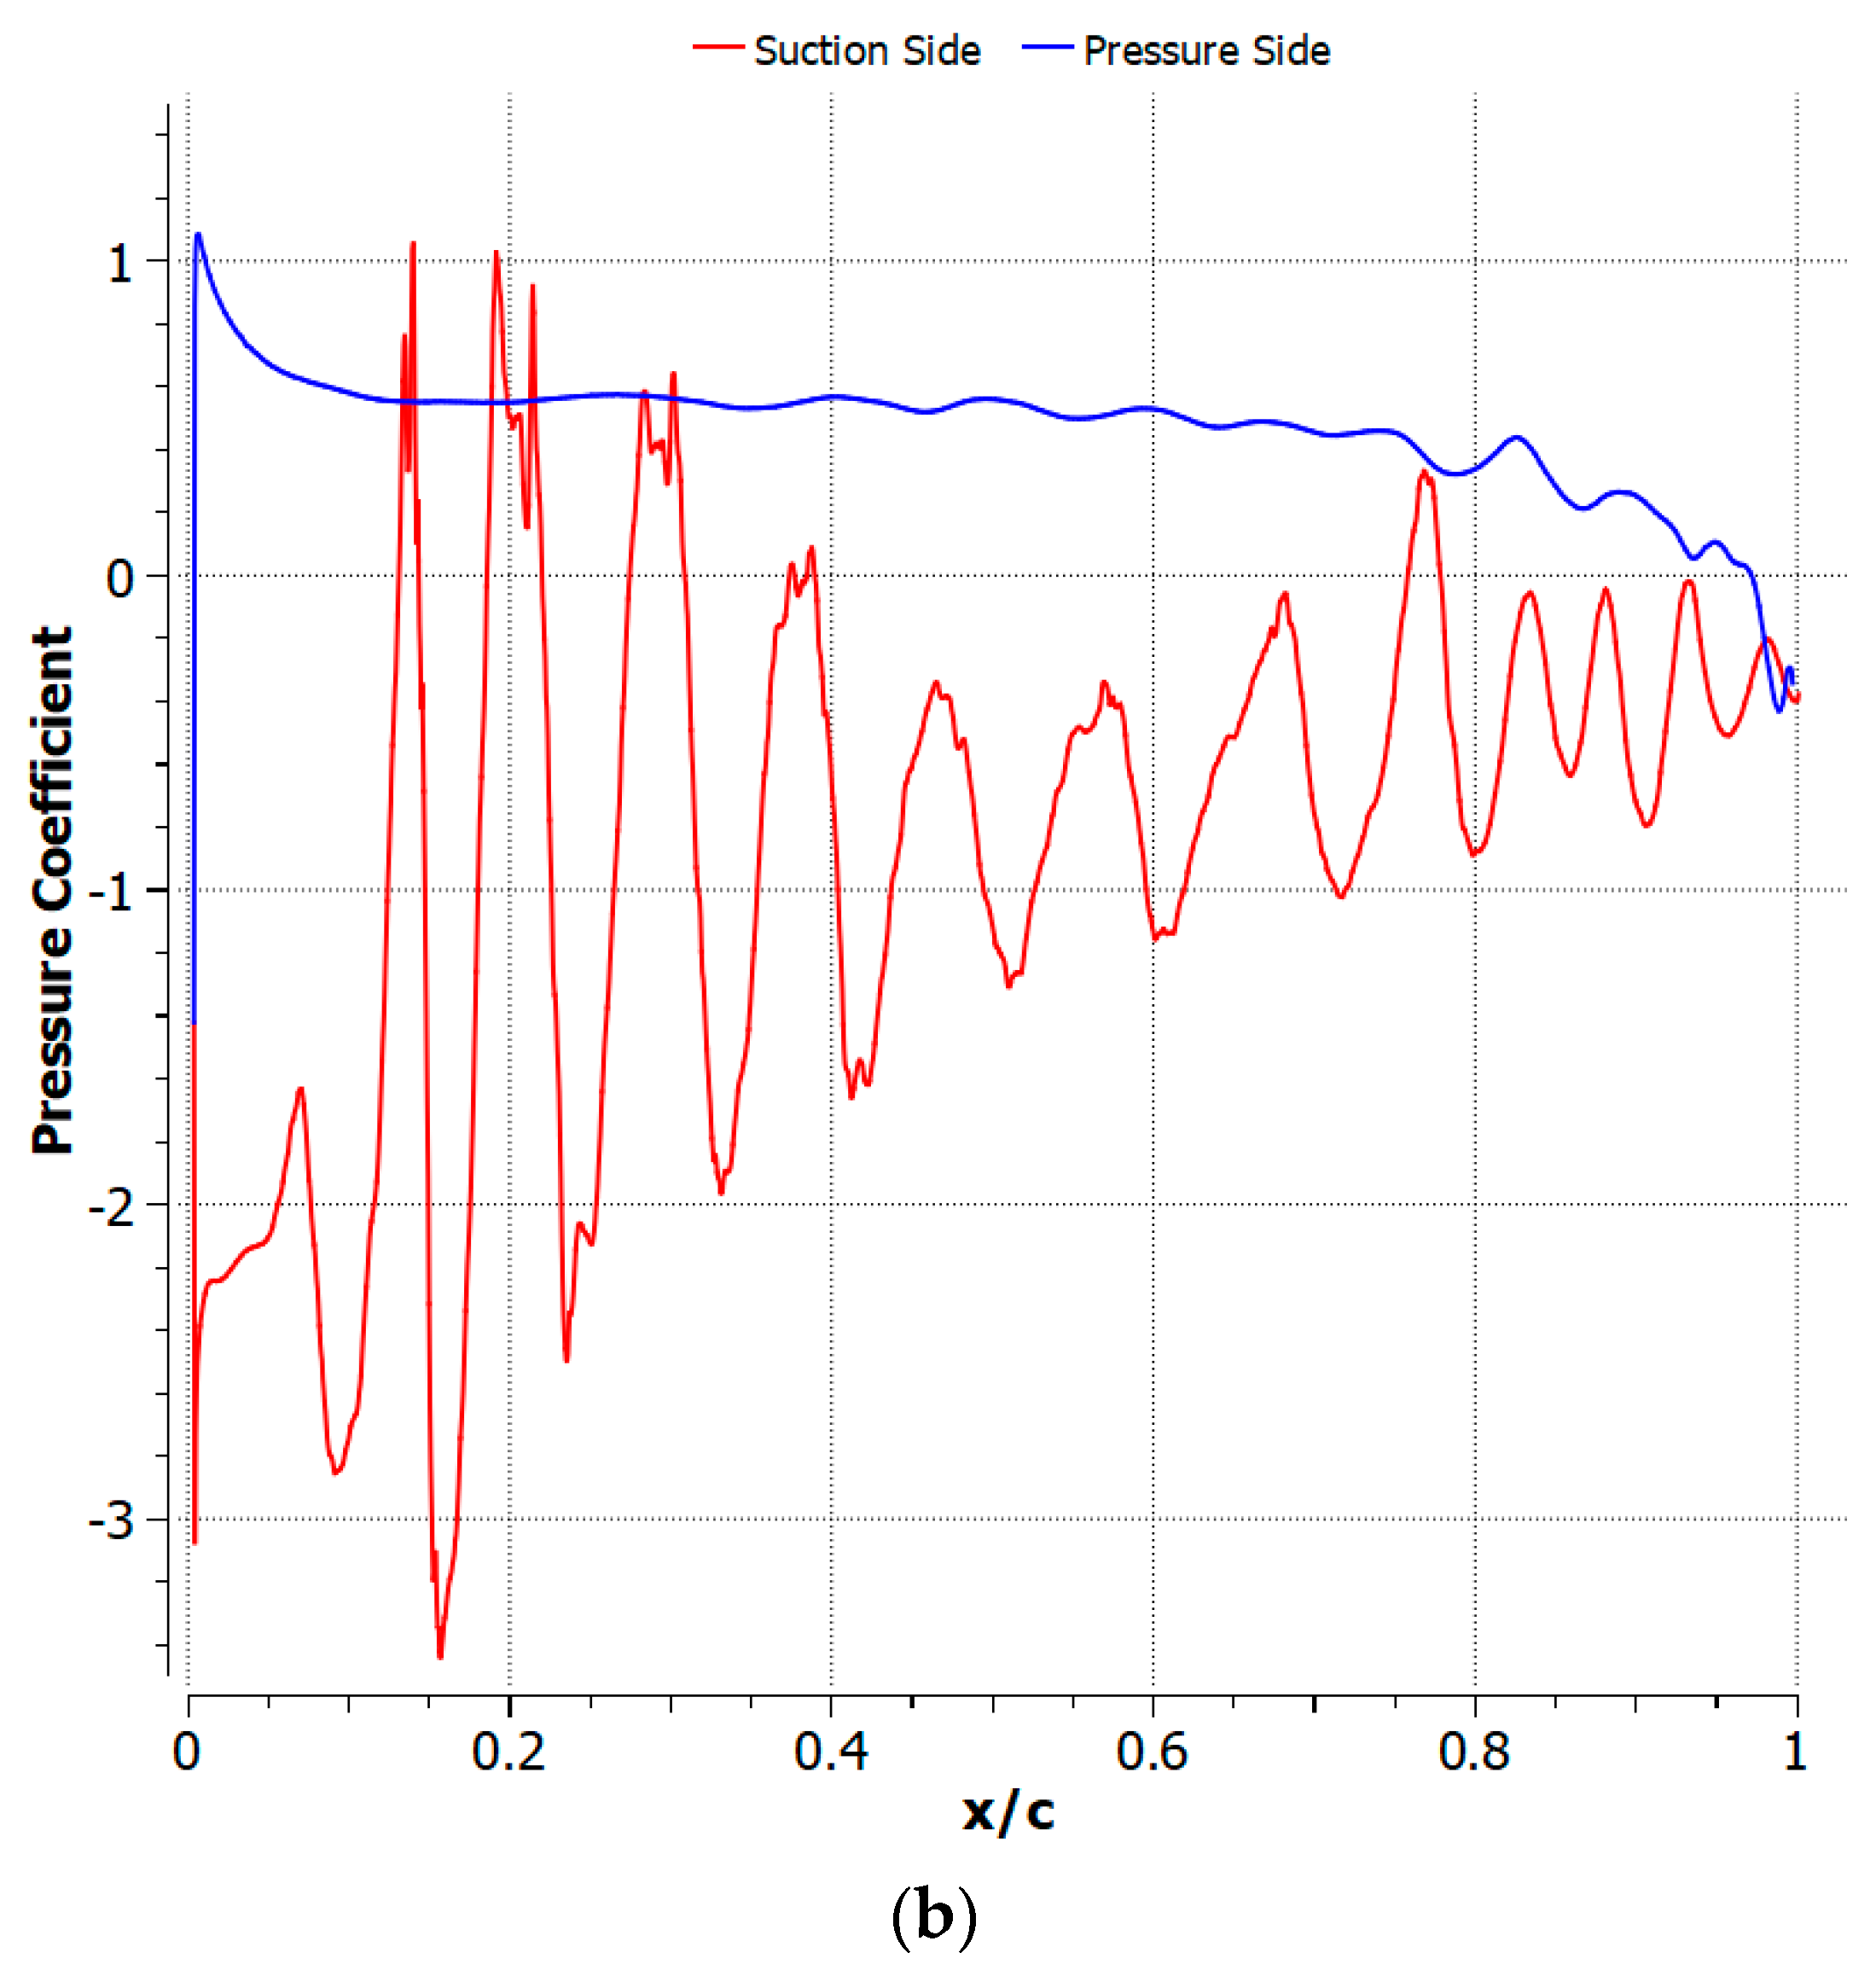
At 6°, both airfoils developed a LEV on the LE and separated closer to the TE. The LEV over shape #5 closed at x/c = 30%, and the BL remained attached up to x/c = 66%, separating with no reattachment. Similarly, shape #9 developed a LEV up to x/c = 43%, and the BL separated at x/c = 83%. The BL over shape #9, despite having a larger LEV, remained attached longer over the top surface compared to shape #5. This reflected a lower drag and, consequently, a larger lift-to-drag ratio. The adverse pressure gradient in the LEV and LSB were expected to increase drag over the airfoils. However, both flow structures were also expected to promote the reattachment of the BL, resulting in lower drag in comparison to the separated BL. This was exhibited at 6° between shape #5 and #9. By analyzing the pressure coefficients developed around both shapes (Figure 20) it was noticed that after reattachment, the pressure decayed quickly until separation for shape #5 but remained consistent until separation for shape #9. These behaviors were linked to the precipitated separation in shape #5 and the attached BL over shape #9.
In general, with a lower camber, the drag coefficient tended to be lower, influencing the BL separation that would be closer to the trailing edge compared to the configurations with 4% fc. However, the lift coefficient generated in the later configurations exceeded the increased drag generation and a more turbulent BL on the suction side appeared. From the efficiency point of view, the medium camber configuration performed best for the reasons stated above.

4.2. Cambered Plate at M = 0.5

Shape #8 showed an overall improved performance compared to shape #5 (Figure 16). The effect of f and x was particular to each camber level. The low camber was considerably improved with a forward camber due to a smaller LEV. As x moved to the trailing edge, the lift-to-drag ratio was reduced due to a higher LEV induced drag. The medium camber shared a similar behavior, where the backward camber showed a poor performance. Finally, the high camber was greatly influenced by x. In fact, the forward camber not only achieved a higher lift-to-drag ratio, but also shifted to a higher AoA (10°) compared to the other shapes. However, the same shape at 4° and 6° showed a poor efficiency compared to shape #8. It seemed that at M = 0.5, the backward camber was not beneficial for the flow transition. The circular arc with medium and high cambers obtained a quicker transition and a longer flow.
The streamlines developed around shape #5 at 4° are shown in Figure 21. As the flow reached the LE, an LEV was formed, closing at x/c = 17%. Afterwards, the flow remained attached up to x/c = 59%. From this point forward, the BL transitioned to a turbulent up to x/c = 88%, where the flow separated. Shape #8 at 4° (Figure 22) developed the same BL structure. However, the turbulent BL increased from x/c = 55% to x/c = 72%, then separated with no reattachment. In this latter case, the premature BL separation penalized the performance of shape #8 at this AoA and increased drag by 25% in comparison to shape #5.
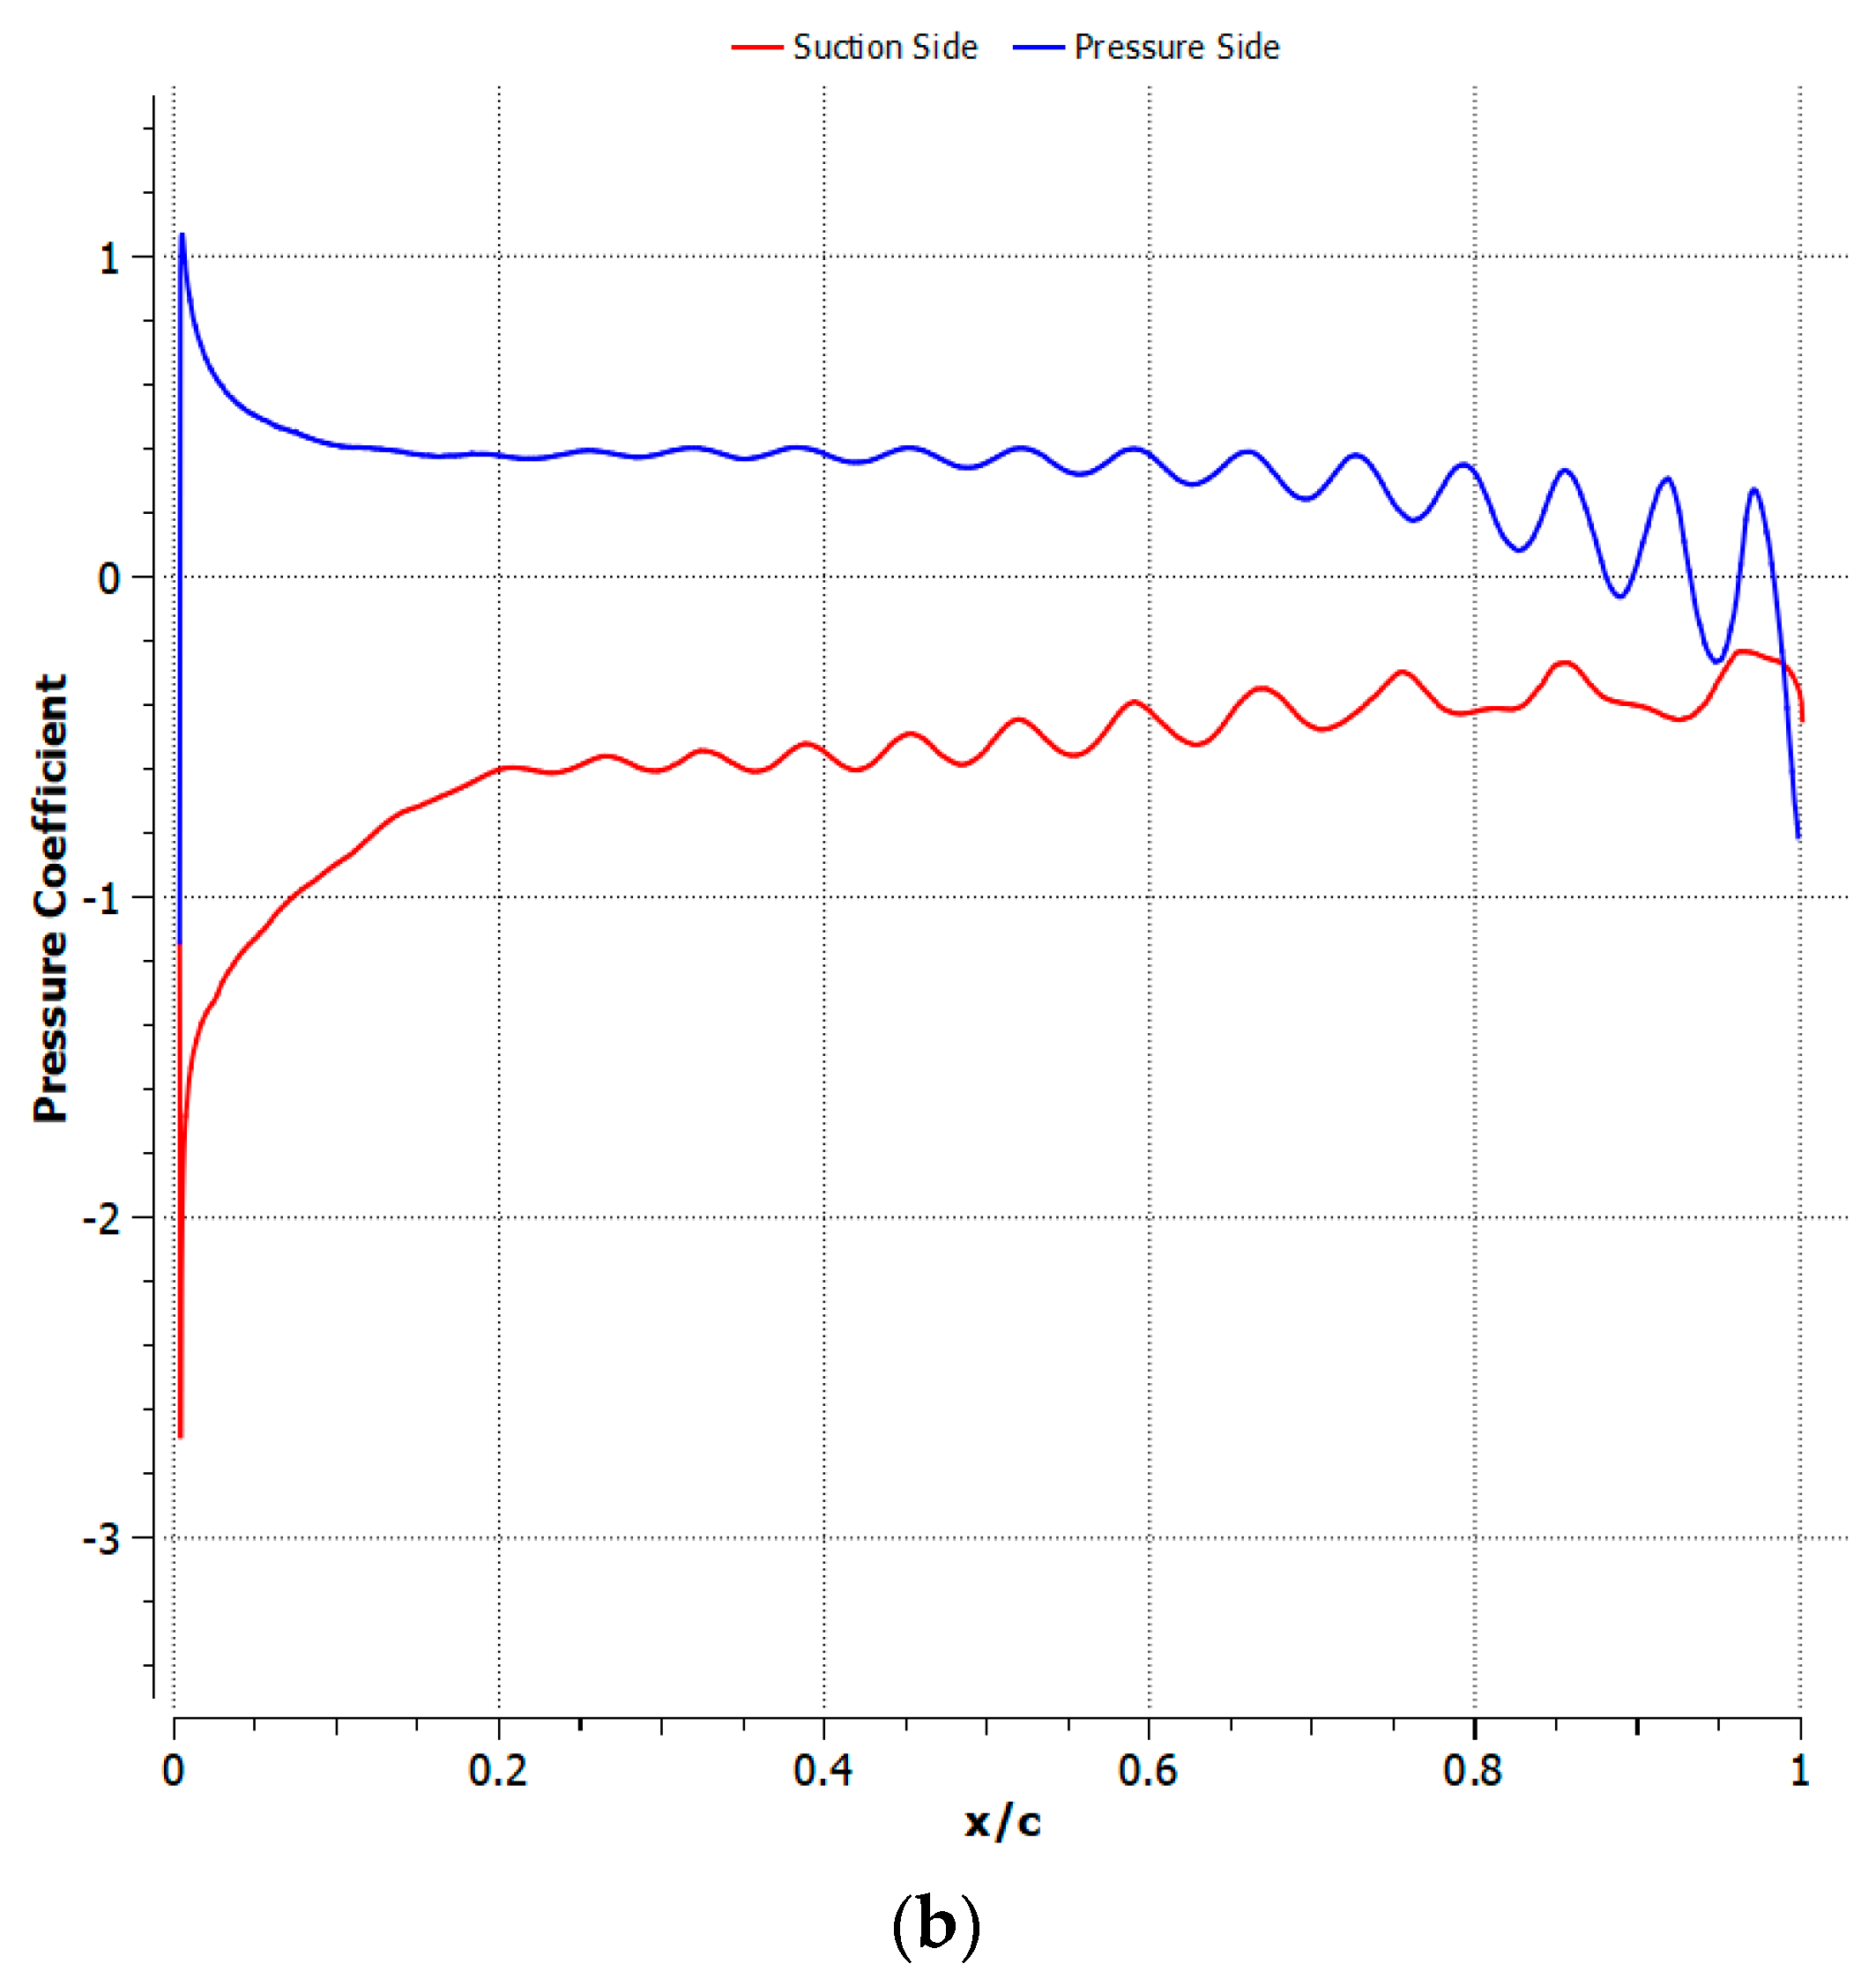
As shown in Figure 23, the pressure difference between the suction and pressure sides was larger for shape #8 in comparison to shape #5, enhancing the lift generation. However, the increase in lift did not compensate for the larger drag, resulting in a lower lift-to-drag ratio for shape #8 at 4°.
At 6°, the BL over shapes #5 and #8 separated at the leading edge and transitioned to an attached turbulent BL. Then, the BL separated near the trailing edge (Figure 24 and Figure 25). Despite having the same BL structure and sharing comparable drag coefficients, shape #8 took advantage of a higher lift generation. This was evidenced by inspecting the results plotted in Figure 26, where the pressure coefficient over the suction side of shape #5 showed a positive Cp along the chord. This positive value resulted in a reduced to no lift generation. Similarly, the first half of shape #8′s chord depicted positive values of Cp. However, due to the taller f, the pressure side showed larger values of Cp along the chord, resulting in a larger lift generation in comparison to shape #5, explaining the higher lift-to-drag ratio from shape #8 at 6°.

4.3. Cambered Plate at M = 0.7

As the turbulent BL separated, the unsteady response affected the applicability of the current model. Longer transient simulations may help to understand whether the model would be able to provide more accurate behaviors or if it is inadequate for higher speed conditions. A possible way to overcome this would be using a four-equation boundary equation and finer meshes. The proposed work was limited by the ANSYS license that was used.

5. Conclusions

The applicability of the commercial simulation software ANSYS Fluent to simulate the flow around an airfoil in Mars-like conditions was evaluated in this work. Additionally, given the computational power limitations, the analysis only focused on 2D simulations.
From the comparison of the results obtained in this study, and the results used for the ingenuity rotorcraft (0–6°) [33], it was found that the optimal shapes, among the nine options examined in this paper, showed a close correlation between the lift and drag development as the AoA changed. Notably, it was stablished that at M = 0.2, the backward high cambered plate (#9) showed the best performance over the Ingenuity’s AoA range. This airfoil shape showed a 2.9% increase in the lift-to-drag ratio at 6° compared to shape #5 (described in [17]). Similarly, the high circular arc cambered plate (#8) presented the best performance at M = 0.5 with a lift-to-drag ratio that significantly improved by 20% (at 6°) compared to the reference cambered plate (shape #5).
The model selected in this study used the transient compressible RANS formulation coupled with the intermittency (γ) SST turbulence model and was solved using the DB solver. The model showed comparable results to the MSH force coefficients model reported in [17] at M = 0.2 and M = 0.5. However, it was not accurate at M = 0.7. The parametric study showed that the higher f-values had a positive influence over the cambered plates at both the selected Mach stations. In fact, in all the cases, the lift increment was always larger than the drag increment which, in turn, reflected a larger lift-to-drag ratio over the reference circular arc with a 5% chamber. It was also observed that a backward camber (x = 70%c) had a prejudicial effect over the cambered plates at M = 0.5. At the same time, the forward camber (x = 30%c) showed potential only with a low camber at M = 0.5. Moreover, the circular arc cambered plates showed the best response at different Mach conditions and almost all AoAs.
Ultimately, this work provided insight into the framework for the flow simulation around an airfoil at Mars-like conditions using ANSYS Fluent. Continuing efforts on modeling the external flow around airfoils shapes under Martian conditions should use the mass flow rate instead of the constant velocities to include larger Mach number stations and higher AoAs.
The results provide great insight for the design of a 3D rotor blade. Finer meshes and more complex turbulent models (four-equation turbulent models, for example) should be explored in the future.

Author Contributions

Conceptualization, A.S. and M.M.; methodology, A.S., M.M. and M.C.; validation, A.S., M.M. and M.C.; formal analysis, A.S. and M.M.; investigation, A.S.; Resources, M.M.; data curation, A.S. and M.M; writing—original draft preparation, A.S.; writing—review and editing, A.S., M.M. and M.C.; visualization, A.S., M.M.; supervision, M.M. All authors have read and agreed to the published version of the manuscript.

Funding

This research received no external funding.

Data Availability Statement

The data presented in this study are available on request from the corresponding authors.

Conflicts of Interest

The authors declare no conflict of interest.

Nomenclature

aSpeed of Sound (m/s)
cChord length
cdDrag coefficient
clLift coefficient
cpPressure coefficient
fCamber height (m)
gGravity (m/s2)
J j Diffusion flux of species j (mol/m2s)
kTurbulence kinetic energy (J/kg)
k e f f Effective conductivity
MMach number
μDynamic Viscosity (N s/m2)
pPressure (Pa)
RGas constant (m2 K/s2)
S h Heat of chemical reactions
TTemperature (°C)
tTime (s)
vWind speed (m/s)
vtTurbulent eddy viscosity
xSpatial dimension (m)
xcCamber location from leading edge (m)
y + Dimensionless wall distance
γIntermittency
Grid element size (m)
ρDensity (Kg/m3)
ω Specific dissipation rate

References

  1. Gheisari, M.; Irizarry, J.; Walker, B.N. UAS4SAFETY: The Potential of Unmanned Aerial Systems for Construction Safety Applications. In Proceedings of the Construction Research Congress, Atlanta, GA, USA, 19–21 May 2014; pp. 1801–1810. [Google Scholar] [CrossRef]
  2. Hogan, S.D.; Kelly, M.; Stark, B.; Chen, Y.Q. Unmanned aerial systems for agriculture and natural resources. Calif. Agric. 2017, 71, 5–14. [Google Scholar] [CrossRef] [Green Version]
  3. Zhang, C.; Kovacs, J.M. The application of small unmanned aerial systems for precision agriculture: A review. Precis. Agric. 2012, 13, 693–712. [Google Scholar] [CrossRef]
  4. Lorenz, R.D.; Turtle, E.D.; Barnes, J.W.; Trainer, M.G.; Adams, D.S.; Hibbard, K.E.; Sheldon, C.Z.; Zacny, K.; Peplowki, P.N.; Lawrence, D.J. Dragonfly: A rotorcraft lander concept for scientific exploration at Titan. Johns Hopkins APL Tech. Dig. 2018, 34, 14. [Google Scholar]
  5. Fujita, K.; Karaca, H.; Nagai, H. Parametric Study of Mars Helicopter for Pit Crater Exploration. In Proceedings of the AIAA Scitech 2020 Forum, Orlando, FL, USA, 6–10 January 2020; American Institute of Aeronautics and Astronautics: Reston, VA, USA, 2020. [Google Scholar]
  6. Lacerda, M.; Park, D.; Beard, R.; Schrage, D. Georgia Tech Mars Exploration UAV Collaborative System: A Conceptual Design and Systems Engineering Study; Georgia Institute of Technology: Atlanta, GA, USA, 2017. [Google Scholar]
  7. González-Jorge, H.; Martínez-Sánchez, J.; Bueno, M. Unmanned aerial systems for civil applications: A review. Drones 2017, 1, 2. [Google Scholar] [CrossRef] [Green Version]
  8. Vélez-Nicolás, M.; García-López, S.; Barbero, L.; Ruiz-Ortiz, V.; Sánchez-Bellón, Á. Applications of unmanned aerial systems (UASs) in hydrology: A review. Remote Sens. 2021, 13, 1359. [Google Scholar] [CrossRef]
  9. Irizarry, J.; Costa, D.B. Exploratory study of potential applications of unmanned aerial systems for construction management tasks. J. Manag. Eng. 2016, 32, 05016001. [Google Scholar] [CrossRef]
  10. Manfreda, S.; McCabe, M.F.; Miller, P.E.; Lucas, R.; Pajuelo, M.V.; Mallinis, G.; Dor, E.B.; Helamn, D.; Estes, L.; Ciraolo, G. On the use of unmanned aerial systems for environmental monitoring. Remote Sens. 2018, 10, 641. [Google Scholar] [CrossRef] [Green Version]
  11. Wanasinghe, T.R.; Gosine, R.G.; De Silva, O.; Mann, G.K.; James, L.A.; Warrian, P. Unmanned aerial systems for the oil and gas industry: Overview, applications, and challenges. IEEE Access 2020, 8, 166980–166997. [Google Scholar] [CrossRef]
  12. Canham, B.B.T.; Courtney, D.; Grip, H.F.; Johnson, W.; Maki, J.; Quon, A.; Stern, R.; Zhu, D. Mars Helicopter Technology Demonstrator. In Proceedings of the 2018 AIAA Atmospheric Flight Mechanics Conference, Kissimmee, FL, USA, 8–12 January 2018; American Institute of Aeronautics and Astronautics: Reston, VA, USA, 2018. [Google Scholar]
  13. mars.nasa.gov. Mars Helicopter. Available online: https://mars.nasa.gov/technology/helicopter/ (accessed on 24 February 2022).
  14. mars.nasa.gov. Flying on Mars Is Getting Harder and Harder. Available online: https://mars.nasa.gov/technology/helicopter/status/334/flying-on-mars-is-getting-harder-and-harder/ (accessed on 24 February 2022).
  15. Saez, A.; Manzo, M.; Ciarcià, M. Mars Drone Configurations and Approaches to Rotor Design: A Review. In Proceedings of the ASME 2021 International Mechanical Engineering Congress and Exposition, Online, 1–5 November 2021. [Google Scholar] [CrossRef]
  16. Radotich, M.; Withrow-Maser, S.; de Souza, Z.; Gelhar, S.; Gallagher, H. A Study of Past, Present, and Future Mars Rotorcraft. In Proceedings of the Vertical Flight Society’s 9th Biennial Autonomous VTOL Technical Meeting, Online, 26–28 January 2021; Available online: https://rotorcraft.arc.nasa.gov/Publications/files/Radotich_aVTOL_Tech_Meeting_Final_Revised_012521.pdf (accessed on 24 February 2022).
  17. Johnson, W.; Withrow-Maser, S.; Young, L.; Malpica, C.; Koning, W.; Kuang, W.; Fehler, M.; Tuano, A.; Chan, A. Datta, Mars Science Helicopter Conceptual Design; National Aeronautics and Space Administration, Ames Research Center: Mountain View, CA, USA, 2020.
  18. Withrow, S.; Johnson, W.; Young, L.A.; Cummings, H.; Balaram, J.; Tzanetos, T. An Advanced Mars Helicopter Design. In Proceedings of the ASCEND 2020, Online, 16–18 November 2020; American Institute of Aeronautics and Astronautics: Reston, VA, USA, 2020. [Google Scholar] [CrossRef]
  19. Young, L.A.; Aiken, E.W. Vertical Lift Planetary Aerial Vehicles: Three Planetary Bodies and Four Conceptual Design Cases; National Aeronautics and Space Administration: Moffett Field, CA, USA, 2001. Available online: https://apps.dtic.mil/sti/citations/ADA480699 (accessed on 8 March 2021).
  20. Mars Climate Database v5.3: The Web Interface. Available online: http://www-mars.lmd.jussieu.fr/mcd_python/ (accessed on 13 April 2021).
  21. mars.nasa.gov. Location Map for Perseverance Rover. Available online: https://mars.nasa.gov/mars2020/mission/where-is-the-rover/ (accessed on 13 May 2021).
  22. Kroo, I.; Fritz, P.; Shantz, M.; Kunz, P.; Fay, G.; Cheng, S.; Fabian, T.; Partridge, C. The Mesicopter: A Miniature Rotorcraft Concept Phase II Interim Report; American Institute of Aeronautics and Astronautics: Reston, VA, USA, 2000. [Google Scholar]
  23. Koning, W.J.F.; Johnson, W.; Grip, H.F. Improved Mars Helicopter Aerodynamic Rotor Model for Comprehensive Analyses. AIAA J. 2019, 57, 3969–3979. [Google Scholar] [CrossRef] [Green Version]
  24. Koning, W.J. Airfoil Selection for Mars Rotor Applications; NASA CR: Washington, DC, USA, 2019; Volume 220236.
  25. Graebel, W. Advanced Fluid Mechanics; Academic Press: Cambridge, MA, USA, 2007; ISBN 9780123708854. [Google Scholar]
  26. Rodriguez, S. Applied Computational Fluid Dynamics and Turbulence Modeling: Practical Tools, Tips and Techniques; Springer Nature: Berlin/Heidelberg, Germany, 2019; ISBN 978-3-030-28690-3. [Google Scholar]
  27. Aftab, S.M.A.; Rafie, A.S.M.; Razak, N.A.; Ahmad, K.A. Turbulence Model Selection for Low Reynolds Number Flows. PLoS ONE 2016, 11, e0153755. [Google Scholar] [CrossRef] [PubMed] [Green Version]
  28. Morgado, J.; Vizinho, R.; Silvestre, M.A.R.; Páscoa, J.C. XFOIL vs CFD performance predic-tions for high lift low Reynolds number airfoils. Aerosp. Sci. Technol. 2016, 52, 207–214. [Google Scholar] [CrossRef]
  29. Rumsey, C.L.; Spalart, P.R. Turbulence model behavior in low Reynolds number regions of aero-dynamic flowfields. AIAA J. 2009, 47, 982–993. [Google Scholar] [CrossRef] [Green Version]
  30. Drela, M. XFOIL: An Analysis and Design System for Low Reynolds Number Airfoils. In Low Reynolds Number Aerodynamics; Springer: Berlin/Heidelberg, Germany, 1989; pp. 1–12. [Google Scholar]
  31. ANSYS Inc. ANSYS Fluent Theory Guide; ANSYS Inc.: Canonsburg, PA, USA, 2013. [Google Scholar]
  32. Saez, A.G. Aerodynamic Optimization of a 2D Airfoil for Rotary-Wing Aircraft at Mars Atmospheric Conditions. UNT Digital Library. 2021. Available online: https://digital.library.unt.edu/ark:/67531/metadc1873834/ (accessed on 26 February 2022).
  33. Withrow-Maser, S.; Koning, W.; Kuang, W.; Johnson, W.R. Recent Efforts Enabling Martian Rotorcraft Missions. In Proceedings of the VFS Aeromechanics for Advanced Vertical Flight Technical Meeting, San Jose, CA, USA, 21–23 January 2020. [Google Scholar]
  34. Koning, W.J.; Romander, E.A.; Johnson, W. Optimization of Low Reynolds Number Airfoils for Martian Rotor Applications Using an Evolutionary Algorithm. In Proceedings of the AIAA Scitech 2020 Forum, Orlando, FL, USA, 6–10 January 2020; p. 0084. [Google Scholar] [CrossRef]
  35. Koning, W.J.F.; Romander, E.A.; Johnson, W. Performance Optimization of Plate Airfoils for Martian Rotor Applications Using a Genetic Algorithm. In Proceedings of the 45th European Rotorcraft Forum, Warsaw, Poland, 17–20 September 2019; pp. 1–15. [Google Scholar]
  36. Koning, W.J.; Johnson, W.; Allan, B.G. Generation of Mars Helicopter Rotor Model for Comprehensive Analyses. In Proceedings of the AHS Aeromechanics Design for Transformative Vertical Flight, San Francisco, CA, USA, 16–18 January 2018. [Google Scholar]
  37. Koning, W.J.F.; Romander, E.A.; Johnson, W. Low Reynolds Number Airfoil Evaluation for the Mars Helicopter Rotor. In Proceedings of the AHS International 74th Annual Forum & Technology Display, Phoenix, AZ, USA, 14–17 May 2018; p. 17. [Google Scholar]
Figure 1. Flat distribution of the temperature (Right) and density (Left) during the Martian summer, at noon at 10 m over the surface. Mars Climate Database v5.3: The Web Interface.”http://www-mars.lmd.jussieu.fr/mcd_python/ (accessed on 13 April 2021). mars.nasa.gov, “Location Map for Perseverance Rover.”https://mars.nasa.gov/mars2020/mission/where-is-the-rover/ (accessed on 13 May 2021).
Fluids 08 00194 g001
Figure 2. Cambered Plate, 0.05c of f (at xc = 0.5c), 0.01c thickness, with a 0.2c beveled bottom corner of the leading edge (LE).
Fluids 08 00194 g002
Figure 3. Fluid domain discretization. In black: mesh used to discretize the domain; in red: domain boundary.
Fluids 08 00194 g003
Figure 4. Boundary conditions. In green: mesh used to discretize the domain.
Fluids 08 00194 g004
Figure 5. 2D airfoil stations. Colors indicate low, medium, and higher speeds reached at different stations, as indicated numerically by the Mach number.
Fluids 08 00194 g005
Figure 6. Enlarged view of the unstructured grid.
Fluids 08 00194 g006
Figure 7. Transient mesh convergence analysis with Re = 13,000, Ma = 0.5, and AoA = 4°. (a) Lift coefficient vs. the number of elements; (b) drag coefficient vs. the number of elements.
Fluids 08 00194 g007
Figure 8. Max y+ vs. the number of elements.
Fluids 08 00194 g008
Figure 9. Time grid discretization analysis. (a) Lift coefficient; (b) drag coefficient.
Fluids 08 00194 g009
Figure 10. Lift and drag coefficients (a,b), and lift-to-drag ratio (c) as functions of the AoA, comparing ANSYS Fluent density-based solver and NASA solver: case x/c = 50% f/c = 5% cambered plate at M = 0.2.
Fluids 08 00194 g010
Figure 11. Lift and drag coefficients (a,b), and lift-to-drag ratio (c) as functions of the AoA, comparing ANSYS Fluent density-based solver and NASA solver: case x/c = 50% f/c = 5% cambered plate at M = 0.5.
Fluids 08 00194 g011
Figure 12. Lift and drag coefficients (a,b), and lift-to-drag ratio (c) as functions of the AoA, comparing ANSYS Fluent density-based solver and NASA solver: case x/c = 50% f/c = 5% cambered plate at M = 0.7.
Fluids 08 00194 g012
Figure 13. Parametric study at M = 0.2.
Fluids 08 00194 g013
Figure 14. Lift-to-drag ratio as a function of the AoA: influence of the camber position at M = 0.2: (a) low camber; (b) medium camber; (c) high camber.
Fluids 08 00194 g014
Figure 15. Parametric study at M = 0.5.
Fluids 08 00194 g015
Figure 16. Lift-to-drag ratio as a function of the AoA: influence of the camber position at M = 0.5: (a) low camber; (b) medium camber; (c) high camber.
Fluids 08 00194 g016
Figure 17. Shape #5 at M = 0.2 at an AoA = 4°: (a) streamlines distribution around the airfoil, (b) shear stress X as a function of the chord’s position.
Fluids 08 00194 g017
Figure 18. Shape #9 at M = 0.2 at an AoA = 4°: (a) streamlines distribution along the airfoil, (b) shear stress X as a function of the chord’s position.
Fluids 08 00194 g018
Figure 19. Shape #9 at M = 0.2, AoA = 4°. Streamlines distribution showing LEV at the leading edge.
Fluids 08 00194 g019
Figure 20. Pressure coefficient distribution as a function of chord’s position at M = 0.2, AoA = 6°; (a) shape #5; (b) shape #9.
Fluids 08 00194 g020aFluids 08 00194 g020b
Figure 21. Shape #5 at M = 0.5, AoA = 4°; (a) streamlines distribution around the airfoil, (b) shear stress X as a function of the chord’s position.
Fluids 08 00194 g021
Figure 22. Shape #8 at M = 0.5, AoA = 4°; (a) streamlines distribution around the airfoil, (b) shear stress X as a function of the chord’s position.
Fluids 08 00194 g022aFluids 08 00194 g022b
Figure 23. Pressure coefficient distribution as a function of chord’s position at M = 0.5, AoA = 4°: (a) shape #5; (b) shape #8.
Fluids 08 00194 g023aFluids 08 00194 g023b
Figure 24. Shape #5 at M = 0.5, AOA = 6°; (a) streamlines distribution around the airfoil, (b) shear stress X as a function of the chord’s position.
Fluids 08 00194 g024aFluids 08 00194 g024b
Figure 25. Shape #8 at M = 0.5, AoA = 6°; (a) streamlines distribution around the airfoil, (b) shear stress X as a function of the chord’s position.
Fluids 08 00194 g025aFluids 08 00194 g025b
Figure 26. Pressure coefficient distribution as a function of chord’s position at M = 0.5, AoA = 6°: (a) shape #5; (b) shape #8.
Fluids 08 00194 g026aFluids 08 00194 g026b
Table 1. Mars atmospheric conditions at noon at 10 m over the surface [20].
PropertyUnitsRange
T°C−29−130
PPa130087
Density, ρkg/m30.0360.0023
am/s233.55
vm/s023
gm/s23.721
Table 2. Mars conditions used for the simulation in comparison with the ESL conditions.
VariableESLMC2
Density, ρ [kg/m3]1.2250.017
Temperature, T [K]288.2223.2
Gas Constant, R [(m2 K)/s2]287.1188.9
Specific Heat Ratio1.4001.289
μ [N s/m2]1.750⋅10−51.130⋅10−5
Static pressure, p [Pa]101,300716.6
Speed of Sound, a [m/s]340233.55
Gravity, g [m/s2]9.813.71
Table 3. Grid quality parameters (average).
MeshElement Quality Aspect RatioSkewnessOrthogonal Quality
Coarse0.921.350.120.93
Medium0.951.250.080.95
Fine0.961.220.070.96
Table 4. Airfoil shapes.
#ConfigurationAirfoil Shapes
1 f c = 3 % ; x c = 30 % Fluids 08 00194 i001
2 f c = 3 % ; x c = 50 % Fluids 08 00194 i002
3 f c = 3 % ; x c = 70 % Fluids 08 00194 i003
4 f c = 5 % ; x c = 30 % Fluids 08 00194 i004
5 f c = 5 % ; x c = 50 % Fluids 08 00194 i005
6 f c = 5 % ; x c = 70 % Fluids 08 00194 i006
7 f c = 7 % ; x c = 30 % Fluids 08 00194 i007
8 f c = 7 % ; x c = 50 % Fluids 08 00194 i008
9 f c = 7 % ; x c = 70 % Fluids 08 00194 i009
Disclaimer/Publisher’s Note: The statements, opinions and data contained in all publications are solely those of the individual author(s) and contributor(s) and not of MDPI and/or the editor(s). MDPI and/or the editor(s) disclaim responsibility for any injury to people or property resulting from any ideas, methods, instructions or products referred to in the content.