Abstract
This article focuses on the prediction of the small bubble holdups (assuming the existence of two major bubble classes) in two bubble columns (0.289 m in ID and 0.102 m in ID), operated with organic liquids under various conditions (including high temperature and pressure). A new correction factor has been established in the existing model for the prediction of the gas holdups in the homogeneous regime. The correction parameter is a single function of the Eötvös number (gravitational forces to surface tension forces), which characterizes the bubble shape. In addition, the behavior of small bubble holdups in 1-butanol (selected as a frequently researched alcohol) aerated with nitrogen, in a smaller BC (0.102 m in ID), at various operating pressures, is presented and discussed. The ratio of small bubble holdup to overall gas holdup, as a function of superficial gas velocity and operating pressure, has been investigated. All small bubble holdups in this work have been measured by means of the dynamic gas disengagement technique.
1. Introduction
Bubble columns (BCs) are simple but very effective gas-liquid contactors. These reactors are widely used in chemical, petrochemical, biochemical and pharmaceutical industries. They are frequently used as absorbers and preferred chemical reactors for oxidations, chlorinations, hydrogenations, methanol synthesis, Fischer–Tropsch synthesis, etc. Their behavior is complicated, due to the formation of multiscale flow structures (patterns) and several different flow regimes (FRs).
One of the key hydrodynamic parameters in BCs is the overall gas holdup. It is important for the accurate prediction of the interphase mass transfer behavior in BCs. The investigation of the gas holdup structure is also very important for the prediction of the mass transfer coefficient from small and large bubbles in the heterogeneous FR.
Another essential characteristic of BCs is the existence of multiple bubble classes in the heterogeneous FR, which complicate the modeling efforts. Krishna et al. [1] developed a three-fluid model by considering the liquid, small and large bubbles as separate inter-penetrating phases. Wang et al. [2] also used a two-fluid model to predict the first transition velocity. The authors found that the occurrence of the first transition velocity is associated with a sharp decrease in the small bubble holdup. However, Krishna et al. [1] did not report such a behavior in the small bubble holdup. Chen et al. [3] proposed a dual bubble size model, which considers the two bubble classes (small ellipsoidal bubbles and large spherical-cap bubbles). Based on this model, the authors provided a physical explanation of the main regime transition.
In the homogeneous FR, the gas holdup increases strongly with the superficial gas velocity (Ug). In the transition FR, the rate of gas holdup increase is not so rapid, whereas in the heterogeneous FR the gas holdup increases sharply again. In the homogeneous FR, the gas holdup increases faster than in the heterogeneous FR, mostly because bubbles remain small and their number increases. Even in some cases [4] in the transition FR, the gas holdup decreases at ambient conditions. Deckwer and Schumpe [5] reported that the dependence of gas holdup on Ug is characterized by two exponents: 1.2 in the homogeneous FR and less than one in the heterogeneous FR. The gas holdup depends strongly on the gas distributor (GD) in the homogeneous FR, but this dependence becomes weak in the heterogeneous FR.
A very good description of the gas holdup behavior, under different operating conditions, is available in [5,6]. Gas holdup depends predominantly on both bubble diameter and bubble rise velocity. The decrease of the bubble diameter leads to an increase in gas holdup and vice versa. The mean bubble diameter decreases when the operating pressure is higher or the gas density is higher. In Kemoun et al. [7], the most important correlations for the prediction of the overall gas holdup are listed. The methods for measuring the gas holdup are summarized in [6,8].
One very important technique for studying the gas holdup structure is the dynamic gas disengagement (DGD) technique. Schumpe and Grund [9] exhaustively described how both the small and large bubble holdups can be calculated based on this simple but very effective experimental technique. In this method, the change of the gas holdup structure, after the sudden stop of the gas supply, is investigated. In such a way, important information about the bubble size distribution can be obtained. It is worth mentioning that this technique was originally developed by Sriram and Mann [10], and was later modified by several research groups.
The gas holdup structure is affected by the bubble formation mechanism in the GD vicinity. Schumpe and Grund [9] have also discussed some disadvantages of the DGD technique. They have reported that the contribution of small bubbles to the overall gas holdup becomes almost constant at a rather small (or low) Ug value of about 0.035 m/s. At high Ug values, only the flow of large bubbles with short gas residence time is increased. This trend strongly reduces the gas conversion in BCs [9].
Dependence of the Gas Holdup Structure on the Gas Distribution
In the heterogeneous FR, the dense phase holdup is independent of Ug and it remains constant. At high Ug values, the large bubble holdup is dependent on the column diameter, but it is independent of liquid properties, the gas density and the gas distribution [11]. It is frequently assumed that the holdup of the small bubbles in the heterogeneous FR equals the overall gas holdup at the first regime transition velocity [11]. This particular gas holdup can be predicted reliably by means of the correlation of Reilly et al. [12]. In principle, the values of the dense phase holdup (or small bubble holdup) depend on the method of gas distribution. A more uniform gas distribution with a porous plate GD leads to a higher dense phase gas holdup, in comparison with the one with a perforated plate GD [11]. The large bubble holdup is independent of liquid properties and GD. The increase of the gas density significantly increases the dense phase gas holdup and does not have any effect on the large bubble holdup.
Krishna and Ellenberger [11] reported small bubble holdups in both air–paraffin oil and air–water systems. Except for this set of data, there are not many additional data published in the literature about small bubble holdups in organic liquids. Especially important is to obtain such data at elevated pressures and temperatures. In general, the articles have focused on the gas holdup structure.
In this work, a new model for the prediction of the small bubble holdups will be developed and successfully tested with various data obtained at elevated pressures and temperatures. In addition, the behavior of small bubble holdup in an alcohol, (1-butanol), aerated with nitrogen at higher pressures, (up to 2.0 MPa), will be investigated.
2. Experimental Setups and Conditions
Small bubble holdups in polyalphaolefin (PSS8), aerated with nitrogen or hydrogen, were measured in a BC (0.289 m in ID) equipped with a cross sparger (6 legs, each having 6 orifices of 0.5 mm in ID on each side and the bottom, totaling 18 holes on each leg and 108 on the sparger) and operated at high temperature (T = 441–446 K) and pressure (P = 1.60–2.45 MPa). All other data (decalin, ethanol (96%) and toluene aerated with nitrogen or helium) were obtained in a smaller BC (0.1 m in ID), equipped with a perforated plate GD (19 × ∅1 mm), and operated at ambient temperature (T = 293 K) and various pressures (P = 0.1–4.0 MPa). The physicochemical properties of the liquids used are provided in Table 1. The experimental setup in the smaller column is shown in Figure 1.

Table 1.
Physicochemical properties of the liquids used.
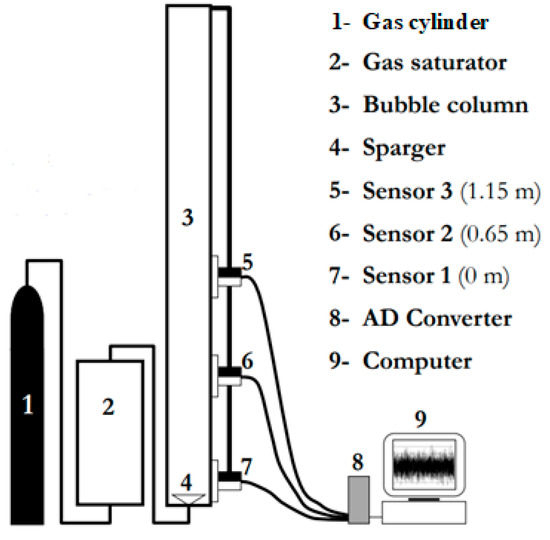
Figure 1.
Experimental setup for measuring the small bubble holdups in a BC (0.102 m in ID).
The DGD technique developed by Schumpe and Grund [9] was used. It is a simple but very effective experimental technique for studying the gas holdup structure in the presence of different bubble classes. In the DGD, the change in the liquid height or pressure signal after a sudden stop of the gas flow is investigated. The rate of liquid height drop provides information about the bubble size distribution. When the gas flow is cut off, the drop of the liquid level in the column is usually filmed. The most important requirement is that the gas holdup should remain undisturbed by bubble interactions after cutting off the gas supply [9]. Usually the drop of the liquid level is monitored by a video camera based on a frame-by-frame analysis, but in the present research, differential pressure (DP) transducers have been used. The same analysis as in [9] has been applied but the liquid heights have been calculated on the basis of the DP signals. In order to obtain the small bubble holdups in the bigger column (0.289 m in ID), two DP cells have been used. The measurements have been performed in the Ug range of 0.117–0.257 m/s, i.e., in the heterogeneous FR. The two DP cells (model IDP10-V20A11F, rated at 7.5 kPa) were manufactured by Foxboro, USA. These DP transducers allowed the measurement of the hydrostatic pressure head between any two levels in the reactor. The clear liquid height was set equal to 1.31 m (bed aspect ratio = 4.53). All the measurements were carried out with zero liquid superficial velocity, i.e., no net liquid flow. The raw DP fluctuations were sampled at a frequency of 20 Hz.
The DP fluctuations in the smaller column (0.102 m in ID) were recorded by means of DP transducers (LABOM GmbH, Hude, Germany, range 0–1 bar). The time series were measured with a sampling frequency of 100 Hz. The clear liquid height was set at 1.3 m. It is worth noting that the DGD technique is non-intrusive. In the DGD analysis, it is assumed that first the small bubbles disengage and then the large bubbles.
3. Results and Discussion
The same approach for predicting the gas holdup, which was introduced earlier by Nedeltchev and Schumpe [6], was used. It was assumed that the small bubbles had an oblate ellipsoidal shape, which was confirmed by the corresponding Tadaki numbers. The values of this dimensionless number varied between 2 and 6 in all cases. The Tadaki number is a product of both the bubble Reynolds number and Morton number, raised to the power of 0.23. In order to develop the model, two definitions for the gas-liquid interfacial area were used. These two definitions are needed in order to extract a correlation for the small bubble holdup εsb. In the first classical definition, the gas-liquid interfacial area was correlated to both εsb and Sauter-mean bubble diameter. This definition is strictly valid for rigid spherical bubbles. For any other bubble shape a correction factor is required. According to the second definition, in the case of oblate ellipsoidal bubbles, the interfacial area depends on the number of bubbles, individual bubble surface SB and the total dispersion volume [6]. Nedeltchev and Schumpe [6] have demonstrated that when the two definitions of the interfacial area are set as equal, then an expression for the small bubble holdup εsb can be successfully derived:
The εsb values depend on the Sauter-mean bubble diameter, bubble formation frequency fb, individual bubble surface SB and bubble rise velocity uB. The Sauter-mean bubble diameter was calculated by means of the correlation of Wilkinson et al. [12], whereas the geometrical characteristics of the ellipsoidal bubbles were estimated by the correlation of Terasaka et al. [13]. The bubble rise velocity was calculated by means of the correlation of Mendelson [14], based on the wave theory.
A new dimensionless correction factor was derived:
fc = 0.693Eo−0.56
The definition of the Eötvös number Eo (in some countries called Bond number) is presented in the Nomenclature. It describes the ratio of gravitational forces to surface tension forces. The Eo number characterizes the shape of bubbles moving in a surrounding fluid. In comparison with the correction factor (0.78Eo−0.22) for prediction of the overall gas holdups in the homogeneous FR, the power of the Eo number decreases almost twice. This means that the dependence on the Sauter-mean bubble diameter becomes weaker at elevated pressures and temperatures. Based on this approach, 73 experimental small bubble holdups were fitted (see Figure 2) reasonably well (average relative error = 18.2%). Every experimental small bubble holdup in Figure 2 was based on three measurements with an experimental error of 7%. It is worth noting that the proposed new approach is capable of fitting small bubble holdups at industrially important elevated pressures and temperatures. In the abscissa of Figure 2, the calculated small bubble holdups are based on the proposed method (see Equation (1)) in this article along with the new correction factor (see Equation (2)). The operating conditions in Figure 2 are specified in the second section (Experimental setups and conditions). The small bubble holdups in PSS8 were measured in the bigger column (0.289 m in ID), whereas all other experimental data were obtained in the smaller column (0.102 m in ID).
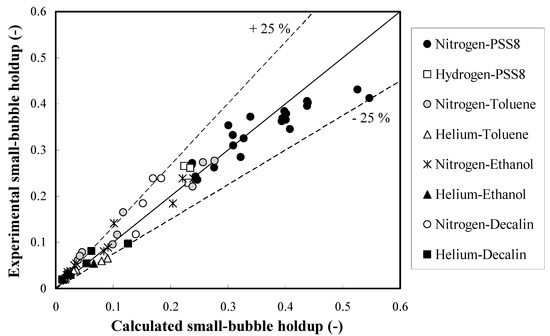
Figure 2.
Parity plot of the small bubble holdups in different organic liquids.
Effect of Pressure on Small Bubble Holdups in 1-Butanol
Figure 3 shows the profile of the small bubble holdups at ambient pressure in a BC (0.102 m in ID) operated with a nitrogen-1-butanol system. It is noteworthy that the small bubble holdups monotonously increase in all FRs. However, the rate of increase is small. This is a new finding since the correlation of Reilly et al. [15] predicts constant small bubble holdup (0.135) in the heterogeneous FR. Figure 3 also demonstrates that the differences between both overall and small bubble holdups increase with the superficial gas velocity Ug.
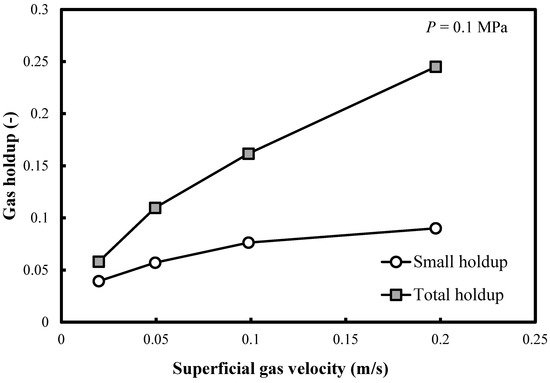
Figure 3.
Comparison between the total gas holdups and the small bubble holdups measured in a BC (0.102 m in ID) operated with a nitrogen-1-butanol system at P = 0.1 MPa.
Figure 4 demonstrates that the same trends are observable when the operating pressure (P) doubles. In Table 2, the ratios of small bubble holdups over total gas holdups are listed. At elevated pressures, at the highest Ug value, the small bubble holdup always exceeds 0.1. On the other hand, the overall gas holdup exceeds the threshold of 0.25. Table 2 shows that the ratio of small bubble holdups εsb to overall gas holdups εG decreases with Ug. As the pressure increases, at most of the Ug values, the ratio εsb/εG remains practically constant, whereas at the highest Ug value, this ratio drops with the increase in pressure.
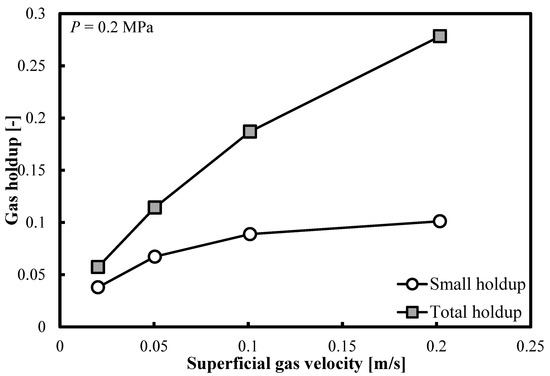
Figure 4.
Comparison between the total gas holdups and the small bubble holdups measured in a BC (0.102 m in ID) operated with a nitrogen-1-butanol system at P = 0.2 MPa.
Table 2.
Comparison between small bubble holdups and overall gas holdups in a 1-butanol aerated with nitrogen, in a BC (0.102 m in ID) operated at various pressures.
Figure 5a–c show that when the operating pressure, P, is elevated at 0.5, 1.0 and 2.0 MPa, the same trends are distinguishable. The small bubble holdup profile is not flat and it keeps increasing smoothly. Constant small bubble holdup is not observable.
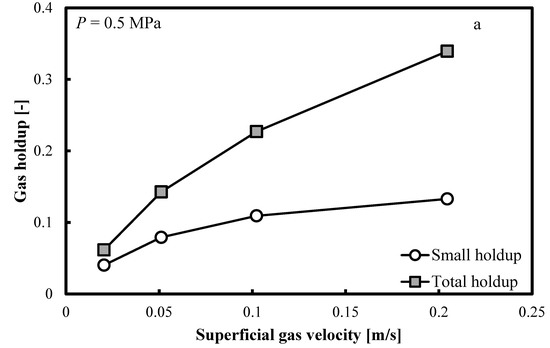
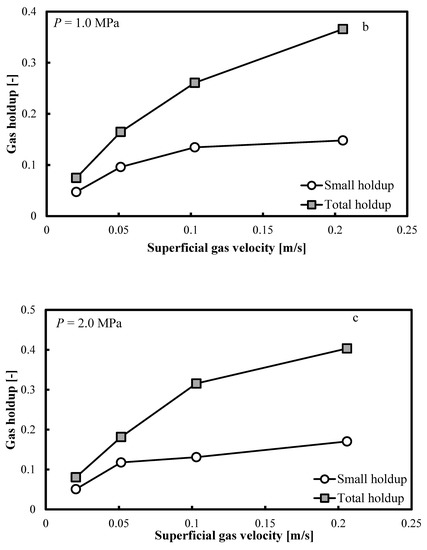
Figure 5.
Comparison between the total gas holdups and the small bubble holdups measured in a BC (0.102 m in ID) operated with a nitrogen-1-butanol system at: (a) P = 0.5 MPa; (b) P = 1.0 MPa and (c) P = 2.0 MPa.
In Figure 6, a comparison between all small bubble holdups in 1-butanol, at different pressures, is presented. It is clear that, as the operating pressure increases, the small bubble holdups increase.
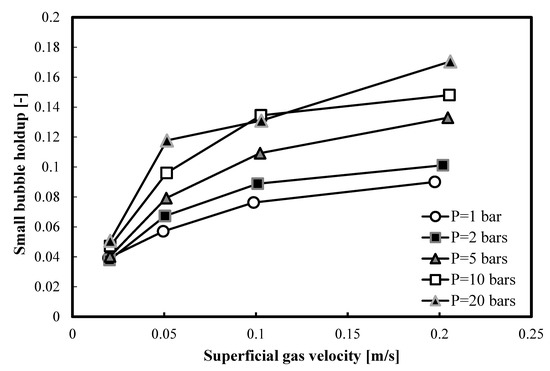
Figure 6.
Comparison between the small bubble holdups measured at different pressures in a nitrogen-1-butanol system in the small BC (0.102 m in ID).
4. Conclusions
A new approach (see Equations (1) and (2), and reference [6]) for the prediction of the small bubble holdups in heterogeneous bubble columns (BCs) was proposed. The model takes into account the real ellipsoidal shape of the bubbles and that is why a correction factor is applied. It is a single function of the Eötvos number. A total of 73 experimental small bubble holdups, in four different organic liquids, were fitted reasonably well (average relative error = 18.2%). The error for every experimentally measured small bubble holdup was 7% (or less in some cases). This new approach is much more sophisticated than any empirical correlation for small bubble holdup prediction.
In addition, in the case of the 1-butanol-nitrogen system, the effect of pressure (P) on the small bubble holdup was investigated. In the pressure range of 0.1–2.0 MPa, it was discovered that the small gas holdup was not constant but gradually increased with the superficial gas velocity (Ug). The ratio of small bubble holdup to overall gas holdup, as a function of Ug and P, was investigated. It was also discovered that the small bubble holdups increased with the operating pressure elevation.
Funding
This research was funded by both the Bulgarian-American “Fulbright” Commission and the Alexander von Humboldt Foundation (Germany).
Data Availability Statement
The experimental data can be obtained by contacting the author.
Conflicts of Interest
The author declares no conflict of interest.
Nomenclature
| db | bubble diameter | [m] |
| ds | Sauter-mean bubble diameter | [m] |
| Eo | Eötvös number (ρLgdb2/σ) | [−] |
| fb | bubble formation frequency | [s−1] |
| fc | correction factor | [−] |
| g | acceleration due to gravity | [m/s2] |
| P | operating pressure | [MPa] |
| SB | individual bubble surface | [m2] |
| T | operating temperature | [K] |
| Ug | superficial gas velocity | [m/s] |
| Greek letters | ||
| εsb | small bubble holdup | [−] |
| εG | overall gas holdup | [−] |
| μL | liquid viscosity | [Pa·s] |
| ρL | liquid density | [kg/m3] |
| σL | surface tension | [N/m] |
| Abbreviations | ||
| BC | bubble column | |
| DGD | dynamic gas disengagement | |
| DP | differential pressure | |
| FR | flow regime | |
| GD | gas distributor |
References
- Krishna, R.; Urseanu, M.I.; Van Baten, J.M.; Ellenberger, J. Influence of scale on the hydrodynamics of bubble columns operating in the churn-turbulent regime: Experiments versus Eulerian simulations. Chem. Eng. Sci. 1999, 54, 4903–4911. [Google Scholar] [CrossRef]
- Wang, T.; Wang, J.; Jin, Y. Theoretical prediction of flow regime transition in bubble columns by the population balance model. Chem. Eng. Sci. 2005, 60, 6199–6209. [Google Scholar] [CrossRef]
- Chen, J.; Yang, N.; Ge, W.; Li, J. Modeling of regime transition in bubble columns with stability condition. Ind. Eng. Chem. Res. 2009, 48, 290–301. [Google Scholar] [CrossRef]
- Zahradnik, J.; Fialova, M.; Ruzicka, M.; Drahos, J. Duality of the gas-liquid flow regimes in bubble column reactors. Chem. Eng. Sci. 1997, 52, 3811–3826. [Google Scholar] [CrossRef]
- Deckwer, W.-D.; Schumpe, A. Improved tools for bubble column reactor design and scale-up. Chem. Eng. Sci. 1993, 48, 889–911. [Google Scholar] [CrossRef]
- Nedeltchev, S.; Schumpe, A. A new approach for the prediction of gas holdup in bubble columns operated under various pressures in the homogeneous regime. J. Chem. Eng. Jpn. 2008, 8, 744–755. [Google Scholar] [CrossRef]
- Kemoun, A.; Ong, B.C.; Gupta, P.; Al-Dahhan, M.H.; Dudukovic, M.P. Gas holdups in bubble columns at elevated pressure via computed tomography. Int. J. Multiph. Flow. 2001, 27, 929–946. [Google Scholar] [CrossRef]
- Leonard, C.; Ferrasse, J.-H.; Boutin, O.; Lefevre, S.; Viand, A. Bubble column reactors for high pressures and high temperatures operation. Chem. Eng. Res. Des. 2015, 100, 391–421. [Google Scholar] [CrossRef]
- Schumpe, A.; Grund, G. The gas disengagement technique for studying gas holdup structure in bubble columns. Can. J. Chem. Eng. 1986, 64, 891–896. [Google Scholar] [CrossRef]
- Sriram, K.; Mann, R. Dynamic gas disengagement: A new technique for assessing the behavior of bubble columns. Chem. Eng. Sci. 1987, 32, 571–580. [Google Scholar] [CrossRef]
- Krishna, R.; Ellenberger, J. Gas holdup in bubble column reactors operating in the churn-turbulent flow regime. AIChE J. 1996, 42, 2627–2634. [Google Scholar] [CrossRef]
- Reilly, I.G.; Scott, D.S.; De Bruijn, T.J.W.; MacIntyre, D. The role of gas phase momentum in determining gas holdup and hydrodynamic flow regimes in bubble column operations. Can. J. Chem. Eng. 1994, 72, 3–12. [Google Scholar]
- Wilkinson, P.M.; Haringa, H.; Van Dierendock, L.L. Mass transfer and bubble size in a bubble column under pressure. Chem. Eng. Sci. 1994, 49, 1417–1427. [Google Scholar] [CrossRef]
- Terasaka, K.; Inoue, Y.; Kakizaki, M.; Niwa, M. Simultaneous measurement of 3-dimensional shape and behavior of single bubble in liquid using laser sensors. J. Chem. Eng. Jpn. 2004, 37, 921–926. [Google Scholar] [CrossRef]
- Mendelson, H.D. The prediction of bubble terminal velocities from wave theory. AIChE J. 1967, 13, 250–253. [Google Scholar] [CrossRef]


Disclaimer/Publisher’s Note: The statements, opinions and data contained in all publications are solely those of the individual author(s) and contributor(s) and not of MDPI and/or the editor(s). MDPI and/or the editor(s) disclaim responsibility for any injury to people or property resulting from any ideas, methods, instructions or products referred to in the content. |
© 2023 by the author. Licensee MDPI, Basel, Switzerland. This article is an open access article distributed under the terms and conditions of the Creative Commons Attribution (CC BY) license (https://creativecommons.org/licenses/by/4.0/).