Abstract
Acting upon clinical patient data, acquired in the pathway of percutaneous intervention, we deploy hierarchical, multi-stage, data-handling protocols and interacting low- and high-order mathematical models (chamber elastance, state-space system and CFD models), to establish and then validate a framework to quantify the burden of ischaemia. Our core tool is a compartmental, zero-dimensional model of the coupled circulation with four heart chambers, systemic and pulmonary circulations and an optimally adapted windkessel model of the coronary arteries that reflects the diastolic dominance of coronary flow. We guide the parallel development of protocols and models by appealing to foundational physiological principles of cardiac energetics and a parameterisation (stenotic Bernoulli resistance and micro-vascular resistance) of patients’ coronary flow. We validate our process first with results which substantiate our protocols and, second, we demonstrate good correspondence between model operation and patient data. We conclude that our core model is capable of representing (patho)physiological states and discuss how it can potentially be deployed, on clinical data, to provide a quantitative assessment of the impact, on the individual, of coronary artery disease.
1. Introduction
Myocardial function is dependent on sufficient coronary blood flow (CBF), the rate of which is matched closely to the fluctuating metabolic requirements of the heart. CBF is compromised in ischaemic heart disease (IHD), the commonest cause of death in the world. The most frequent cause of IHD is coronary artery disease (CAD), whereby the epicardial coronary arteries become stenosed or occluded, thus restricting CBF, initially under exercise conditions, but eventually at rest; see Section 3.2.2. Although there are data correlating global myocardial ischaemic burden with clinical outcomes, there are little data linking it with myocardial energetics, function or cardiac output. Here we demonstrate a multi-compartment, zero-dimensional (0D) model [1,2,3,4] of the coronary and systemic circulation, based on clinical data, with the potential to address myocardial energetics. Specifically, we postulate that a zero-dimensional (0D) model, adapted to readily available, patient-specific data, can accurately simulate coronary (patho)physiology, with the potential to personalise [5] and predict an individual patient’s global ischaemic burden and associate this with LV energetics and cardiac output. Our aims are to:
- Devise and implement a 0D model and robust data handling protocols able to replicate in silico haemodynamic dysfunction;
- Make optimal use of appropriate haemodynamic data, collected in the clinical PCI pathway;
- Demonstrate our process’ ability to capture patient-specific (patho)physiological states in silico.
2. Background
CFD modelling can provide a detailed assessment of local, usually single-vessel coronary haemodynamics which may be patient-specific [6]. It has also allowed for less or even non-invasive diagnostic tools, such as virtual fractional flow reserve (vFFR) [7], and in the novel form of the lattice Boltzmann simulation [8], it may be extended to describe flow within multiple small vessels [9]. However, CFD alone cannot provide a description of the perfusion of the entire myocardium necessary to characterise global ischaemic burden. To quantify the effects of multi-vessel disease upon total myocardial blood flow, one must set the diseased vessel(s) within the context of the whole coronary tree. This requires a methodology which can interact with CFD and wider physiological data.
Windkessel models are not new [10,11], neither are low-order representations of cardiac function [12,13,14] and coupled pseudo-mechanical system models, which have both been utilised here have been available, open source, for years [15]. We are concerned with computational medicine however, where a parsimonious model design should be constrained by data sources, with suitable interpretation protocols in mind. A composite of low-order models comprising a mechanical cardio-vascular 0D model of left heart function, valvular function and systemic circulation has been shown to have the capacity to ingest CFD-derived data and prognose the systemic effects of aortic and mitral valve disease [16]. Czechowicz et al. took CFD-derived valve properties, ingested them into a 0D model and formulated hypotheses connecting valve physiology, personalised cardiac energetics and valve function, to develop a clinical decision support tool. Here, we attempt to extend that methodology to a wider range of clinical data and disease states which are more difficult to characterise. This requires:
- A coronary network topology conforming to the clinical pattern of atherosclerosis;
- Modelling that reflects diastolic dominance of myocardial flow;
- The ability to incorporate all available clinical patient data;
- Sufficient computational simplicity for clinical deployment.
These demands make it necessary to simplify the task from the outset. To reduce the burden of model personalisation, we parameterise its right circulation parameters to normal values [17]. (This decision is supported by our input parameter sensitivity analysis in Appendix B, which shows that the coronary, left heart and systemic circulation input parameters are most influential). Further, the fact that resting coronary blood flow (250 mL min; 0.8 mL min g of heart muscle) constitutes about 5% of cardiac output [18] allows us to assume that coronary flow does not directly influence the systemic circulation. It also allows us to approach our problem by adjusting, with the relevant coronary flow data a posteriori, a model in which systemic and ventricular outputs are tuned first. Further, we appeal, hierarchically, to the key physiological principles of LV performance and the systemic circulation to construct each patient’s baseline and only then incorporate detailed CFD-derived information related to the coronaries’ microvascular resistance (MVR), etc., while retaining a minimum number of assumptions necessary to impose physiological principles. We use cardiac energetics and the concepts encapsulated in Wiggers’ diagram [19] to refine our low-order model of LV contractility and compliance; then, we consider ventricular–aortic (VA) coupling (which characterises the interaction between the myocardial contractile function and LV afterload and defines cardiovascular performance and efficiency [20]), and finally, the role of passive ventricular filling and valves. Only once an accurate model of general cardiac function is established will coronary flow be considered.
3. Methods and Materials
Broadly, we first describe our model (Section 3.1), then its data (Section 3.2). However, since model operation and data are related, some model details bleed into Section 3.2.
3.1. Methods
Personalisation cost function hyper-surfaces are intricate in the presence of non-linearities. Similar to valve functions, the cost function varies at very different rates with displacement in different parameter directions. Then, the task of locating the global minimum becomes computationally expensive. We address this difficulty with the multi-step protocol outlined in Table 1. The six steps declared there buffer clinical data into our tool, using low-order haemodynamic models, a closed loop system model and finally 3D CFD.

Table 1.
Stages in the personalisation process and their rationale. Physiological effects (column 2) are sequentially ingested into the workflow, with the objective declared in column 3, culminating, at step 5, in a patient-specific in silico model of the resting patient state.
3.1.1. Low-Order Models
To express heart chamber biomechanics and valve characteristics appropriately, we use the double Hill elastance model [12,14] and the valves’ pressure-flow characteristics. See Appendix A.2 for details; see also Czechowicz et al. [16], who give a fuller account of valve characteristic functions. Our passive systemic and pulmonary circulation windkessels, with proximal inertance (L), viscous dissipation (R) and multiple compliance (C), are also well documented [21]. Our pulmonary and systemic windkessels are designated LRCRC, having two capacitances to separate arterial and venous compliance. Note, each coronary branch is characterised by a compliance with its back plate pressure set to that in the relevant ventricle. Note also that elastance is not used solely to activate our system model. We will also use it, together with the LV PV loop [22], to clarify the relationship between our LV pressure and volume time-series data in Section 3.2.1.
3.1.2. System Model
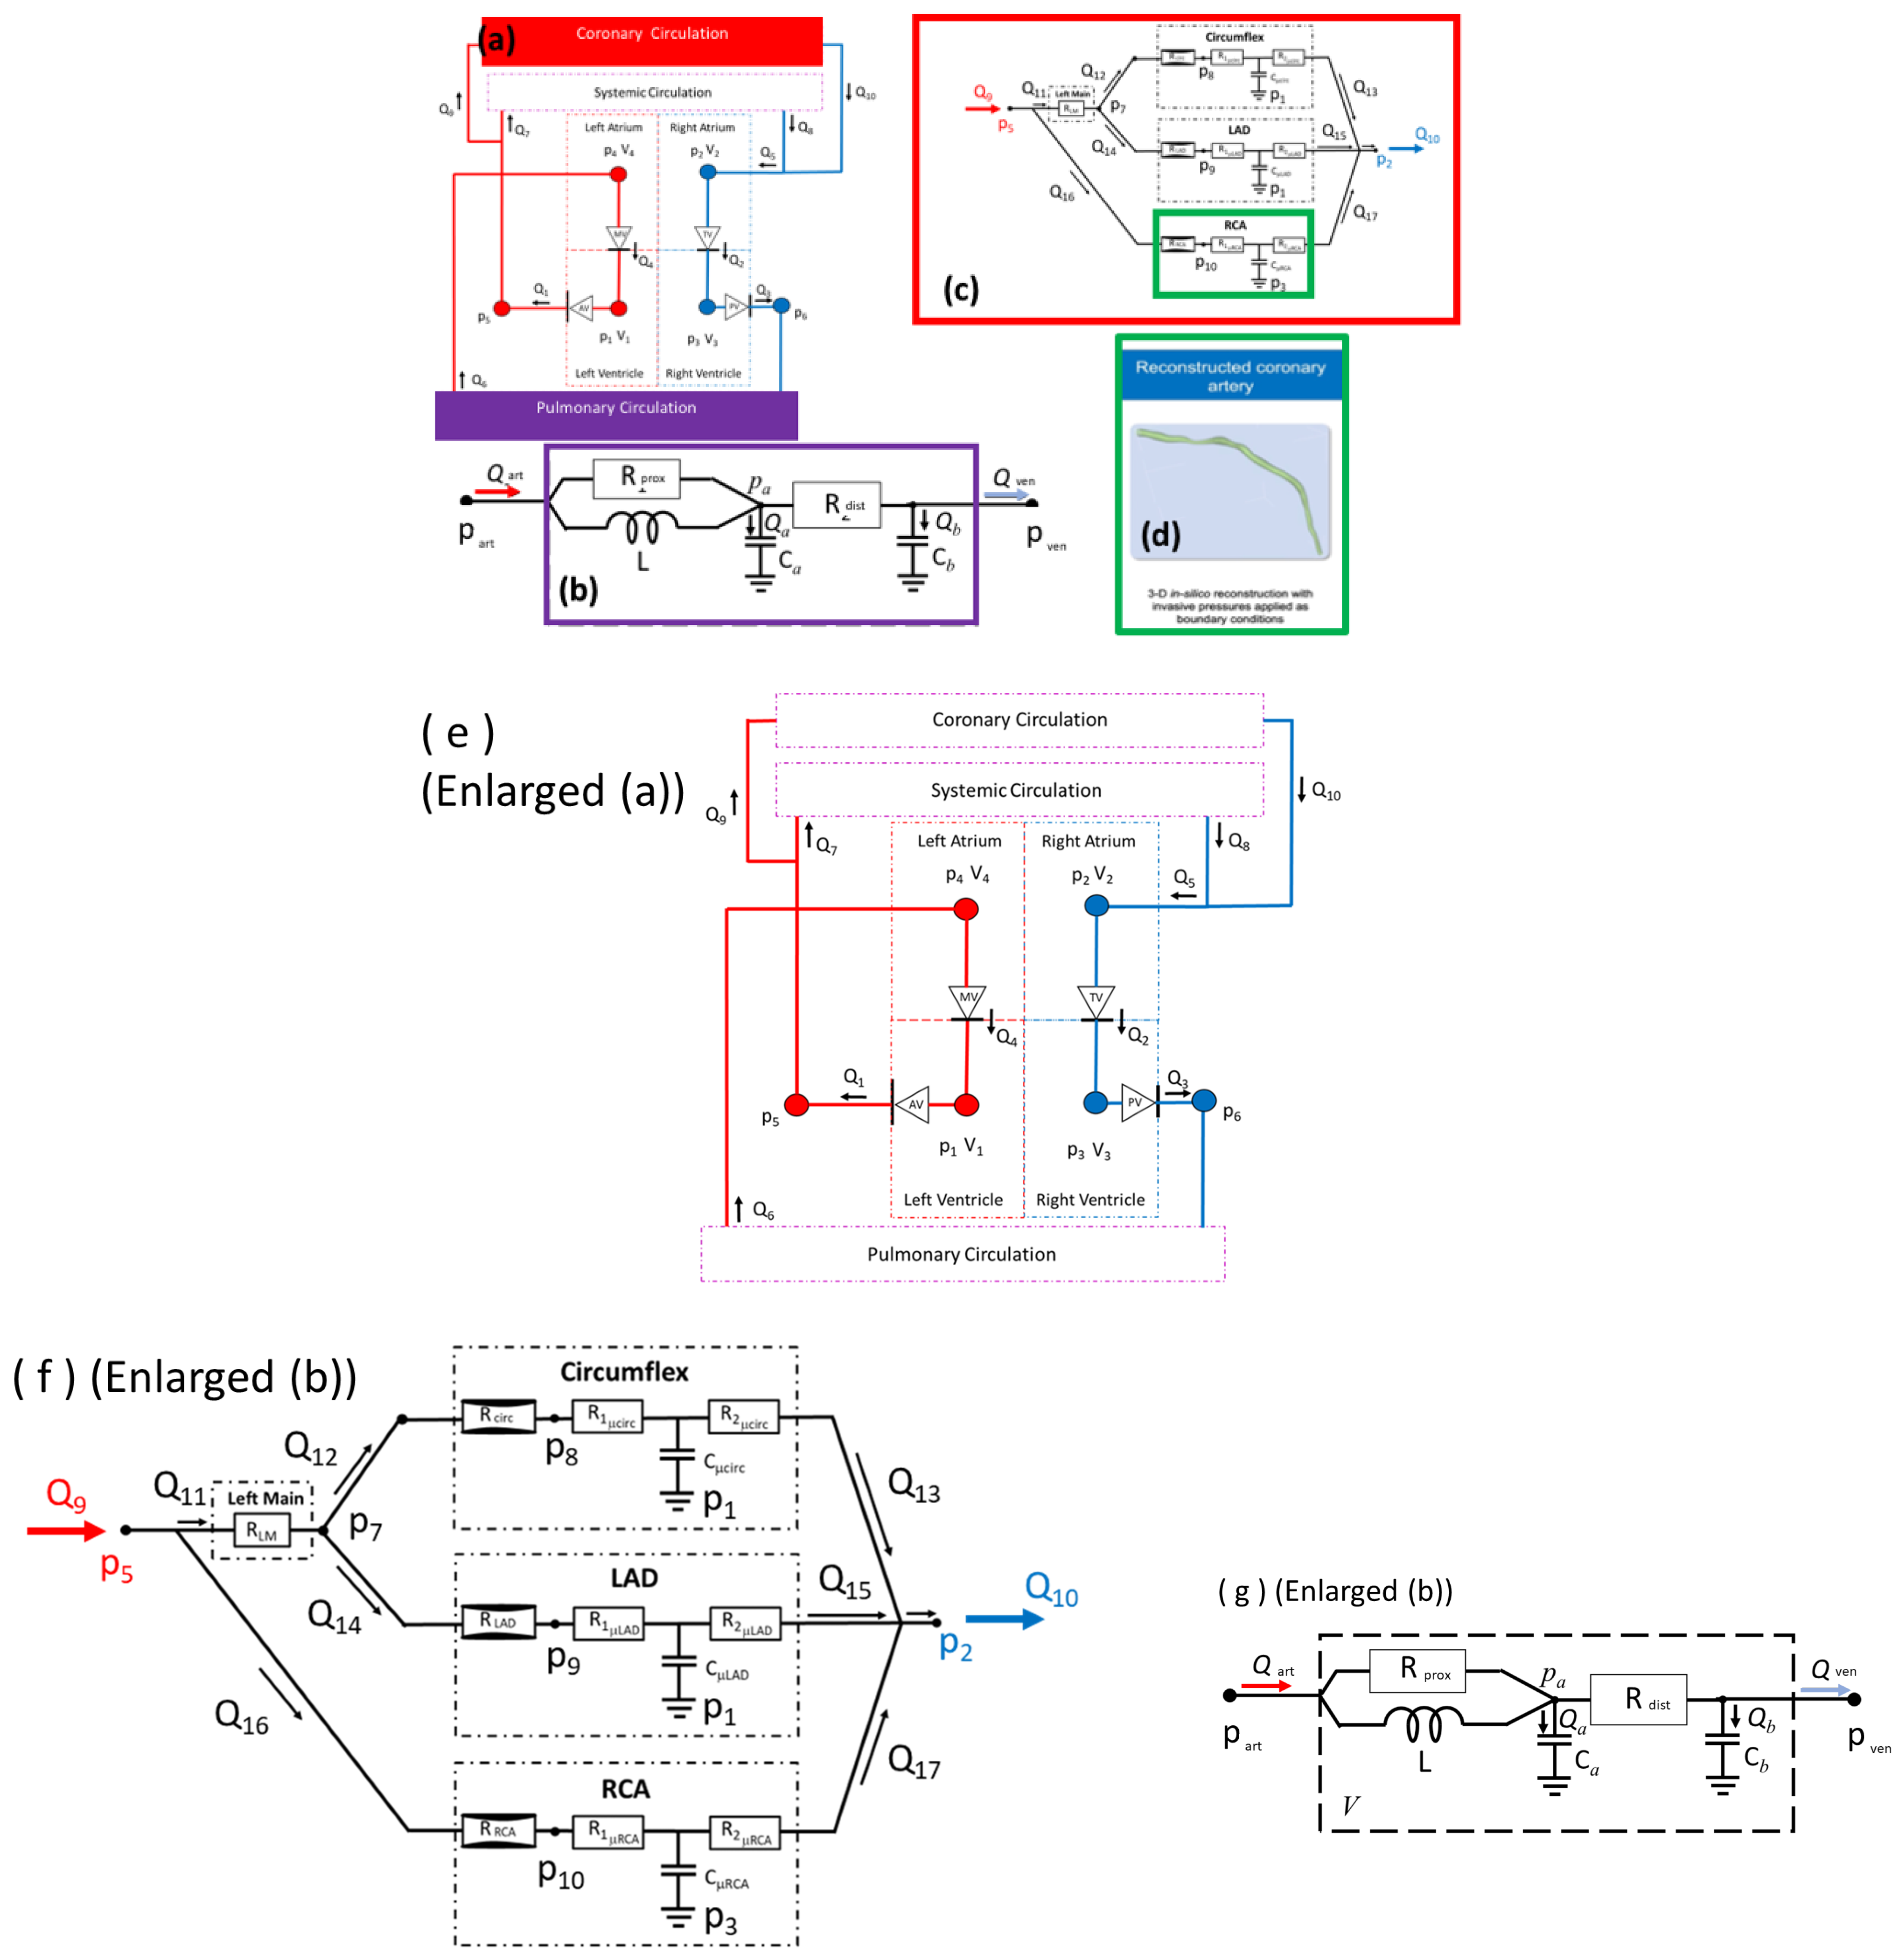
Figure 1 shows, in relation to our CFD models, our assembly of windkessels, elastance functions and valves. It is designated a compartmental, electrical analogue or 0D model. It has four heart chambers as well as systemic arterial and venous, pulmonary arterial and venous, and several coronary arterial compartments. The overhead of four heart chambers is offset by enhanced performance [17]. We set the right circulation parameters to population average values. We compute N sampled time-series outputs , , derived from internal states, , with the sample times drawn from the converged heart cycle. Table 2 declares our compartment numbering convention and Table 3 our names, conventions, equivalent subscripting and input parameter base values. Note, micro-vascular resistance (MVR) is distributed relative to arterial compliance, with a proximal-to-distal ratio controlled by input parameter .
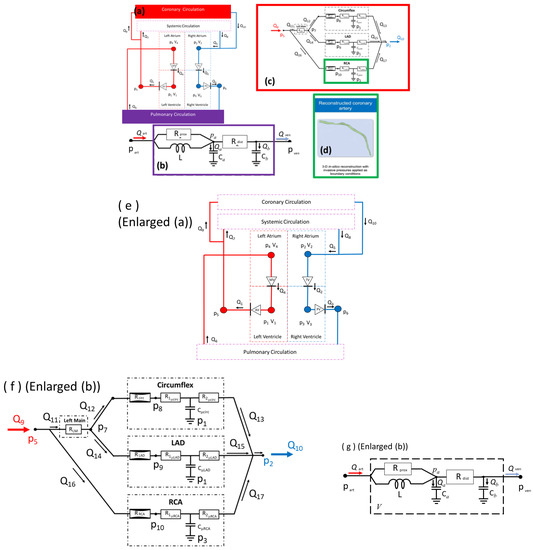
Figure 1.
Interacting 0D system and CFD models. Clockwise from the top. First panel uses colour coding to expose the interaction between (a) core heart module; (b) systemic and LRCRC windkessels; (c) coronary module; and (d) 3D steady CFD workflow used to parameterise the stenotic resistance and MVR. (e) An enlargement of (a), the heart module. Important pressure, flow and volume variables are displayed. Valves are all diodes. Chamber elastances are represented by double Hill elastance functions. The subscripting of the compartment state variables is that which is used throughout, with the convention that compartment, inlet pressure, volume and outlet flow are all subscripted by the compartment number. (f) An enlargement of (c), the coronary windkessel set. There is a RCR windkessel for each of the three principal vessels, designated LCx, LAD and RCA. The back plates of the vessel compliances are all coupled to the relevant ventricular pressure. (g) An enlargement of (b), the systemic and pulmonary circulation windkessels.

Table 2.
Indexing and naming conventions for system model variables. Free subscript * is to be replaced by the appropriate symbol. Flows generally are trans-compartment; pressures and volumes apply to compartments directly.

Table 3.
System model input parameter nomenclature and status. The 0D model chamber parameters are classified by compartment. The status of the parameter is either fixed (at population average value) or tuned, from an initial value declared above. In the latter, the step in which the parameter is tuned is identified below. Note, the coronary LAD circulation parameters 74, …, 80 and the coronary RCA circulation parameters 81, …, 87 follow the naming convention of those declared above for the left circumflex artery, with the text “LAD” and “RCA” replacing the text “Cx” and identical initialisations.
It is typical to express the dynamics of the system in Figure 1 in coupled ordinary differential equations (ODEs), or differential algebraic equations (DAEs [23]), typically with compartment pressures serving as internal states. In state-space form [24], using relative time, our model is expressed as
Vector function , which maps between internal states and outputs, is often the identity. Outputs can, of course, be sampled to generate a discrete output metrics vector. denotes the system model’s full input parameter set and
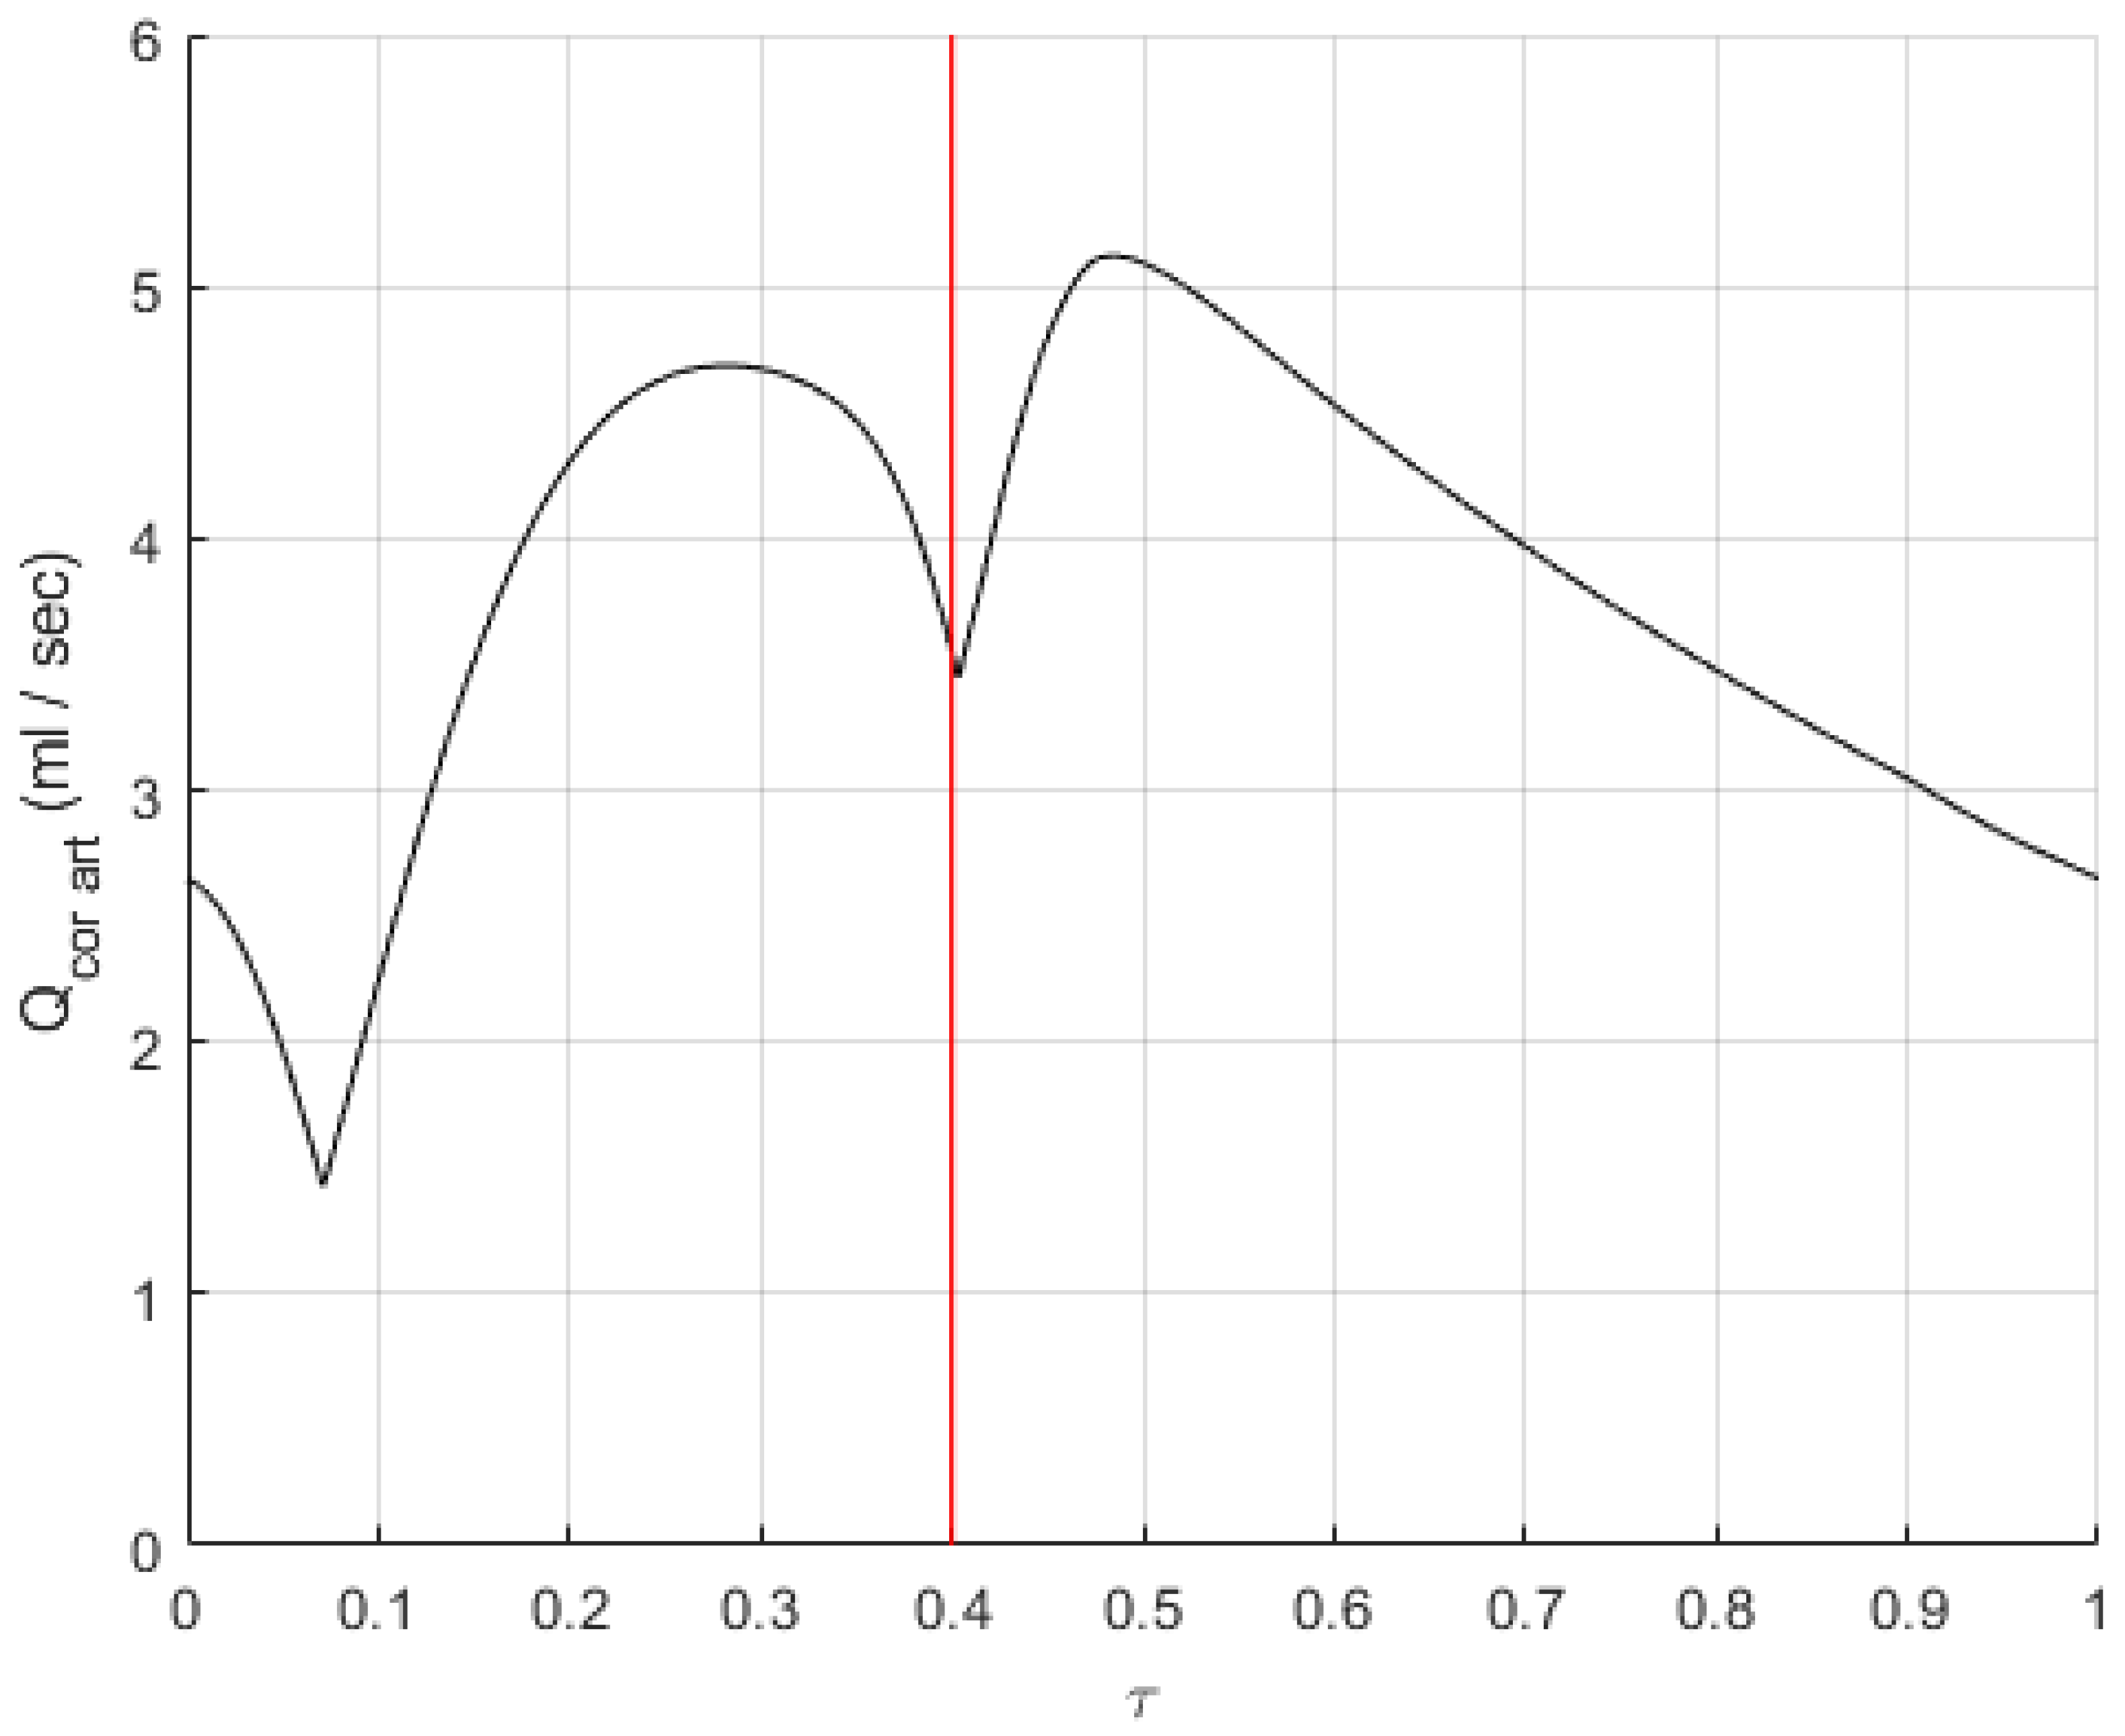
is our instantaneous state vector. We use () to denote the full set (a subset) of input parameters. Particular examples of the system expressed in equations in Section 3.1.2 are given in Appendix A. Deriving equations in Section 3.1.2 uses recursive applications of simple haemodynamic sub-models, to formulate, in closed form, all the necessary relationships between compartmental pressures, volumes and flows (see Appendix A). A simple but lengthy process of eliminating flow and volume variables results in a DAE system [23] which is readily transformed into state-space form, by differentiating equations where necessary. Typically, the system is solved using a time-marching numerical solution, e.g., a fourth-order Runge–Kutta algorithm. A time step of was chosen for the numerical solution. It will occasionally be helpful to replace the numerical compartment index (subscript) with an abbreviation of its name, e.g., , with LV denoting left ventricle, etc.; see Table 2 and Table 3. For example model output data see Figure 2, which shows flow in a coronary artery illustrating a key feature- to capture diastolic dominance in coronary flow, our coronary vessels’ compliance is biased by the LV or RV pressure, as appropriate.
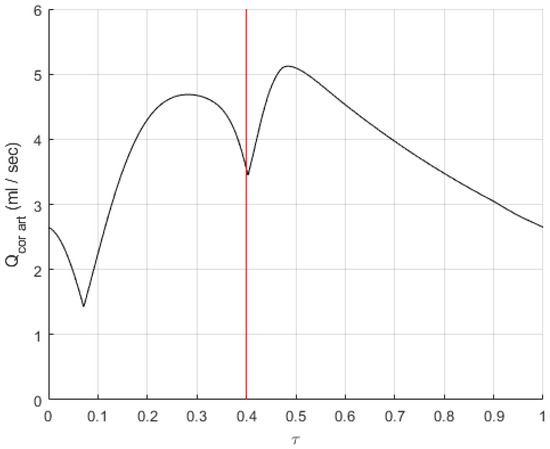
Figure 2.
Diastolic dominance of coronary artery flow in the system model. It is essential to capture the diastolic dominance of flow in the coronaries. Here, the vertical red line indicates the end of systole. These illustrative data show that computed flow peaks in the diastolic phase.
3.1.3. Input Parameters, Local Sensitivity and Orthogonality Analysis
Of our 87 input parameters, a majority take population average values and are not tuned; see Table 3. The interrogated input parameter sub-space is spanned by parameters of cardiac energetics, coronary perfusion, LV and left atrial elastance, the mitral valve, the coronary and systemic windkessels and mean circulatory filling pressure. The underlying full local sensitivity and input parameter orthogonality analysis is shown in Appendix B, along with a reduced analysis, based upon the most relevant inputs and outputs.
3.1.4. Model Personalisation or Input Parameter Identification
Personalisation involves inverse operation, guided by a cost function, together with an appropriate multi-variate functional minimisation algorithm. Our personalisation process is multi-stage. It is summarised in the inter-relating Table 1, Table 4 and Table 5. For all stages, the minimised cost function is a scalar weighted composite of: (i) the L norm of the difference between model-predicted and target data interpolated onto the same times, , and (ii) a derived metric,

Table 4.
Patient-specific data. Data are classified according to physical and mathematical significance, how the data are used, patient state and the 0D model compartment(s) to which they apply. Table 5 provides more information on the sub-models used to introduce these data into our 0D system model. The free subscript * in column 6 denotes one of the resolved coronary arteries, LMS (left main stem), LCA (left coronary artery), LCX (left circumflex) and RCA.

Table 5.
Sub-models used to pre-process patient data. We provide further information on how patient data outlined in Table 4 are prepared. Here, denotes an ensemble average, taken over equivalent intervals of dimensionless time . This table shows the interaction between the various data sources and re-processing, to allow them to be ingested into the 0D compartmental system model (column 3). All pressure data were downsampled onto the CMR phase times; see Equation (2).
For example, a derived metric might be systolic systemic arterial (compartment 5) pressure
with and denoting the weights. We defer further discussion until Section 3.2.
Having summarised our processing and its rationale and declared our notation, we may now conclude this sub-section by defining the processing in key steps 3 and 4 of our protocol, which require inverse operation, or tuning, of the 0D system model. In Table 6 we state the model input parameters which are tuned and the corresponding patient data that is used to perform the tuning in each of the steps 3 and 4.
3.1.5. 3D CFD Models
We proceed to consider the CFD tools and modelling used in our study. Patient-specific stenotic Bernoulli resistance coefficients and MVRs are provided in our core model using two validated CFD based methods, (i) VirtuHEART (University of Sheffield, Sheffield, United Kingdom) and (ii) VirtuQ (University of Sheffield, Sheffield, United Kingdom) [6,7]. In the domain , these tools solve the incompressible Navier–Stokes and continuity equations
for steady, i.e., time-average flow; all symbols have their usual meaning. An accepted approximate value of Reynolds’ number for the coronary arteries, which indicates transitional flow. Note that we assume blood is a Newtonian fluid. Patient-specific boundary conditions are derived as follows. A closed coronary artery geometry (Figure 1d) is decomposed into a luminal boundary, , an entrance face, , and an exit face, . Using epipolar geometry and two compatible angiogram views, taken at the time of PCI, we construct , generate a mesh and apply a Dirichlet, no-slip condition
We remark that a model of vessel sequestration using Murray’s law [25,26] to assign a flux across the luminal boundary based upon local geometry is available [7,27]; however, zero leak was specified here. Lesion proximal and distal time-averaged pressures are also recorded at PCI. Solutions were computed using Fluent (Ansys Corporation, Canonsburg, PA, United States of America), with boundaries and processed in each of two ways:
- Following VirtuQ methodology, apply measured proximal and distal average pressure on , , respectively,we compute the steady-state solution and deduce vessel flowthen, we use Ohm’s law and to compute a patient-specific MVR.
- Following VirtuHeart methodology, assume an MVR based on patient characteristics [6]; compute vessel inlet and outlet areasset two physiologically plausible inlet flows ( mL/s), find uniform inlet and outlet streamwise velocitiescompute the two corresponding pressure drops, , and hence infer the two Bernoulli resistance coefficients of the stenosis.
3.2. Materials
We analysed anonymised clinical datasets from 40 CAD patients with angina symptoms. The elective PCI workflow culminates in re-vascularisation of one or more of the coronaries in a majority of cases. The decision to stent is guided by the average pressure drop across a lesion. This is measured using a pressure wire (PRESSUREWIREX Abbott, downloading software Coroflow, Coroventis Uppsala, Sweden) with the patient in a hyperaemic state of pharmacological stress induced by adenosine (a strong vasodilator); from this, one computes
with re-vascularisation indicated for . The clinical pathway generates PCI pressure data, cardiac MRI of the LV, six-minute walk tests (6mwt) before and after PCI and home activity monitoring (see below); these data fall into two categories
- Measured data (such as pressure and volume, expressed as time-series);
- Exercise and physical activity data (like patient 6mwt (exercise) and home monitoring (activity) measures).
Table 4 identifies data available for every patient, for Table 5, the particular form in which pre-processed data modalities, declared in Table 4, are ingested into the system model, and Table 1, a commensurate sequence of handling protocols.
Our personalisation process steps (Table 1) introduce physiological effects sequentially, considering
- Functional form (qualitative data trends should accord with accepted physiology);
- Modality (pressure is measured directly, using a manometer; CMR volumes, in contradistinction, involve reciprocal space reconstruction).
Our raw data take the form of time-series at two sampling rates. Pressure data were all sampled for 120 s, using a sampling rate of 100 Hz. CMR volumes were acquired at a nominal sampling rate of 30 images per heart cycle. Pressure and volume can be co-registered to the start of ventricular contraction using the RR interval of the concurrent ECG1 traces, also recorded. Pressure and CMR data were acquired at different stages in the patient pathway (Table 4), with patients often in different physiological states. For all pressure signals, the sampled wave-train had its low frequency contribution removed and was decomposed, using time-domain analysis, into single beat pressure excursions, identified from the concurrent ECG 1 R-R interval, and then ectopic beats were filtered, and the remaining cycle pressure samples were downsampled onto the 30 dimensionless times defined as follows
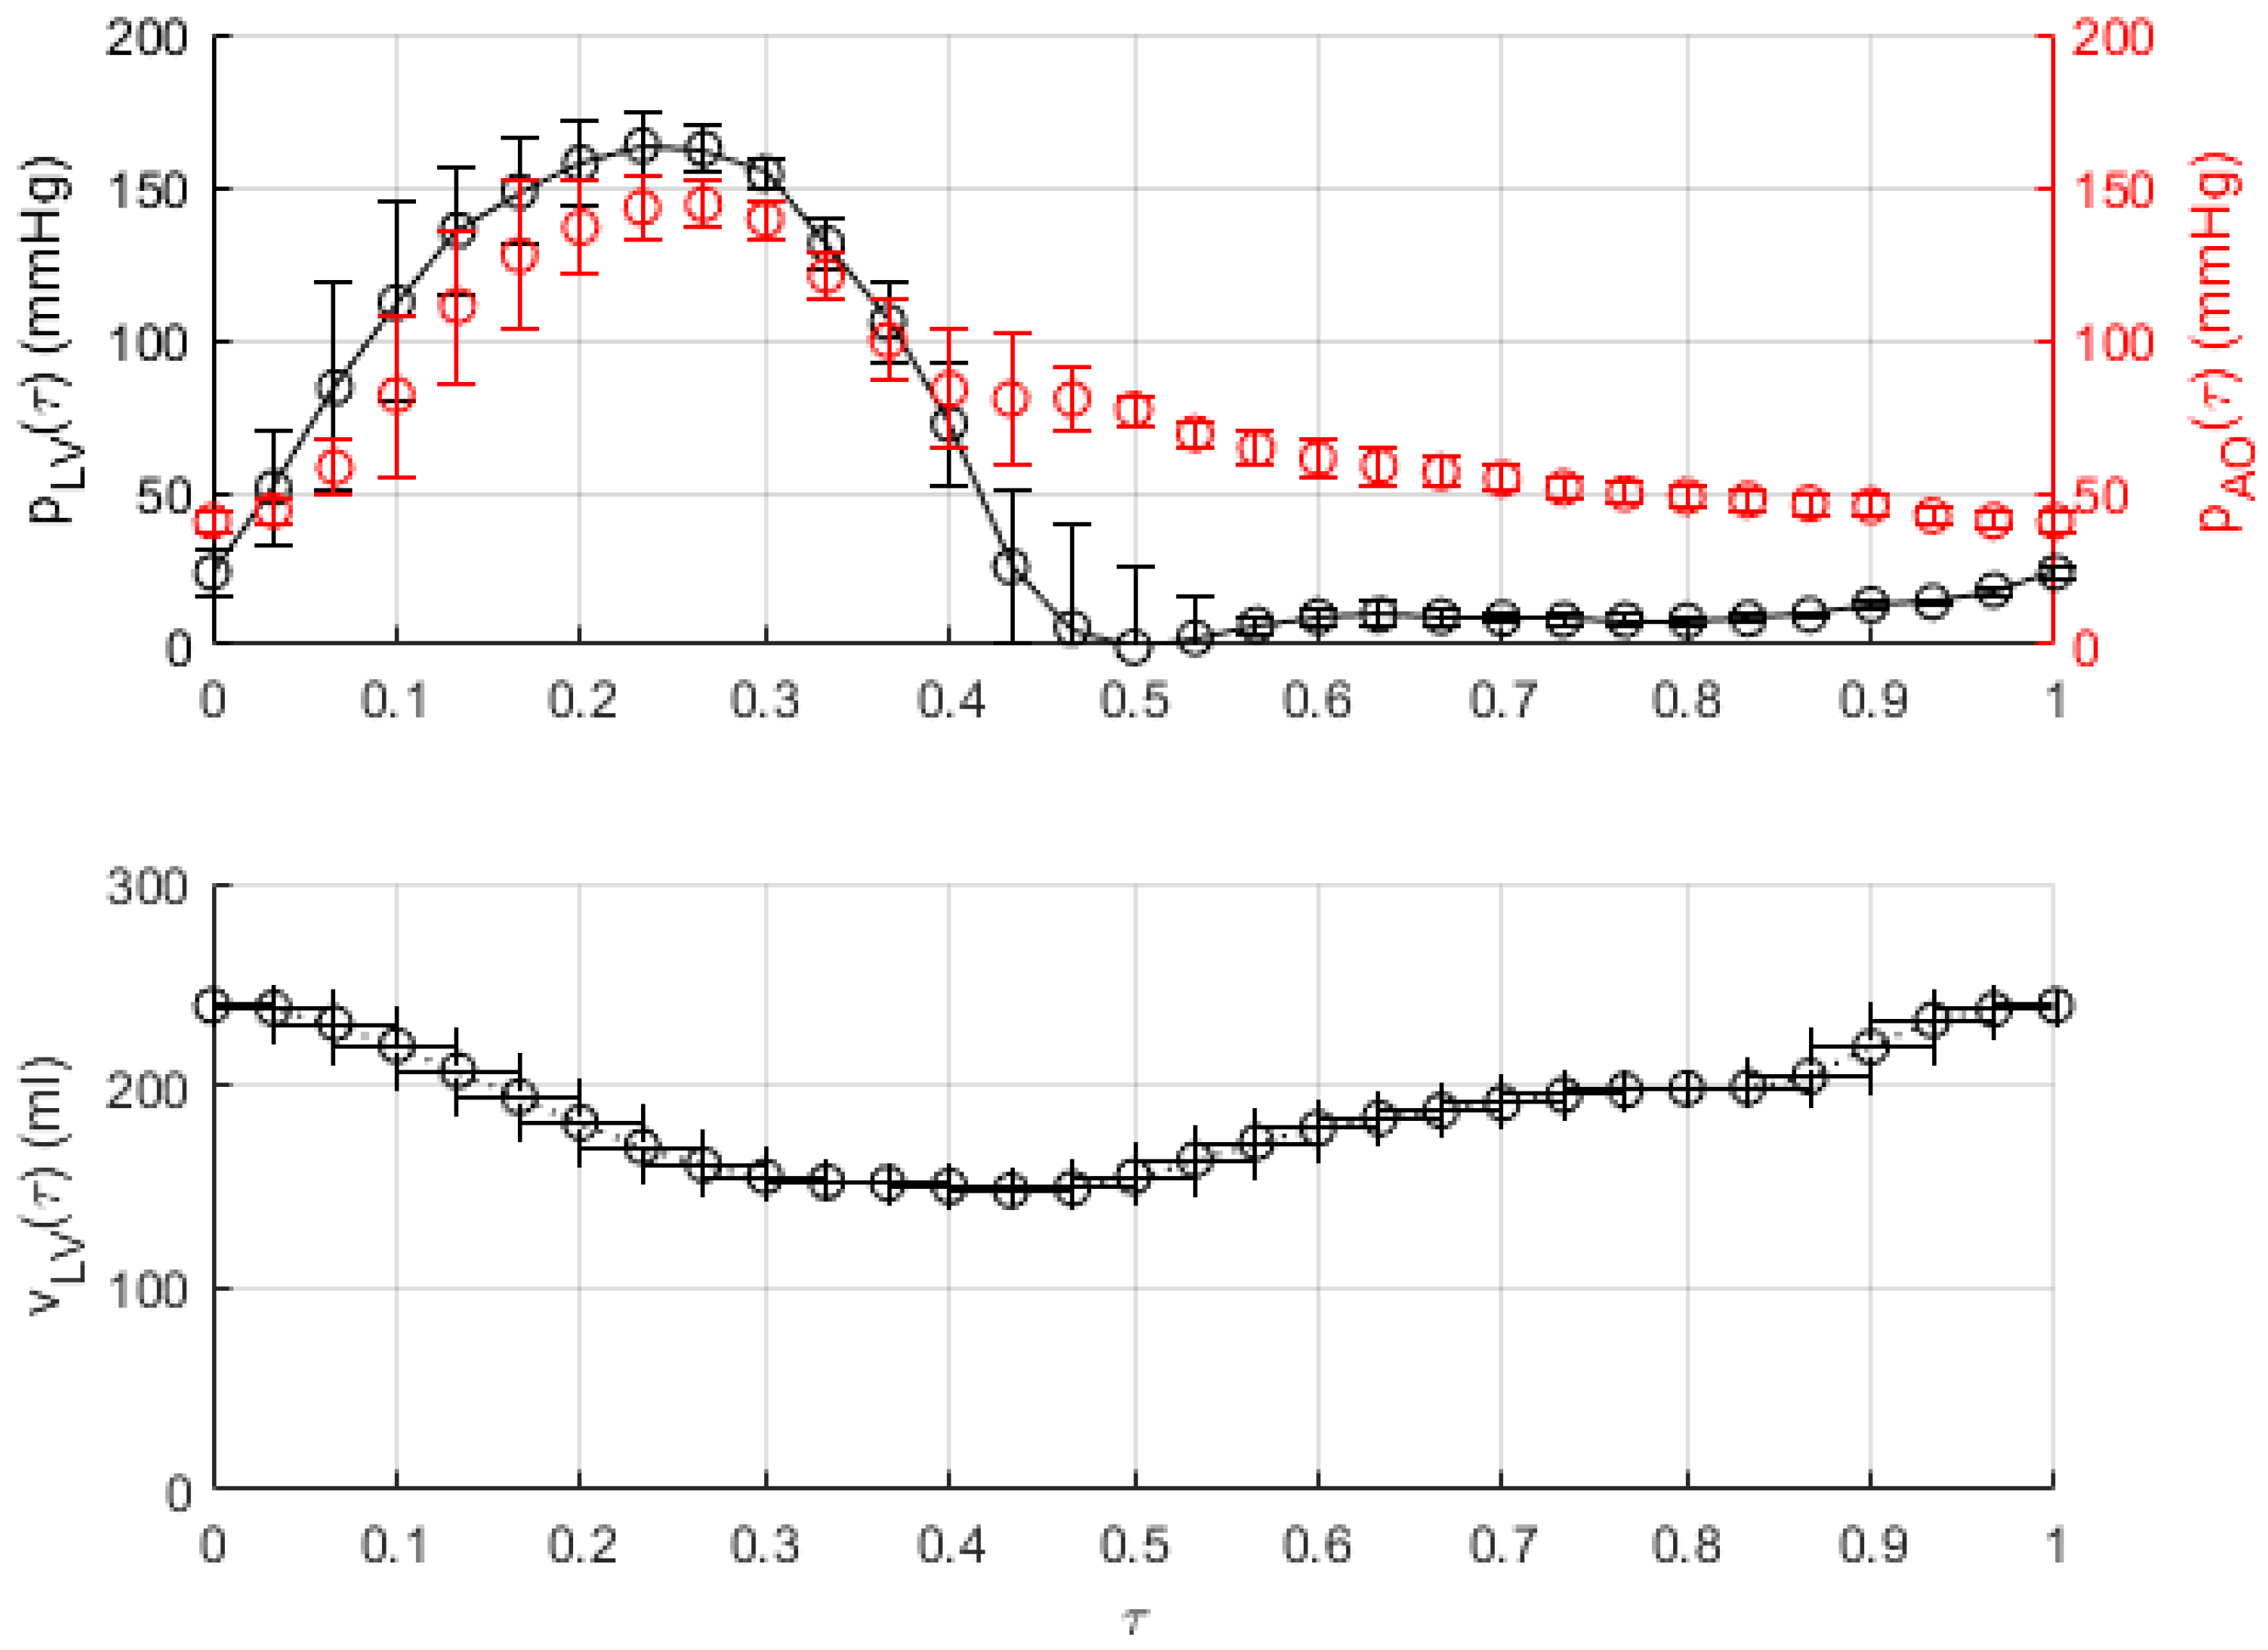
corresponding to CMR data sampling times. This set was then ensemble averaged, with the sample standard deviations in each dimensionless time channel providing an error. Example aortic and LV pressure data are shown in Figure 3. CMR-derived LV volume data are also effectively ensemble averaged (acquisition involves a reciprocal space reconstruction of data acquired at a given cycle phase, over several consecutive beats). Our CMR total LV volume measurements are attributed to 30 equispaced dimensionless times. Each was computed by segmenting the chamber, in a set of between 9 and 12 cross-sections, with the base and apical frames frequently discarded, owing to error. Frames were positioned along the long axis of the approximately cylindrical LV. Our segmentation and subsequent volume computation were performed using the MASS software (Leiden University, Version 2018 EXP, Leiden University Medical Centre, Leiden, The Netherlands). Figure 3, right panel, shows a typical CMR volume time-series.
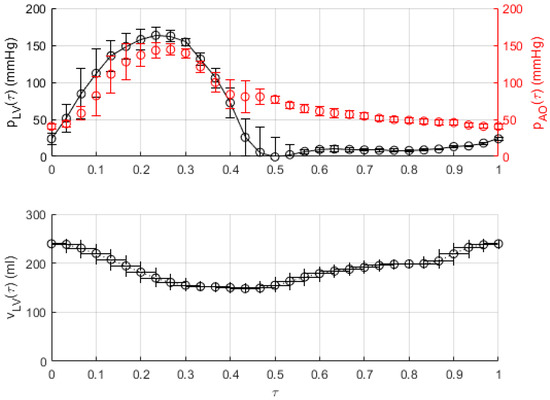
Figure 3.
Raw time-series data. Top panel. Downsampled aortic (right ordinate) and left ventricular (left ordinate) pressure variation. These pressure time-series (original sampling rate 120 Hz) were acquired with a concurrent ECG time-series (ECG 1 lead) in the catheterisation laboratory while the patient was undergoing elective PCI. The independent signals were co-registered, using the common background clock of the RR interval of the accompanying ECG 1 recordings. The error bar on these data is derived from the standard deviation of the downsampled pressure time-series sample bins. Bottom panel. LV volume variation. These time-series data are expressed in 30 equispaced CMR phases times. The horizontal error bar corresponds to two CMR phases because the principal source of error in the CMR signals was deemed to originate in the pressure–volume co-registration, which was corrected by a rigid shift, relative to the pressure signals, of about two CMR phases. The data in both panels have time period secs, but the patient HR and systolic time typically vary between the data collections.
Downsampled pressure and volume are acquired relative to a common clock provided by the ECG 1 RR interval which can potentially synchronise them, to yield a personal double Hill elastance function, , etc. However, there are demonstrable inconsistencies, such as heart rate (HR) miss-match. Pressure data have a certain HR, and CMR data another. We will demonstrate that careful pressure and volume time-series co-registration is essential, and we will develop a minimal rigid shift which adjusts only relative phase.
3.2.1. Physical Data Processing
Chamber elastance functions (Appendix A.2) are low-order models developed from studied physical data. Elastance may be defined as follows
where subscript * now denotes the chamber and its unstressed volume. We take the clinical approximation, . Clearly in Equation (5), is sensitive to the relative phase of and , but the importance of co-registration is perhaps better illustrated by another metric—the PV loop. The latter is a closed, two-dimensional parametric, Cartesian curve
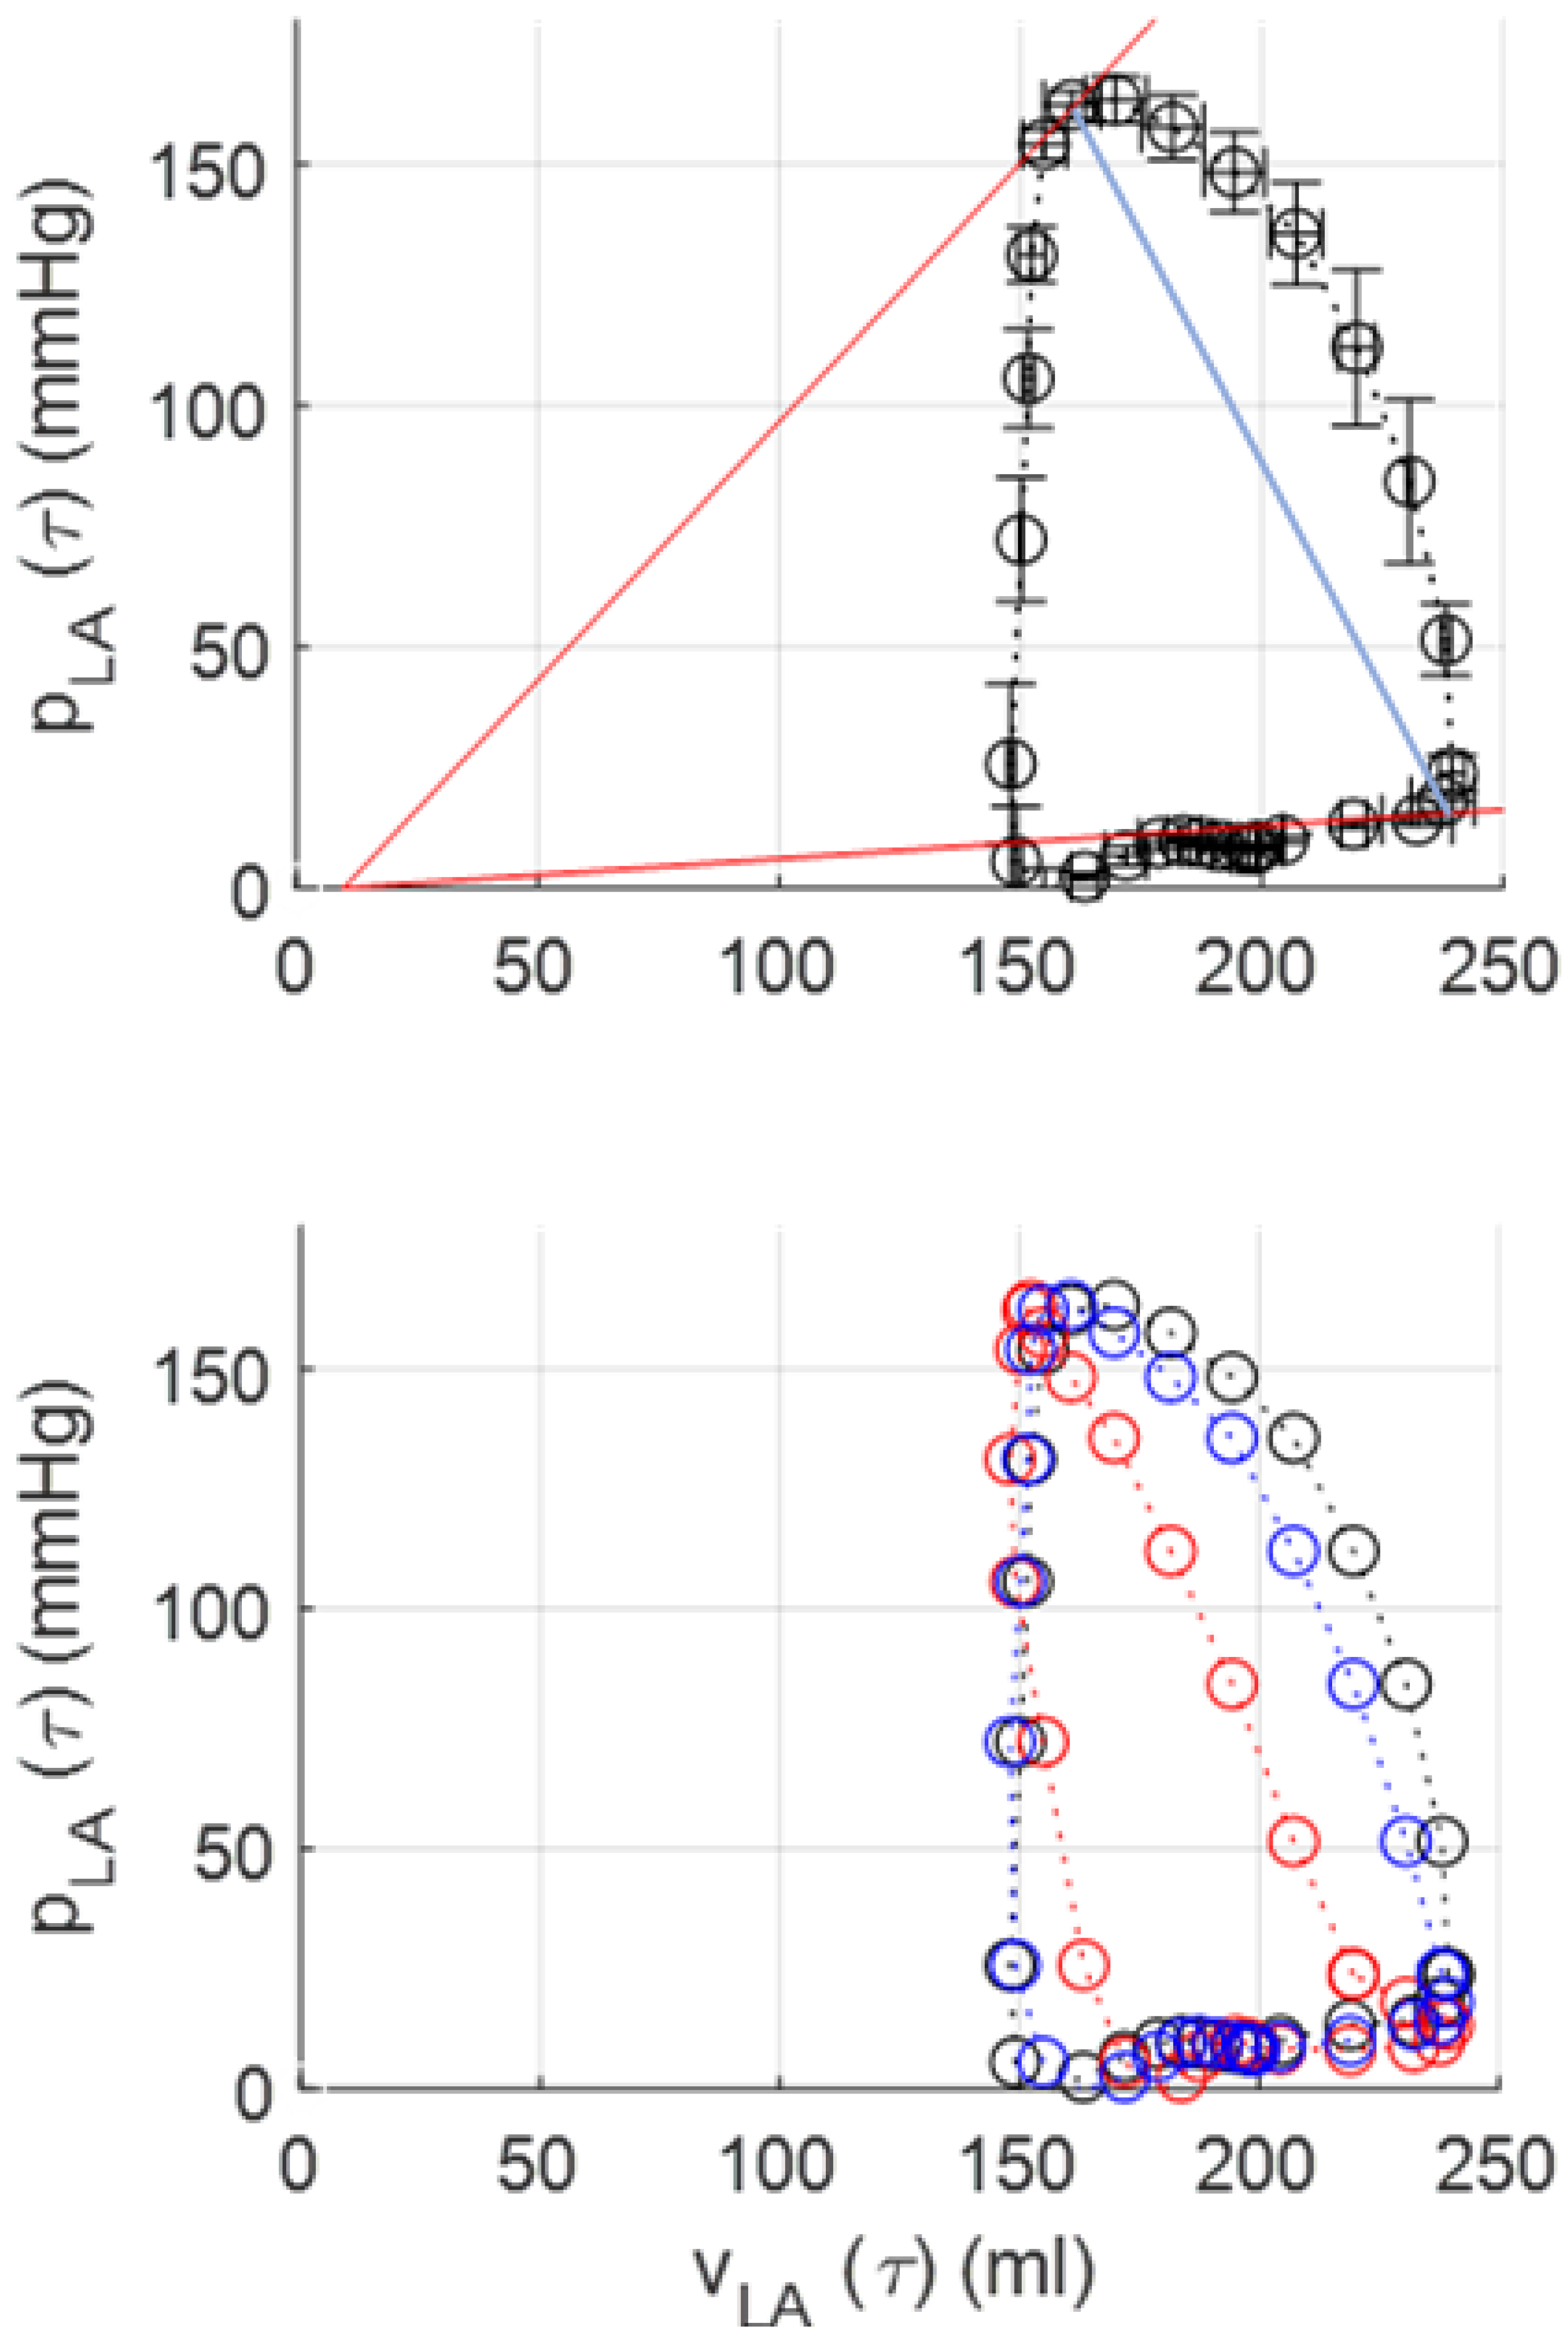
Figure 4, top panel, shows a personal PV loop in which the LV pressure and volumes are correctly co-registered. The ventricular–aortic coupling parameter (blue line) and the wasted mechanical work, as well as the useful mechanical work (loop area), can be deduced. In contradistinction, Figure 4, bottom panel, shows the same patient’s PV loop using the putative common clock of the RR interval, to co-register the two time-series signals (red data). This primitive co-registration is implausible: it has no identifiable iso-volumetric phases, and it implies a high level of valvular regurgitation and irregular aortic and mitral valve actuation pressures. The difference between Figure 4, top and bottom panels. argues for a principled co-registration other that the EGG 1 RR signal. Reserving for subsequent work a more elaborate co-registration, possibly involving signal dilations, we chose rigidly to delay the LV volume samples relative to a fixed pressure sample set , by an integral number of dimensionless time steps, . We observed a cohort-average shift of two CMR phases. Patient-specific synchronisation was accomplished by seeking the instant at which the aortic and mitral valves open, in the separate pressure and volume time-series, using the multiple criteria declared in the fourth column of Table 7.
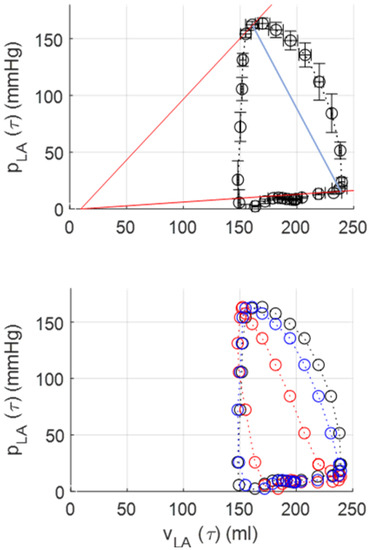
Figure 4.
Patient-specific PV loops. Top panel. The closed curve, or loop, derives from the raw data in Figure 3, appropriately co-registered. Ventricular–arterial coupling [20] is measured by the modulus of the gradient of the blue solid line. Isovolumetric compression (right) and relaxation (left) segments are apparent. The volume enclosed within the PV loop is the useful mechanical work, applied to ejected fluid. Wasted work is calculated from the area bounded by the red lines and the left-hand side of the PV loop. Bottom panel. One PV loop based up the same data as shown in the top panel, but using different co-registrations of pressure and volume time-series data. The primitive co-registration (red) has no rigid shift applied to the volume data; the blue dataset shows the result of a rigid shift of one CMR phase, and the black data show the result of a shift of two CMR phases (the value of the shift obtained by synchronising the valve timing points). These data demonstrate the clear need for careful co-registration of the two signals.

Table 7.
Identification of mitral and aortic valve opening times, in LV pressure and volume time-series data. Each valve opening instant was identified by multiple criteria (column 3). Discrete time-series data temporal derivatives were evaluated by the class of finite difference approximation stated in column 4. Column 5 defines the notation for the identified cycle time fraction.
When times and are not simultaneous, a plausible co-registration is imposed by postulating a shift, or delay in the data of CMR phases. Similarly, was evaluated. The final rigid shift of CMR volume time-series data is
Here, the symbol ≈ is used to denote a rounded value. The result of applying the rigid shift defined in Table 7 to our volume time-series data transforms the PV loop; see Figure 4, bottom panel. Our processing paradigm may be summarised as: constrain the LV pressure and volume time-series to conform to accepted PV loop physiology.
With an acceptable co-registration of pressure and volume data, we derive the LV double Hill elastance function parameters. (widely termed “contractility”) and (“compliance”) are assigned directly
The remaining activation function parameters accrue by seeking the extremum of a multi-variate function, which is assumed to be differentiable
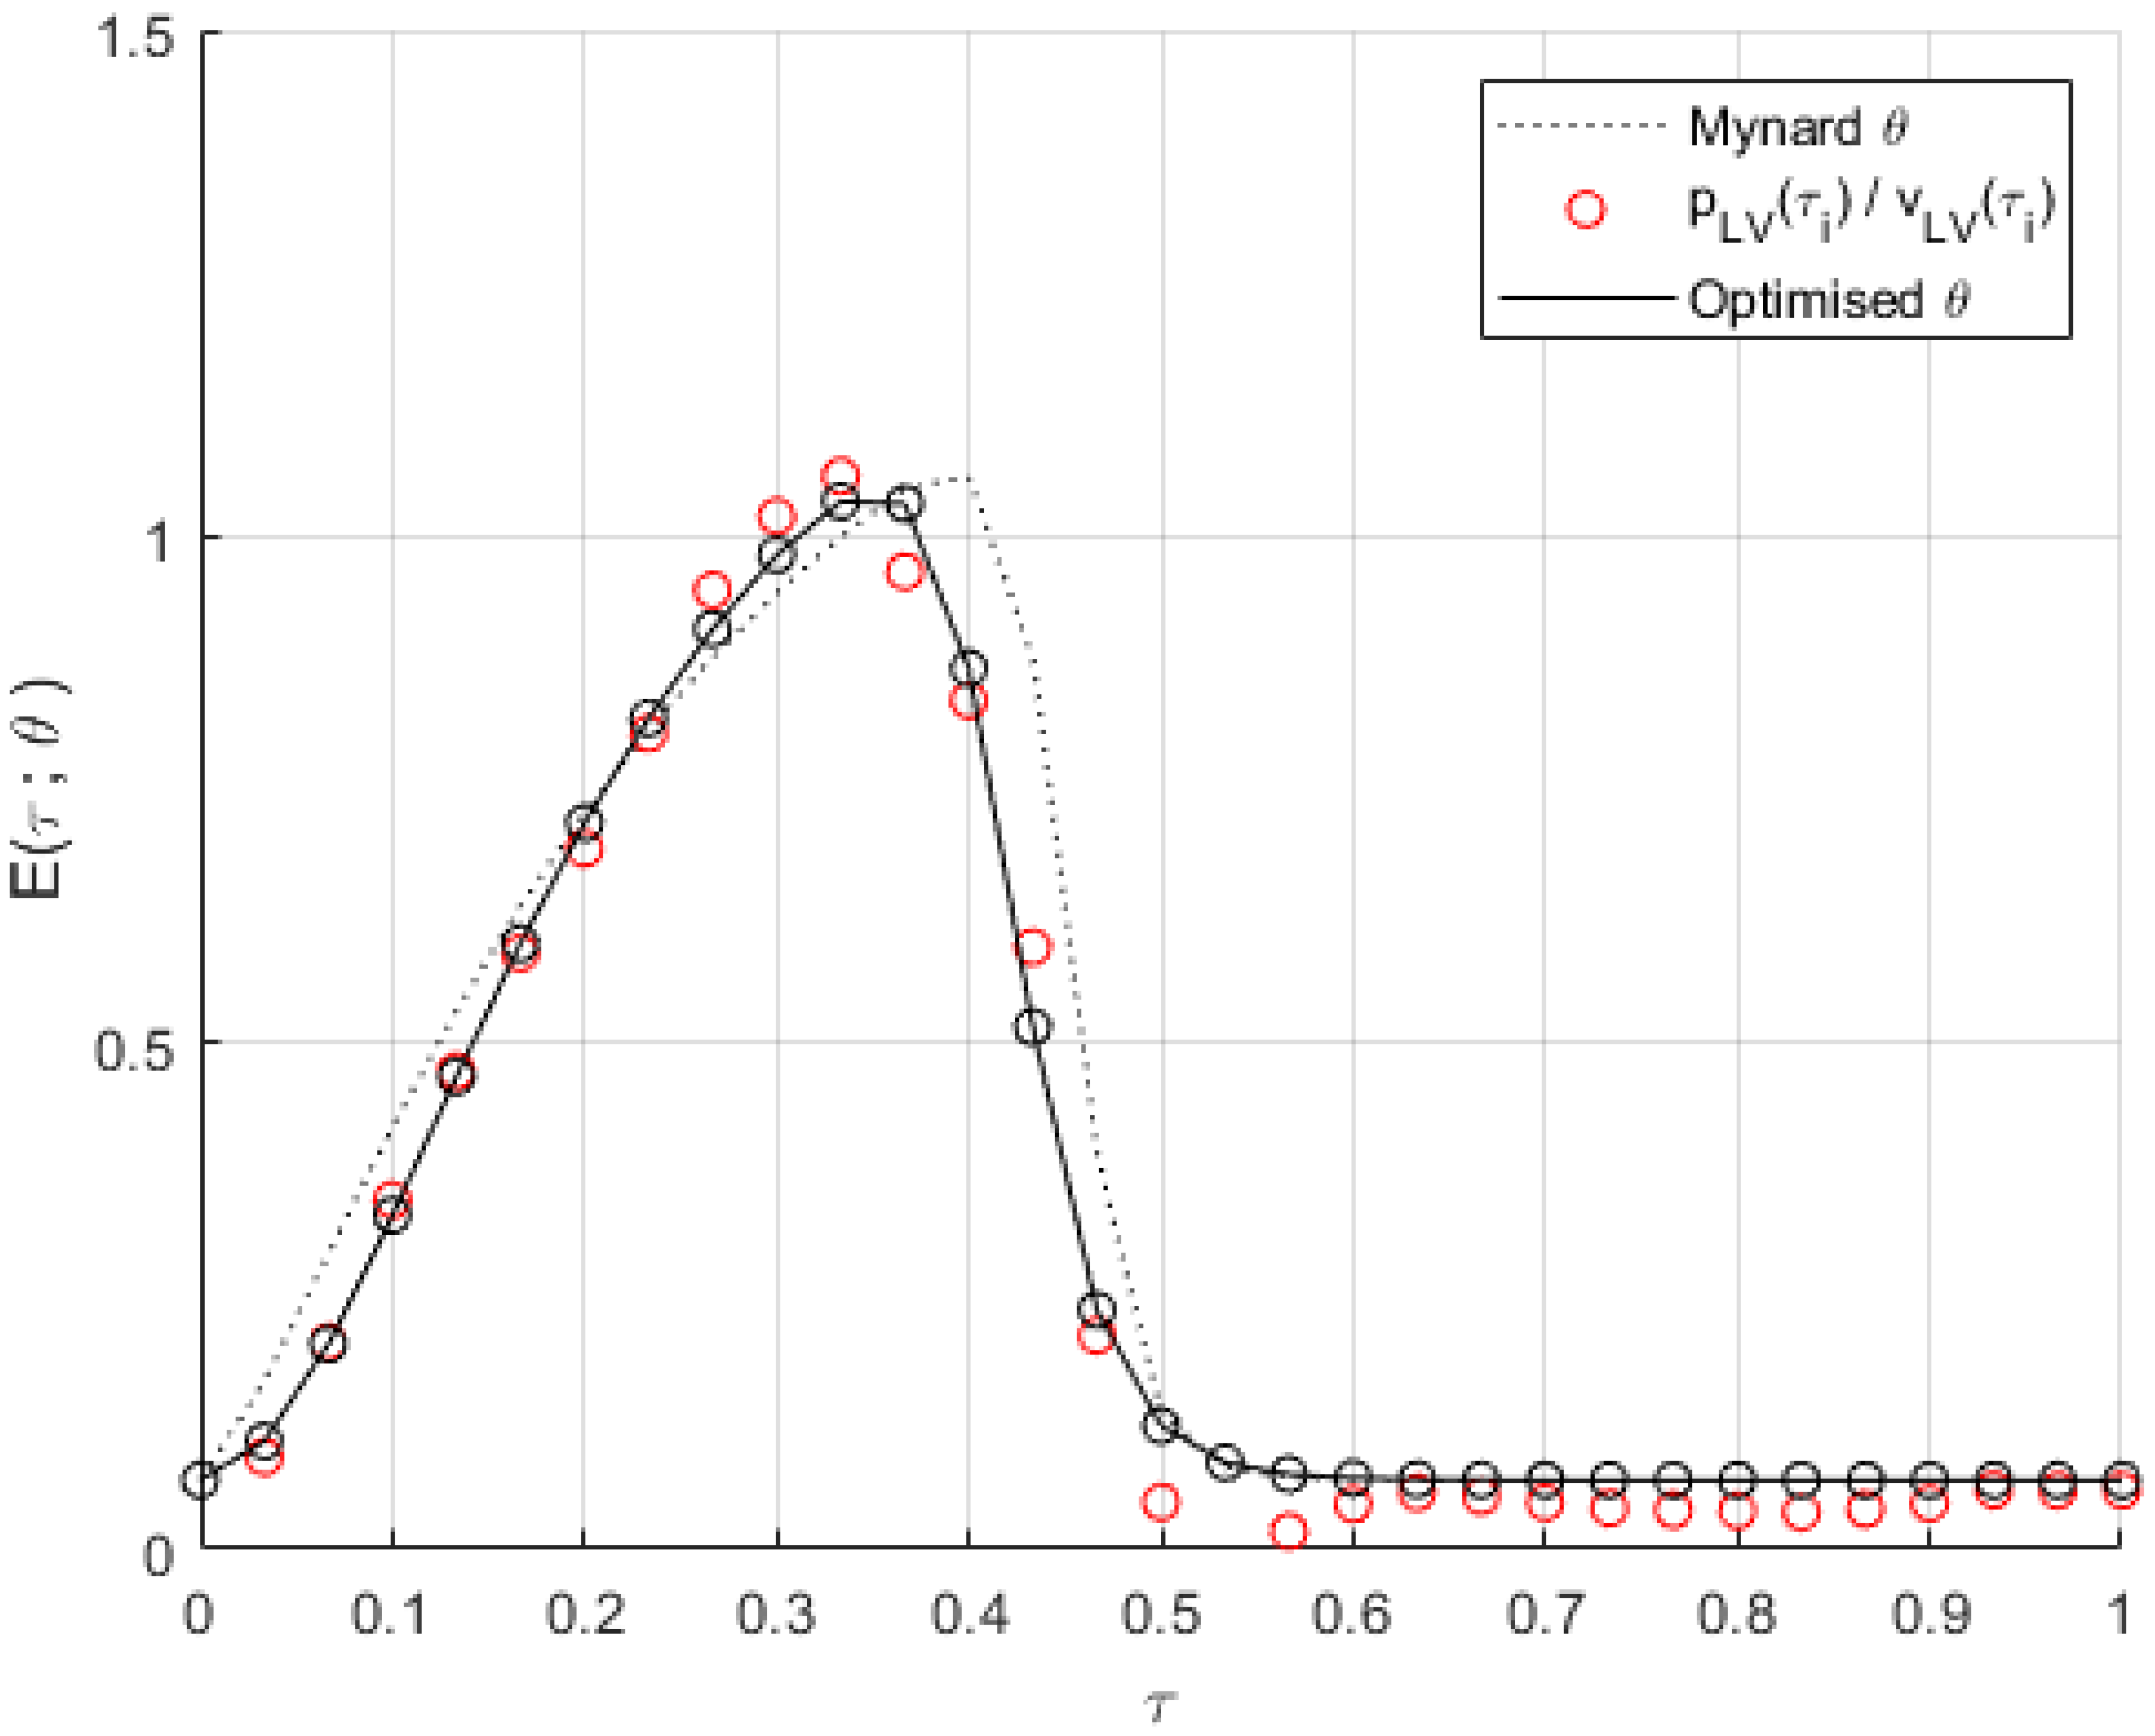
Note, are variables (parameters) on the left (right)-hand side of Equation (7). Minimisation was performed using a gradient descent, initialised to the population average [12]. Figure 5 below shows a derived elastance function.
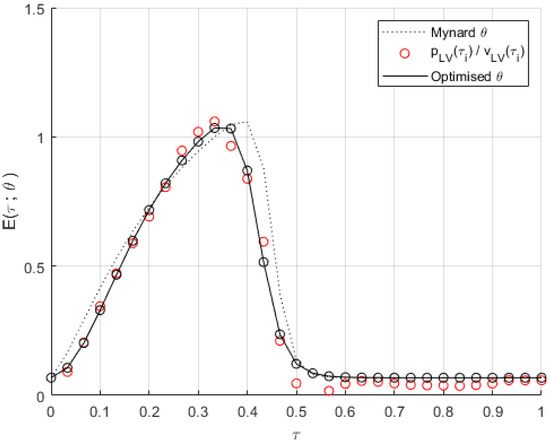
Figure 5.
A personalised elastance function. The solid line corresponds to the optimum elastance function, obtained from suitably co-registered coordinates (,), using the cost function in Equation (7), minimised using a gradient descent simplex method. Broken line: our common initialisation, using Mynard’s population average [12] parameterisation, . Open red circles: raw data, with the appropriate shift applied. Black circles and line: optimised fit on the shifted data minimising the residual declared in Equation (7).
In this way, our mechanical time-series signals are downsampled onto a common rate of Hz, suitably co-registered, and then used to deduce a personalised for each patient. These data will be recycled as 0D system model personalisation targets, both as discrete time-series and derived metrics.
3.2.2. Exercise/Monitoring Data Processing
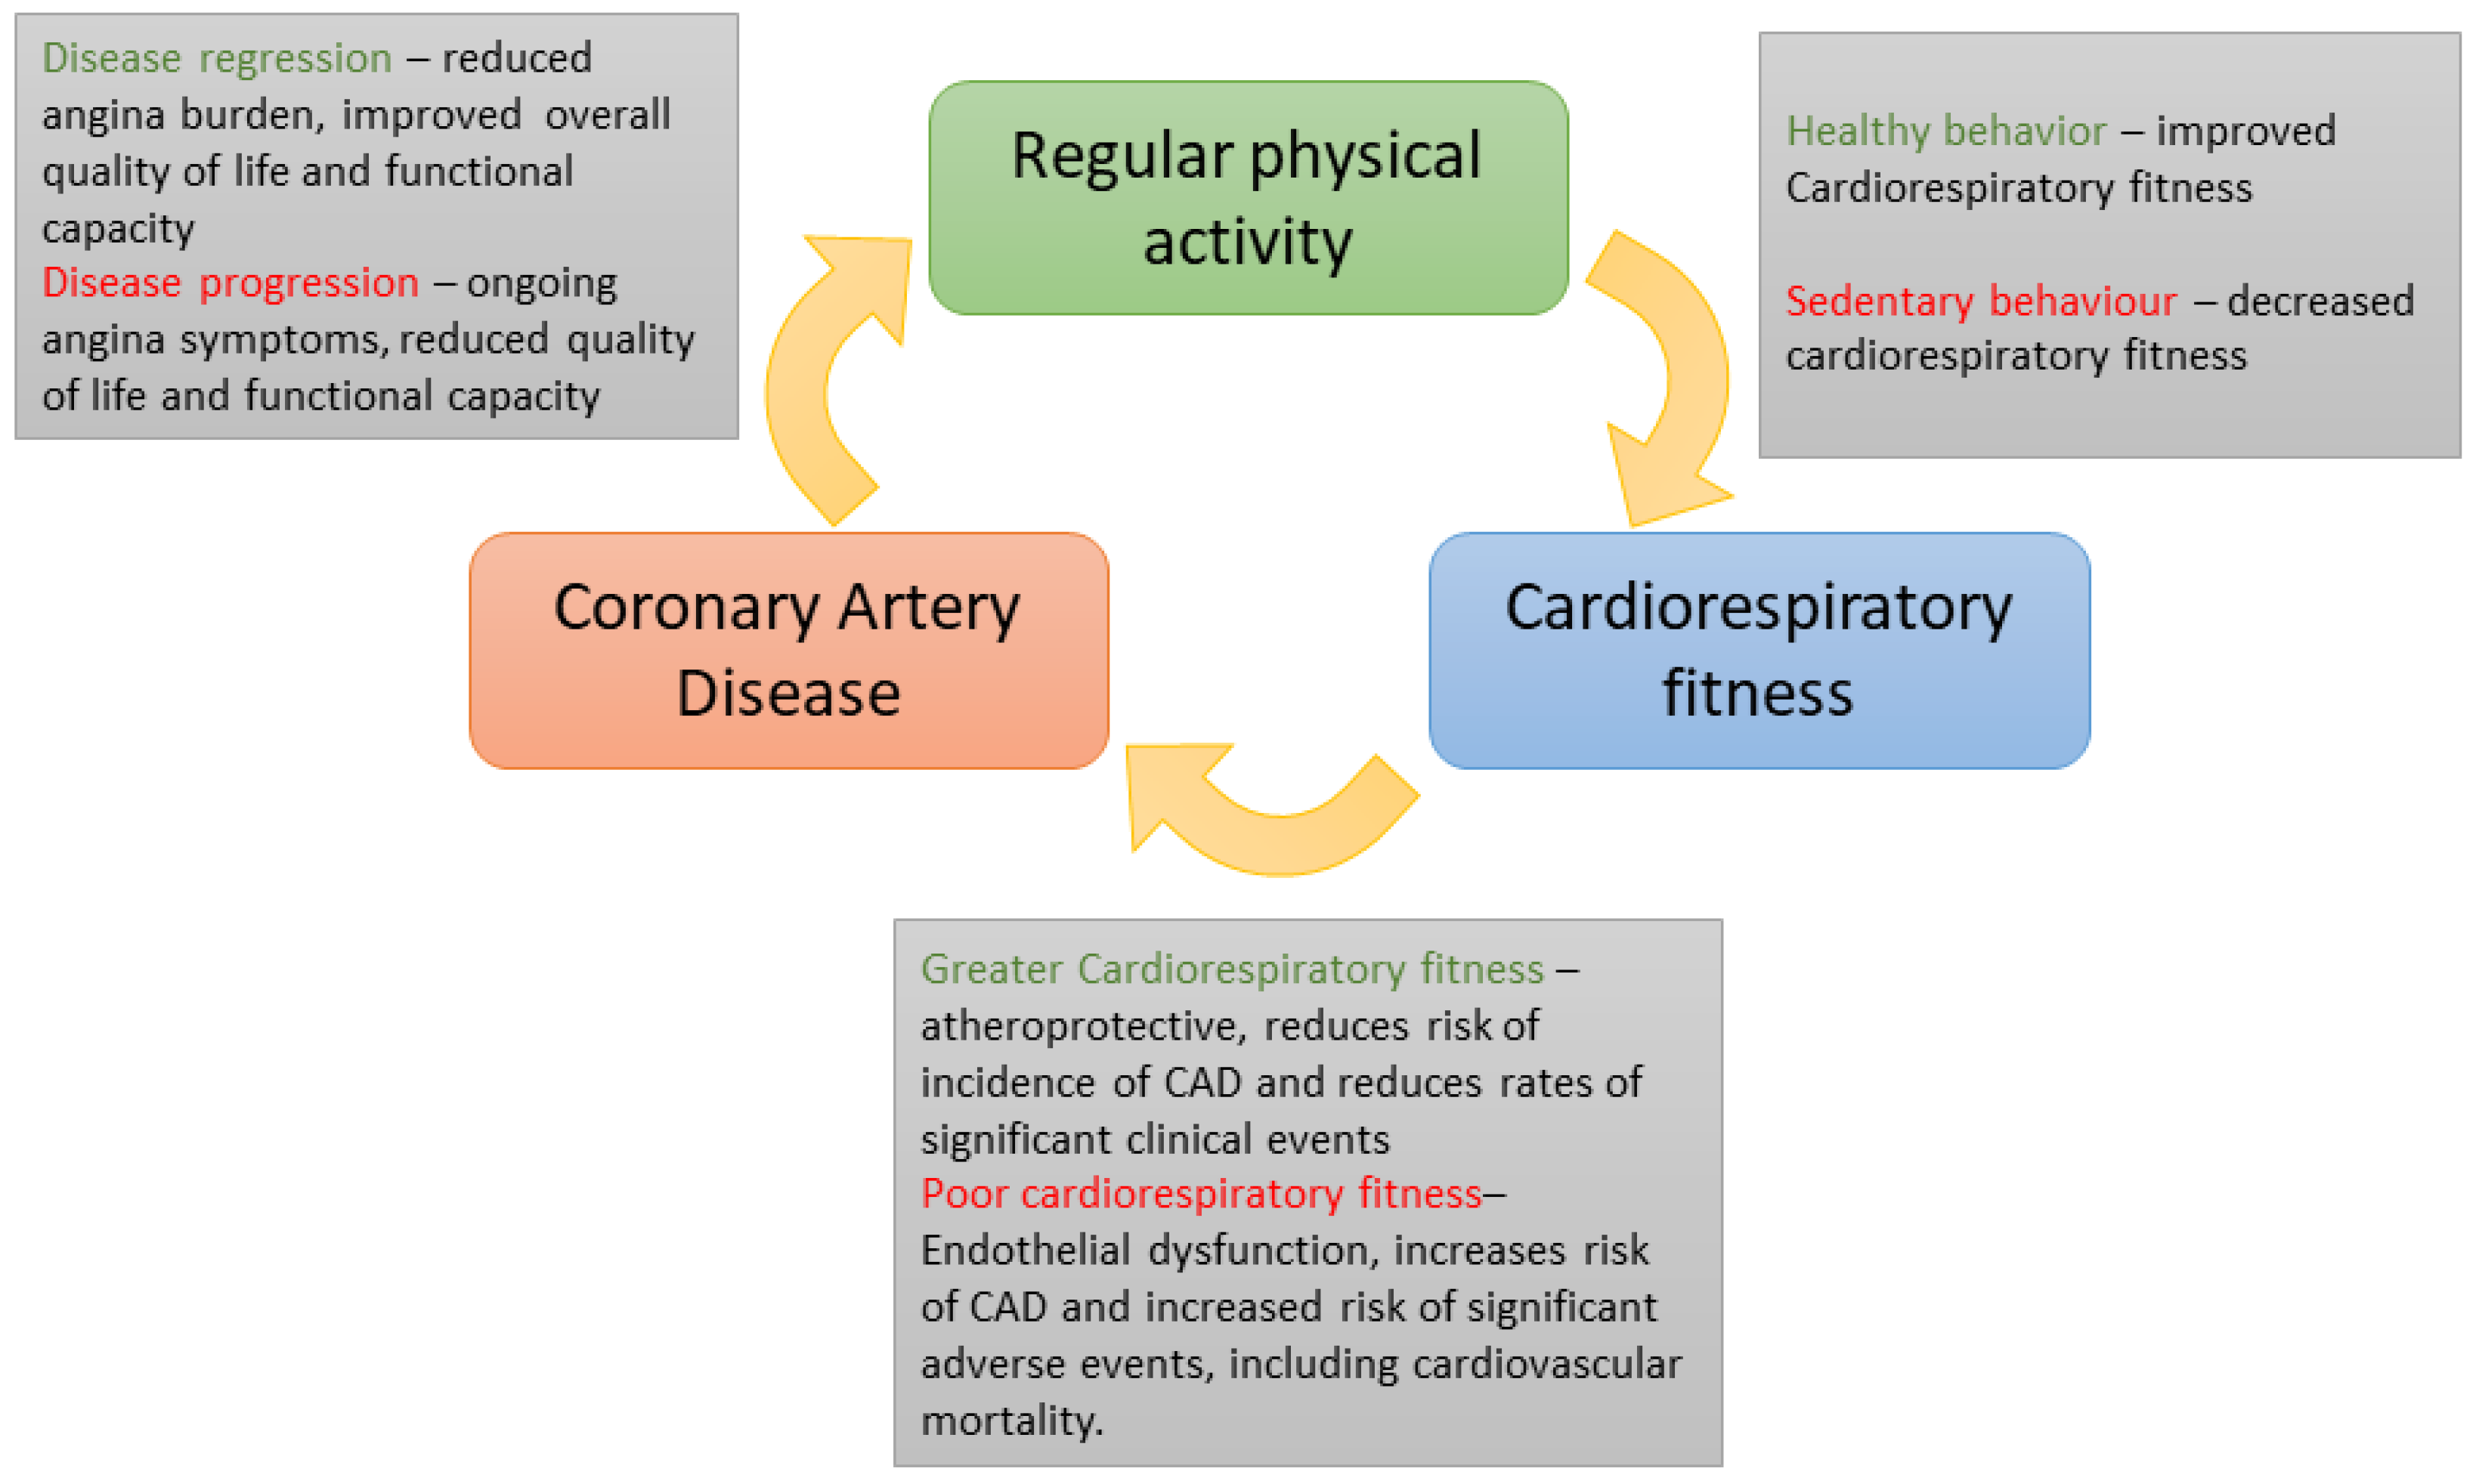
CAD and cardiorespiratory fitness are linked. Endothelial nitric oxide synthase (eNOS) prevents platelet aggregation and white cell adhesion and inhibits vascular smooth muscle cell proliferation [28], and regular physical exercise enhances bioavailability of eNOS and regeneration of the vascular endothelium [29]. Conversely, inactivity is associated with pathological processes preceding atherosclerosis and CAD [30]. As a result, a dose–response relationship exists between physical activity and the risk of CAD [31], with exercise capacity predictive of mortality, myocardial infarction and risk of re-vascularisation in patients with established CAD [32]; see Figure 6. Assessing patients’ activity and exercise capacity is key in the management and assessment of CAD. For completeness, therefore, we summarise, in two categories, the study exercise and activity data which will, in future work, quantify the change in patient exercise tolerance attending measured PCI-related physiological changes.
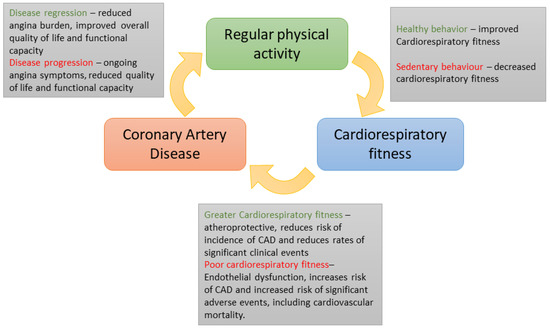
Figure 6.
Schematic representation of the relationship between exercise, coronary artery disease progression and cardio-pulmonary fitness and the underlying physiology. The exercise and activity data gathered in this study will eventually expose quantitative links between physical activity, cardio-respiratory fitness and coronary artery disease.
- Home activity monitoring. Fitbit Charge 4 wrist watches (Healthy Metrics Research Inc. San Francisco, CA, USA) and a smartphone were used. Data monitoring started at recruitment and extended up to six months post PCI. All data were uploaded to the Fitbit website simultaneously through a smartphone application and then exported as coarse-grained time-series (mechanical energy consumption, distance walked, minutes spent sedentary, light, fairly, and great activity). Concurrent HR data were also exported as downsampled HR data, which were simultaneously updated throughout the day as time-averaged values every 10–15 min.
- Formal six-minute walk tests (6MWT). These were performed at baseline before the PCI (ideally one day) with a repeat assessment after three and six months. In these standard clinical assessments, the data collected were cuff blood pressure, HR and distance walked.
We remark that exercise training in CAD is superior to PCI in improving event-free survival and exercise capacity and is at a much lower cost [33], and the total distance walked is a proxy for cumulative CO.
4. Results
Three randomly chosen patients designated A, …, C were used to validate our personalisation process, by demonstrating an accurate in silico description of patients’ pre-PCI rest state. Since changes in arterial geometry accompanying re-vascularisation are recorded, PCI-modified MVR and stenotic Bernoulli resistance coefficients will accrue with our approach. Thus, data such as those presented here will eventually be available on the post-operative patient; see Section 5. Results fall into two categories: (i) data on our methodology as summarised in Table 1 and Table 4 and (ii) the emergent patient representations.
4.1. Elastance Function Evaluation
Downsampling and ensemble averaging of patient LV and aortic pressure time-series datasets were performed straightforwardly. We proceed to protocol step 2 (a personal )), where we encounter the sensitivity of , to the co-registration of pressure and volume data. See Table 8 and Figure 7, which describe patient B, who required the largest shift. The PV loop illustrates the importance of co-registration, in Figure 4, where the PV loop shape progressively acquires accepted physiological features of iso-volumetric compression and relaxation phases. The corresponding sensitivity of , in Figure 7, is quantified by the parameterisations in Table 8. We defer further comment to Section 5.

Table 8.
Sensitivity of LV double Hill elastance function parameterisation. For a single patient B, fitted double Hill elastance function shape parameters are declared for a range of co-registration shifts. We deem a shift of 5 in the last column to be the correct co-registration for this particular patient. The corresponding elastance function sequence is plotted in Figure 7.
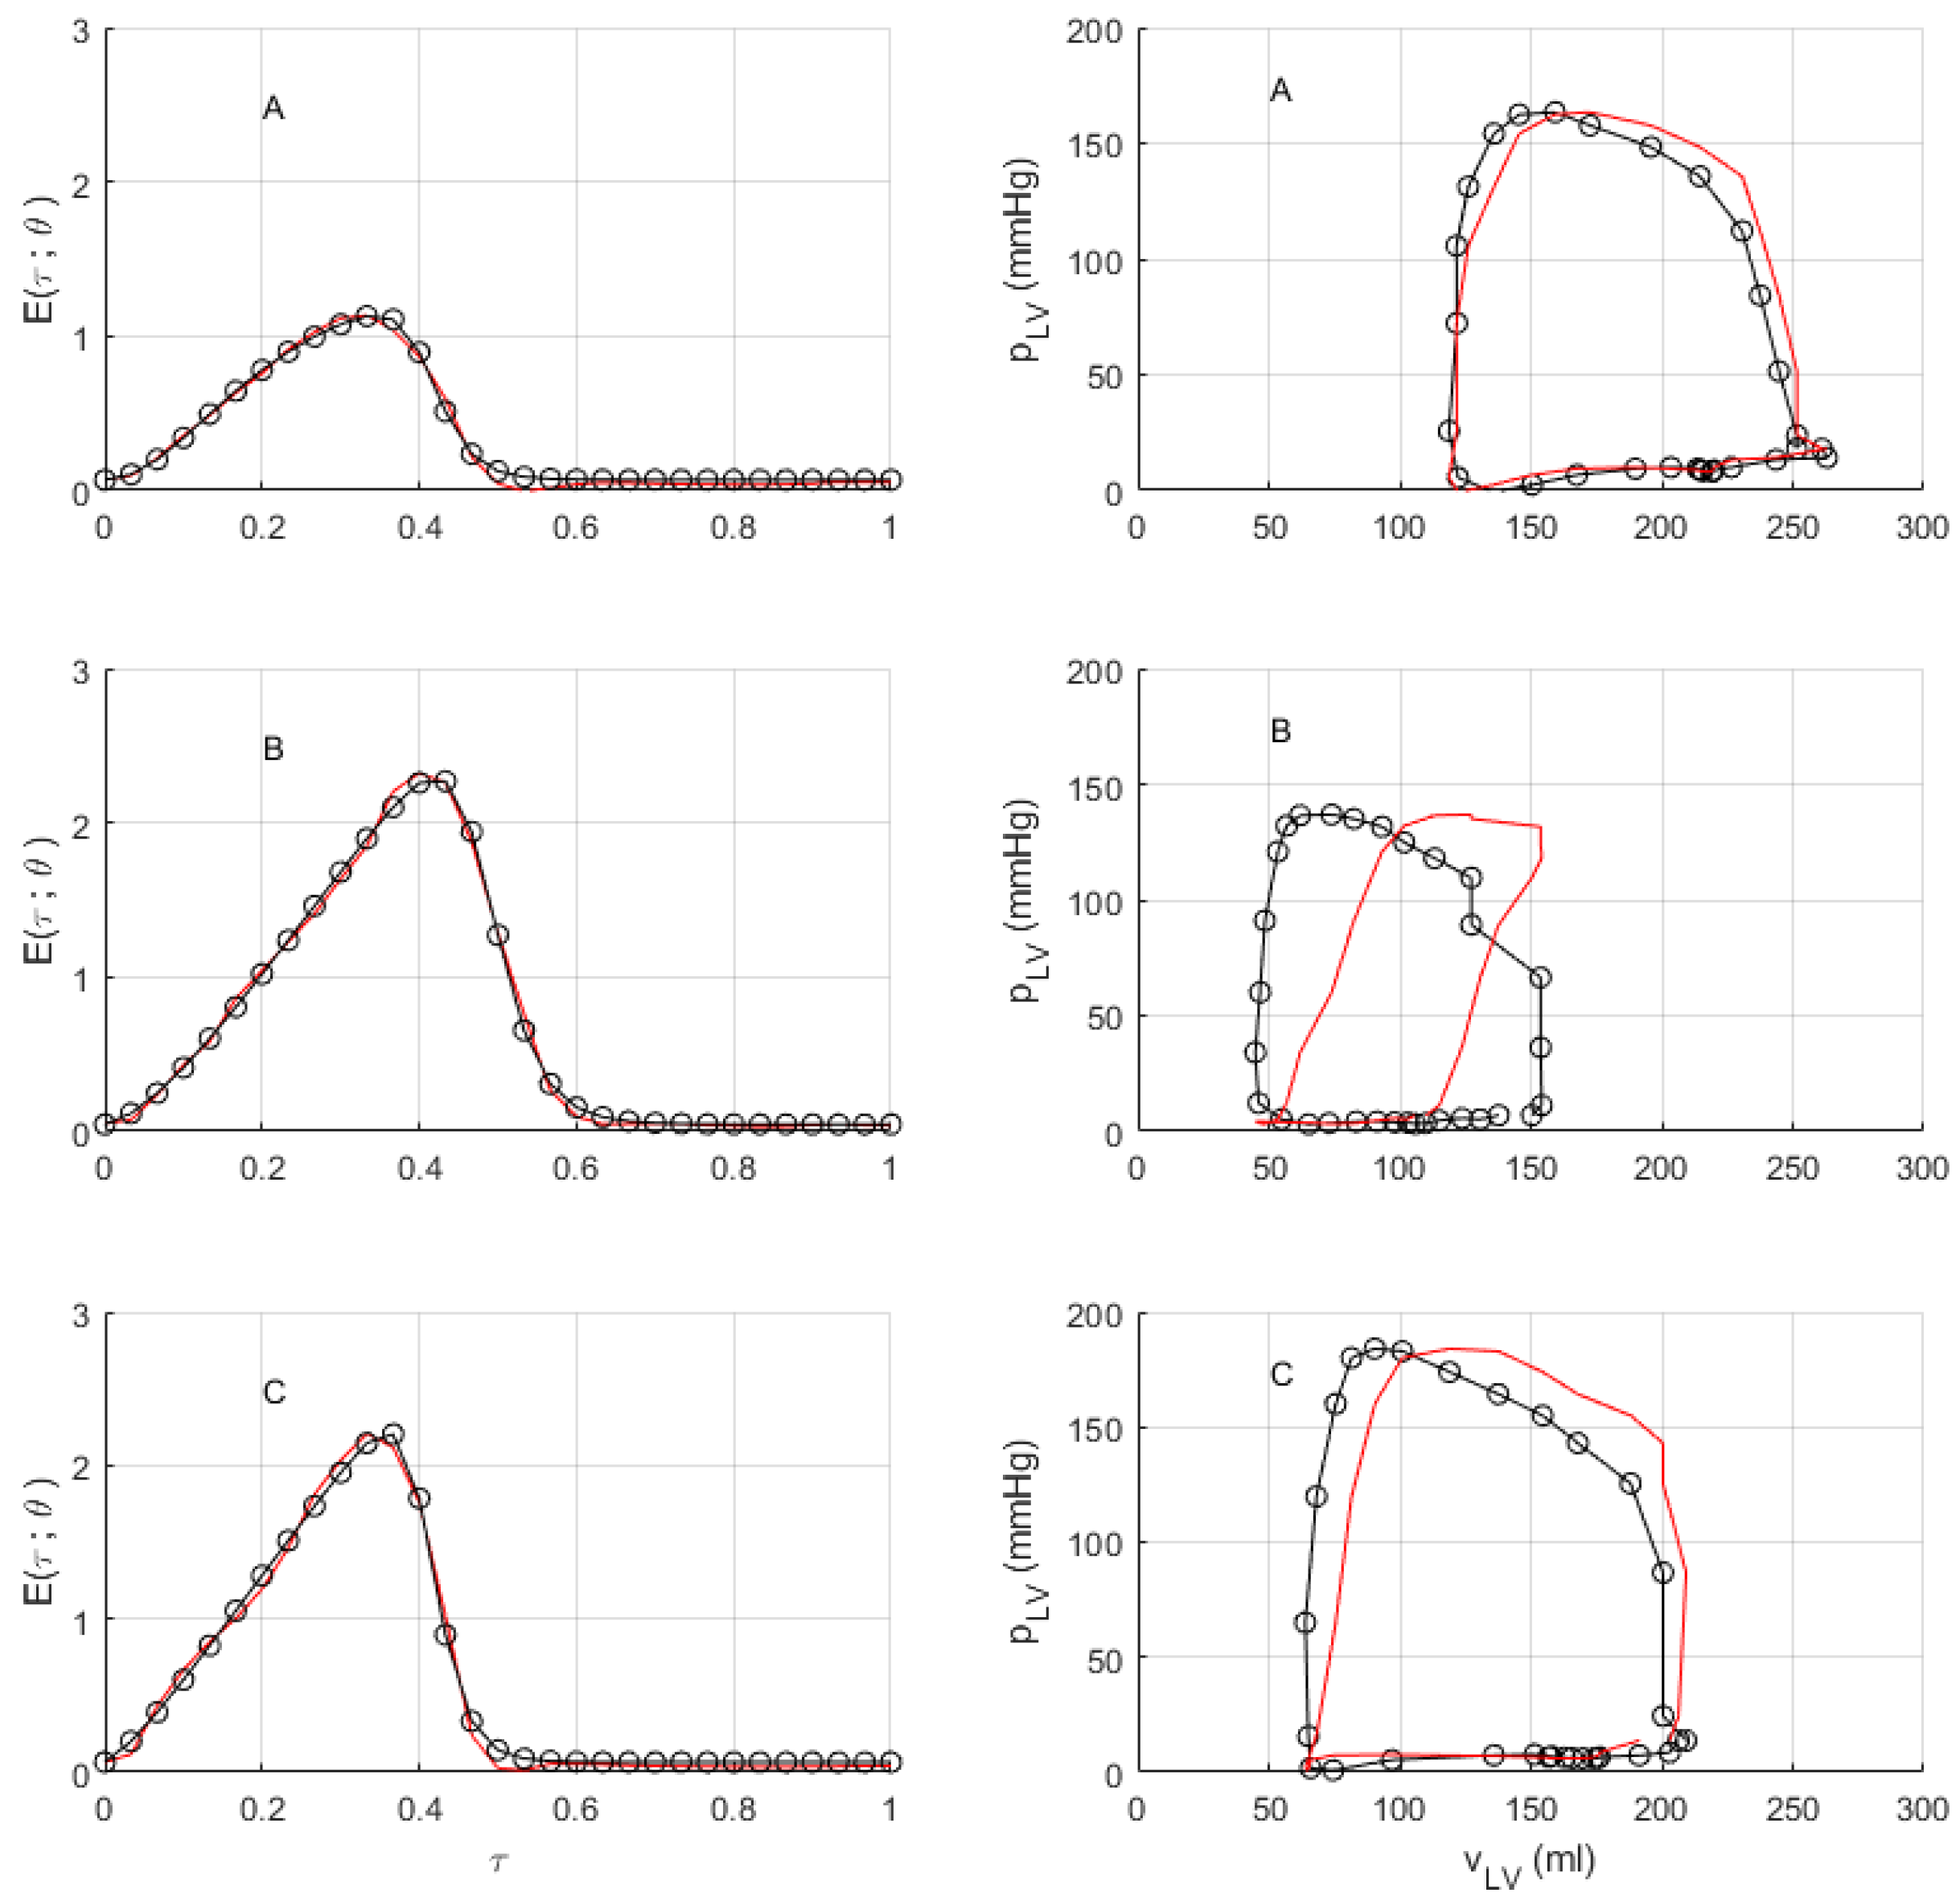
Figure 8 shows the personalised (left) and PV loop (right) for patients A, …, C. The elastance data take correctly co-registered LV pressure and volumes and show the initial (red) and optimised (black) fit. The PV loops in the right-hand column show the importance of co-registration case by case, with the PV loop obtained without co-registration shown in red and that with an appropriate co-registration in black.
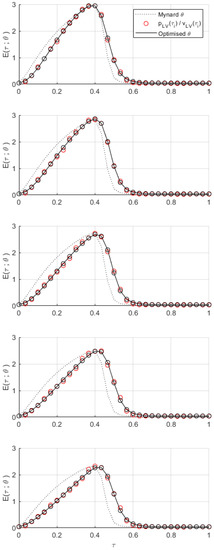
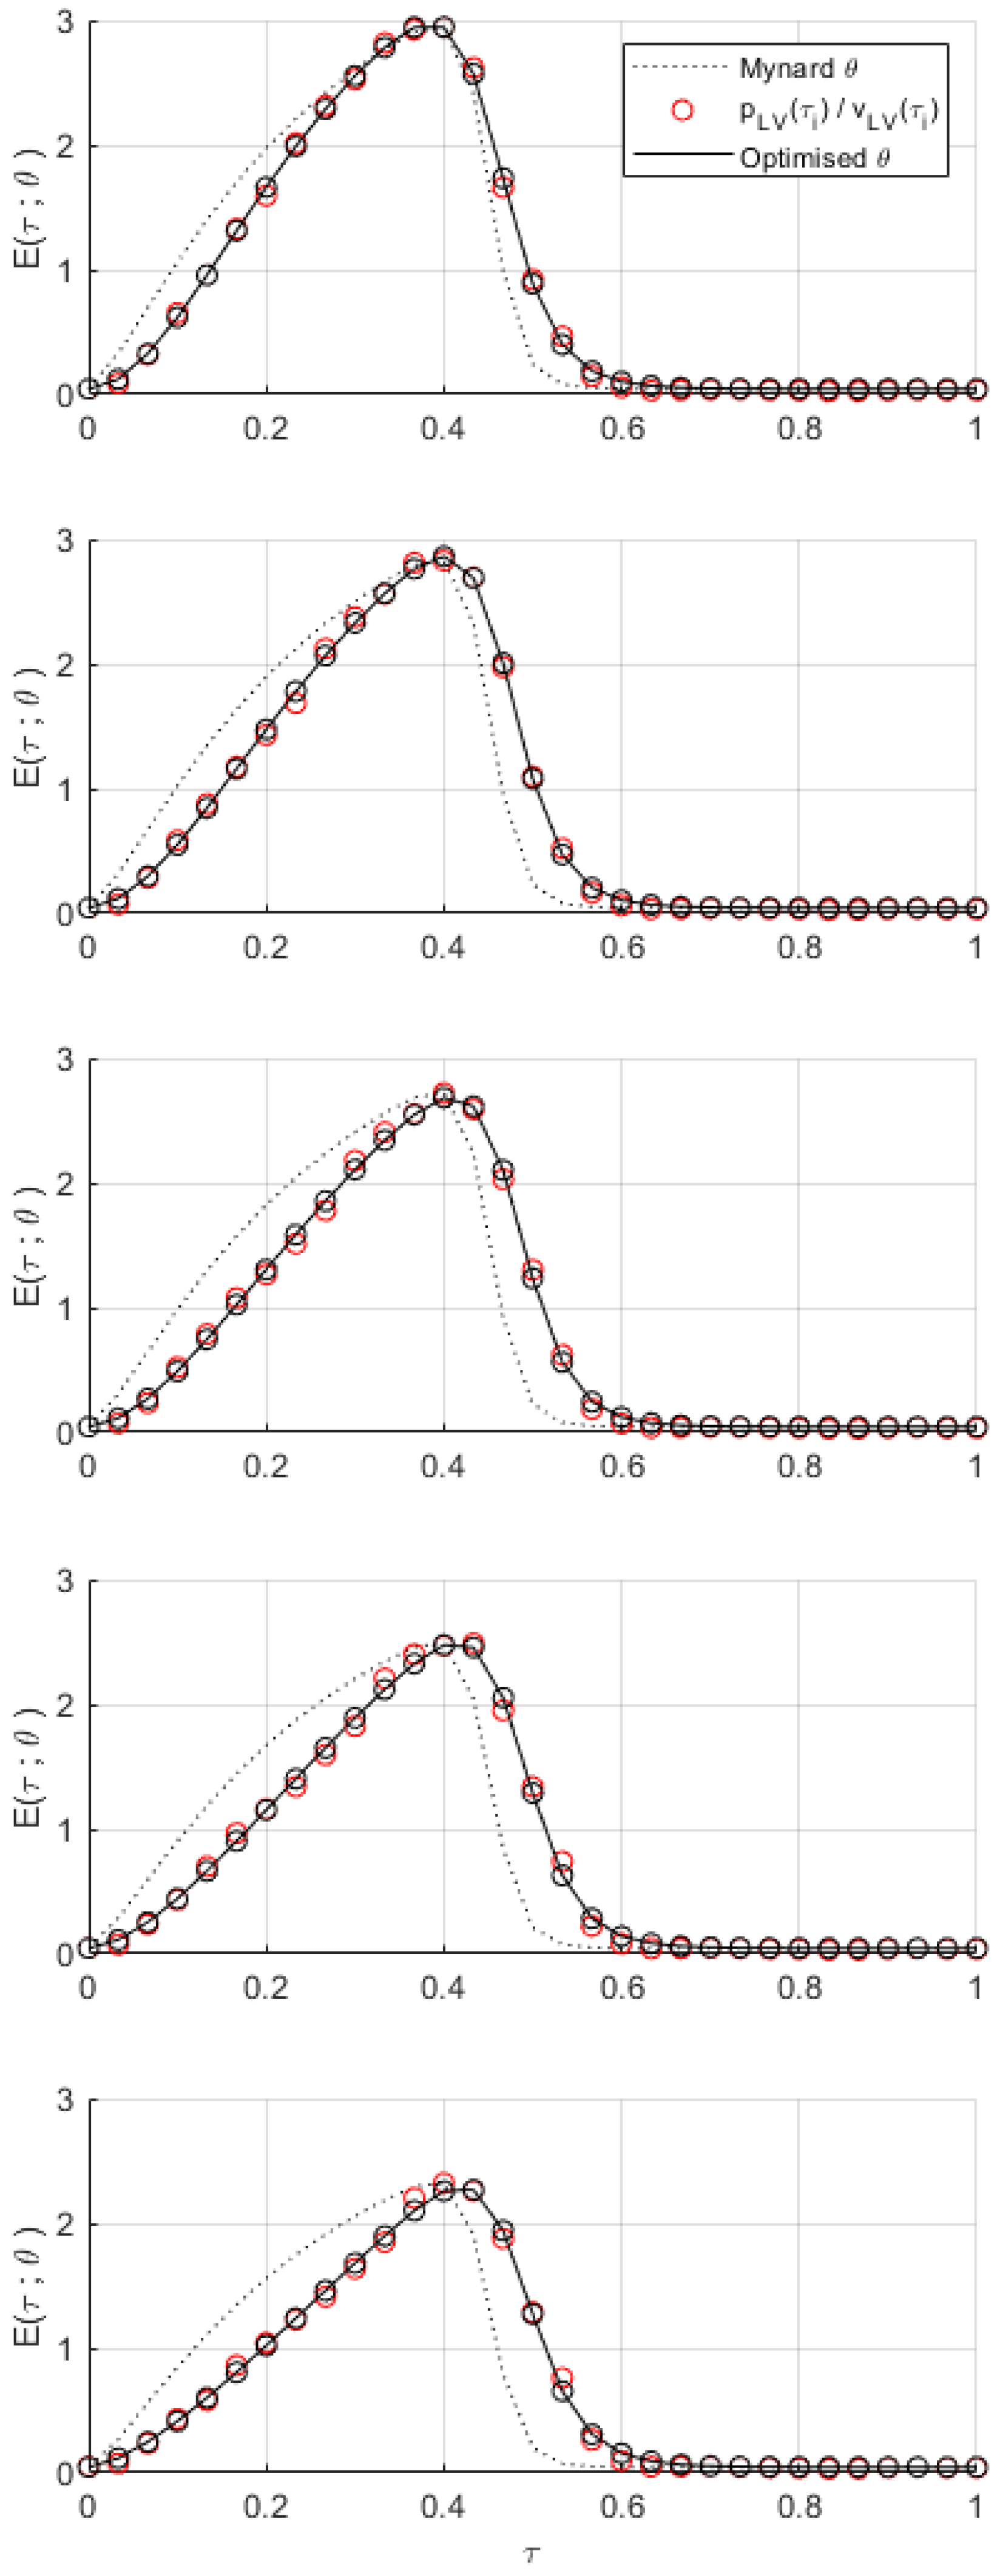


Figure 7.
Sensitivity of a patient elastance function to co-registration shift. Data correspond to the double Hill elastance function parameters in Table 8. The shift increases top to bottom with the bottom panel corresponding to the expected shift of 5 phases, deduced using the co-registration declared in Table 9. The broken line shows our common initialisation using Mynard’s population average [12] parameterisation. Open red circles show the raw data with the appropriate shift applied. The black circles and the line show the optimised fit on the shifted data from a gradient descent simplex method applied to Equation (7).


Table 9.
Patient-specific LV double Hill elastance function parameters. These parameterisations result from fitting the product to the measured, downsampled pressure , using the cost function defined in Equation (7) and a gradient descent method. The applied co-registration rigid shift, or relative delay, applied to the volume data is declared in the first row.
| Patient ID | A | B | C | |
|---|---|---|---|---|
| Co-Registration Rigid Shift | 1 | 5 | 2 | |
| double Hill LV elastance parameter | 0.29 | 0.54 | 0.82 | |
| 0.42 | 0.5 | 0.42 | ||
| 1.58 | 1.56 | 1.26 | ||
| 17.53 | 17.96 | 19.95 | ||
| 1.1 | 2.22 | 2.17 | ||
| 0.05 | 0.03 | 0.03 | ||
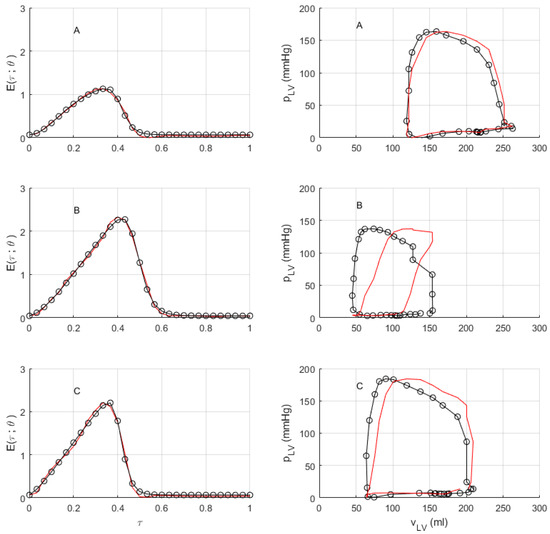
Figure 8.
Patient-specific PV loops and elastance functions, for patients A, …, C. Left column. Patient-specific elastance functions. Red lines correspond to LV pressure and volume time-series data, which are correctly co-registered according to the criteria declared in Table 7 but which is not optimised. Black circles, with black lines to guide the eye, correspond to an optimised, double Hill elastance function parameterisation, obtained by minimising the residual declared in Equation (7), targeting the 30 downsampled LV pressure time samples, using the 30 LV volume time samples. Right column. The corresponding patient-specific PV loops. These data were processed as described in the text, with the personal co-registration shifts identified in Table 8. The red line shows the result which would be obtained without any co-registration. The black circles, with black lines to guide the eye, are the co-registered data.
4.2. Tuning Protocol Evaluation
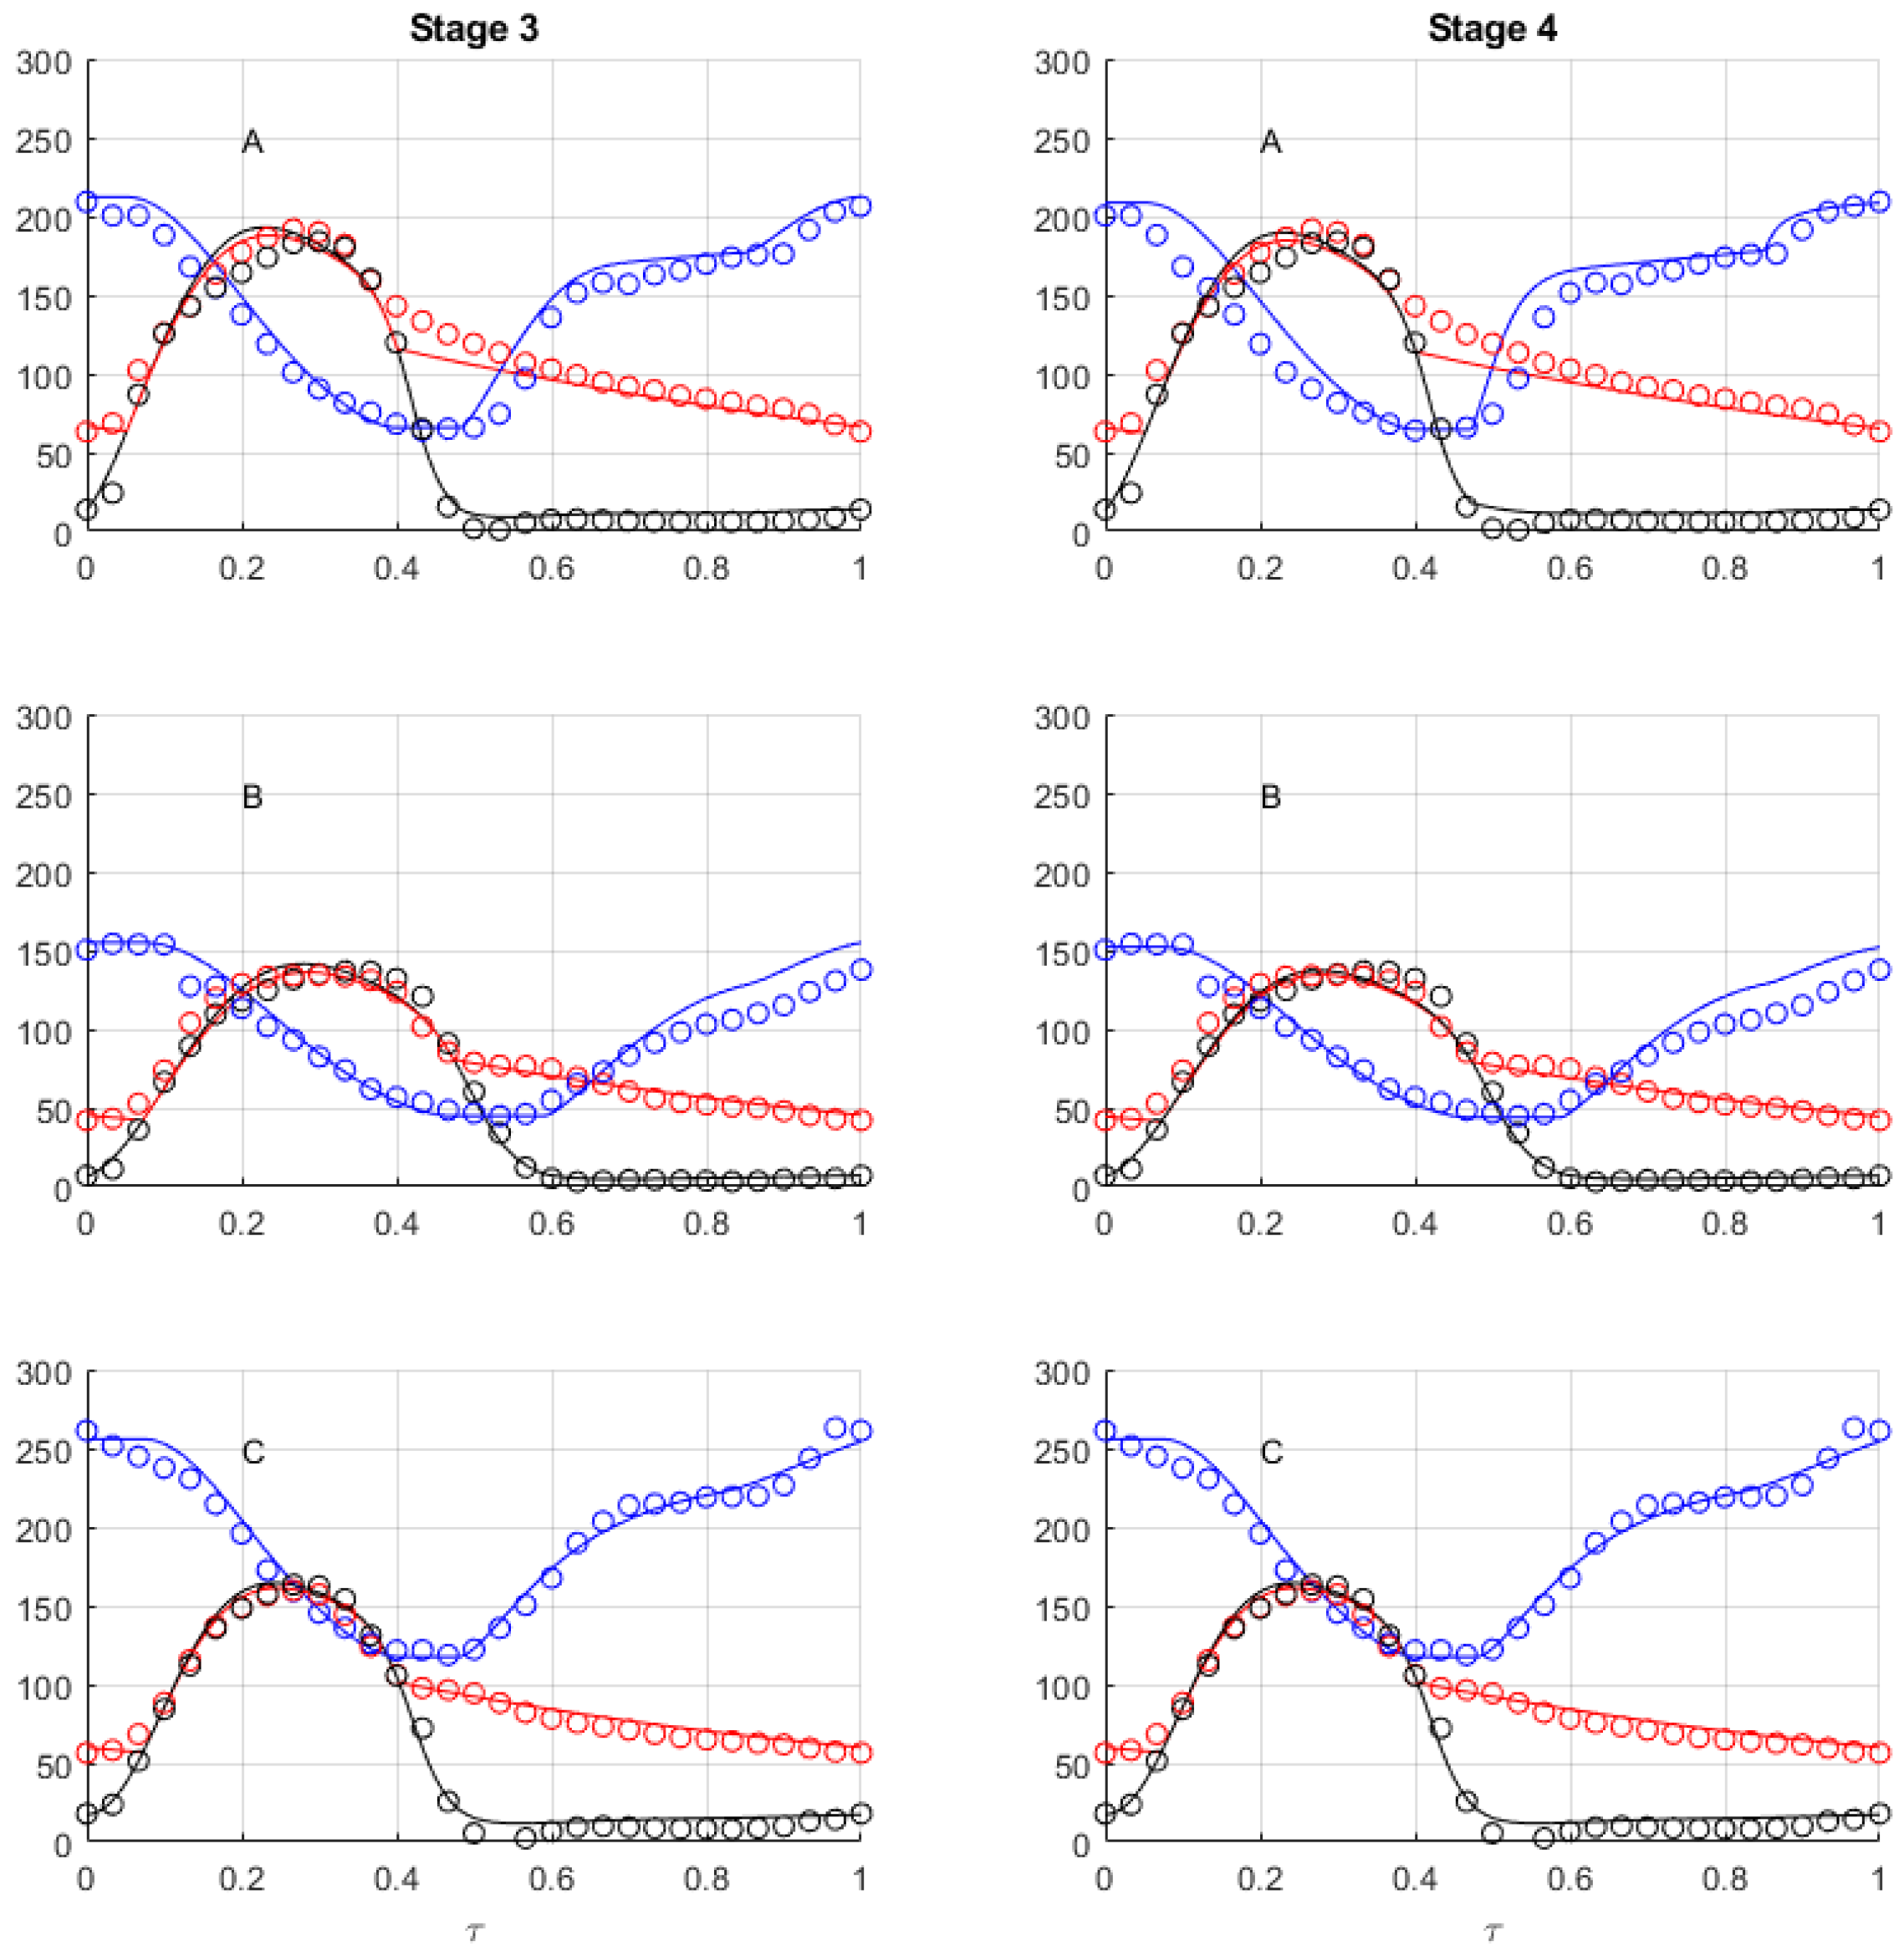
Steps 0, 1, and 2 culminate in a personal which is input into the system 0D model. The latter then provides time-series outputs for LV and aortic pressures and LV volume at the end of step 3; see Figure 9. The cost function used to acquire these data, Equation (1), equally weights its five targets. Step 3 uses a genetic algorithm (GA) to localise the global cost function minimum, by adjusting the systemic windkessel. In general, the LV diastolic phase exhibits the largest discrepancy between model outputs and targets. This suggests parameters, such as mitral valve resistances and left atrial (LA) elastance, as secondary targets for step 4, which uses a less expensive gradient descent search, on the assumption that previous GA tuning will first have located the correct region. The initial values of the input parameters of the mitral valve Bernoulli resistance and are specified in Table 1 and Table 5. Step 4 retains the targets of step 3 but adds the LV volume time-series. That step 4 favours the diastolic phase, particularly for cases A and C, is apparent from Figure 9, which shows outputs at the end of step 3 in the left column and outputs from the end of step 4 in the right column.
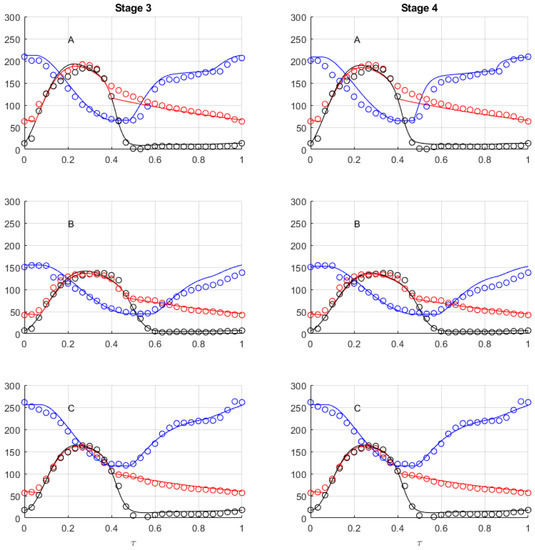
Figure 9.
Systemic parameter tuning for patients A, B, C. Key 0D system model outputs (solid lines) are shown alongside the corresponding ensemble-averaged and downsampled data (open circles). Black line is LV pressure (mmHg), red line is aortic pressure (mmHg), and blue line is LV volume (mL). All data that were acquired after the appropriate personal elastance function assigned in step 2 had been ingested. Left column, step 3. The search used the GA guided by the cost function in Equation (1), with equal weights applied to patients’ discrete LV pressure and volume extrema and the aortic time-series data. These data result from tuning the following subset of the 0D model input parameters of the systemic circulation. Right column, step 4. The search used a gradient descent method based on the cost function, Equation (1), with equal weights applied to patients’ discrete LV pressure, volume extrema, aortic time-series data and now LV volume data. These data result from tuning the following subset of the 0D model input parameters .
Having assigned systemic and left-heart energetic parameters, it remains to tune flow in patients’ coronary circulations. The coronaries sequester a small fraction of cardiac output [18]. It is reasonable to suppose that this does not perturb already identified systemic and left heart parameters. The tuning of coronaries in step 5 relies upon CFD data to assign the MVR and stenotic Bernoulli resistance coefficients. The latter rely on data declared in Table 10 and Table 11 and are derived as described in Section 4.3.

Table 10.
Coronary artery average pressure data. Time average pressure for lesion-proximal, aortic sinus, and lesion-distal locations. Study data are recorded for treated arteries only. Pressures were obtained using a pressure transducer by catheterisation during the PCI process.

Table 11.
CFD-derived data for the patient coronary arteries. Stenotic Bernoulli resistance coefficients and MVRs for patients A,B,C.
4.3. CFD Data Evaluation
Patients’ stenotic Bernoulli resistance coefficients were derived, as discussed above, from VIRTUheart (University of Sheffield, Sheffield, UK). VirtuQ (University of Sheffield, Sheffield, UK) was used to compute the corresponding MVRs. Both tools assume steady flow. Furthermore, VIRTUheart approximates pressure distal to the MVR as zero. The first assumption is raised within our transient 0D system model. Moreover, the 0D system model, with its four hear chambers, develops an unconstrained pressure distal to the MVR. The stenotic Bernoulli resistance coefficients ingested into the system 0D model (Table 10) are deemed to be unaffected by these differences. However, the MVR yielded by our CFD tool requires the correction in Equation (8)
Table 10 and Table 11 declare the patient-specific CFD data inputted into the system 0D model. There, we encounter that sparsity and incompleteness which are typical of clinical data- none of our selected patients have three vessel disease and others have total coronary occlusion (TCO). The latte precludes all treatment but which can still be mapped to the coronary artery module in Figure 1 however, by setting large stenotic resistance coefficients. The latter are used to determine the pressure drop, , across a lesion from the flow, using Equation (9)
Above, * identifies the particular vessel.
5. Discussion
We have characterised the pre-PCI patient state, but equivalent data exist for post-PCI patient states; thus, the approach described here may be used to examine post-intervention physiology. Our methodology brings within scope for the first time, a means to relate qualitative changes in physiology to changes in, e.g., exercise tolerance. The importance of a careful co-registration of our LV pressure and volume time-series data is underscored by the data in Figure 7 and the corresponding double Hill parameterisations, declared in Table 8. These data show LV contractility () and systolic activation function parameters , to be the most sensitive elastance parameters to co-registration shift. These parameters respectively quantify LV contractility and the vigour of systolic onset and are very important indicators of cardiac health.
Step 2 of our protocol is seen to be robust and necessary. It represents a successful means of dealing with nonsimultaneous pressure and volume time-series data. From the data of Figure 8, it is apparent that a range of elastance functions and PV loops are successfully addressed. The change in the elastance function as correct co-registration is progressively applied demonstrates a significant degree of sensitivity in the elastance function. This underscores the importance of step 2 in our protocol. From Figure 8, it is also apparent that the PV loop of some cases is rather more sensitive than others to our rigid shift co-registration of pressure and volume time-series data.
6. Conclusions
We have verified the ability of appropriate protocols, PCI-acquired data and a suitable 0D system model, robustly interacting with 3D CFD models to recover a quantitative in silico representation of three individual patients’ physiological and pre-PCI cardiovascular state. This depiction relies on parsing diverse clinical data, compiled during the elective PCI clinical pathway. Specifically, our hierarchical, multi-stage protocol is shown to identify prioritised input model parameters of cardiac energetics and coronary perfusion, within a 0D (compartmental) four-chamber system model with data-adapted coronary artery topology. Using this, we reached verifiable in silico representations of significant LV aortic and coronary artery volume, flow and pressure time-series. This process of input parameter identification is known in the clinical context as model personalisation. It is a key determinant of clinical utility, which urges a parsimonious model or (as here) the prioritisation of a subset of model input parameters, chosen with the supporting sensitivity and orthogonality analysis, provided in the appendices. The present study requires accurate representation of coronary flow states which are dominated by diastolic dynamics. The coupling of the coronary arteries’ compliances (capacitances) to the appropriate chamber pressure (see Figure 1) apparently recovers diastolic dominance in coronary flow.
Time-series data play a defining role. To utilise them optimally, it was necessary to reconcile data collected at different stages of the clinical pathway with patients at different points in their physiological envelopes. This is deemed to be our largest source of error. The time-series data in question are non-invasive left ventricular volume, derived from CMR, and invasive LV and aortic pressures measured during PCI. Our approach involves downsampling pressure to accord with MRI phases and devising a suitable rigid phase shift, based upon LV valve timings, to overcome an identified co-registration error; results were assessed by the qualitative credibility of a physiological properties inferred from the LV PV loop. The commensurate LV elastance function is an input into the system 0D model personalisation process. It is shown to be sensitive to the co-registration of time-series data. Possibly, the most consequential, purely clinical outcome of this work is that we have been able to obtain credible results for patient PV loops and left-ventricular elastance functions by using a straightforward co-registration of non-simultaneous invasive pressure and non-invasive volume data when guided by rudimentary and therefore robust physiological principles.
Despite sources of error, it is apparent that there remains sufficient depth in the clinical pathway dataset to build appropriate digital twins, and we present as evidence data for three patients in the pre-PCI state. A route to the complementary, post-intervention description of the patient now lies open. One simply needs to apply the current workflow to extant data which are of equivalent form to that considered here. Therefore, using our methodology, one can expect to develop both pre- and post-PCI representation of patients from which to measure physiological changes attending PCI. Section 3.2.2 outlines a range of relevant activity measures which might be used meaningfully to contextualise this change in global ischaemic burden. Put another way, the act of correlating these model-derived statistics of the study data has the potential to reveal relationships between coronary physiology, cardiac energetics and physical activity, as well as providing clinical decision support. The model represents a means not only to establish a connection between global coronary perfusion and cardiac energetics, but to quantify it.
Author Contributions
A.A.B. and G.W., P.G. collected, curated and prepared all data. D.R.H., D.R. and F.v.d.V. devised the original model elements. K.C., A.L., I.H., A.J.N., M.M., F.v.d.V. and D.R.H. devised, implemented and adapted the model elements and designed the data-handling protocols. Clinicians P.D.M., R.C.G., P.G. and J.P.G. performed the PCI interventions from which all data are harvested. J.P.G. designed and led the study. All authors have read and agreed to the published version of the manuscript.
Funding
This publication is supported by the European Union’s Horizon 2020 research and innovation programme under grant agreement Sano No. 857533 and by the Sano project carried out within the International Research Agendas Programme of the Foundation for Polish Science, co-financed by the European Union under the European Regional Development Fund.
Institutional Review Board Statement
The study was conducted in accordance with the Declaration of Helsinki, and approved by the UK’s NHS Health Research Authority, sponsored by Sheffield Teaching Hospitals NHS Foundation Trust, (IRAS project ID 272069, REC reference 20/NS/0063, approved 23 March 2020).
Informed Consent Statement
Informed consent was obtained from all subjects involved in the study. Written informed consent has been obtained from the patients to publish this paper.
Data Availability Statement
Study data are not publicly available due to ethical restrictions, which apply to personal patient data. The data presented in this study are available on request from the corresponding author, Ian Halliday.
Conflicts of Interest
There are no conflict of interest.
Appendix A. System Model
Appendix A.1. System Model Dynamical Equations
It is possible to formulate the 0D model in terms of ordinary differential equations or differential algebraic equations [23]. Compartments are specified by their time-dependant dynamic pressure p (mmHg), inlet flow q (mL/s) and volume v (mL). The equations relating to the passive compartmental state variables all take the form
Above, the subscripts respectively represent the proximal, present and distal system compartments, (mL) denotes the circulating (stressed) volume and (mL/mmHg) and (mmHgs/mL) denote compartmental compliance and the Ohmic, or Bernoulli, resistance between compartments i, . We turn to the active system compartments, described by so-called activation functions, and valve characteristics.
Appendix A.2. Sub-Models—Chamber Elastances and Valve Characteristic Functions
The double Hill elastance used here [12,14] is that in most widespread use within the clinical and physiological communities. The same essential model is used to express the biomechanics of all four heart chambers. Shi proposed an alternative model, with more compact support, which is arguably more intuitive [34], having similar properties. Neither takes into account stress stiffening in systole. Arts et al. [35] and Bovendeerd et al. [36] developed a model based on a more formal approach which accounts for stress-stiffening of the chamber. The double Hill function for it is expressed in terms of an activation or shape function, which is a product of monotonically increasing and decreasing expressions, as follows:
A model elastance is then assigned
Above, denotes the set elastance parameters . and specify chamber contractility and compliance, respectively. Parameter (the relaxation rate constant) is commonly set to large values to produce a sharp cut-off in at the systolic to diastolic boundary. The double Hill parameter, , (the diastolic time constant) is the principal determinant of the systolic to diastolic ratio. Amplitude and shape parameters differ between all four chambers. Moreover, atrial elastance functions have adjustable phase, relative to ventricular elastances.
Valve characteristic functions express the relationship between flow through a valve, , and pressure difference, , between separated compartments. Valves used in this work are diodes, having quadratic (Bernoulli) flow-pressure characteristics under forward bias with no leakage flow under reverse bias
Above, the free subscript * denotes one of our four valve flows.
Appendix B. Sensitivity and Orthogonality Analysis
Personalisation is a parameter identifiability analysis [5] applied to a chosen subset of input parameters which are often hypothesised to serve as clinical biomarkers and to a set of output metrics which correspond to available clinical data. The foundations of input parameter identifiability are sensitivity and input parameter orthogonality analysis. Using such, one can turn to formal methods (see, e.g., Li et al. [37]) which help to determine subsets of model input parameters which are optimal for personalisation [38]. Relative sensitivity and input parameter orthogonality analyses, derived from the operation of our system 0D model, are presented here in two forms. First, we consider an full analysis, based on the whole set of our system model’s input parameters with an impractically large range of discrete outputs. Then we present the same analyses, with the list of input parameters restricted, to reflect those which we use in our patient personalisation process. For this subset, we also restrict the range of discrete model outputs to be representative of our study’s patient data.
The relative sensitivity of the mth discrete output, , on the nth discrete input, , is measured by a numerical approximation to the normalised partial derivative
Above, the model base state, , corresponds to our normal patient, where N (M) is the number of model inputs (outputs) and is a sensitivity matrix element. Noting the system input index, n, which identifies rows of , we define a relative sensitivity row vector, characteristic of the nth input
From such sensitivity vectors, it is possible to measure the linear independence of the action across all outputs, of two chosen input parameters using a simple, intuitive orthogonality measure, which is a straightforward generalisation of the scalar product of two vectors
Above, for two input parameters having identical action on all outputs, we find . Put another way, if , then incrementing and will move all the system outputs in the same direction. Under such circumstances, while and might each have considerable influence, they do not act upon them differentially. Optimal choices of input parameters for personalisation should clearly be chosen on the basis of influence and orthogonality. Clearly, , and it is convenient to survey the orthogonality of the model input parameters by presenting the square, symmetric matrix , as a heatmap.
Figure A1 shows the full sensitivity matrix, based upon all inputs and a large range of discrete outputs. Of course, no practical study, however extensive, will have access to the range of outputs shown here. For the sake of completeness, however, we also present the corresponding input parameter orthogonality matrix and the statistics of that dataset in Figure A2 and Figure A3, respectively. These figures are to be interpreted using Table A1.
Of much greater practical significance, certainly for the present study, is the partial sensitivity matrix, now based upon that subset of model inputs which are considered in this study alongside a set of outputs which are representative of the data we access. These data are presented in Figure A4, Figure A5 and Figure A6. They suggest that the systemic circulation parameters influence coronary flow. This, of course, is consistent with our assumptions: the recognised principal determinant of LV afterload is the systemic arterial windkessel parameterisation and a reduction in (say) systemic vascular resistance will increase flow to the system, and thereby, the fixed fraction which is sequestered to the coronaries increases. Conversely, changes in the parameterisation of the coronaries have little effect on the systemic metrics. The block diagonal structure in Figure A6 reinforces the conclusion that there is only weak coupling between the coronaries and the systemic and cardiac parameters of our model.
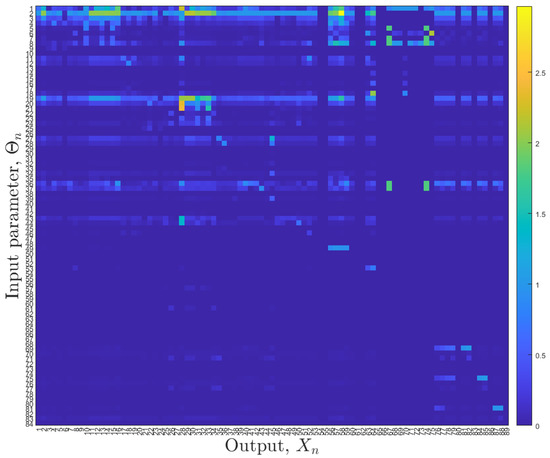
Figure A1.
Full relative sensitivity matrix of the model, at base state. The sensitivity matrix is represented here as a heatmap. These data represent the fullest assessment of the studied four-chamber model and are presented for the sake of completeness. Input parameters and outputs are identified by their numerical subscripts, identified in Table A1. Many of the sensitivities are of restricted utility as they are based upon unobservable outputs. A restricted sensitivity analysis is presented in Figure A4 where the range of model inputs and outputs is restricted, in line with data available in the present study. Here, and in a majority of complex models, the heatmap is dominated by a few large sensitivities.
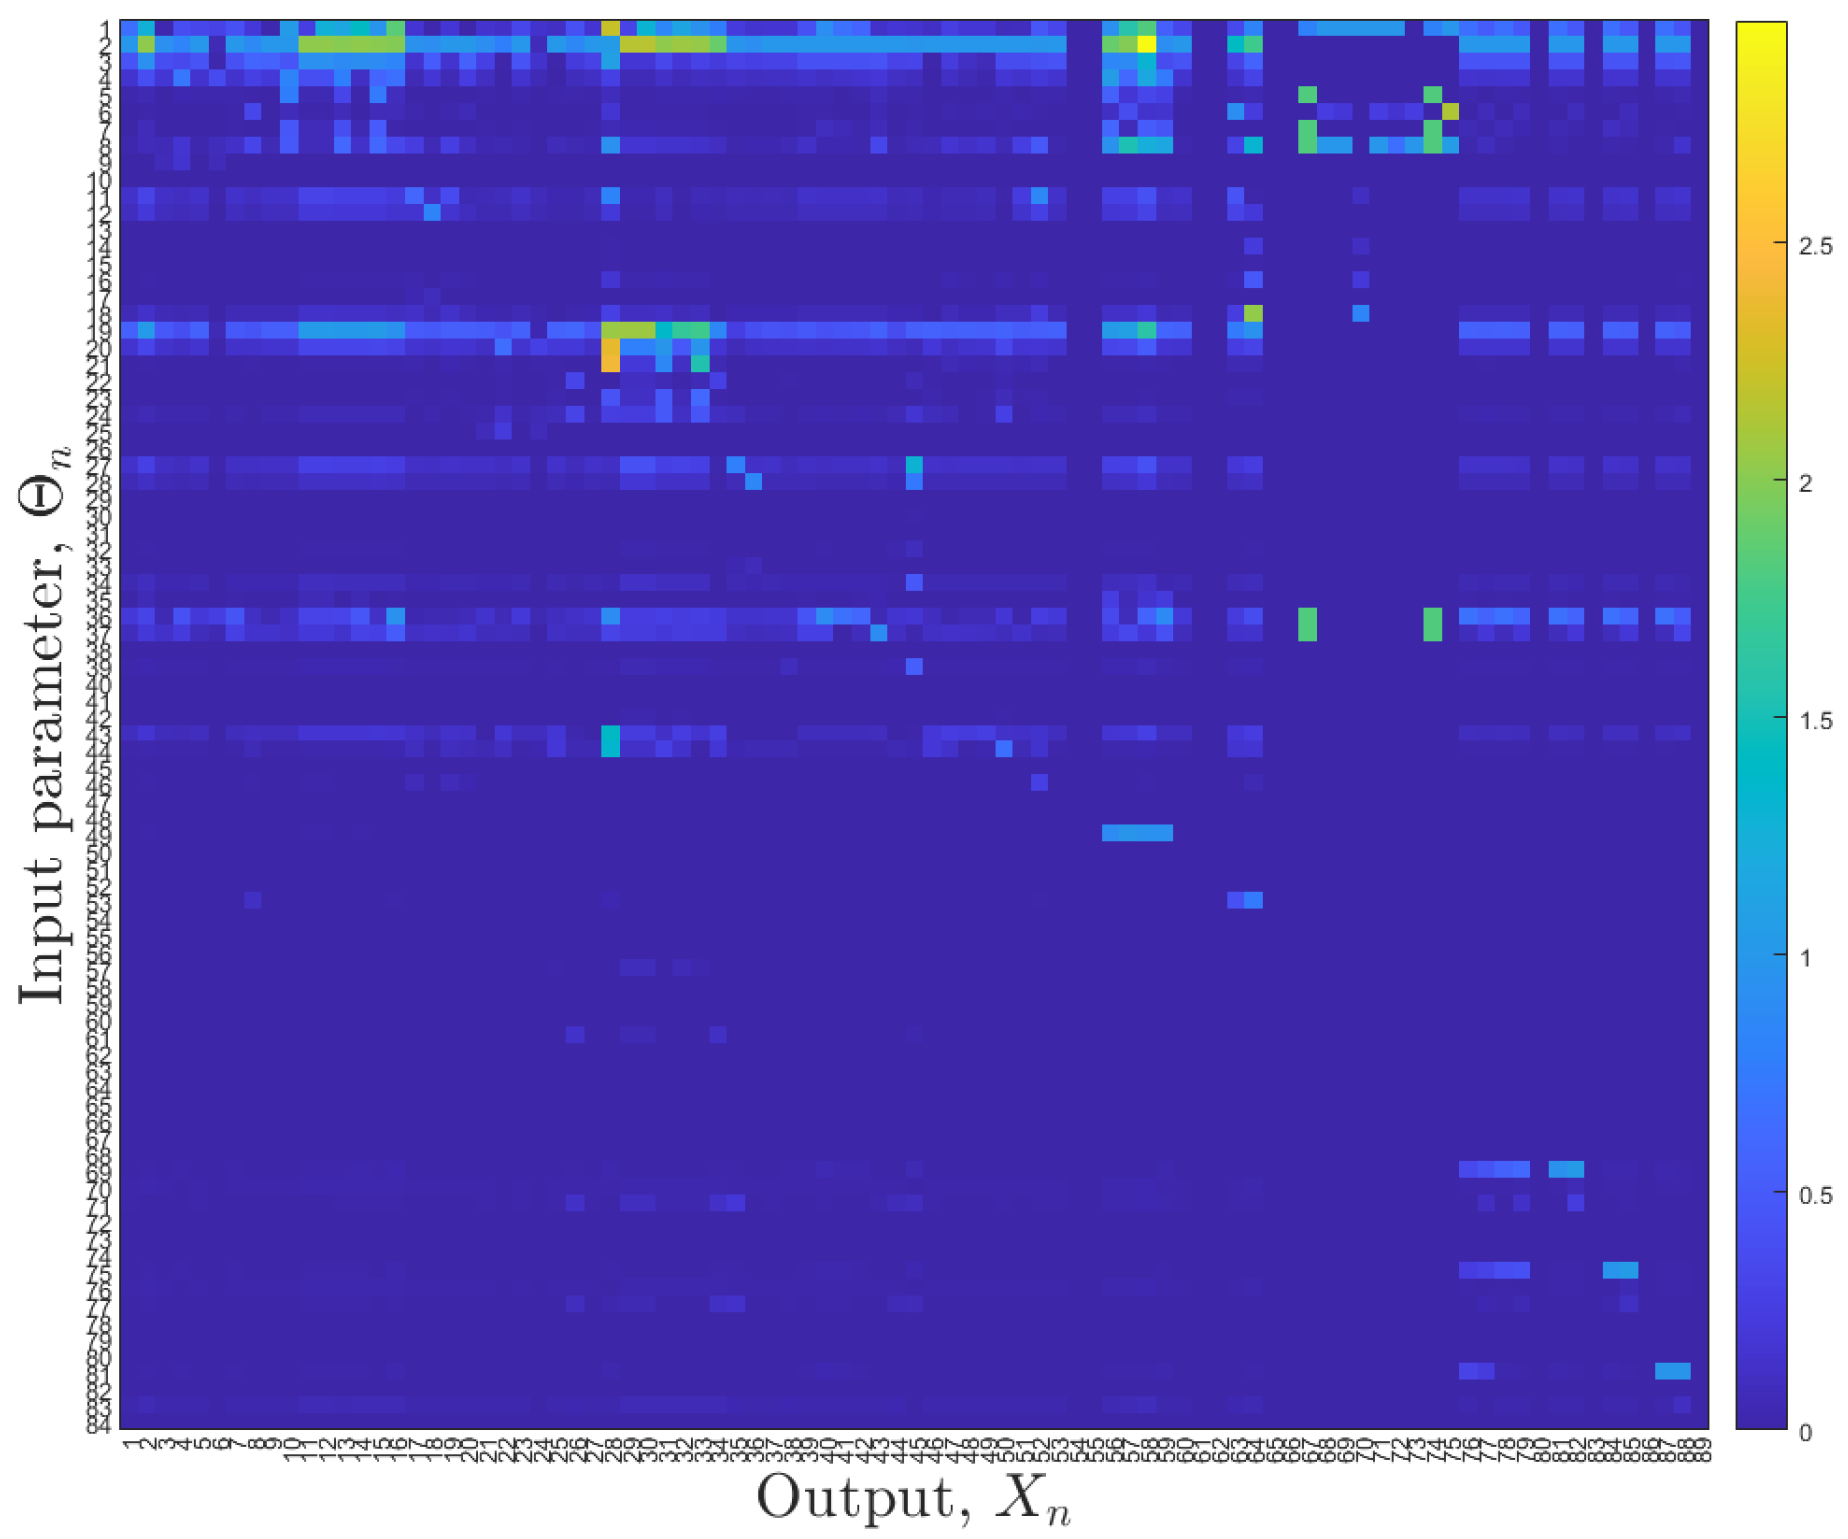
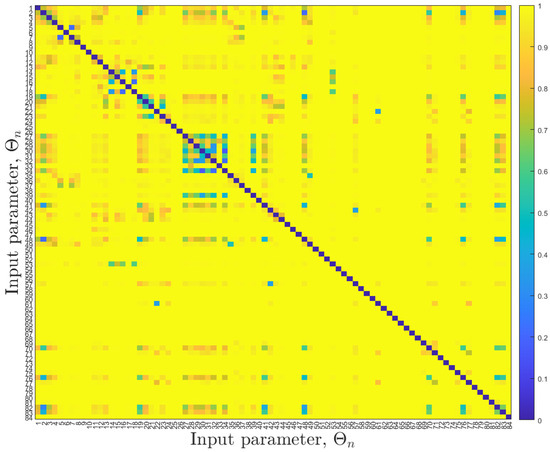
Figure A2.
Full input parameter orthogonality analysis of the model sensitivity vectors. This heatmap is a representation of the matrix (Equation (A4)). Input parameters are identified by their numerical subscripts identified in Table A1. Data are based upon sensitivity vectors, derived from the full model sensitivity matrix, in Figure A1. A more meaningful input parameter orthogonality analysis is presented in Figure A4, where the range of model inputs and outputs is restricted, in line with the data available in the present study.
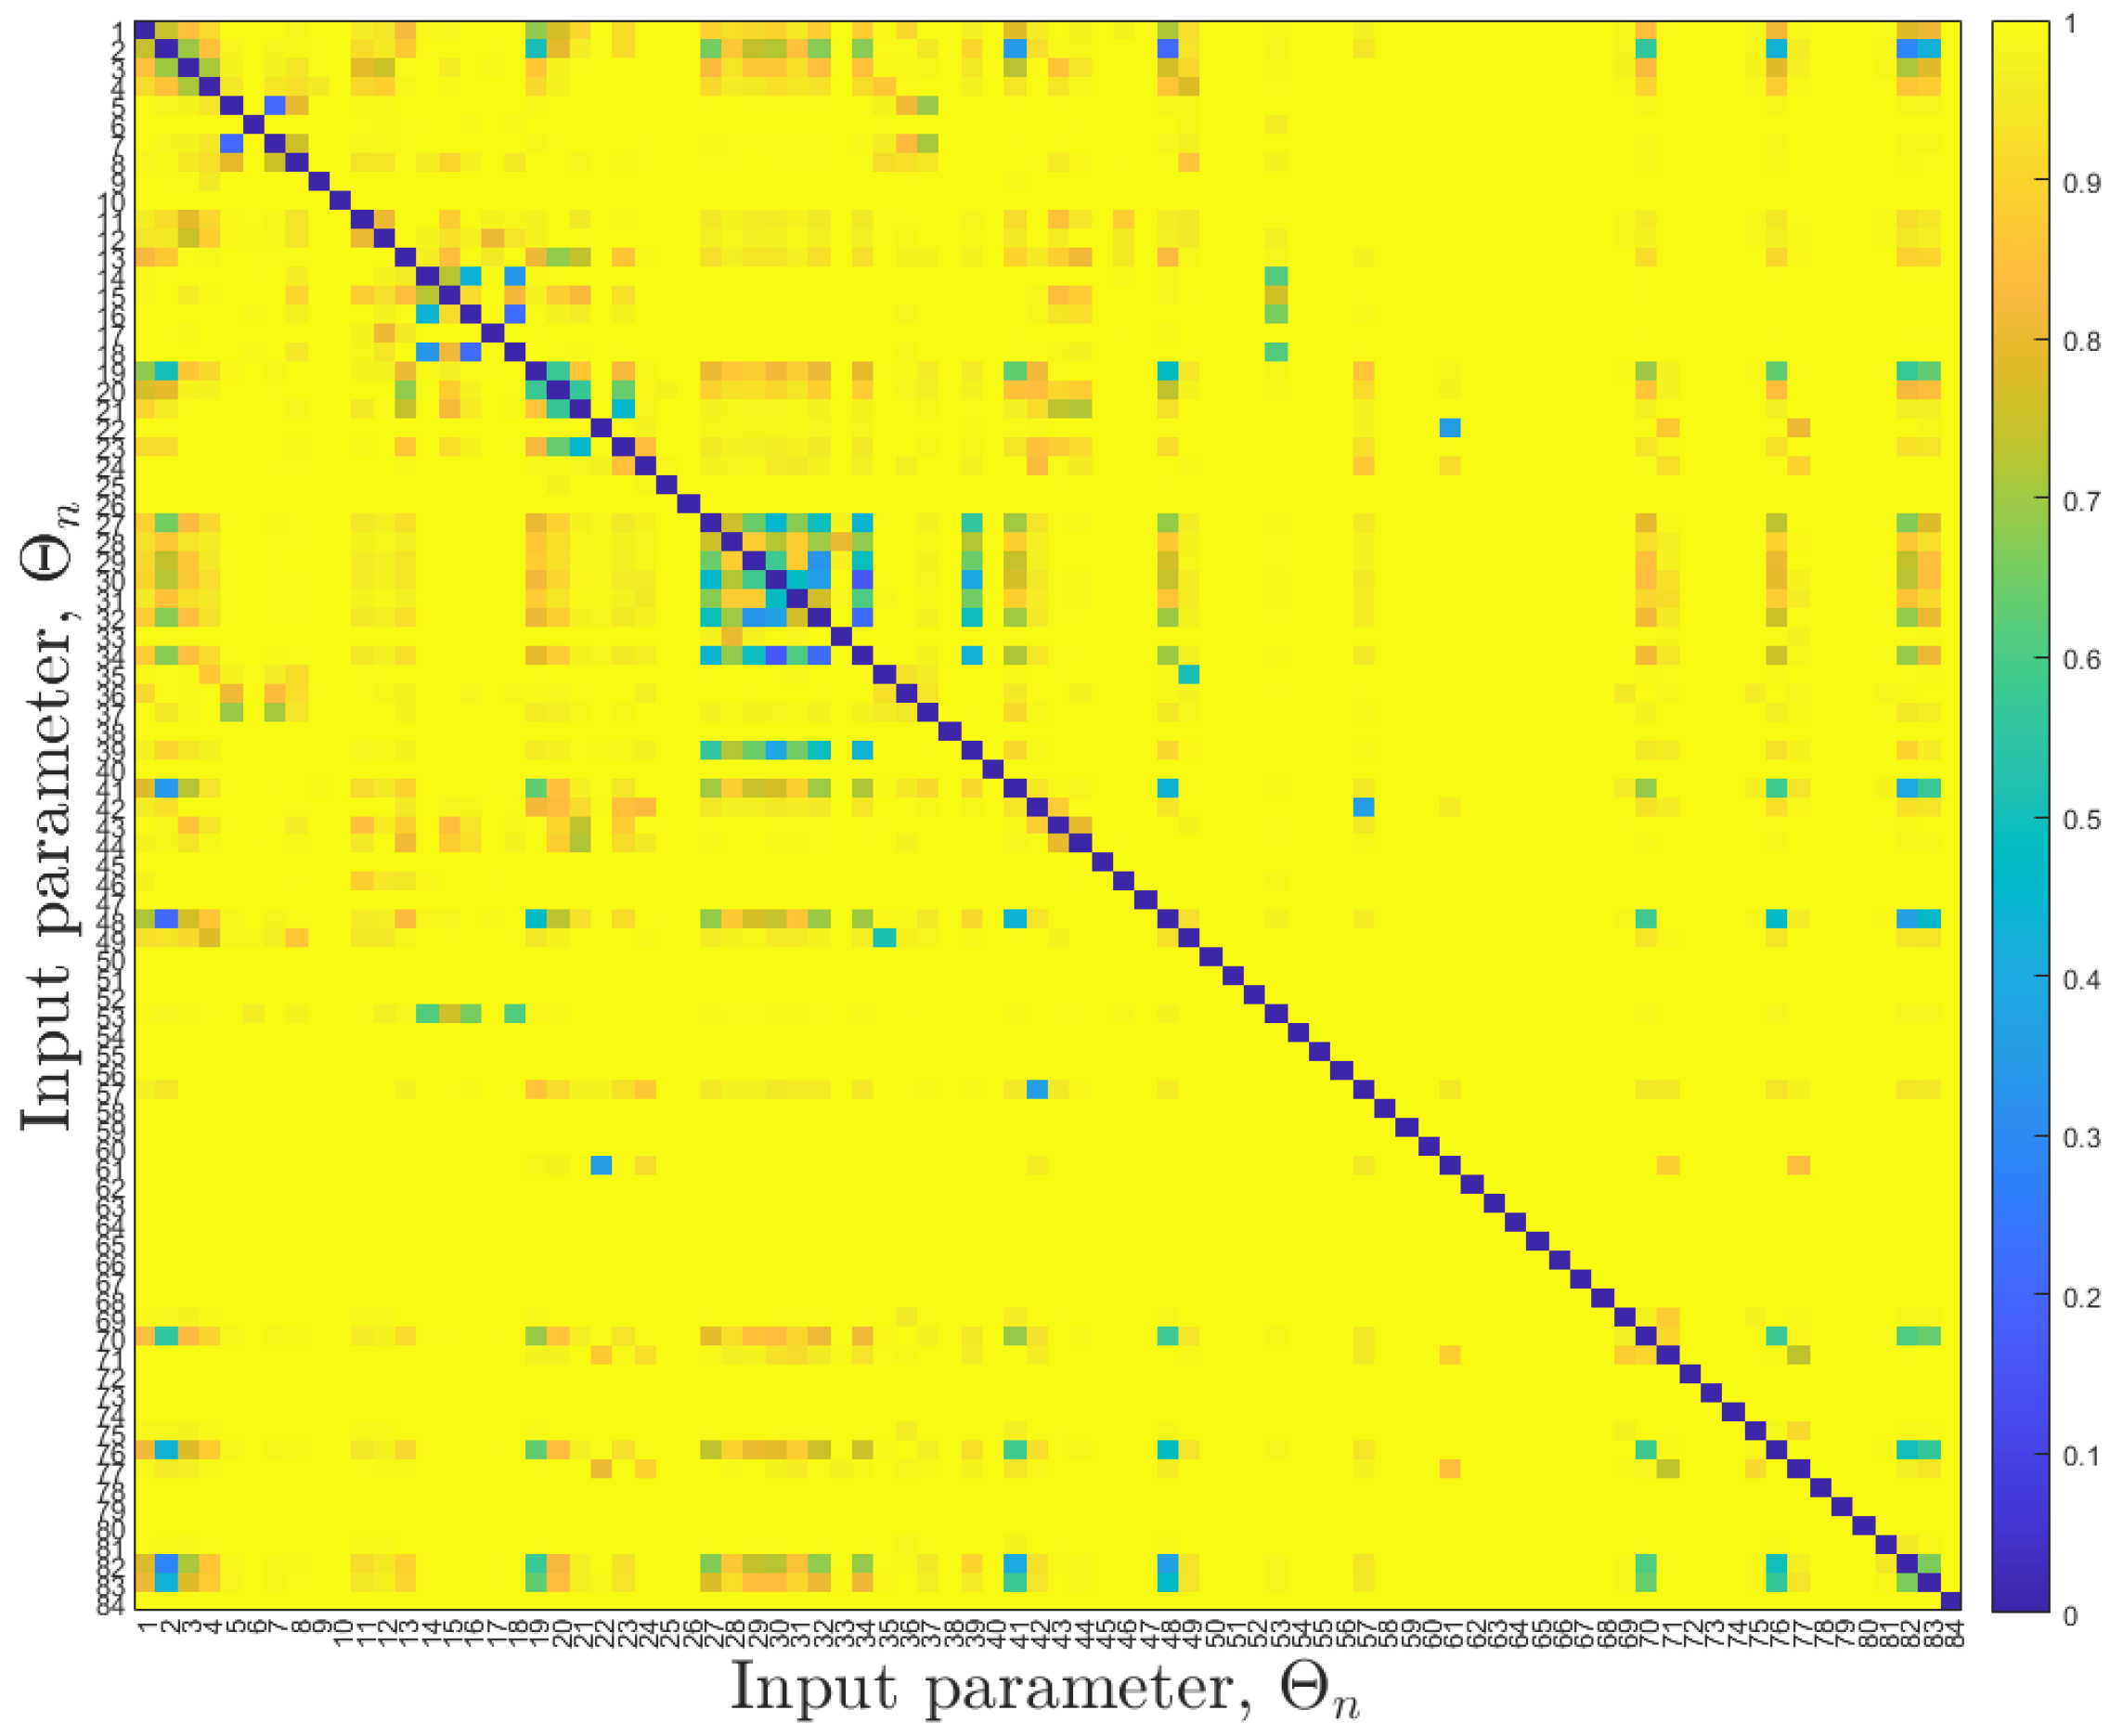
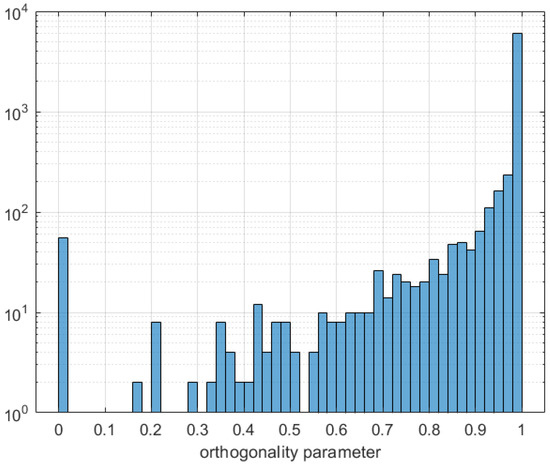
Figure A3.
Statistics of the full input parameter orthogonality analysis. The statistical distribution of the matrix elements are shown in heatmap form in Figure A2. The distribution of these data tends to suggest that with a comprehensive set of outputs, a majority of model input parameters are identifiable.
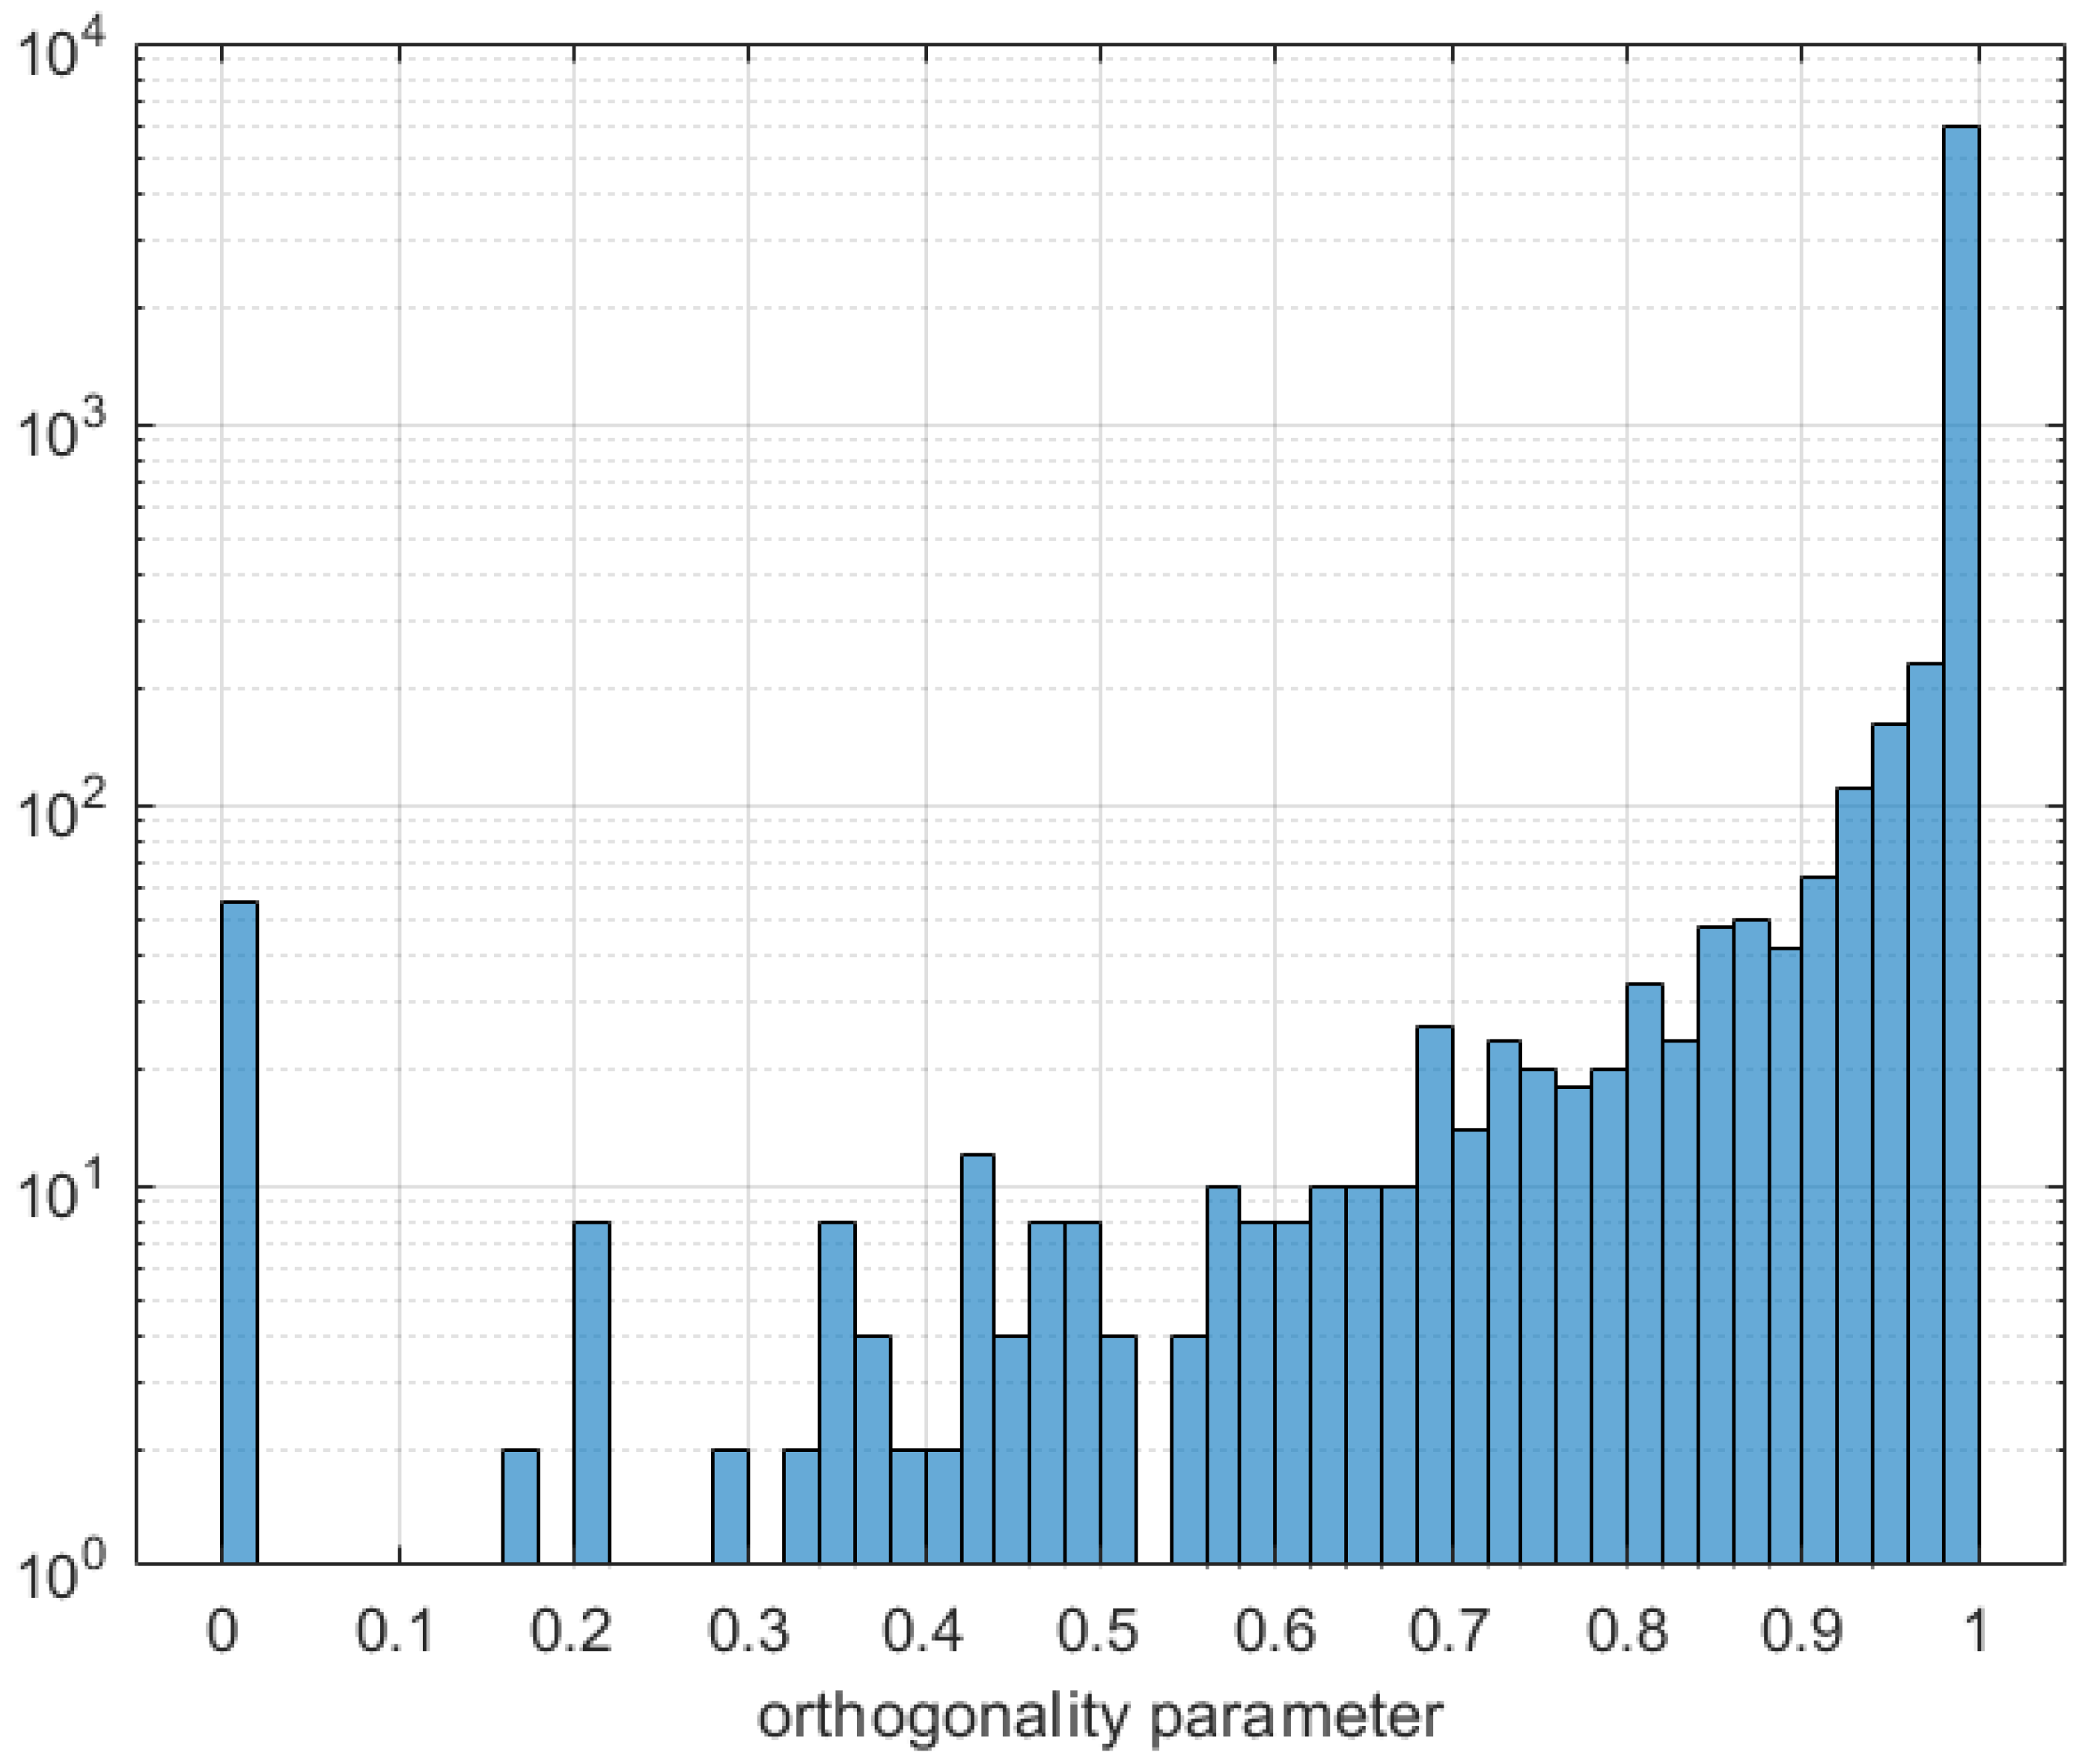
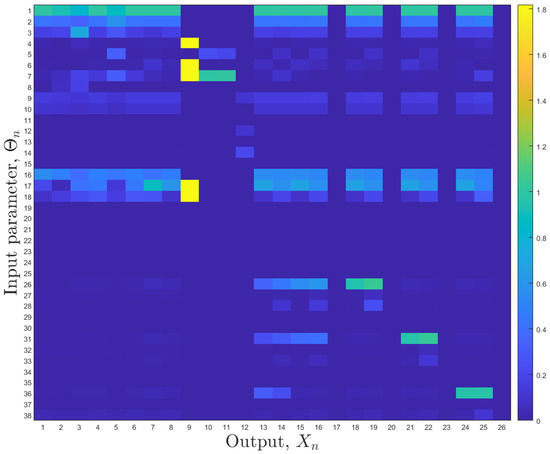
Figure A4.
Restricted relative sensitivity matrix of the model, at base state. Relative to the data in Figure A1, here we show the sensitivity matrix based upon model input parameters which are emphasised within this study, combined with outputs which are acquired within the patient clinical pathway. Input parameters and outputs are identified by the numerical subscripts identified in Table A1.
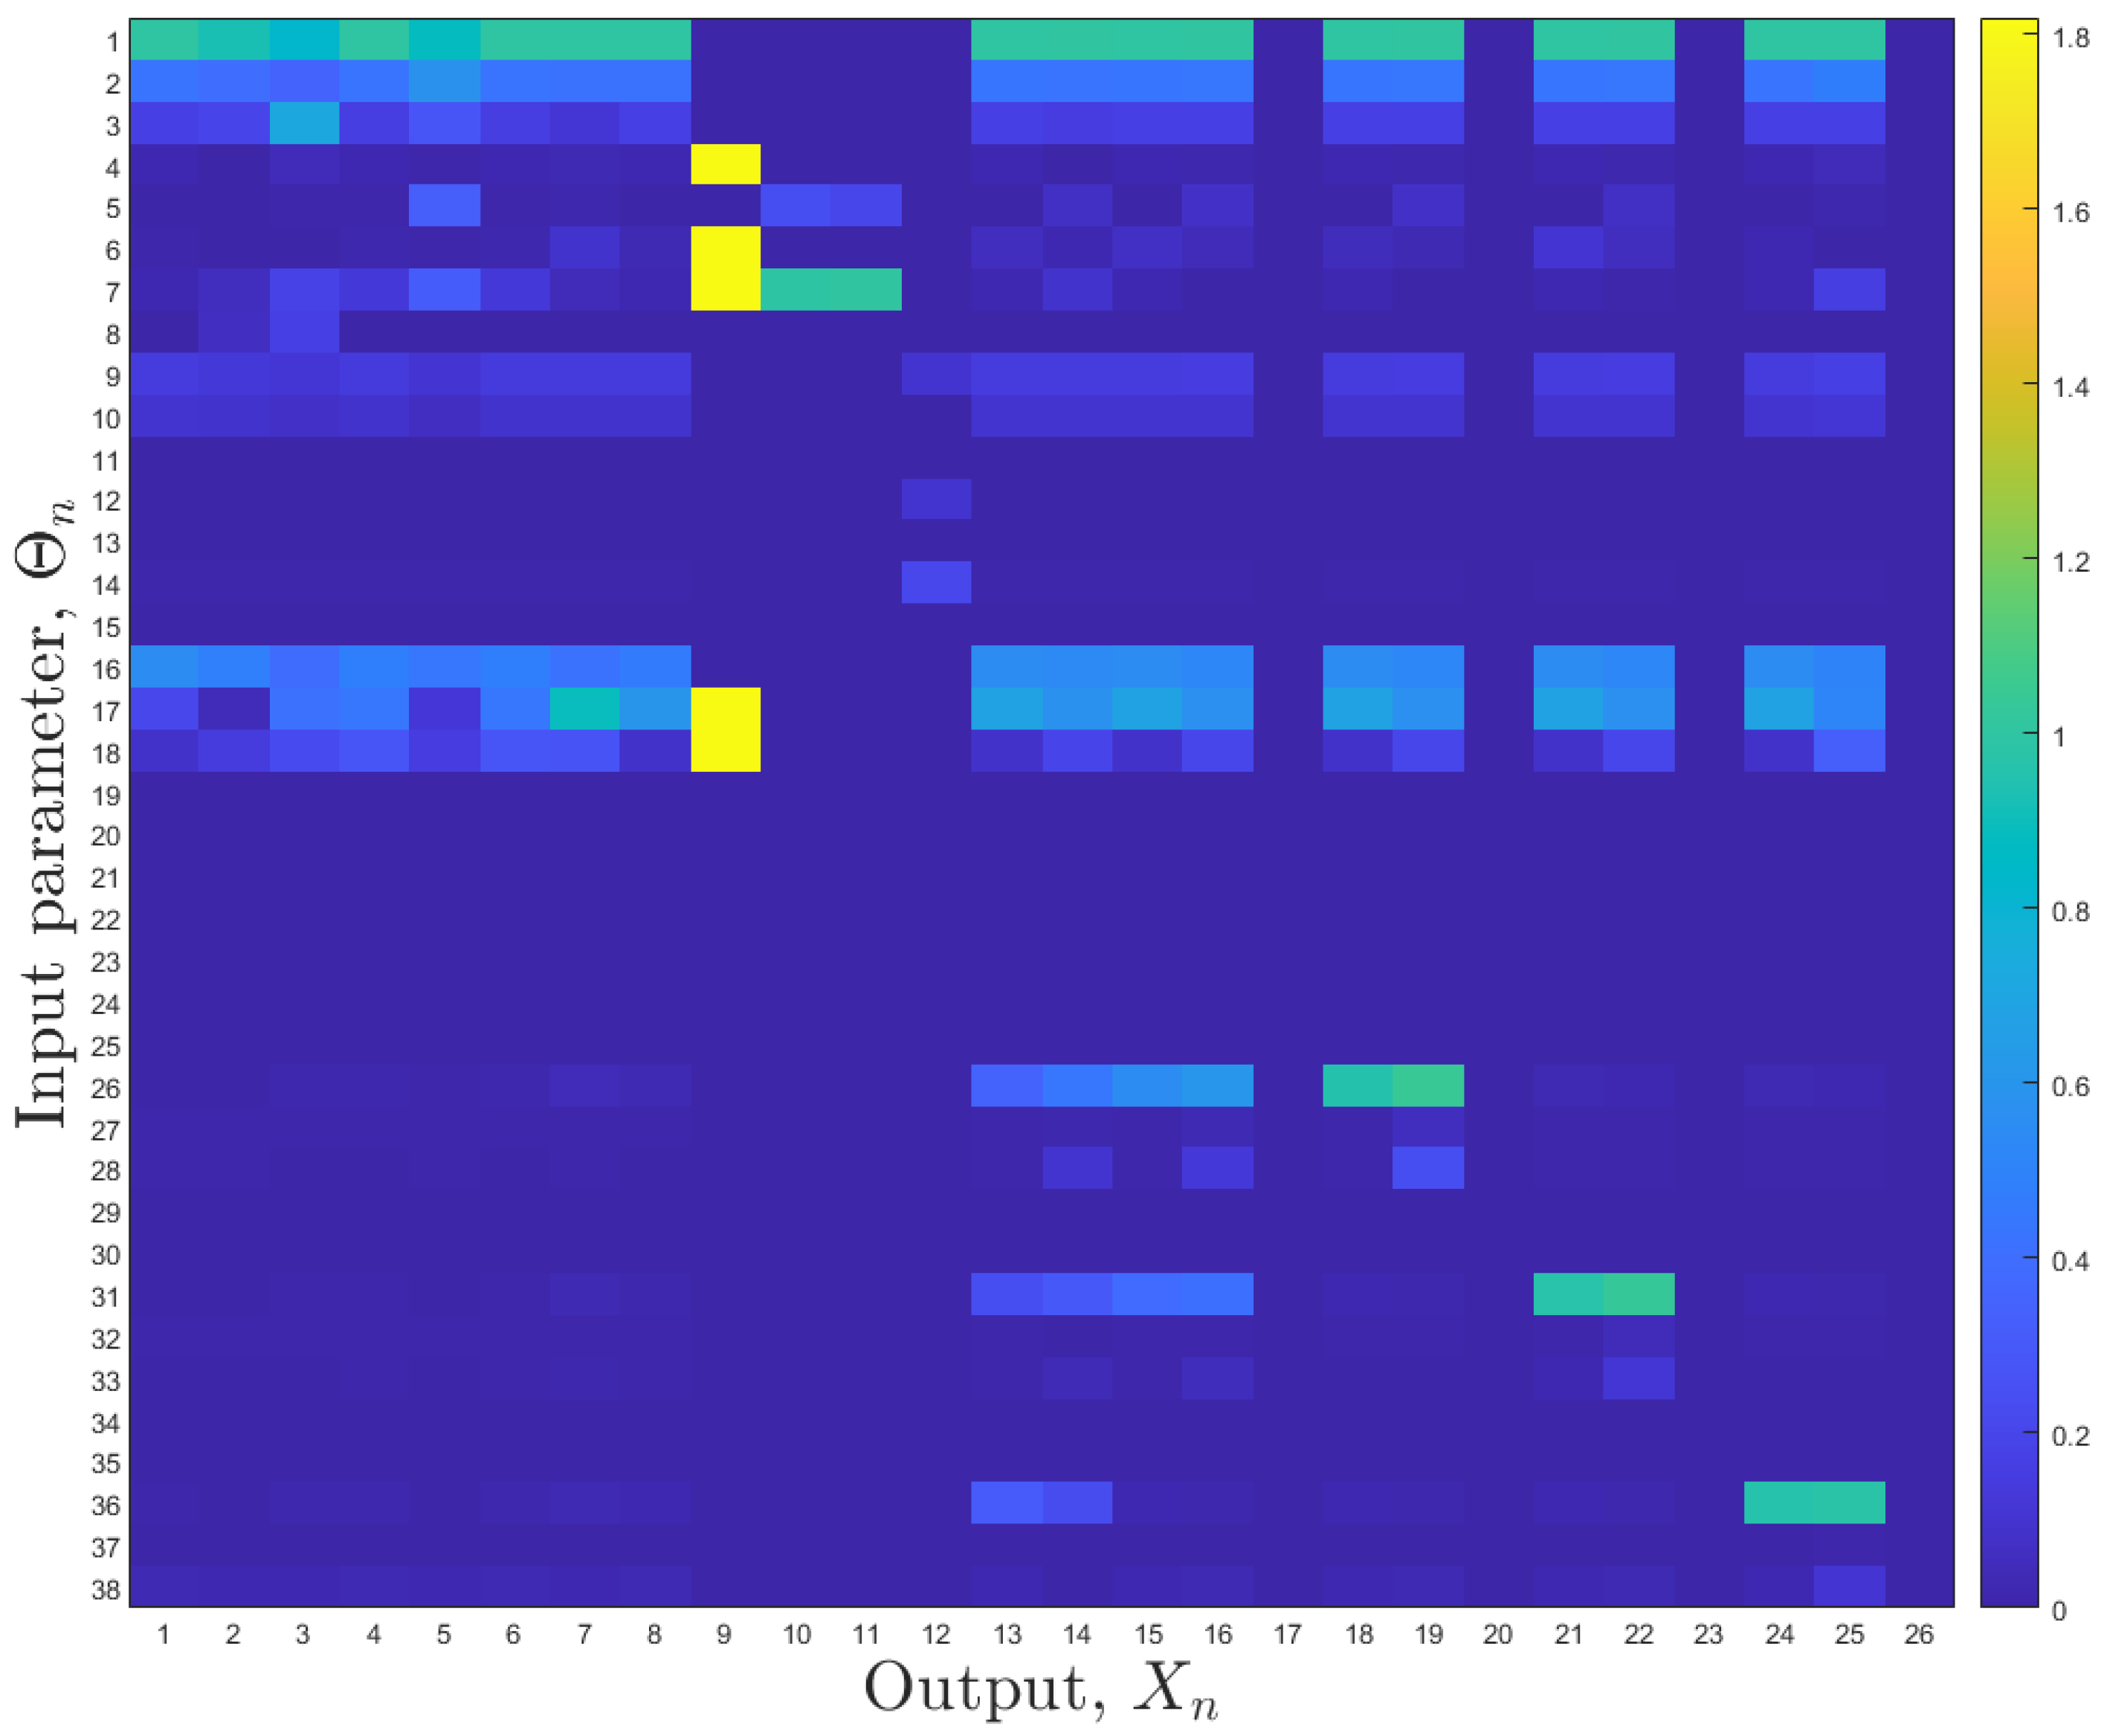
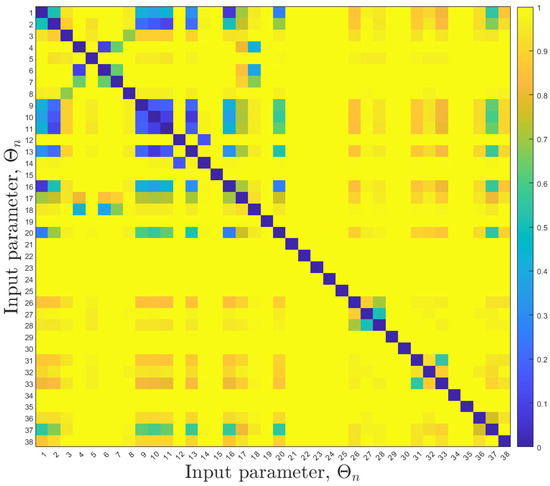
Figure A5.
Restricted input parameter orthogonality analysis. These data represent the subset of model input parameters used in this study. The output parameters which are embedded in these data are those effectively declared in the data of Figure A4. Input parameters are identified by the subscripts declared in Table A1.
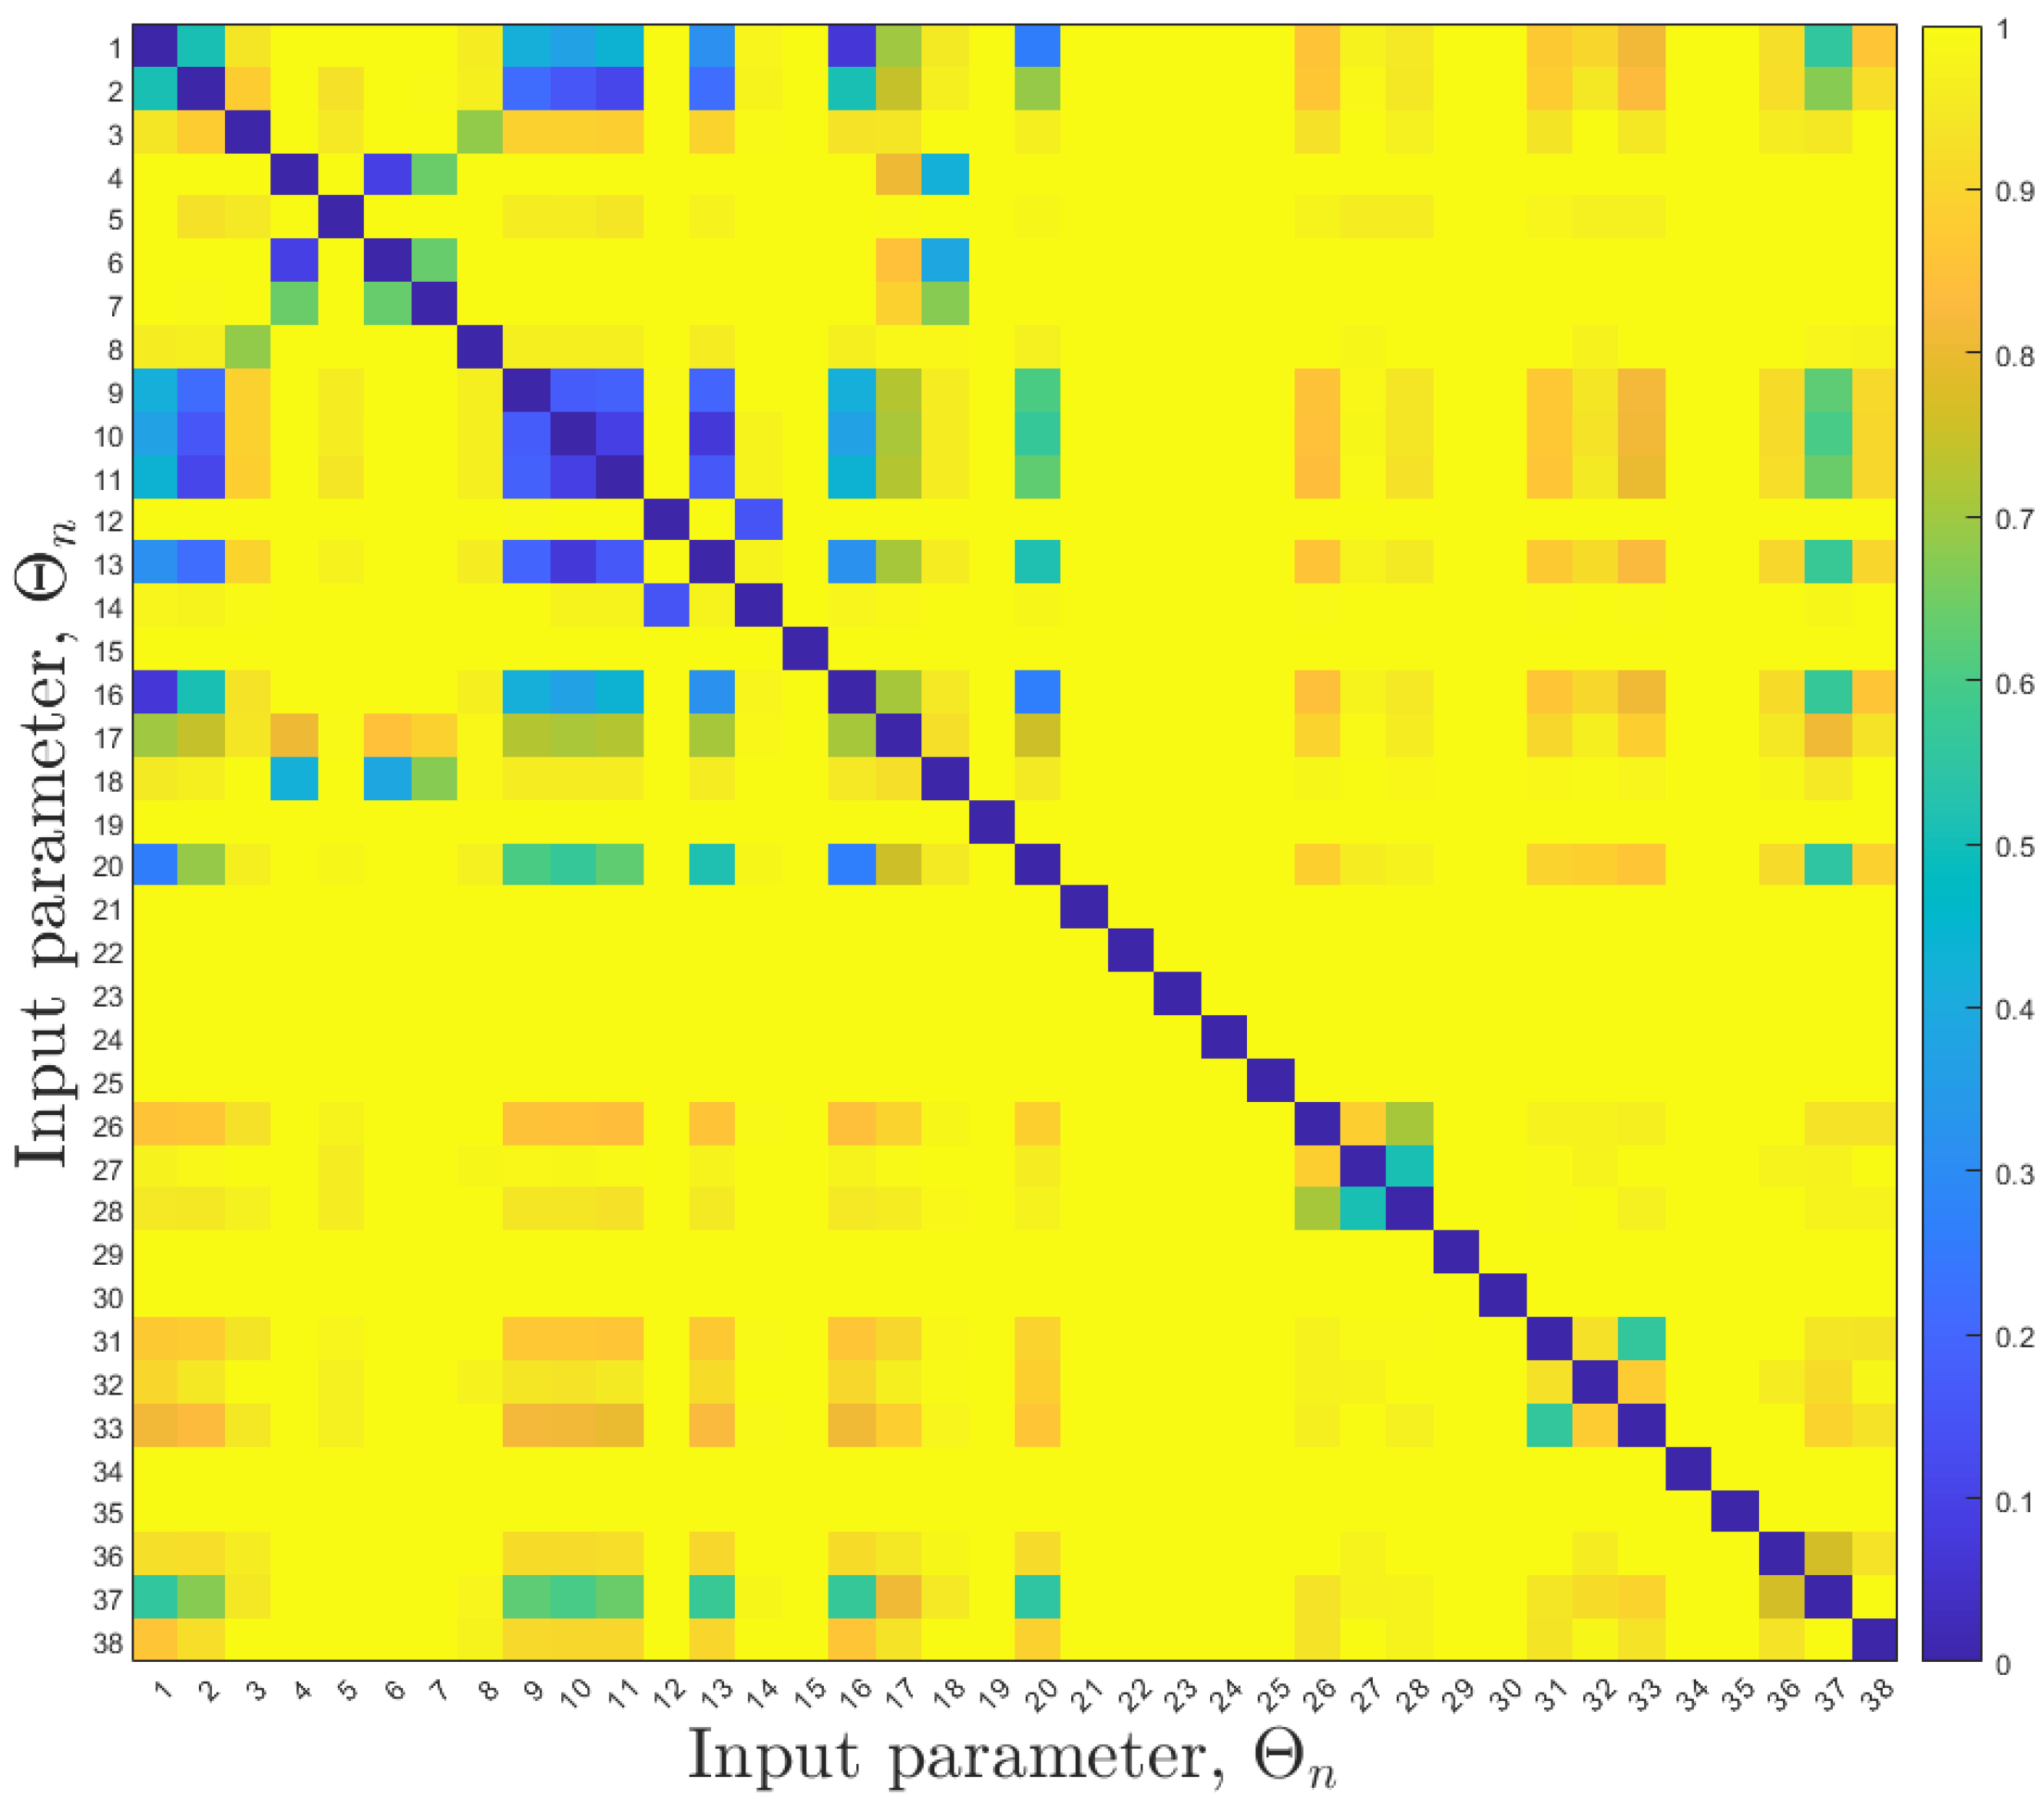
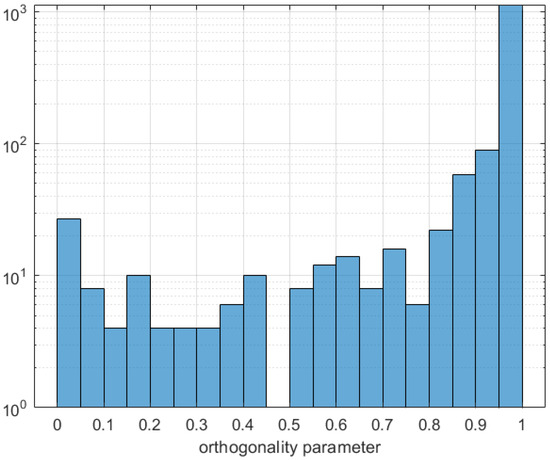
Figure A6.
Statistics of the restricted input parameter orthogonality analysis. The statistical distribution of the matrix elements are shown in heatmap form in Figure A5.
Figure A6.
Statistics of the restricted input parameter orthogonality analysis. The statistical distribution of the matrix elements are shown in heatmap form in Figure A5.
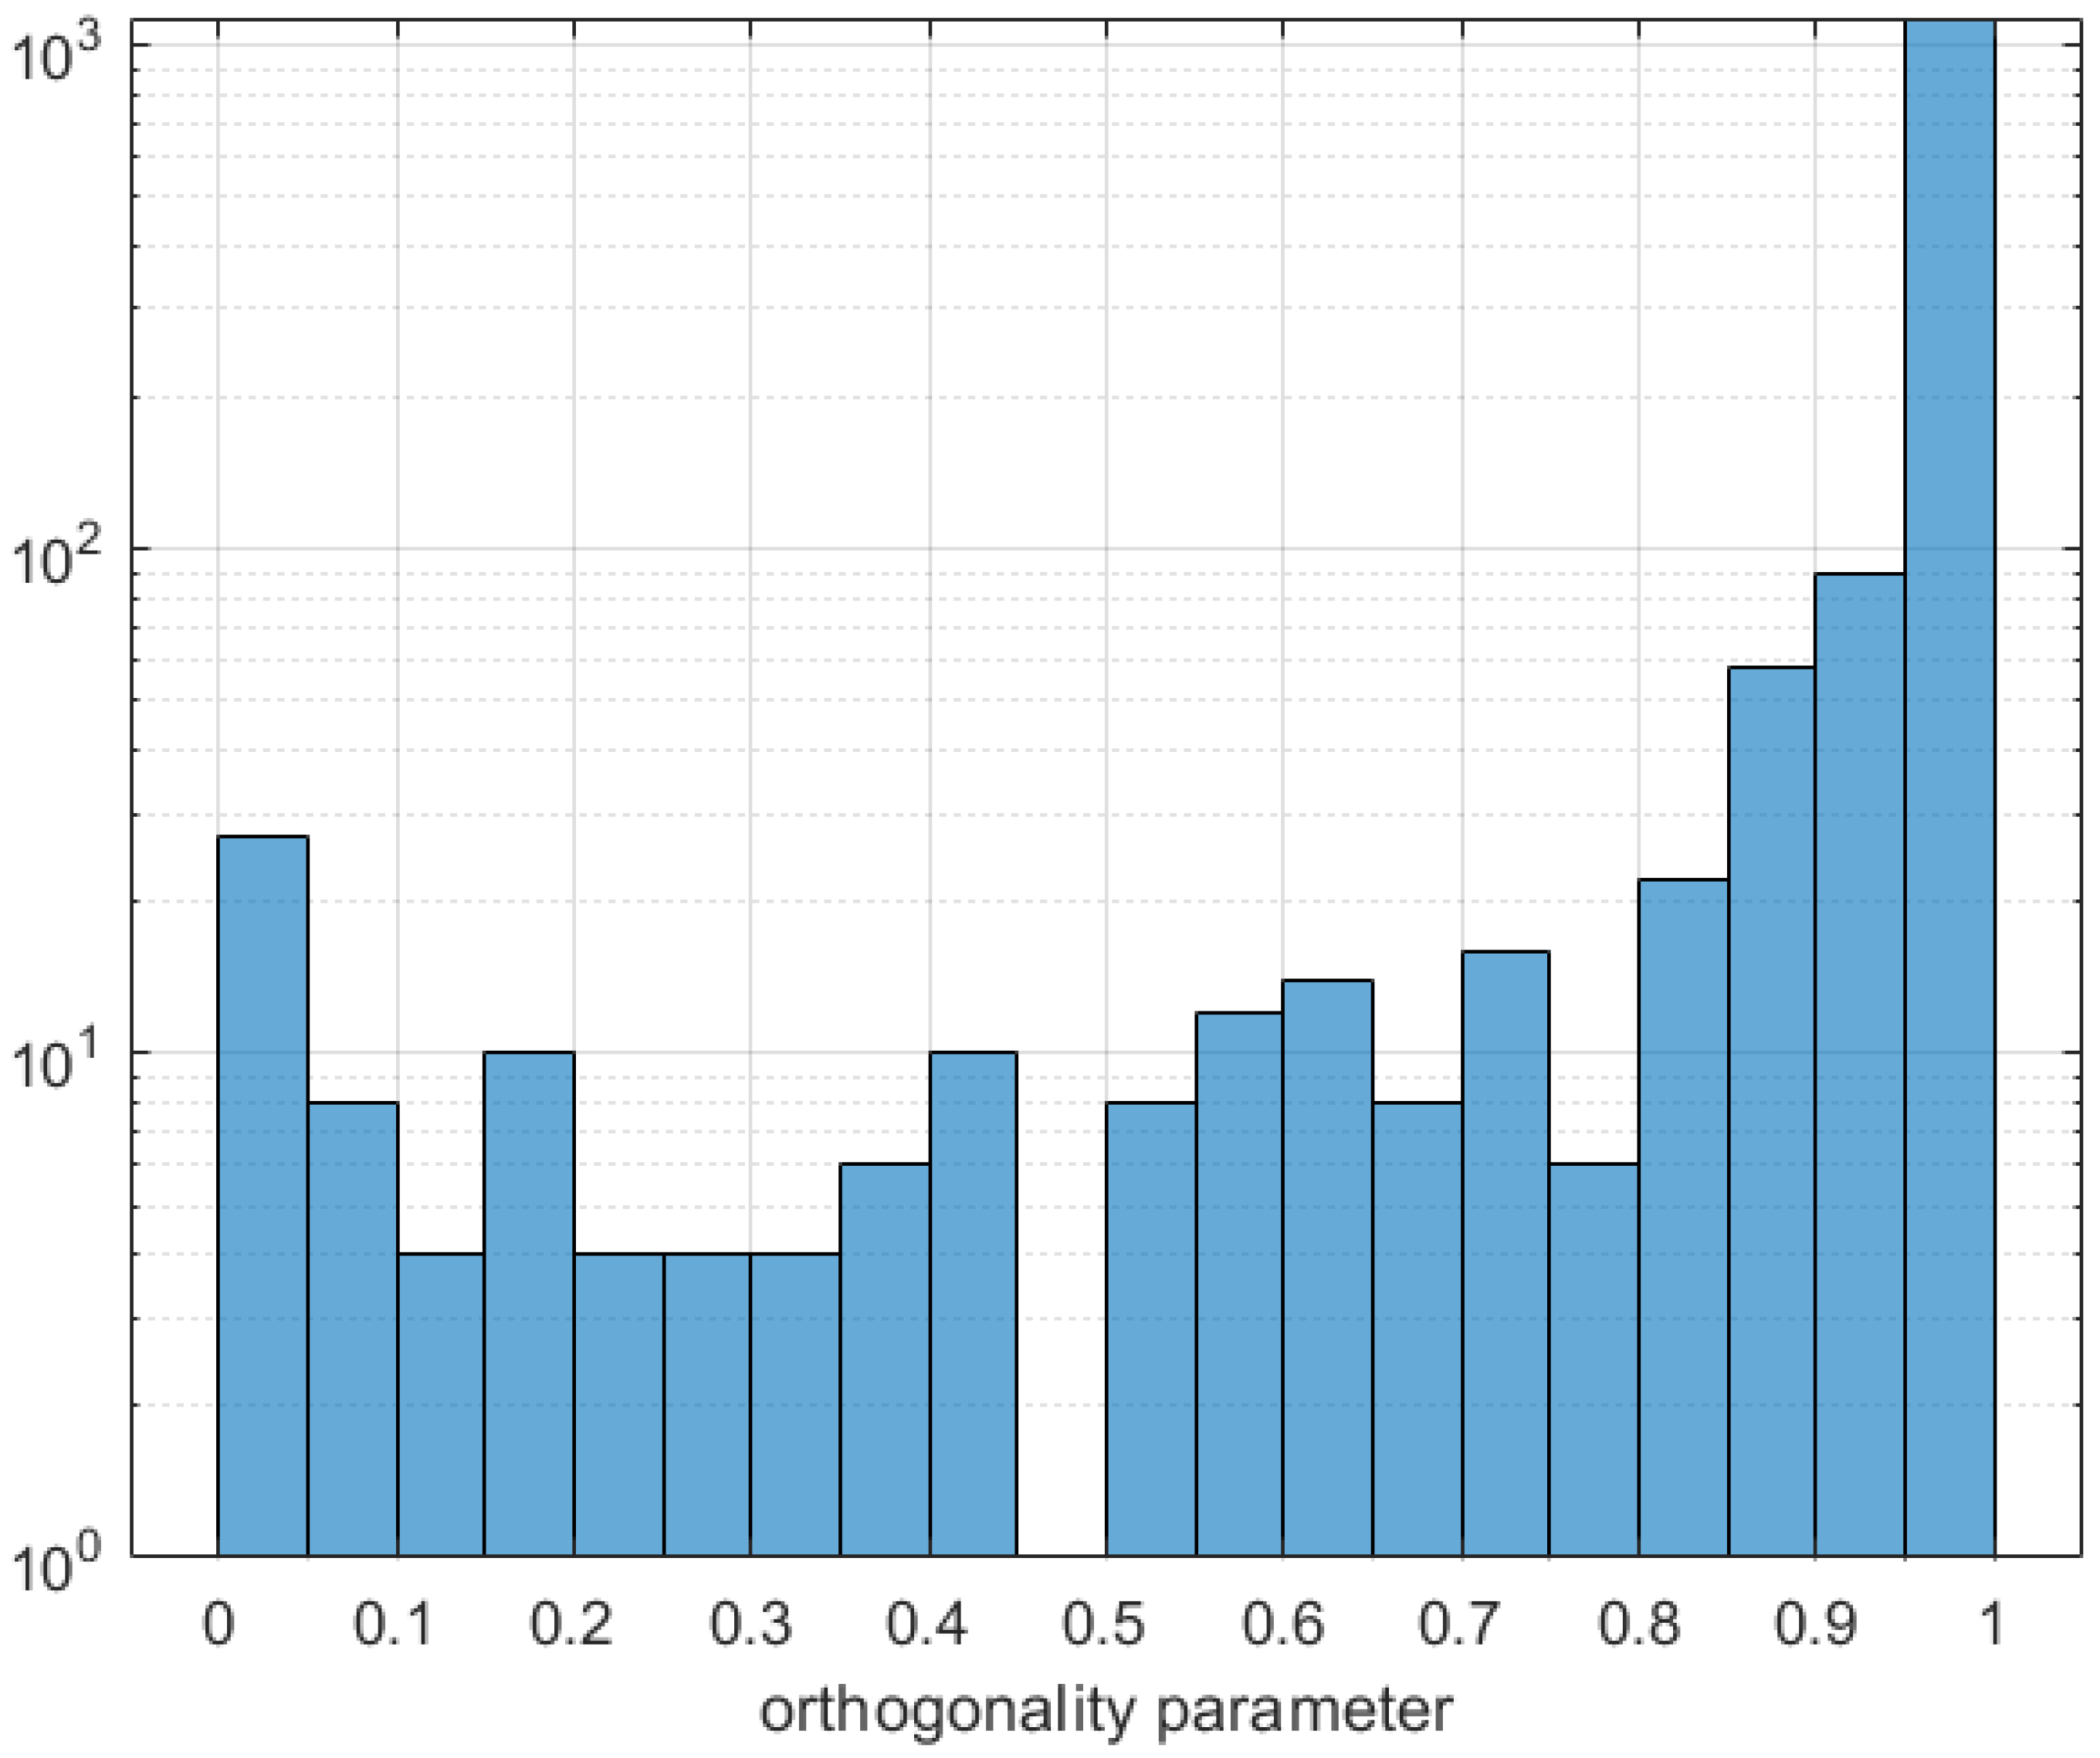

Table A1.
Key to full and restricted sensitivity and orthogonality analyses in Figure A1, Figure A2, Figure A4 and Figure A5. First column, index, and second and third columns are restricted analysis, fourth and fifth columns are full analysis. denotes an input parameter; denotes an output parameter.
| n | ||||
|---|---|---|---|---|
| 1 | Heart Rate | Cardiac Output | Heart Rate | Cardiac Output |
| 2 | Mean circ. filling press. | LV End Diastolic Volume | Mean circ. filling press. | Useful Cardiac Power |
| 3 | ELVmin | LV End Systolic Volume | ELVmin | LV End Diastolic Volume |
| 4 | ELVmax | LV Maximum Pressure | ELVmax | LV End Systolic Volume |
| 5 | n1LV | LV Minimum Pressure | n1LV | LV Stroke Volume |
| 6 | n2LV | Systemic Artery Systolic Press. | n2LV | LV Ejection Fraction |
| 7 | Tau1fLV | Systemic Artery Diastolic Pres. | Tau1fLV | LV Maximum Pressure |
| 8 | Tau2fLV | Systemic Artery True MAP | Tau2fLV | LV Minimum Pressure |
| 9 | LV fractional time shift | AV Opens | LV volume offset | LV End Diastolic Pressure |
| 10 | ELAmin | AV Closes | LV fractional time shift | LV dp/dt (peak) |
| 11 | ELAmax | MV Opens | ELAmin | LV Stroke Work per Beat |
| 12 | n1LA | MV Closes | ELAmax | LV Stroke Power (Mean) |
| 13 | n2LA | Mean Coronary Flow | n1LA | LV Stroke Power (Peak) |
| 14 | Tau1fLA | Maximum Coronary Flow | n2LA | LV Myocardial Power (mean) |
| 15 | Tau2fLA | Left Main Flow (mean) | Tau1fLA | LV Myocardial Power (peak) |
| 16 | LA fractional time shift | Left Main Flow (peak) | Tau2fLA | LV Wasted Myocardial Power (Suga) |
| 17 | Systemic Resistance (Prox.) | Left Main ’FFR’ (<Pd> / <Pa>) | LA volume offset | LA Maximum Volume |
| 18 | Systemic Resistance Distal | Cx Flow (mean) | LA fractional time shift | LA Minimum Volume |
| 19 | Systemic Art. Cap (Prox.) | Cx Flow (peak) | ERVmin | LA Maximum Pressure |
| 20 | Systemic Art. Inertance (Prox.) | Cx ’FFR’ (<Pd> / <Pa>) | ERVmax | LA Minimum Pressure |
| 21 | Mitral Valve quadratic coeff. | LAD Flow (mean) | n1RV | RV End Diastolic Volume |
| 22 | Mitral Valve linear coeff. | LAD Flow (peak) | n2RV | RV End Systolic Volume |
| 23 | Left main, quadratic coeff. | LAD ’FFR’ (<Pd>/<Pa>) | Tau1fRV | RV Stroke Volume |
| 24 | Left main, linear coeff. | RCA Flow (mean) | Tau2fRV | RV Ejection Fraction |
| 25 | Cx, quadratic coeff. | RCA Flow (peak) | RV volume offset | RV Maximum Pressure |
| 26 | Cx, linear coeff. | RCA ’FFR’ (<Pd> / <Pa>) | RV fractional time shift | RV Minimum Pressure |
| 27 | Cx, RCR total res. | ∼ | ERAmin | RV End Diastolic Pressure |
| 28 | Cx, RCR cap. | ∼ | ERAmax | RV dp/dt (peak) |
| 29 | Cx Cap. back press. fraction | ∼ | n1RA | RV Stroke Work per Beat |
| 30 | LAD, quadratic coeff. | ∼ | n2RA | RV Stroke Power Expenditure |
| 31 | LAD, linear coeff. | ∼ | Tau1fRA | RV Stroke Power (Peak) |
| 32 | LAD, RCR total resistance | ∼ | Tau2fRA | RV Myocardial Power (mean) |
| 33 | LAD, RCR cap, | ∼ | RA volume offset | RV Myocardial Power (peak) |
| 34 | LAD Cap. back press. fraction | ∼ | RA fractional time shift | RV Wasted Myocardial Power (Suga) |
| 35 | RCA, quadratic coeff. | ∼ | Systemic Resistance Prox. | RA End Diastolic Volume |
| 36 | RCA, linear coeff. | ∼ | Systemic Resistance Dist. | RA End Systolic Volume |
| 37 | RCA, RCR total resistance | ∼ | Systemic Arterial Prox. Cap. | RA Maximum Pressure |
| 38 | RCA, RCR capacitance | ∼ | Systemic Arterial Prox. Unstressed Vol. | RA Minimum Pressure |
| 39 | ∼ | ∼ | Systemic Arterial Distal Cap. | Systemic Artery Systolic Pressure |
| 40 | ∼ | ∼ | Systemic Arterial Distal Unstressed Vol. | Systemic Artery Diastolic Pressure |
| 41 | ∼ | ∼ | Systemic Arterial Inertance (Prox.l) | Systemic Artery Nominal MAP |
| 42 | ∼ | ∼ | Pulmonary Resistance Prox. | Systemic Artery True MAP |
| 43 | ∼ | ∼ | Pulmonary Resistance Distal | Systemic Artery Pulse Pressure |
| 44 | ∼ | ∼ | Pulmonary Arterial Proximal Cap. | Systemic Vein Mean Pressure |
| 45 | ∼ | ∼ | Pul. Art. Prox. Unstressed Vol. | Systemic Vein Pulse Pressure |
| 46 | ∼ | ∼ | Pul. Art. Distal Cap. | Pulmonary Artery Systolic Pressure |
| 47 | ∼ | ∼ | Pulmonary Arterial Distal Unstressed Vol. | Pulmonary Artery Diastolic Pressure |
| 48 | ∼ | ∼ | Pulmonary Arterial Inertance (Prox.) | Pulmonary Artery Nominal MAP |
| 49 | ∼ | ∼ | Aortic Valve quadratic coeff. | Pulmonary Artery True MAP |
| 50 | ∼ | ∼ | Aortic Valve linear coeff. | Pulmonary Artery Pulse Pressure |
| 51 | ∼ | ∼ | Aortic Valve regurgitant quadratic coeff. | Pulmonary Vein Mean Pressure |
| 52 | ∼ | ∼ | Aortic Valve regurgitant linear coeff. | Pulmonary Vein Pulse Pressure |
| 53 | ∼ | ∼ | Mitral Valve quadratic coeff. | AV Forward Flow [ml/beat] |
| 54 | ∼ | ∼ | Mitral Valve linear coeff. | AV Regurgitation [ml/beat] |
| 55 | ∼ | ∼ | Mitral Valve regurgitant quadratic coeff. | AV Regurgitant Fraction [-] |
| 56 | ∼ | ∼ | Mitral Valve regurgitant linear coeff. | AV Maximum Pressure Drop |
| 57 | ∼ | ∼ | PulmonaryValve quadratic coeff. | AV Mean Pressure Drop |
| 58 | ∼ | ∼ | Pulmonary Valve linear coeff. | (Stroke Power Lost):(AV Resistance) |
| 59 | ∼ | ∼ | Pulmonary Valve regurgitant quad. coeff. | (Stroke Power Lost):(AV Resistance) |
| 60 | ∼ | ∼ | Pulmonary Valve regurgitant linear coeff. | MV Forward Flow [ml/beat] |
| 61 | ∼ | ∼ | Tricuspid Valve quadratic coeff. | MV Regurgitation [ml/beat] |
| 62 | ∼ | ∼ | Tricuspid Valve linear coeff. | MV Regurgitant Fraction [-] |
| 63 | ∼ | ∼ | Tricuspid Valve regurgitant quad. coeff. | MV Maximum Pressure Drop |
| 64 | ∼ | ∼ | Tricuspid Valve regurgitant linear coeff. | MV Mean Pressure Drop |
| 65 | ∼ | ∼ | Left main, quadratic coeff. | Stroke Power Lost to MV Regurgitation |
| 66 | ∼ | ∼ | Left main, linear coeff. | (Stroke Power Lost):(MV Regurgitation) |
| 67 | ∼ | ∼ | Cx. quad. coefficient | AV Opens |
| 68 | ∼ | ∼ | Cx. linear coefficient | AV Closes |
| 69 | ∼ | ∼ | Cx. RCR total resistance | MV Opens |
| 70 | ∼ | ∼ | Cx. RCR cap. | MV Closes |
| 71 | ∼ | ∼ | Cx. RCR fraction proximal resistance | Period of Systole |
| 72 | ∼ | ∼ | Cx. cap. back pressure fraction | Period of Diastole |
| 73 | ∼ | ∼ | LAD, quadratic coefficient | Proportion of Heart Period in Systole |
| 74 | ∼ | ∼ | LAD, linear coefficient | Period of Isovolumetric Contraction |
| 75 | ∼ | ∼ | LAD, RCR total resistance | Period of Isovolumetric Relaxation |
| 76 | ∼ | ∼ | LAD, RCR capacitance | Mean Coronary Flow |
| 77 | ∼ | ∼ | LAD, RCR fraction proximal resistance | Maximum Coronary Flow |
| 78 | ∼ | ∼ | LAD cap. back pressure fraction | Left Main Flow (mean) |
| 79 | ∼ | ∼ | RCA, quadratic coefficient | Left Main Flow (peak) |
| 80 | ∼ | ∼ | RCA, linear coefficient | Left Main ’FFR’ (<Pd> / <Pa>) |
| 81 | ∼ | ∼ | RCA, RCR total resistance | Circumflex Flow (mean) |
| 82 | ∼ | ∼ | RCA, RCR capacitance | Circumflex Flow (peak) |
| 83 | ∼ | ∼ | RCA, RCR fraction proximal resistance | Circumflex ’FFR’ (<Pd>/ <Pa>) |
| 84 | ∼ | ∼ | LAD cap, back pressure fraction | LAD Flow (mean) |
| 85 | ∼ | ∼ | ∼ | LAD Flow (peak) |
| 86 | ∼ | ∼ | ∼ | LAD ’FFR’ (<Pd>/ <Pa>) |
| 87 | ∼ | ∼ | ∼ | RCA Flow (mean) |
| 88 | ∼ | ∼ | ∼ | RCA Flow (peak) |
| 88 | ∼ | ∼ | ∼ | RCA ’FFR’ (<Pd> / <Pa>) |
References
- Shi, Y.; Lawford, P.; Hose, D.R. Review of Zero-D and 1-D Models of Blood Flow in the Cardiovascular System. BioMed. Eng. 2011, 10, 33. [Google Scholar] [CrossRef] [PubMed]
- Hose, D.R.; Lawford, P.V.; Huberts, W.; Hellevik, L.R.; Omholt, S.; van de Vosse, W. Cardiovascular models for personalised medicine: Where now and where next? Med. Eng. Phys. 2019, 72, 38. [Google Scholar] [CrossRef] [PubMed]
- Shi, Y. Lumped-Parameter Cardiovascular Model with Windkessel Afterload; CellML: Auckland, New Zealand, 2007; Available online: http://models.cellml.org/exposure/ea64608ab564ee085bef7cde3ed1731e (accessed on 1 May 2023).
- Korakianitis, T.; Shi, Y. A concentrated parameter model for the human cardiovascular system including heart valve dynamics and atrioventricular interaction. Med. Eng. Phys. 2006, 28, 613–628. [Google Scholar] [CrossRef]
- Saltelli, A.; Ratto, M.; Andres, T.; Campolongo, F.; Cariboni, J.; Gatelli, D.; Saisana, M.; Tarantole, S. Global Sensitivity Analysis: The Primer; John Wiley and Sons: Hoboken, NJ, USA, 2008. [Google Scholar]
- Morris, P.D.; Ryan, D.; Morton, A.C.; Lycett, R.; Lawford, P.V.; Hose, D.R.; Gunn, J.P. Virtual Fractional Flow Reserve From Coronary Angiography: Modeling the Significance of Coronary Lesions: Results From the VIRTU-1 (VIRTUal Fractional Flow Reserve From Coronary Angiography). JACC Cardiovasc. Interv. 2013, 6, 149–157. [Google Scholar] [CrossRef]
- Morris, P.D.; Gosling, R.; Zwierzak, I.; Evans, H.; Aubiniere-Robb, L.; Czechowicz, K.; Evans, P.C.; Hose, D.R.; Lawford, P.V.; Narracott, A.J. A novel method for measuring absolute coronary blood flow and microvascular resistance in patients with ischaemic heart disease. Cardiovasc. Res. 2021, 117, 1567–1577. [Google Scholar] [CrossRef] [PubMed]
- Succi, S. The Lattice Boltzmann Equation for Fluid Dynamics and Beyond; Clarendon Press: Oxford, UK, 2001. [Google Scholar]
- Groen, D.; Richardson, R.; Coy, R.; Schiller, U.D.; Chandrashekar, H.; Robertson, F.; Coveney, P.V. Validation of Patient-Specific Cerebral Blood Flow Simulation Using Transcranial Doppler Measurements. Front. Physiol. 2018, 9, 1–12. [Google Scholar] [CrossRef] [PubMed]
- Westerhof, N.; Lankhaar, J.W.; Westerhof, B.E. The arterial windkessel. Med. Biol. Eng. Comput. 2009, 47, 131–141. [Google Scholar] [CrossRef]
- Sagawa, K.R.; Lie, J. Schaefer, Translation of Otto Frank’s paper “Die Grundform des arteriellen Pulses” Zeitschrift fur Biologie 37: 483–526 (1899) [Translation of Otto Frank’s paper, The basic shape of the arterial pulse]. J. Mol. Cell. Cardiol. 1990, 22, 253–277. [Google Scholar] [CrossRef]
- Mynard, J.P.; Davidson, M.R.; Penny, D.J.; Smolich, J.J. A simple, versatile valve model for use in lumped parameter and one-dimensional cardiovascular models. Numer. Methods Biomed. Eng. 2012, 28, 626–641. [Google Scholar] [CrossRef]
- Walley, K.R. Left ventricular function: Time-varying elastance and left ventricular aortic coupling. Crit. Care 2016, 20, 626–641. [Google Scholar] [CrossRef]
- Seemann, F.; Arvidsson, P.; Nordlund, D.; Kopic, S.; Carlsson, M.; Arheden, H.; Heiberg, E. Noninvasive quantification of pressure-volume loops from brachial pressure and cardiovascular magnetic resonance. Circ. Cardiovasc. 2019, 12, e008493. [Google Scholar] [CrossRef] [PubMed]
- Available online: https://models.physiomeproject.org/welcome (accessed on 1 May 2023).
- Czechowicz, K.; Archer, G.; Franz, J.; Nowakowski, P.; Narracott, A.J.; Hose, D.R. Modelling the Aortic and Mitral valve replacement using personalised 0D and 3D Computational Models of Left Heart Circulation; To be submitted to Fluids; Multi-Disciplinary Publishing Institute: Basel, Switzerland, 2023. [Google Scholar]
- Hann, C.E.; Chase, J.G.; Desaive, T.; Froissart, C.; Revie, J.; Stevenson, D.; Lambermont, B.; Ghuysen, A.; Kohl, P.; Shaw, G.M. Unique parameter identification for cardiac diagnosis in critical care using minimal data sets. Comput. Methods Programs Biomed. 2010, 29, 75. [Google Scholar] [CrossRef]
- Ramanathan, T.; Skinner, H. Coronary blood flow. Contin. Educ. Anaesth. Crit. Care Pain 2005, 5, 61–64. [Google Scholar] [CrossRef]
- Wiggers, C. Modern Aspects of the Circulation in Health and Disease; Lea and Febiger: Philadelphia, PA, USA, 1923. [Google Scholar]
- Monge Garcia, M.I.; Santos, A. Understanding ventriculo-arterial coupling. Ann. Transl. Med. 2020, 8, 795–805. [Google Scholar] [CrossRef] [PubMed]
- Stergiopulos, N.; Westerhof, B.E.; Westerhof, N. Total arterial inertance as the fourth element of the windkessel model. Am. J. Physiol. 1999, 276, 81–88. [Google Scholar] [CrossRef] [PubMed]
- Bastos, M.B.; Burkhoff, D.; Maly, J.; Daemen, J.; den Ui, C.A.L.; Ameloot, K.; Lenzen, M.; Mahfoud, F.; Zijlstra, F.; Schreuder, J.J.; et al. Invasive left ventricle pressure-volume analysis: Overview and practical clinical implications. Eur. Heart J. 2020, 21, 1286–1297. [Google Scholar] [CrossRef]
- Kunkel, P.; Mehrmann, V.L. Differential-Algebraic Equations: Analysis and Numerical Solution; European Mathematical Society: Zurich, Switzerland, 2006; ISBN 978-3-03719-017-3. [Google Scholar]
- Jacobs, O.L.R. Introduction to Control Theory; Oxford University Press: Oxford, UK, 1984; ISBN 0-19-856148-2. [Google Scholar]
- Murray, C.D. The Physiological Principle of Minimum Work: I. The Vascular System and the Cost of Blood Volume. Proc. Natl. Acad. Sci. USA 1923, 12, 207–214. [Google Scholar] [CrossRef]
- Huo, Y.; Kassab, G.S. Intraspecific scaling laws of vascular trees. J. R. Soc. Interface 2012, 9, 190–200. [Google Scholar] [CrossRef]
- Gosling, R.C.; Study, J.; Morris, P.D.; Fossan, F.E.; Hellevik, L.R.; Lawford, P.; Hose, D.R.; Gunn, J.P. Effect of side branch flow upon physiological indices in coronary artery disease. J. Biomech. 2020, 103, 109698. [Google Scholar] [CrossRef]
- Foerstermann, U.; Muenzel, T. Endothelial Nitric Oxide Synthase in Vascular Disease From Marvel to Menace. Circulation 2006, 113, 1708–1714. [Google Scholar] [CrossRef]
- Linke, A.; Erbs, S.; Hambrecht, R. Effects of exercise training upon endothelial function in patients with cardiovascular disease. Front Biosci. 2008, 13, 424–432. [Google Scholar] [CrossRef]
- Laufs, U.; Wassmann, S.; Czech, T.; Muenzel, T.; Eisenhauer, M.; Boehm, M.; Nickenig, G. Physical inactivity increases oxidative stress, endothelial dysfunction, and atherosclerosis, Arteriosclerosis. Thromb. Vasc. Biol. 2005, 25, 809–814. [Google Scholar] [CrossRef]
- Sattelmair, J.; Pertman, J.; Ding, E.L.; Kohl, H.W.; Haskell, W.; Lee, I.M. Dose response between physical activity and risk of coronary heart disease: A meta-analysis. Circulation 2011, 124, 789–795. [Google Scholar] [CrossRef]
- Hung, R.K.; Al-Mallah, M.H.; McEvoy, J.W.; Whelton, S.P.; Blumenthal, R.S.; Nasir, K.; Schairer, J.R.; Brawner, C.; Alam, M.; Keteyian, S.J.; et al. Prognostic value of exercise capacity in patients with coronary artery disease: The FIT (Henry Ford ExercIse Testing) project. Mayo Clin. Proc. 2014, 89, 1644–1654. [Google Scholar] [CrossRef] [PubMed]
- Hambrecht, R.; Walther, C.; Moebius-Winkler, S.; Gielen, S.; Linke, A.; Conradi, K.; Erbs, S.; Kluge, R.; Kendziorra, K.; Sabri, O.; et al. Percutaneous coronary angioplasty compared with exercise training in patients with stable coronary artery disease: A randomized trial. Circulation 2004, 109, 371–378. [Google Scholar] [CrossRef]
- Shi, Y.; Korakianitis, T. Numerical simulation of cardiovascular dynamics with left heart failure and in-series pulsatile ventricular assist device. Artif. Organs 2006, 30, 929–948. [Google Scholar] [CrossRef]
- Arts, T.; Bovendeerd, P.H.M.; Prinzen, F.W. Reneman, Relation between left ventricular cavity pressure and volume and systolic fiber stress and strain in the wall. Biophys. J. 1991, 59, 93–102. [Google Scholar] [CrossRef]
- Bovendeerd, P.H.; Borsje, P.; Arts, T.; van de Vosse, F.N. Dependence of intramyocardial pressure and coronary flow on ventricular loading and contractility, a model study. Ann. Biomed. Eng. 2006, 34, 133–1145. [Google Scholar] [CrossRef] [PubMed]
- Li, R.; Henson, M.A.; Kurtz, M.J. Selection of model parameters for off-line parameter estimation. IEEE Trans. Control. Syst. Technol. 2004, 12, 402–412. [Google Scholar] [CrossRef]
- Bjordalsbakke, N.I.; Sturdy, J.T.; Hose, D.R.; Hellevik, L.R. Parameter estimation for closed loop lumped parameter models in the systemic circulation using synthetic data. Math. Biosci. 2002, 343, 108731. [Google Scholar] [CrossRef] [PubMed]
Disclaimer/Publisher’s Note: The statements, opinions and data contained in all publications are solely those of the individual author(s) and contributor(s) and not of MDPI and/or the editor(s). MDPI and/or the editor(s) disclaim responsibility for any injury to people or property resulting from any ideas, methods, instructions or products referred to in the content. |
© 2023 by the authors. Licensee MDPI, Basel, Switzerland. This article is an open access article distributed under the terms and conditions of the Creative Commons Attribution (CC BY) license (https://creativecommons.org/licenses/by/4.0/).

