1. Introduction
Plate heat exchangers (PHEs) are nowadays extensively being used in several industrial applications such as dairy processing, paper/pulp, refrigeration, heating, ventilation, and air conditioning. PHEs are superior to other kinds of heat exchangers in several ways. They are useful for energy and space-saving because they generally have a higher heat transfer area to volume ratio and have less weight, flexible designs, and good thermal efficiency. Their adaptable design gives them an advantage in changing the heat transfer area since it makes it easy to add or remove plates without disrupting the pipe connections. Plate-type heat exchangers have been widely used as two-phase heat exchangers in heating and refrigeration systems due to their advantages.
Yan et al. [
1] conducted experiments to measure the condensation heat transfer coefficient and frictional pressure drop of R134a in a vertical plate heat exchanger. Their investigation of the effect of refrigerant mass flux, imposed heat flux, and system pressure on condensation heat transfer showed that with the imposed heat flux, refrigerant mass flux, and vapor quality, both the heat transfer coefficient and pressure drop increased. Additionally, the increase in pressure drop caused by the vapor quality was higher than the heat transfer coefficient. It was also observed that the heat transfer coefficients were somewhat lower at a greater system pressure. Correlations for the experimentally measured heat transfer coefficient and frictional pressure drop were developed.
Han et al. [
2] carried out experiments to determine the condensation heat transfer coefficient and the pressure drop of R410A and R22 in brazed plate heat exchangers (BPHEs) with different chevron angles, such as 45°, 55°, and 70°. They determined the condensation heat transfer coefficients and pressure drop by varying the mass flux, condensation temperature, and refrigerant vapor quality. The pressure drop and heat transfer coefficient both increased proportionately as the refrigerant mass flux and vapor quality increased, but inversely with the condensation temperature. The heat transfer coefficient was also found to increase with chevron angles. For the tested BPHEs, correlations of the Nusselt number and the friction factor with the geometrical parameters were proposed.
Jokar et al. [
3,
4] also experimentally measured the heat transfer coefficients and pressure drop during condensation of HFC-134a inside BPHEs and applied dimensional analysis to develop new correlations of heat transfer and pressure drop.
Longo et al. [
5] conducted an experimental investigation on the use of a “cross-grooved” surface and the vaporization and condensation of the refrigerant HCFC-22 within a BPHE with herringbone macro-scale corrugation. Compared to conventional herringbone plates with a smooth surface, herringbone plates with a “cross-grooved” surface demonstrated a 30% to 40% increase in evaporation and a 60% increase in the condensation heat transfer coefficient.
Kuo et al. [
6] presented empirical correlations for heat transfer and pressure drop and reported experimental results on HFC-410A condensation within a BPHE. The friction factor was shown to be substantially impacted by the mass flux and vapor quality, whereas the heat transfer coefficient was found to depend mainly on the heat flux and the mass flux.
Longo and Zilio [
7] illustrated the heat transfer coefficient and pressure drop of HFC1234yf in condensation heat transfer and also compared the results with HFC134a under the same operating conditions. According to their findings, the heat transfer coefficient of HFO1234yf shows weak sensitivity to saturation temperature and strong sensitivity to the mass flux of the refrigerant. They also showed that the condensation heat transfer coefficients of superheated vapor are almost 8–11% higher than those of saturated vapor. Furthermore, HFO1234 exhibits a heat transfer coefficient almost 10–12% lower and a pressure drop about 10–20% lower than those of HFC134a under similar thermal conditions.
Longo et al. [
8] investigated HFO1234ze(E) condensation inside a brazed plate heat exchanger at various mass fluxes and condensation temperatures. According to their studies, for low refrigerant mass fluxes (G < 20 kg/m
2s), condensation is indeed caused by gravity, however, for higher refrigerant mass fluxes (G > 20 kg/m
2s), forced convective condensation occurs. HFO1234ze(E), in comparison to HFC134a, displays lower (4–6%) heat transfer coefficients and a higher (10%) frictional pressure drop.
Table 1 summarizes some of the previous research work dedicated to condensation heat transfer (HT) and pressure drop (PD) in plate heat exchangers.
Many researchers have studied the heat transfer properties of various refrigerants in different types of plate heat exchangers, particularly for condensation and evaporation, over the years. The use of refrigerants with low global warming potential (GWP) has received more attention in recent years due to concerns about global warming [
9].
The CF
3I refrigerant is gaining interest for use in refrigeration and air conditioning applications due to its low GWP (<1), low ozone depletion potential (ODP = 0.019), and ability to suppress flammability [
12]. CF
3I has good environmental, safety, and flammability characteristics, as well as good oil solubility and material compatibility. Therefore, it is also being considered as a promising alternative, especially as a component in mixtures [
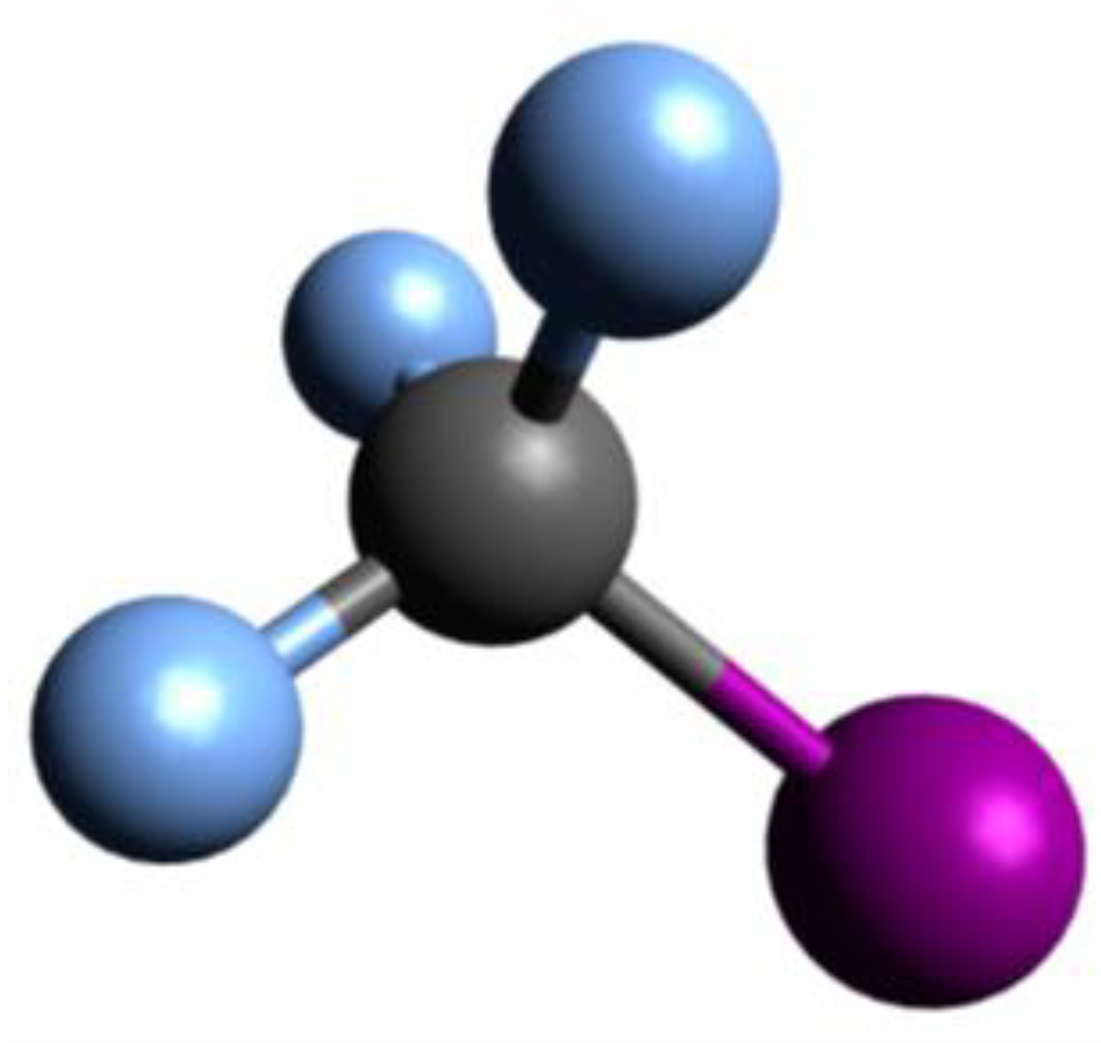
13], to replace high-GWP refrigerants. The molecule CF
3I, or trifluoro iodomethane, has three fluorines, one iodine, and one carbon in a tetrahedral structure, as illustrated in
Figure 1 [
12]. REFPROP 10.0 [
14] and other literature [
12,
15] contain extensive detail on the thermophysical characteristics of CF
3I.
The characteristics and properties of CF
3I are provided in
Table 2.
Much research on various refrigerants in plate heat exchangers has been carried out over the years, which can be found reported by Amalfi et al. [
21,
22], Eldeeb et al. [
23], and Tao and Ferreira [
24]. However, CF
3I is a working fluid whose heat transfer characteristics are still to be investigated.
Additionally, most of the literature discusses the overall heat transfer coefficient, and very few papers have discussed local heat transfer characteristics inside the brazed plate heat exchanger. To further understand the heat transfer characteristics from the information on local heat transfer, a specially designed test section was constructed for the present study to measure the local heat transfer coefficient obtained from local wall temperature and heat flux.
In this experimental work, the condensation local heat transfer coefficients of the refrigerant CF3I in a vertical brazed plate heat exchanger were measured and analyzed as a function of the mass flux, saturation temperature, vapor quality, and heat flux. In addition, the obtained data were compared with R1234yf experimental data from the same test facility. Along with the results that are described, the measurement methods and experimental procedures are also explained. This work investigated the heat transfer characteristics of CF3I with a newly developed prediction method. Although CF3I is not used as a pure refrigerant, the reported data and proposed correlation will contribute to the design of PHE with a refrigerant mixture such as R466A (39.5% CF3I, 49% R32, and 11.5% R125).
2. Experimental Apparatus and Procedures
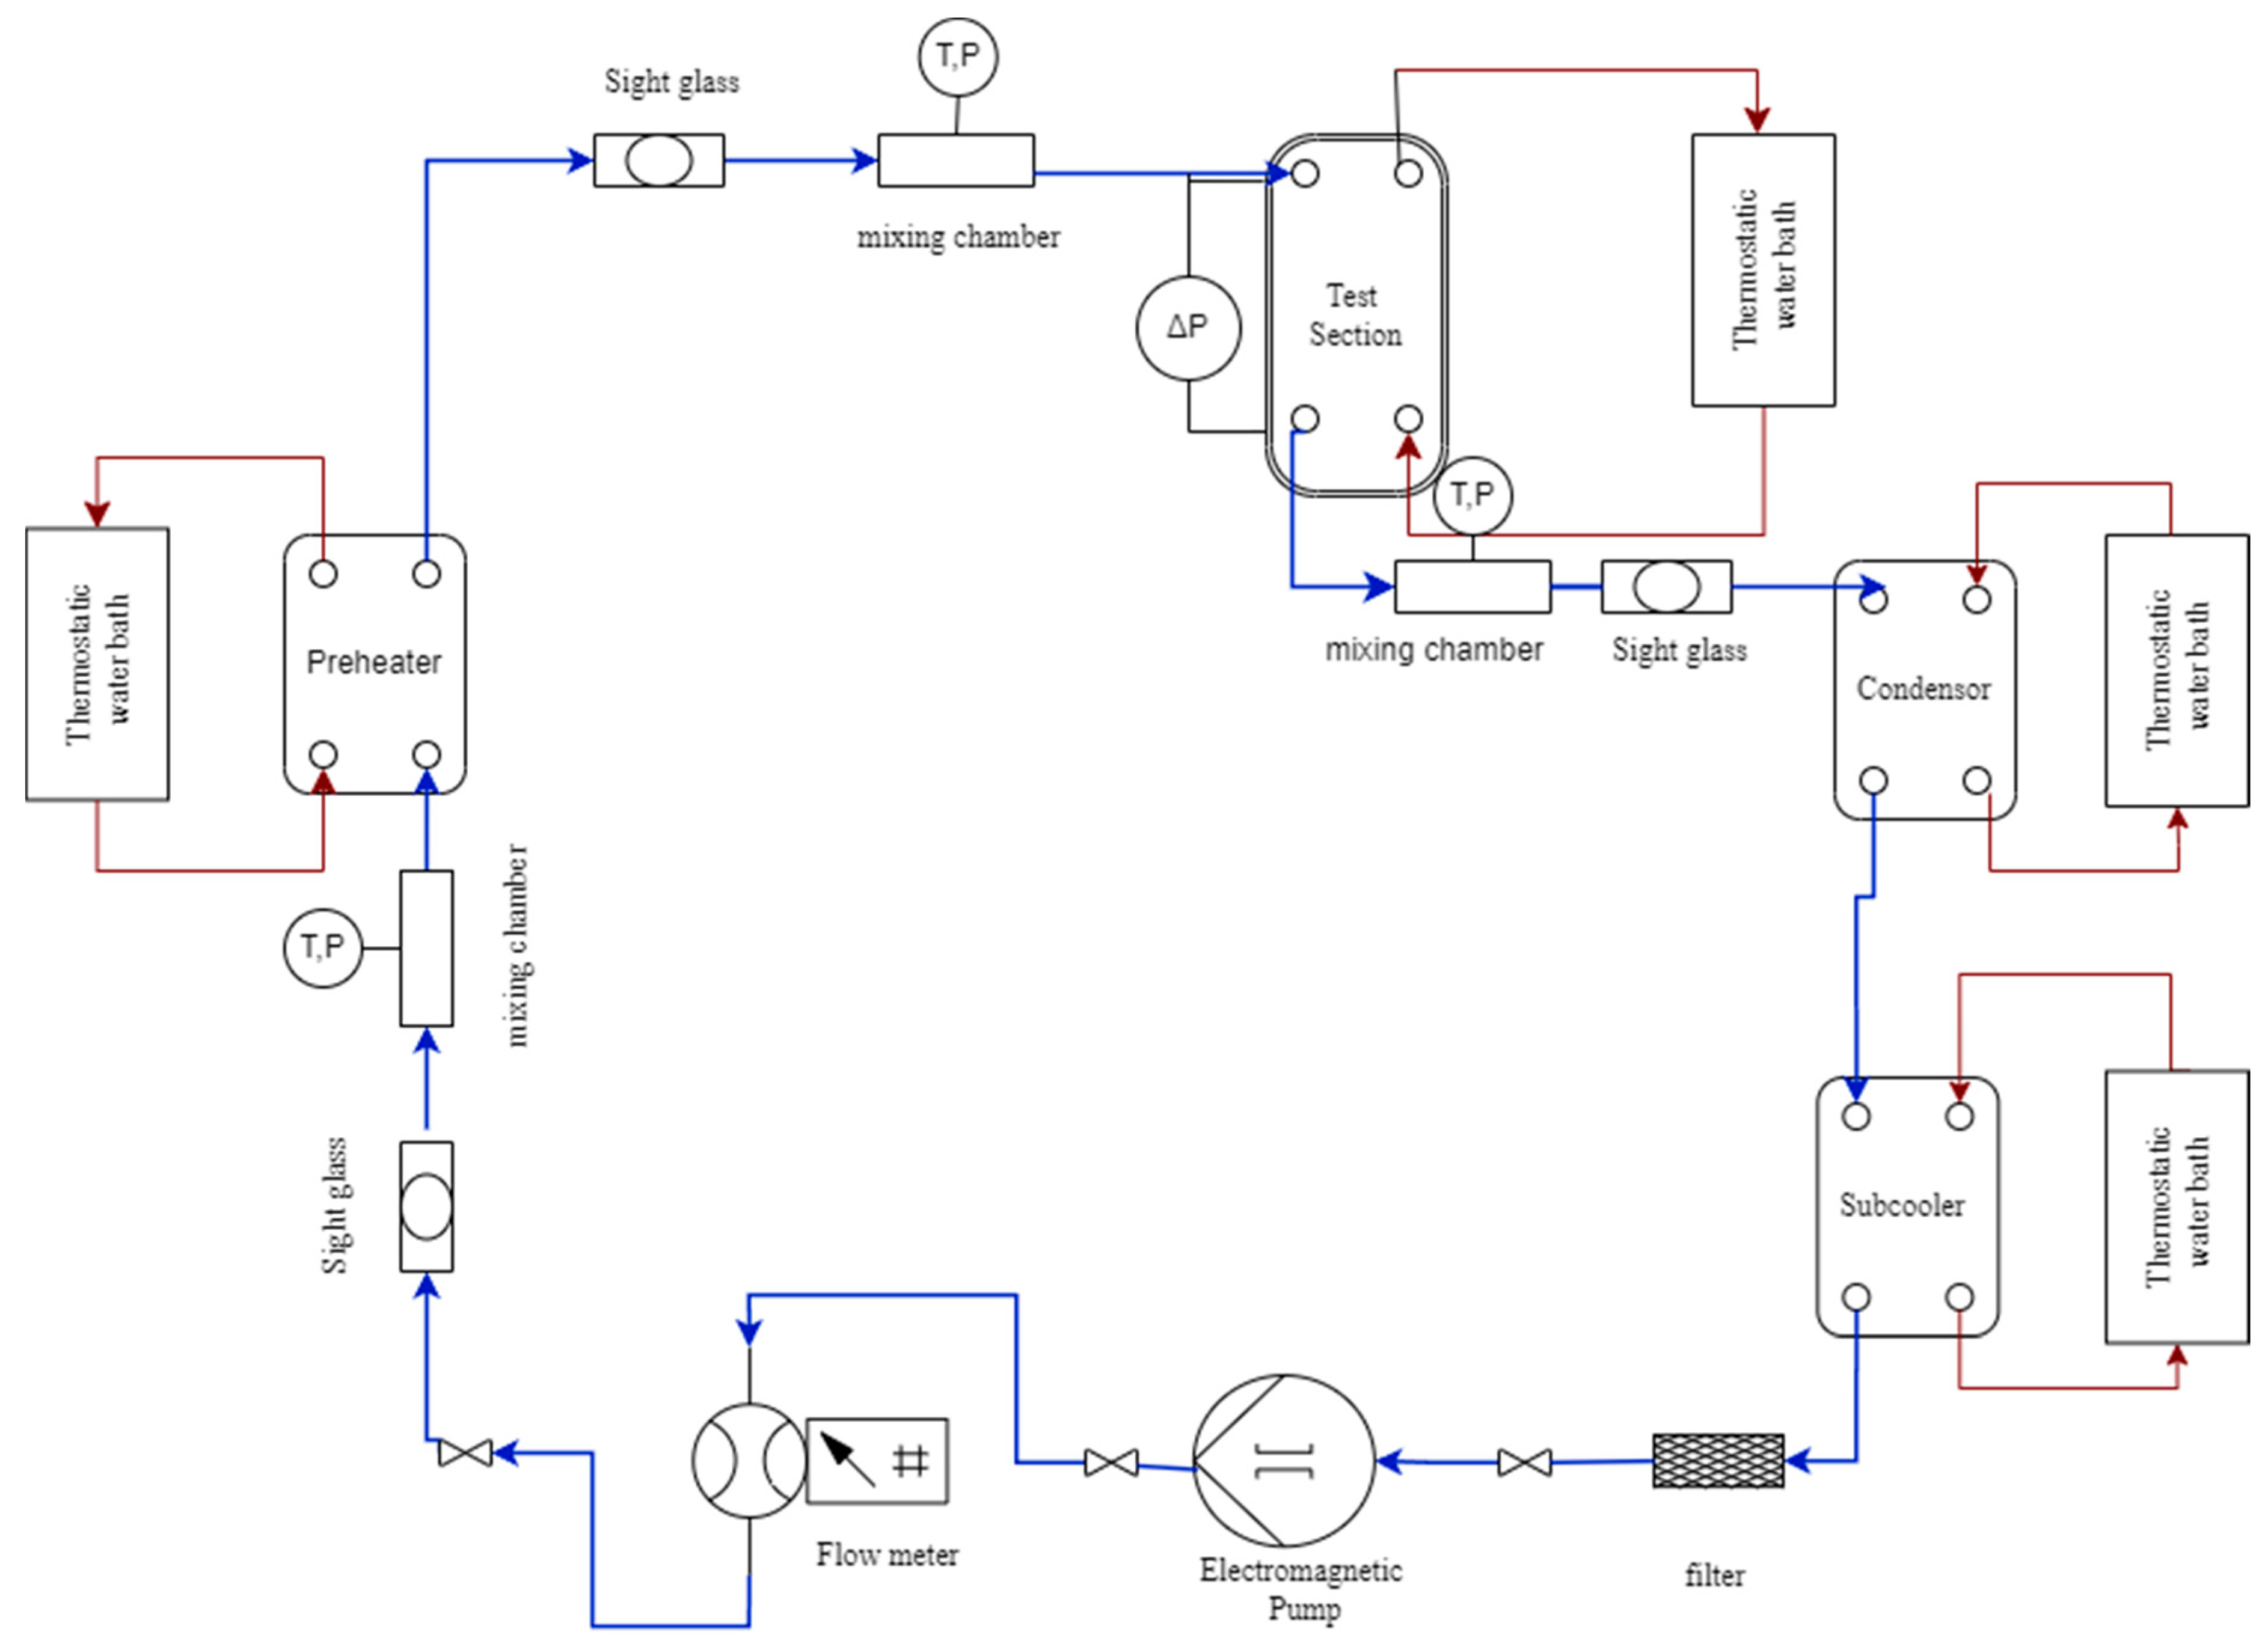
The experimental setup comprised five different loops and a data acquisition system to investigate the condensation heat transfer of the refrigerant CF
3I in a vertical brazed plate heat exchanger. It included a refrigerant loop, three water loops for the preheater, a test section and condenser, and a cold-water brine loop for the subcooler. The refrigerant CF
3I was circulated through the refrigerant loop as shown in
Figure 2.
To achieve the various test conditions of CF3I, such as imposed mass flux, saturation temperature and inlet vapor quality in the test section, it was necessary to regulate the flow and control temperature in the other loops. The desired vapor quality at the test section inlet was provided by the preheater circuit. The heating circuit provided the heating of the test section as well.
2.1. Refrigerant Flow Loop
A refrigerant pump, a refrigerant mass flow meter, a preheater, a test section “the plate heat exchanger”, a condenser, a subcooler, three mixing chambers, and three sight glasses comprised the refrigerant loop. The refrigerant pump was a Shimpo pump powered by a DC motor that was controlled by a variable DC output motor controller. A rotating DC motor controlled the fluctuation of the liquid CF3I flow rate by changing the DC current. A mass flow meter (MASSMAX), positioned between the pump and preheater, was used to monitor the refrigerant flow rate. The preheater transferred heat from hot water to CF3I to evaporate the refrigerant to a specific vapor quality at the inlet of the test section. The saturated vapor then entered into the test section and the CF3I condensed there. The vapor–liquid two-phase refrigerant from the outlet of the test section was finally condensed in the condenser. Then the refrigerant was subcooled by controlling the flow rate of a low-temperature water brine mixture in the subcooler. The system pressure of the refrigerant loop could be controlled by adjusting the temperature in the condenser. The purpose of the filter was to remove any solid particles that may have been present in the loop. The refrigerant coming from the exit of the test section was maintained in a subcooled condition to prevent cavitation at the pump inlet. Three mixing chambers were installed before and after the test section, as well as before the preheater, to monitor the absolute pressure and temperature of the refrigerant. The state of the refrigerant flowing through the refrigerant loop of the experimental apparatus could be observed through the sight glasses. The entire pressure drop across the refrigerant side of the vertical PHE was measured using a differential pressure transducer. K-type and T-type thermocouples were used after calibration to measure all the temperatures in the loop.
2.2. Test Section
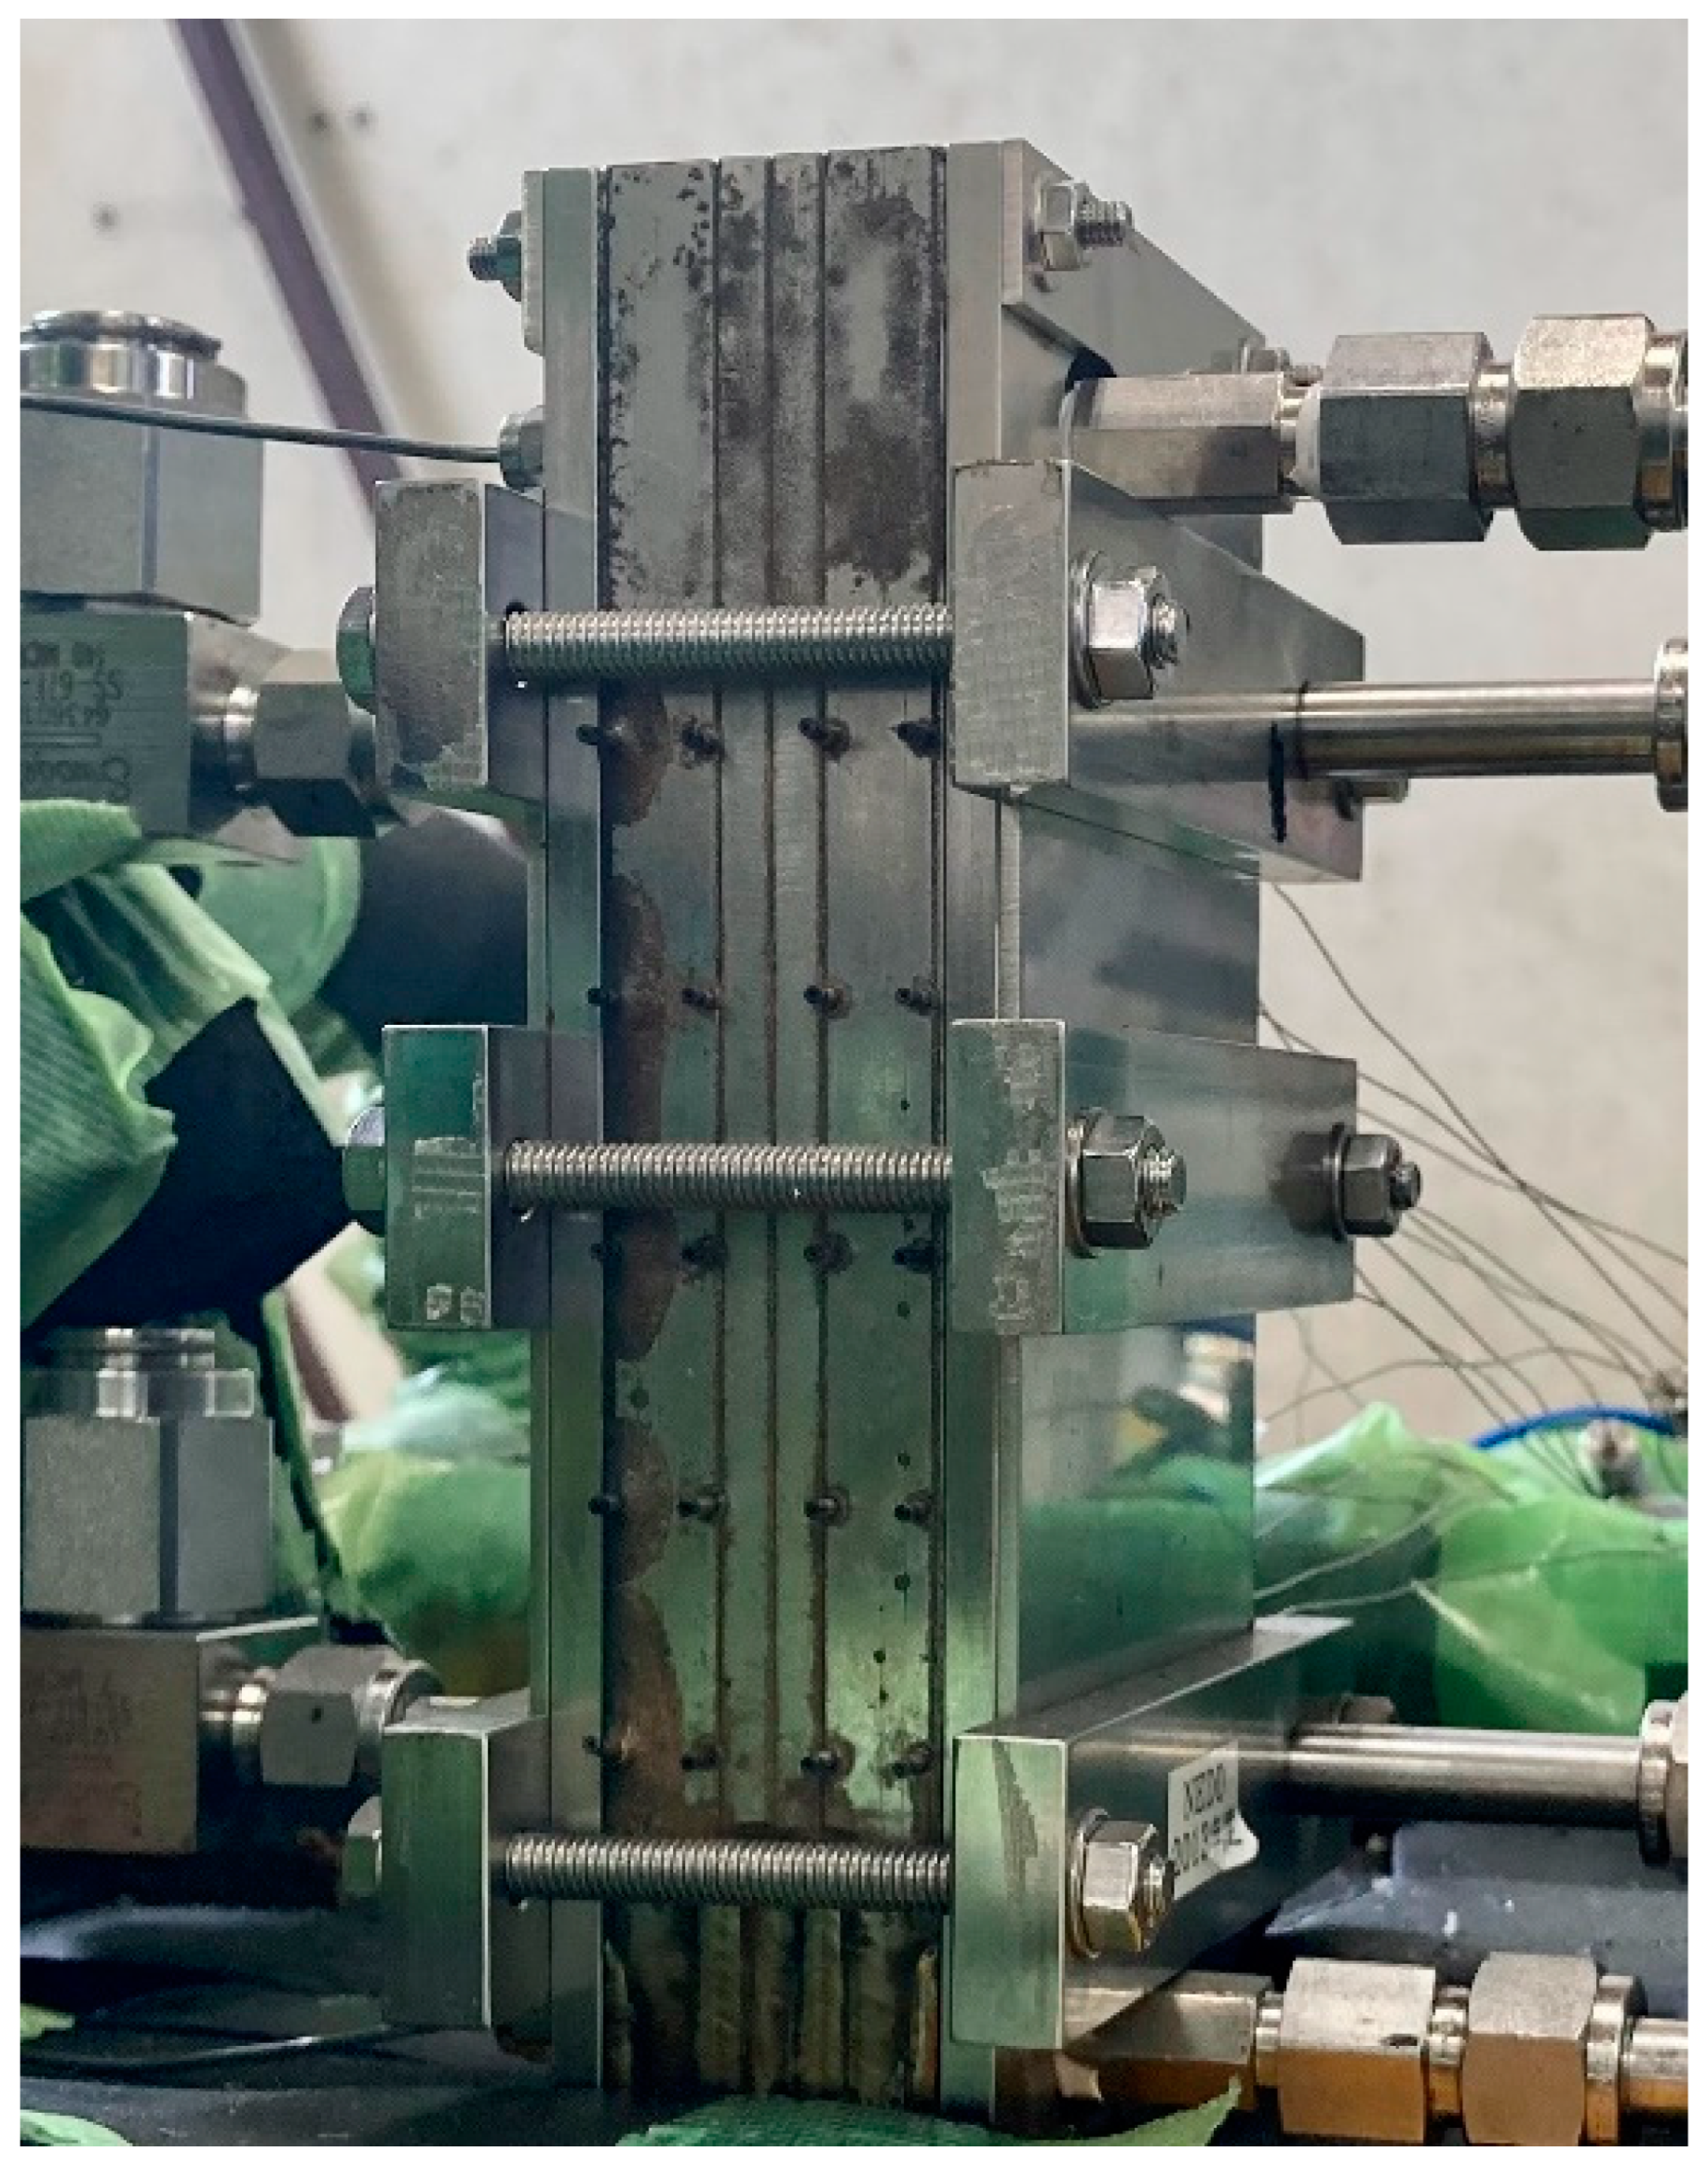
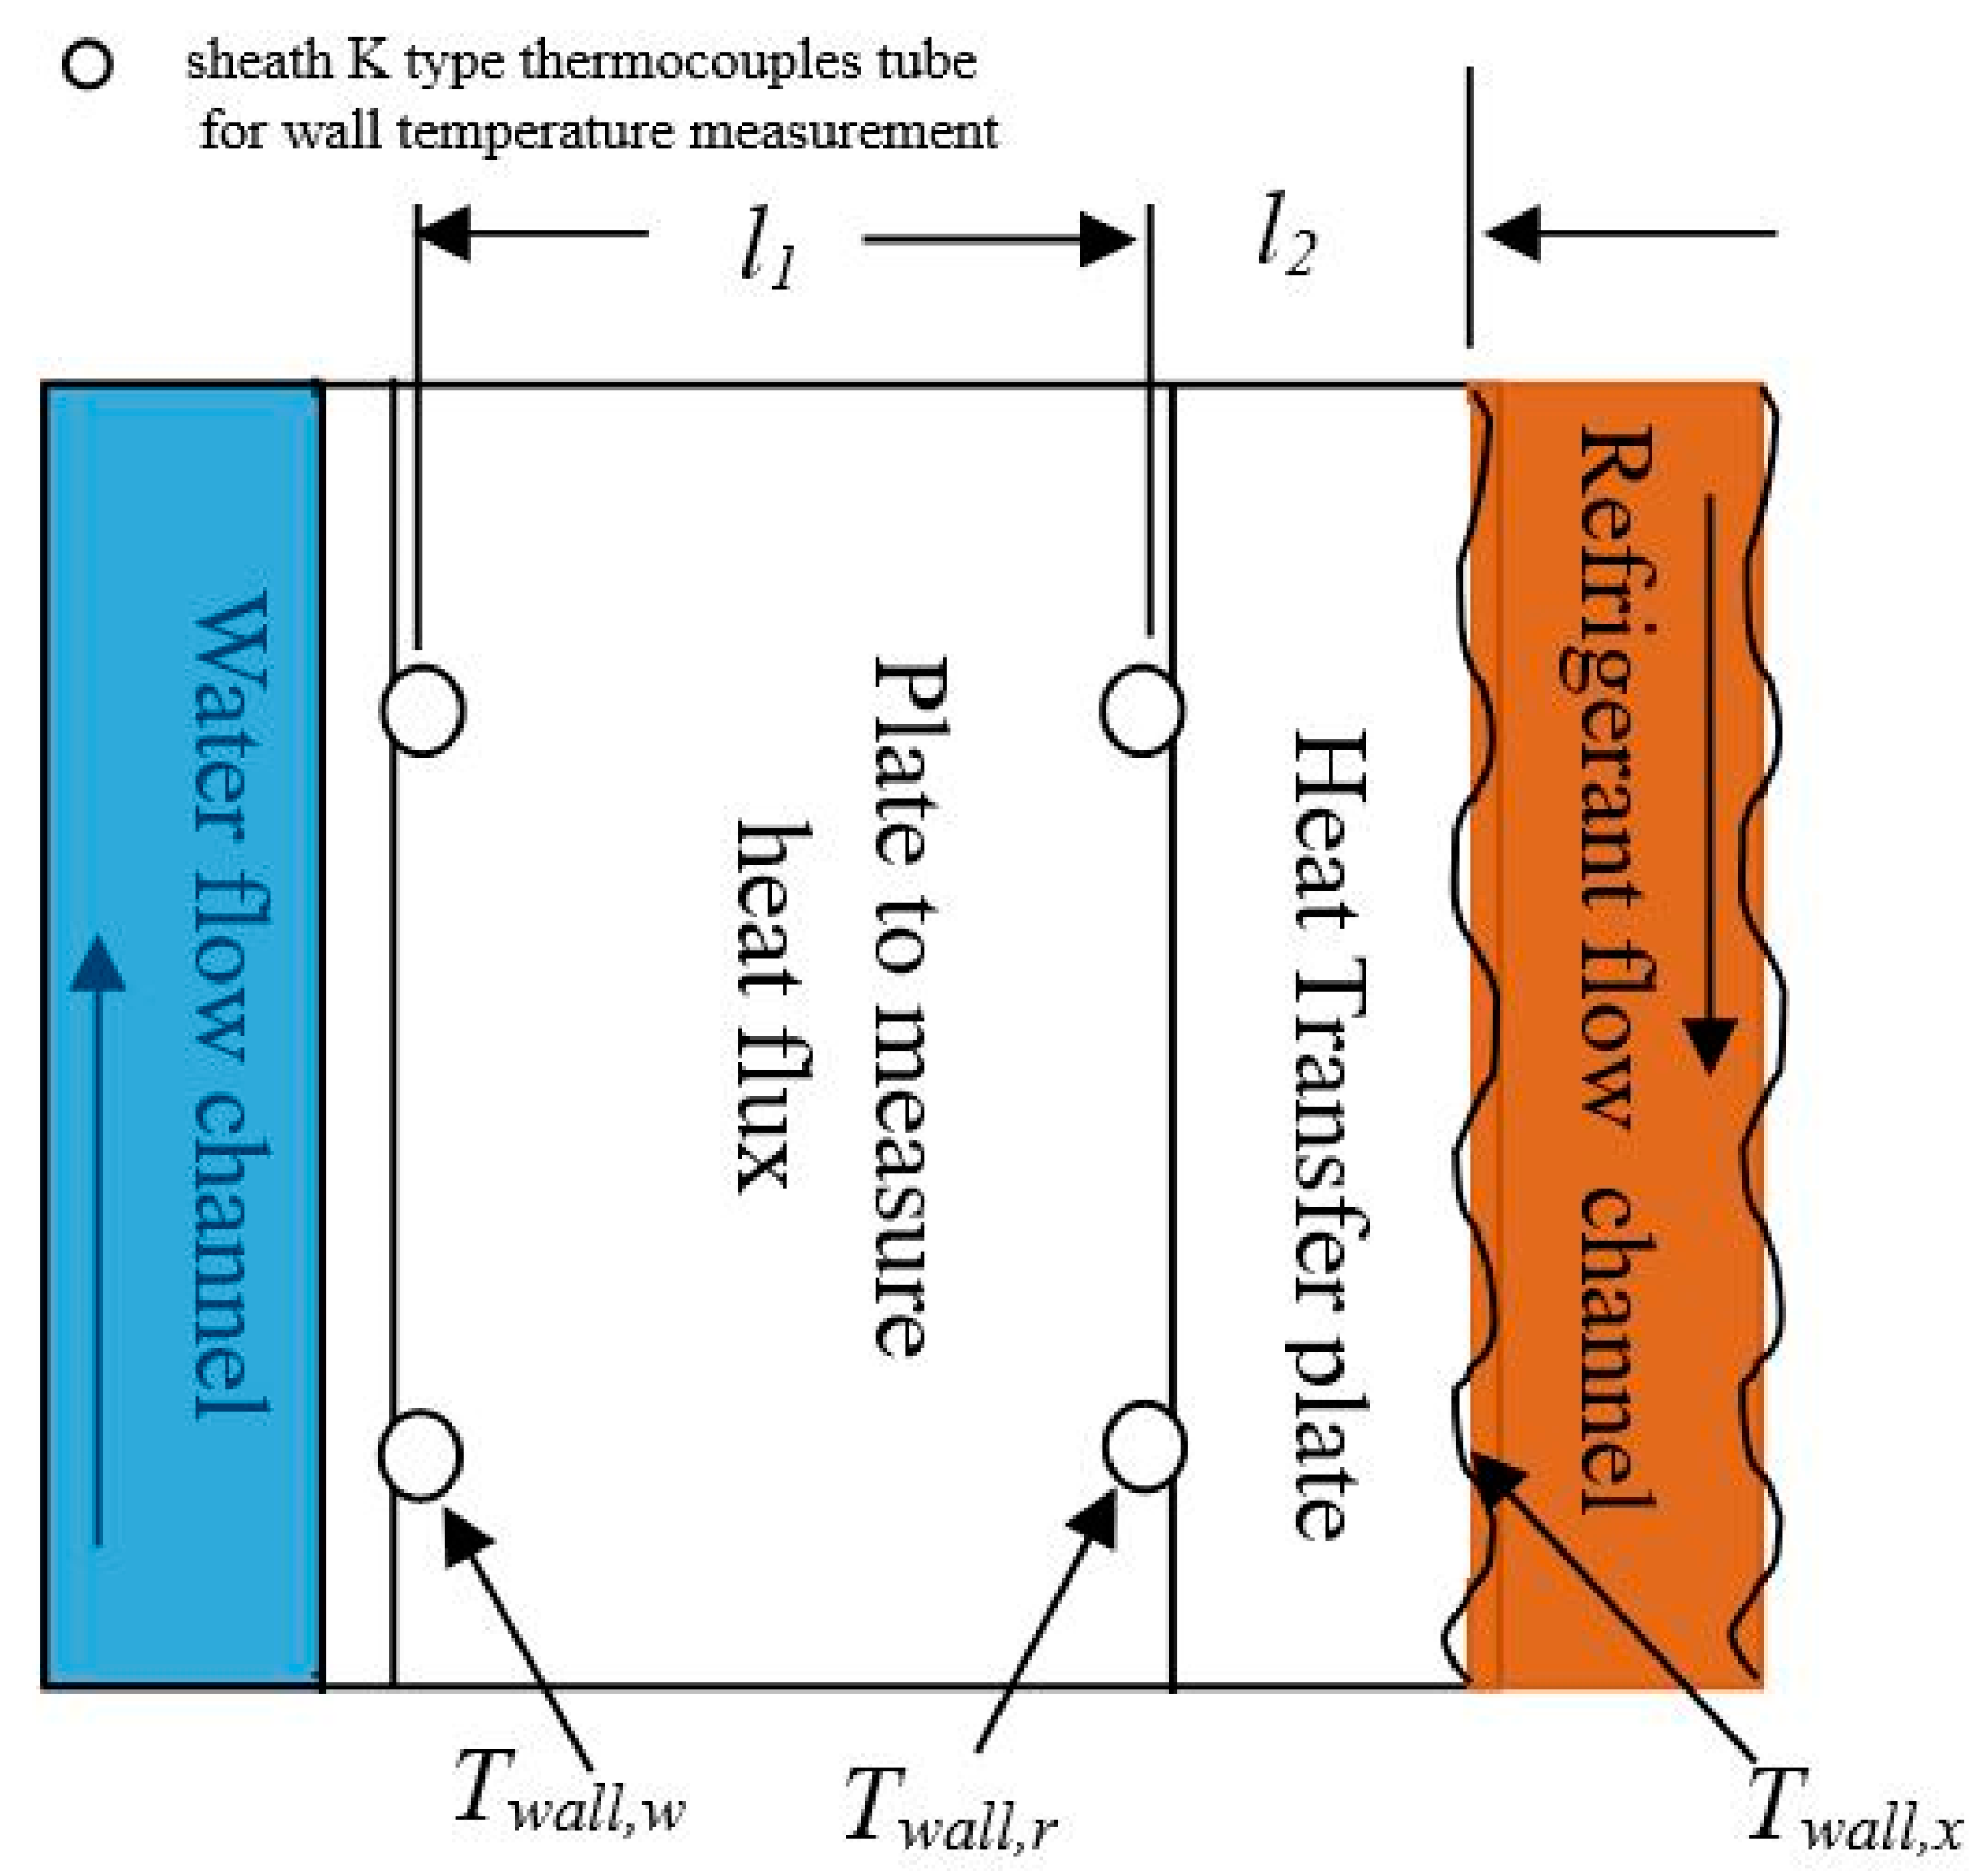
The specially designed test section [
25] used in this study, as shown in
Figure 3, was constructed with 8 stainless steel plates (material SUS303) brazed to each other. Among these, two were processed chevron plates with a 60° angle.
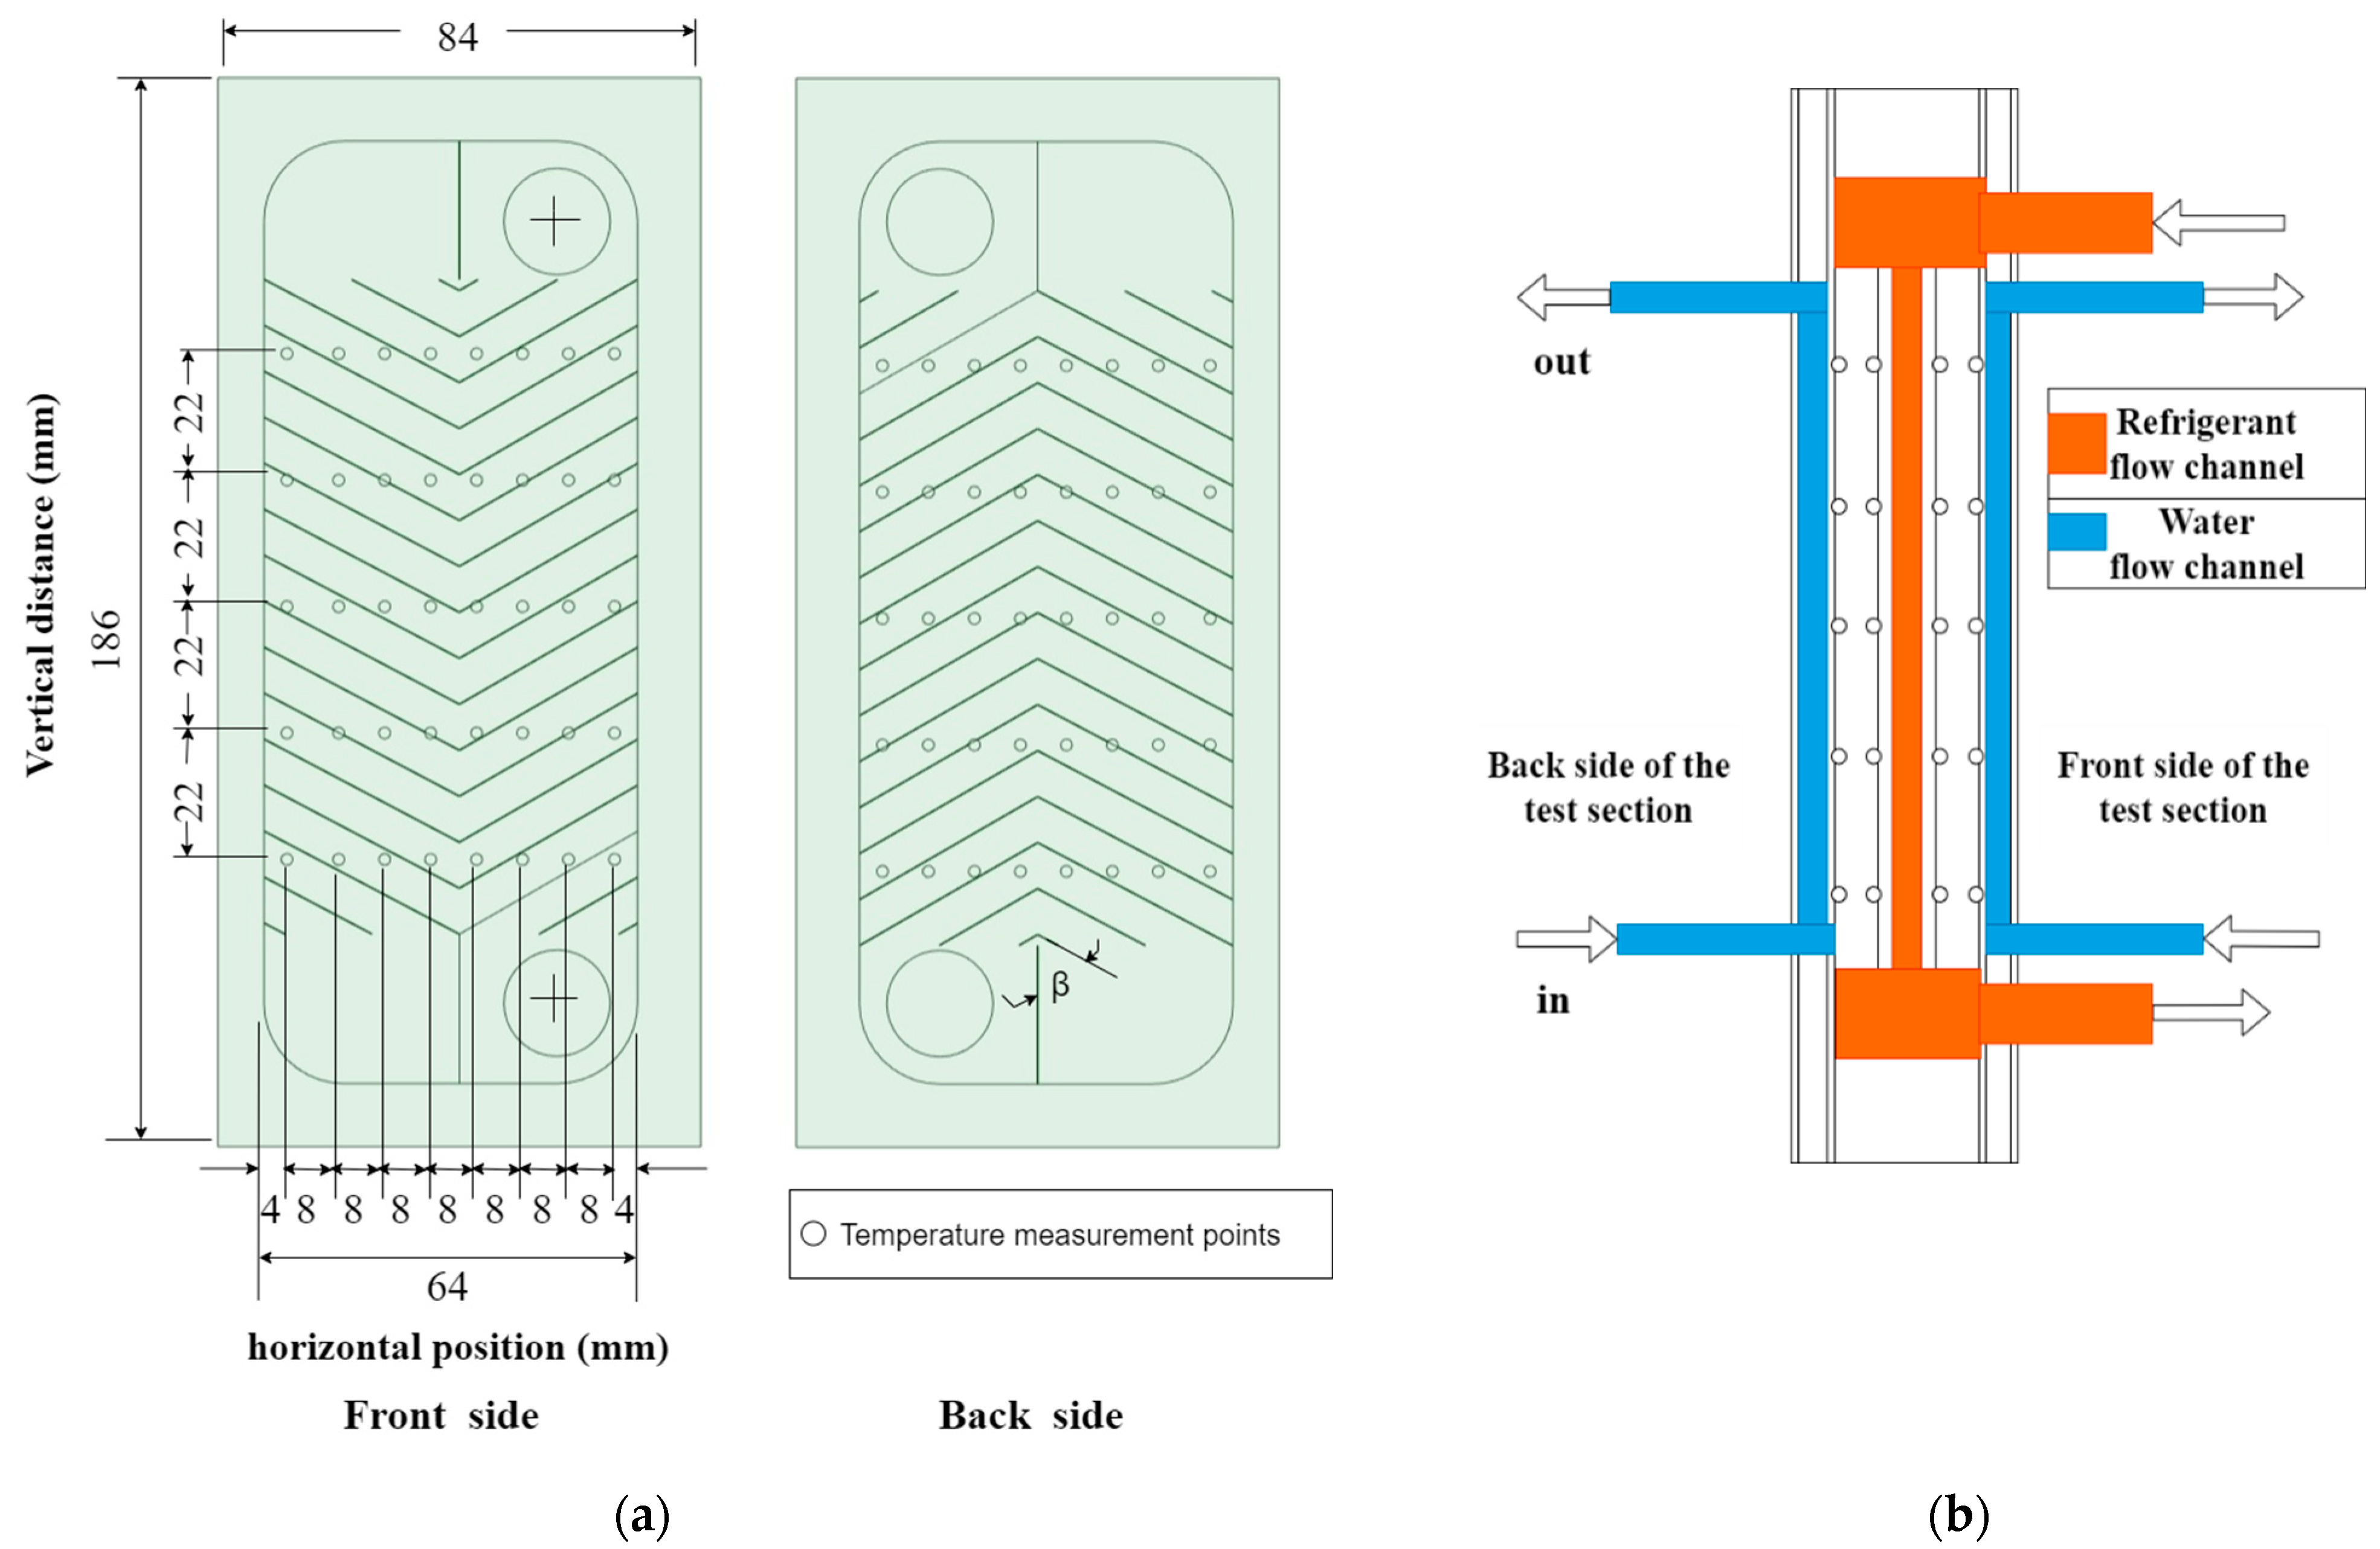
The flow of the refrigerant occurs in the channel created by the space between these two chevron plates. Two flat plates were set for heat transfer measurements next to the chevron-shaped plates. The other four plates were dedicated to forming two water flow channels. The red and blue regions, shown in
Figure 4b, indicate, respectively, the refrigerant and cooling water channels.
Table 3 shows the geometrical characteristics of the test section. The dimensions of the plates were 186 mm, 84 mm, and 5 mm, respectively. The chevron plates had a corrugation pitch of 5.6 mm, a depth of 1.5 mm, and a chevron angle of 60°. The length between the inlet and outlet port centers was 136 mm, with each connection port having a diameter of 18.5 mm. The two processed chevron plates forming the refrigerant channel had a height and width of 117.5 mm and 64 mm, respectively. Five straight grooves were machined at both outsides of the plate (dedicated to measuring heat flux) perpendicular to the flow direction. A stainless-steel tube with an outer diameter of 1.6 mm was inserted into each groove and brazed. Sheath K-type thermocouples with a diameter of 0.5 mm were inserted in the small tubes for the measurement of wall temperatures and heat fluxes.
The locations of the temperature measurement points were set vertically at 14.75, 36.75, 58.75, 80.75, and 102.75 mm from the bottom port of the plate. The horizontal arrangements of the measurement points were 4, 12, 20, 28, 36, 44, 52, and 60 mm from the end face of the cross-section, shown in
Figure 4a. The wall temperatures were measured at a total of 160 points during the experiment, with 4 sets of 5 points in the vertical direction and 8 points in the horizontal direction of the test section. The heat flux across the plate and the local heat transfer coefficients were calculated by the values of the set thermocouples on the surface of the plates in
Figure 4b.
2.3. Water Loop for Preheater
The preheater was a brazed PHE. Hot water flowing through the outer passageways heated the liquid CF3I flowing through the inner passage in the preheater to achieve the desired conditions at the inlet of the test section. The test section, the preheater, and the connecting pipe between them were all thermally insulated. A 34 L hot water thermostatic bath with 6.0 kW heaters made up the hot water loop for the preheater. The hot water was then sent to the preheater using a water pump with an inverter at a certain water flow rate. A bypass water valve was also used to adjust the flow rate.
2.4. Water Loop for Test Section
A constant temperature water bath with a 3.6 kW heater was included in the water loop in the system to precisely control the water temperature intended for circulating cold water through the test section. Cold water was driven at a predetermined flow rate to the plate heat exchanger using a pump with an inverter. The water flow rate could also be adjusted using a different bypass valve.
2.5. Water Loop for Condenser
The condenser that had the role of adjusting the pressure of the entire experimental setup included a water loop as well. By changing the temperature of the refrigerant in the condenser, the pressure could be set to the experimental conditions.
2.6. Water Brine Loop for Subcooler
A water brine loop was designed for subcooling the CF3I refrigerant coming from the condenser. A pump drove the water brine to the subcooler at a predetermined flow rate. The flow rate of the water brine was also adjustable by using a bypass valve.
2.7. Data Acquisition
A Keithley 3700 system switch data logger was combined with a personal computer in the data acquisition unit. Temperature and voltage data were recorded using the data logger. The water flow meter and differential pressure transducer required a power supply as a driver to output an electric current. The Kickstart® 2020 interface was used to link the data logger to the computer, allowing all measured data from the data logger to be transmitted to the computer and subsequently analyzed using a spreadsheet.
2.8. Experimental Procedure
In each experiment, the system pressure in the experimental setup was first maintained at a specified level by adjusting the temperature in the condenser. The temperature and flow rate of the hot water loop for the preheater was then adjusted to obtain the desired vapor quality of CF3I at the inlet of the test section. Finally, the heat transfer rate between the counter flow channels in the test section could be varied by changing the temperature and flow rate in the water loop for the test section. The temperature and pressure of the flow fluctuated with any change to the system variables. The time it took to attain a statistically stable state condition was between 20 and 100 min. The data acquisition unit was then started, and it scanned every data channel 10 times in 40 s. To determine the heat transfer coefficient, the mean values of the data for each channel were collected. To ensure that the corresponding heat transfer occurs, the water flow rate in the test section should be high enough to provide a turbulent flow on the water side. Furthermore, the flow velocity of water in the test section should be high enough to provide a turbulent flow on the water side, allowing the related heat transfer to balance the condensation heat transfer on the refrigerant side.
4. Results and Discussion
The heat transfer coefficients (both local and average) of the plate heat exchanger were determined for the condensation experiment with CF
3I refrigerant. The condensation heat transfer experiments were carried out at mass fluxes of 20 kg/m
2s and 50 kg/m
2s, saturation temperatures of 25–30 °C, and heat fluxes of 10.4–13.7 kW/m
2. The flow direction of the refrigerant was downward and the flow direction for the water side of the test section was counter to the refrigerant flow, i.e., the water was flowing upwards at both sides of the only refrigerant channel, as if sandwiched. The experimental conditions for the condensation heat transfer in the plate heat exchanger are shown in
Table 5.
The results for the heat transfer coefficients at the corresponding measurement points are described with respect to the horizontal distance for both the front sides and back sides of the plates. These plates formed the refrigerant flow channel in the test section. The measured results are provided to show how the local condensation heat transfer coefficient changes with the vapor quality in the test section for different flow and thermal conditions. The local heat flux and the local wall temperature distribution inside the test plates are also shown. The experimentally obtained average heat transfer coefficients of CF3I are compared with those of R1234yf in the same test facility and with available correlations from the literature. A newly proposed correlation is considered to predict all the experimental data reported in the work.
4.1. Condensation at Mass Flux G = 20 kg/m2s
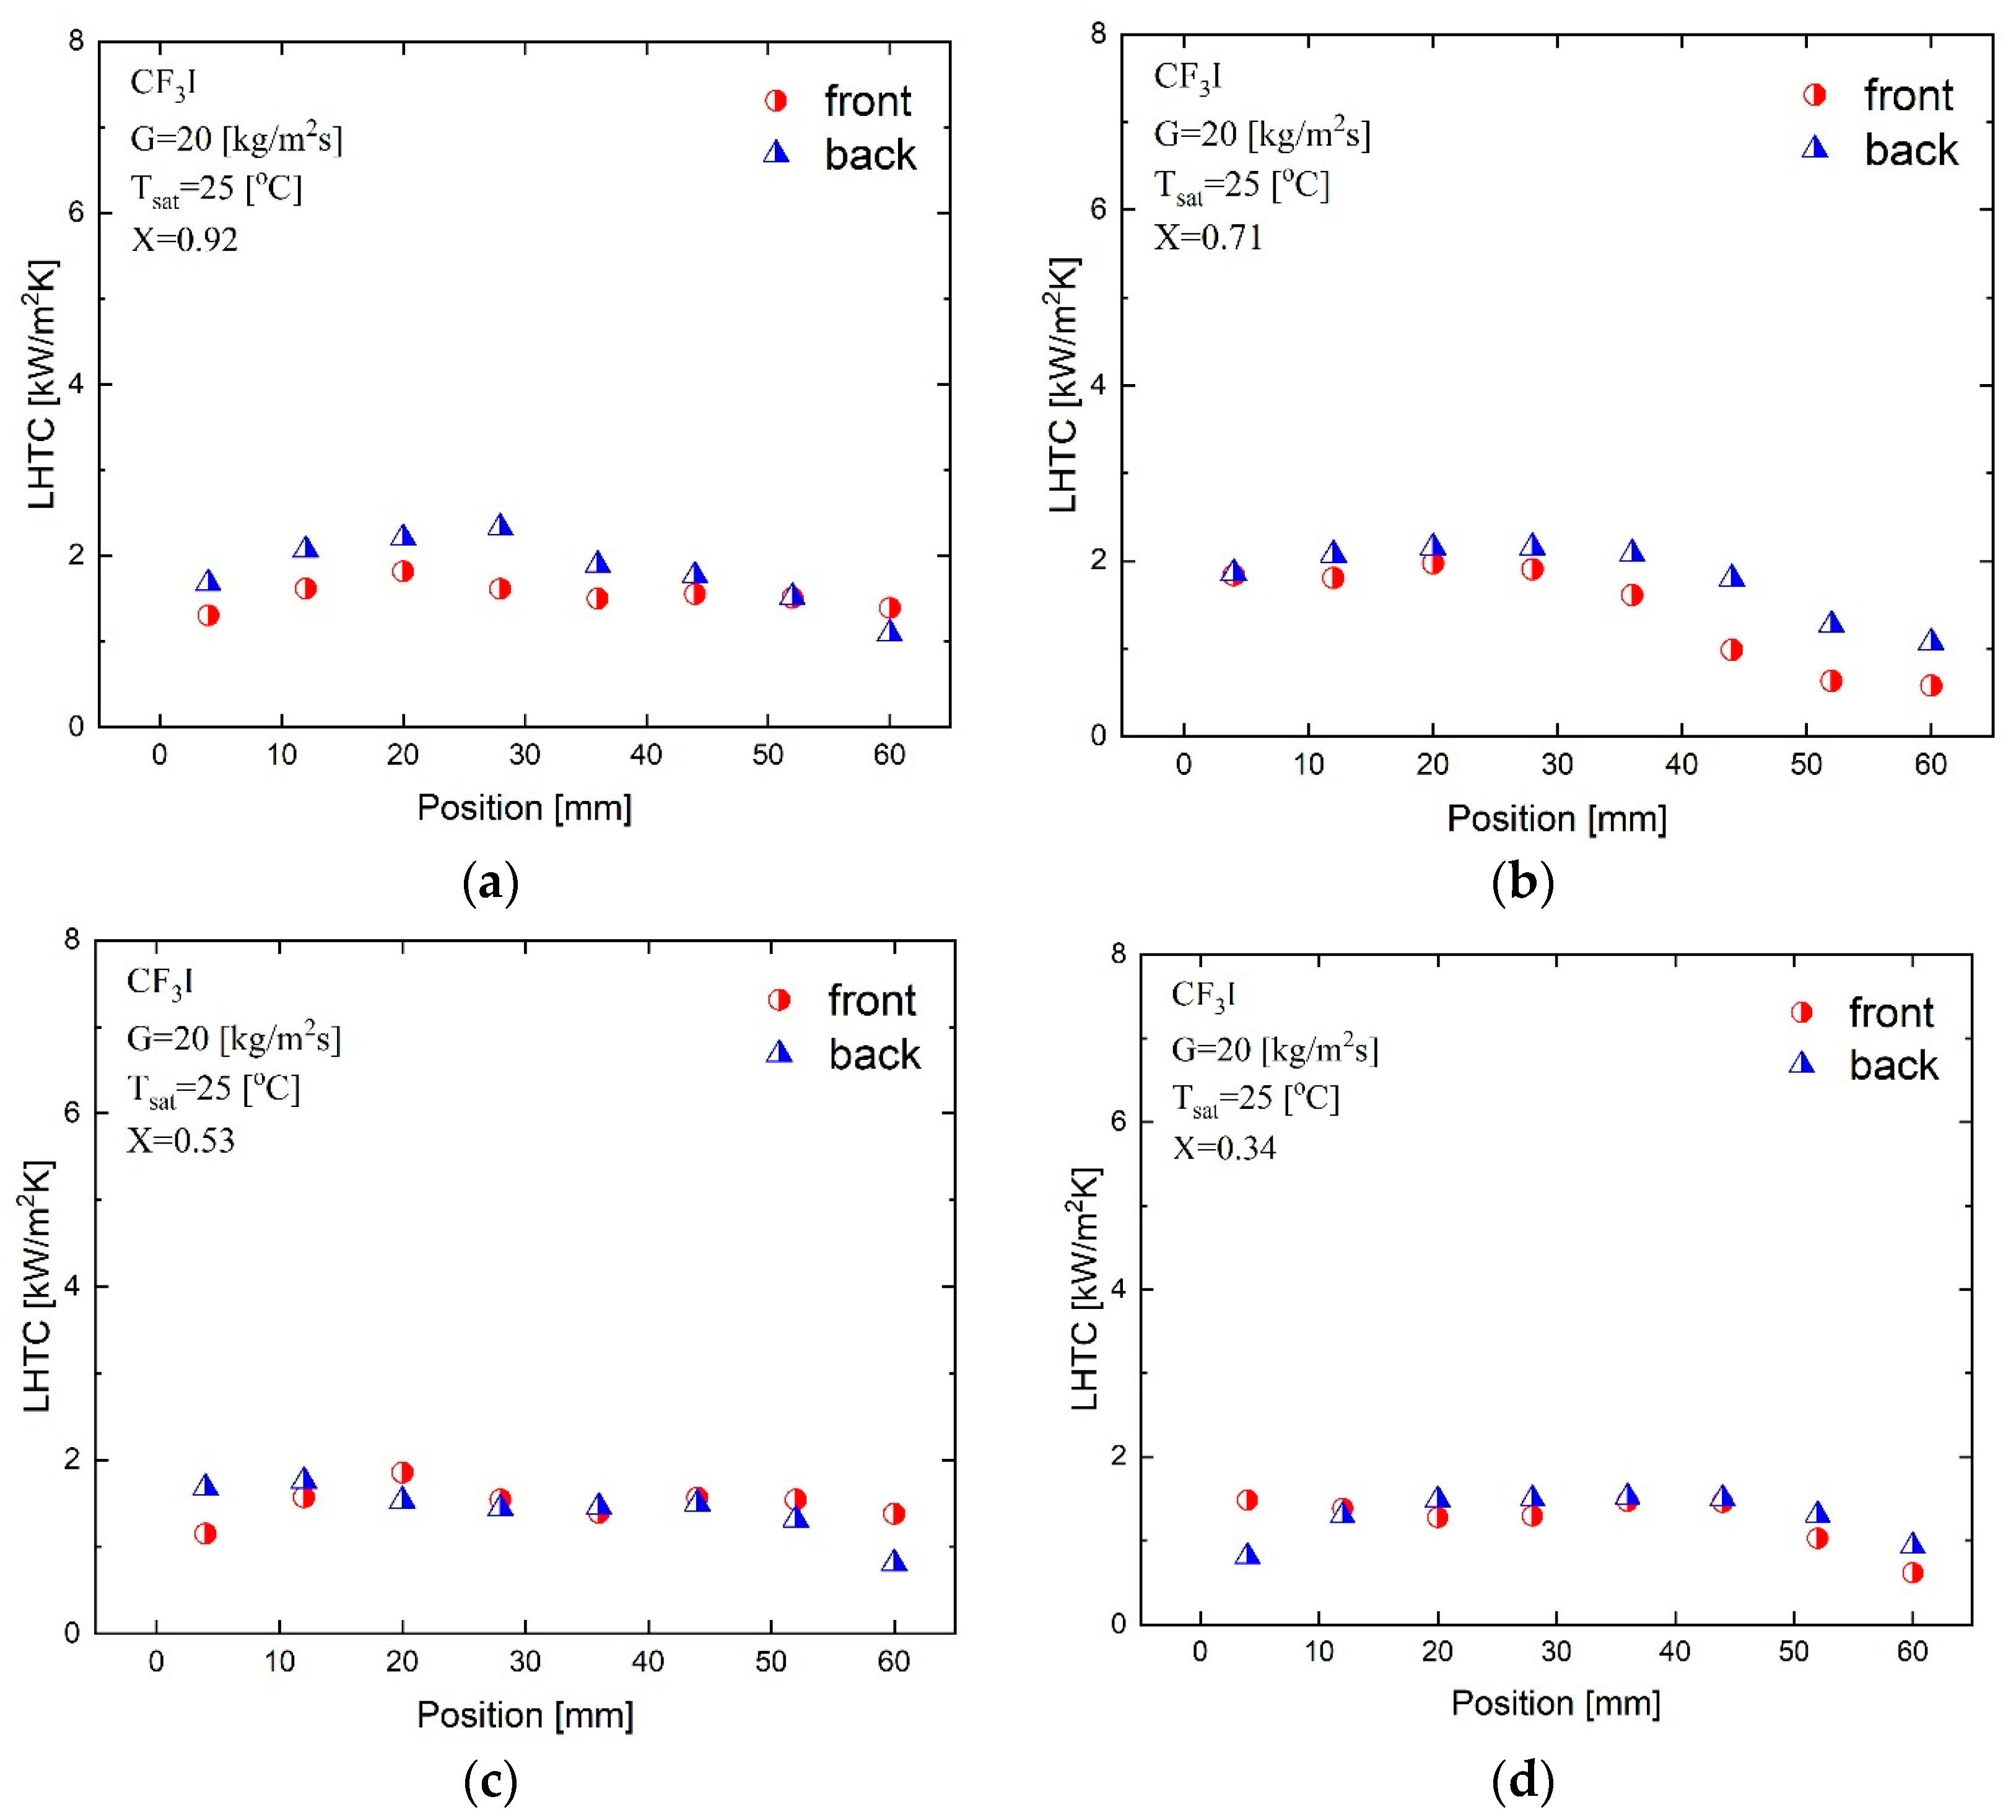
Figure 6 explains the variation of the local heat transfer coefficient on the front and back sides of the plate for the condensation experiment with the CF
3I refrigerant at
x = 0.92, 0.71, 0.53, and 0.34, respectively, for the mass flux of 20 kg/m
2s, an inlet saturation temperature of 25 °C and a maximum heat flux of 12.8 kW/m
2.
These data indicate that the local condensation heat transfer coefficient is greater for the higher vapor qualities of
x = 0.92 and 0.71. However, there were some significant differences in the local heat transfer coefficients from the front and back side plates at horizontal distances of 28 mm and 36 mm and a vapor quality of 0.92. For a vapor quality of 0.71, the heat transfer coefficient of the back side of the test section plate was higher than that of the front side at horizontal distances from 36 mm to 54 mm. As shown in
Figure 4a, the chevron direction is different on the front and back sides of the plate. On the front side plate, the chevron corrugations act to collect condensate to the center part of the plate. On the back side plate, the chevron corrugations act to diverge the condensate on the center part of the plate. Because a thinner condensate film gives a higher heat transfer coefficient, the back side plate tends to give a higher heat transfer coefficient. Of course, the condensate flows on the front and back side plates interact with each other, and the heat transfer coefficients show opposite values or similar values downstream. The values of the local heat transfer coefficient in the horizontal direction show similar trends in the condensation experiment, with minimum values at the edges and maximum values in the middle [
29].
Figure 7 illustrates the horizontal average condensation heat transfer coefficient for a mass flux of 20 kg/m
2s and a maximum heat flux of 12.8 kW/m
2 in relation to vapor quality at the front and back sides of the PHE. These heat transfer coefficients were obtained from the average heat transfer coefficient data at various positions in horizontal distances for the front and back side, respectively, at a certain vapor quality.
The results show that the heat transfer coefficient decreased with decreasing vapor quality because, in condensation experiments, lower vapor quality results in a thicker liquid film that reduces the heat transfer efficiency. The heat transfer coefficient of the back side of the PHE is slightly higher than that of the front side at higher vapor qualities. Specifically, a significant difference was observed in the vapor qualities of 0.71 and 0.92. The condensation heat transfer coefficient at the vapor quality of 0.92 is about 30% higher than that at 0.13 for the front side of PHE. Also, the condensation heat transfer coefficient at the vapor quality of 0.71 is about 40% higher than that at 0.35 for the back side of PHE. This difference between front heat transfer coefficient and back heat transfer coefficient is due to the effect of plate geometries of the test section, as explained in
Figure 6.
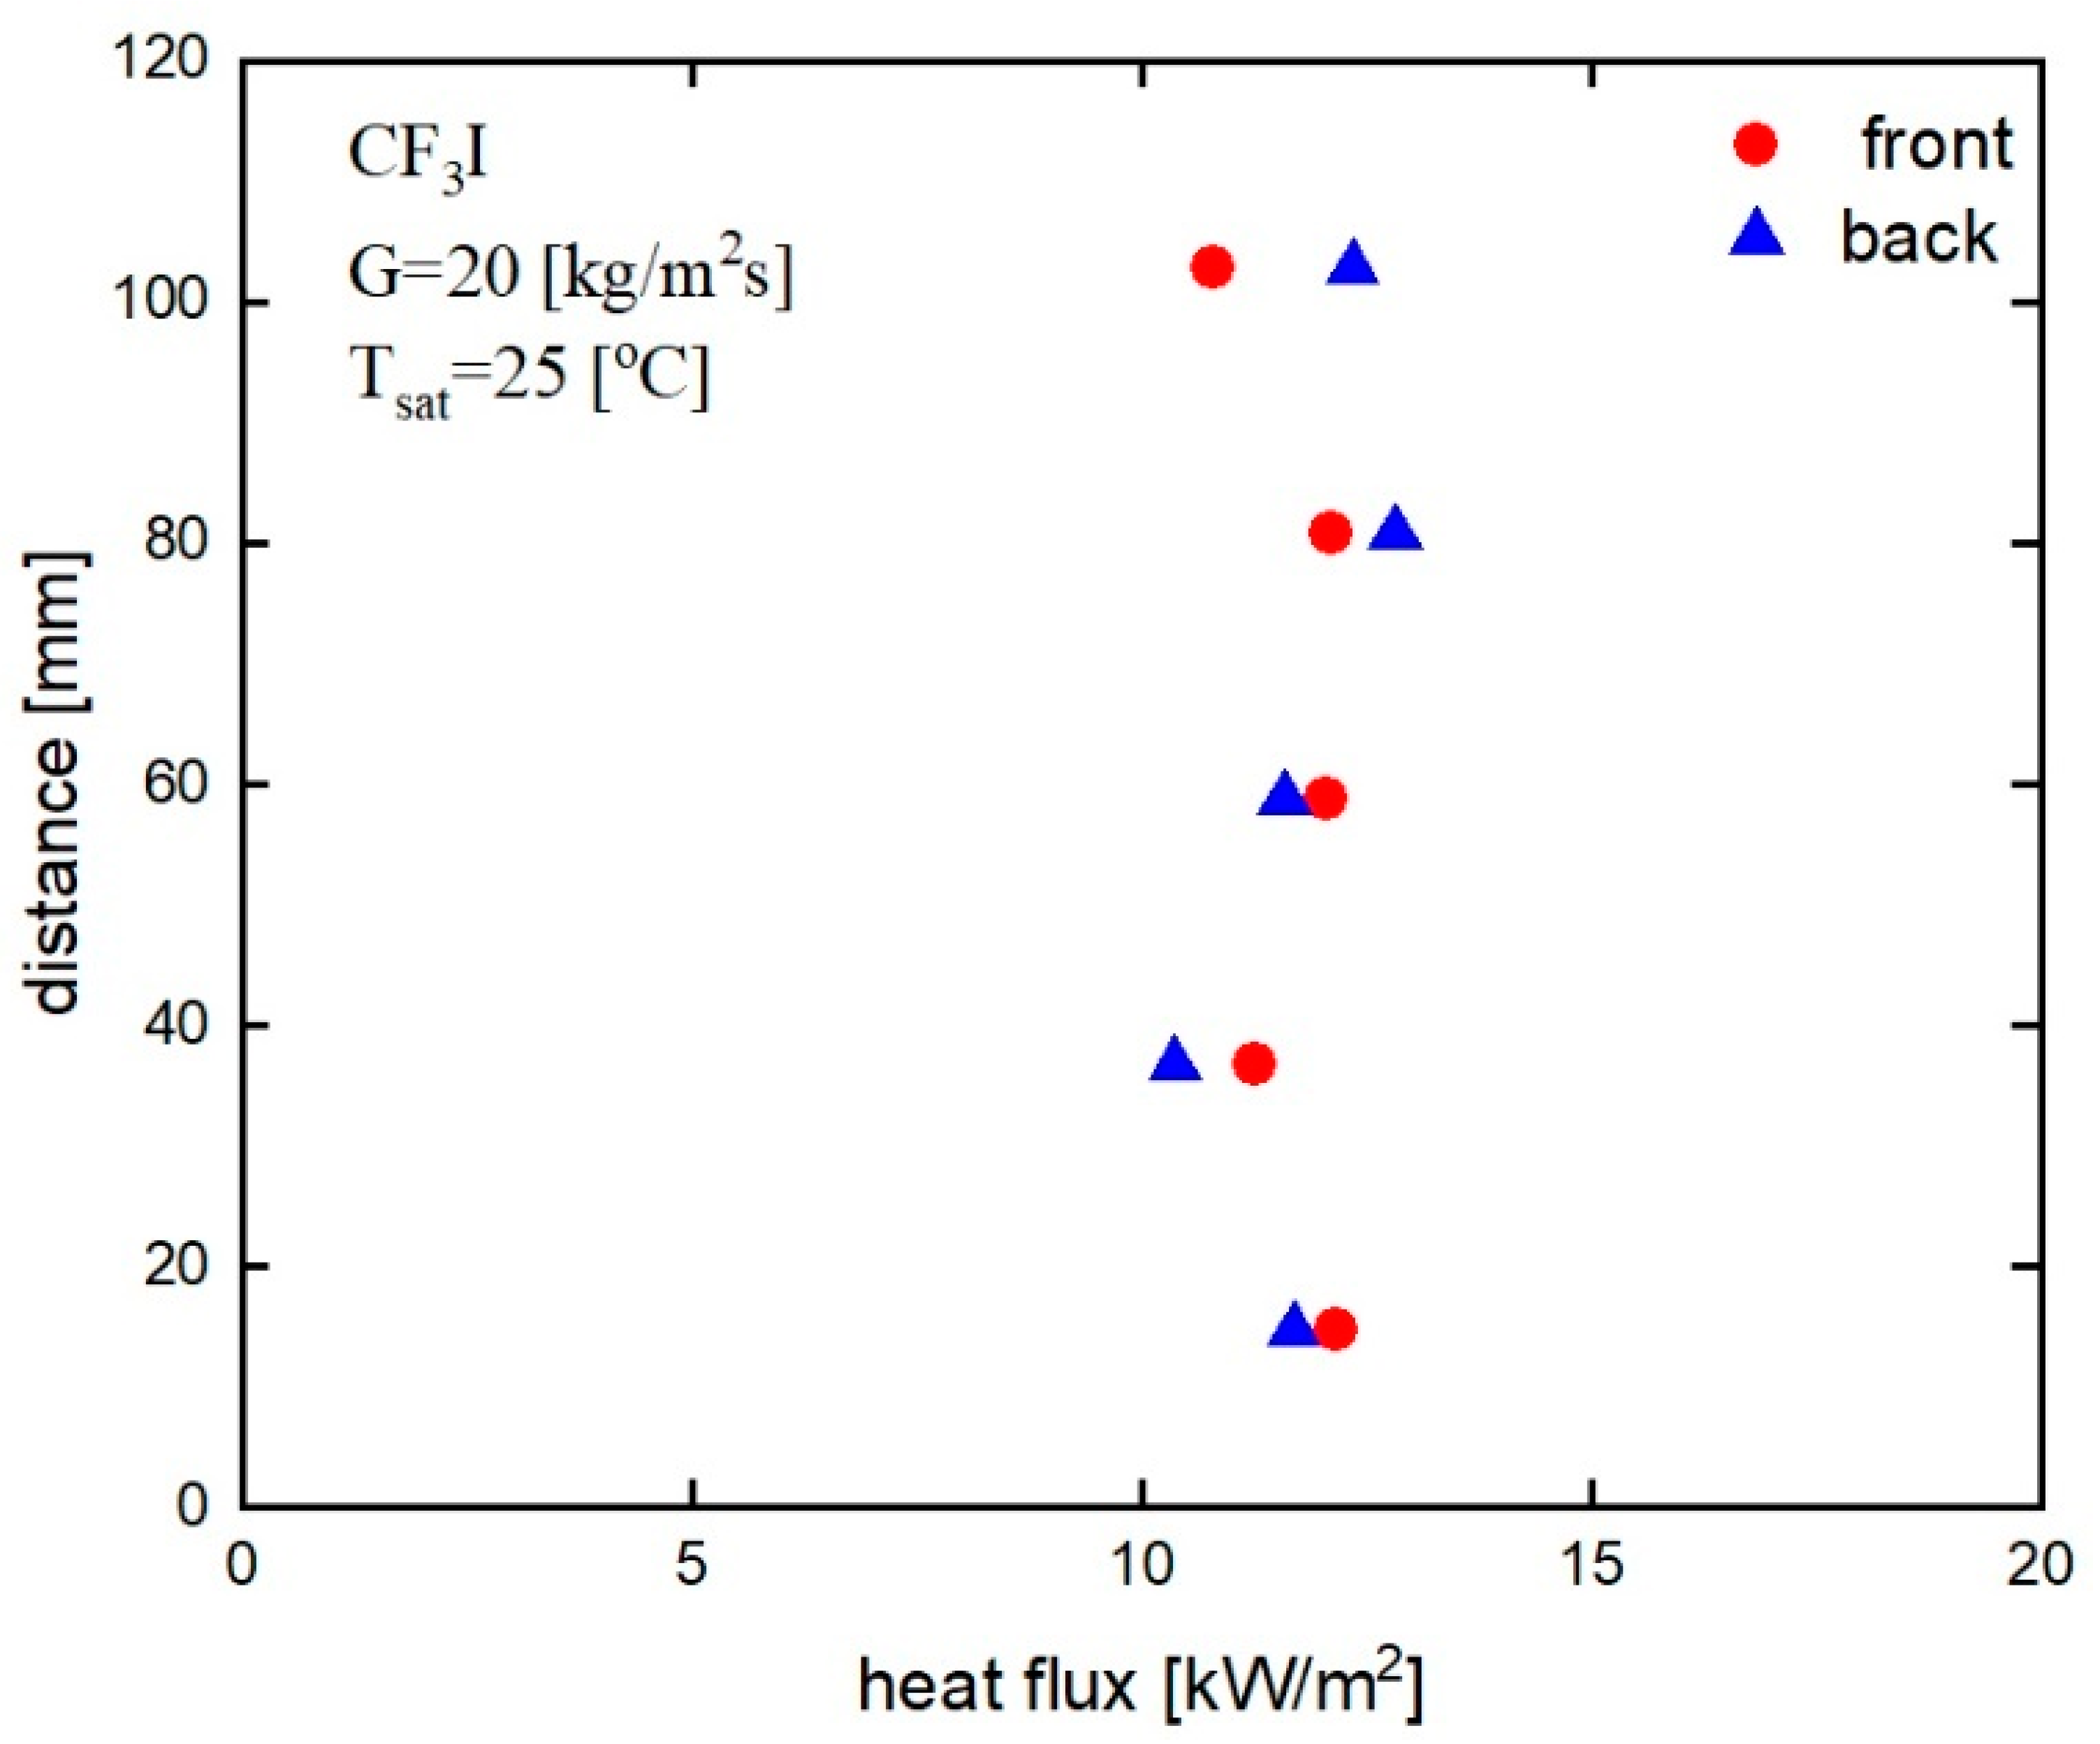
Figure 8 indicates the variation of local heat flux with distance from the inlet to the outlet of the PHE, i.e., along the vertical cross-section of the PHE at a mass flux of 20 kg/m
2s, a saturation temperature of 30 °C, and a horizontal position of 12 mm from the end face of the cross-section of the test plates. There is no significant difference in the local heat flux found for the front and back sides of the PHE except at the inlet (117.5 mm from the bottom port of the test section) where the back side heat flux is slightly higher than that of the front side. This also signifies that the heat transfer coefficients in the condensation inlet and the very next measurement point of the back side of the PHE (at vapor quality 0.92 and 0.71) are higher than those of the front side, which has already been discussed in
Figure 6 and
Figure 7. Hence, it is observed that the heat flux follows a similar trend with the local heat transfer coefficient and vapor quality in a certain mass flux. The local heat flux varies from 10.4 kW/m
2 to a maximum of 12.8 kW/m
2 in the PHE for condensation heat transfer for the mass flux of 20 kg/m
2s.
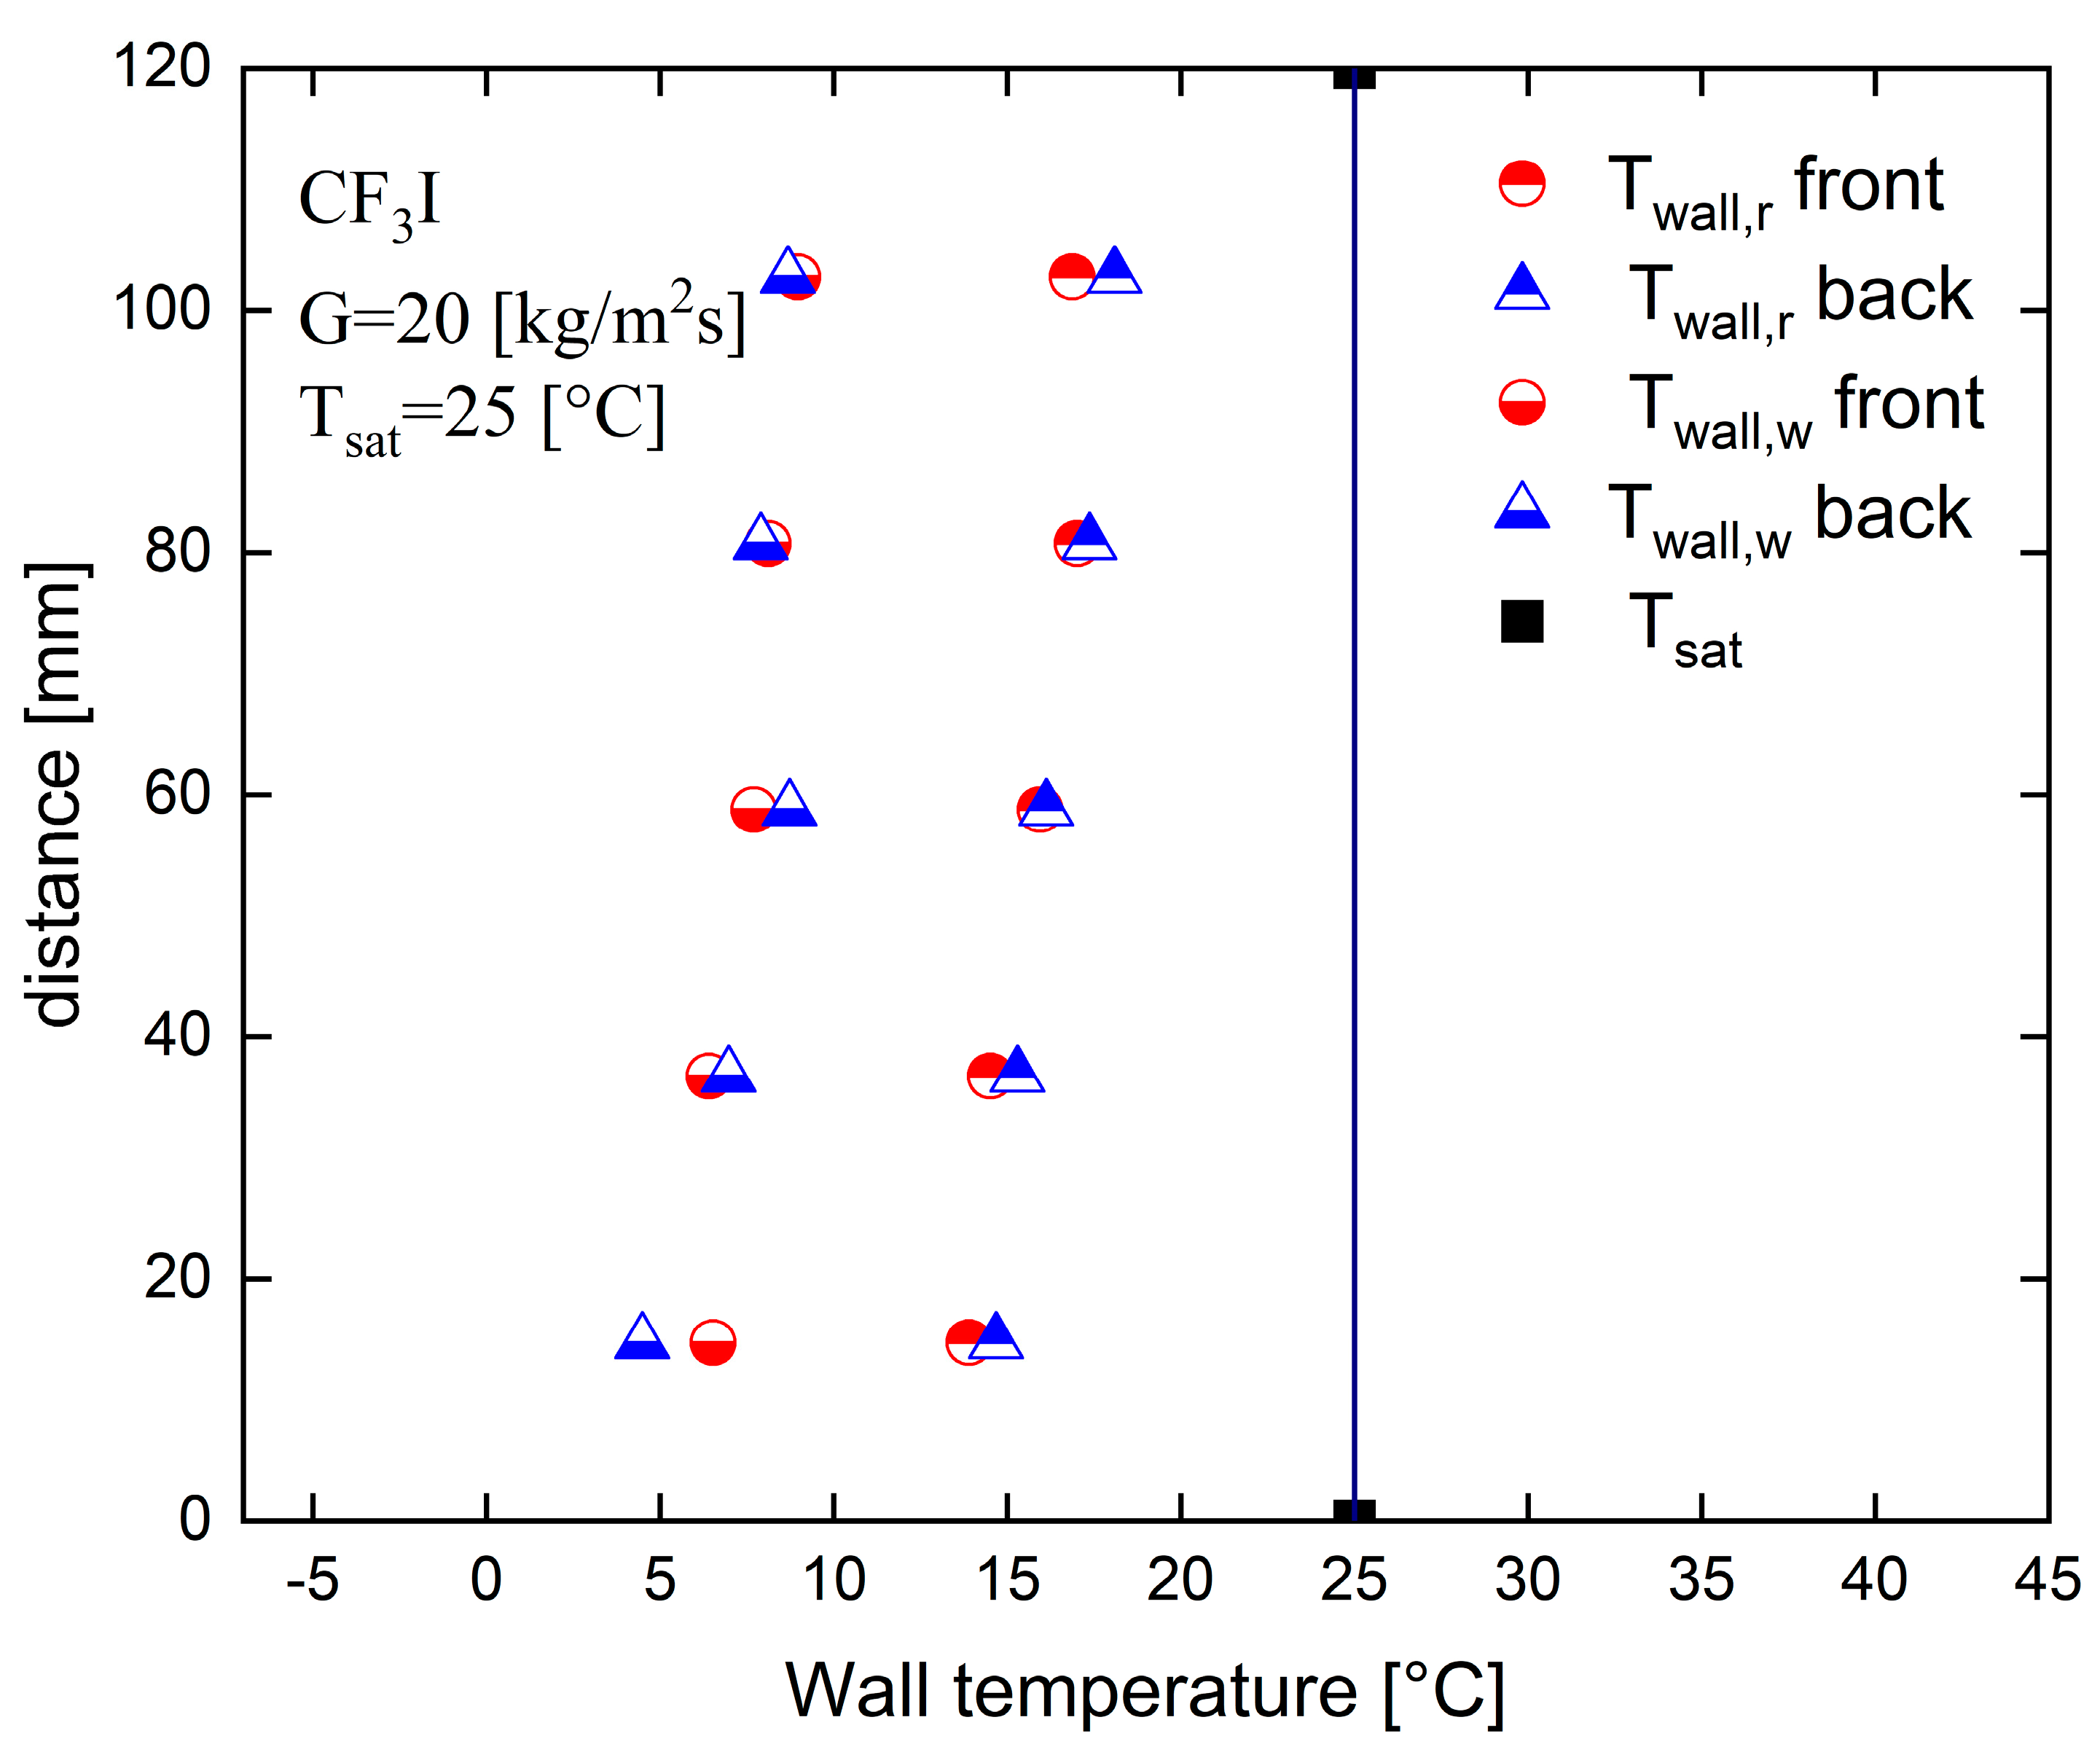
Figure 9 shows the variation of the local wall temperature with the distance from the inlet to the outlet of the test section for a mass flux of G = 20 kg/m
2s, saturation temperature of 25 °C, a maximum heat flux of 12.8 kW/m
2, and at a horizontal position of 12 mm from the end face of the cross-section of the test plates. The measured local wall surface temperatures of the water side and the refrigerant side are plotted for both the front and back side of the PHE. The wall surface temperatures were observed to decrease gradually toward the distance downstream of the condensation process, similar to the observation of Mahmud et al. [
27]
4.2. Condensation at Mass Flux G = 50 kg/m2s
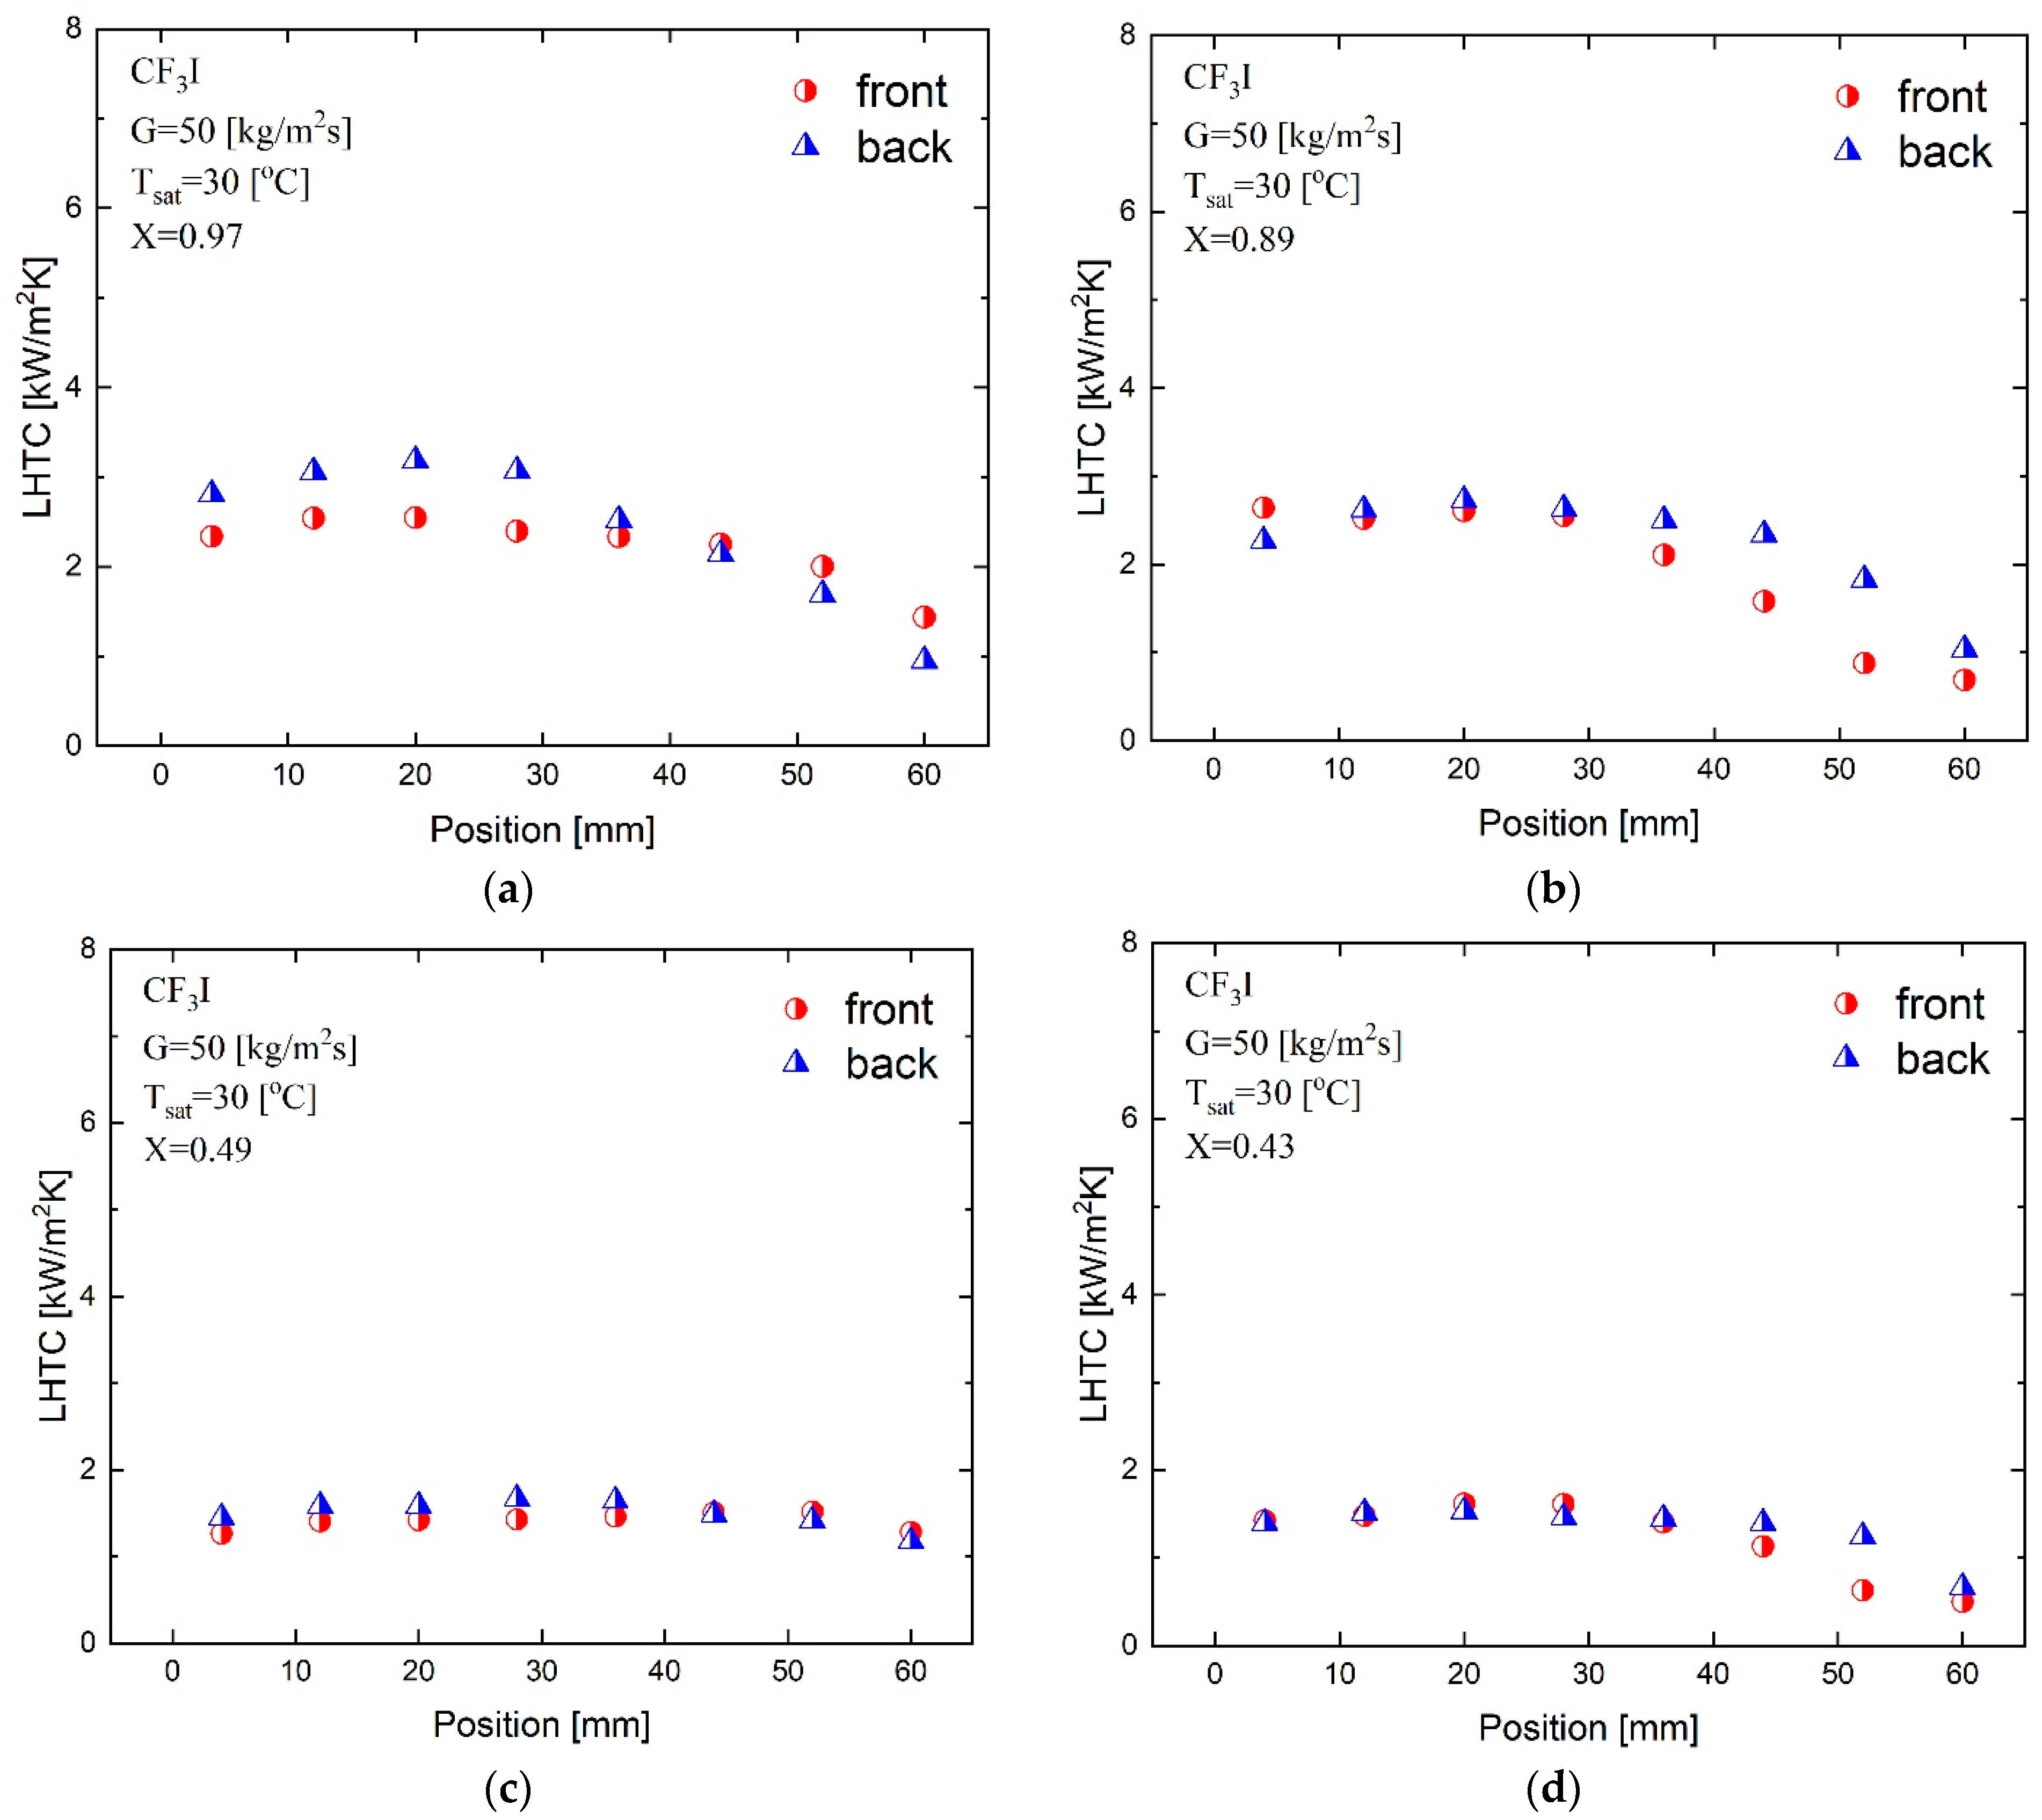
Figure 10 explains the variation of local heat transfer coefficients on the front and back sides of the plate for the CF
3I condensation experiment at
x = 0.97, 0.89, 0.49 and 0.43, respectively, for a mass flux of 50 kg/m
2s, at an inlet saturation temperature of 30 °C, and a maximum heat flux of 13.7 kW/m
2. These data indicate that the local condensation heat transfer coefficient increases with the vapor quality. There is also a significant difference in the local heat transfer coefficient on the front and back sides of the test section, at horizontal distances from 12 mm to 28 mm, and at a high vapor quality of 0.97. Also, at a vapor quality of 0.89 the heat transfer coefficient of the back side of the plate of the test section is higher than that of the front side at the horizontal distances of 44 mm to 52 mm. The front and back sides of the plate have distinct chevron directions, as shown in
Figure 4a. The chevron corrugations on the front side plate act to direct condensate to the center part of the plate, whereas the chevron corrugations on the back side plate act to diverge the condensate on the center part of the plate. Because a thinner condensate film gives a higher heat transfer coefficient, the back side plate tends to give a higher heat transfer coefficient. The condensate flows on both the front and back side plates simply interact with one another, and the heat transfer coefficients in the downstream region exhibit opposing values or comparable values. An almost similar trend is observed as for a mass flux of 20 kg/m
2s.
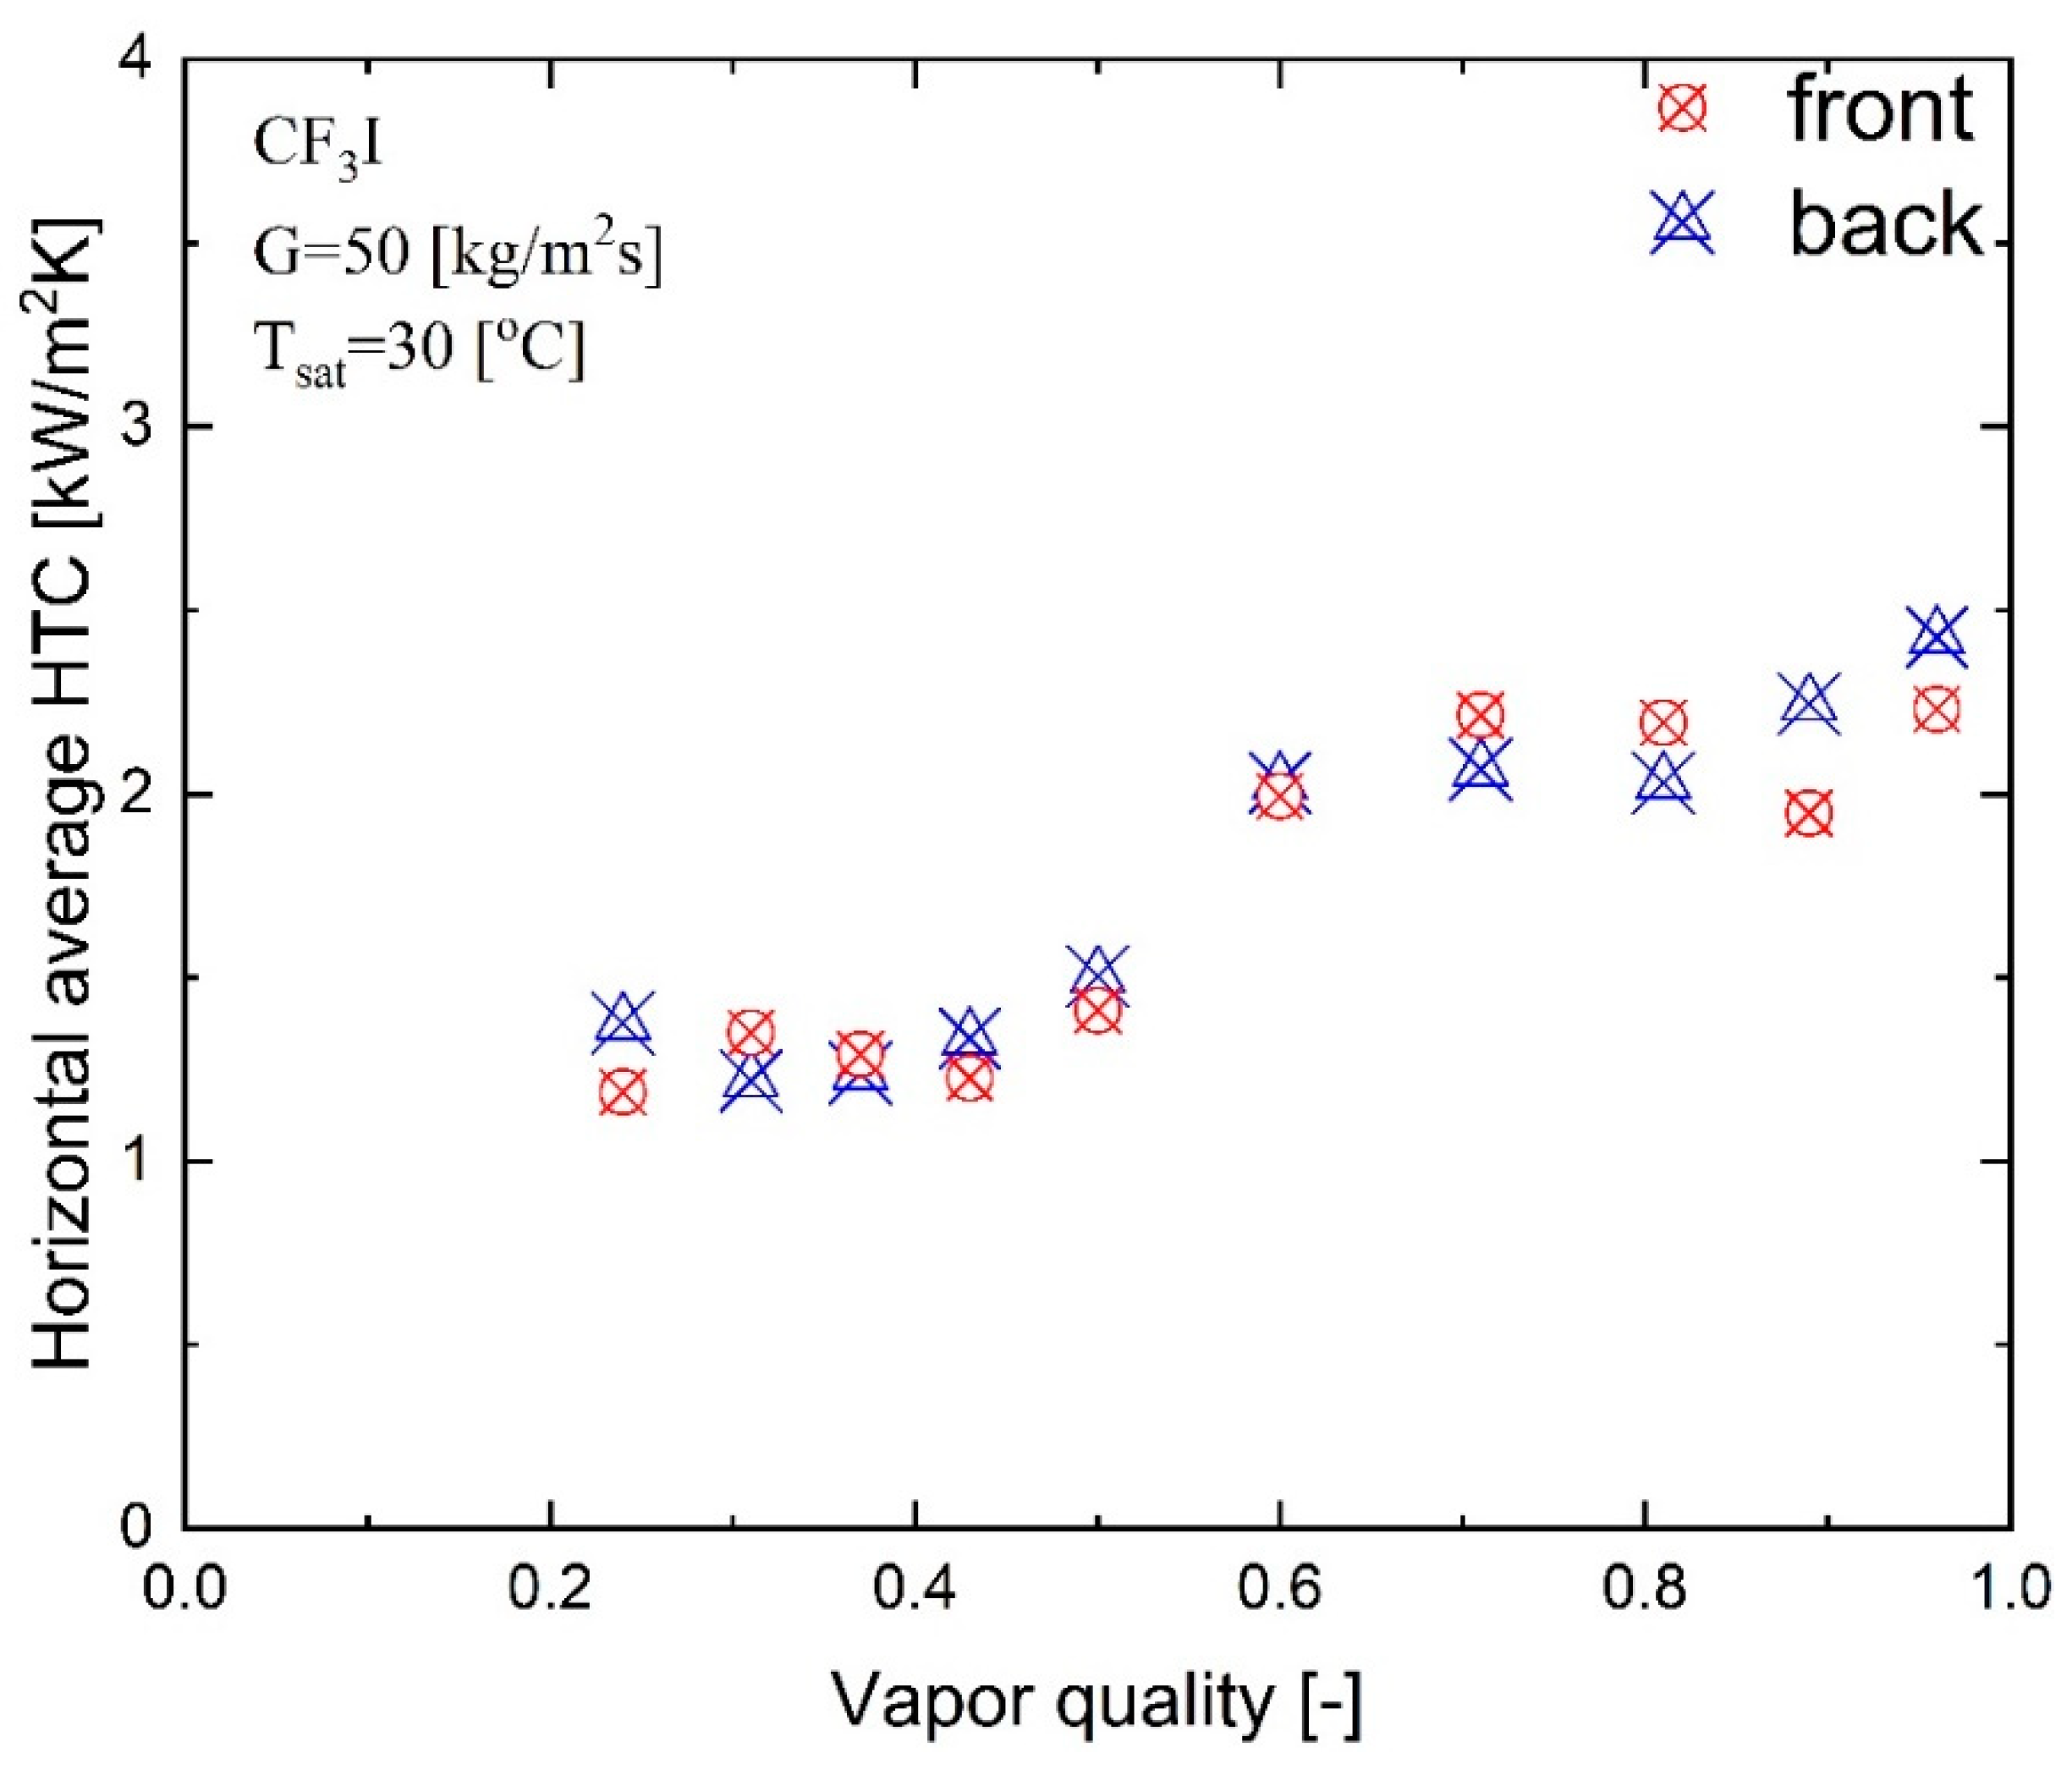
Figure 11 illustrates the horizontal average condensation heat transfer coefficient for a mass flux of 50 kg/m
2s and a maximum heat flux of 13.5 kW/m
2 in relation to vapor quality on the front and back side of the PHE. These heat transfer coefficients are obtained from the average heat transfer coefficient data at various positions in horizontal distances for the front and back sides, respectively, at a certain vapor quality. The heat transfer coefficients for the back side of the plate do not have significant differences for lower vapor qualities. However, the heat transfer coefficients on the back side of the PHE is significantly higher at higher vapor qualities (
x > 0.85) due to the plate geometric effect of the test section, as has already been discussed in
Figure 10. Moreover, the refrigerant mass flux has little impact on the condensation heat transfer coefficient in the low vapor quality regime (
x < 0.40). The condensation heat transfer coefficient affected by the mass flux is observed as the vapor quality exceeds 0.4. In addition, the heat transfer coefficient for the larger mass flux increases with vapor quality more quickly than it does for the lower mass flux. The condensation heat transfer coefficient at the vapor quality of 0.81 is about 1.8 times higher than that at 0.24 for the front side of the PHE and the condensation heat transfer coefficient at the vapor quality of 0.96 is about 1.9 times higher than that of 0.13 for the back side of the PHE. The findings in
Figure 11 also show that, mainly due to the convective effect, an increase in the refrigerant mass flow always results in a large increase in the condensation heat transfer coefficient at a high vapor quality. A high convective effect is caused by a high vapor quality and high mass flux of the refrigerant, in a similar observation to Kuo et al. [
6].
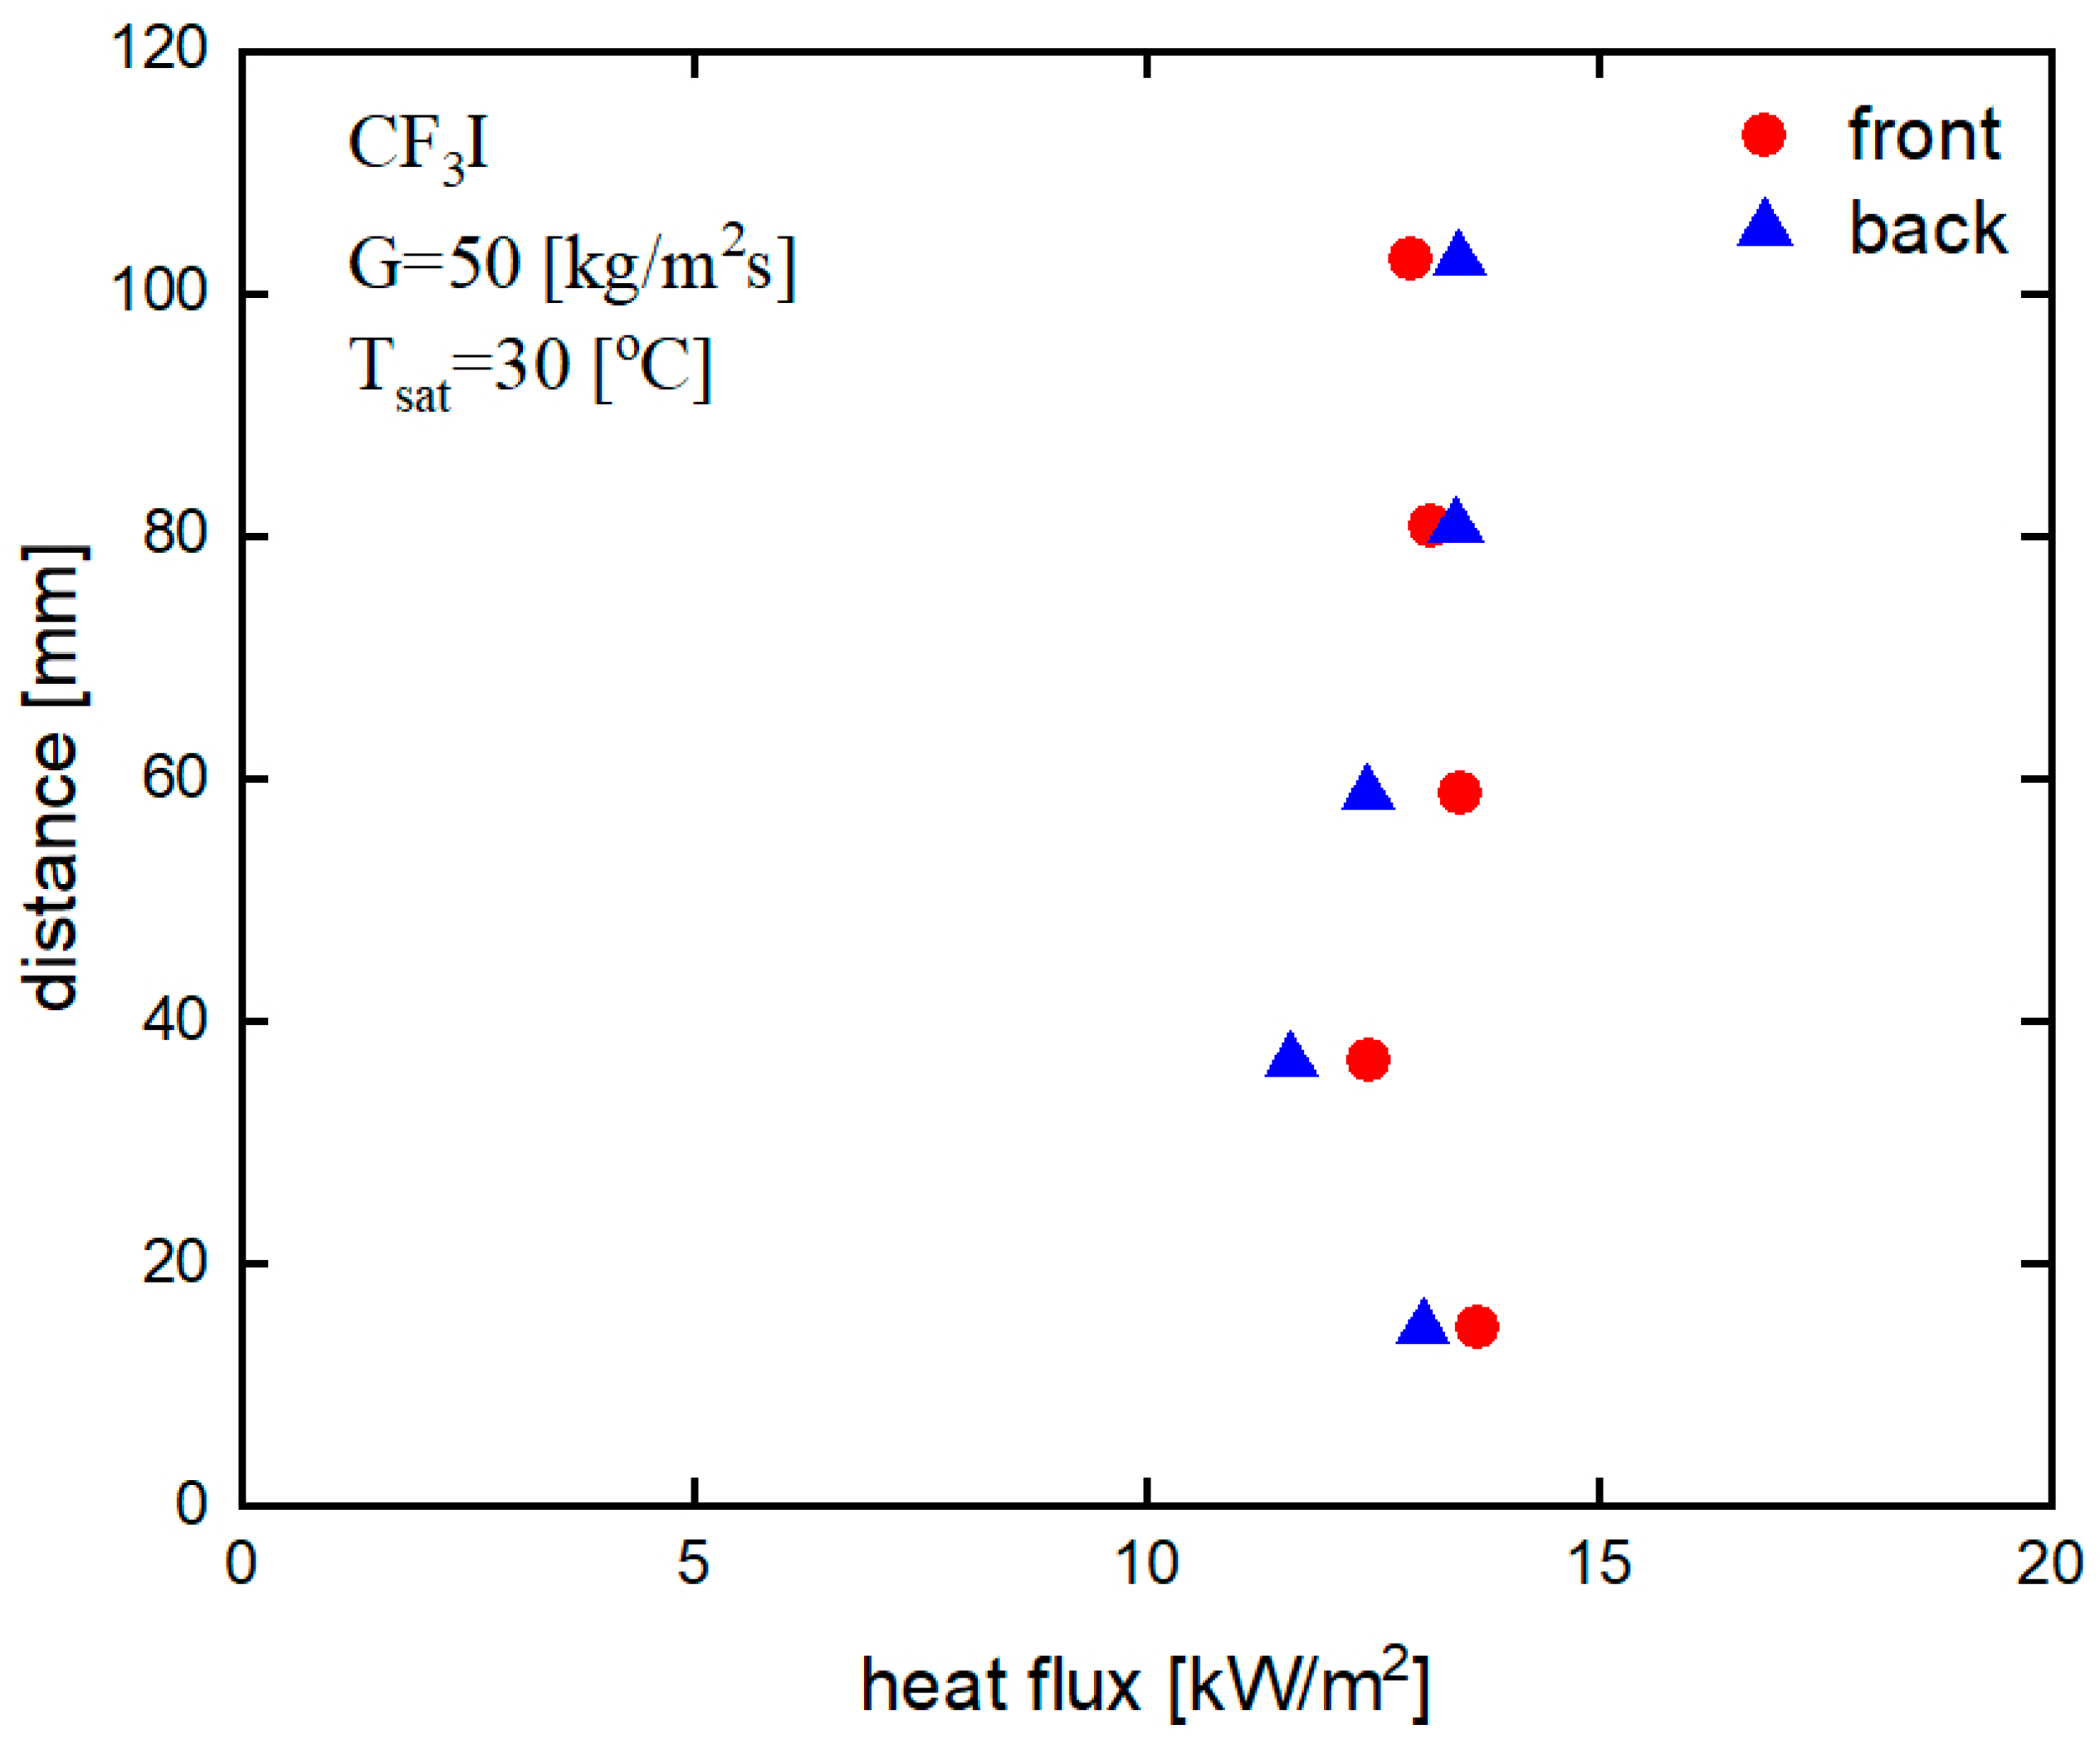
Figure 12 indicates the variation of local heat flux with distances from the inlet to the outlet of the PHE, i.e., along the vertical cross-section of the PHE for a mass flux of 50 kg/m
2s, a saturation temperature 30 °C, and at a horizontal distance of 12 mm from the end face of the cross-section of the test plates.
The front and back sides of the plate heat exchanger do not have significant differences in local heat flux at the corresponding measurement point. The local heat flux on the back side is also high, as similarly observed for a mass flux of 20 kg/m2s. The local heat flux varies from 11.6 kW/m2 to a maximum of 13.7 kW/m2 in the PHE for condensation heat transfer at the mass flux of 50 kg/m2s.
Figure 13 shows the variation in the local wall temperature in relation to distance from the inlet to the outlet of the test section for a mass flux of G = 50 kg/m
2s, saturation temperature of 30 °C, a maximum heat flux of 13.6 kW/m
2, and at a horizontal position of 12 mm from the end face of the cross-section of the test plates. The measured local wall surface temperatures of the water side and the refrigerant side are plotted for both the front and back sides of the PHE. The wall surface temperatures were observed to decrease along the condensation path similar to the observation for the mass flux of 20 kg/m
2s.
The results of heat transfer coefficient for mass flux 50 kg/m2s was not possible to obtain in our specified test section in one time between vapor quality 1.0 to 0.0 because of high mass flow rate. The local heat flux distribution and local wall temperature distribution reported for 50 kg/m2s were measured for vapor quality 1.0 to 0.50.
4.3. Comparison of Heat Transfer with Another Refrigerant
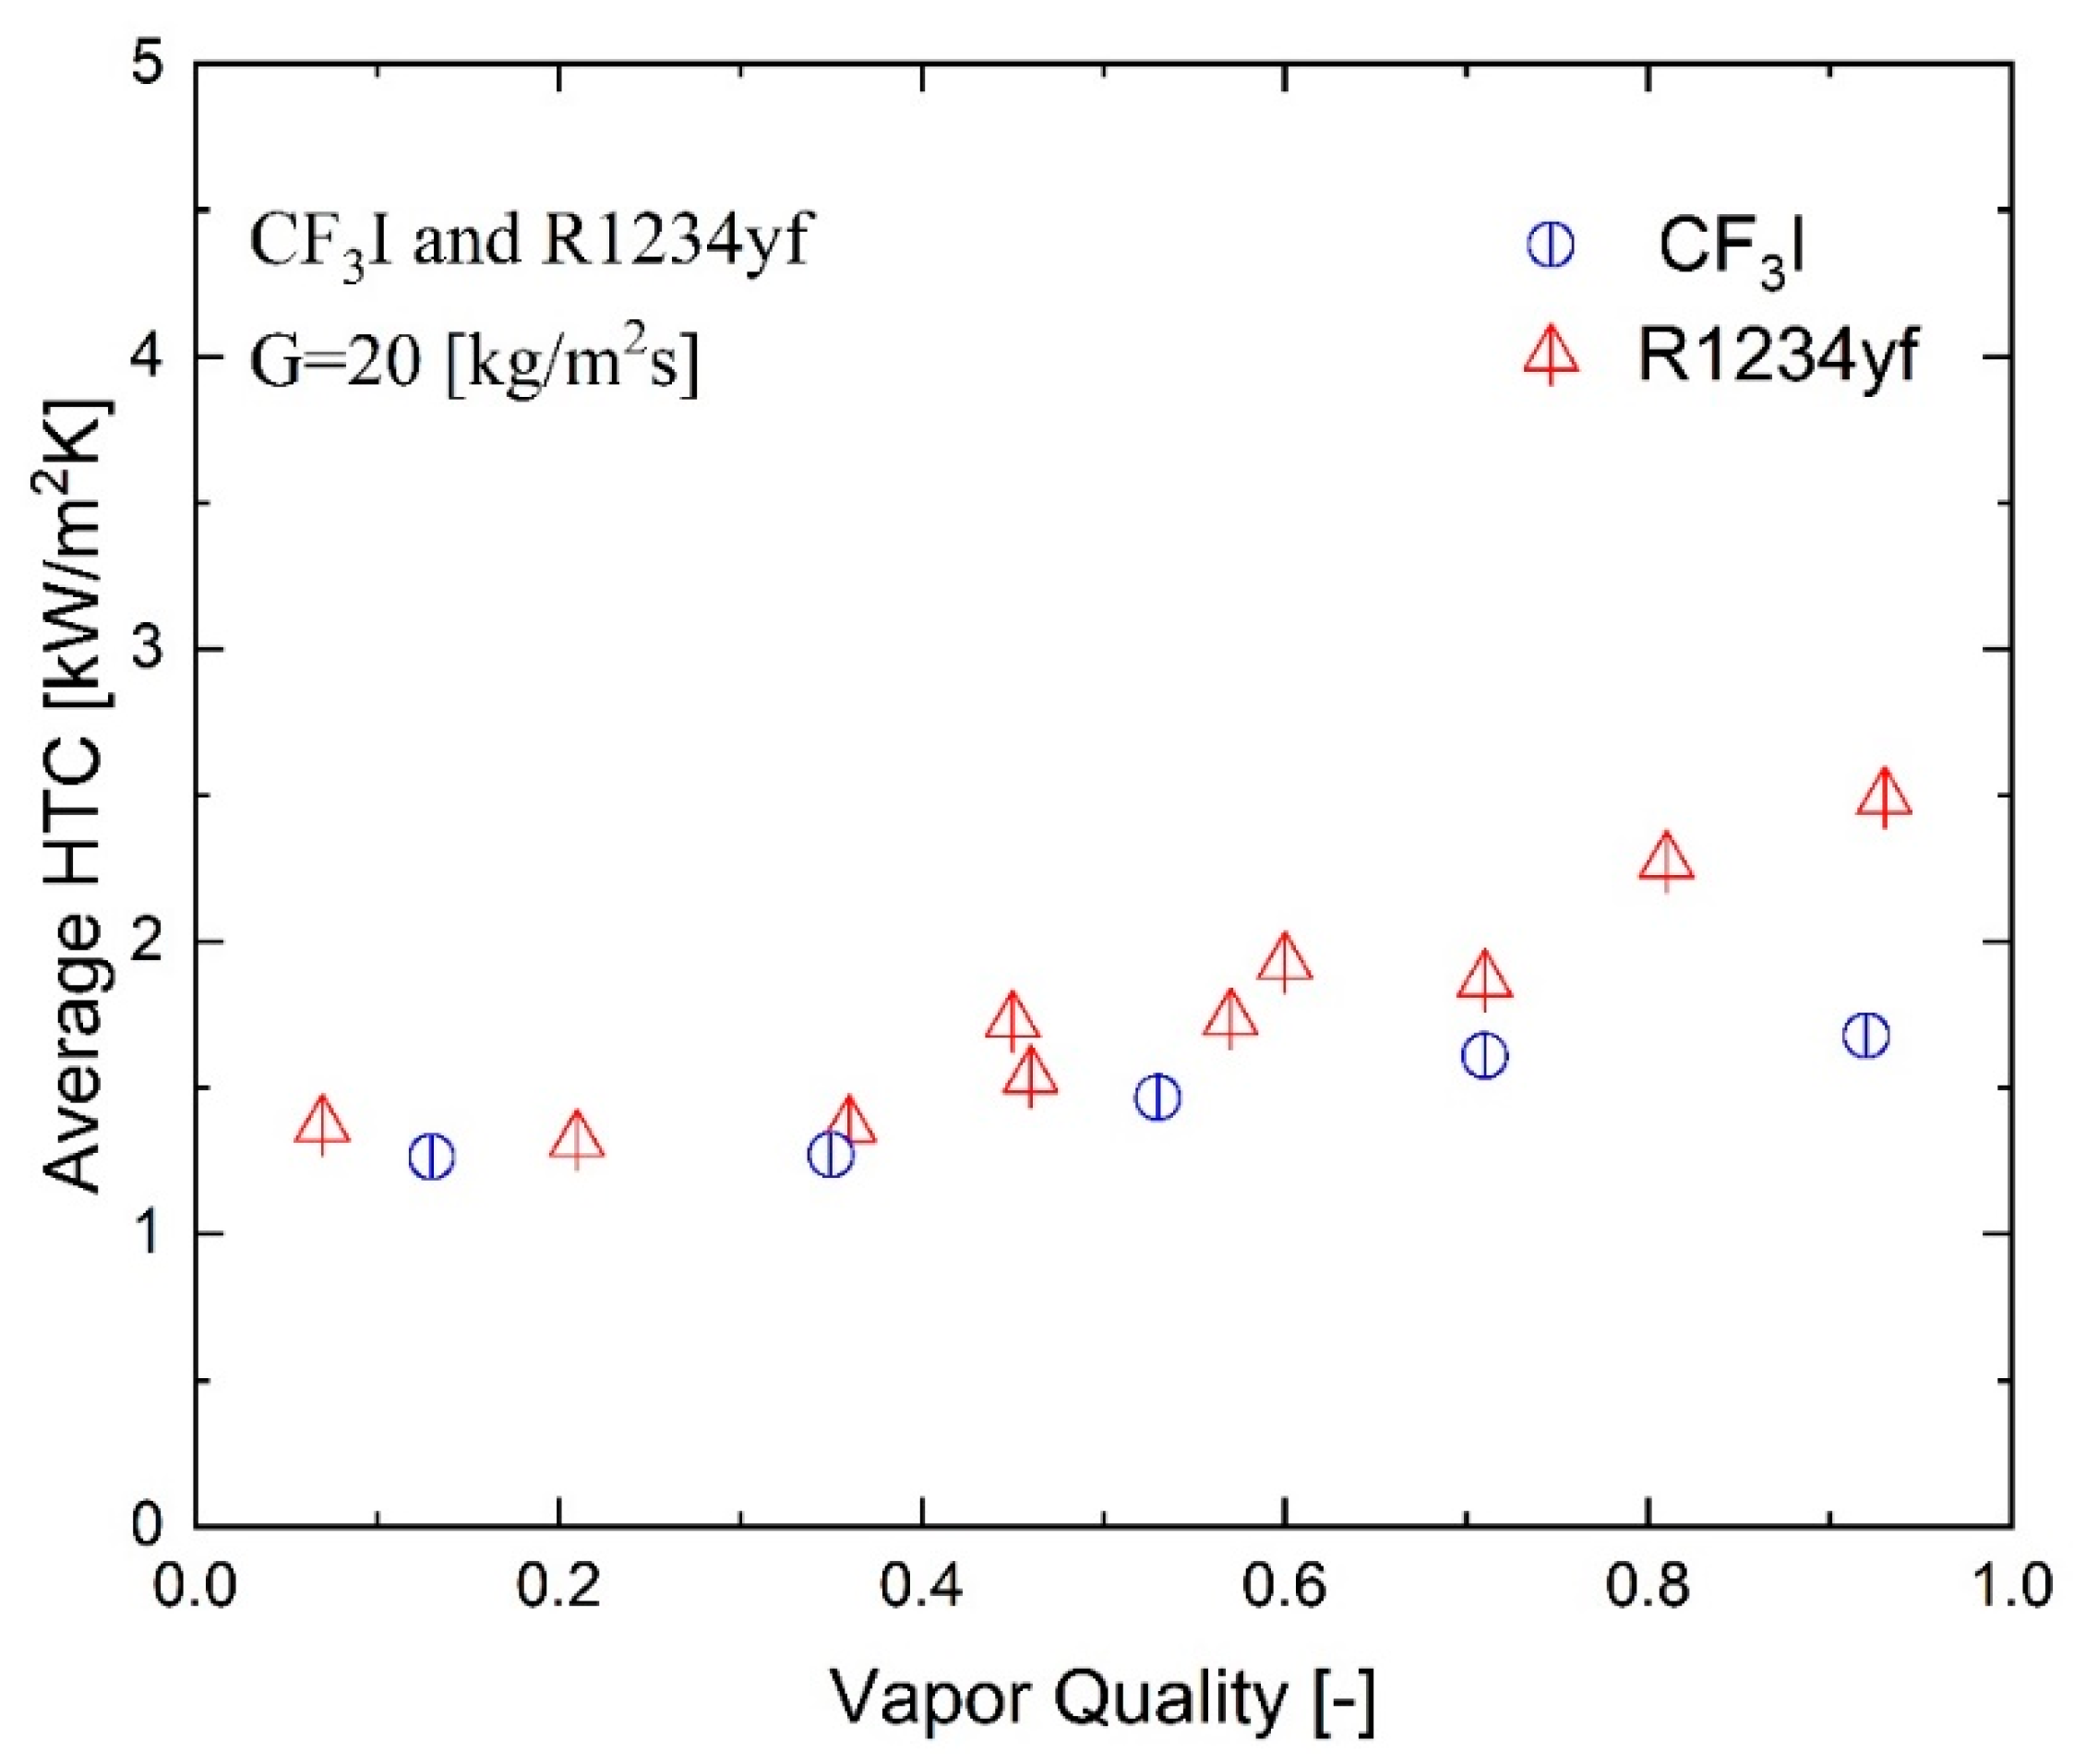
Figure 14 shows the comparison of experimentally measured heat transfer coefficient for R1234yf and CF
3I refrigerant for a mass flux of 20 kg/m
2s in the same test facility. The condensation heat transfer experiments for CF
3I and R1234yf were conducted at saturation temperatures of 25 °C and 30 °C respectively. These heat transfer coefficient data are the average of the front and back side heat transfer coefficients for both refrigerants. The heat transfer coefficient for CF
3I is approximately identical to R1234yf with a low mass flux and low vapor quality (
x < 0.45). Gravity-controlled condensation occurs under low mass flow and low vapor quality conditions, and the shear stress effect has little impact on the condensation heat transfer coefficient. However, the heat transfer coefficient for R1234yf is significantly higher than CF
3I in the high vapor quality region (
x > 0.50). For instance, in the plate heat exchanger, the heat transfer coefficient for R1234yf was almost 1.5 times higher than that for CF
3I at a vapor quality of 0.92.
Figure 15 shows the comparison of experimentally measured heat transfer coefficients for R1234yf and CF
3I refrigerants for a mass flux of 50 kg/m
2s in the same test facility. The condensation heat transfer experiments for both CF
3I and R1234yf were conducted at saturation temperature of 30 °C. The front and back side heat transfer coefficients for both refrigerants were averaged to provide these heat transfer coefficient statistics. The findings demonstrate that the condensation heat transfer coefficient gradually increases with vapor quality in PHE for a certain imposed mass flux and saturation temperature. This increase is rather significant. This can be simply understood from the fact that in the high vapor quality region, the vapor and liquid shear stresses are substantially higher on the plate surface, while the liquid film is relatively very thin. This, consequently, reduces the heat transfer resistance from the plate surface to the refrigerant and results in an increase in the heat transfer coefficient of the plate heat exchanger. The heat transfer coefficients for R1234yf are all larger than those for CF
3I in all vapor quality regions in a high mass flux. For instance, at the vapor quality of 0.37, the heat transfer coefficient for R1234yf is approximately 50% higher than that for CF
3I. The heat transfer coefficient for R1234yf is about 60% higher than that for CF
3I in the plate heat exchanger at a vapor quality of 0.96. Given the thermophysical characteristics of R1234yf and CF
3I, this result is quite significant.
The liquid thermal conductivity of R1234yf and CF
3I are 62.0 and 52.8 mW/m·K, respectively, at a saturation temperature of 30 °C [
14]. Generally, greater liquid thermal conductivity results in a greater heat transfer coefficient because the liquid thermal conductivity affects the thermal resistance of the refrigerant.
The thermophysical properties of CF
3I and R1234yf at 30 °C derived from REFPROP [
14] are shown in
Table 6.
4.4. Comparison with Heat Transfer Correlations
The experimental data obtained in the current work were compared with the previous correlations of Yan et al. [
1], Longo et al. [
5], Shon et al. [
28], and Zhang et al. [
30] and a newly developed correlation in the present study. The development of the new correlation is described later. The experimental conditions and refrigerants used for their correlations are shown in
Table 7.
Figure 16 presents a comparison of the experimental data with available correlations in the open literature and a proposed correlation for the mass flux of 20 kg/m
2s. It is observed that all the correlations underestimate the experimental heat transfer coefficient data for CF
3I condensation in the plate heat exchanger at all the vapor qualities. The prediction of Shon et al. [
28] is closer to the present data compared to the other correlations of Yan et al. [
1], Longo et al. [
31], and Zhang et al. [
30]. The newly developed correlation shows good agreement with the experimental data.
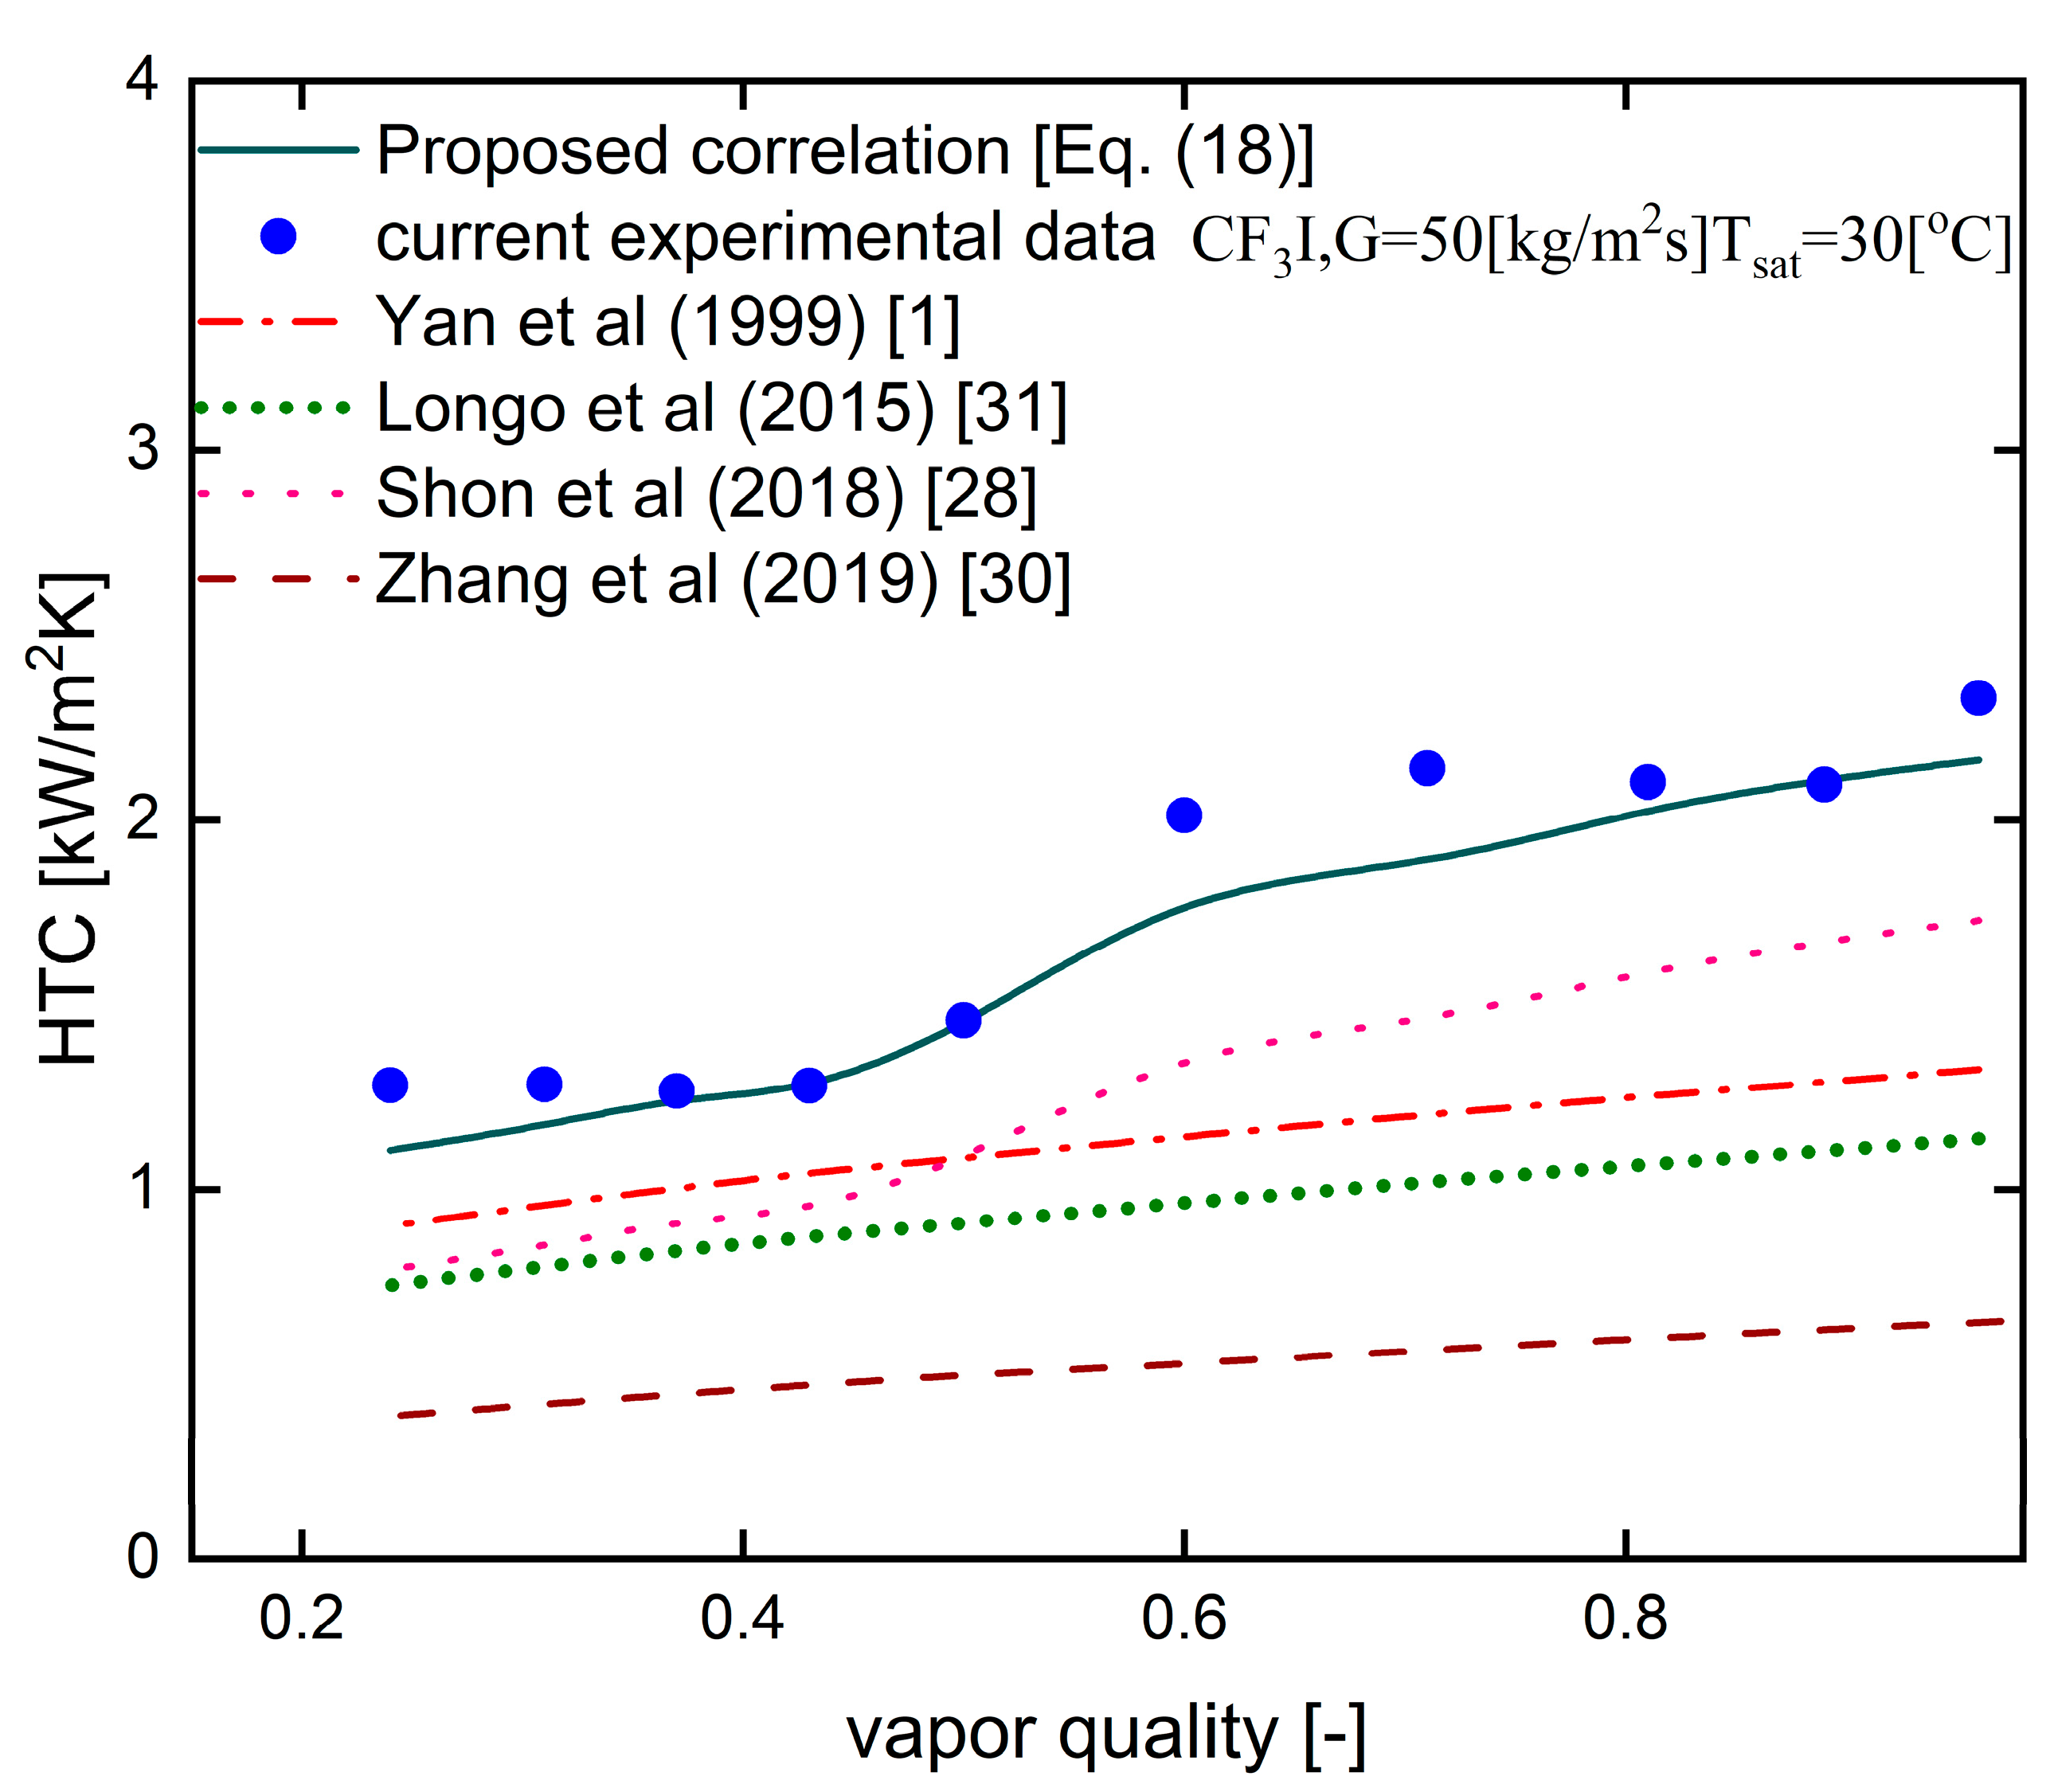
Figure 17 presents a comparison of the experimental data with available correlations in the open literature and a proposed correlation for the mass flux of 50 kg/m
2s. The trend is almost similar to that observed for the mass flux of 20 kg/m
2s, except for Shon et al., 2018 for the vapor quality
x = 0.54. The predictions of Shon et al. [
24] are closer to the present data compared to the other correlations of Yan et al. [
1], Longo et al. [
31], and Zhang et al. [
30]
4.5. Development of a New Heat Transfer Correlation
Based on the experimental results for CF
3I, a correlation for the Nusselt number was developed. Additionally, by comparing the Nusselt number with the experimental results, the precision of the correlations is confirmed. Three nondimensional numbers are considered in the correlation for the prediction of the Nusselt number, and the empirical correlation is developed in a power form of those dimensionless parameters as shown in Equation (13)
where
is the heat transfer coefficient,
Dh is the hydraulic diameter of the test section,
λl is the thermal conductivity of the refrigerant,
C is the coefficient, and
n1,
n2, and
n3 are the exponents for the Reynolds number
Reeq, Prandtl number
Prl, and Boiling number Bo, respectively.
The Reynold equivalent number defined in Equation (14) includes the equivalent mass flux expressed in Equation (15) in the concept of compensating the effect of vapor quality proposed by Akers et al. [
32].
where
Geq is the equivalent mass flux, µ
l is the liquid viscosity, and
Dh is the hydraulic diameter of the test section.
where
G is refrigerant mass flux,
ρl and
ρv are the liquid and vapor density, respectively, and
x is the vapor quality of the refrigerant.
The Boiling number is added to the correlation to reflect the effect of heat flux in the heat transfer even in condensation heat transfer [
28].
where
q is heat flux,
G is refrigerant mass flux, and
ifg is the latent heat. The liquid Prandtl number is also defined by Equation (17)
where
Cp,l is the specific heat capacity for the liquid phase and
λl is the liquid thermal conductivity. Keeping the exponents
n1 and
n2 of
Reeq and
Prl, rounding off to two decimals (as proposed by Zhang et al. [
30]), and only fitting the exponent n
3 of newly introduced Bo and coefficient C in a nonlinear curve fitting analysis, the following results are obtained (
Table 8).
The newly developed correlation equation is shown in Equation (18).
The average deviation and mean deviation are applied for the evaluation of the predicted correlation for condensation heat transfer in respect of the experimental data and are defined as follows.
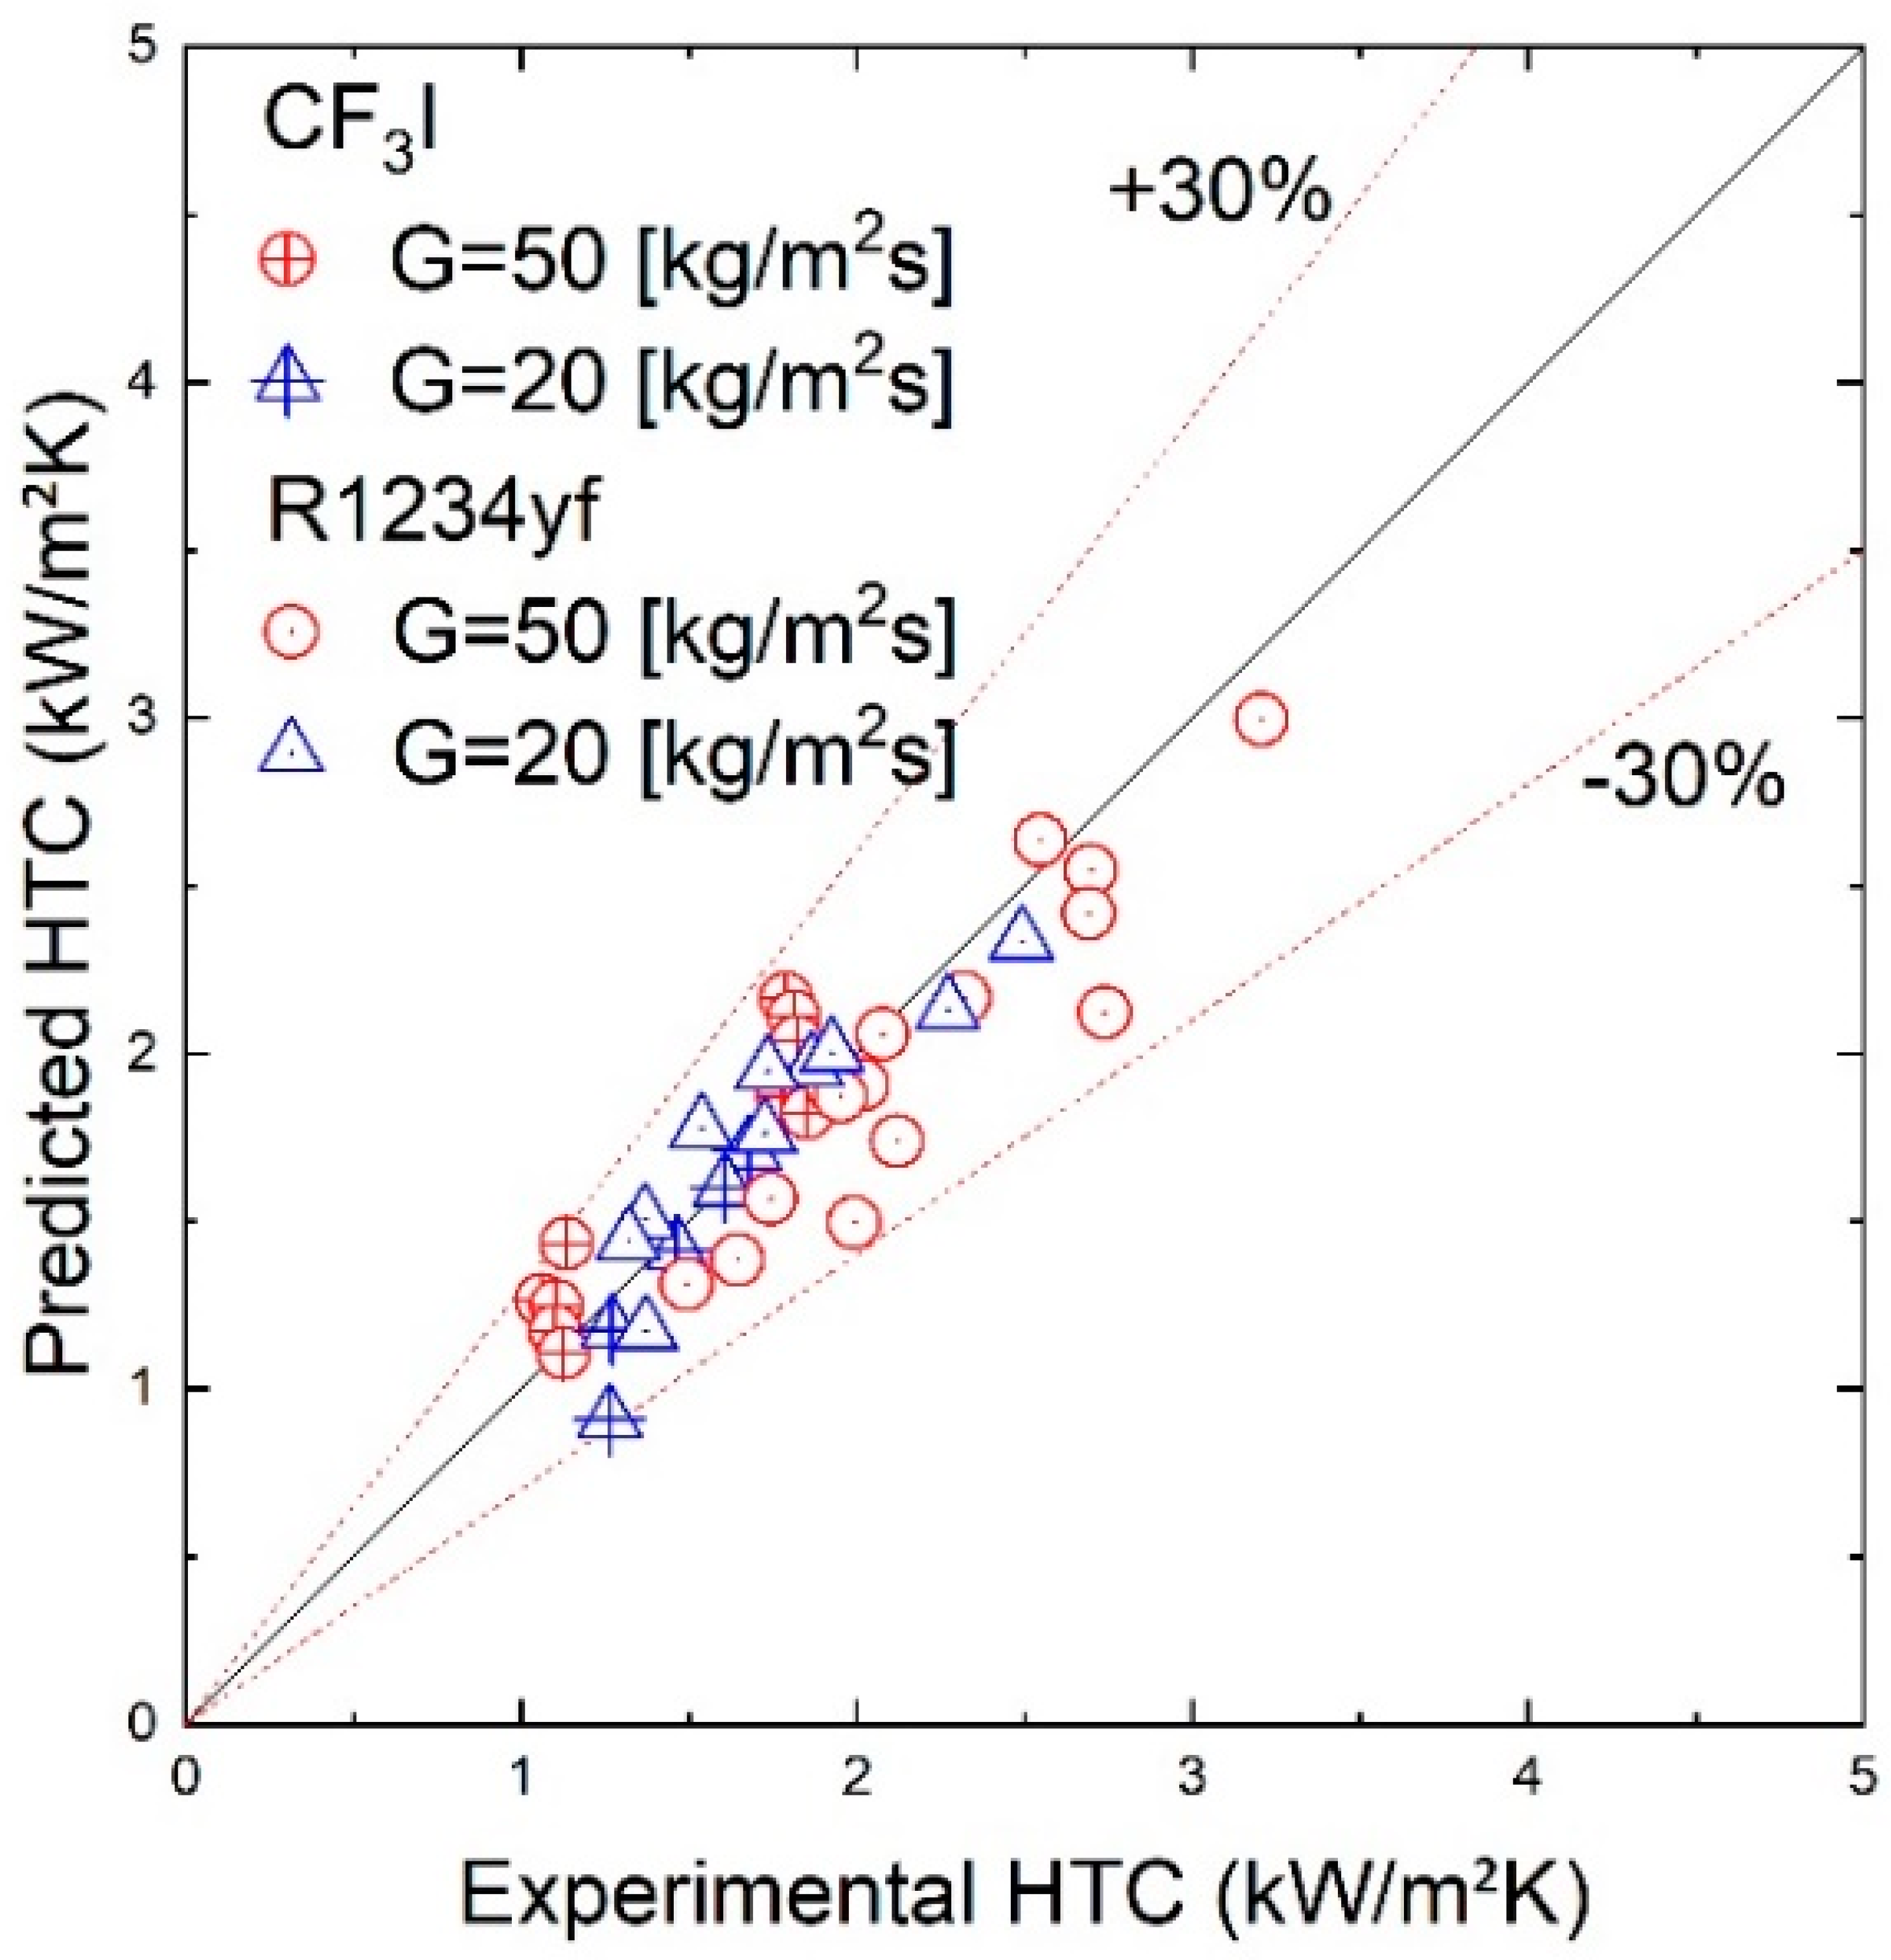
It is observed from the graphical representation of
Figure 18 that all the data for CF
3I and R1234yf are within ±30% with a mean deviation of 7.03% and an average deviation of −6.70% for the CF
3I refrigerant and a mean deviation of 9.35% and an average deviation of −4.51% for the R1234yf refrigerant, respectively. The prediction formula shows an overall mean deviation of 8.48% and an average deviation of −5.33% for all the experimentally obtained data. The new correlations enable significantly better prediction accuracies for the experimental results in this study than existing correlations.
