
Task-Driven Path Planning for Unmanned Aerial Vehicle-Based Bridge Inspection in Wind Fields


Abstract
:1. Introduction
2. Methods
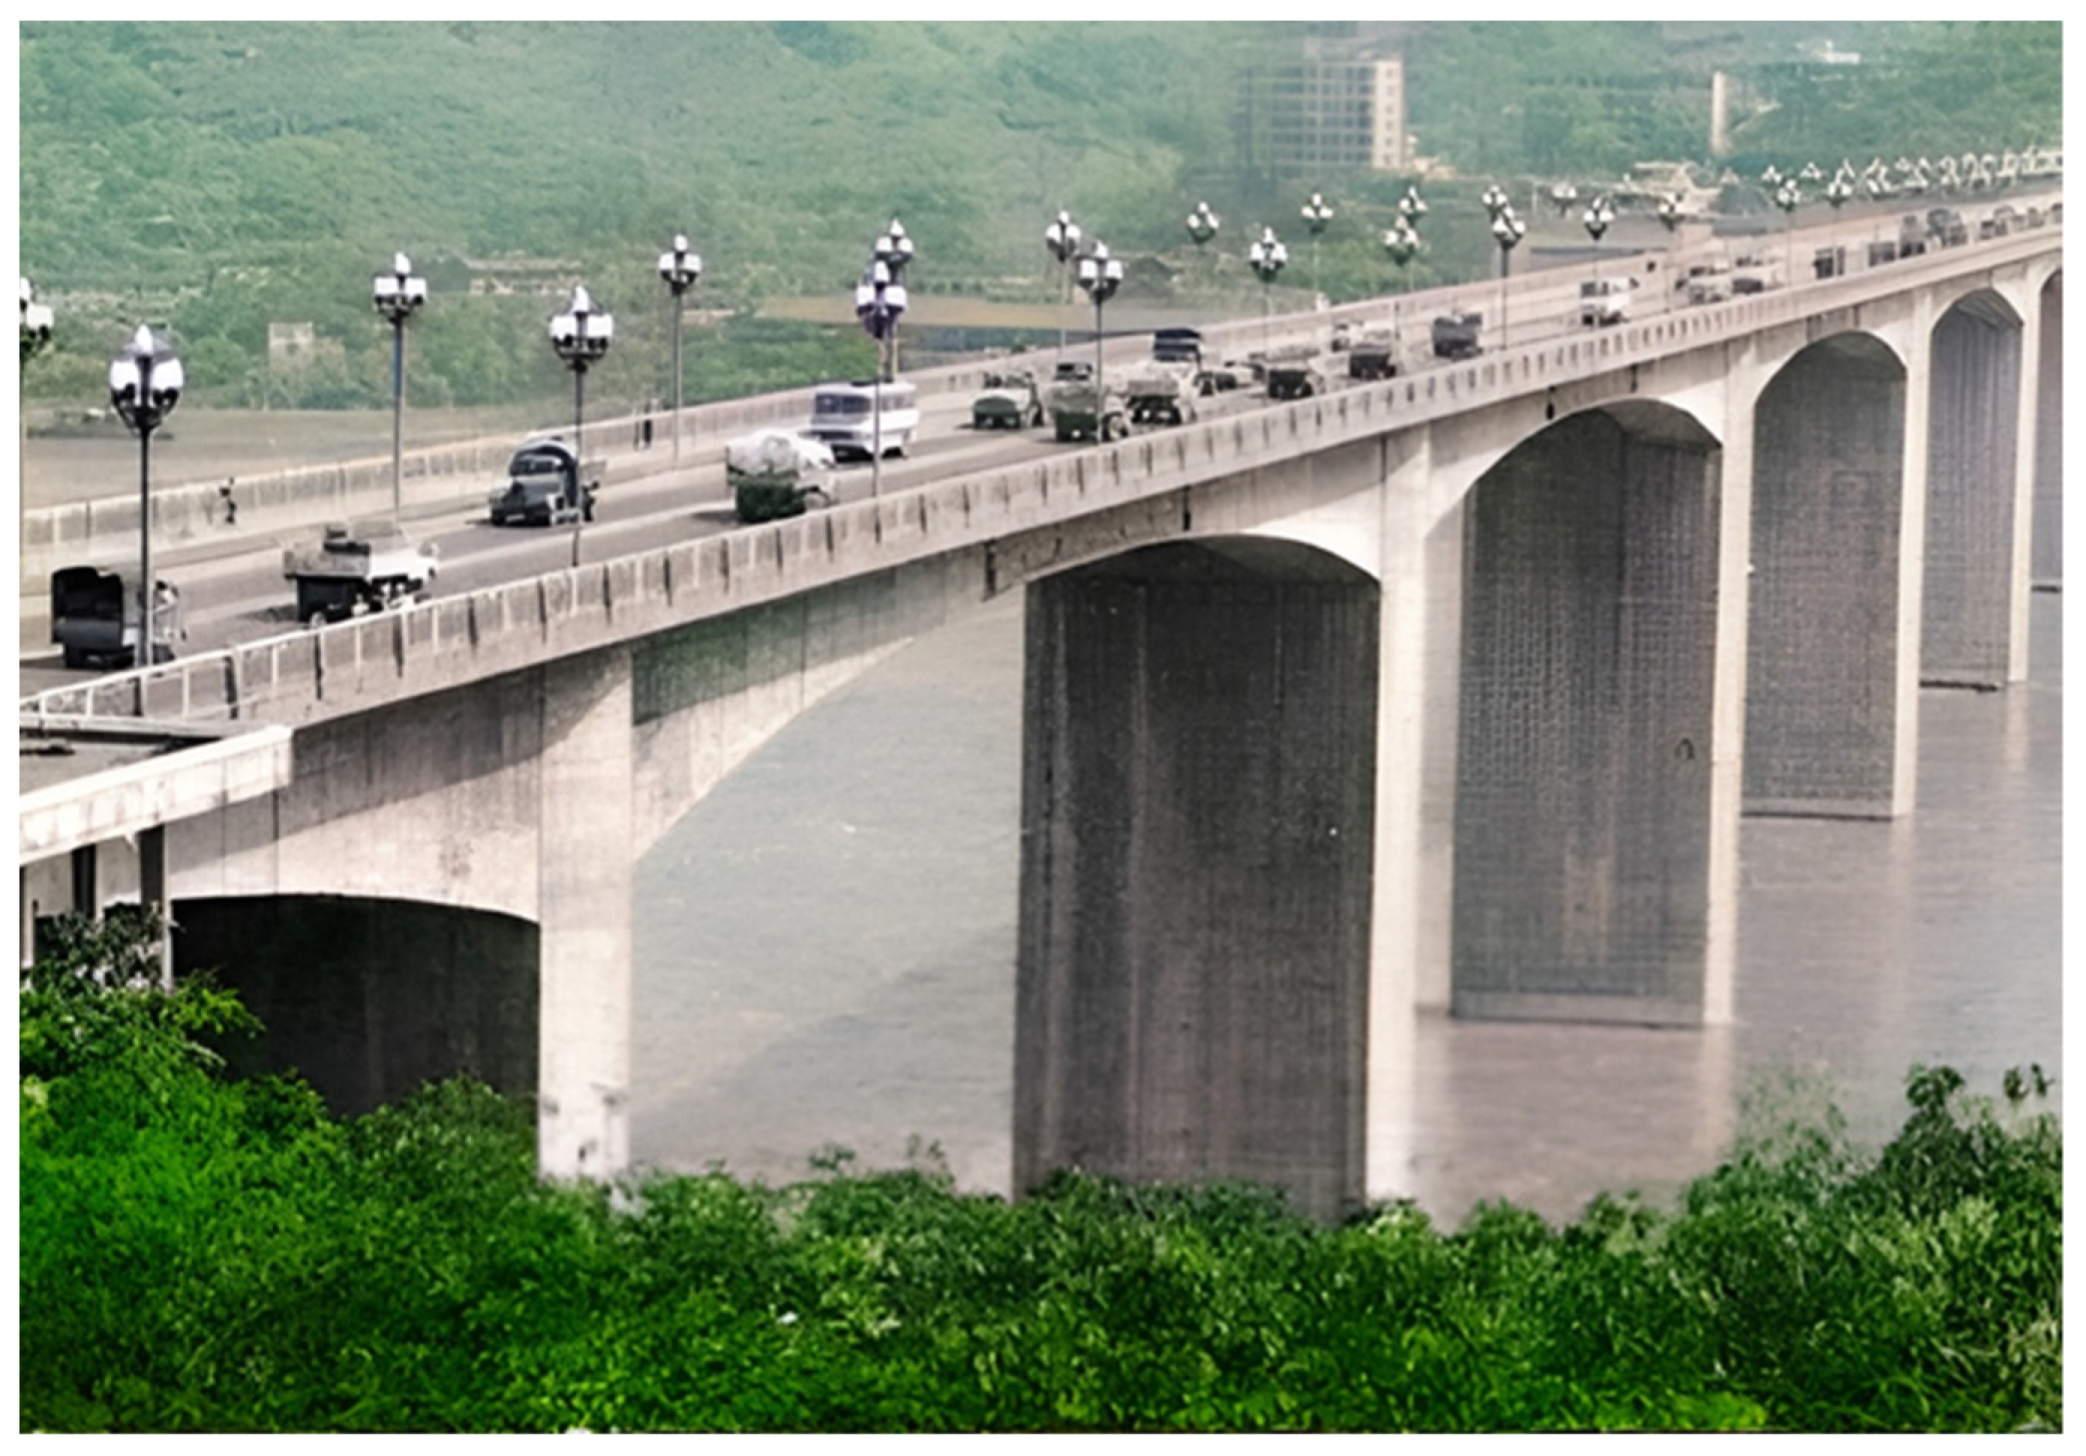
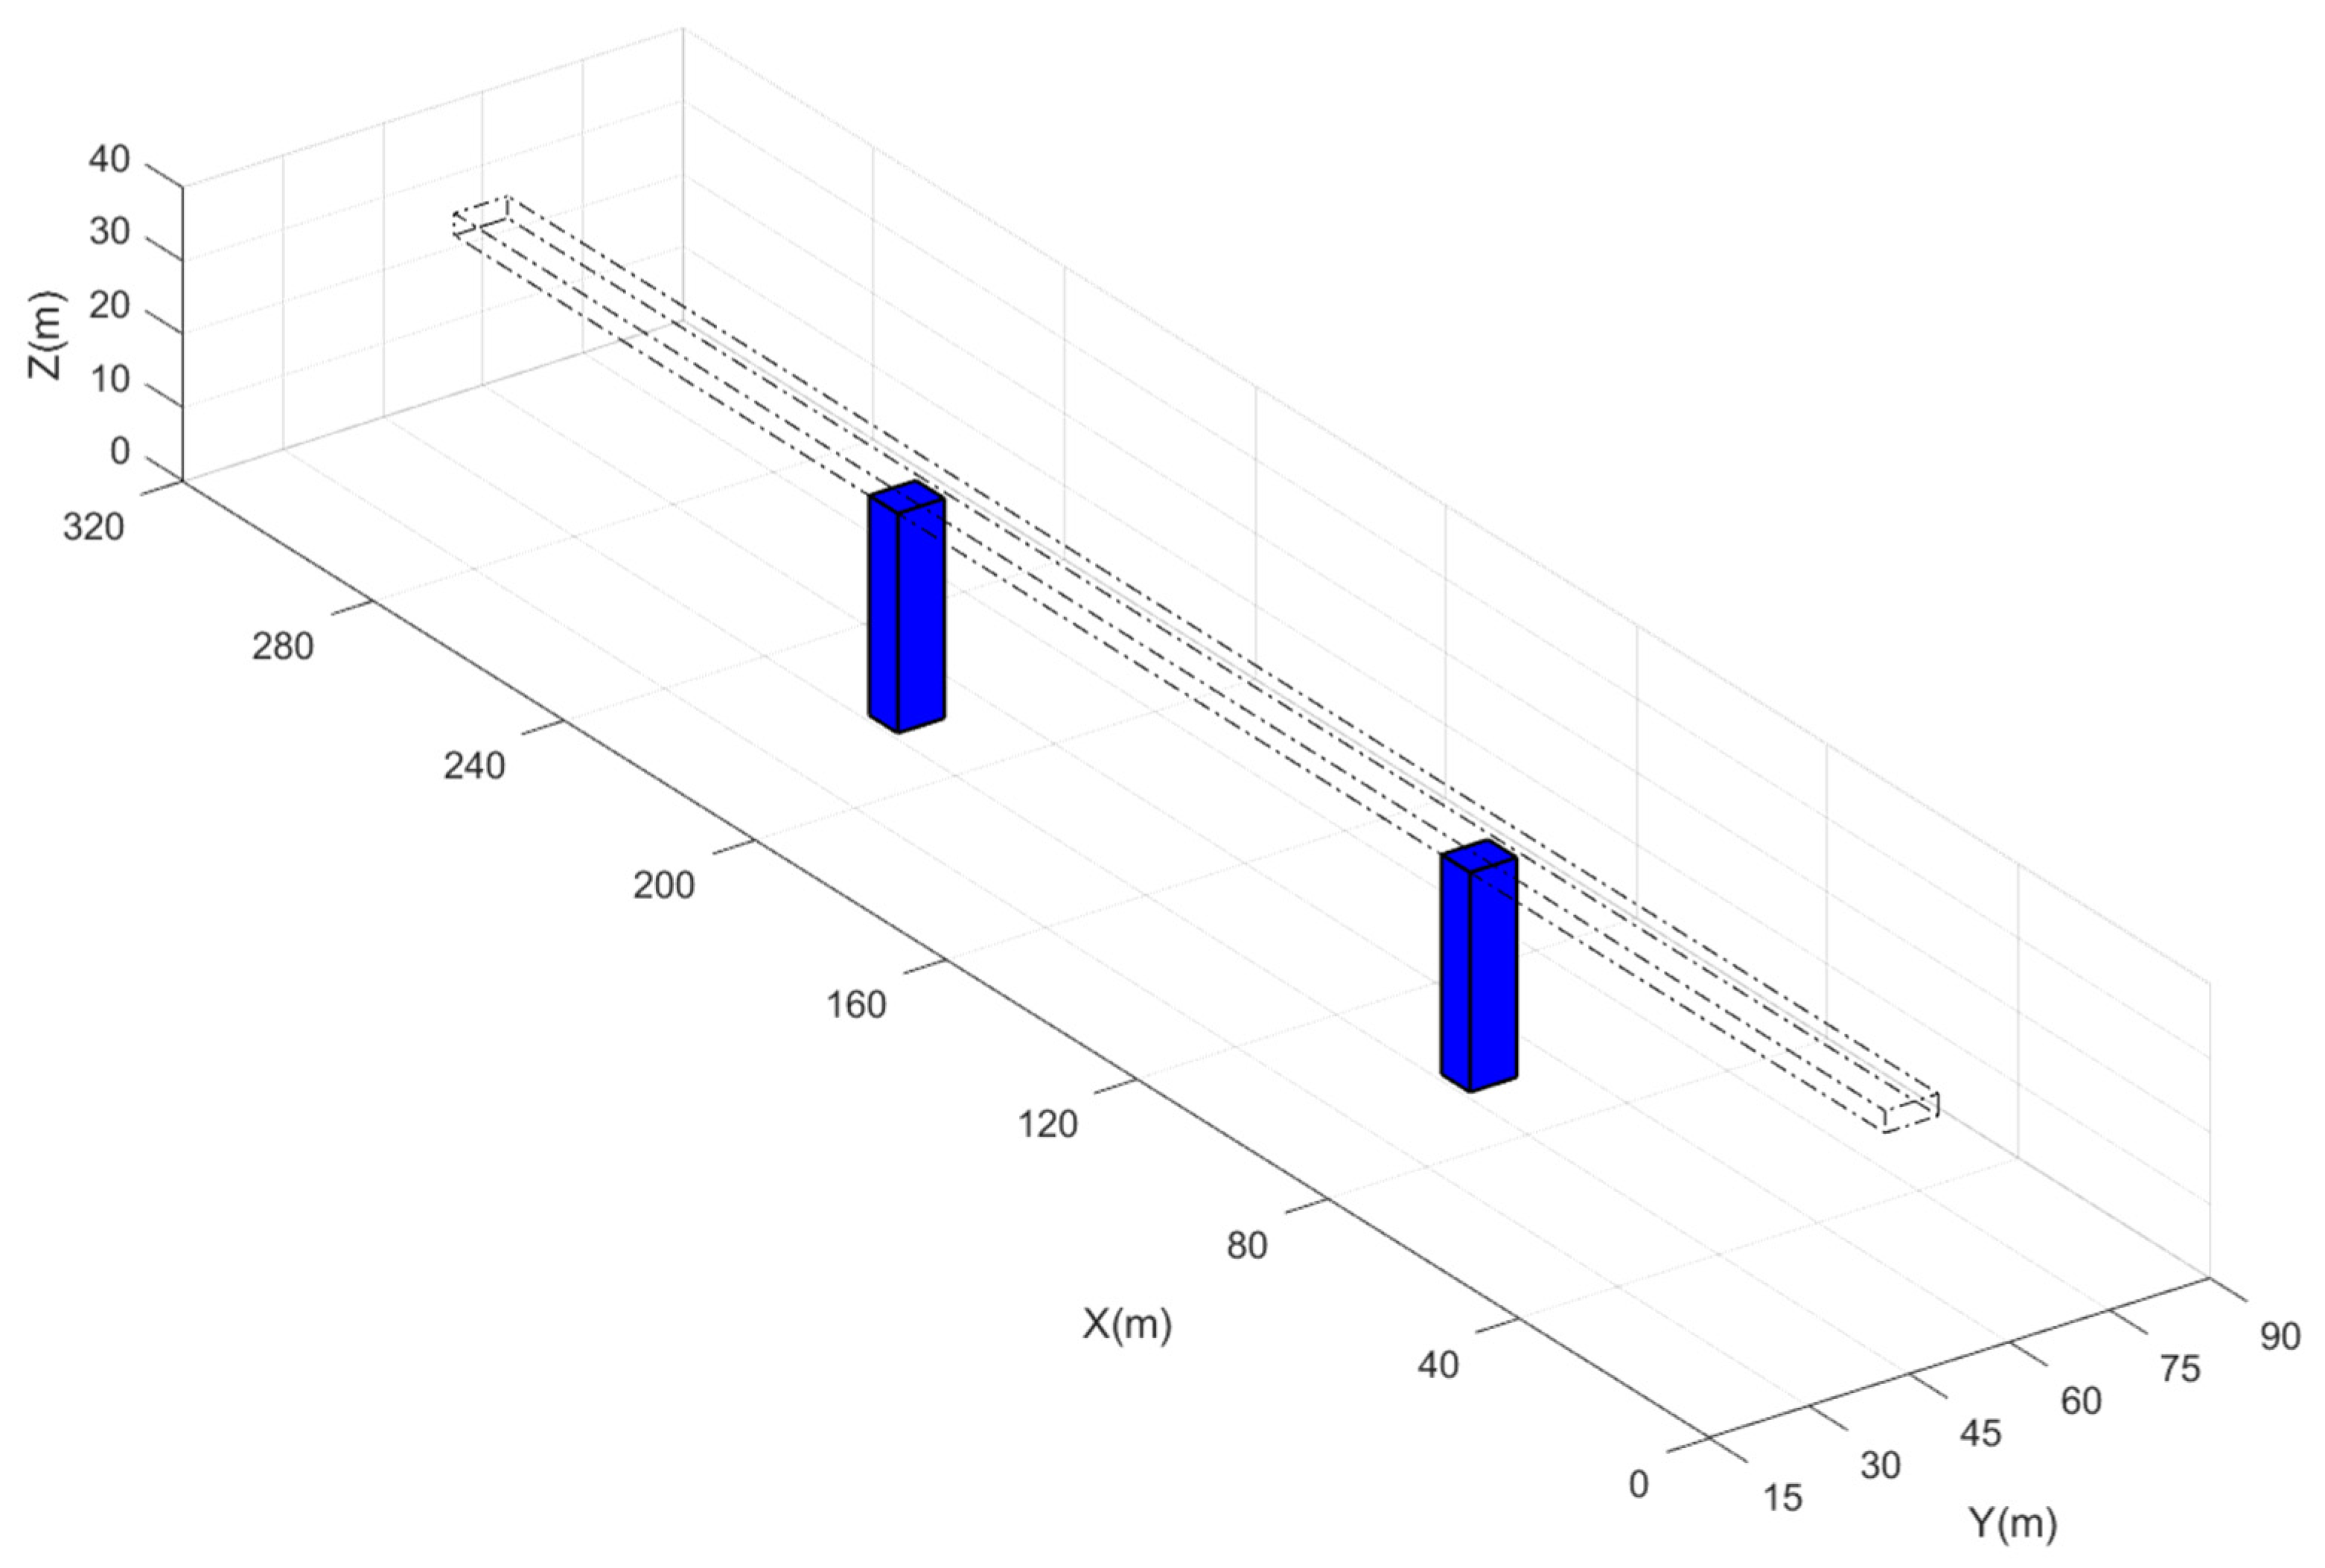
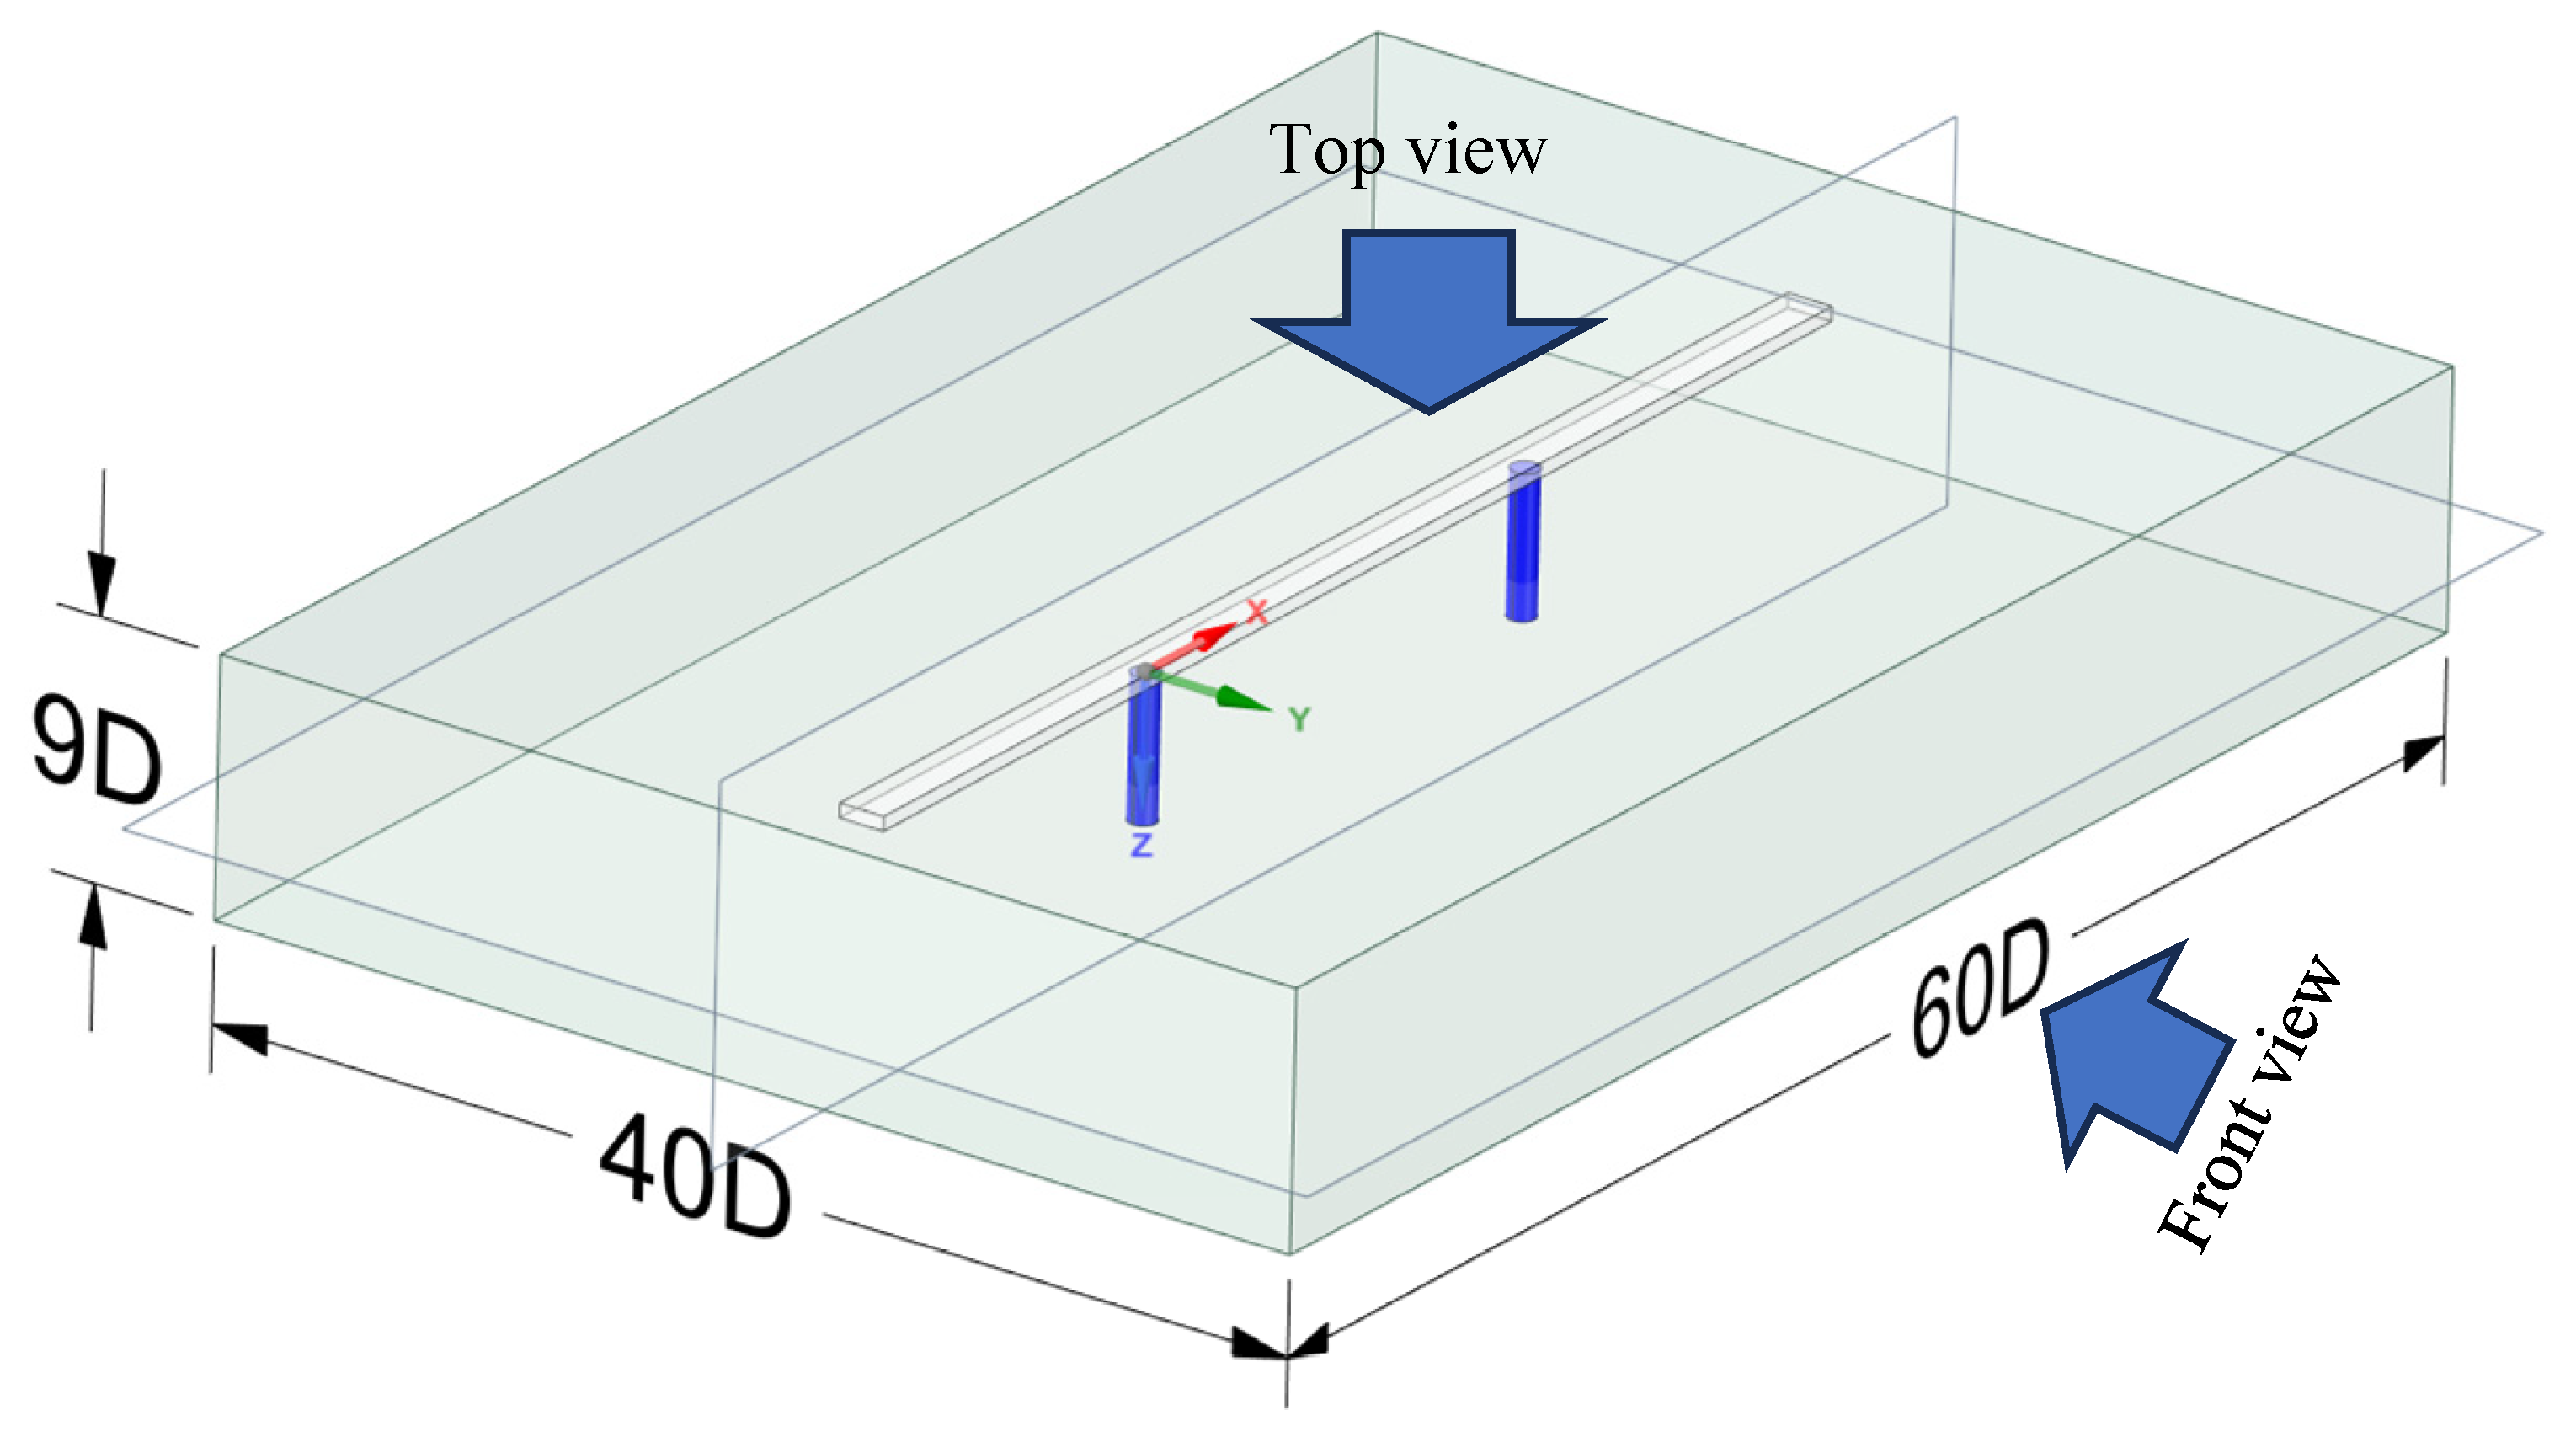
2.1. Bridge Model
2.2. UAV Model
2.3. Wind Model
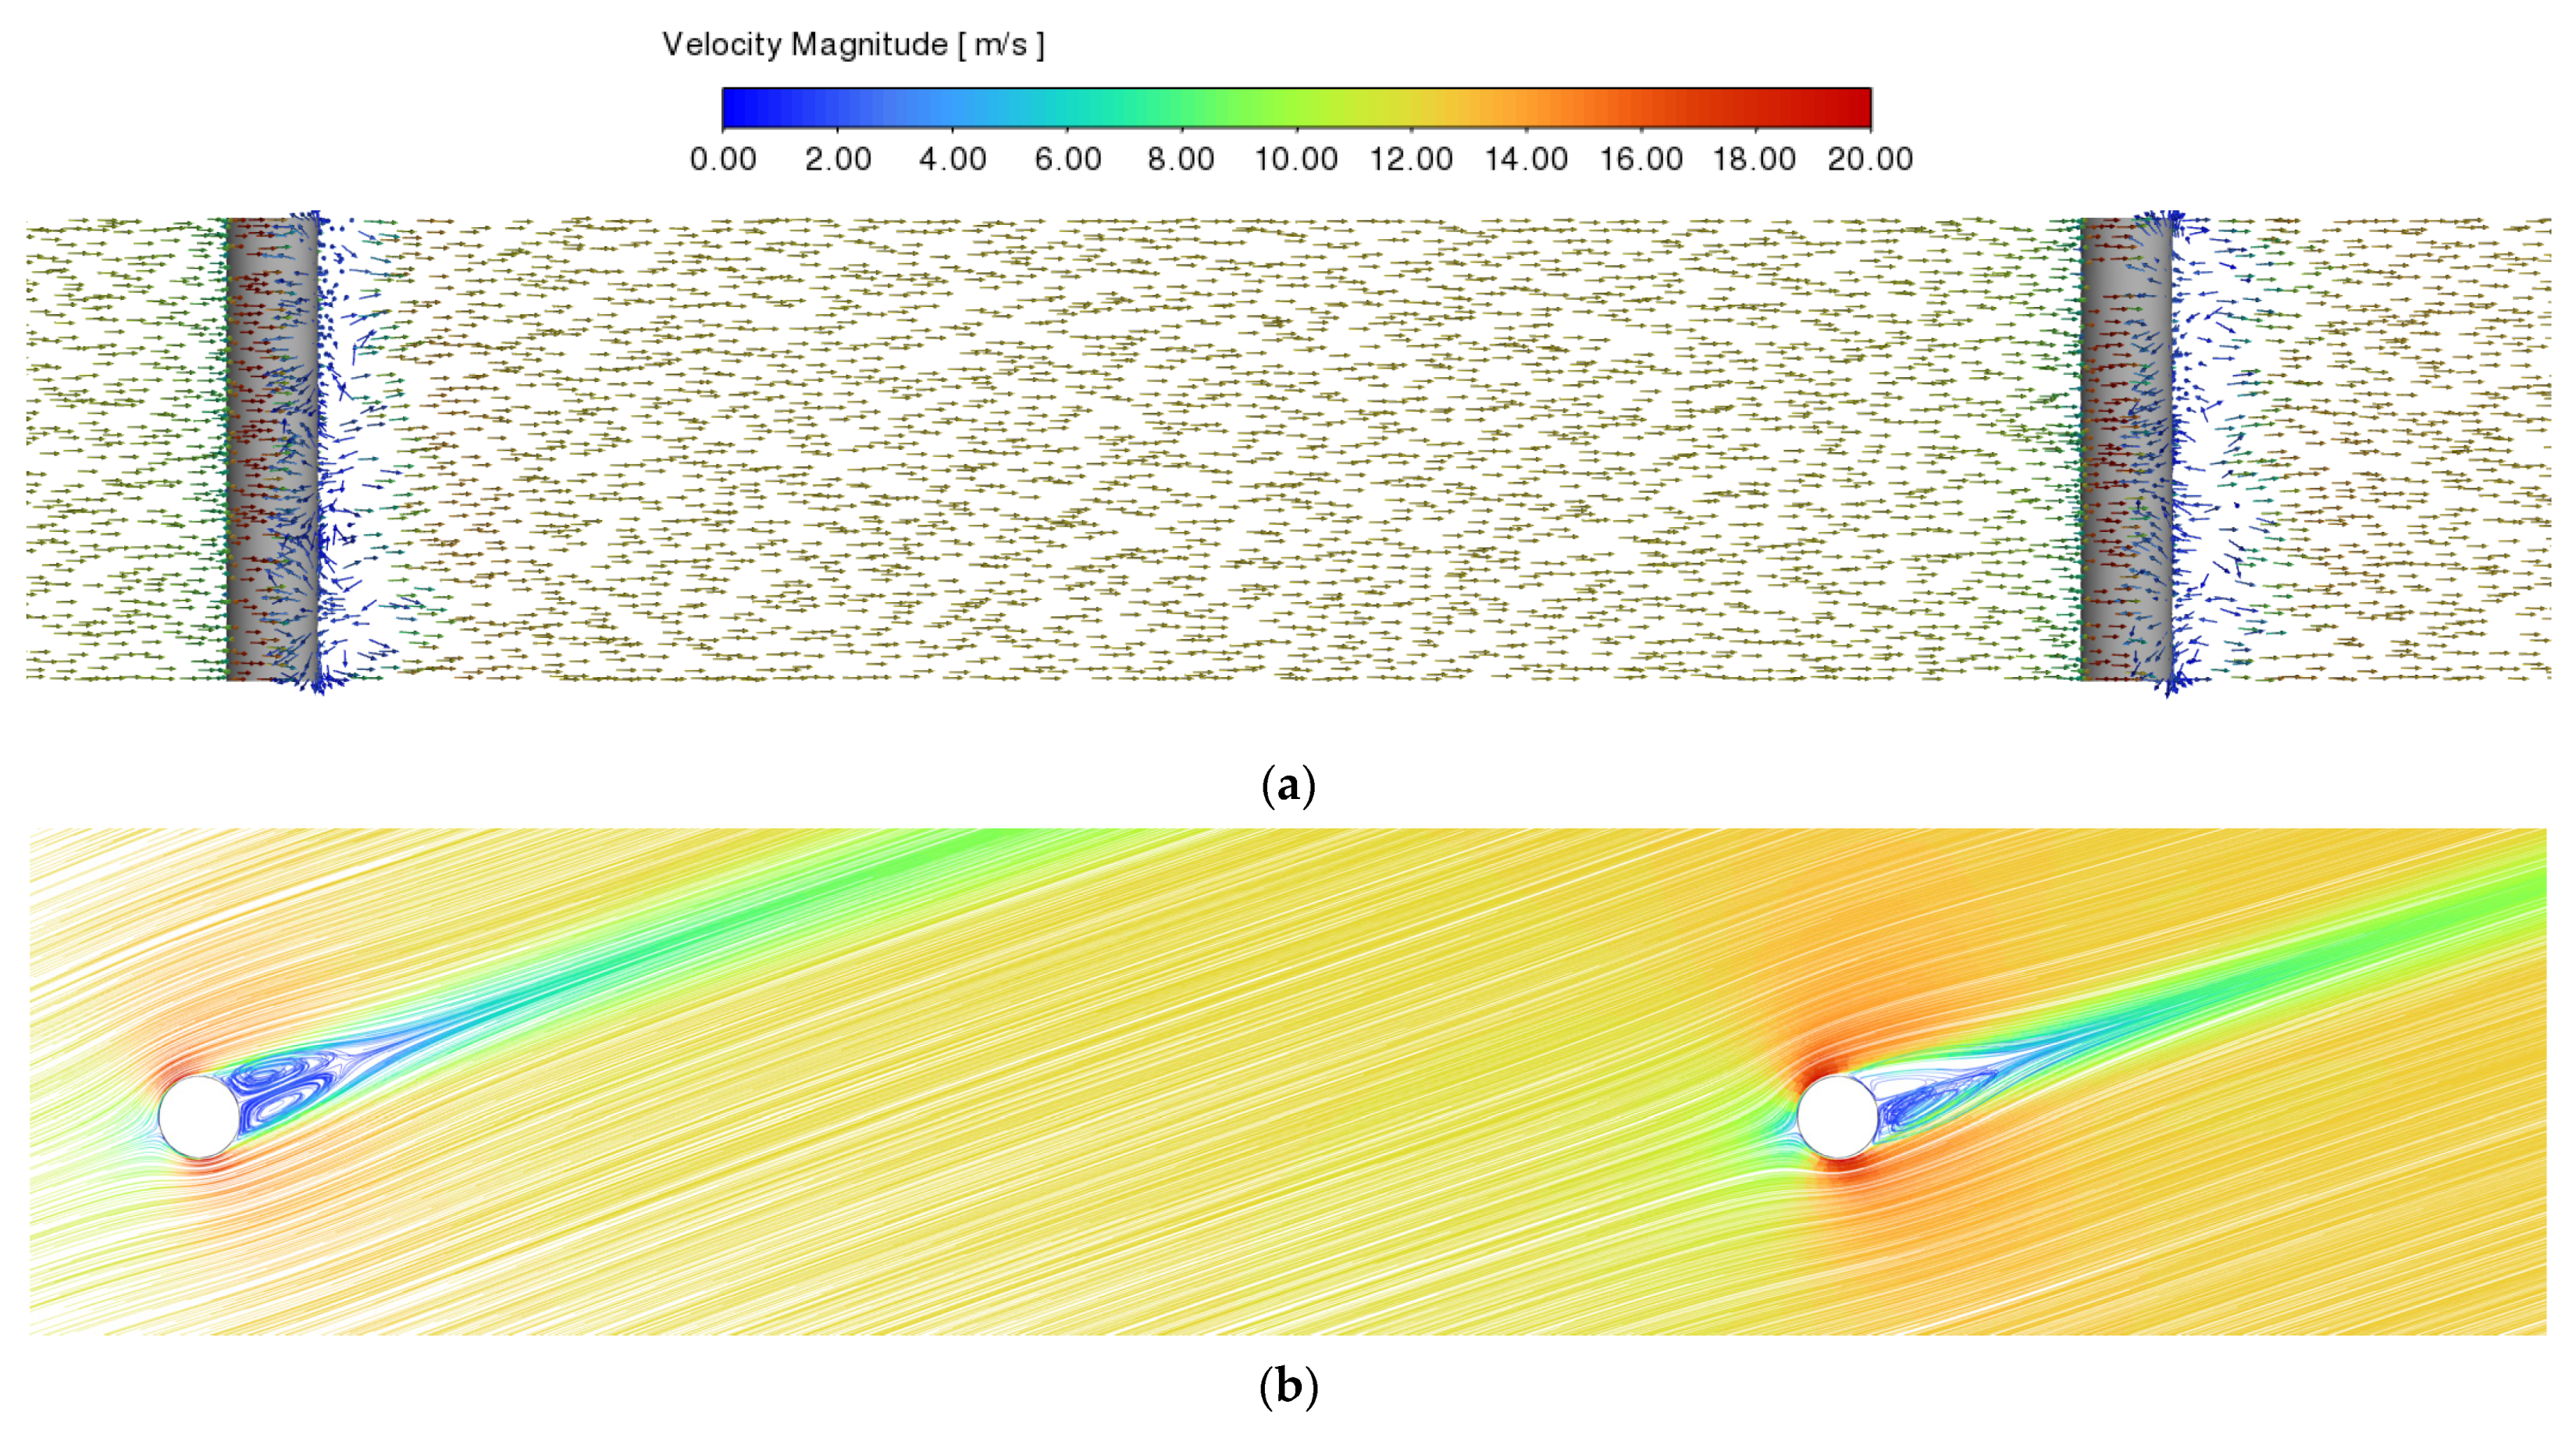
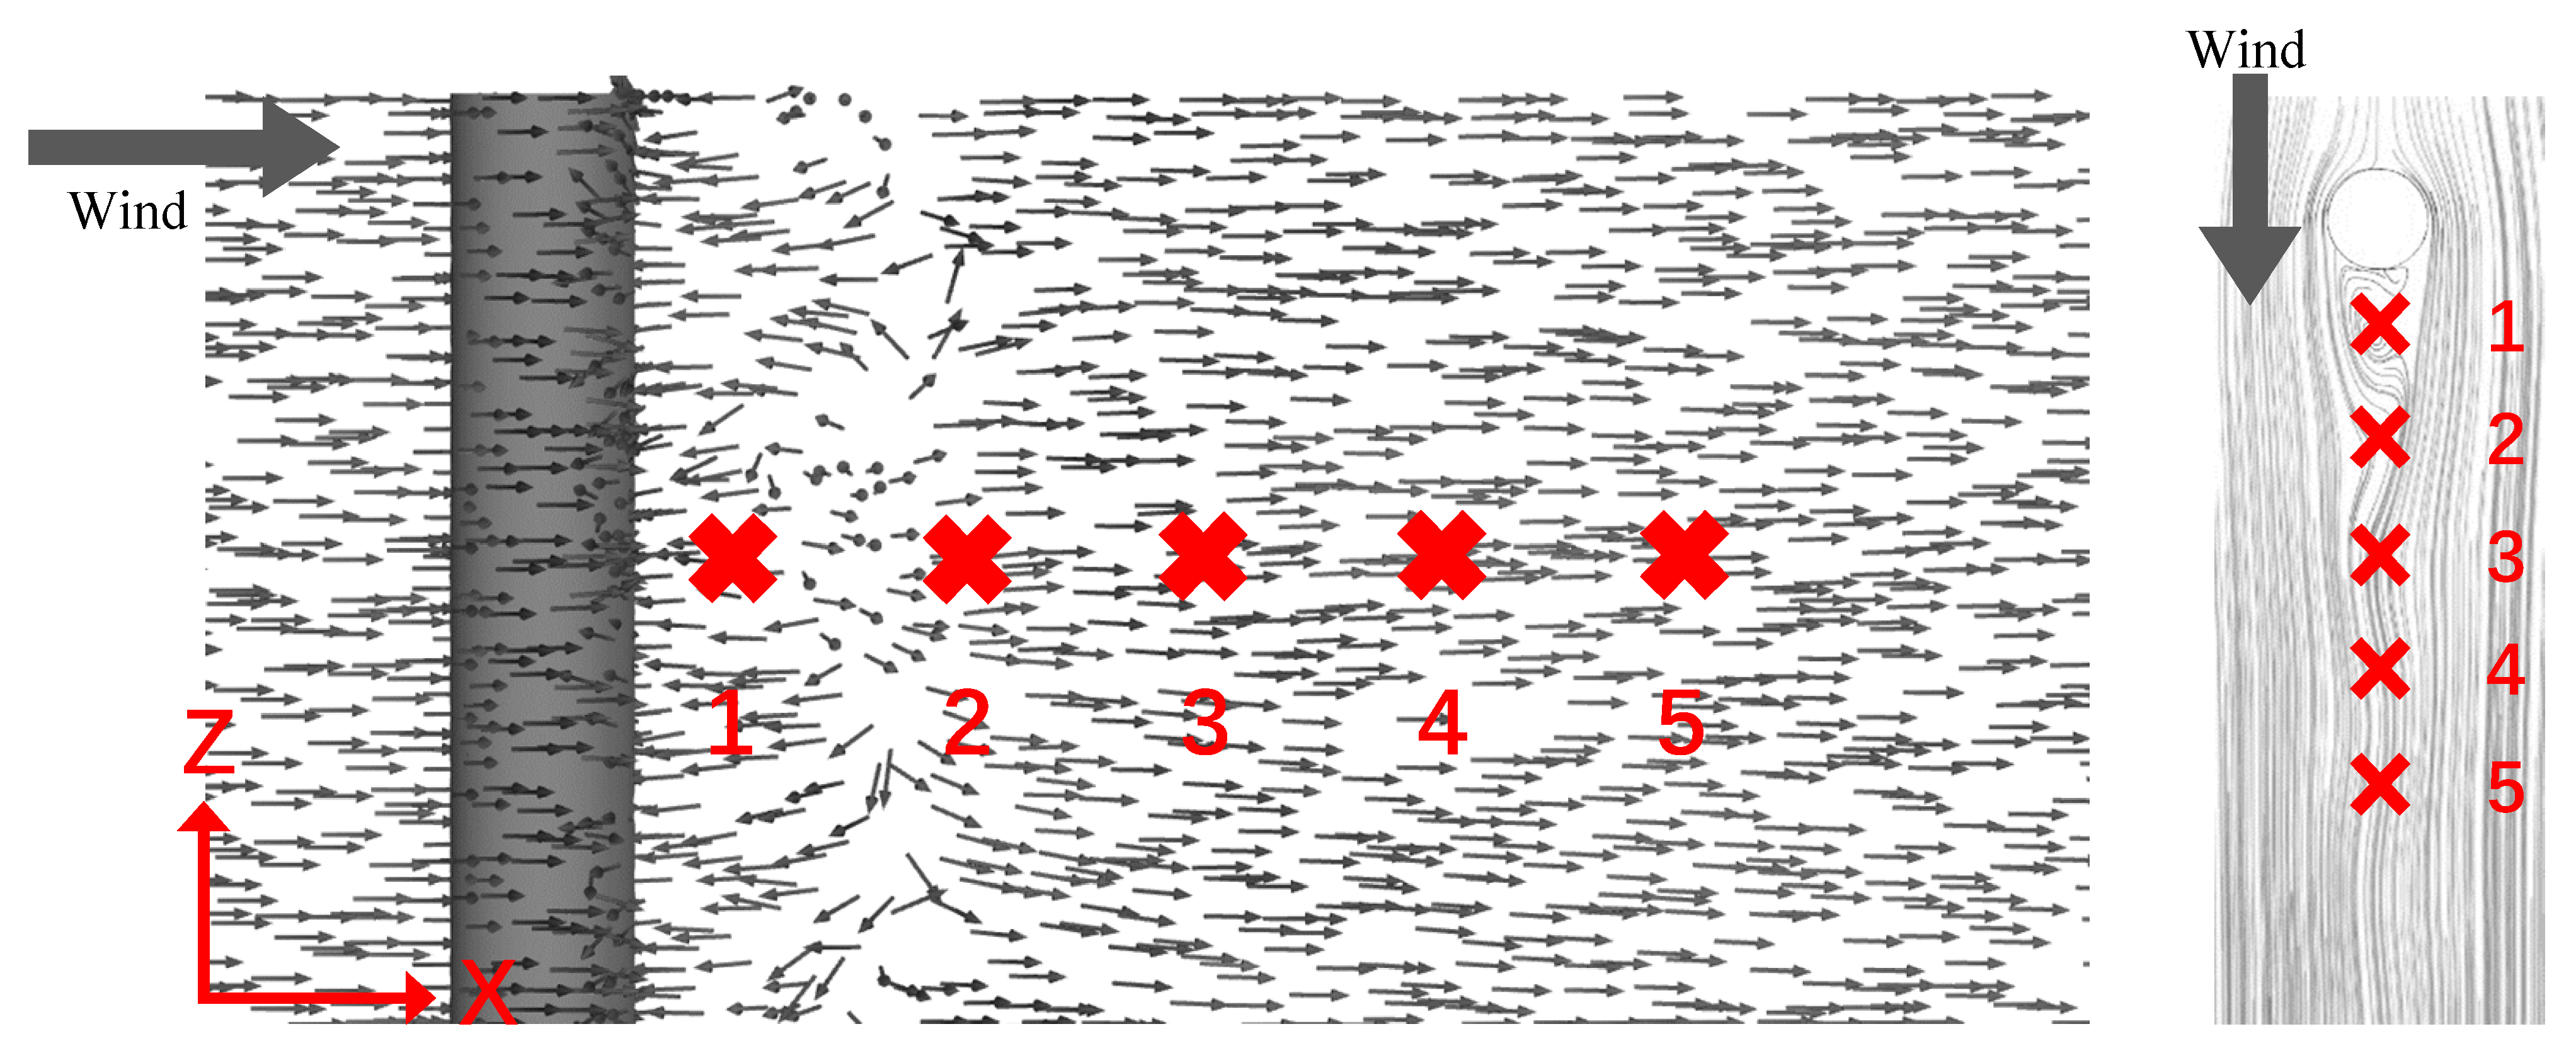
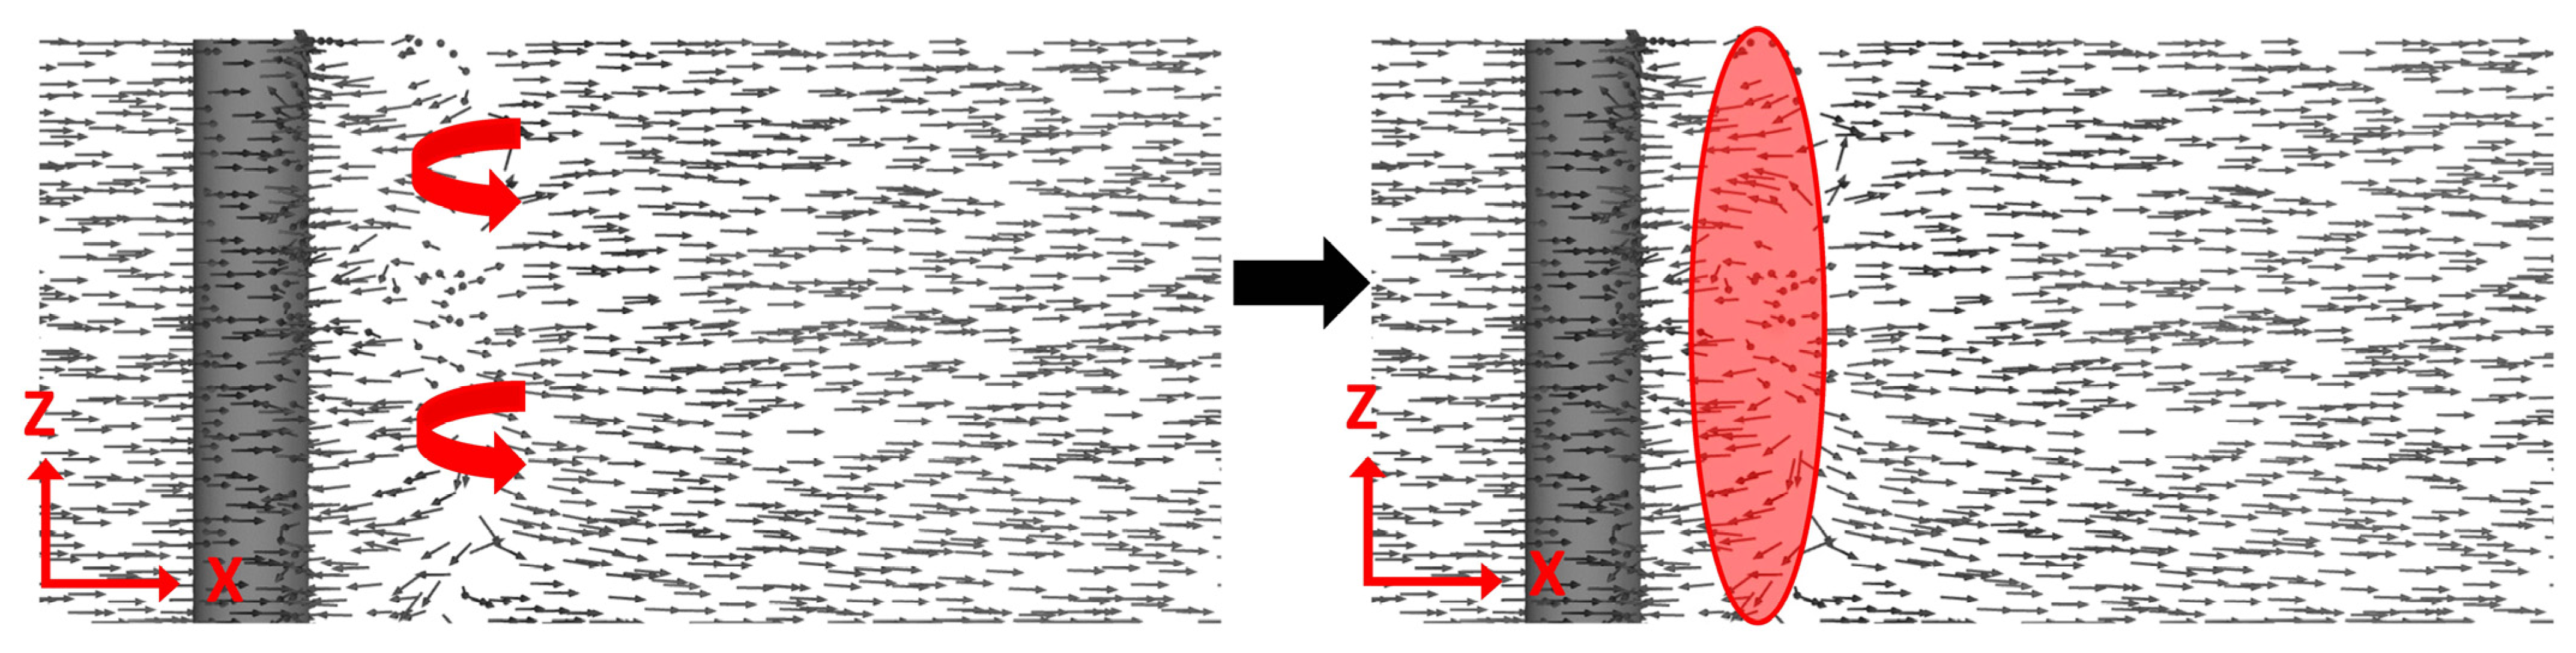
3. Unsafe Zone Identification
- (1)
- The solution method uses the pressure-velocity coupled SIMPLE algorithm
- (2)
- The density of the set fluid (air) is 1.29 kg/m3, the specific heat capacity is 1006 J/(kg·K), the thermal conductivity is 0.0242 W/(m·K), and the viscosity is 1.8 × 10⁻⁵ kg/(m·s).
- (3)
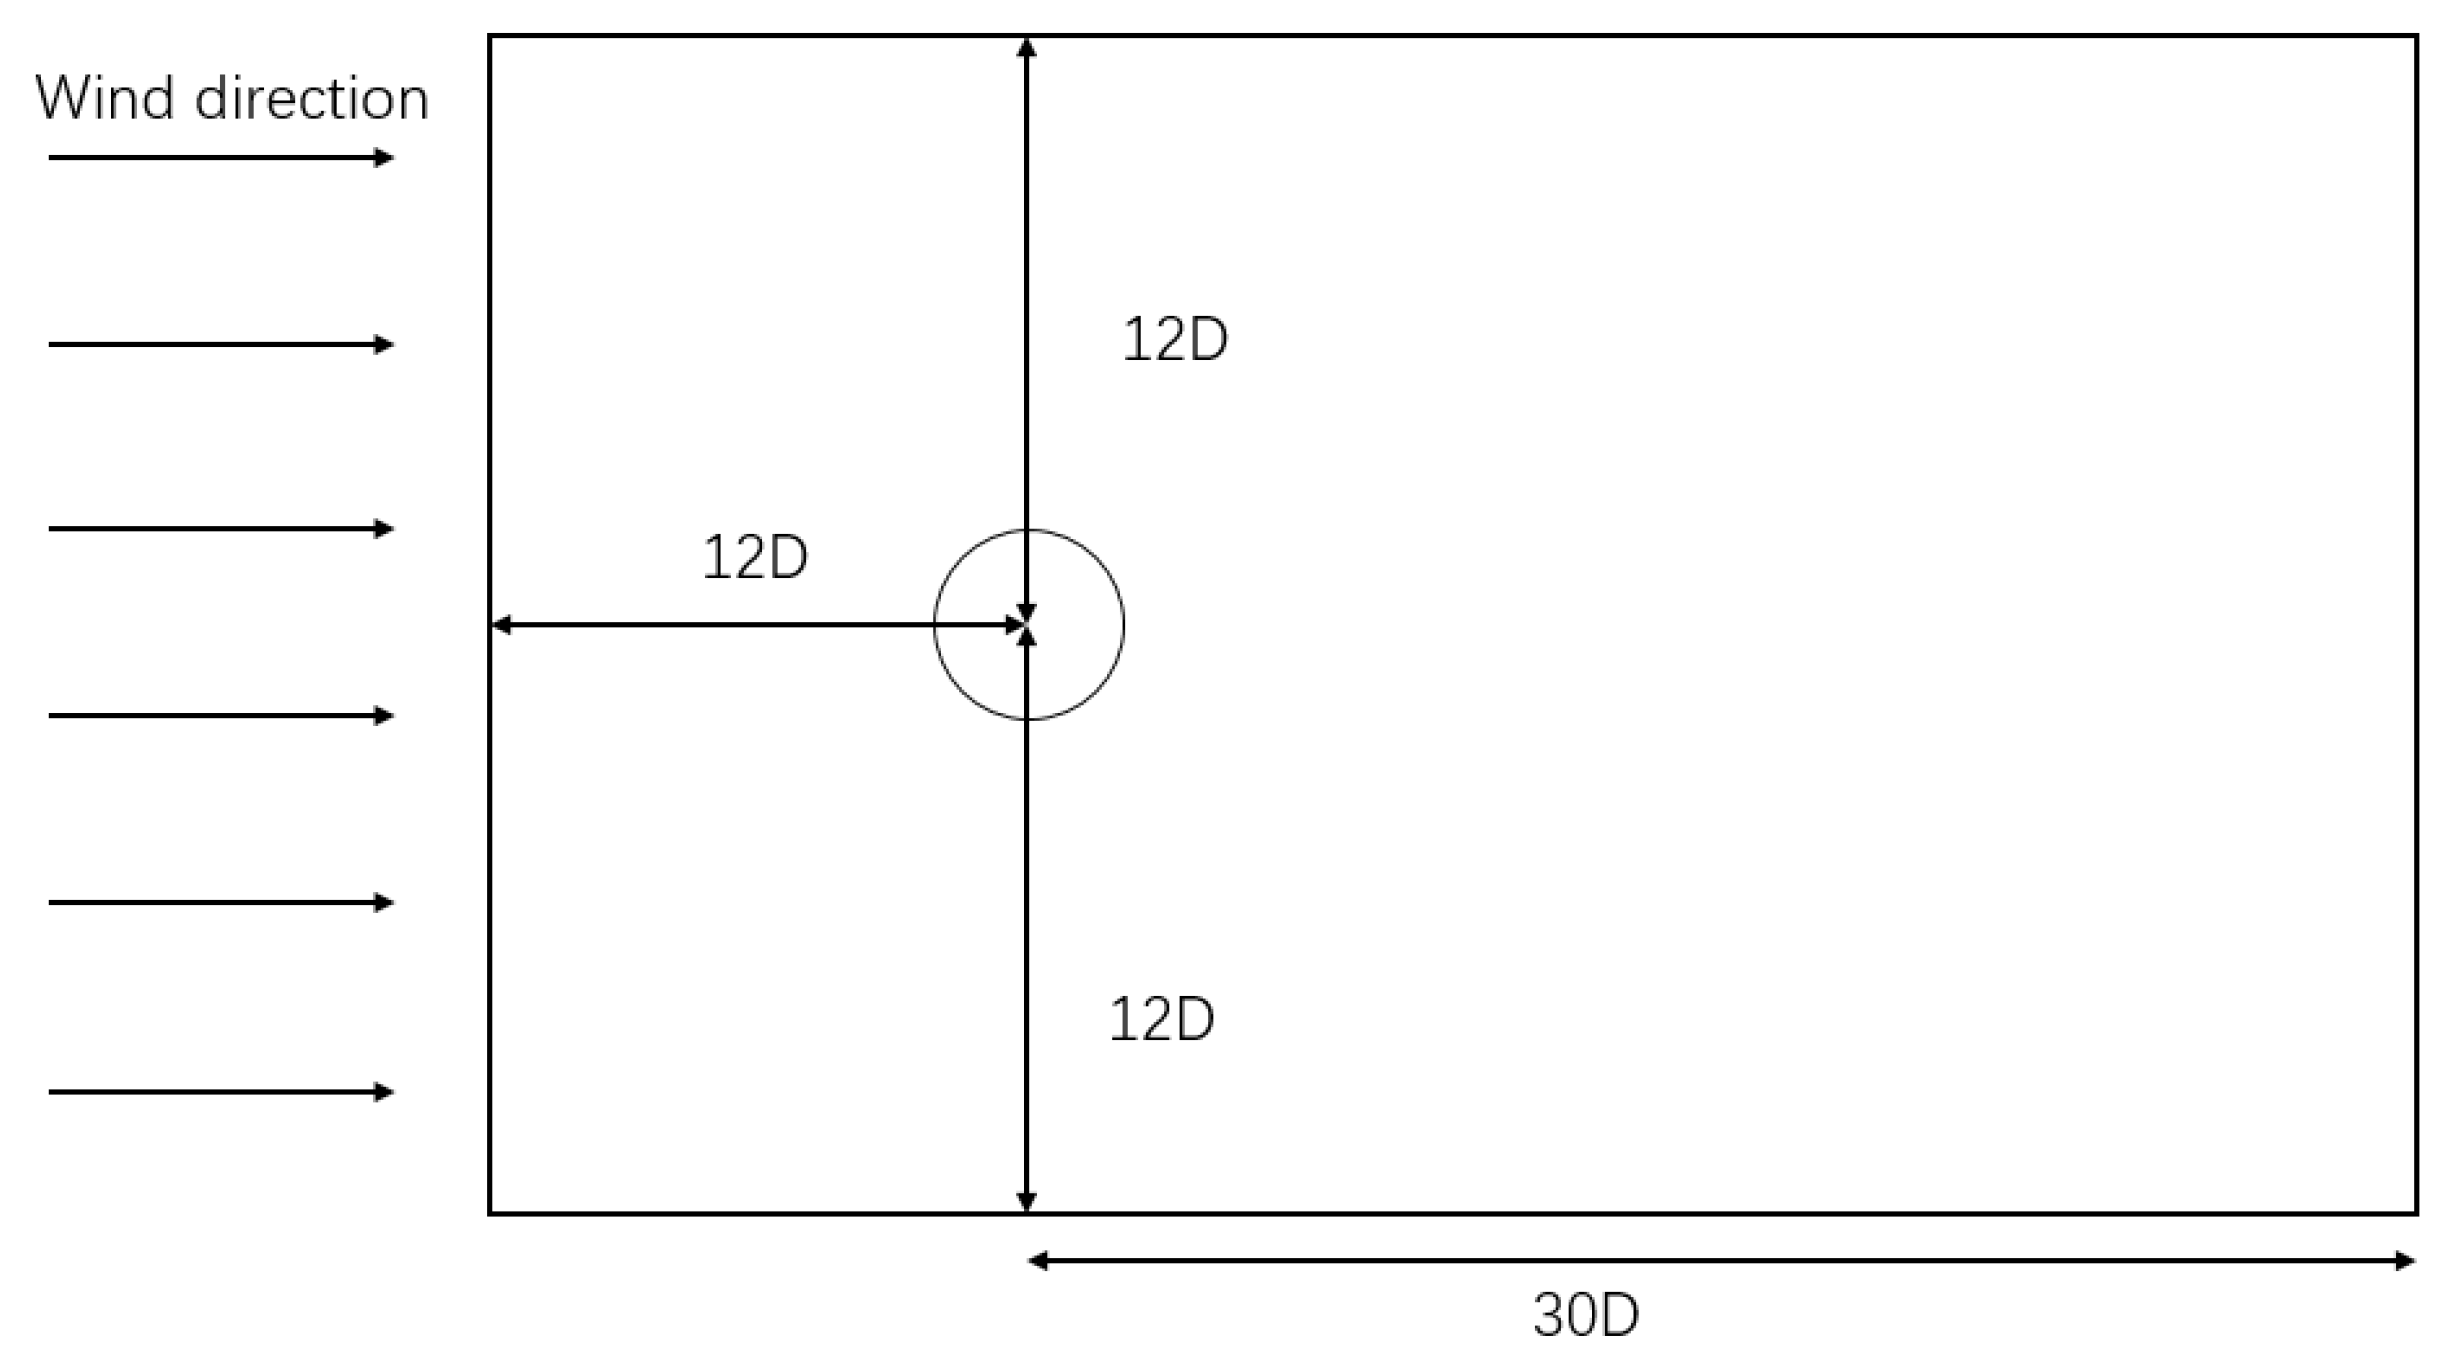
- The average static pressure, P, is zero, and the outlet is on the right boundary.
- (4)
- Symmetric boundary conditions are applied at the two spanwise borders of the computing domain, and the components of each variable in the normal direction are all equal to zero.
3.1. Wind Speed Effects
3.2. Air Temperature Effects
3.3. Wind Angle Effects
3.4. Unsafety Zone Model
4. Path Planning
4.1. Objective Function Design
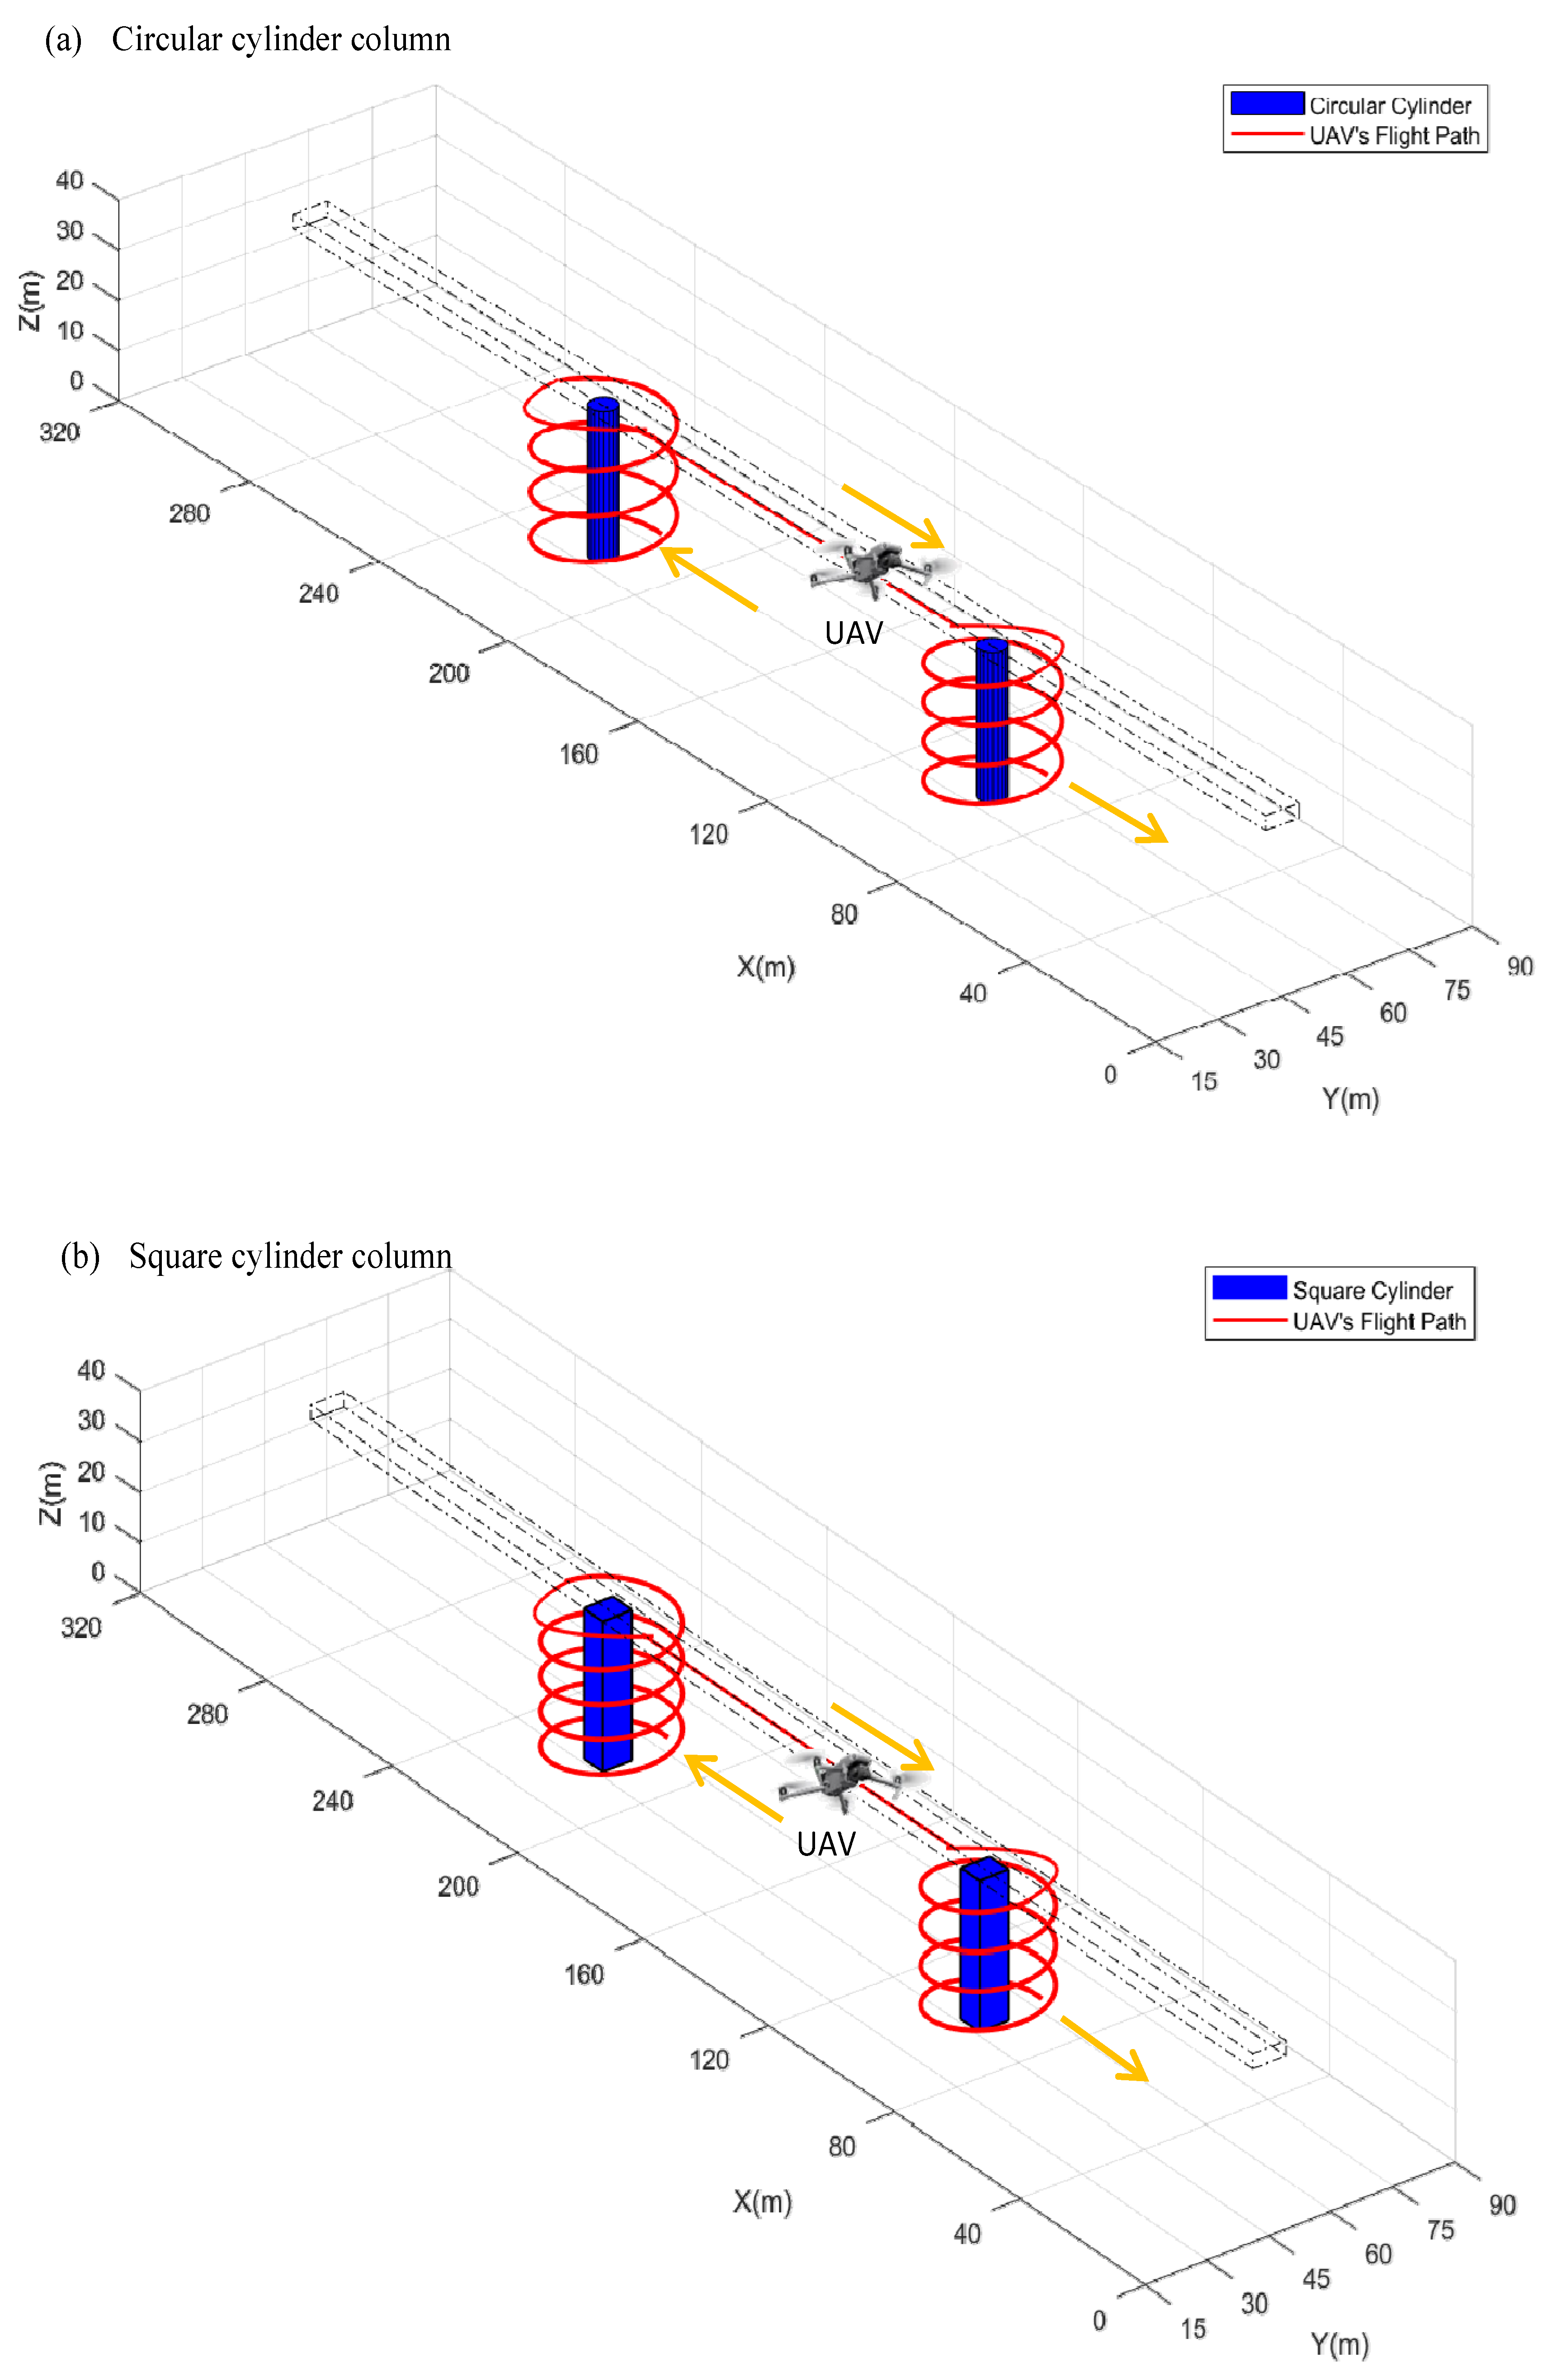
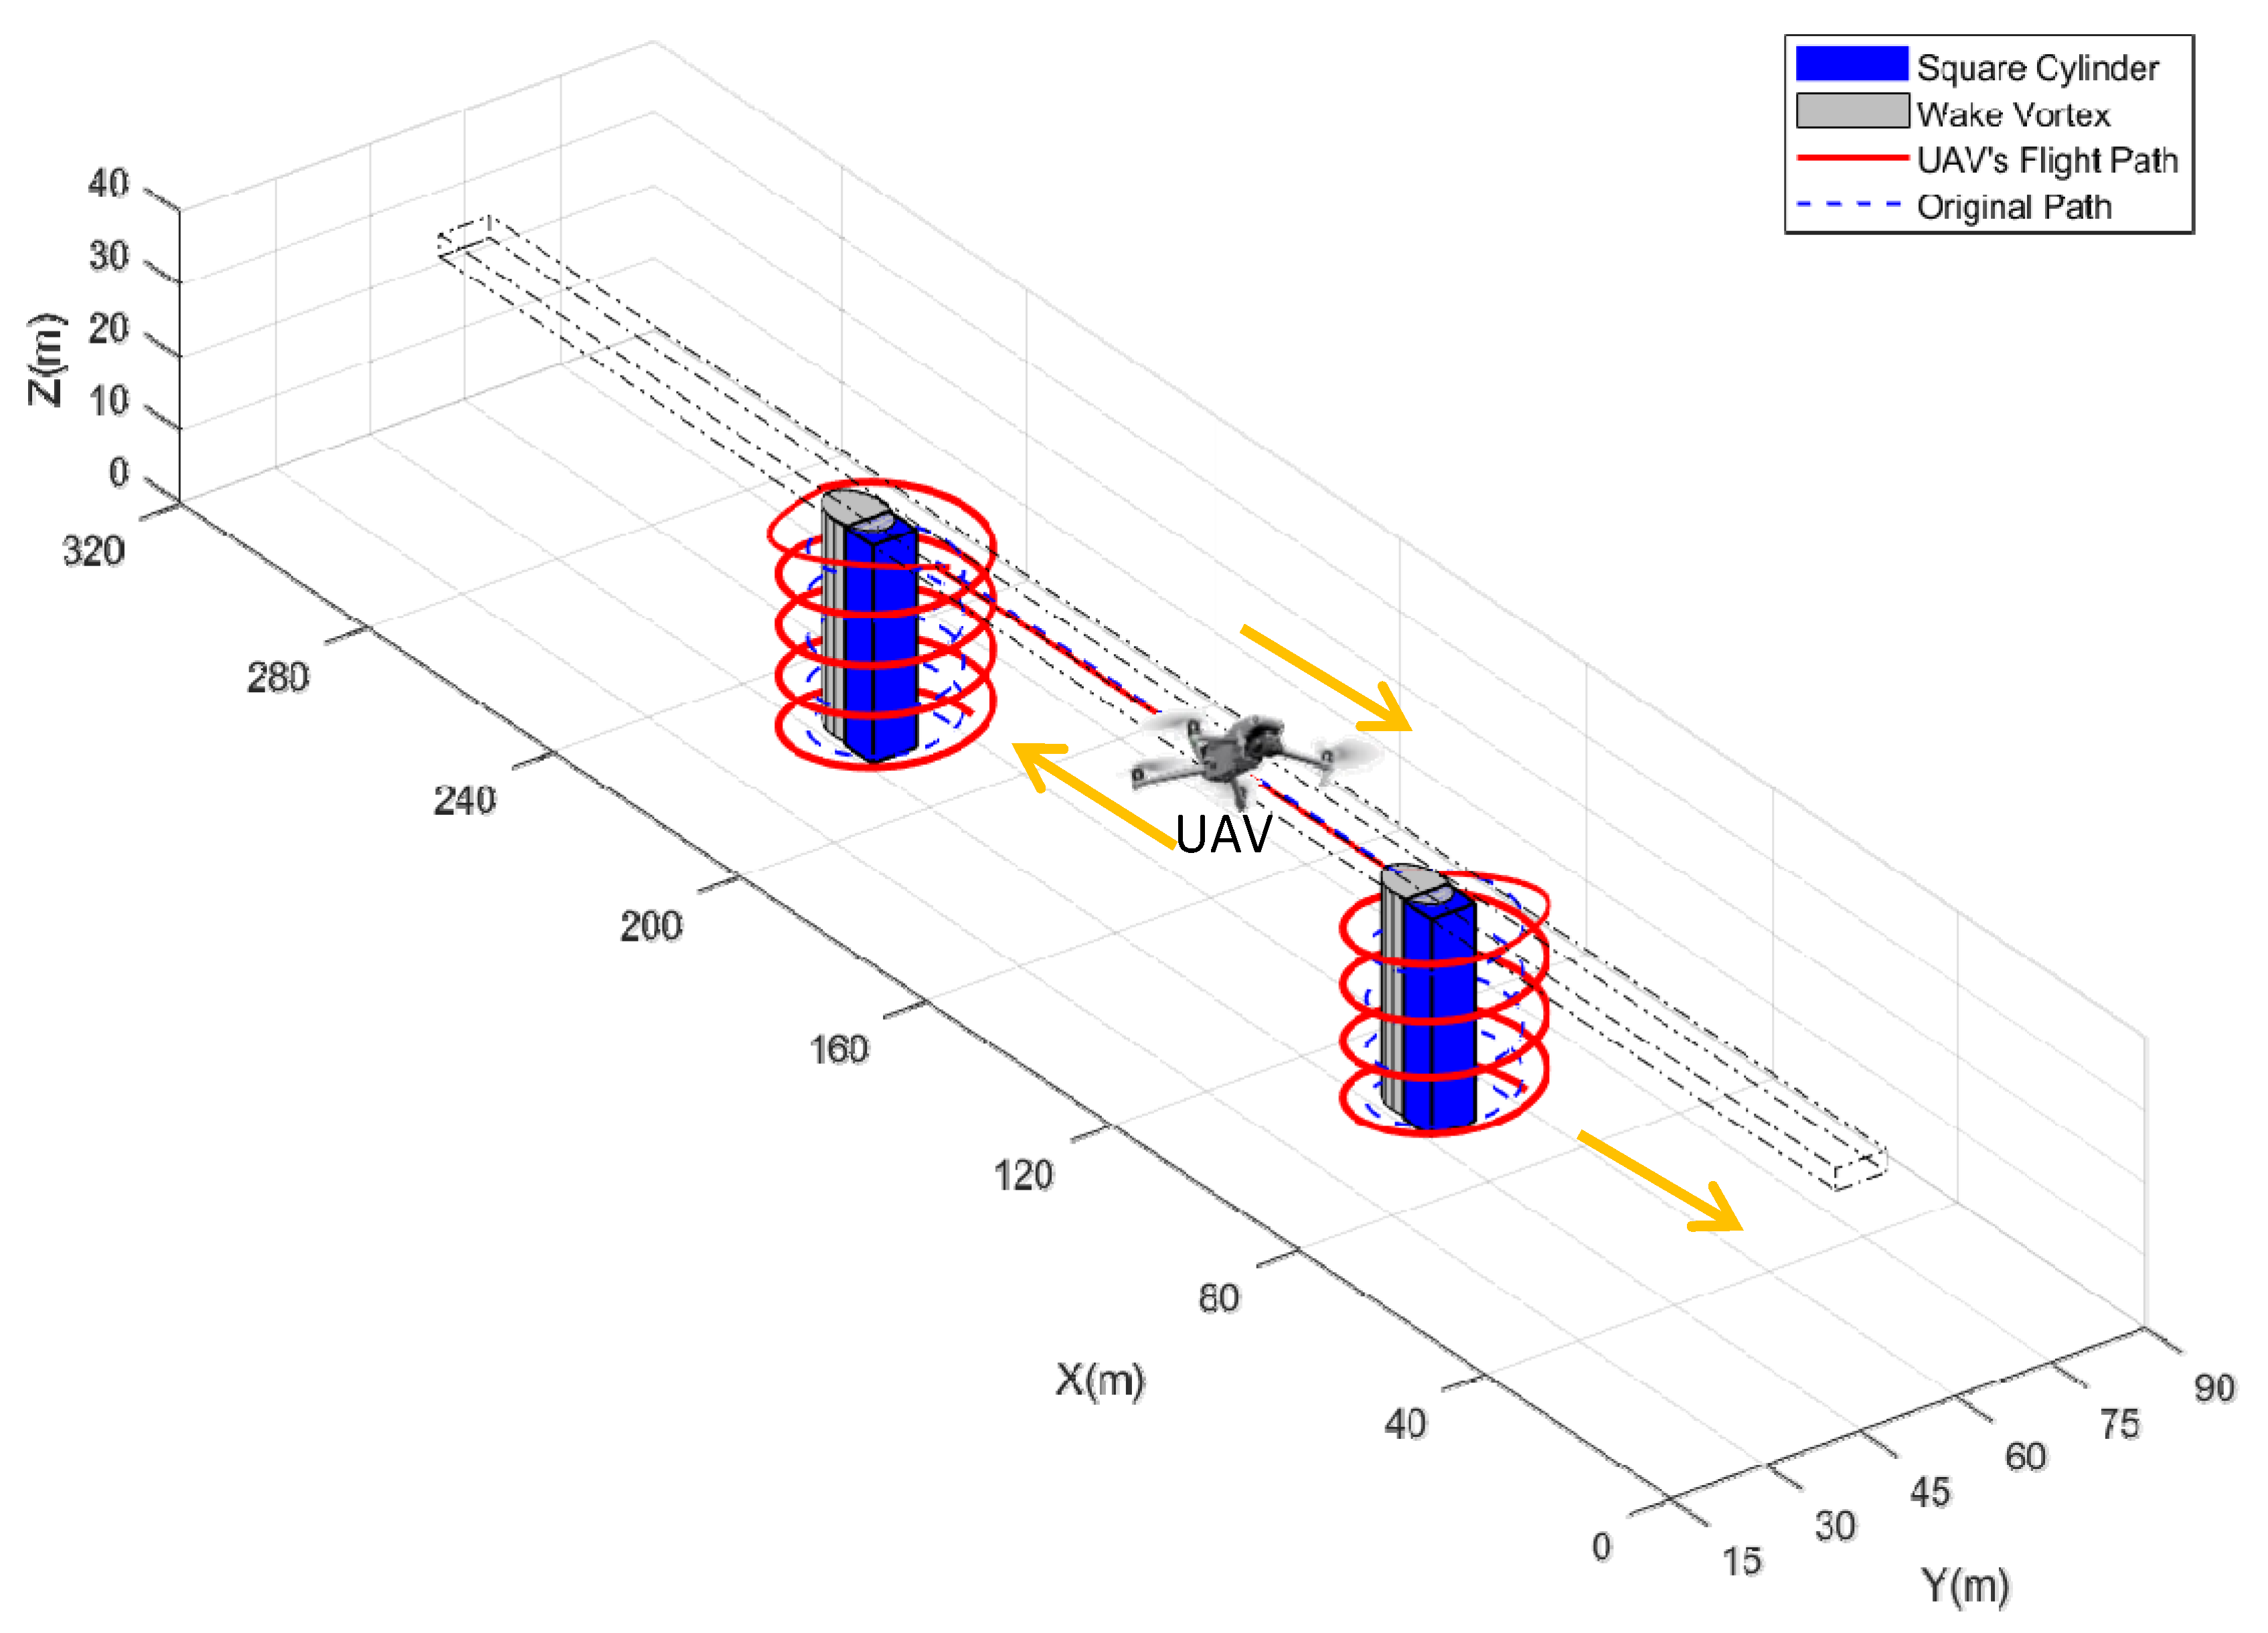
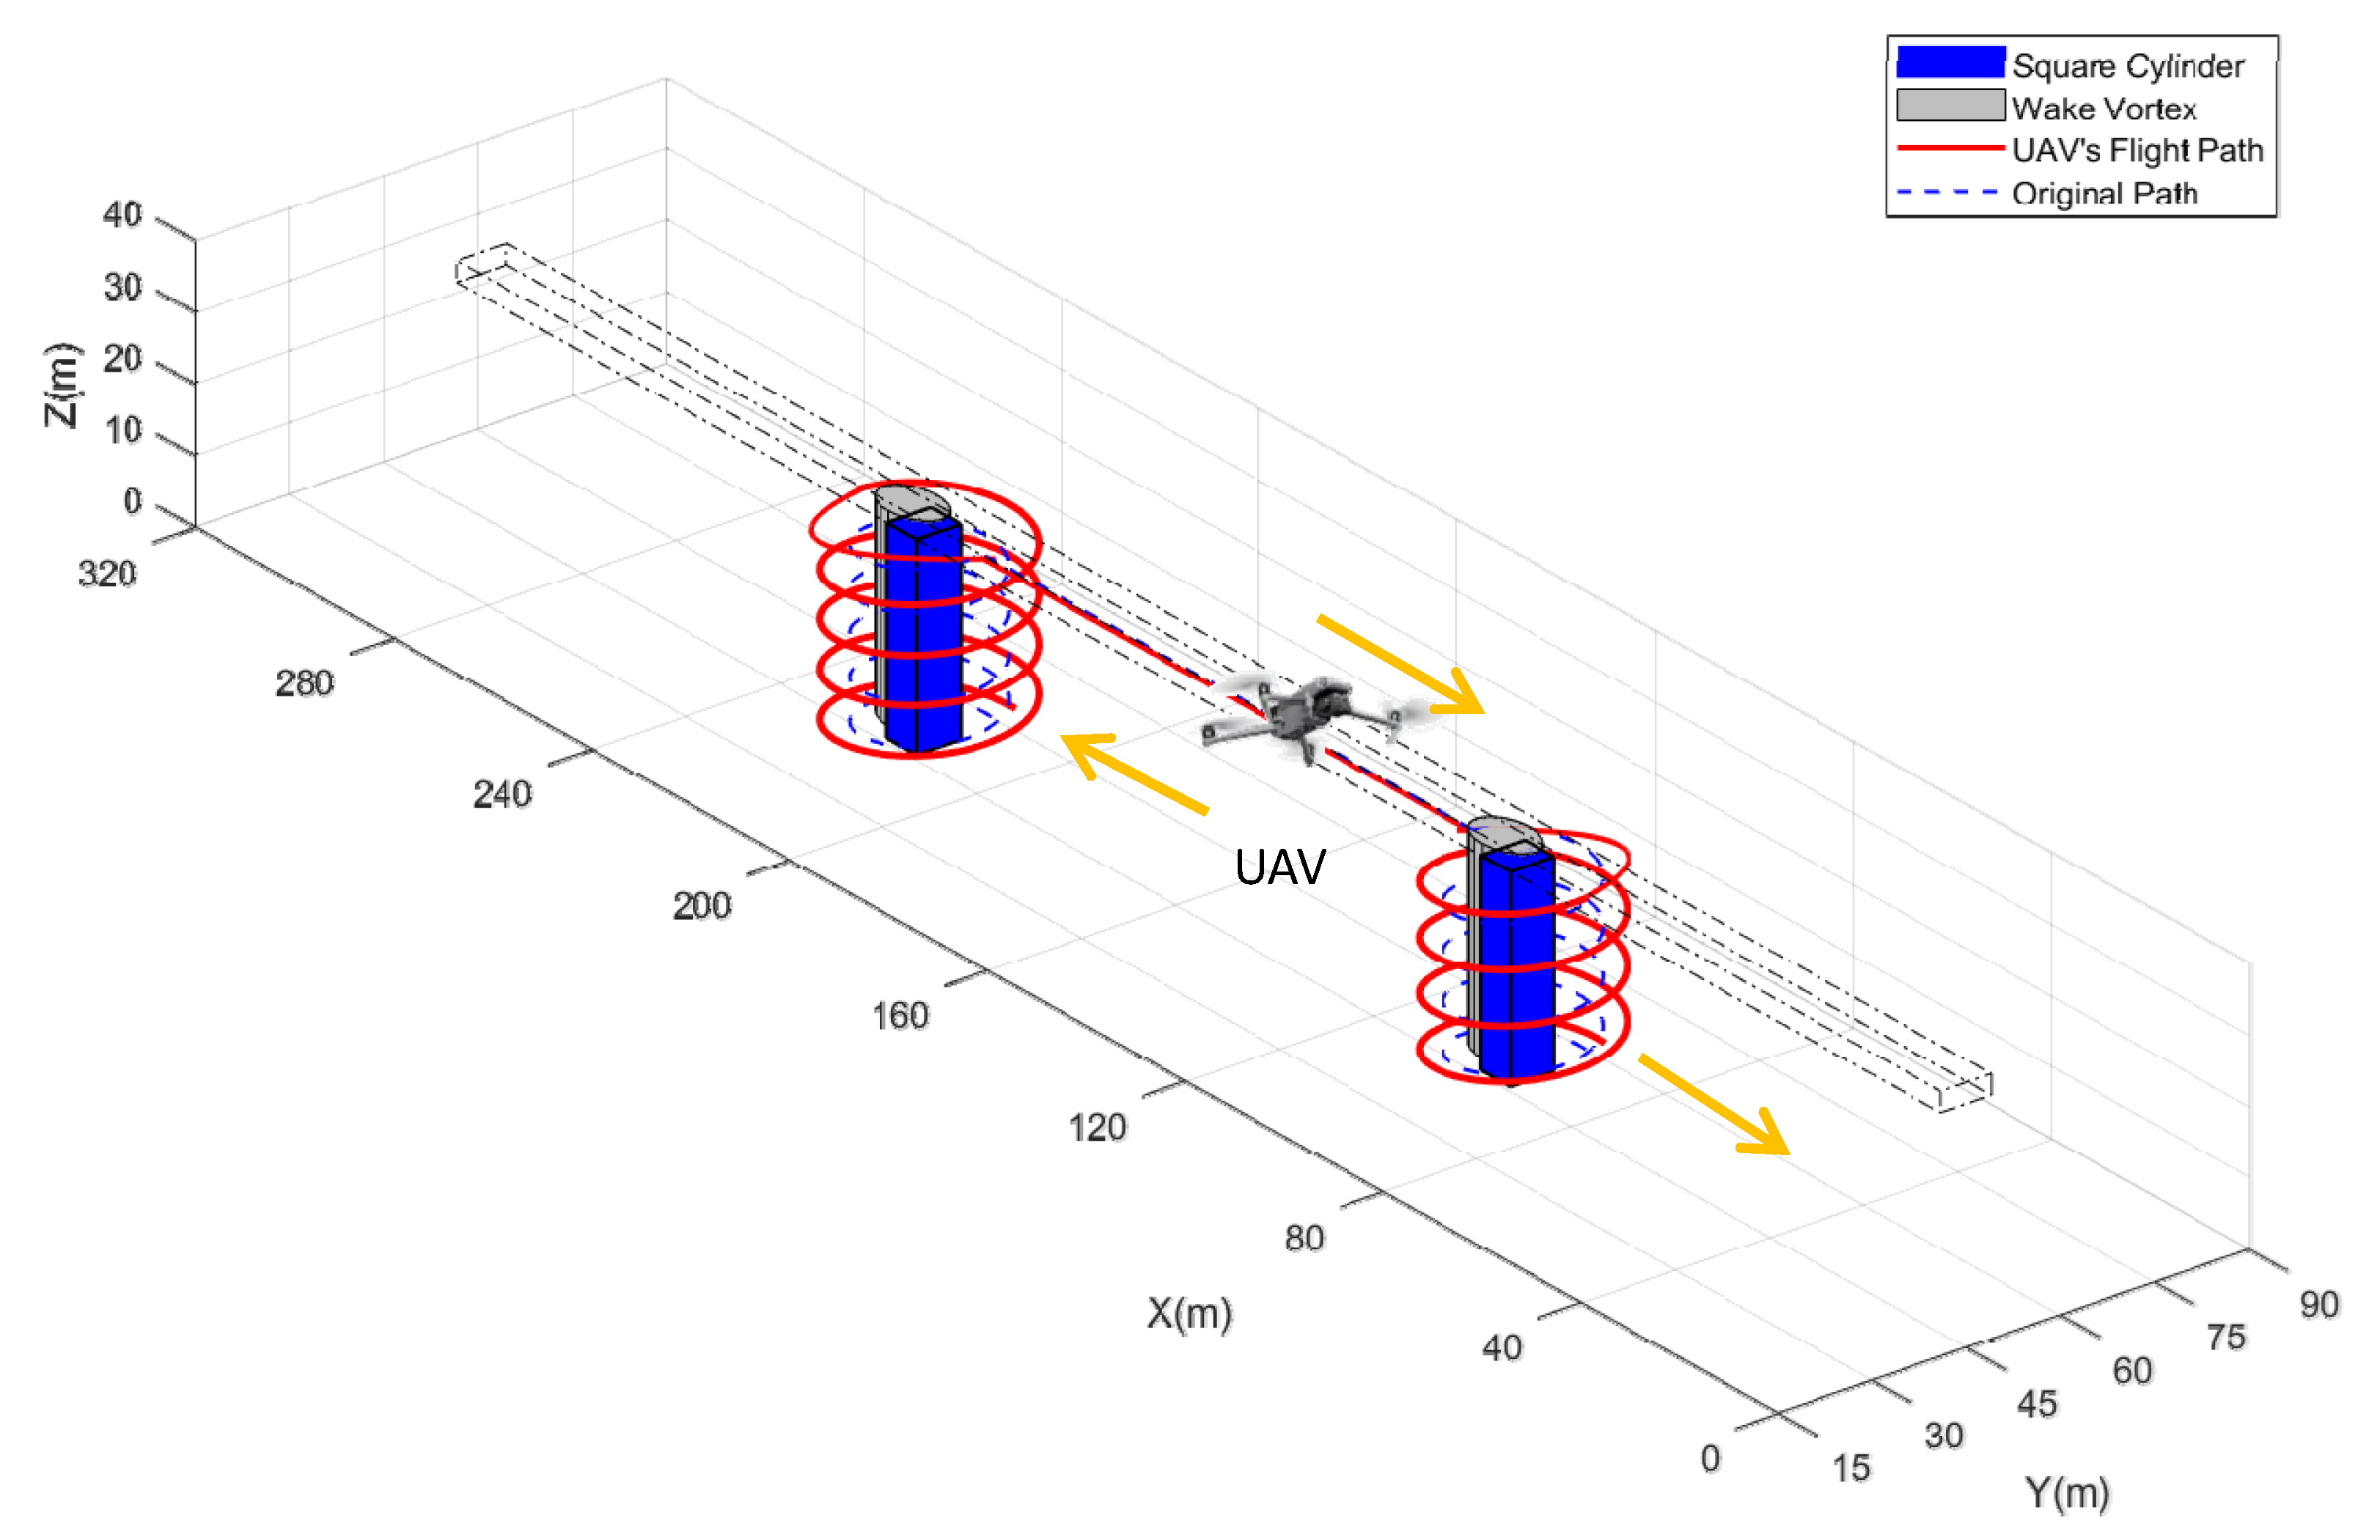
4.2. Flightpath Simulation
5. Conclusions
- (1)
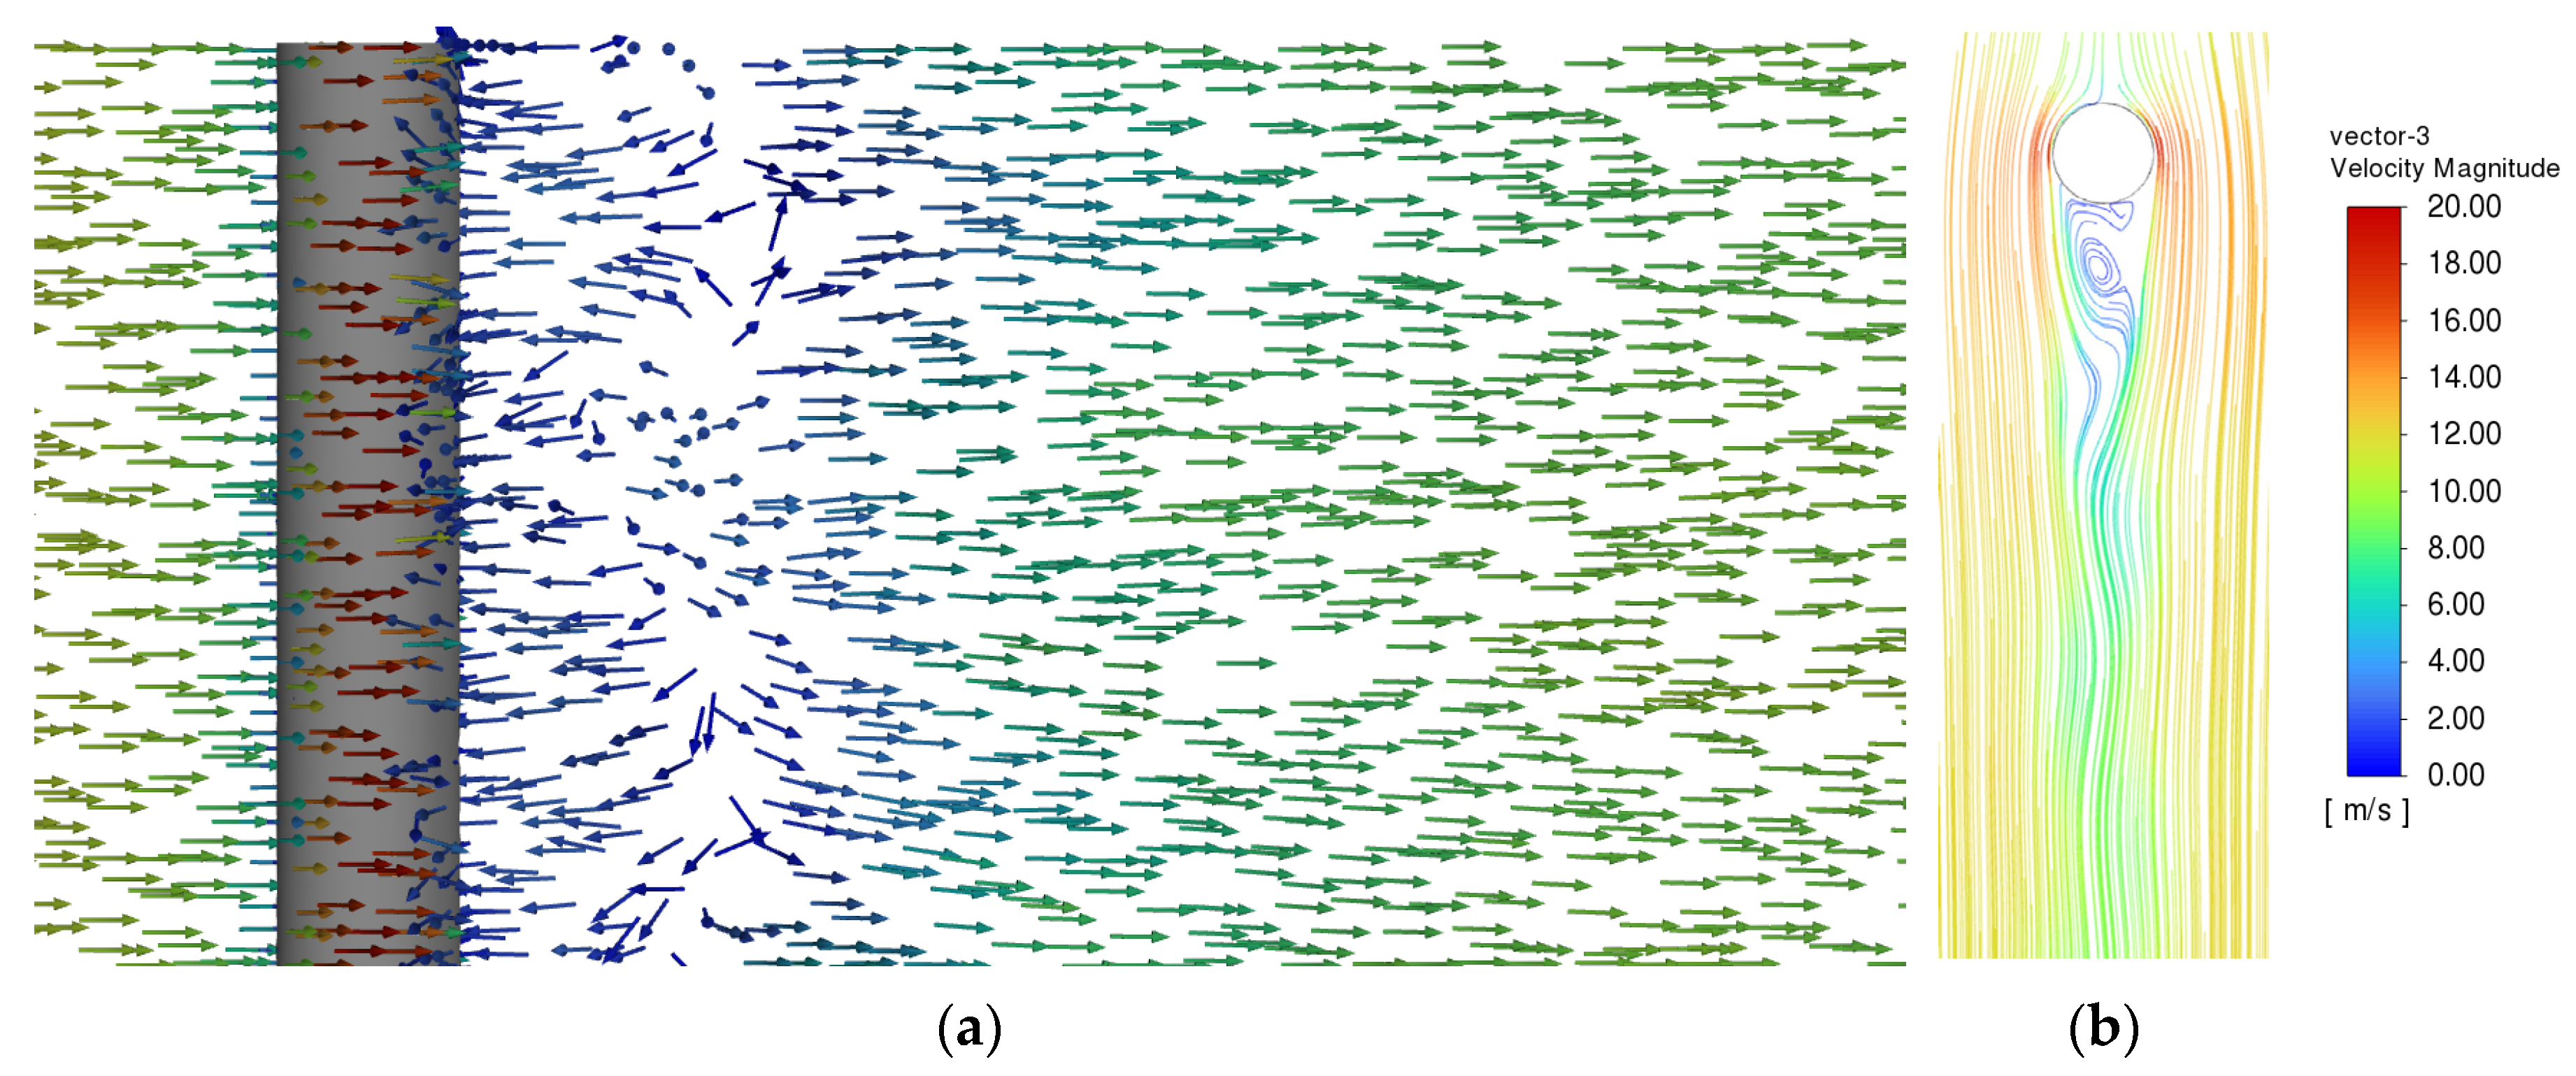
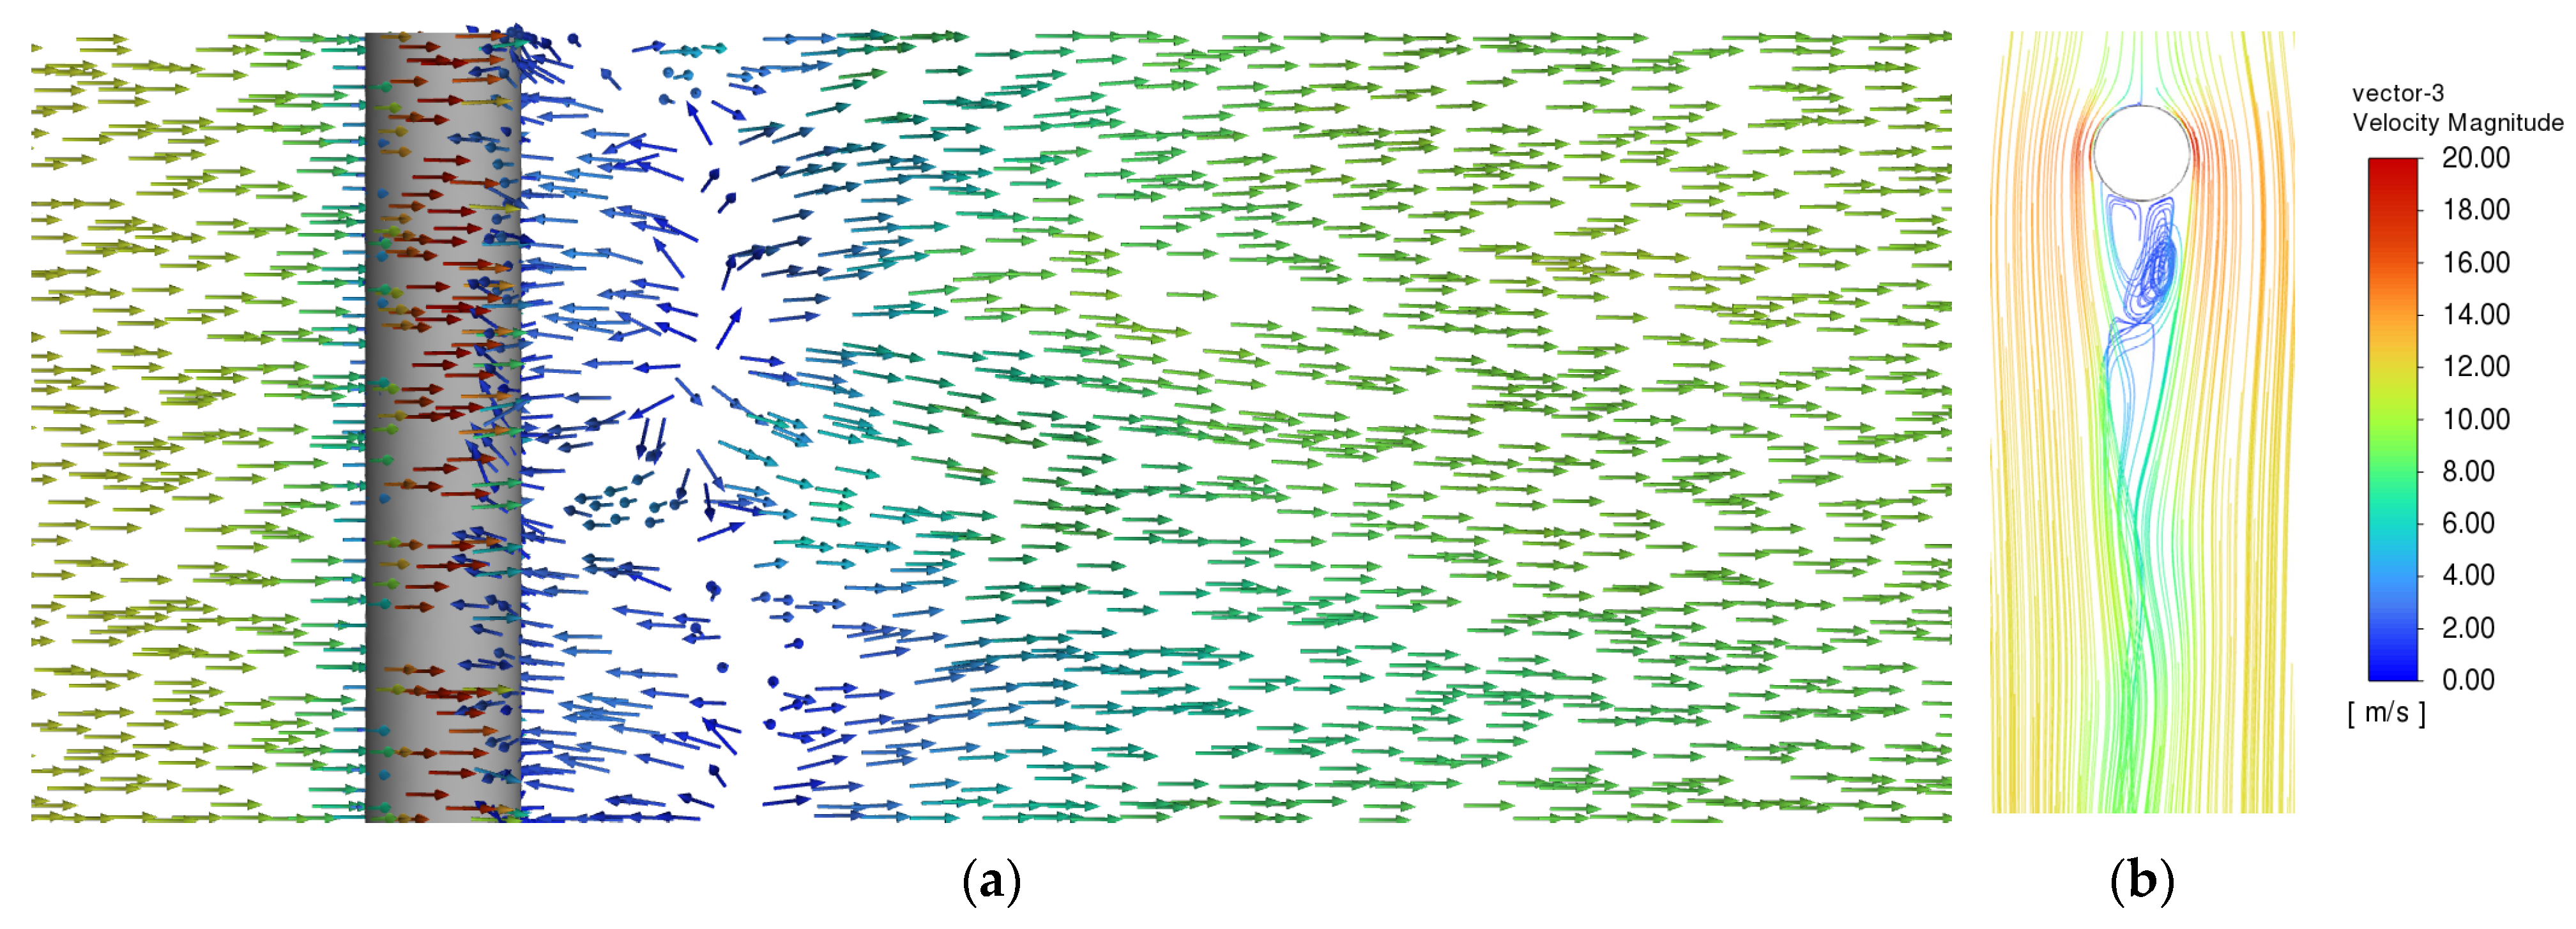
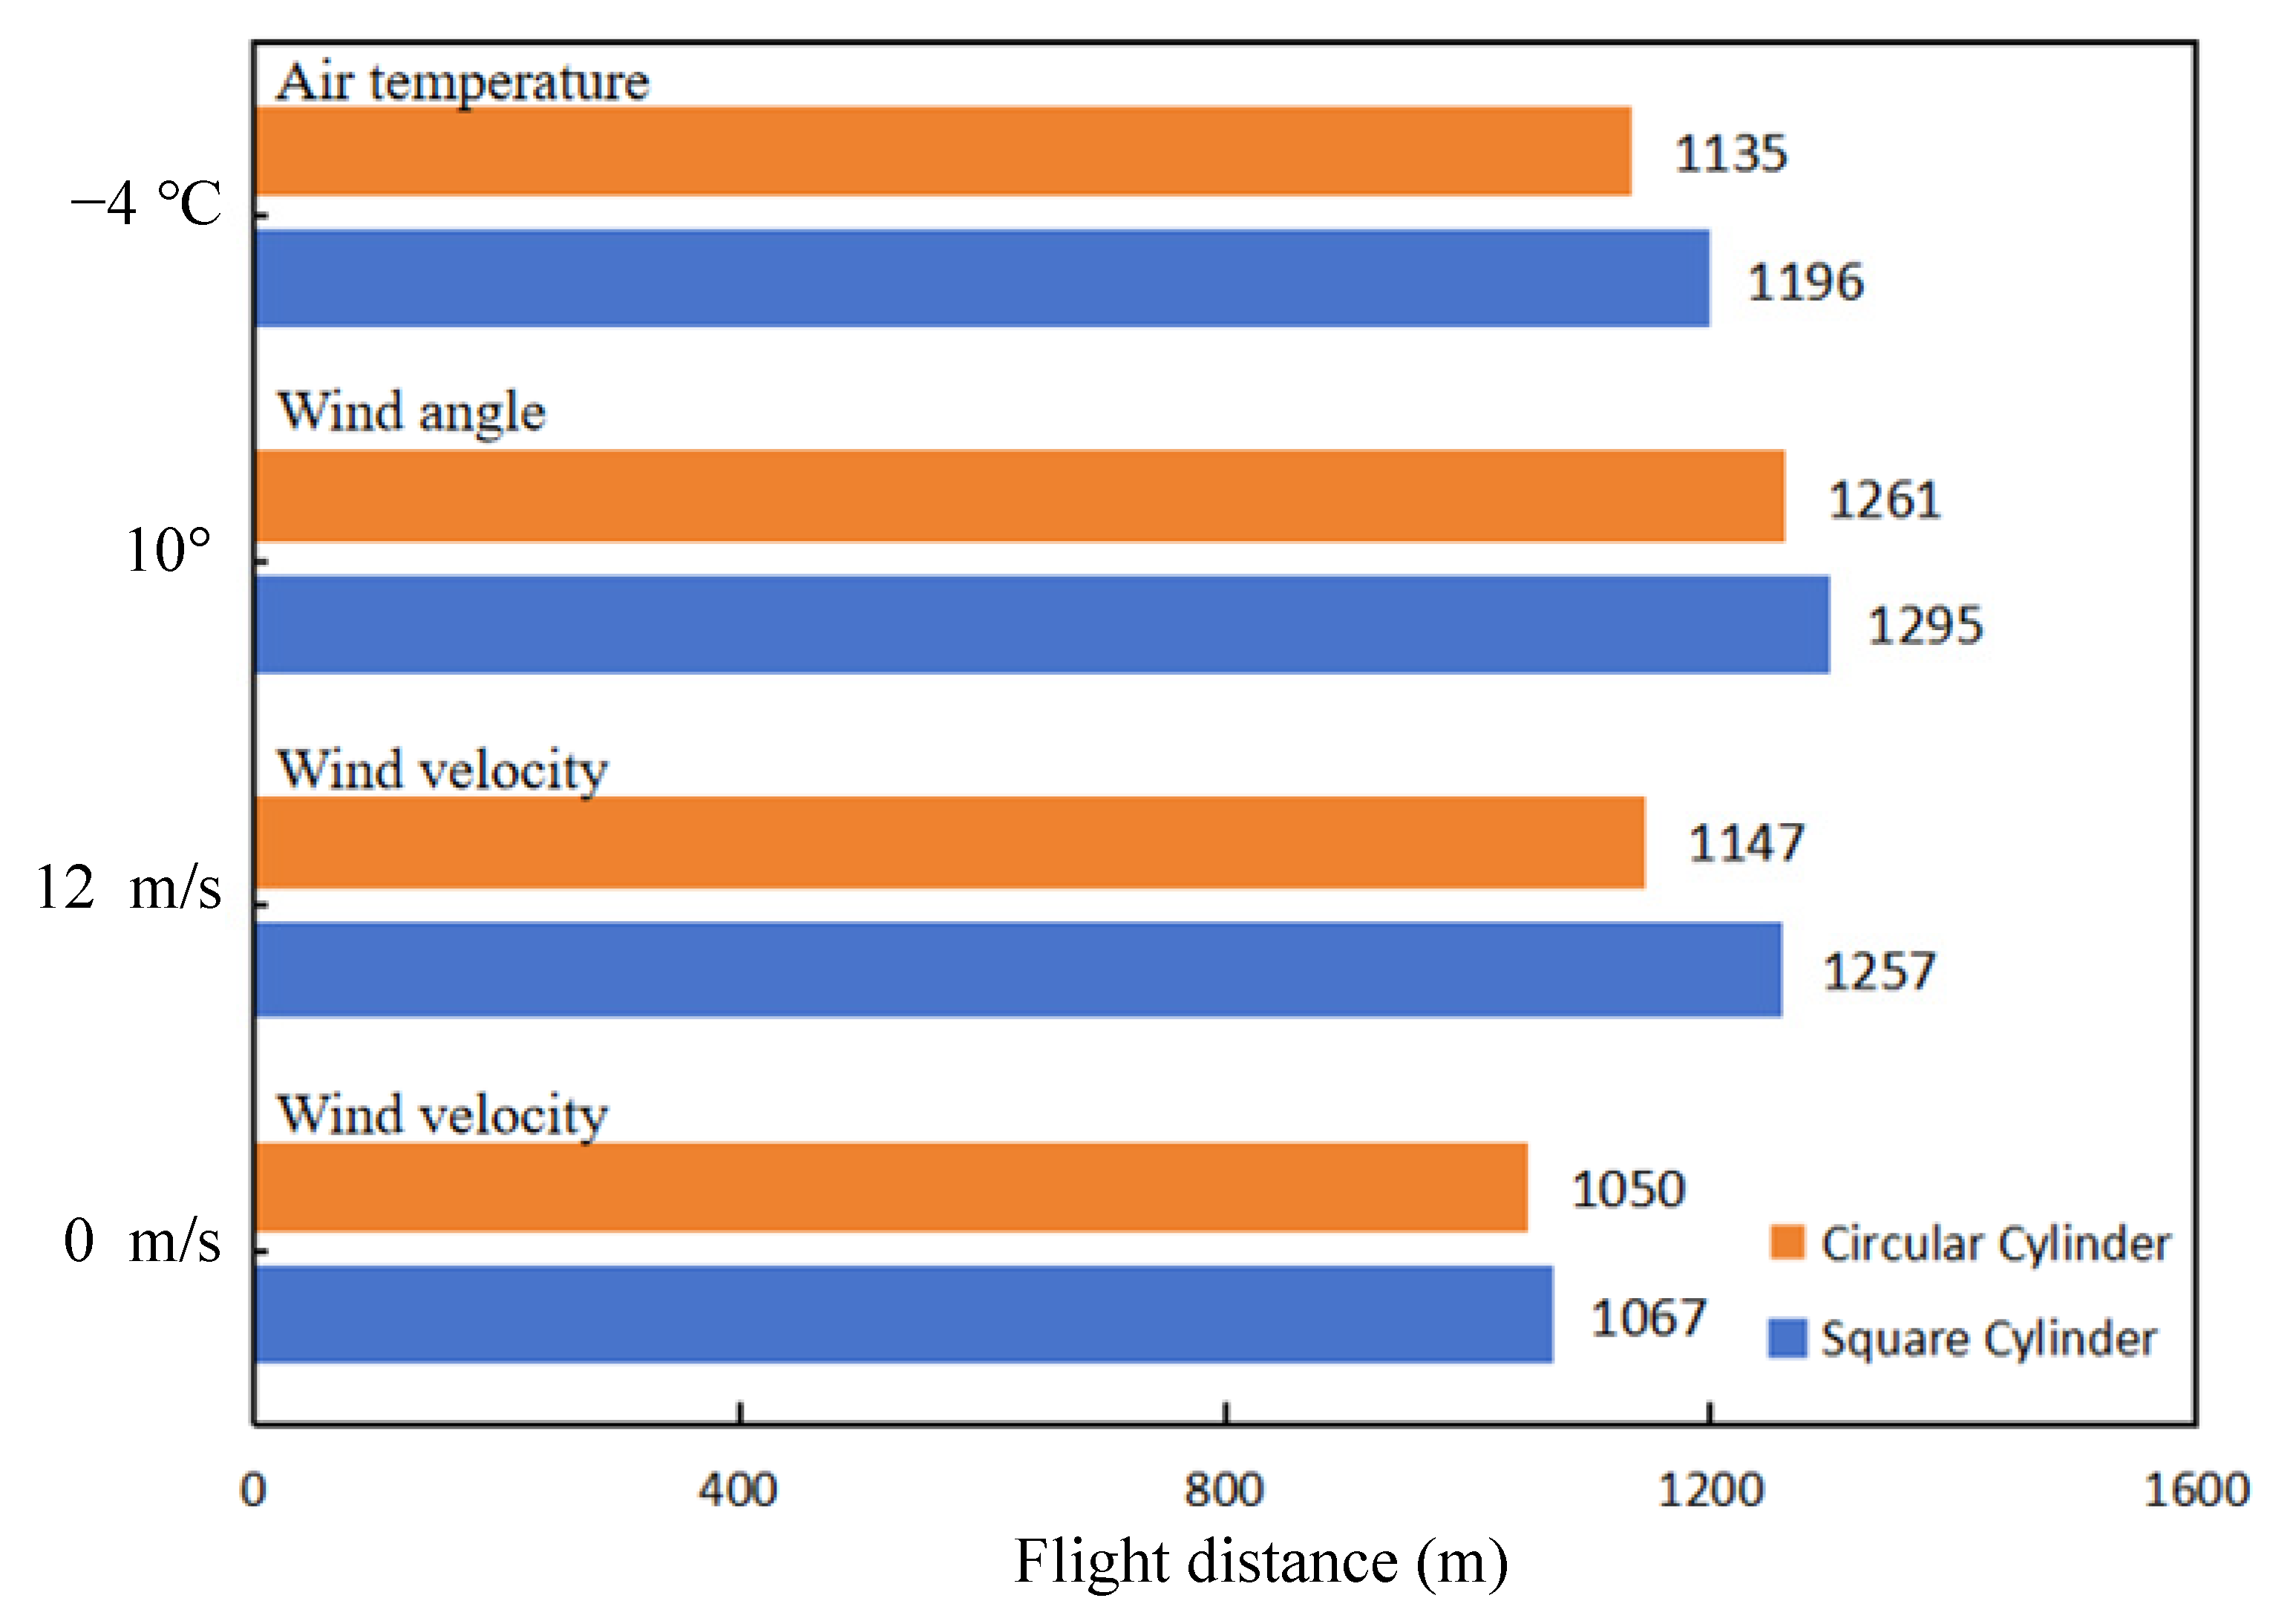
- At different wind speeds, the larger the wind speed, the larger the wake vortex and the higher the risk for UAV flight operation. Moreover, the optimal path of UAV bridge monitoring is sensitive to meteorological conditions, especially wind speed factors. Therefore, it is crucial to accurately identify and account for these factors when creating flight plans for UAVs conducting bridge inspections in order to increase the efficiency and effectiveness of these operations.
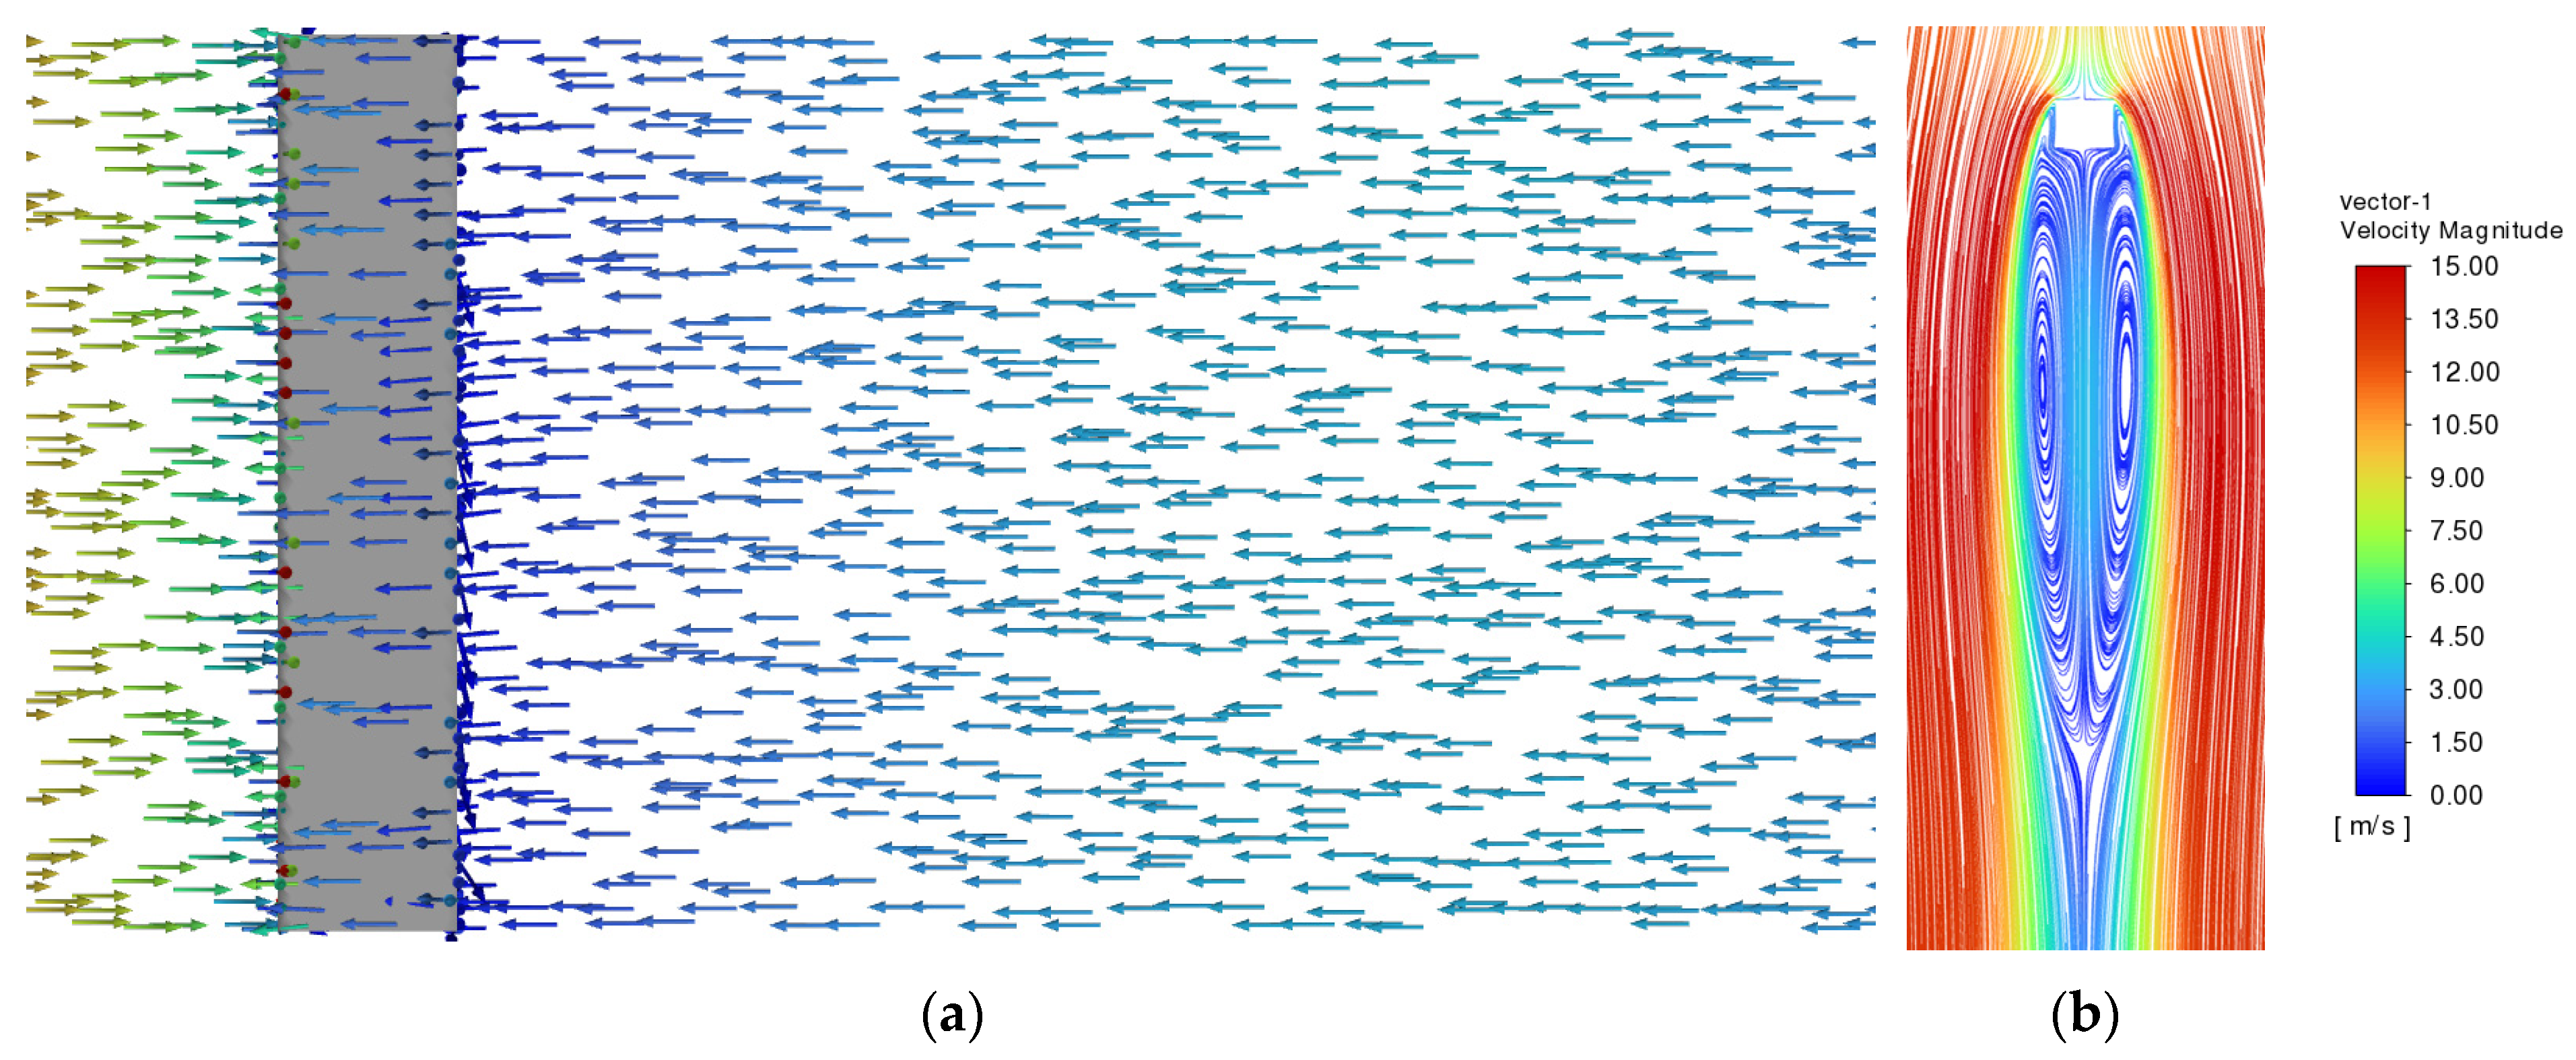
- (2)
- The wake vortex generated by a square cylinder column is more intricate and complex than that generated by a circular cylinder column due to the different bridge structure types. Therefore, the UAV flight path optimization required for square cylinder columns tends to be larger. The strength and influence of the vortex generated by different bridge columns significantly impact the optimal path and flight safety of UAVs conducting bridge monitoring. Irregular columns have an even greater impact as they can result in creating a larger UAV flying danger zone. Therefore, it is of utmost importance to identify and consider these factors when designing flight plans for UAVs conducting bridge inspections.
- (3)
- Most of the focus of research right now is on using drones to monitor bridges with spans that stretch long distances. The primary emphasis of the current research is on the UAV surveillance of long-span bridges. Future research can be applied to small-span bridges because the close spacing of the bridge columns will affect the wake vortex of the bridge columns on the downwind side, resulting in an inconsistent wake danger zone and wind direction, which will complicate UAV bridge monitoring and even the best flight path for UAV bridge inspection. In the future, it would be beneficial to explore new approaches such as selecting professional analysis software like Fluent for a comprehensive examination of the wake vortex and their potential threats to UAV flight safety.
Author Contributions
Funding
Data Availability Statement
Conflicts of Interest
References
- Ministry of Transport of the People’s Republic of China. Statistical Bulletin on the Development of the Transport Sector. 2021. Available online: https://xxgk.mot.gov.cn/2020/jigou/zhghs/202205/t20220524_3656659.html (accessed on 1 September 2023).
- Ruan, X.; Chen, A.; Shi, X. Bridge Engineering Risk Assessment; China Communications Press: Beijing, China, 2008. (In Chinese) [Google Scholar]
- Peng, X.; Zhong, X.G.; Zhao, C.; Chen, Y.F.; Zhang, T.Y. The Feasibility Assessment Study of Bridge Crack Width Recognition in Images Based on Special Inspection UAV. Adv. Civ. Eng. 2020, 2020, 17. [Google Scholar] [CrossRef]
- Seo, J.; Duque, L.; Wacker, J.P. Field Application of UAS-Based Bridge Inspection. Transp. Res. Rec. 2018, 2672, 72–81. [Google Scholar] [CrossRef]
- Jeong, E.; Seo, J.; Wacker, J.P. UAV-aided bridge inspection protocol through machine learning with improved visibility images. Expert Syst. Appl. 2022, 197, 14. [Google Scholar] [CrossRef]
- Jung, S.; Choi, D.; Song, S.; Myung, H. Bridge Inspection Using Unmanned Aerial Vehicle Based on HG-SLAM: Hierarchical Graph-Based SLAM. Remote Sens. 2020, 12, 3022. [Google Scholar] [CrossRef]
- Cano, M.; Pastor, J.L.; Tomas, R.; Riquelme, A.; Asensio, J.L. A New Methodology for Bridge Inspections in Linear Infrastructures from Optical Images and HD Videos Obtained by UAV. Remote Sens. 2022, 14, 1244. [Google Scholar] [CrossRef]
- Mohammadi, M.; Rashidi, M.; Mousavi, V.; Karami, A.; Yu, Y.; Samali, B. Quality Evaluation of Digital Twins Generated Based on UAV Photogrammetry and TLS: Bridge Case Study. Remote Sens. 2021, 13, 3499. [Google Scholar] [CrossRef]
- Lee, J.H.; Yoon, S.; Kim, B.; Gwon, G.H.; Kim, I.H.; Jung, H.J. A new image-quality evaluating and enhancing methodology for bridge inspection using an unmanned aerial vehicle. Smart. Struct. Syst. 2021, 27, 209–226. [Google Scholar] [CrossRef]
- Seo, J.; Duque, L.; Wacker, J. Drone-enabled bridge inspection methodology and application. Autom. Constr. 2018, 94, 112–126. [Google Scholar] [CrossRef]
- Shalyhin, A.; Nerubatsky, V.; Denysova, S. The UAV flight route optimization by taking into consideration the wind influence. Наука І Техніка Пoвітряних Сил Збрoйних Сил України 2018, 3, 20–24. [Google Scholar] [CrossRef]
- Yang, Y.; Chen, Y. Wind disturbance rejection control based on the dynamic parameters estimation of quadrotors UAV. High Technol. Lett. 2019, 25, 443–451. [Google Scholar]
- Barikbin, B.; Fakharian, A. Trajectory tracking for quadrotor UAV transporting cable-suspended payload in wind presence. Trans. Inst. Meas. Control. 2019, 41, 1243–1255. [Google Scholar] [CrossRef]
- Xu, X.; Watanabe, K.; Nagai, I. Flight control system design for a tandem rotor UAV robot in the presence of wind field disturbances. Artif. Life Robot. 2021, 26, 457–464. [Google Scholar] [CrossRef]
- Wang, B.; Ali, Z.A.; Wang, D. Controller for UAV to Oppose Different Kinds of Wind in the Environment. J. Control. Sci. Eng. 2020, 2020, 5708970. [Google Scholar] [CrossRef]
- Lee, D. A Linear Acceleration Control for Precise Trajectory Tracking Flights of a Quadrotor UAV Under High-wind Environments. Int. J. Aeronaut. Space Sci. 2021, 22, 898–910. [Google Scholar] [CrossRef]
- Nobahari, H.; Asghari, J. A Fuzzy-PLOS Guidance Law for Precise Trajectory Tracking of a UAV in the Presence of Wind. J. Intell. Robot. Syst. Theory Appl. 2022, 105, 18. [Google Scholar] [CrossRef]
- Grandić, I.Š. Reduction in wind force in relation to corner design of bridge piers. Eng. Rev. 2020, 40, 88–100. [Google Scholar] [CrossRef]
- Zhipeng, Z.; Guangbiao, J. Numerical Simulation of Static Wind Coefficient and Flow Field of Box Girder of High Pier and Large Span Continuous Bridge. In Proceedings of the 2017 3rd International Forum on Energy, Environment Science and Materials (IFEESM 2017), Shenzhen, China, 25–26 November 2017; pp. 299–305. [Google Scholar]
- Cao, B.; Sarkar, P.P. Numerical simulation of dynamic response of a long-span bridge to assess its vulnerability to non-synoptic wind. Eng. Struct. 2015, 84, 67–75. [Google Scholar] [CrossRef]
- Zhang, Y.; Zhou, M. Field investigation and wind-environment numerical simulation of cable-stayed bridge site in the west midlands region. In Proceedings of the 2011 International Conference on Civil Engineering and Building Materials, CEBM 2011, Kunming, China, 29–31 July 2011; pp. 4202–4206. [Google Scholar]
- Wang, D.; Zhang, Y.; Sun, M.; Chen, A. Characteristics of the Wind Environment above Bridge Deck near the Pylon Zone and Wind Barrier Arrangement Criteria. Appl. Sci. 2020, 10, 1437. [Google Scholar] [CrossRef]
- Ye, Z.-W.; Xiang, Y.-Q. Analysis and comparison on wind load of long span girder bridges with high pier. In Proceedings of the 2011 2nd International Conference on Challenges in Environmental Science and Computer Engineering, CESCE 2011, Haikou, China, 14–15 December 2011; pp. 322–327. [Google Scholar]
- Bayrak, Z.U.; Kaya, U.; Oksuztepe, E. Investigation of PEMFC performance for cruising hybrid powered fixed-wing electric UAV in different temperatures. Int. J. Hydrogen Energy 2020, 45, 7036–7045. [Google Scholar] [CrossRef]
- Li, N.; Liu, X.; Yu, B.; Li, L.; Xu, J.; Tan, Q. Study on the environmental adaptability of lithium-ion battery powered UAV under extreme temperature conditions. Energy 2021, 219, 119481. [Google Scholar] [CrossRef]
- Hossain, T.; Segura, S.; Okeil, A.M. Structural effects of temperature gradient on a continuous prestressed concrete girder bridge: Analysis and field measurements. Struct. Infrastruct. Eng. 2020, 16, 1539–1550. [Google Scholar] [CrossRef]
- Guo, C.; Lu, Z. Effect of temperature on CFST arch bridge ribs in harsh weather environments. Mech. Adv. Mater. Struct. 2020, 29, 732–747. [Google Scholar] [CrossRef]
- Niu, Y.; Wang, Y.; Tang, Y. Analysis of temperature-induced deformation and stress distribution of long-span concrete truss combination arch bridge based on bridge health monitoring data and finite element simulation. Int. J. Distrib. Sens. Netw. 2020, 16, 155014772094520. [Google Scholar] [CrossRef]
- Cekmez, U.; Ozsiginan, M.; Aydin, M.; Sahingoz, O. UAV Path Planning with Parallel Genetic Algorithms on CUDA Architecture. Lect. Notes Eng. Comput. Sci. 2014, 1, 551–557. [Google Scholar]
- Leng, S.; Sun, H. UAV Path Planning in 3D Complex Environments Using Genetic Algorithms. In Proceedings of the 33rd Chinese Control and Decision Conference, CCDC 2021, Kunming, China, 22–24 May 2021; pp. 1324–1330. [Google Scholar]
- Wang, X.; Meng, X. UAV online path planning based on improved genetic algorithm. In Proceedings of the 38th Chinese Control Conference, CCC 2019, Guangzhou, China, 27–30 July 2019; pp. 4101–4106. [Google Scholar]
- Zhang, H.; Yan, Y.; Li, S.; Hu, Y.; Liu, H. UAV Behavior-Intention Estimation Method Based on 4-D Flight-Trajectory Prediction. Sustainability 2021, 13, 12528. [Google Scholar] [CrossRef]
- Zhou, H.; Xiong, H.-L.; Liu, Y.; Tan, N.-D.; Chen, L. Trajectory Planning Algorithm of UAV Based on System Positioning Accuracy Constraints. Electronics 2020, 9, 250. [Google Scholar] [CrossRef]
- Hua, L.; Zhang, J.; Li, D.; Xi, X.; Shah, M.A. Sensor Fault Diagnosis and Fault Tolerant Control of Quadrotor UAV Based on Genetic Algorithm. J. Sens. 2022, 2022, 8626722. [Google Scholar] [CrossRef]
- Pehlivanoglu, Y.V.; Baysal, O.; Hacioglu, A. Path planning for autonomous UAV via vibrational genetic algorithm. Aircr. Eng. Aerosp. Technol. 2007, 79, 352–359. [Google Scholar] [CrossRef]
- Yuan, J.; Liu, Z.; Lian, Y.; Chen, L.; An, Q.; Wang, L.; Ma, B. Global Optimization of UAV Area Coverage Path Planning Based on Good Point Set and Genetic Algorithm. Aerospace 2022, 9, 86. [Google Scholar] [CrossRef]
- Roberge, V.; Tarbouchi, M.; Labonte, G. Fast genetic algorithm path planner for fixed-wing military UAV Using GPU. IEEE Trans. Aerosp. Electron. Syst. 2018, 54, 2105–2117. [Google Scholar] [CrossRef]
- Hu, X.; Liu, J. An obstacle avoidance design of UAV based on genetic algorithm. In Proceedings of the 3rd International Conference on Mechanical, Electric and Industrial Engineering, MEIE 2020, Virtual, Online, 18 June 2020. [Google Scholar]
- Liu, J. An Improved Genetic Algorithm for Rapid UAV Path Planning. In Proceedings of the 2021 3rd International Conference on Robotics, Intelligent Control and Artificial Intelligence, ICRICA 2021, Virtual, Online, 3–5 December 2021. [Google Scholar]
- Zhang, J.; Zhang, M.; Li, Y.; Jiang, F.; Wu, L.; Guo, D. Comparison of wind characteristics in different directions of deep-cut gorges based on field measurements. J. Wind Eng. Ind. Aerodyn. 2021, 212, 104595. [Google Scholar] [CrossRef]
- Zhan, S.; Qing, Z.; Guo, C. Brief introduction of Chongqing Yangtze River Bridge construction. Bridge Construction. 1981, 3, 1–35. (In Chinese) [Google Scholar]
- Гoлoдoв, Н.М. Wuhan Yangtze River Bridge Structure and Construction; Science and Technology Health Press: Beijing, China, 1958. (In Chinese) [Google Scholar]
- Yuan, M.; Ma, T.; You, L. Design of Changshou Changji ang River Bridge. Bridge Constr. 2005, 3, 40–43. (In Chinese) [Google Scholar]
- Wang, K. Introduction to the Design of the Sanjiang Highway Bridge of the Gezhouba Water Conservancy Hub. Highway 1982, 3, 1–6. (In Chinese) [Google Scholar]
- Zhu, P.F. Research on Key Construction Technologies of Yichang Yangtze River Bridge on the Yiwu Railway. Bridge Constr. 2004, 1, 62–65. (In Chinese) [Google Scholar]
- Liu, Y.; Han, K.; Rasdorf, W. Assessment and Prediction of Impact of Flight Configuration Factors on UAS-Based Photogrammetric Survey Accuracy. Remote Sens. 2022, 14, 4119. [Google Scholar] [CrossRef]
- JTG/T D60-01-2004; Highway Bridge Wind Resistance Design Code. Ministry of Transport of the People’s Republic of China: Beijing, China, 2004. (In Chinese)
- Bureau, C.M. Temperature Statistics by Month of the Year in Nanchuan District, Chongqing. Available online: https://www.tianqi24.com/nanchuan/history.html (accessed on 17 September 2023).
- Yu, C.; Qiang, L.; Ting, G. Numerical simulation of flow around a cylinder at different Reynolds numbers. China Water Transp. 2015, 15, 88–90. (In Chinese) [Google Scholar]
- 5Luo, Y.J.; Liang, L.; Wei, C.; Shui, L.Y.; Ying, L. Numerical simulation of flow around a circular cylinder with rough surface at subcritical Reynolds number. Chin. J. Appl. Mech. 2022, 39, 974–980. (In Chinese) [Google Scholar]
- Anderson, J. Fundamentals of Aerodynamics; McGraw-Hill Education: Columbus, OH, USA, 2016. [Google Scholar]
- Jun, Y.H. Two Dimensional Numerical Analysis of Flow over a Circular and Square Cylinder and Vortex-Induced Vibration of Rectangular Cylinder. Master’s Thesis, Tianjin University, Tianjin, China, 2012. [Google Scholar]
- Green, J.J.; Mott, J. Identification of Wind-Induced Hazard Zones Impacting UAS Bridge Inspection. Int. J. Aviat. Aeronaut. Aerosp. 2021, 8, 2. [Google Scholar] [CrossRef]


| Bridge Name | Main Span (m) | Characteristic Scale (m) | Space Ratio |
|---|---|---|---|
| Chongqing Yangtze River Bridge [41] | 138 | 8.5 | 0.062 |
| Wuhan Yangtze River Bridge [42] | 128 | 6.5 | 0.047 |
| Changshou Yangtze River Bridge of Yuhuai Railway [43] | 192 | 7.0 | 0.036 |
| Gezhouba Yangtze River Bridge [44] | 158 | 7.0 | 0.044 |
| Yichang Yangtze River Bridge of Yi-Wan Railway [45] | 275 | 8.0 | 0.029 |
| Structure Type | Length (m) | Width (m) | Height (m) | Span (m) |
|---|---|---|---|---|
| Circular Cylinder | 300 | 6 | 30 | 120 |
| Square Cylinder | 300 | 6 | 30 | 120 |
| Components Name | Items | Parameters |
|---|---|---|
| Small-scale industry UAV | Maximum horizontal flight speed (m/s) | 21 |
| Maximum flight altitude (m) | 6000 | |
| Maximum wind speed tolerance (m/s) | 12 | |
| Maximum flight time (min) | 46 | |
| Operating ambient temperature (°C) | −10~40 | |
| Infrared sensing range of obstacles (m) | 0.1~8 | |
| Hasselblad camera | Sensor size | 4/3 CMOS |
| DFOV (°) | 84 | |
| Equivalent focal length (mm) | 24 |
| Wind Speed (m/s) | Wind Angle (°) | Temperature (°C) |
|---|---|---|
| 9 | 0 | −10 |
| 12 | 22.5 | 15 |
| 15 | 45 | 40 |
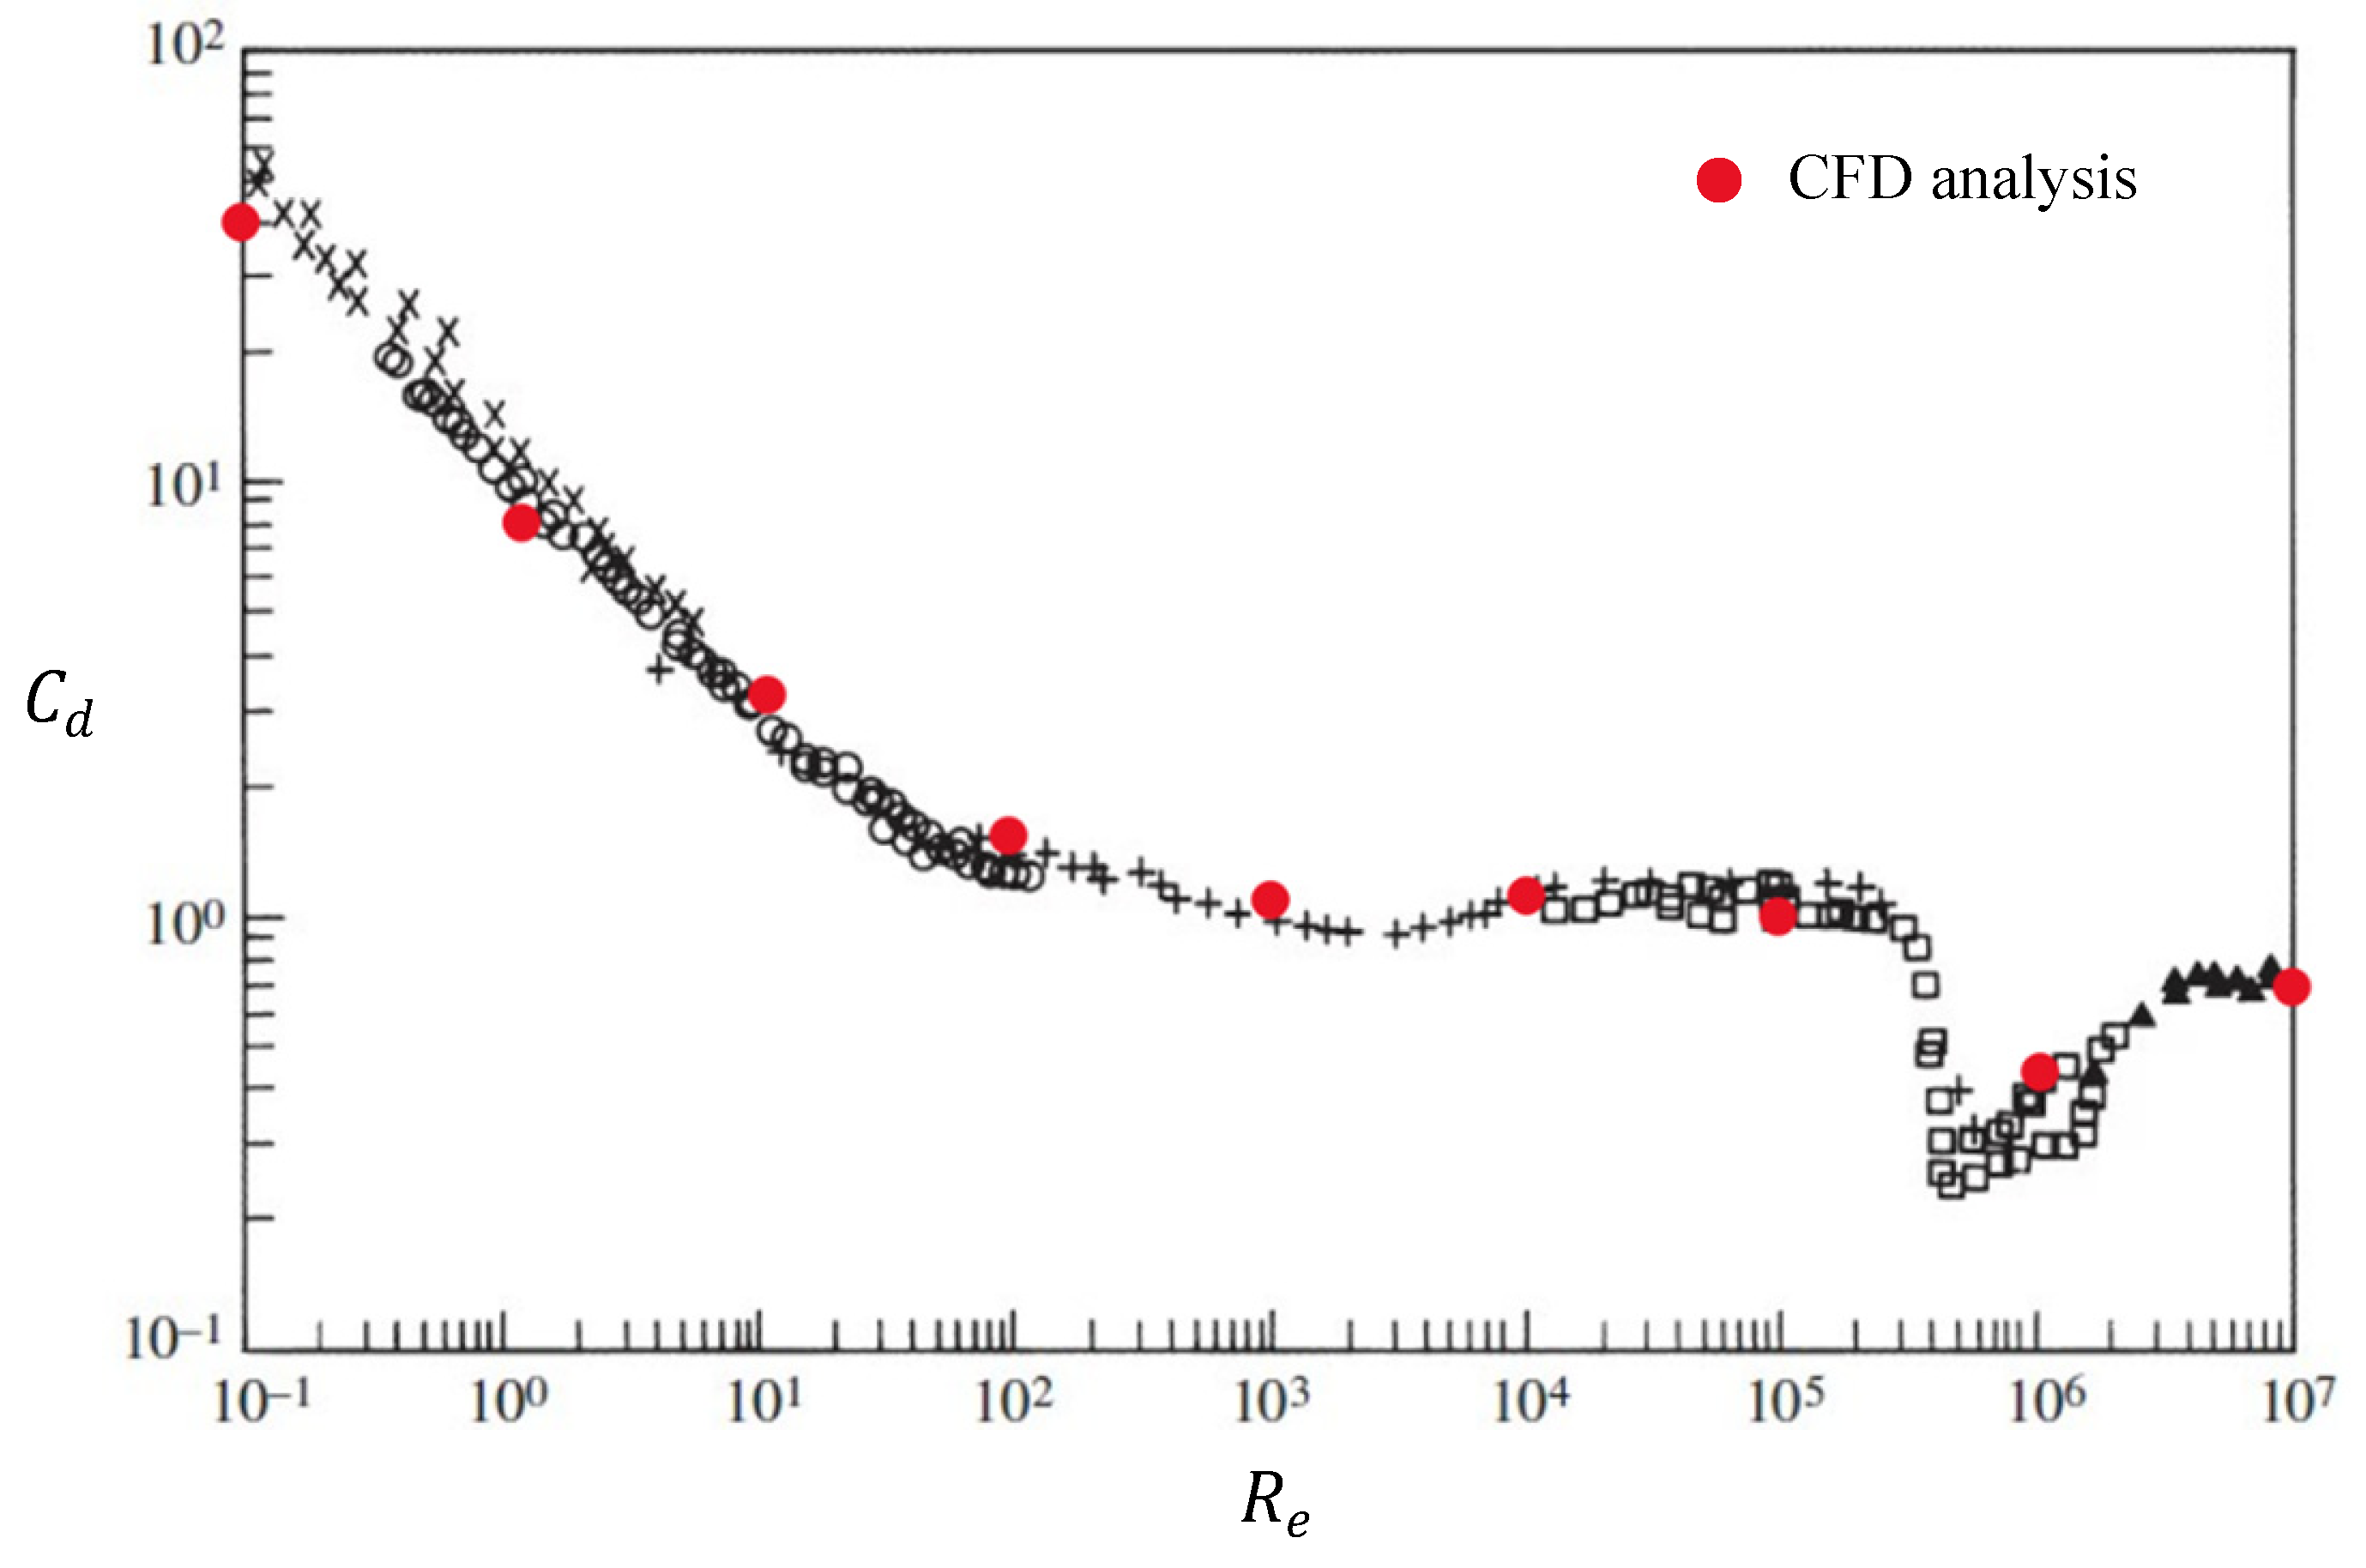
| Type | Reynolds Number | Drag Coefficient | Results | Average Error |
|---|---|---|---|---|
| Circular Cylinder | Re = 2.0 × 10⁴ | 1.37 [52] | 1.19 | 10.8% |
| Re = 3.0 × 10⁵ | 1.00 [52] | 0.99 | 4.2% | |
| Re = 1.0 × 10⁶ | 0.52 [52] | 0.49 | 8.8% | |
| Re = 3.5 × 10⁶ | 0.62 [52] | 0.57 | 2.5% | |
| Square Cylinder | Re = 2.2 × 10⁴ | 2.04 [52] | 2.03 | 0.5% |
| Re = 1.0 × 10⁶ | 2.05 [52] | 2.04 | 0.5% | |
| Re = 3.5 × 10⁶ | 2.04 [52] | 2.02 | 1.0% |
| Identification Point | 1 | 2 | 3 | 4 | 5 |
|---|---|---|---|---|---|
| Average Velocity(m/s) | 2.8592 | 2.1834 | 5.6315 | 7.5309 | 8.2730 |
| Standard Deviation | 0.7257 | 1.0590 | 1.1732 | 1.3728 | 1.4974 |
| Average Turbulent Kinetic Energy (m2/s2) | 6.6501 | 8.5218 | 4.5444 | 3.0611 | 2.4311 |
| Average Specific Dissipation Rate (1/s) | 5.9516892 | 7.8490 | 2.9705 | 1.609 | 0.9919 |
| Meteorological Conditions | Magnitudes | Wake Vortex | Non-Safe Zone Model | Dimensions |
|---|---|---|---|---|
| Wind speed (m/s) | 9.0 |  | 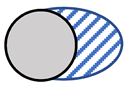 | Semi-major axis: 4 m Semi-minor axis: 2 m |
| 12 | 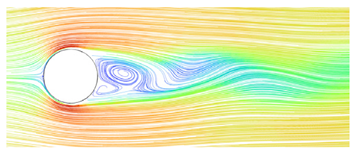 | 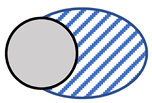 | Semi-major axis: 7 m Semi-minor axis: 4 m | |
| 15 | 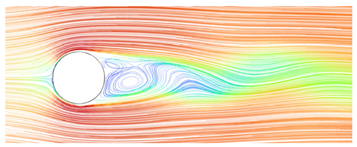 |  | Semi-major axis: 9 m Semi-minor axis: 5 m | |
| Air temperature (°C) | −10 |  |  | Semi-major axis: 8 m Semi-minor axis: 3 m |
| 15 | 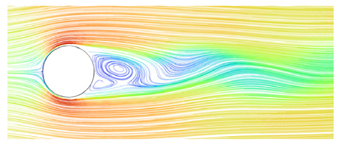 |  | Semi-major axis: 7 m Semi-minor axis: 4 m | |
| 40 | 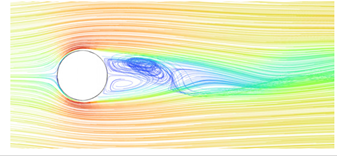 |  | Semi-major axis: 7 m Semi-minor axis: 5 m | |
| Wind angle (°) | 0 |  | 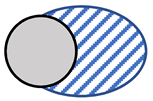 | Semi-major axis: 7 m Semi-minor axis: 4 m |
| 22.5 | 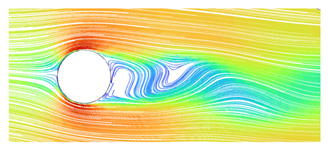 | 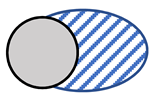 | Semi-major axis: 7 m Semi-minor axis: 3 m | |
| 45 | 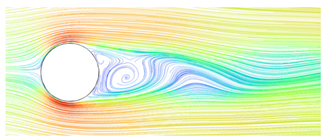 |  | Semi-major axis: 7 m Semi-minor axis: 3 m |
| Meteorological Conditions | Magnitudes | Wake Vortex | Non-Safe Zone Model | Dimensions |
|---|---|---|---|---|
| Wind speed (m/s) | 9.0 |  |  | Semi-major axis: 8 m Semi-minor axis: 5 m |
| 12 |  |  | Semi-major axis: 11 m Semi-minor axis: 6 m | |
| 15 |  |  | Semi-major axis: 14 m Semi-minor axis: 8 m | |
| Air temperature (°C) | −10 |  |  | Semi-major axis: 10 m Semi-minor axis: 6 m |
| 15 |  |  | Semi-major axis: 11 m Semi-minor axis: 6 m | |
| 40 |  |  | Semi-major axis: 12 m Semi-minor axis: 5 m | |
| Wind angle (°) | 0 |  |  | Semi-major axis: 8 m Semi-minor axis: 5 m |
| 22.5 |  |  | Semi-major axis: 10 m Semi-minor axis: 6 m | |
| 45 |  |  | Semi-major axis: 12 m Semi-minor axis: 7 m |
Disclaimer/Publisher’s Note: The statements, opinions and data contained in all publications are solely those of the individual author(s) and contributor(s) and not of MDPI and/or the editor(s). MDPI and/or the editor(s) disclaim responsibility for any injury to people or property resulting from any ideas, methods, instructions or products referred to in the content. |
© 2023 by the authors. Licensee MDPI, Basel, Switzerland. This article is an open access article distributed under the terms and conditions of the Creative Commons Attribution (CC BY) license (https://creativecommons.org/licenses/by/4.0/).
Share and Cite
Wang, Y.; Duan, C.; Huang, X.; Zhao, J.; Zheng, R.; Li, H. Task-Driven Path Planning for Unmanned Aerial Vehicle-Based Bridge Inspection in Wind Fields. Fluids 2023, 8, 321. https://doi.org/10.3390/fluids8120321
Wang Y, Duan C, Huang X, Zhao J, Zheng R, Li H. Task-Driven Path Planning for Unmanned Aerial Vehicle-Based Bridge Inspection in Wind Fields. Fluids. 2023; 8(12):321. https://doi.org/10.3390/fluids8120321
Chicago/Turabian StyleWang, Yonghu, Chengcheng Duan, Xinyu Huang, Juan Zhao, Ran Zheng, and Haiping Li. 2023. "Task-Driven Path Planning for Unmanned Aerial Vehicle-Based Bridge Inspection in Wind Fields" Fluids 8, no. 12: 321. https://doi.org/10.3390/fluids8120321
APA StyleWang, Y., Duan, C., Huang, X., Zhao, J., Zheng, R., & Li, H. (2023). Task-Driven Path Planning for Unmanned Aerial Vehicle-Based Bridge Inspection in Wind Fields. Fluids, 8(12), 321. https://doi.org/10.3390/fluids8120321