1. Introduction
The flash smelting process is used to produce half of the world’s primary copper [
1]. Thus, it is important to understand the different phenomena inside the flash smelting furnace (FSF) to improve the process and limit copper losses. In the flash smelting process, concentrate is fed with flux and oxygen-enriched air through a concentrate burner. The oxidation of the ore creates the energy to melt the feed forming liquid matte and slag which form separate layers at the settler of the FSF. The molten matte droplets must settle through the slag layer, during which they will react with the slag. The reactions increase the copper concentration in the droplets as iron, sulfur and other impurities are removed [
2]. As the slag forms an obstacle for the matte, the settling velocity of the droplets has a major role in the efficiency of the process. Several factors, such as matte density, droplet size and slag viscosity have an effect on the settling velocity [
3]. However, several factors also prohibit the droplets from settling, leading to copper losses. The main losses in the FSF come from copper being dissolved or trapped in the slag and then being removed during slag tapping [
4,
5,
6]. The matte can be trapped in the slag, for example, by becoming stuck to spinel particles or the droplets being so small that they do not settle but are carried out by the slag flow. Understanding these phenomena better will be helpful in reducing copper losses.
Due to the challenging environment in the FSF, studying matte settling experimentally is practically impossible and, thus, computer simulations have been used to study the process. However, the lack of direct observations makes validation of the simulations challenging. Commonly, CFD (computational fluid dynamics) simulations have been used to predict the slag and matte flow in the furnace by using, for example, particle tracking and Eulerian models [
7,
8,
9,
10,
11,
12,
13]. However, a method like coupled CFD-DEM (discrete element method) can provide more accurate data with suitable sub-models as each individual droplet can be simulated as a separate entity. The increased accuracy allows for more detailed studying of different settling phenomena occurring in the slag layer. However, as the DEM software used in the study was developed to simulate solid particles, custom sub-models need to be developed for including liquid-specific behaviour, such as coalescence, in the simulations.
Previous CFD and CFD-DEM simulations have shown a channeling flow phenomenon through the slag [
10]. The phenomenon seems to be present despite the size of the system, as it has been indicated in both eight-liter scaled simulations and a full-scale FSF simulation. However, the smaller model produced one channel through the slag while the full-scale model produced multiple channels. The channeling flow seems to be one of the most important single factors increasing the settling velocity and, thus, the settling efficiency. However, as the earlier simulations [
7,
8] have not mentioned the flow phenomenon and physical observations are impossible, an alternative validation method is required. In this work, matte–slag and sphere–oil CFD-DEM simulations were created and a corresponding physical small-scale sphere–oil model was built and filmed to observe the channeling flow for validating the simulation results, but also to study the formation mechanism of the flow phenomenon. The software used in the presented simulations was Ansys Fluent 2021 R1 and Altair EDEM 2021.2 for the CFD and DEM simulations, respectively.
2. Methods
2.1. Coupled CFD-DEM Simulation
In the CFD-DEM method, CFD is used to simulate a fluid medium (continuum) while DEM is used to simulate discrete particles in the medium. CFD simulations have DPM and DDPM models (discrete particle method and dense discrete particle method, respectively), but in this work DDPM was used only by the CFD-DEM coupling plugin to obtain a two-way coupled simulation where the fluid flow affects the particles (in this work, droplets) and vice versa.
DEM is used in CFD-DEM software for simulating particle movement and interaction with geometry and other particles. Compared to DPM or DDPM, more accuracy can be achieved because DPM and DDPM often use parcels where a large number of particles are solved as a single parcel. Then collision frequency is used to determine the number of collisions between particles. In DEM, every particle is individually simulated. Both CFD and DEM can be complemented with user-defined sub-models.
In this work, Ansys Fluent and Altair EDEM were coupled by the plugin provided by EDEM. For the presented matte–slag simulation, an in-house-built coalescence model was used while sphere–oil simulations were run by using the Hertz–Mindlin collision model built in EDEM. The coalescence model included the Herzt–Mindlin collision model, which was used if coalescence would not occur. For Fluent, a realizable
turbulence model was used. In EDEM, Rayleigh time step is calculated automatically for the smallest particle in the simulation. The time step is based on Rayleigh wave in the given material [
14]. For the simulations, the time step was manually set at value close 20–30% of the Rayleigh time step while keeping the DEM time step as a multiple of the CFD time step. CFD-time step was selected based on stability of the simulation. Used time steps for CFD and DEM were
s and
s in the matte–slag model, and
s and
s in the sphere–oil model, respectively.
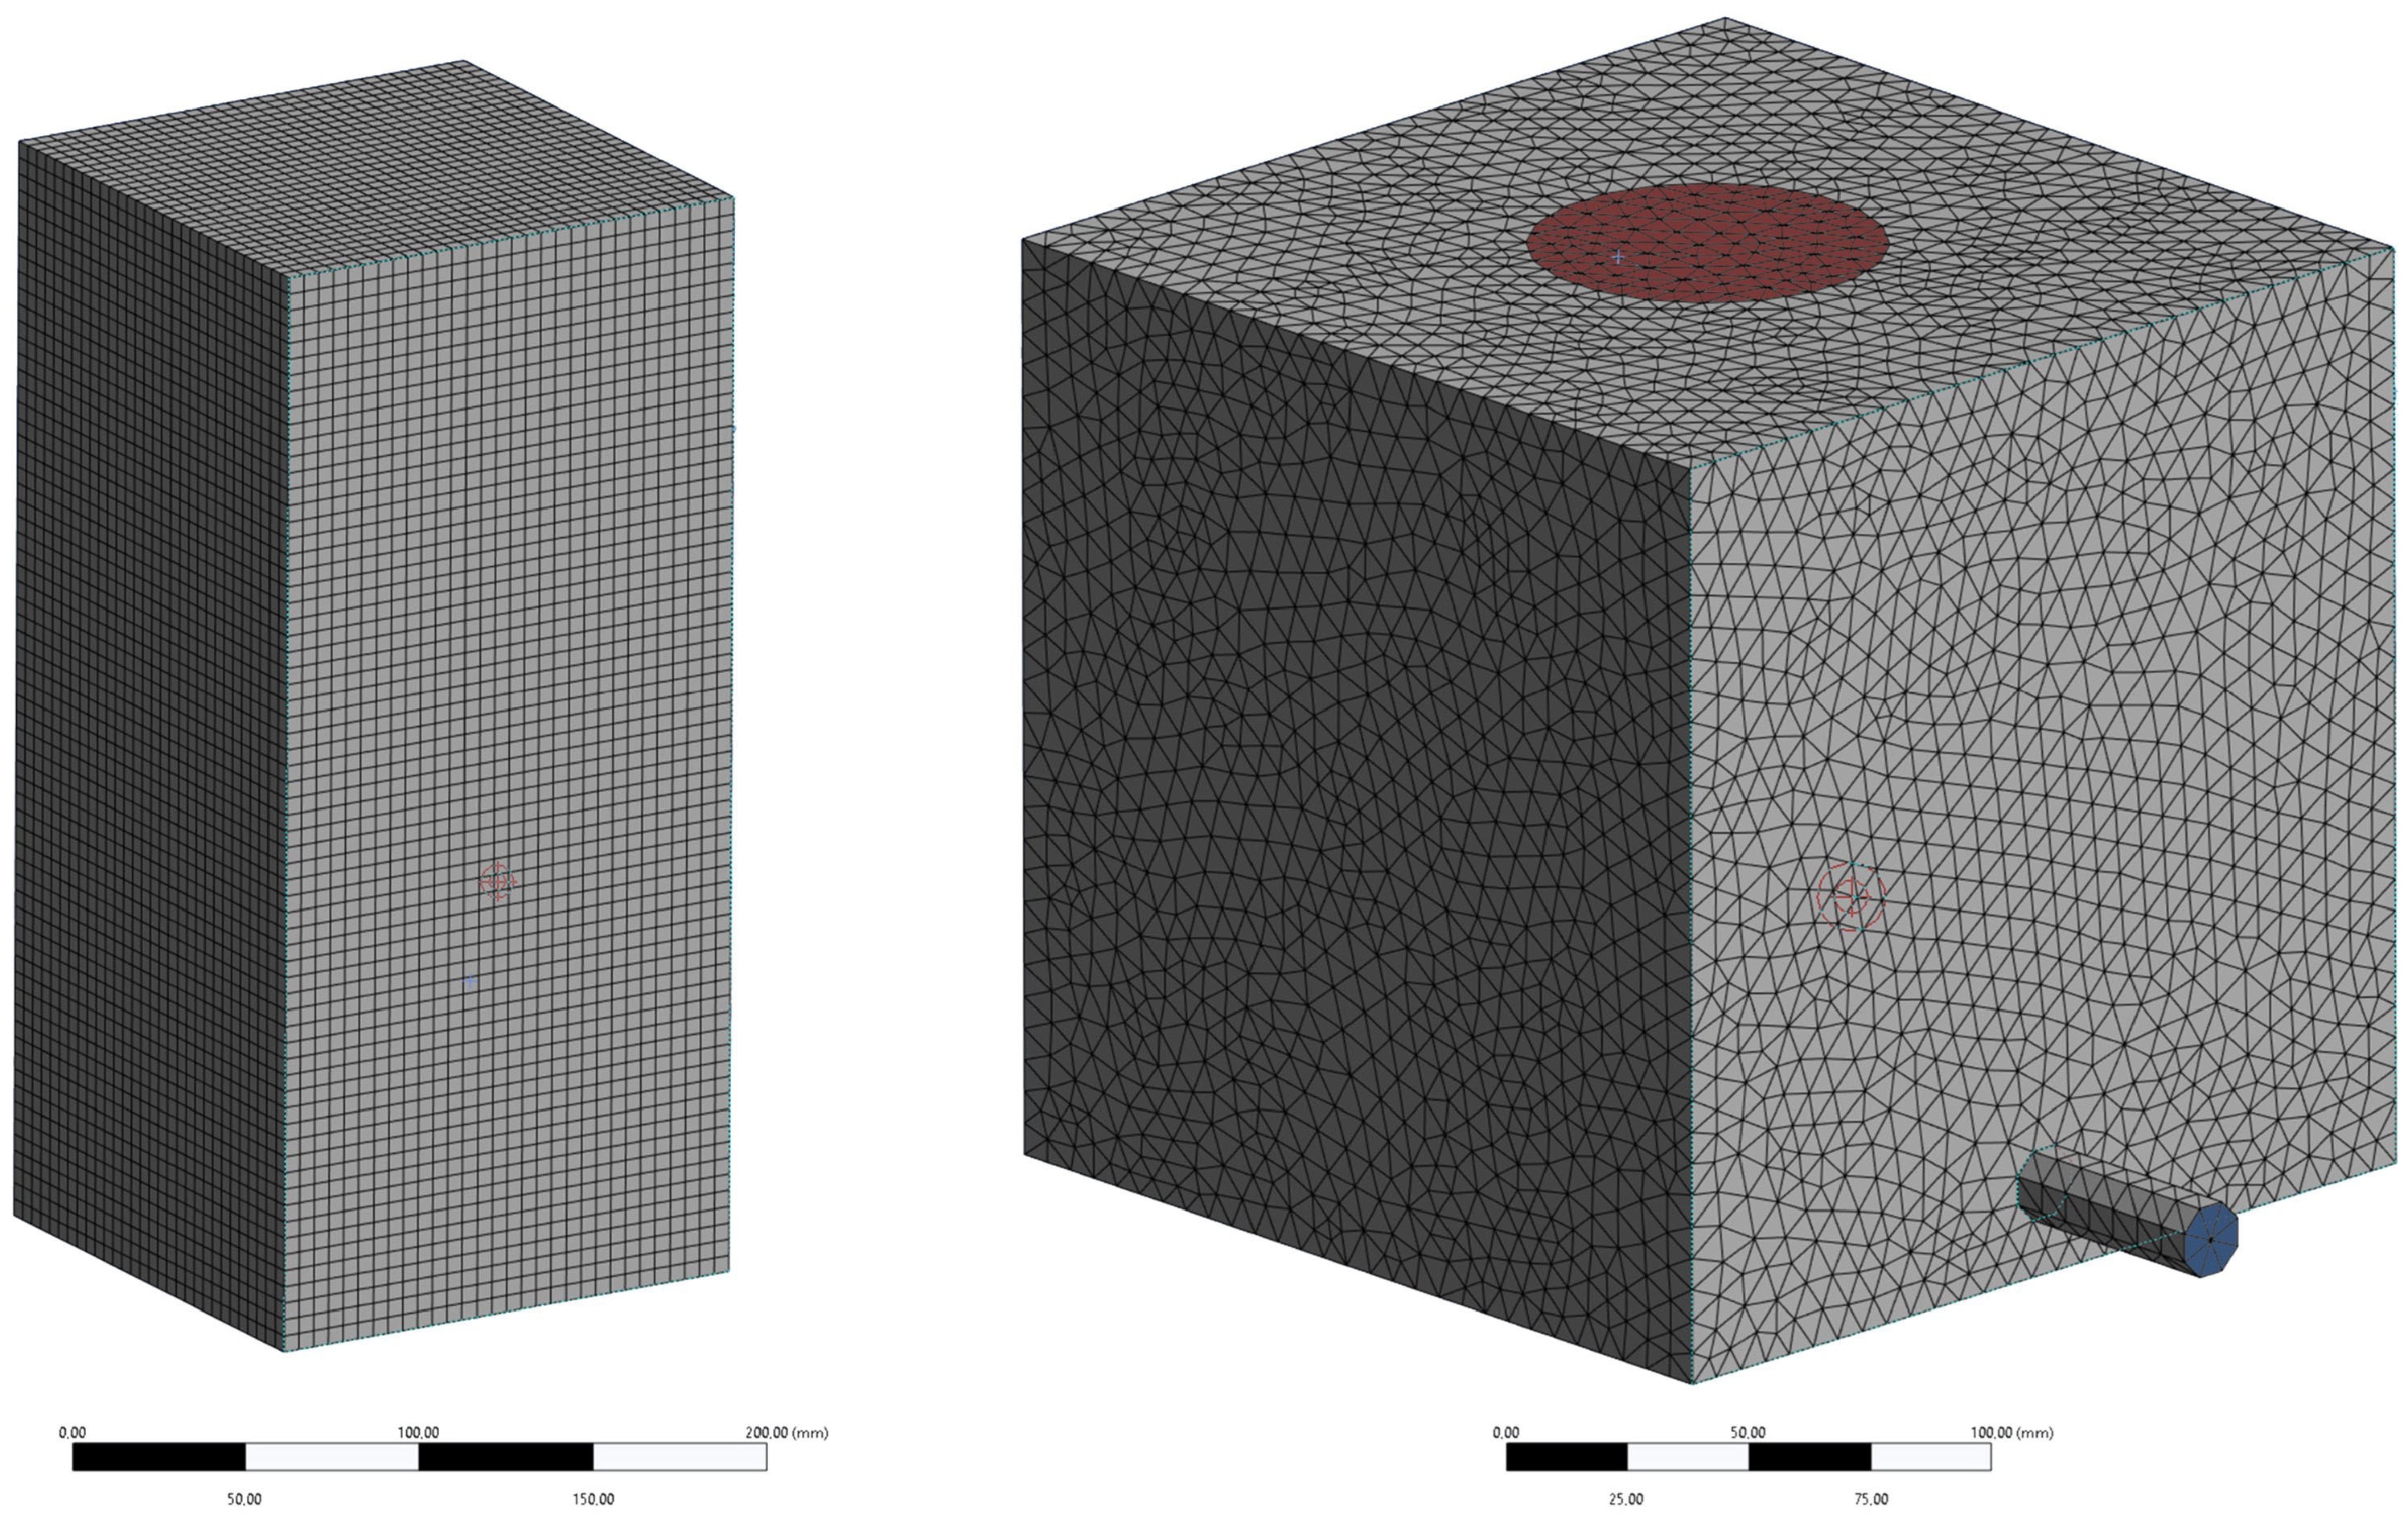
Both CFD and DEM use a mesh to divide the computation domain in small cells. For CFD, this is important as it provides the resolution and, thus, accuracy for the flow calculations. The meshes used in CFD are presented in
Figure 1. Due to the simple geometry, the oil model could be simulated with hexahedral cells, while the more complex geometry was built with tetrahedral cells. For DEM, the mesh size does not affect accuracy of the time, as the mesh is used to limit the number of contact checks [
14].
2.1.1. Matte–Slag Model
The geometry for the matte–slag model was a cube with 20 cm sides. The inlet (diameter was 75 mm) was centered on the top face of the geometry and both the slag and matte feed were injected through it. The slag was set to exit from an outlet at the side near the bottom, while matte droplets could exit either through the outlet or bottom, depicting losses during tapping and passing through the matte–slag interface, respectively. The simulation data is presented in
Table 1. The properties for the matte and slag were taken from the literature [
7].
Feed rates were scaled from literature data so that the simulations would have the same flow rate per unit area of the reaction shaft (here: inlet of the model) [
15]. However, the matte as a liquid does not have a Poisson’s ratio or Young’s modulus, which are properties of a solid although suitable values were needed in the software. The Poisson’s ratio was set as 0.4999, as liquids are generally not compressible and a Poisson’s ratio of 0.5 is perfectly incompressible. For the Young’s modulus, a bulk modulus value of 2.2 GPa was found in the literature [
16]. Also, a relation between the bulk modulus and Young’s modulus exists and is given in Equation (
1) [
16]
where
K is the bulk modulus,
E is the Young’s modulus, and
is the Poisson’s ratio. For practically incompressible liquids, the Poisson’s ratio was set as 0.4999. The Young’s modulus of water can then be calculated as 1.32 MPa. Since more precise data were lacking, as the matte is a more viscous liquid than water, the Young’s modulus of matte was assumed to be 1.5 MPa for the simulations.
Additionally, an in-house-developed coalescence model was used to simulate coalescing matte droplets. The model used bubble coalescence probability as a coalescence criterion [
17] as, in both cases, two immiscible fluids were being simulated, one of which was a small spherical object moving through a layer of the other fluid. During collision, two droplets may coalesce or bounce off of each other [
18]. This was simulated by using a regular contact model if the coalescence probability was under 50%. If the criterion was over 50%, the droplets would coalesce. The coalesced droplet would have a volume equal to the sum of the volumes of the original droplets. Momentum was also conserved by calculating momentum vectors for the original droplets and then summing those for the new vector. The operation of the coalescence model is further described in our previous article [
19], although the coalescence was slowed down in the version used in this study to improve the stability of the model.
2.1.2. Plastic Sphere Simulation
As the operational environment in the FSF makes direct observations impossible, a room-temperature model was built for studying the channeling phenomenon. For simplification, plastic spheres and oil were selected to represent the matte droplets and slag layer, respectively. Further, the plastic spheres could be simulated using only built-in models of the software. allowing for faster and more stable simulations. The sphere–oil simulation consisted of a box with dimensions of 150 × 325 × 150 mm (w × h × d) with an inlet diameter of 100 mm. The inlet was set at a height of 2.5 cm above the oil, allowing the spheres to accelerate under gravity before impacting the oil surface. The properties used in the simulation are presented in
Table 2. The properties of the oil and plastic spheres were provided by the manufacturers [
20,
21,
22,
23] except for the elastic modulus and Poisson’s ratio of the spheres, which were taken from the polymer properties database [
24] and
Perry’s Chemical Engineers’ Handbook [
25]. The feed rate was selected as one that could be matched with the experimental setup.
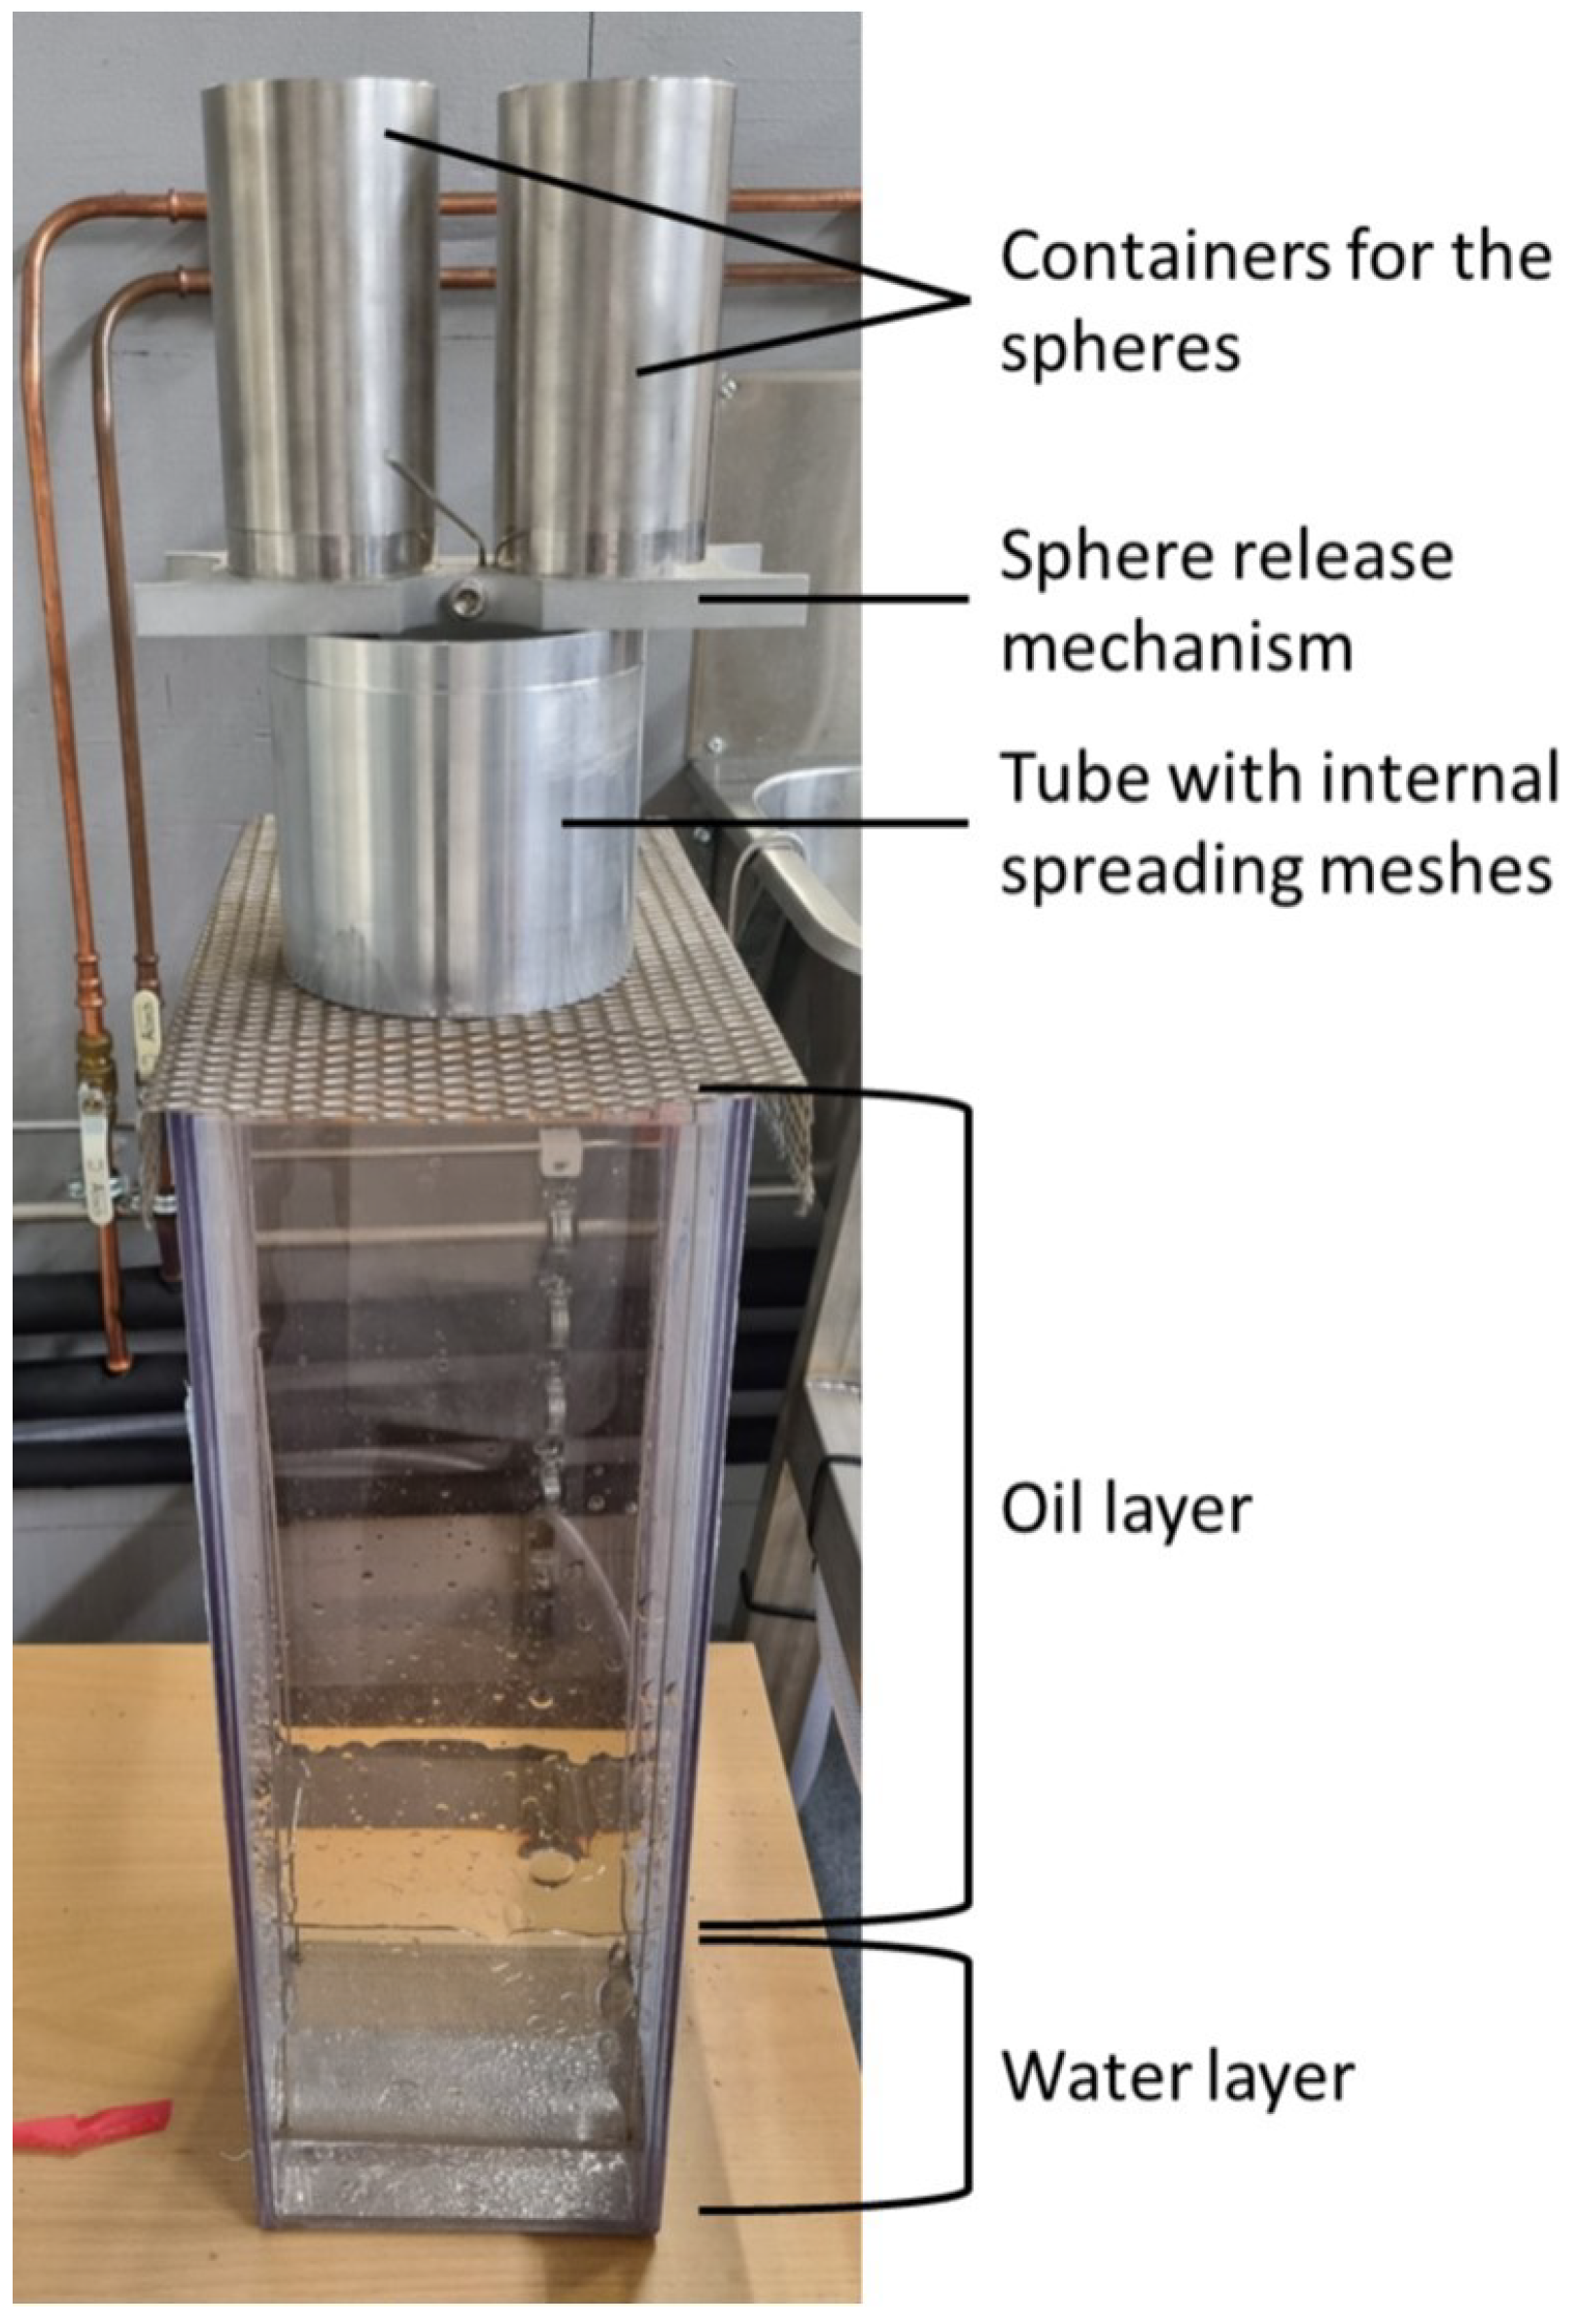
2.2. Plastic Sphere Experiment
The experimental model was made in a PET-G box with similar dimensions as the simulated model. The box was filled with oil at the same height as in the simulation. Due to the height of the box, the bottom was filled with water until the oil surface was just below the upper edge of the box. The two different sphere types were placed in funnels from where they were dropped into a pipe with three internal layers of mesh to mix and spread the spheres into the designated feed area. The two funnels were opened simultaneously, and both were tested to drop the spheres in 4 s. The experimental setup is presented in
Figure 2. The properties are the same (
Table 2) because the aim was to keep the simulation and experiment as identical as possible. The spheres were degreased, dried, and sorted before each new experiment. The plastic sphere experiment was also made using PTFE spheres alone as the nylon spheres showed some problematic behavior (significant cohesion).
The feeding funnels and the tube with mesh to ensure more even spreading of the spheres were made from steel to limit problems caused by static charge in the spheres.
3. Results
3.1. Matte–Slag Simulation
In the matte–slag model a channel formed through the slag similar to those reported in our previous studies [
10,
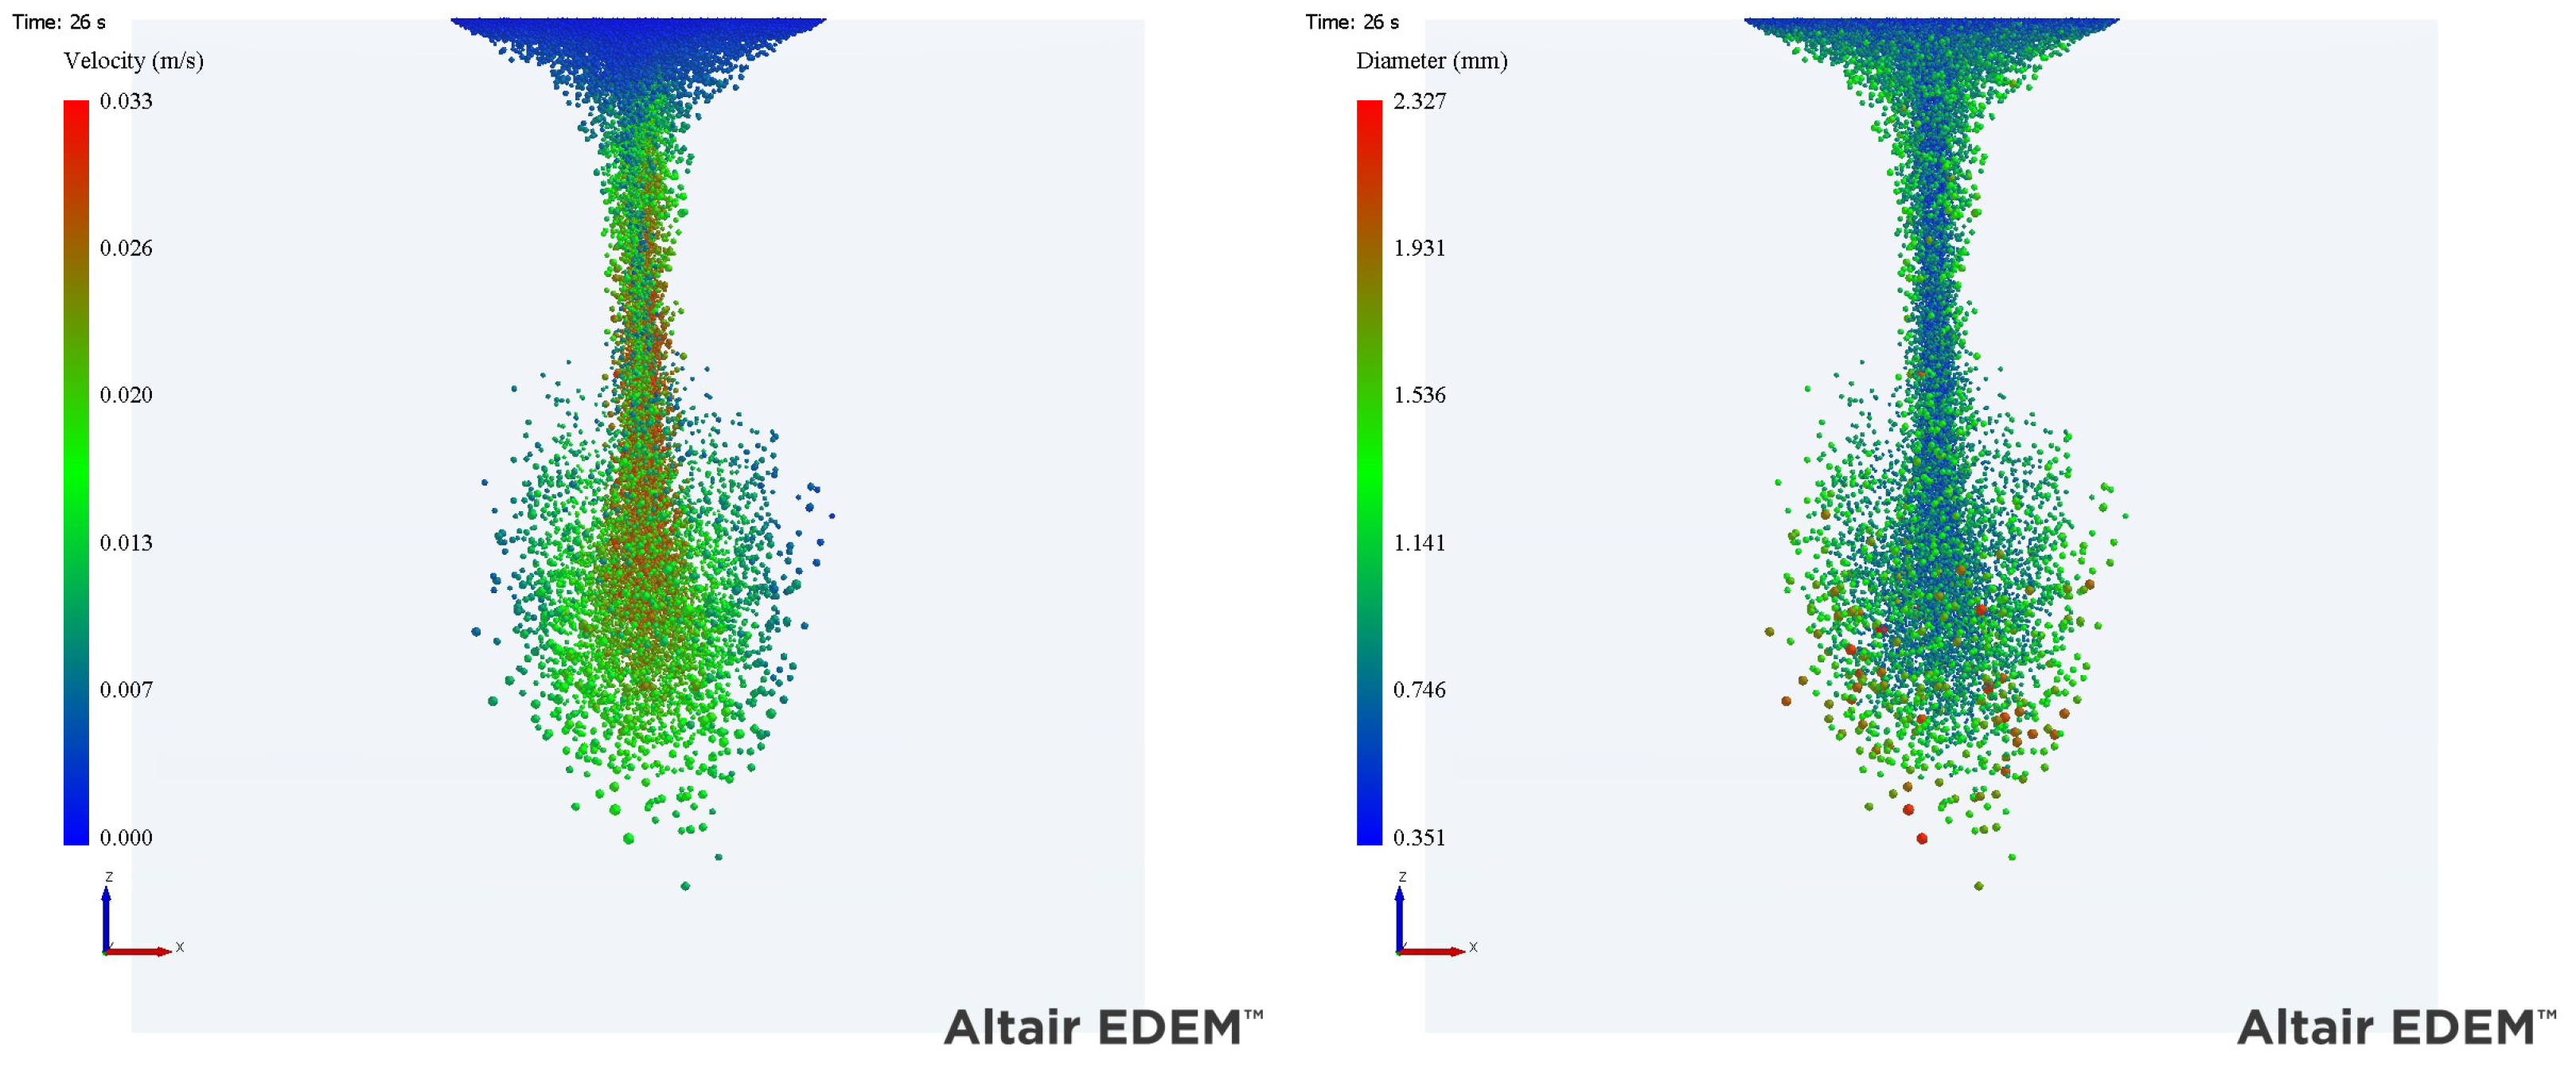
19]. The channel was formed because settling droplets drag other droplets in their wake, pulling them closer together. In a denser droplet cluster, the droplets kept colliding and coalescing more often, which further increased the droplet size and the settling rate. The increasing coalescence rate can be seen in
Figure 3 where the droplet diameter quickly increases as the droplets enter the channel. Also, the settling velocity can be seen to increase significantly in the channel compared to the velocity of the droplets that have not yet entered the channel.
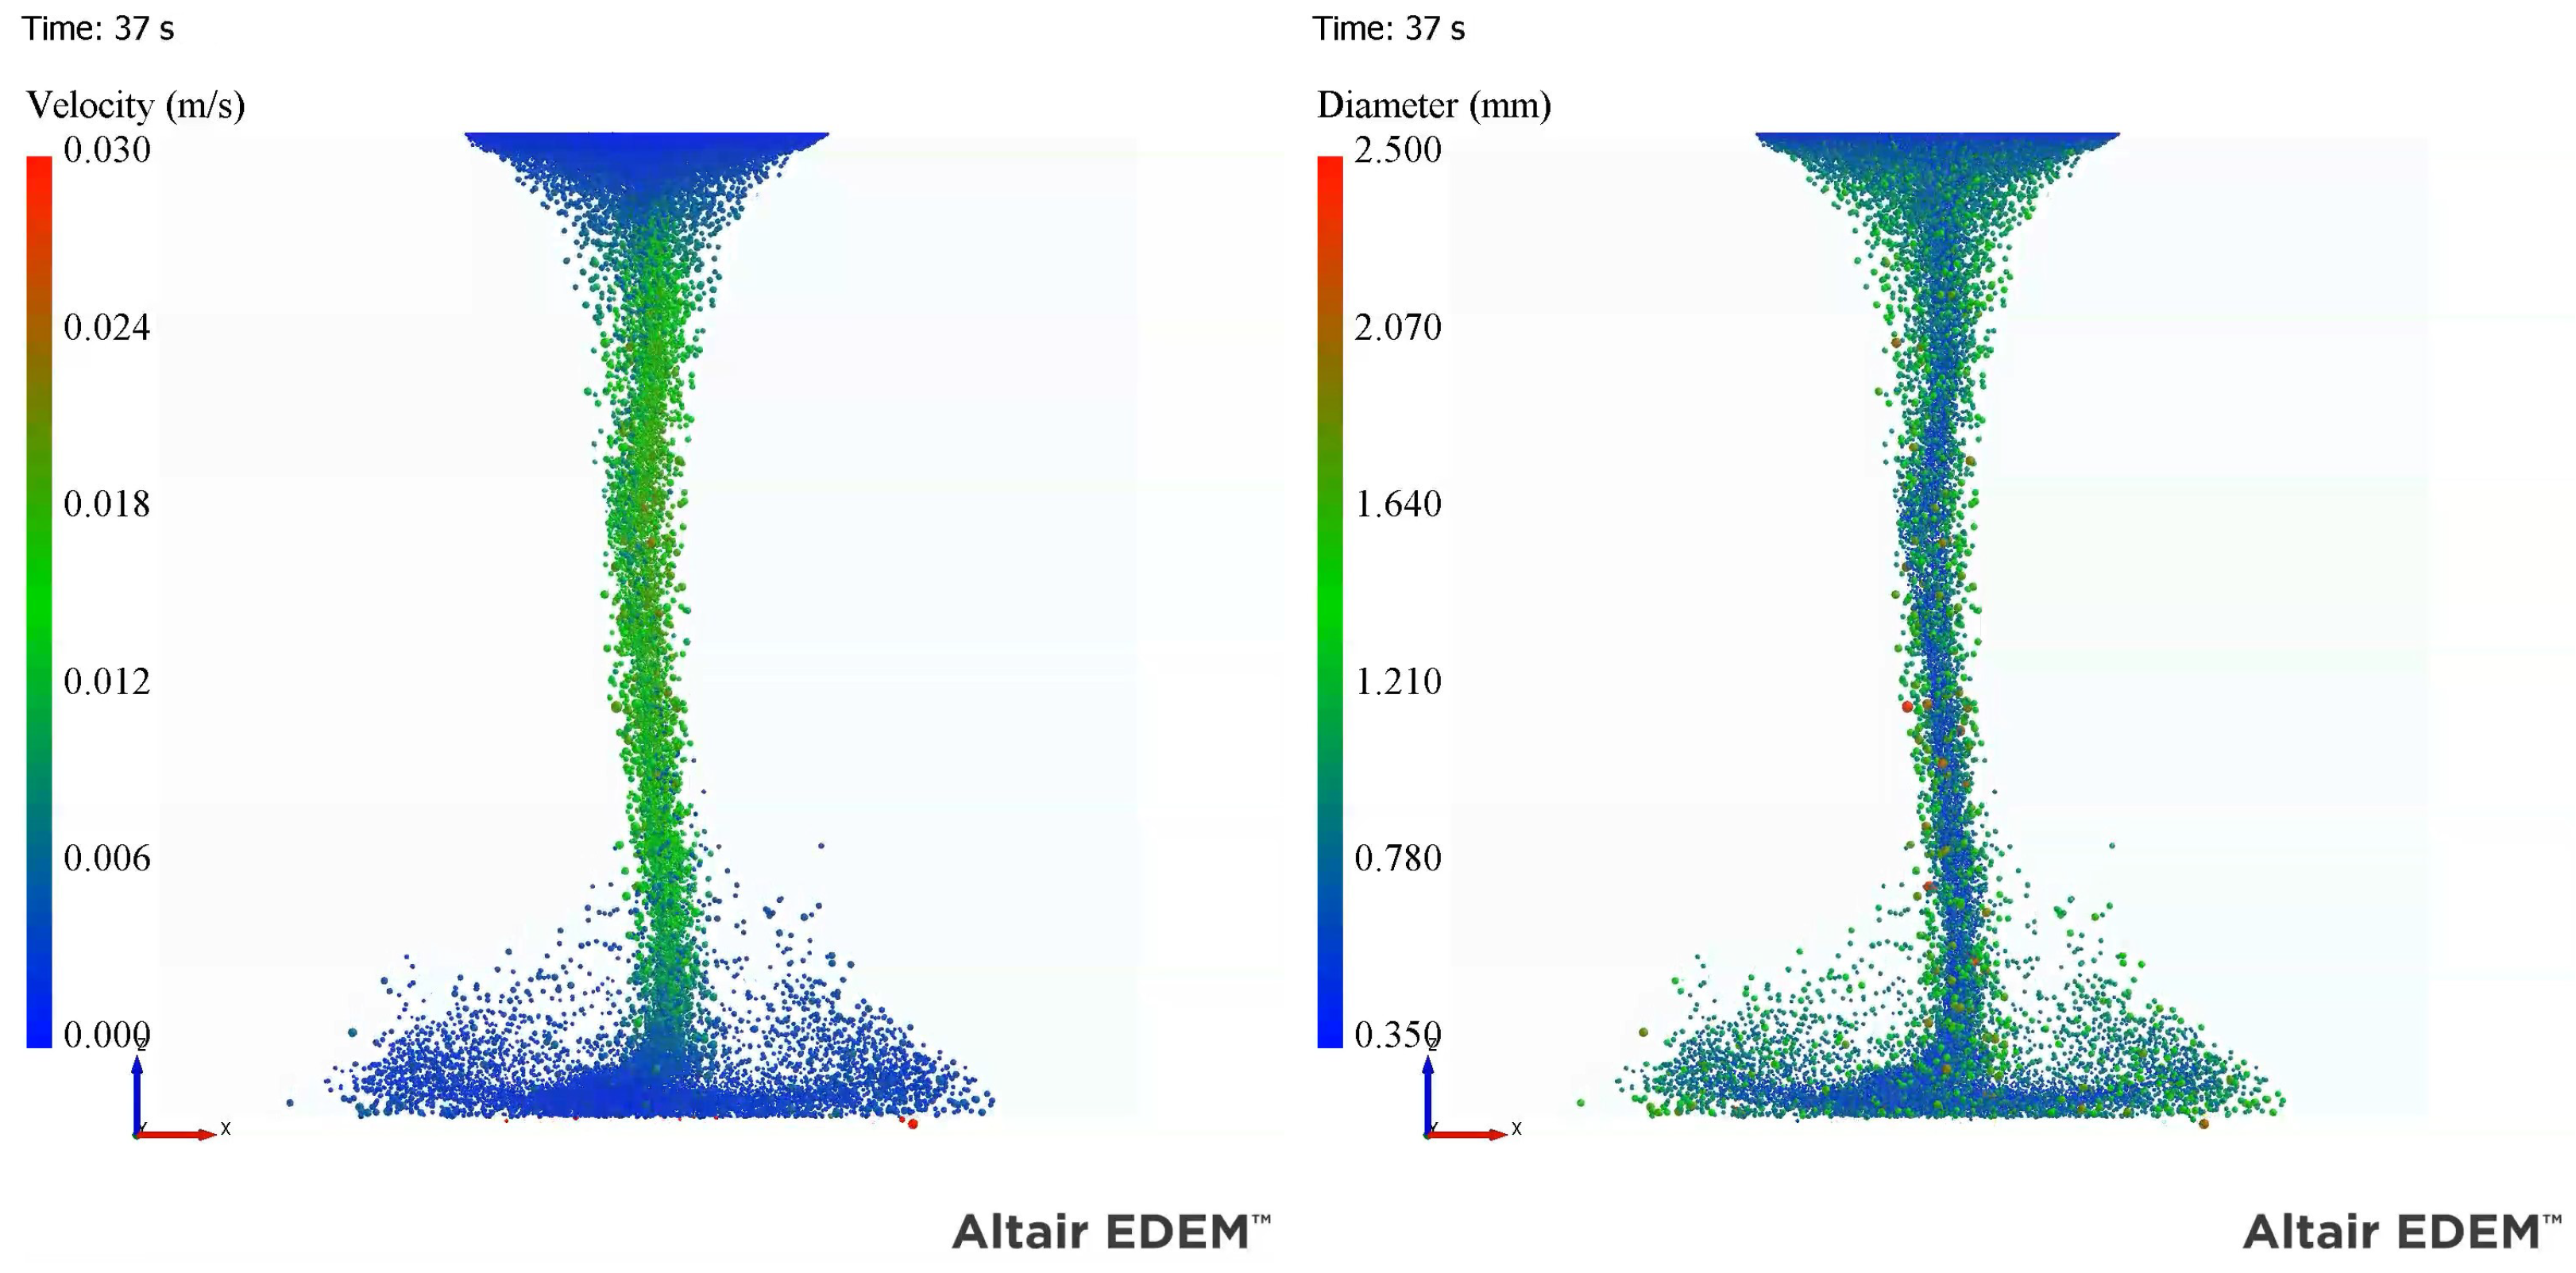
Near the matte–slag interface, the slag flow turned and spread the cluster which decelerated the droplets. As the slag flowed horizontally toward the walls of the geometry, it carried some droplets with it. Smaller droplets were even lifted upward, inhibiting them from passing through the matte–slag interface. The deceleration is shown in
Figure 4 and
Figure 5.
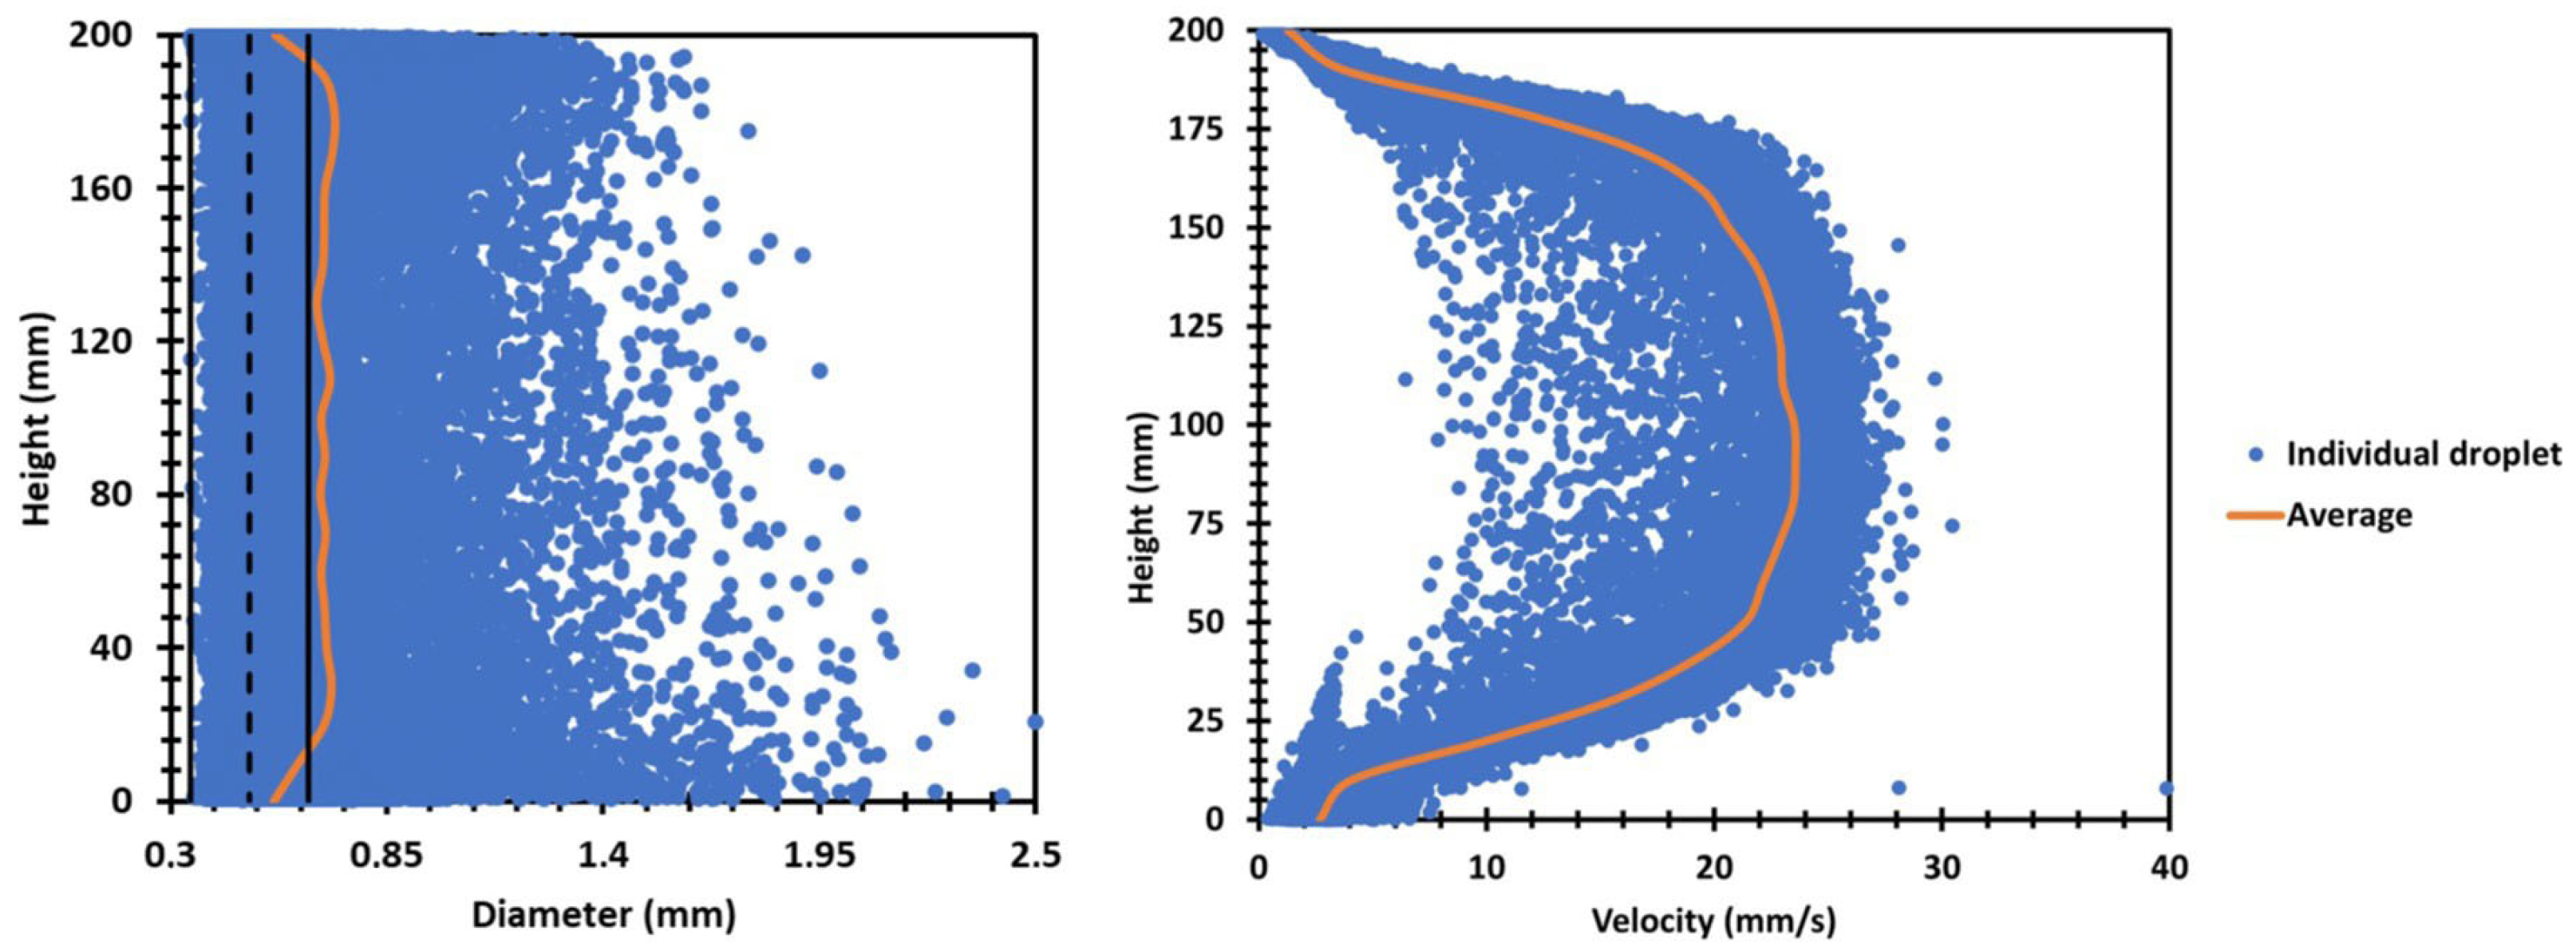
Both the coalescence rate and the dispersion of the droplets at the matte–slag interface can also be seen in
Figure 5. The diameter profile shows that droplets started coalescing quickly at the top of the model but the coalescence rate practically halted as the droplets entered the channel. Also, the diameter plot shows a decrease in average droplet size near the matte–slag interface, as the larger droplets passed through the bottom while the smallest droplets were dispersed. The black lines on the diameter plot show the mean (dashed line), minimum and maximum (intact lines) droplet sizes in the feed. The velocity curve also shows a similar effect, where the settling velocity quickly increased as droplets entered the formed channeling flow and then decelerated as the channel started to disperse.
3.2. Sphere–Oil Models
3.2.1. Nylon and PTFE Spheres
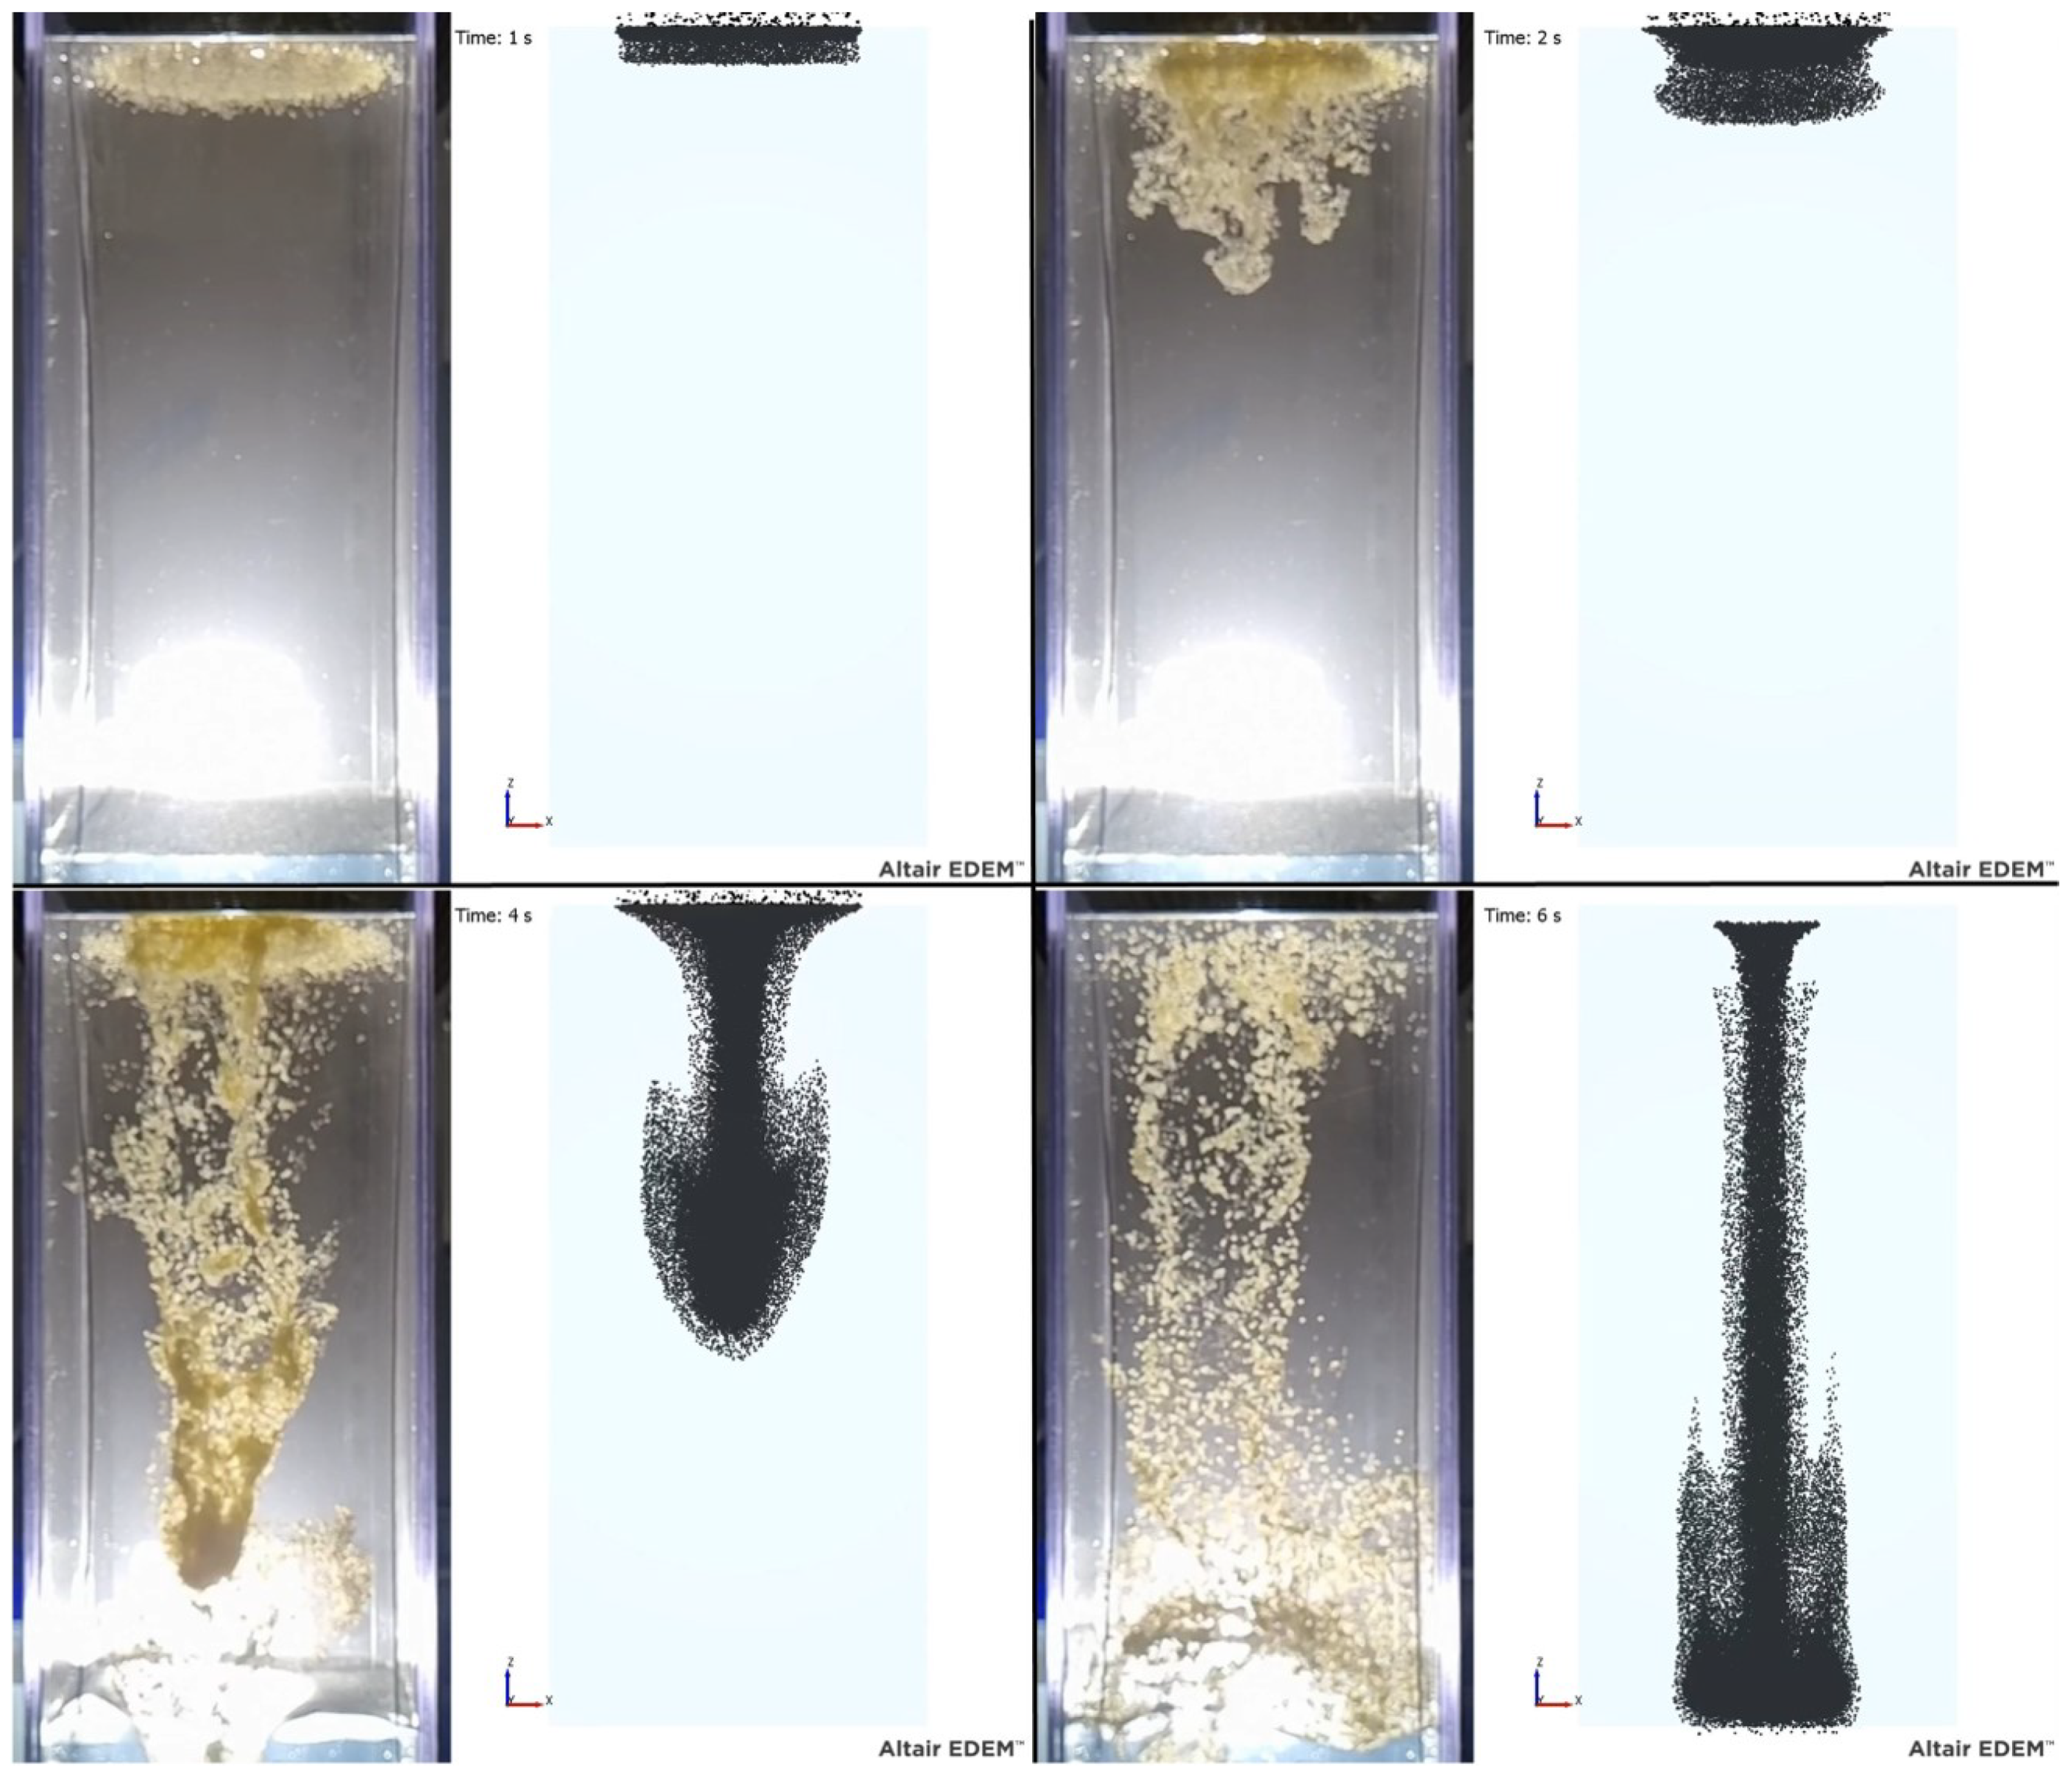
The channeling phenomenon was also produced in the plastic sphere simulation, where the channeling flow caused the spheres to go through the oil as a single cluster. The PTFE spheres went through the oil much faster than the nylon spheres, the remainder of which settled very slowly after the main mass had already settled. The average settling velocity was significantly higher than that of an individual droplet would be, according to Stoke’s law. This was caused both by the channeling flow in the oil and the cohesion of the spheres. The spheres also settled faster than predicted by the simulation. A comparison of the settling in the sphere–oil model and the simulation is presented in
Figure 6.
The situation after two seconds resembles the formation of several channels in the CFD simulation of a full-scale FSF settler. However, in this experiment, the small scale of the model and limited number of spheres resulted in a single channel.
The experiment with plastic spheres revealed some differences between the simulation and the experiment. Some of the differences were caused by the surface tension of the oil. In the simulation, the spheres are immersed in the oil once they enter the oil layer and do not experience a barrier at the surface. However, in the experiment, the spheres stick to the surface of the oil and more spheres are needed to break through the surface, forming larger clumps. Also, some cohesion between the spheres occurred, which was probably caused by both the static charge and oil film sticking to the surface of the spheres. The cohesion caused the further clumping of the spheres which, in turn, caused them to settle faster, resembling a single larger sphere. The clumping issue seemed to affect the nylon spheres more than the PTFE spheres. Nonetheless, similar channeling occurred as the spheres were pushed together near the surface. However, due to the uneven settling of the spheres, they were more often better dispersed in the oil. Unlike in the simulation, some spheres ended up at the sides of the box where the vortex ring lifted them. The lifting was further enhanced by the elastic nature of the water–oil interface.
3.2.2. PTFE Spheres Only
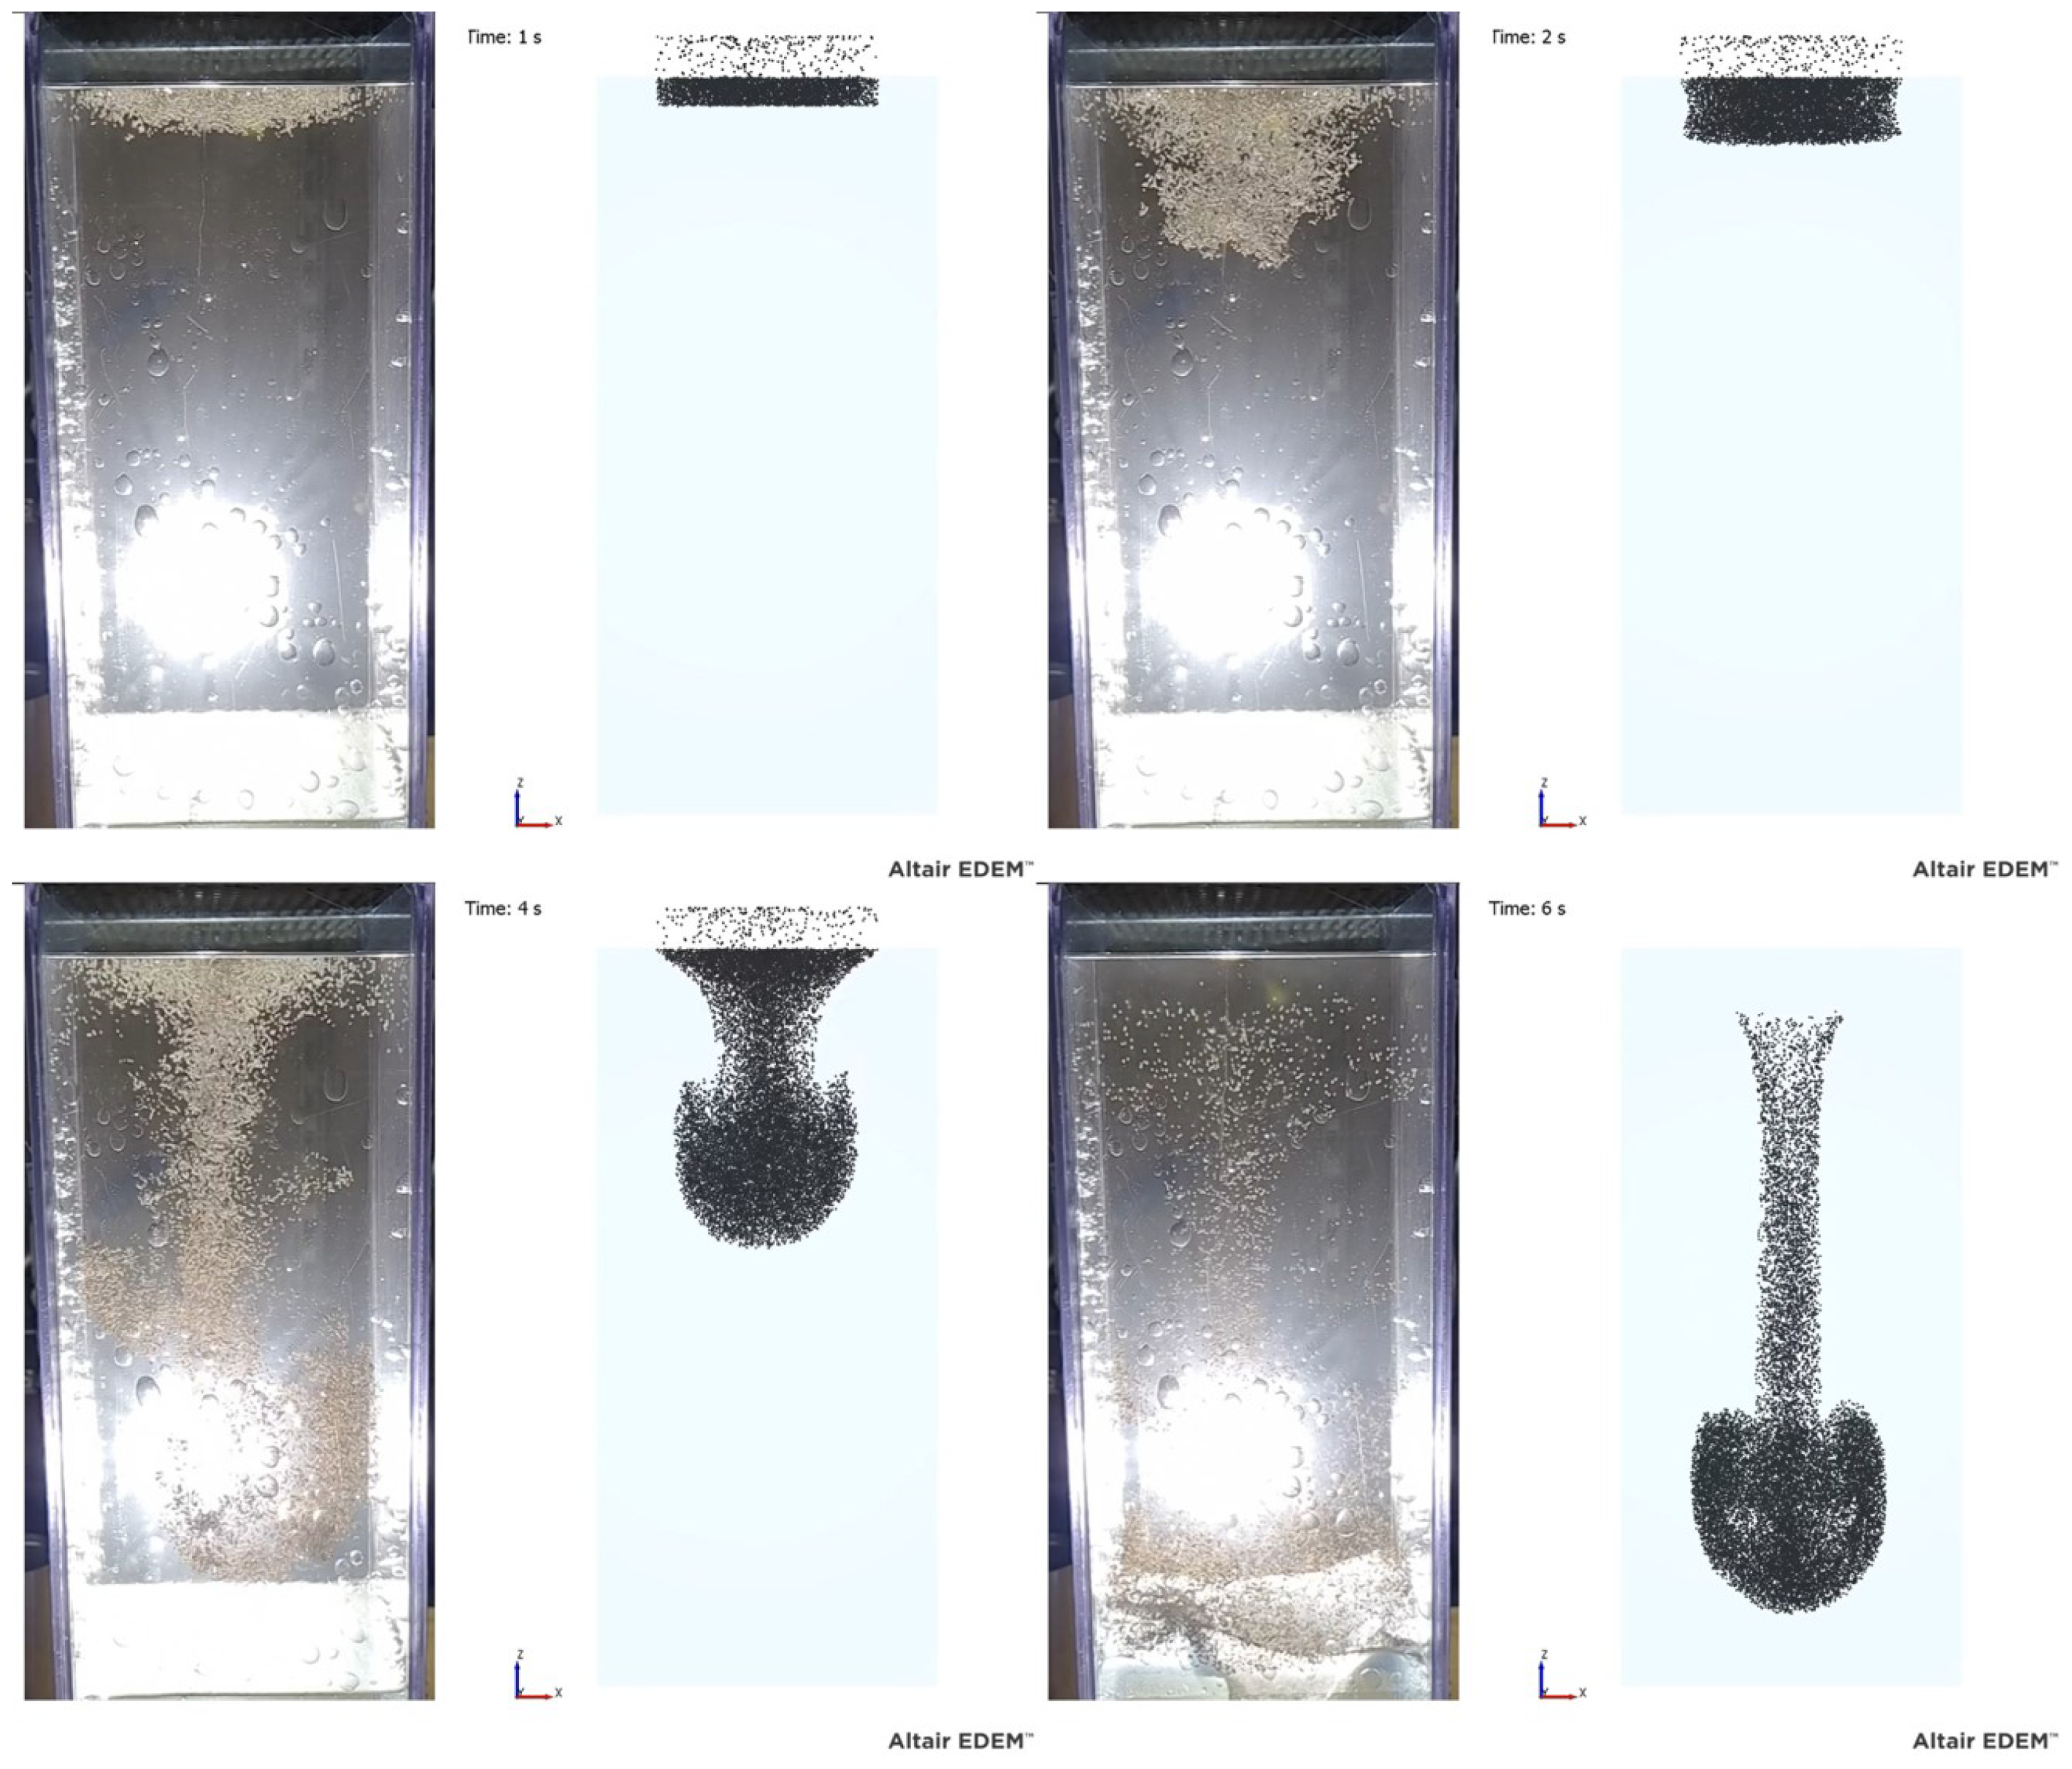
Due to the clumping issue, an experiment and simulation were also made using PTFE spheres alone. The PTFE spheres dispersed more in the oil and produced a more even cluster. The PTFE cluster was similar to the simulated one. However, as can be seen in
Figure 7, the cluster shape is different at the surface as the simulated inlet produces an even distribution of the spheres, whereas in the experiment, a point-like inlet is spread with mesh to create a distribution where most of the droplets fall closer to the center of the surface.
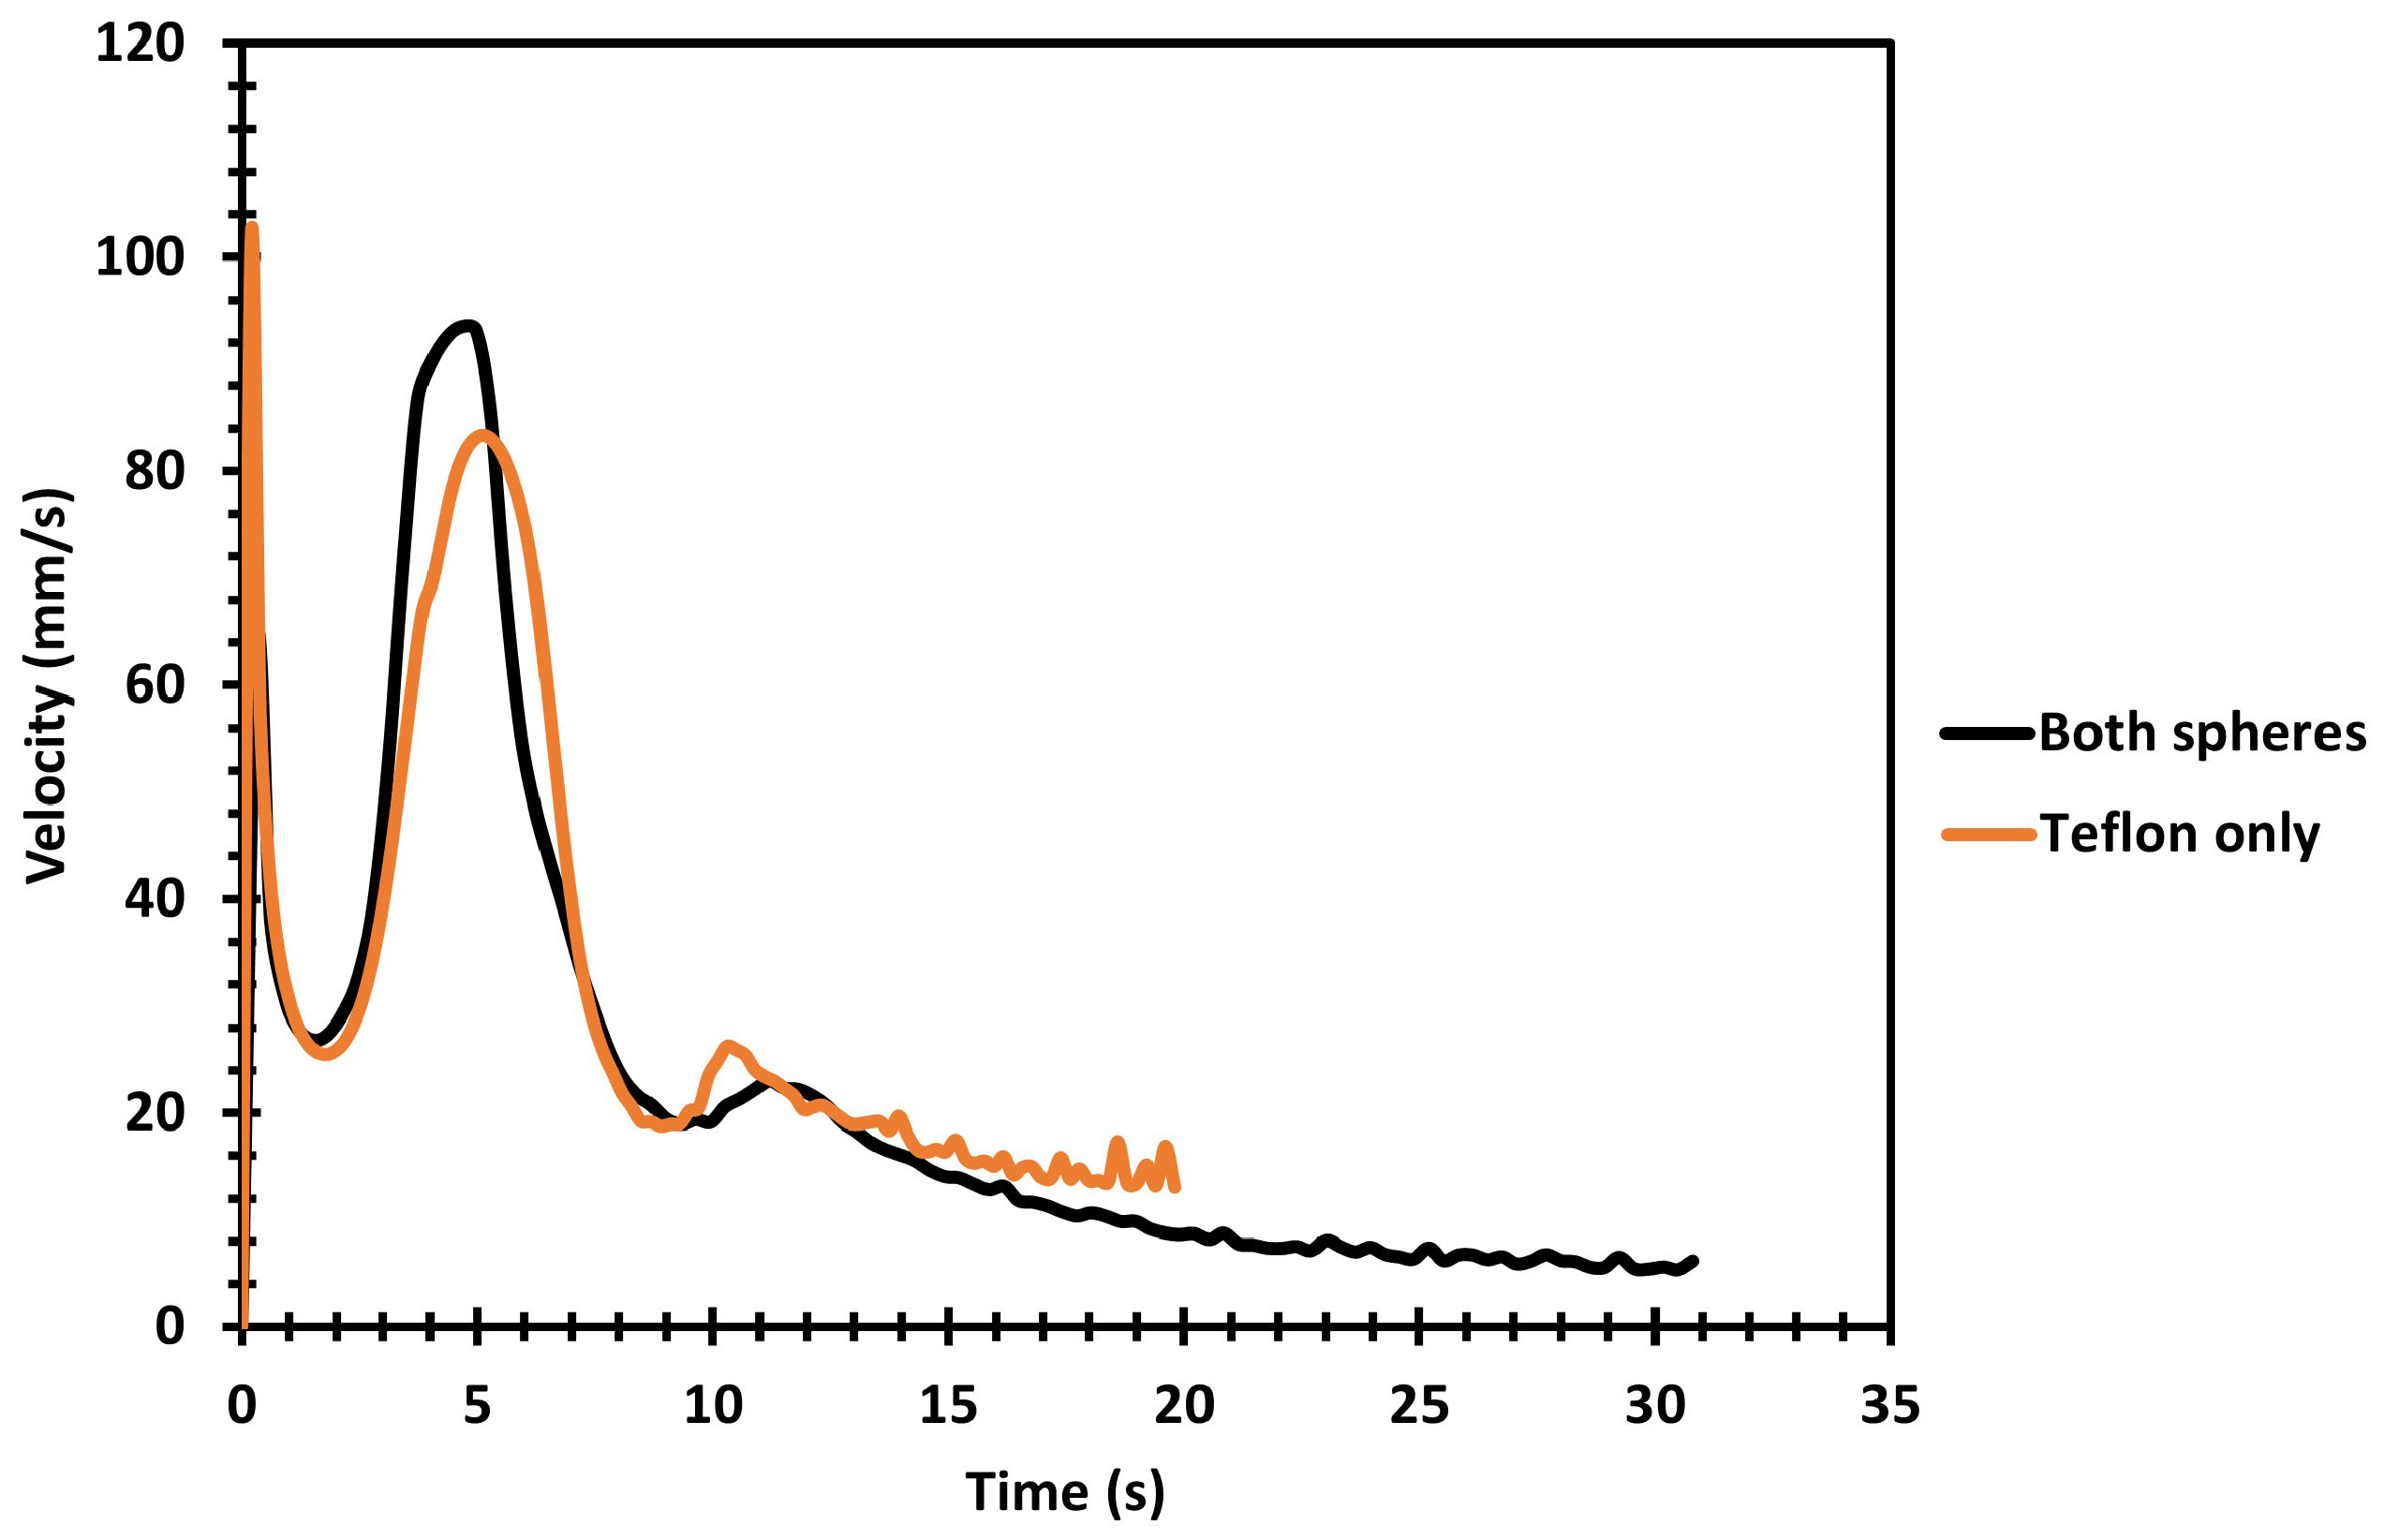
The average velocities of the settling spheres were very similar in both simulated cases, as can be seen in the velocity curves in
Figure 8. In the curves, an initial peak can be seen as the spheres fall without oil resistance, but the velocity decreases rapidly after entering the oil bath. Another, broader peak can be seen at the moment the vortex ring encompasses the whole geometry and the channeling flow reaches the bottom of the oil layer. However, due to the limited number of spheres, the velocity decreases again quickly because the majority of the spheres have left the simulation domain, as shown in
Figure 9.
The channeling phenomenon starts when droplets or particles hit the surface of the slag, causing small flows which form a larger vortex ring around the inlet area. The vortex ring flow then pushes the settling droplets closer to the centerline of the model. A denser cluster settles through the medium faster, causing a feedback loop that strengthens the vortex ring. The formation of the channel can be seen in the top 4 cm section of the plastic sphere model presented in
Figure 10.
The formation of the channel was also studied with a much wider simulation in order to determine the effect of wall distance which is presented in
Figure 11. In the wide geometry, a very similar channeling flow formed. However, the shape generated in the narrower geometry was slightly more deformed, indicating that the shape or details of the channeling flow are affected but not caused by the closeness of the walls.
The formation of the channeling flow of the spheres was similar in the simulated and experimental cases. Also, the extracted velocity–height plots in
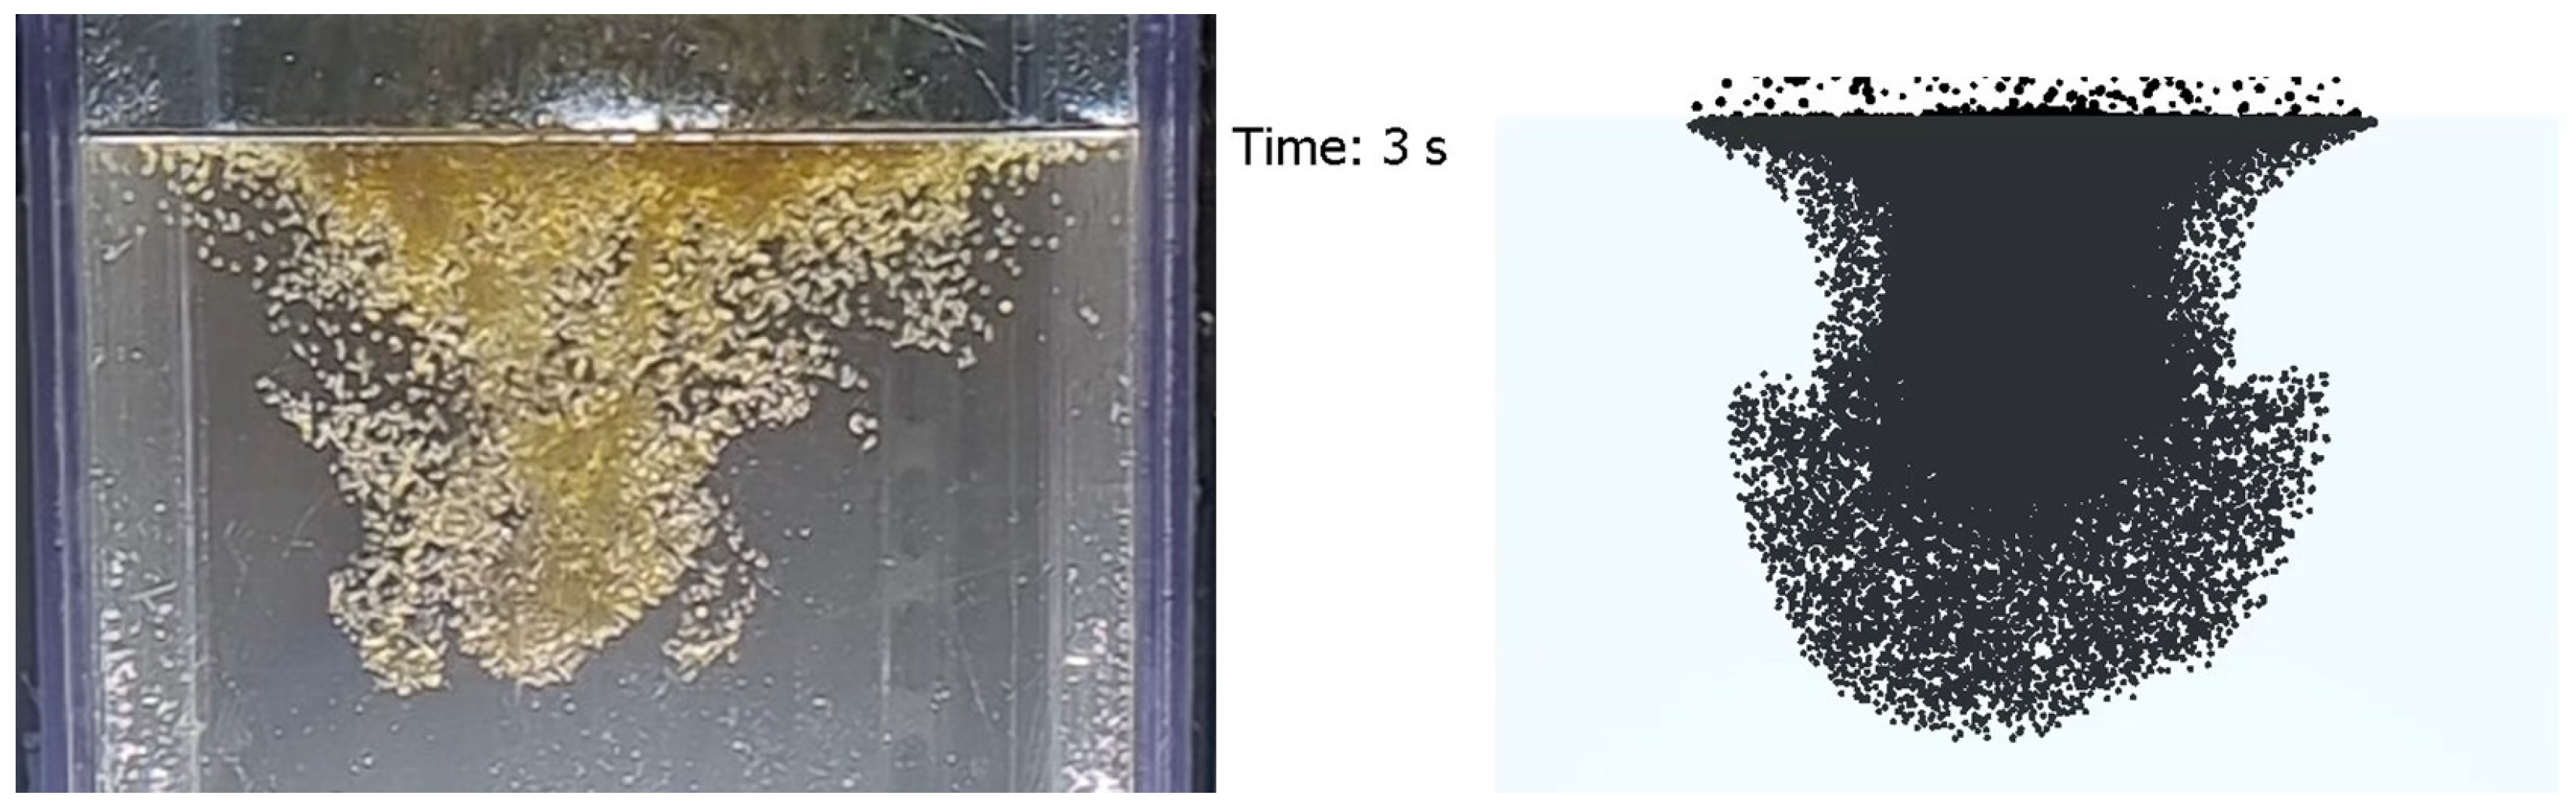
Figure 12 are similar to the one from the matte–slag simulation. The clearest difference between the simulated cases can be seen near the bottom where the spheres started to disperse as the smaller droplets did in the matte–slag simulation. Also, the settling cluster had not yet fully penetrated the oil layer, unlike in the matte–slag simulation. Unlike in the matte–slag simulation, the number of spheres fed to the sphere–oil simulation had been limited. The matte–slag simulation had a finite feed rate but the number of created droplets were otherwise unlimited. Also, the number of spheres in the simulations were lower than the number of droplets in the matte–slag simulation (40,000, 20,000 and 60,000 in simulations with both sphere types, only PTFE and matte–slag simulation, respectively). The lower number of entities and channel not having reached the bottom both emphasized the spheres that were starting to disperse as the oil flow changes direction at the bottom. However, the upside-down mushroom shape is missing in the experimental version, as shown in
Figure 13. The size was similar between the two cases but in the experiment, the spheres formed a much narrower tip compared to the simulated version.
4. Discussion
The channeling phenomenon, similarly to our previous studies [
10,
19], was observed in both the simulated and physical modeling cases. The phenomenon appears to occur with a variety of materials and scales. Both the simulated and experimental results show that channeling significantly increases settling velocity. In the FS process, fast settling causes lower-grade matte to go through the slag layer as the droplets have a limited time to react with the slag. As the more reacted matte is denser, the matte layer may have a gradient where less reacted matte is located at the slag–matte interface. This could allow reactions to continue at the interface. However, in an industrial process, concentrate is fed constantly and at high feed rates, which creates turbulent flows in the slag layer. These flows can carry smaller droplets which increases the contact time between the droplet and the slag, allowing them to react further before settling. However, overly small droplets may not settle at all, as they may be entrained by the slag flows and then removed with the slag.
According to the simulations presented in this and our previous studies, the channeling flow seems to settle into a relatively stable state where the formed channel does not break. However, in the industrial scale, the multiple channels and changing flows in the melts may cause the channeling flows to break. In such a case, new ones would probably form.
The splashing of the water–oil interface in the experimental model is most likely excessive compared to the FSF settler, as the viscosities of the matte and slag are higher than those of the water and the oil in the experiment (2–3.5 kg/ms [
26] vs. 1 kg/ms [
16] and 0.45 [
7,
8] vs. 0.0511 [
21], respectively), although the viscosity of the matte and water is of the same order of magnitude. Also, having a constant stream of matte droplets could decrease the amount of splashing in an industrial settler. However, if the matte droplets do not coalesce but still have some cohesion, as in the sphere experiment, their settling velocity could increase significantly.
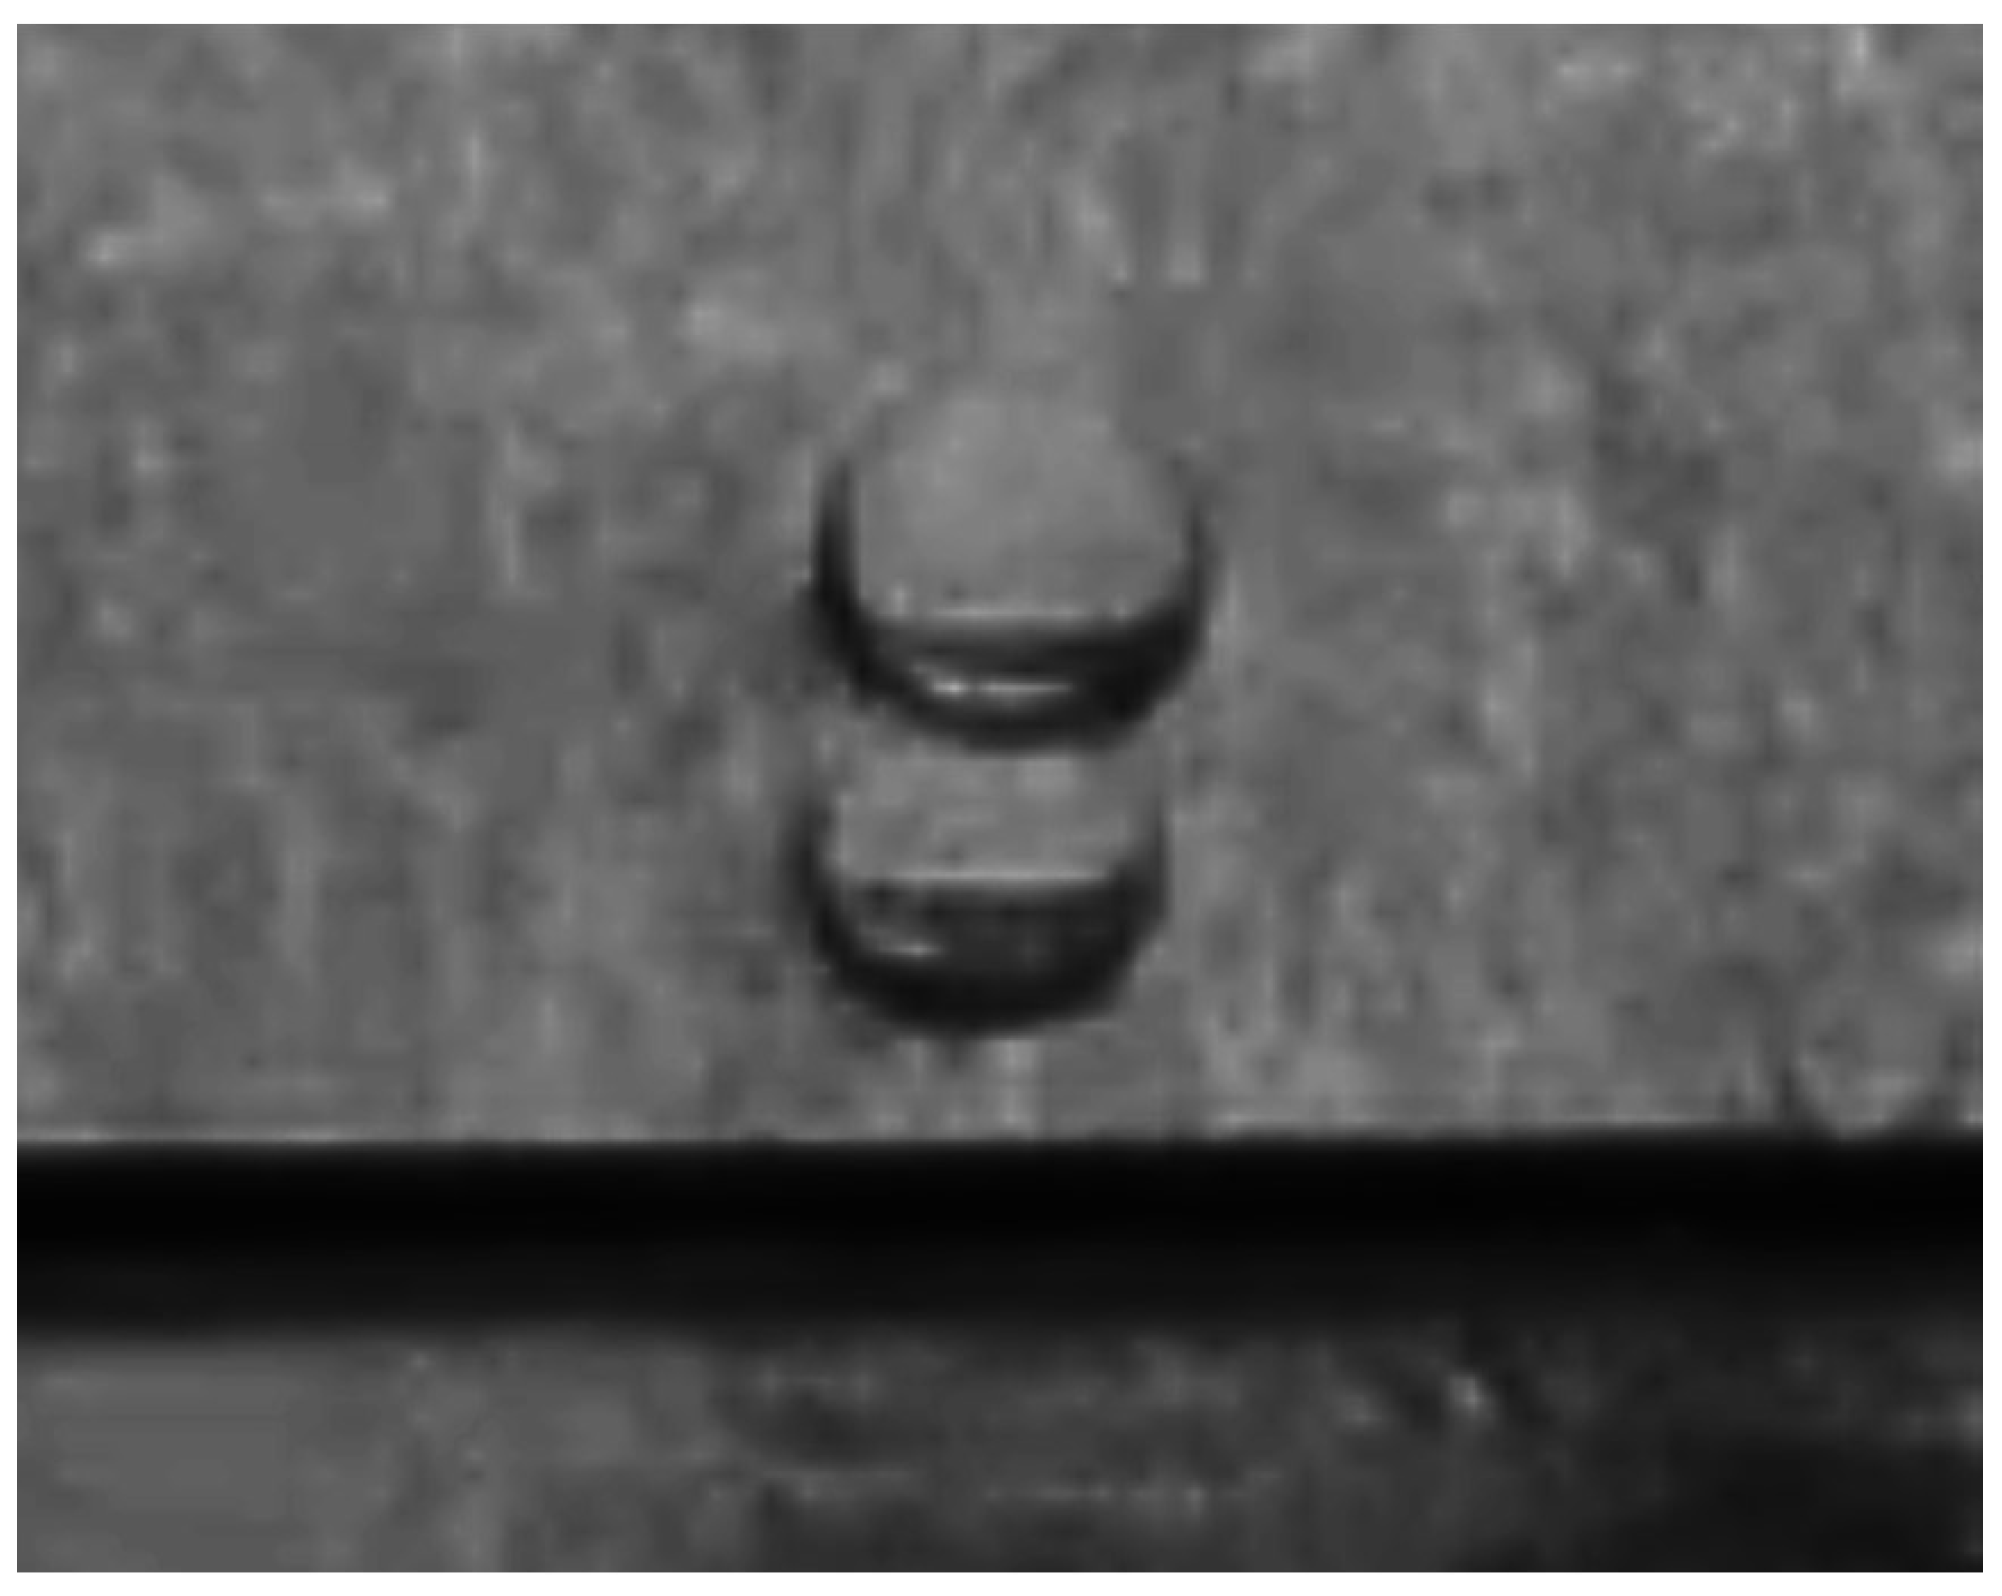
Wetting of the particles was not simulated. However, wetted particles had a film of oil covering them and particles pushed close together might share the film causing cohesion. Similarly, matte droplets could be stuck together if the contact forces could not break the slag film. This kind of cohesion between droplets was observed during early model development, and cohesion between particles were observed in this study as the cohesion in the sphere–oil experiment caused some differences between the simulation and the experiment. An example of the cohesion can be seen in
Figure 14, which was filmed for the thesis. The settling in clumps most likely increased the settling velocity of the cluster. In the simulations, the sphere feed was overly idealistic as the droplets were evenly distributed. Clumping caused relatively uneven sphere settling, which shows some resemblance to the multiple channels in the full-scale CFD simulation of the FSF settler. This could indicate that in the settler, the large number of droplets causes fluctuating streams through the slag, affecting the formation of channels.
In the experiment with PTFE spheres alone, significantly less cohesion was observable. However, the spheres still settled slightly faster than in the simulations. It is most likely that settling was affected by several different factors, such as an uneven distribution of the spheres in the feed, density and size that might differ from those given by the producer, the oil might have experienced some degradation, or the density of the oil might differ slightly. Also, the simulation had an idealistic starting point with perfectly still oil and a surface level that did not change as the spheres hit it.
According to these simulations, a channeling flow forms in many different situations, independent of the walls of the geometry. However, if the walls of the geometry are close, the phenomenon is enhanced. On an industrial scale, the walls are relatively far from the area where droplets hit the slag surface. However, as was visible in the CFD model of the full-sized furnace [
10], several channels may form. The vortex flows from multiple channels could cause a similar effect to that of nearby walls.
5. Conclusions
The settling phenomenon was studied using both coupled CFD-DEM simulations and an experimental model. In simulations carried out in our previous studies, a channeling flow phenomenon was observed that significantly increased the settling velocity of droplets. As practical observations of settling in an FS process cannot be made, an alternative method for the validation of the modeling results was needed. Therefore, a matte–slag simulation was accompanied by a sphere–oil simulation, which was replicated as a physical experiment. Based on the different CFD-DEM simulations together with the physical experiments with the sphere–oil model, the simulation method and results indicating the channeling settling flow phenomenon can be considered to be valid and further investigations of the details of the copper matte settling behavior can be made.
The CFD-DEM models are a capable tool for simulating different phenomena inside liquid layers. However, additional models are needed to simulate phenomena such as the coalescence and reaction kinetics of settling matte droplets. The most important phenomenon, the formation of a channeling flow, seems to occur similarly with and without a coalescence model. Furthermore, the phenomenon appears to occur in different kinds of setups when some object, whether liquid or solid, settles through a fluid. However, in a fluid with very low viscosity, the drag flow is likely to be too weak to significantly pull the droplets together into a cluster, unless the objects are extremely tiny or light.
In future research, the feeding area of the simulations should be set to produce a distribution of feed density as a completely even distribution did not occur in the practical experiments and most probably will not occur in an industrial process either. Also, the effect of the size of the feed area should be studied as multiple channels should be formed over a certain threshold size.
Additionally, the coalescence criterion should be studied and adjusted to further increase the accuracy of future simulations. Similarly, the possible cohesion of the droplets should be studied in cases where coalescence does not occur. As the experimental model has shown, clumps increase the settling velocity significantly. Also, the splashing of the matte–slag interface should be studied with droplet settling, as the spheres in the experimental model were thrown upward in the oil layer as a result of the splashing of the water–oil interface.
Author Contributions
Conceptualization, J.-P.J. and A.J.; methodology, J.-P.J.; software, J.-P.J.; validation, J.-P.J.; formal analysis, J.-P.J.; investigation, J.-P.J.; resources, A.J.; data curation, J.-P.J.; writing—original draft preparation, J.-P.J. and A.J.; writing—review and editing, J.-P.J. and A.J.; visualization, J.-P.J.; supervision, A.J.; project administration, A.J.; funding acquisition, A.J. All authors have read and agreed to the published version of the manuscript.
Funding
This research was funded by Business Finland as a part of TOCANEM project. Grant Number: 41778/31/2020.
Data Availability Statement
The data presented in this study are available on request from the corresponding author. The data are not publicly available due to commercial software licensing policies.
Conflicts of Interest
The authors declare no conflict of interest.
Abbreviations
The following abbreviations are used in this manuscript:
| CFD | Computational Fluid Dynamics |
| DEM | Discrete Element Method |
| FSF | Flash Smelting Furnace |
| DPM | Discrete Phase Model |
| DDPM | Dense Discrete Phase Model |
| PTFE | Polytetrafluoroethylene |
References
- Bacedoni, M.; Moreno-Ventas, I.; Ríos, G. Copper Flash Smelting Process Balance Modeling. Metals 2020, 10, 1229. [Google Scholar] [CrossRef]
- Guntoro, P.I.; Jokilaakso, A.; Hellstén, N.; Taskinen, P. Copper matte—Slag reaction sequences and separation processes in matte smelting. J. Min. Metall. Sect. B Metall. 2018, 54, 301–311. [Google Scholar] [CrossRef]
- Bergh, L.; Cornejo, I.; Romero, F.; Sulzer, C. Improving copper matte grade control in a concentrate flash furnace. In IFAC Proceedings Volumes (IFAC-PapersOnline); Elsevier: Amsterdam, The Netherlands, 2012; pp. 13–18. [Google Scholar] [CrossRef]
- Bellemans, I.; De Wilde, E.; Moelans, N.; Verbeken, K. Metal losses in pyrometallurgical operations—A review. Adv. Colloid Interface Sci. 2018, 255, 47–63. [Google Scholar] [CrossRef] [PubMed]
- De Wilde, E.; Bellemans, I.; Campforts, M.; Guo, M.; Blanpain, B.; Moelans, N.; Verbeken, K. Investigation of High-Temperature Slag/Copper/Spinel Interactions. Metall. Mater. Trans. B Process Metall. Mater. Process. Sci. 2016, 47, 3421–3434. [Google Scholar] [CrossRef]
- Zivkovic, Z.; Djordjevic, P.; Mitevska, N. Contribution to the Examination of the Mechanisms of Copper Loss with the Slag in the Process of Sulfide Concentrates Smelting. Min. Metall. Explor. 2020, 37, 267–275. [Google Scholar] [CrossRef]
- Xia, J.L.; Ahokainen, T.; Kankaanpää, T.; Järvi, J.; Taskinen, P. Flow and Heat Transfer Performance of Slag and Matte in the Settler of a Copper Flash Smelting Furnace. Steel Res. Int. 2007, 78, 155–159. [Google Scholar] [CrossRef]
- Xia, J.; Ahokainen, T.; Kankaanpää, T.; Järvi, J.; Taskinen, P. Numerical modelling of copper droplet setting behavior in the settler of a flash smelting furnace. In Proceedings of the European Metallurgical Conference, EMC 2005, Dresden, Germany, 18–21 September 2005. [Google Scholar]
- Khan, N.A.; Jokilaakso, A. Dynamic Modelling of Molten Slag-Matte Interactions in an Industrial Flash Smelting Furnace Settler. In Proceedings of the Extraction 2018; Davis, B.R., Moats, M.S., Wang, S., Gregurek, D., Kapusta, J., Battle, T.P., Schlesinger, M.E., Alvear Flores, G.R., Jak, E., Goodall, G., et al., Eds.; Springer: Cham, Switzerland, 2018; pp. 993–1005. [Google Scholar] [CrossRef]
- Jylhä, J.P.; Khan, N.A.; Jokilaakso, A. Computational approaches for studying slag-matte interactions in the flash smelting furnace (FSF) settler. Processes 2020, 8, 485. [Google Scholar] [CrossRef]
- Jun, Z.; Zhuo, C.; Ping, Z.; Jian-ping, Y.U.; An-ming, L.I.U. Numerical simulation of flow characteristics in settler of flash furnace. Trans. Nonferrous Met. Soc. China 2012, 22, 1517–1525. [Google Scholar] [CrossRef]
- Fagerlund, K.O.; Jalkanen, H. Microscale simulation of settler processes in copper matte smelting. Metall. Mater. Trans. 2000, 31B, 439. [Google Scholar] [CrossRef]
- Schmidt, L.I.A.; Montenegro, V.; Wehinger, G.D. Transient CFD Modeling of Matte Settling Behavior and Coalescence in an Industrial Copper Flash Smelting Furnace Settler. Metall. Mater. Trans. B 2021, 52, 405–414. [Google Scholar] [CrossRef]
- Altair Engineering Inc. Introducing EDEM; Altair Engineering Inc.: Troy, MI, USA, 2022; Available online: https://2022.help.altair.com/2022.2/EDEM/Introducing_EDEM.htm (accessed on 26 July 2023).
- Davenport, W.G.; Partelpoeg, E.H. Flash Smelting: Analysis, Control and Optimization; Elsevier Science: New York, NY, USA, 1987; pp. 22–28. [Google Scholar]
- Avallone, E.A.; Baumeister, T.I. Standard Handbook for Mechanical Engineers; McGraw-Hill: New York, NY, USA, 1999. [Google Scholar]
- Wang, T.; Wang, J.; Jin, Y. Theoretical prediction of flow regime transition in bubble columns by the population balance model. Chem. Eng. Sci. 2005, 60, 6199–6209. [Google Scholar] [CrossRef]
- Finotello, G.; Padding, J.T.; Deen, N.G.; Jongsma, A.; Innings, F.; Kuipers, J.A. Effect of viscosity on droplet-droplet collisional interaction. Phys. Fluids 2017, 29, 067102. [Google Scholar] [CrossRef]
- Jylhä, J.P.; Jokilaakso, A. CFD-DEM modelling of matte droplet behaviour in a flash smelting settler. In Proceedings of the 58th Conference of Metallurgists Hosting Copper 2019, Vancouver, BC, Canada, 17–21 August 2019; pp. 1–15. [Google Scholar]
- Thermo Fisher Scientific. Silicone Oil A12728; Thermo Fisher Scientific: Waltham, MA, USA, 2021. [Google Scholar]
- Thermo Fisher Scientific. Silicone Oil A12728 Lot 10234143 Viscosity; Technical Report; Thermo Fisher Scientific: Waltham, MA, USA, 2022. [Google Scholar]
- Kaifeng Bell Stainless Steel Ball Manufacture Co., Ltd. PTFE 1 mm Balls. Available online: https://www.bellballs.com/plastic-balls/hard-plastic-balls/ptfe-1mm-balls.html (accessed on 13 November 2022).
- Kaifeng Bell Stainless Steel Ball Manufacture Co., Ltd. 2 mm Nylon Plastic Balls. Available online: https://www.bellballs.com/plastic-balls/hard-plastic-balls/2mm-nylon-plastic-balls.html (accessed on 13 November 2022).
- CROW’s Polymer Physics. Typical Poisson’s Ratios of Polymers at Room Temperature. Available online: https://polymerdatabase.com/polymerphysics/PoissonTable2.html (accessed on 13 November 2022).
- Perry, J.H. Perrys Chemical Engineers’ Handbook; McGraw-Hill: New York, NY, USA, 1950; pp. 132, 161, 349. [Google Scholar] [CrossRef]
- Sundström, A.W.; Eksteen, J.J.; Georgalli, G.A. A review of the physical properties of base metal mattes. J. S. Afr. Inst. Min. Metall. 2008, 108, 431–448. [Google Scholar]
| Disclaimer/Publisher’s Note: The statements, opinions and data contained in all publications are solely those of the individual author(s) and contributor(s) and not of MDPI and/or the editor(s). MDPI and/or the editor(s) disclaim responsibility for any injury to people or property resulting from any ideas, methods, instructions or products referred to in the content. |
© 2023 by the authors. Licensee MDPI, Basel, Switzerland. This article is an open access article distributed under the terms and conditions of the Creative Commons Attribution (CC BY) license (https://creativecommons.org/licenses/by/4.0/).


