Abstract
Due to the harsh operating environment of aero-engines, a surface structure that provides excellent aerodynamic performance is urgently required to save energy and reduce emissions. In this study, microgroove polyurethane coatings fabricated by chemical synthesis are investigated in terms of their effect on aerodynamic performance, which is a new attempt to investigate the impact on aerodynamic performance of compressor cascade at transonic speeds. This method reduces manufacturing and maintenance cost significantly compared with traditional laser machining. Wake measurements are conducted in the high-speed linear compressor cascade wind tunnel to evaluate the performance of cascade attached with different microgroove polyurethane coatings. Compared with the Blank case, the microgroove polyurethane coatings have the characteristic of reducing flow loss, with a maximum reducing rate of 5.87% in the area-averaged total pressure loss coefficient. The mechanism of flow loss control is discussed through analyzing the correlation between the total pressure distribution and turbulence intensity distribution. The results indicate that a large quantity of energy loss in the flow field due to turbulence dissipation and the reduction in viscous drag by microgroove polyurethane coatings relates to its effect on turbulence control. This paper demonstrates a great perspective on designing micro-nano surface structure for aero-engine applications.
1. Introduction
The development of effective methods for improving efficiency and decreasing costs due to flow loss is essential in many engineering applications, particularly for aero-engine compressors that operate at high speeds in harsh environments [1,2,3,4]. So far, a series of active and passive techniques have been developed to control flow near the surface for loss reduction. Active control methods, such as acoustic excitation [5], jet actuators [6], and periodic forcing [7], require power expenditure, thus limiting their application. By contrast, passive flow control methods are widely used to improve drag performance. These methods are usually accomplished by the passive manipulation of near-wall flow by modifying surface topography without additional equipment or energy consumption, such as a vortex generator [8,9,10], an anisotropic porous wall [11,12], and grooves [13,14]. Because of the above characteristics, these methods show great prospects for further application.
Among these mentioned passive flow control methods, inspired by the surface structure from nature, micro-texture surface is widely known as an effective method to reduce viscous drag, which was first investigated by Walsh [15,16] and has been studied extensively [17,18,19,20,21]. The mechanism of friction drag reduction explains that ordered and directional secondary vortices are induced and rotate in the groove. Secondary vortices as a stagnant fluid buffer may even lead to local flow and shear stress reversal, i.e., ‘thrust’ [22]. Moreover, the high-friction area near the wall shrinks as the vortices rise up [23]. Stull and Velkoff [24] introduced a series of cavities over the diverging curved wall to delay flow separation through the so-called “roller bearing” mechanism, i.e., the formation of a succession of recirculation regions adjacent to the solid surface. Dolphin skin-inspired sinusoidal and rectangular grooves were successfully used by Lang et al. [25] to boundary-layer separation delay over a flat plate in an adverse pressure gradient. The effectiveness of small and suitably shaped contoured grooves, placed transverse to the flow, in delaying boundary-layer separation in adverse pressure gradient is provided for internal flows and external flows proved by Mariotti et al. [26,27] due to the generation of local steady flow recirculation. Moreover, Bechert applied and optimized micro-texture surface structure, which reached a 9.9% decrease in total drag [28]. Luo et al. [29] conducted a hydrodynamic drag reduction experiment using manufacturing morphologies and surface structure, which shows that drag can be reduced by more than 12% compared with that of the smooth surface. These results demonstrate the great potential of micro-texture surface application in aircraft viscous drag reduction.
In recent years, several investigations concerning the application of micro-texture surface structure to the airfoil [30,31] and compressor blade have been conducted. Zhang et al. [32] conducted experimental and computational research for aero-engine blades with micro-texture on the surface and established an optimized texture structure over the blade in the inlet Mach of 0.216, which had better drag reduction performance than that of the smooth blade. Boese and Fottner [33] and Lietmeyer et al. [34] also achieved a loss reduction through experimental investigation of the influence of grooved surface structures on the loss behavior of the compressor cascade. Liu et al. [35] studied the effects of a herringbone grooved surface in a linear cascade on pressure losses and flow turning angles over a range of low Reynolds numbers from 0.50 × 10⁵ to 1.50 × 10⁵. The experiment results showed that the herringbone grooved surface at low Reynolds numbers produced obvious improvement in cascade performance for turbulence flow control, which was attributed to the secondary flow produced by herringbone grooves that energized the boundary layer. The above investigations illustrate the effectiveness of micro-texture surface in reducing flow loss on compressor cascade.
However, existing studies basically focus on the aerodynamic effect of micro-texture surface by the traditional laser machining method, which raises its manufacturing and maintenance cost and limits its application field. Actually, the single-level periodic texture is a simplification for convenience in a previous study, and the surface structure from nature is essentially hierarchical and random [36]. With the development of material science, chemical synthesis surfaces could be a new attempt for aerodynamic performance improvement. This method significantly reduces manufacturing and maintenance cost, which provides a new solution to improving the efficiency of design and production and is more beneficial for practical applications. Kim et al. [37] used a durable surface with highly ordered hierarchical structures to enhance drag-reduction properties and verified the factors resulting in drag reduction in the composite structure: an air-layer effect induced by nanostructures and secondary vortices generated by micro-riblet structures. Most of the current research on the performance of chemical synthesis surfaces is conducted in water under low speed, which fails to show its aerodynamic characteristics in a harsh gas environment at transonic speeds. As a result, it is essential to conduct systematic experiments inside the wind tunnel to analyze it.
Considering the experimental circumstances comprehensively, microgroove polyurethane coatings are used as the studied surface structure, which simplifies the fabrication process and improves the reproducibility of the experiment. In the authors’ previous work, Tao et al. [38] conducted wind tunnel tests on an airfoil with microgrooves and strawberry-like nanosphere surface structure. The tests showed that the coating effectively reduces the drag of the airfoil and delays the transition from laminar flow to turbulence. In this paper, the coating process is improved to ensure better uniformity of the groove structure. The aerodynamic performances of compressor cascade with microgroove polyurethane coatings in the transonic speed at Ma = 0.89 are explored and analyzed.
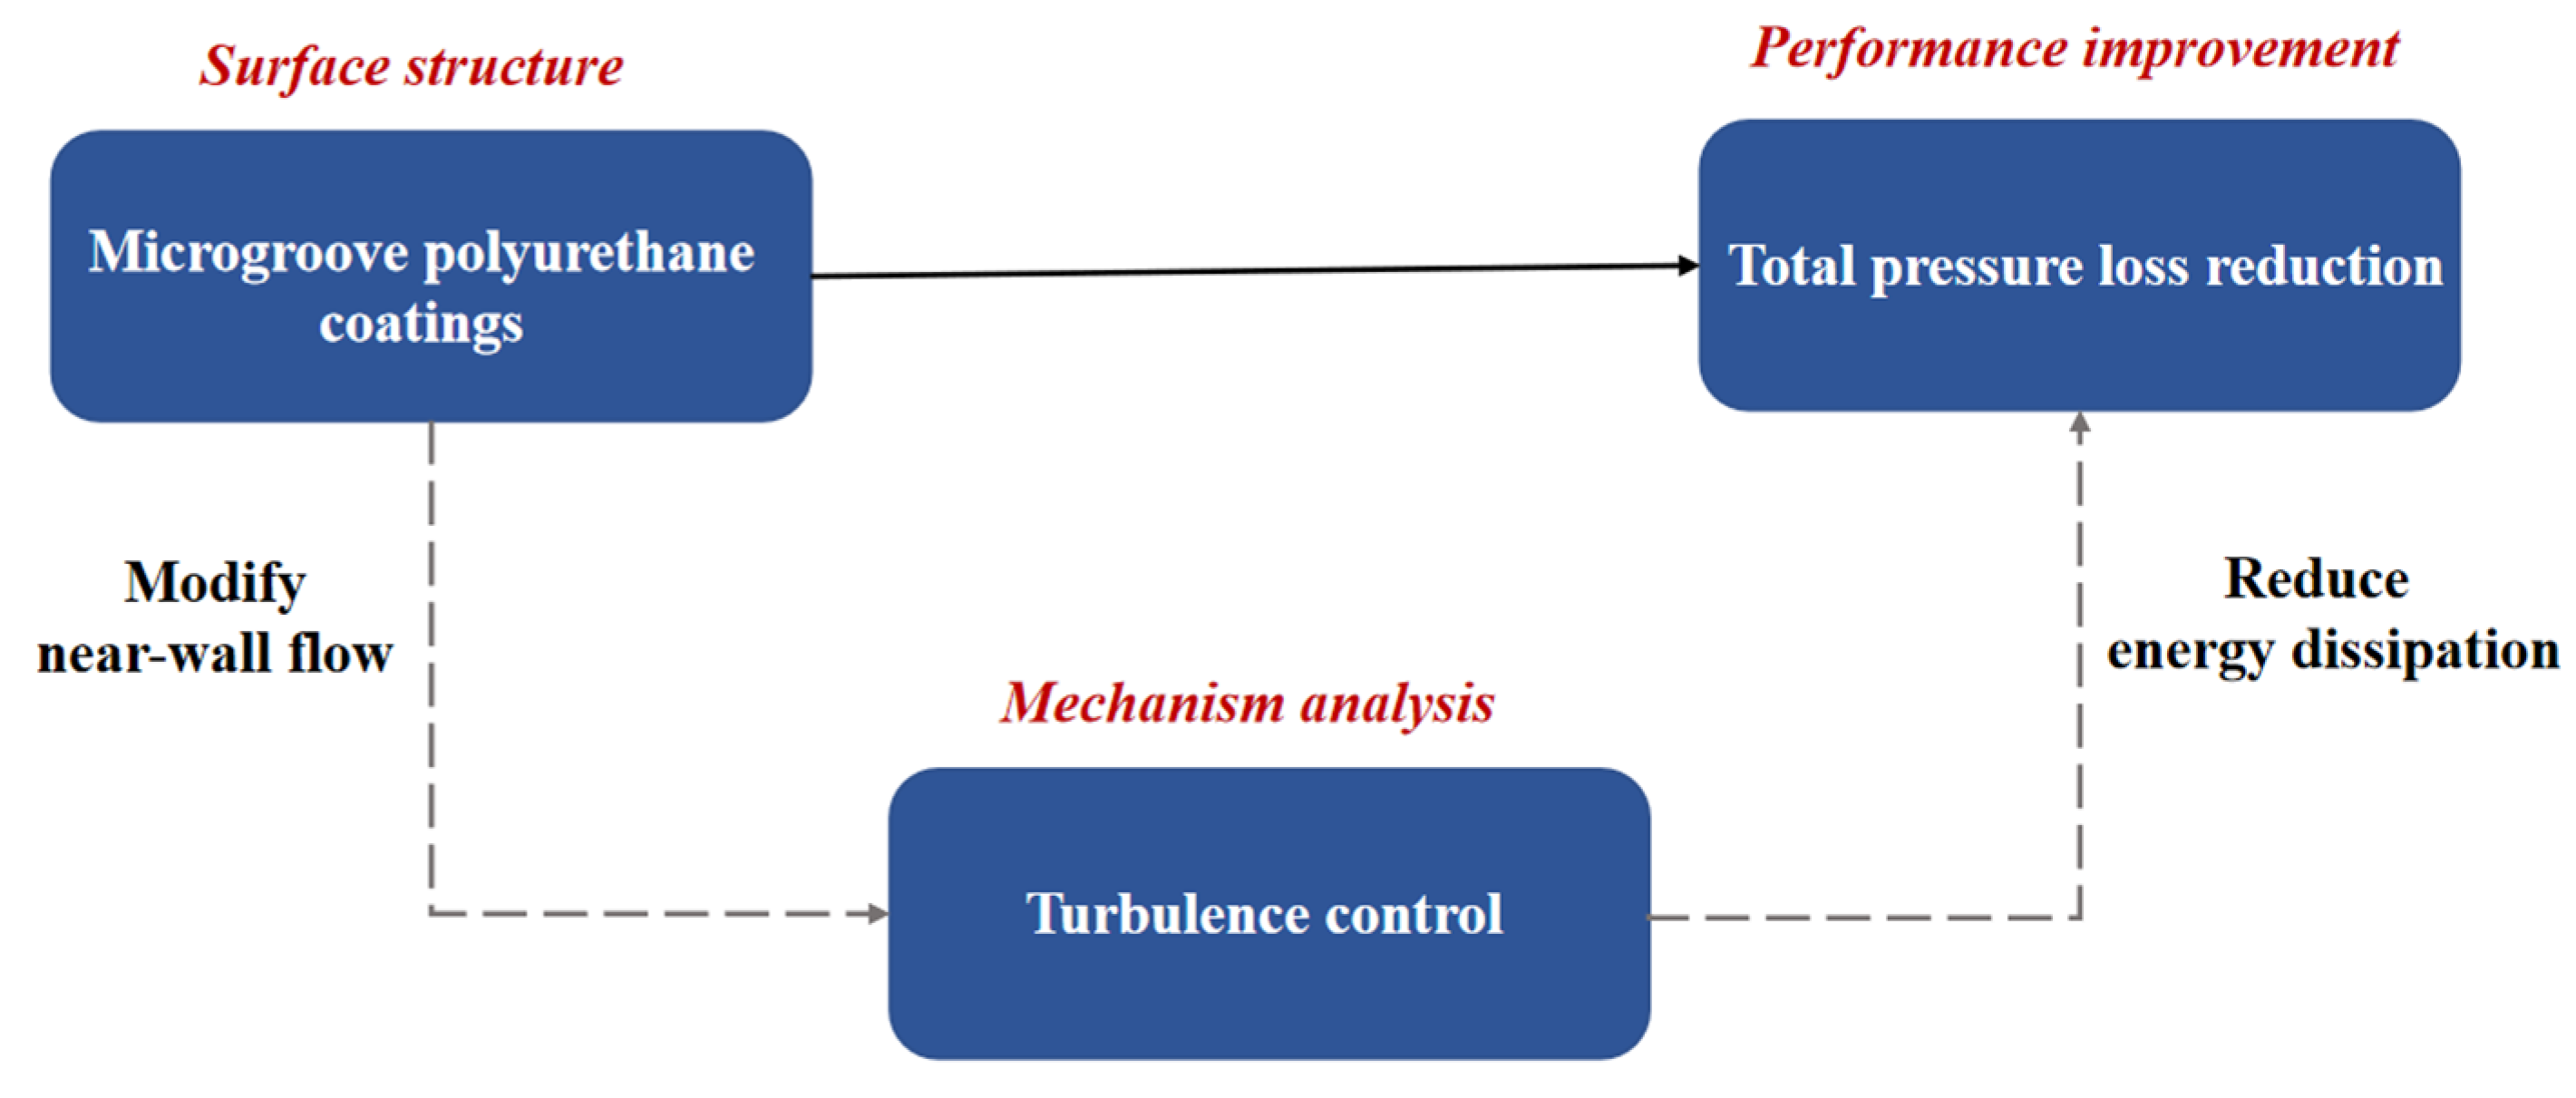
The research framework is shown in Figure 1. The aerodynamic performances of compressor cascade with microgroove polyurethane coatings are tested and the mechanism of performance improvement is discussed. The mechanism of drag reduction by micro-texture surface is widely considered to be turbulence control [39,40]. Since micro-texture surface has been shown to modify the near-wall turbulence [39,41], energy dissipation could be reduced by decreasing the turbulence intensity. As a result, flow loss in compressor cascade will decrease.

Figure 1.
The research framework.
This paper is organized as follows. In Section 2, the test section and preparation of microgroove polyurethane coatings are introduced. In Section 3, the experimental system in this study is presented. In Section 4, compressor cascade performances with hierarchical coatings are evaluated. In Section 5, the mechanism of flow loss control by micro- texture surface is briefly discussed. Finally, in Section 6, some conclusions are drawn according to the results and analysis.
2. Test Section
2.1. Description of Compressor Cascade
Figure 2 shows the side view of the compressor cascade test section. The planar cascade is a simplified configuration of a certain blade profile arranged in a straight line, which is often used to simulate the flow of blade and obtain the flow field characteristics of the blade. The test section has a cross-section of 105 mm in height and 260 mm in width. To ensure periodic conditions, an array of nine blades is chosen in the pitch-wise direction, and each blade is identical with 45 mm in chord length and 100 mm in spreading length. In order to measure the Mach number and the flow angle of the inflow, the blades are mounted on a rotatable disk, and a three-hole probe with a diameter of 1.5 mm is placed upstream [42]. The inlet flow angle is adjusted according to the monitoring value of the three-hole probe, and the inflow Mach number is adjusted by valve opening accommodations.
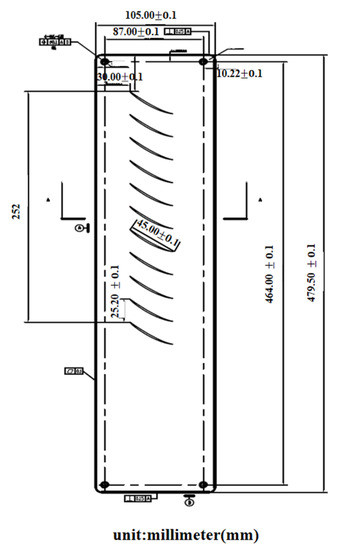
Figure 2.
Test section.
2.2. Microgroove Polyurethane Coating Preparation
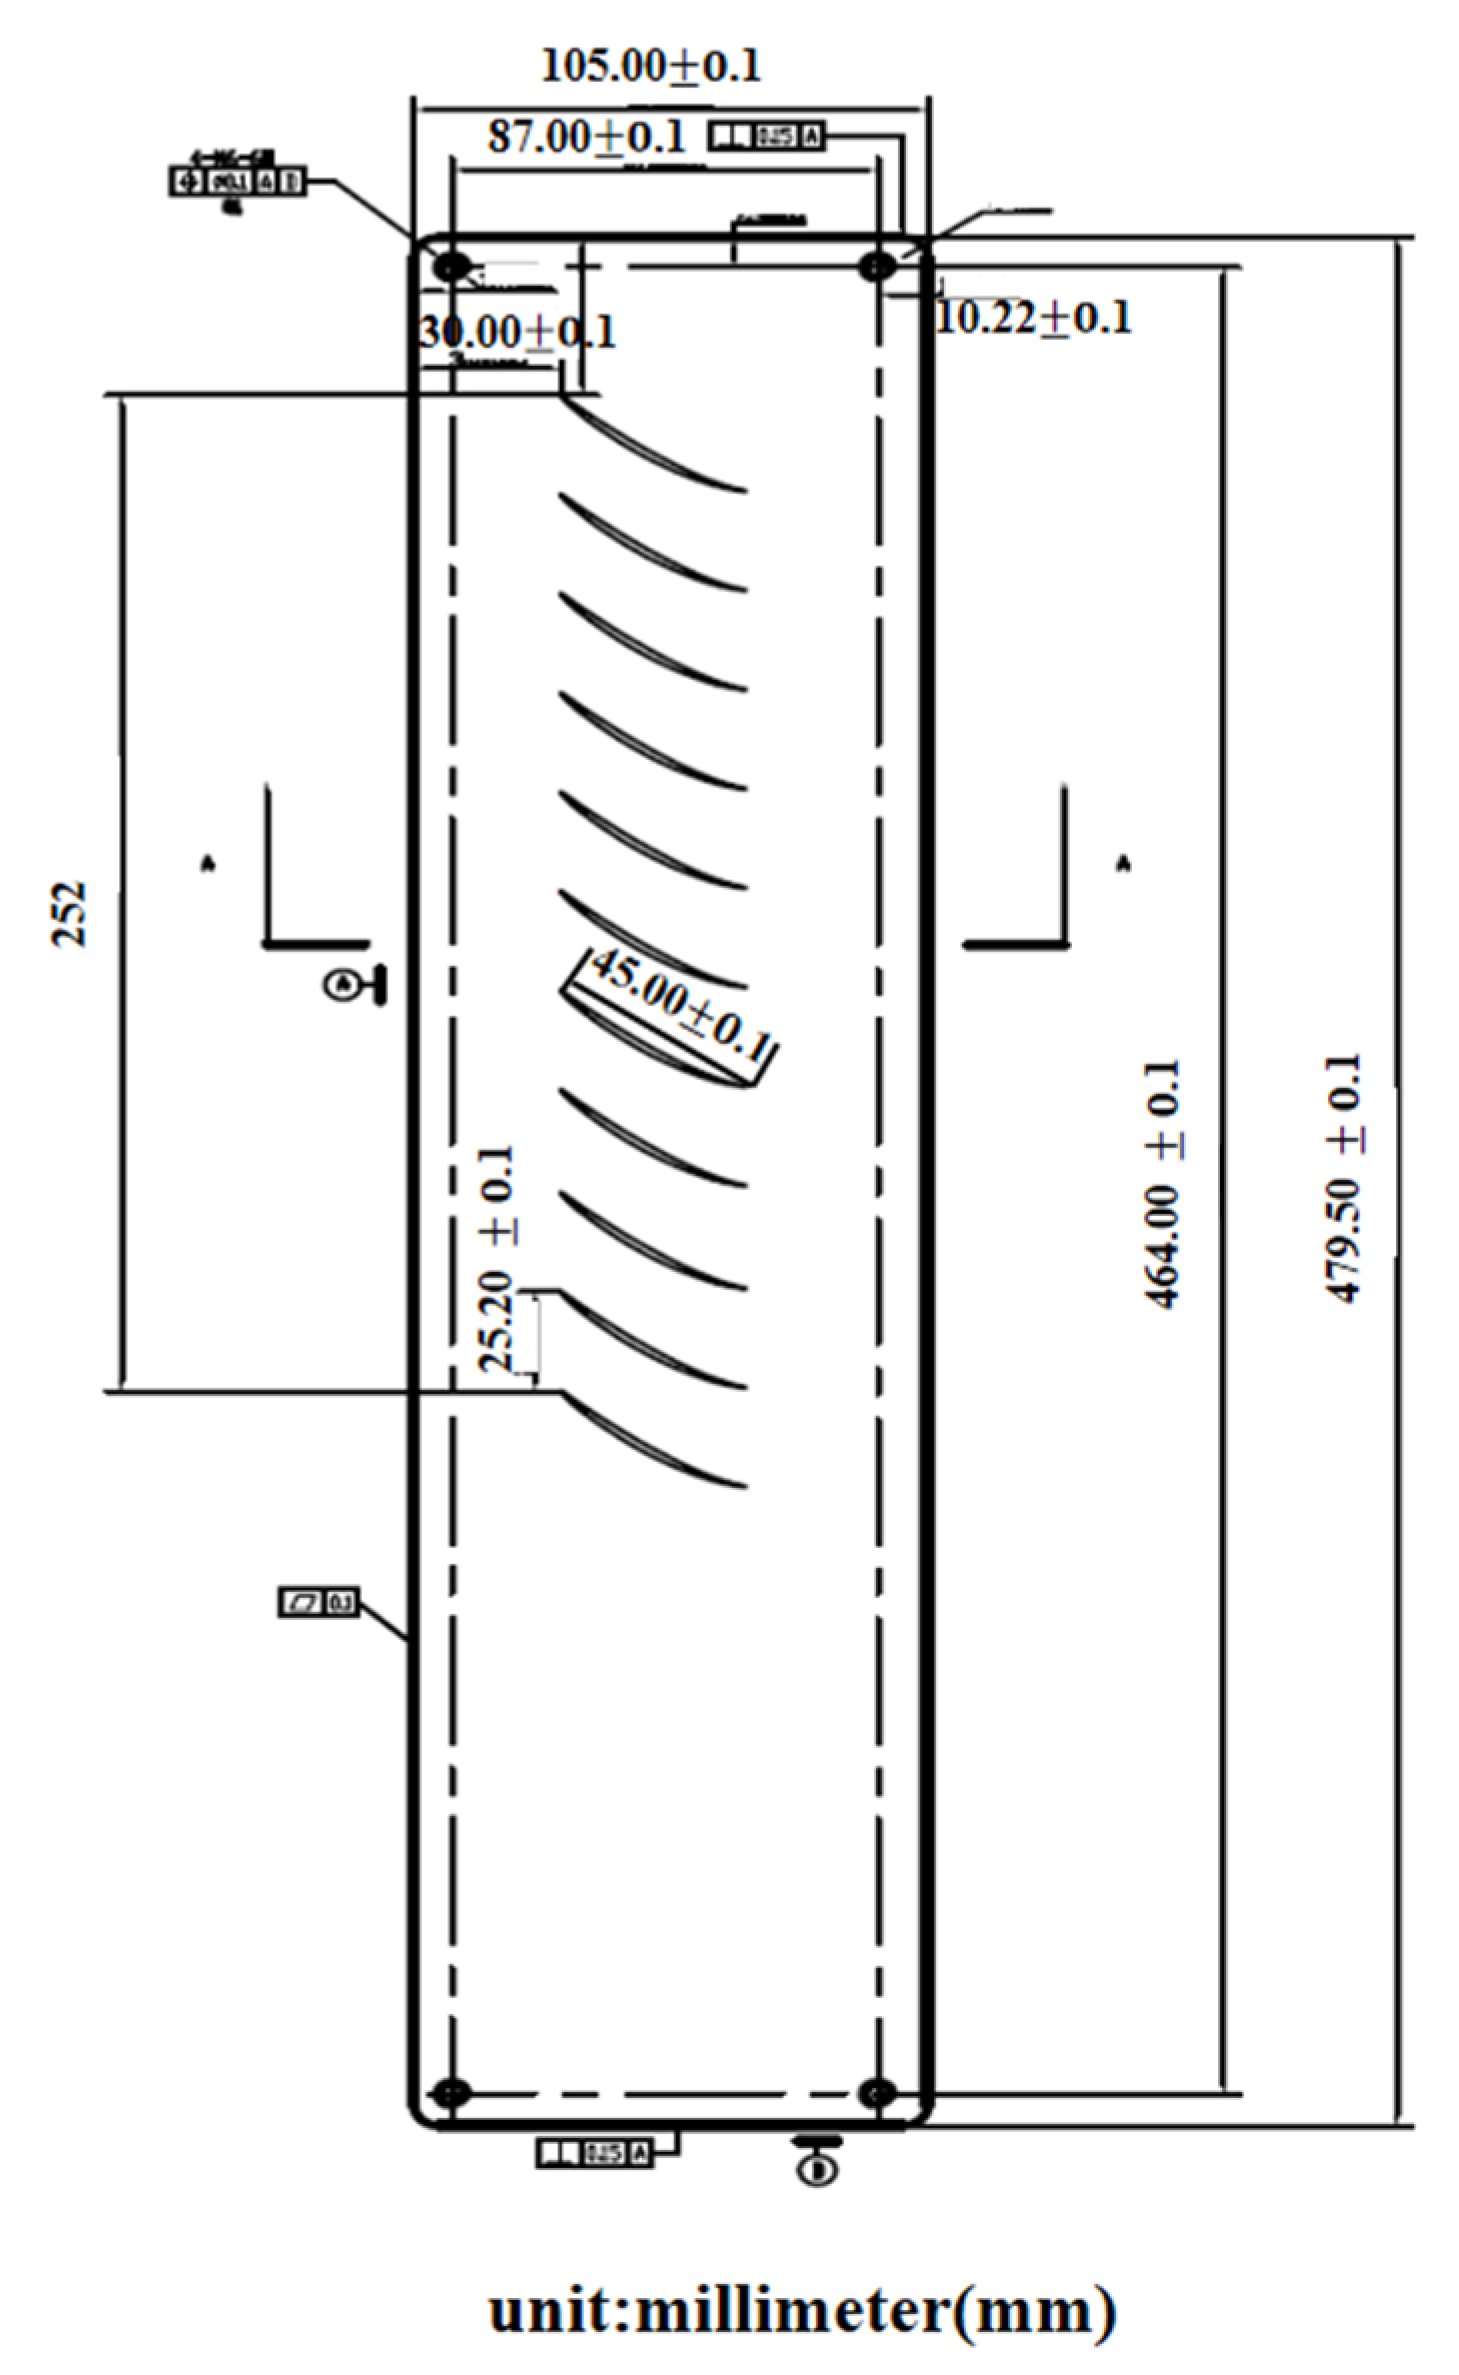
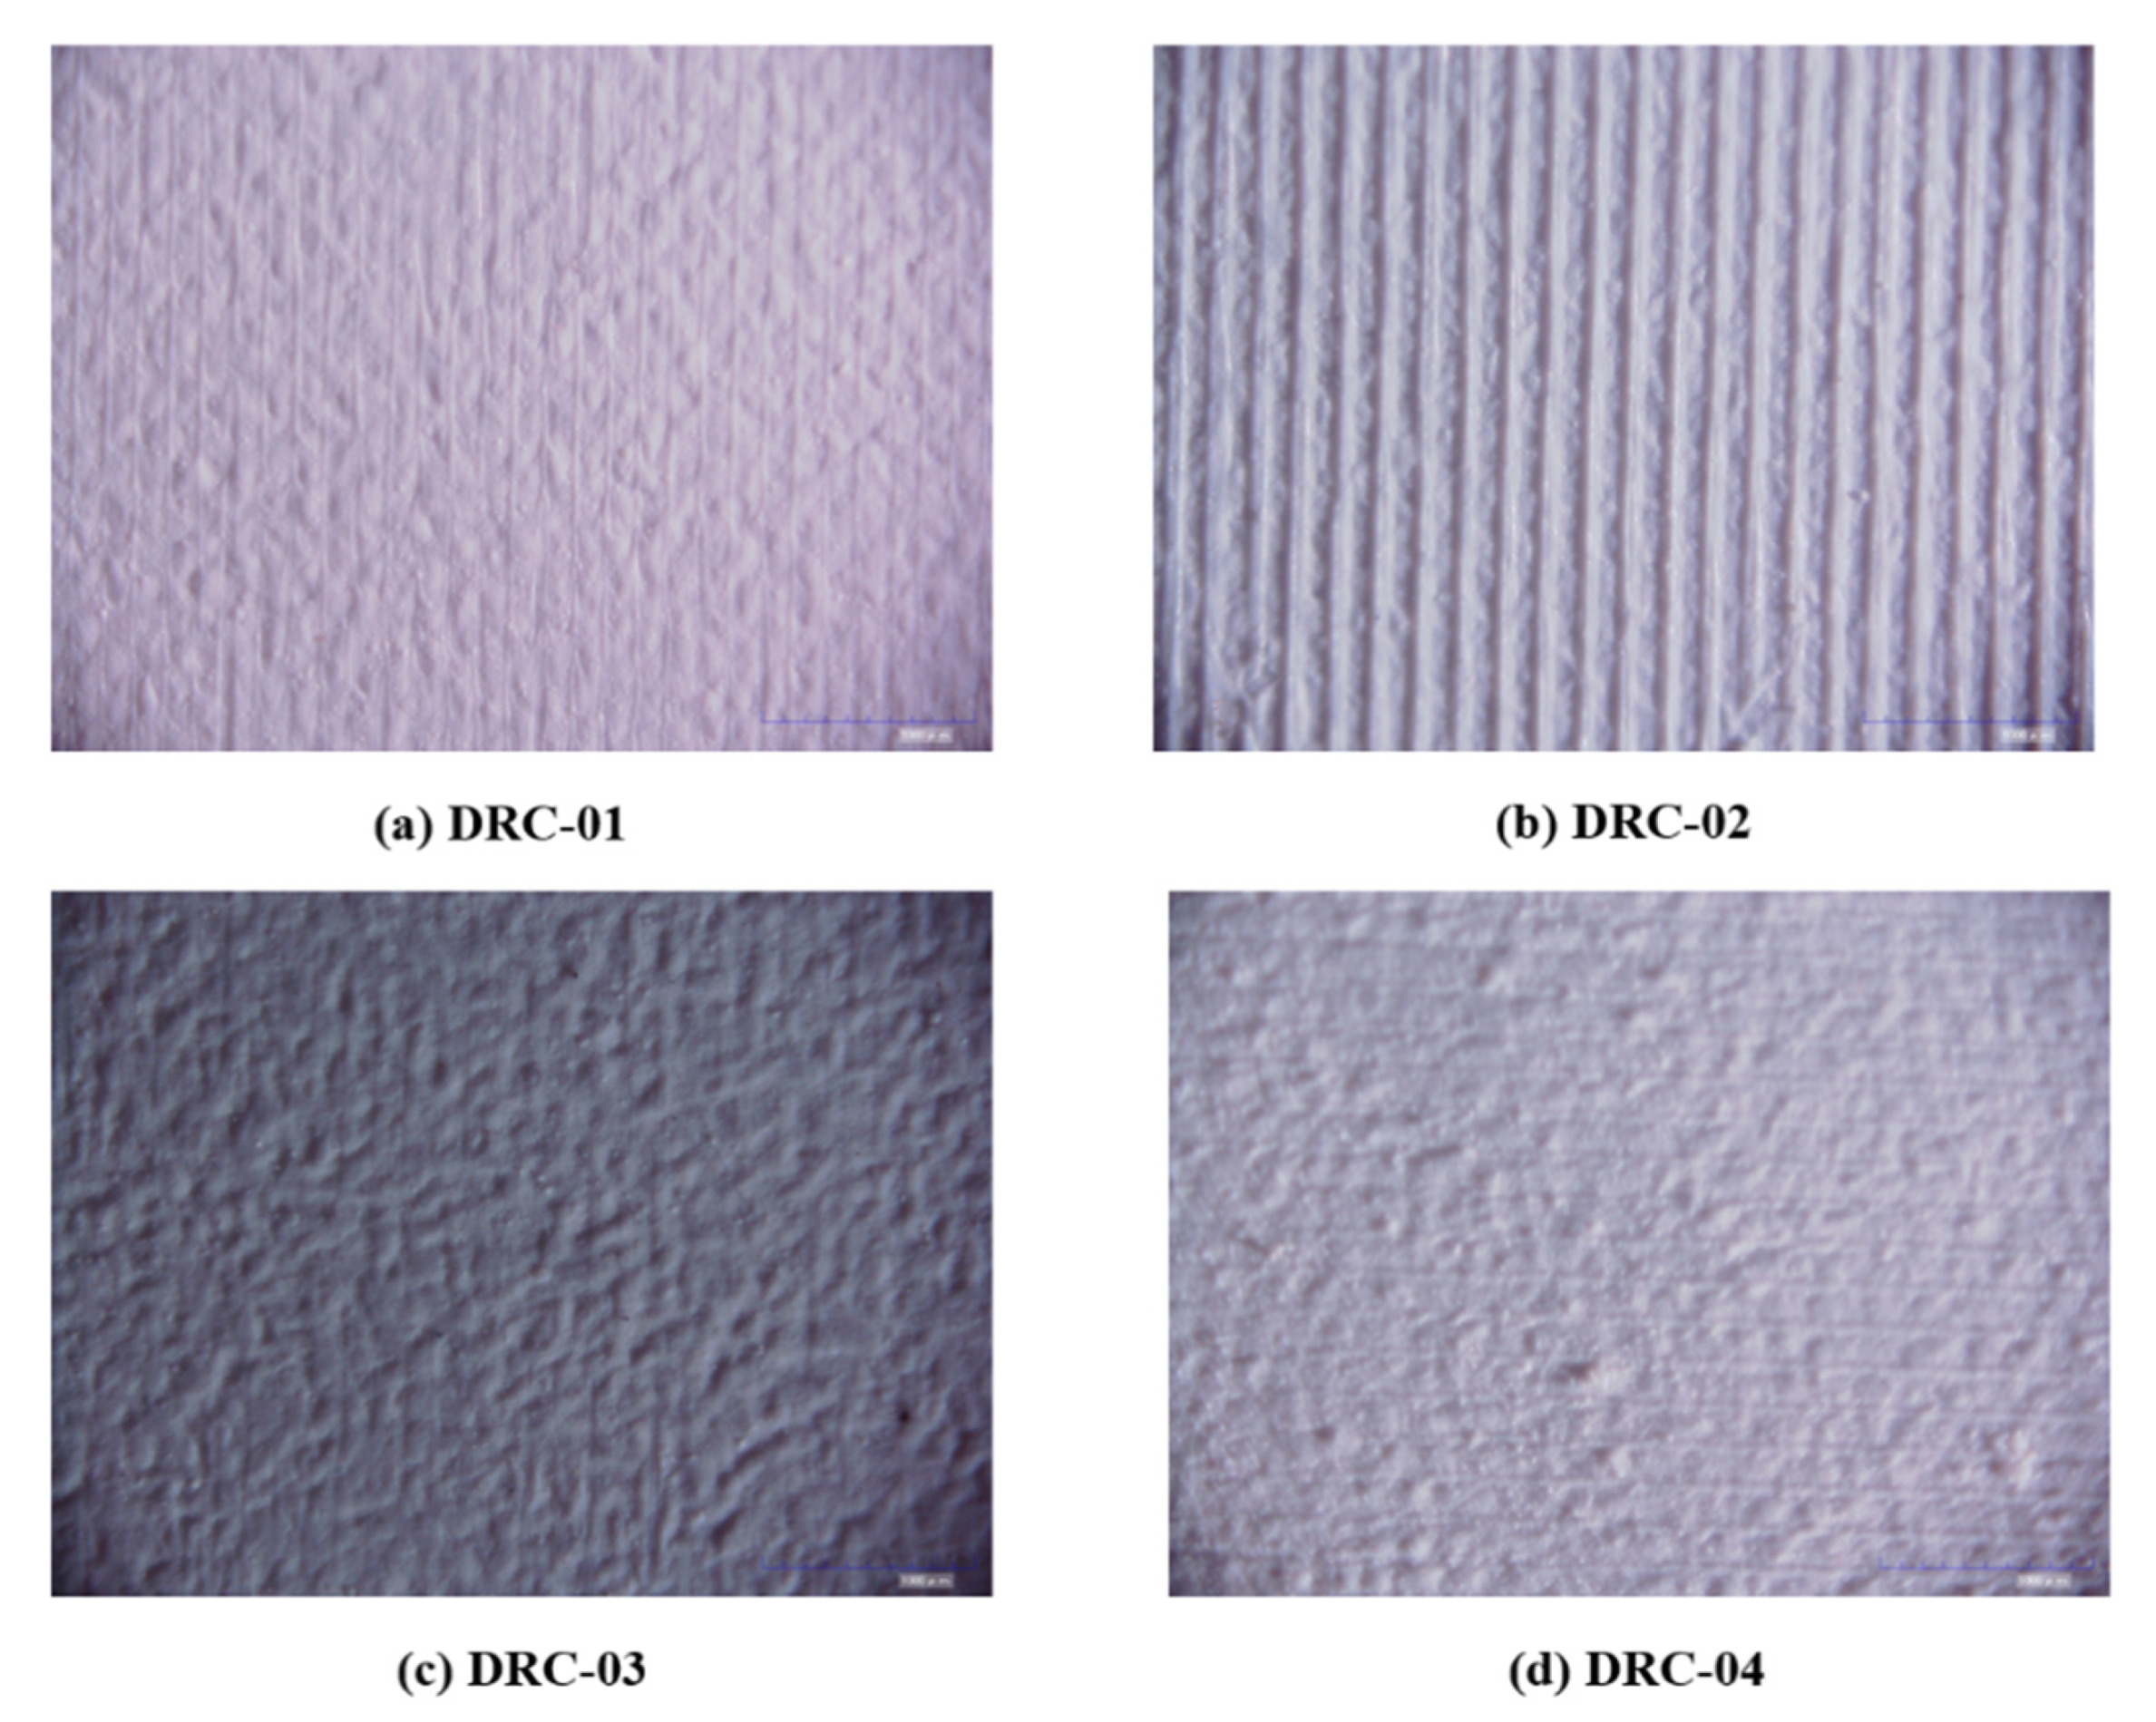
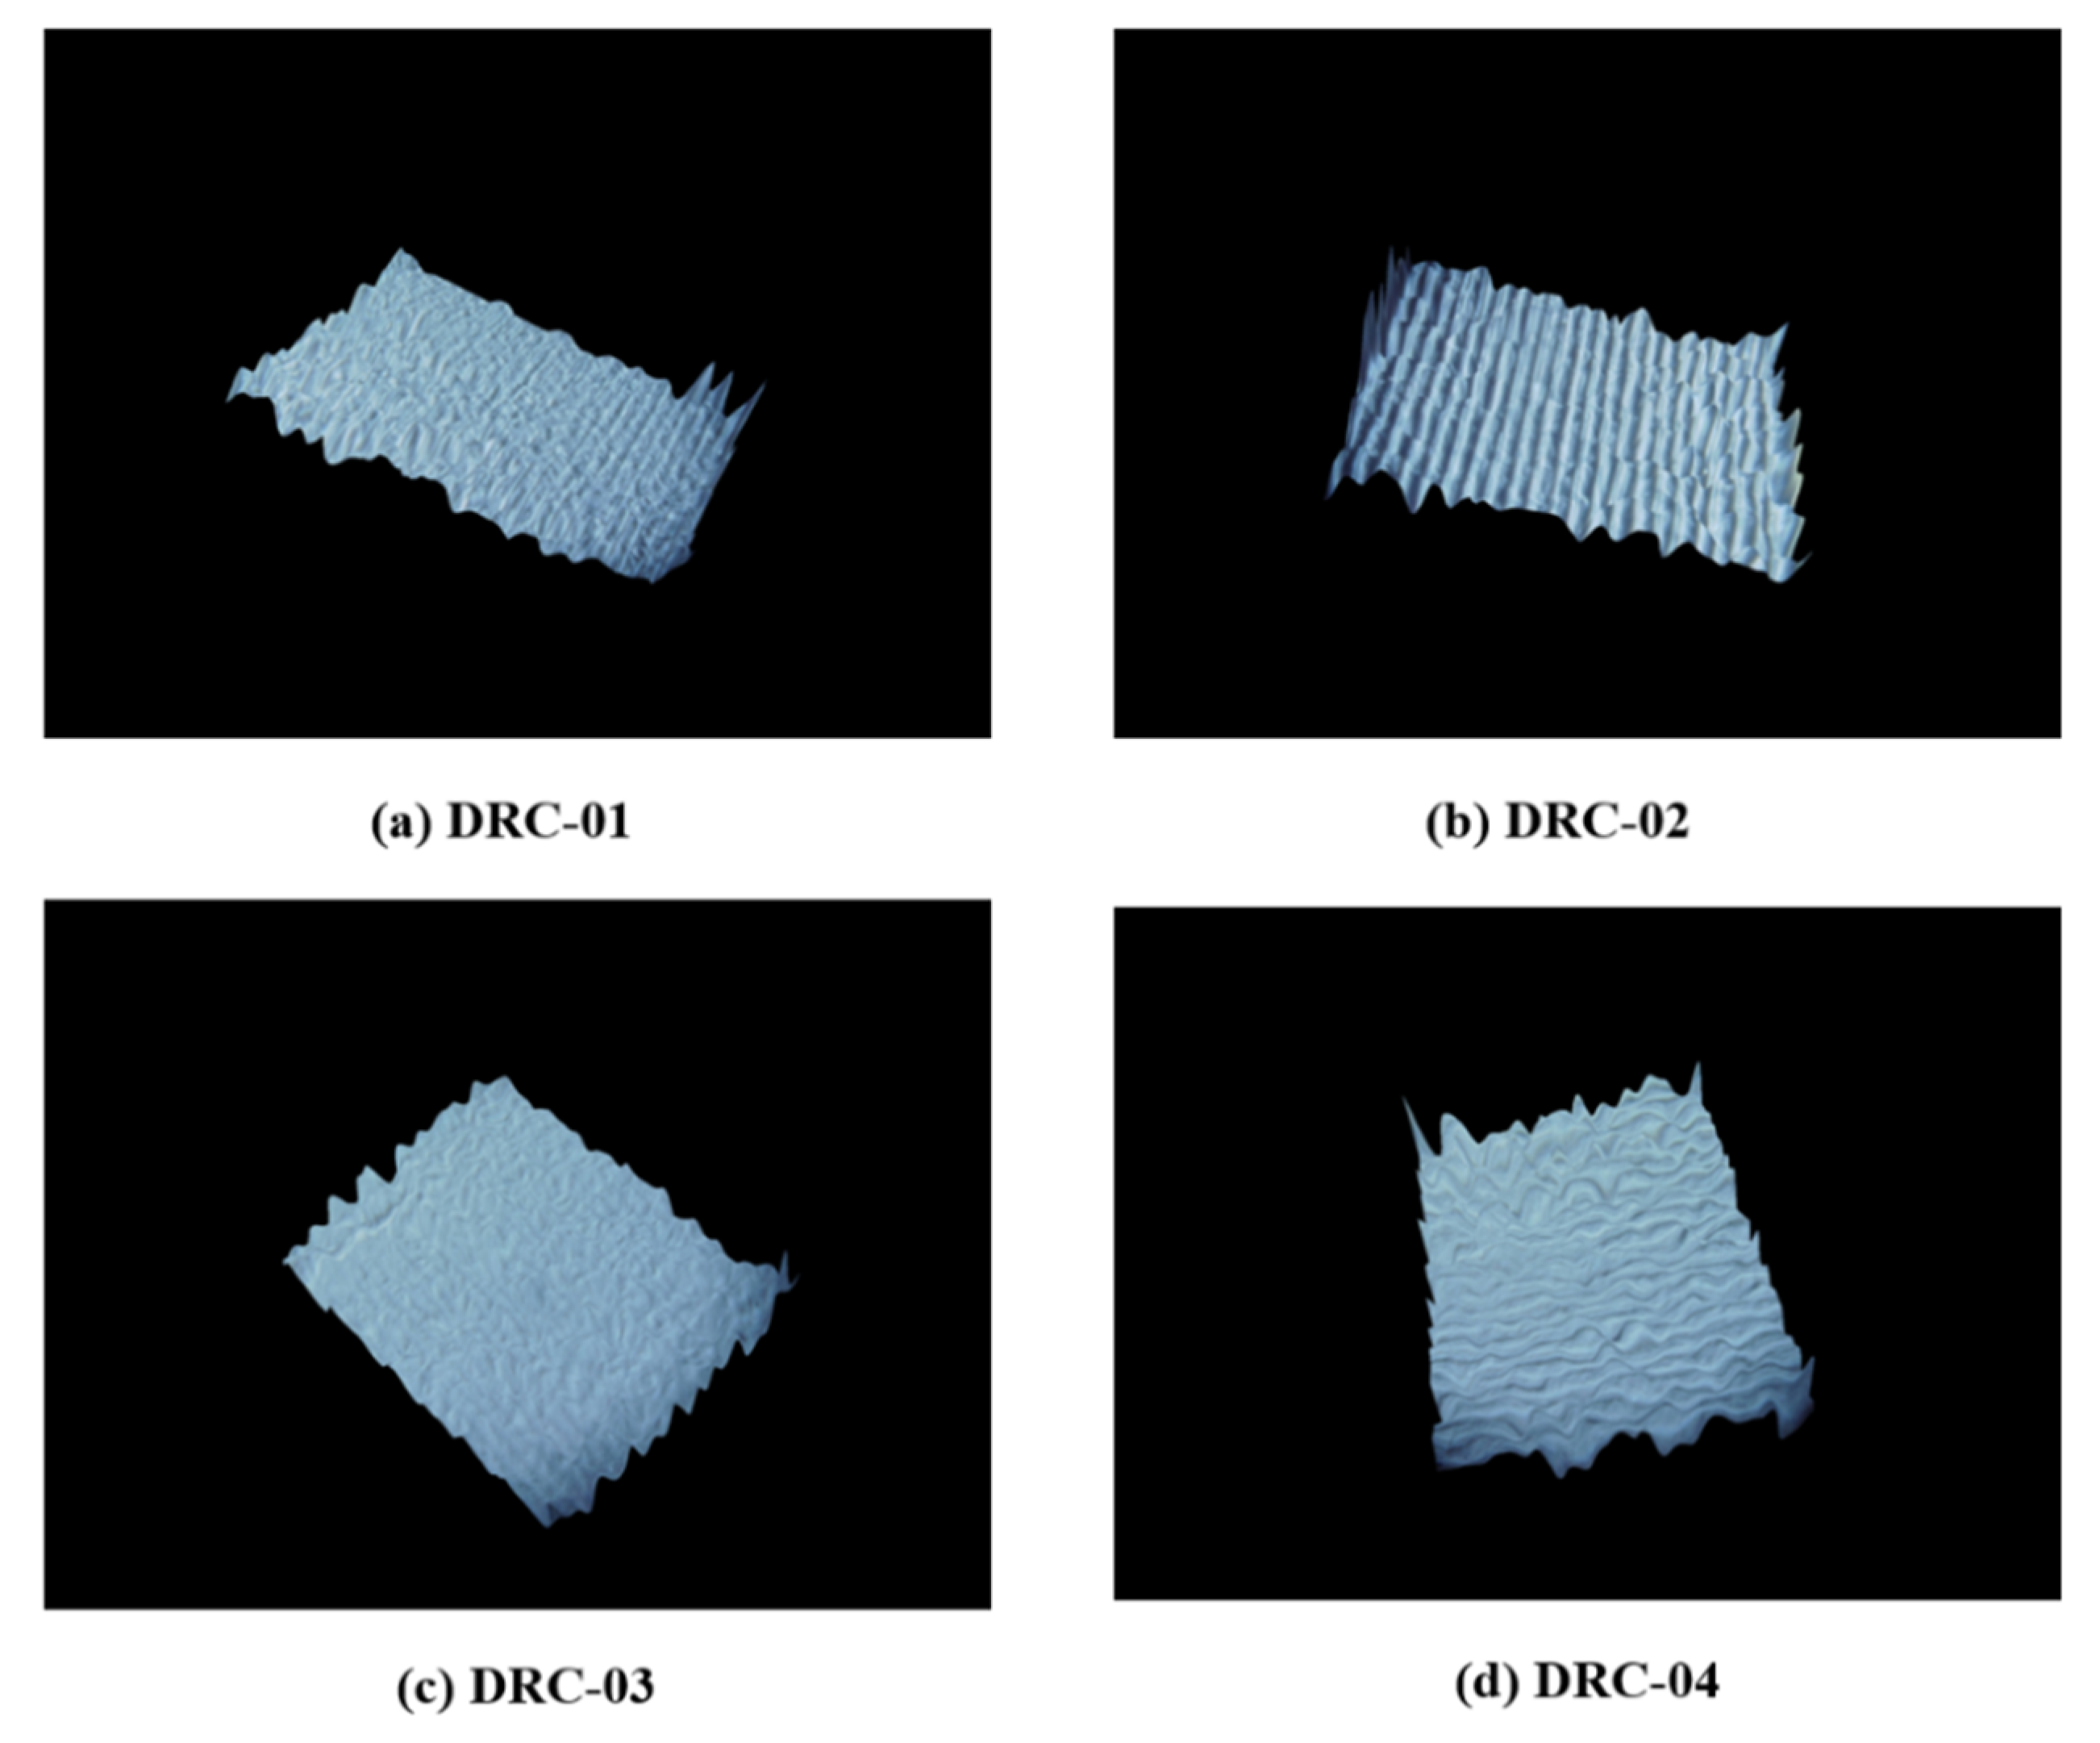
Fluorinated acrylate polymer particles (FANPPs) are selected as the polyacrylate nanospheres in this study and fabricated through an inexpensive and template-free emulsion polymerization process to control their morphologies [43]. The shells of FANPPS are synthesized on the basis of the PS-AA cores, which are firstly prepared by emulsion polymerization. Microgroove polyurethane coatings for this study can be obtained by adding the groove structure on the surface prepared by the suitable coat-ing process. Hydroxy acrylic resin is selected as the base resin. With isocyanate as the curing agent, a microgroove polyurethane coating can be obtained by mixing the hy-droxy acrylic resin with a certain amount of inorganic filler under the condition of high-speed shearing. The two-dimensional and three-dimensional structures of micro-groove polyurethane coatings are shown in Figure 3 and Figure 4.
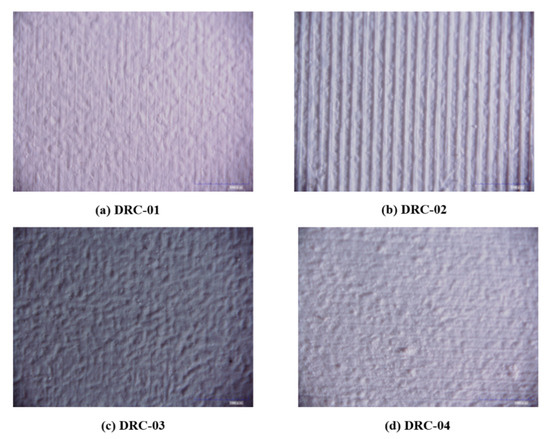
Figure 3.
Two-dimensional structure of microgroove polyurethane coatings.
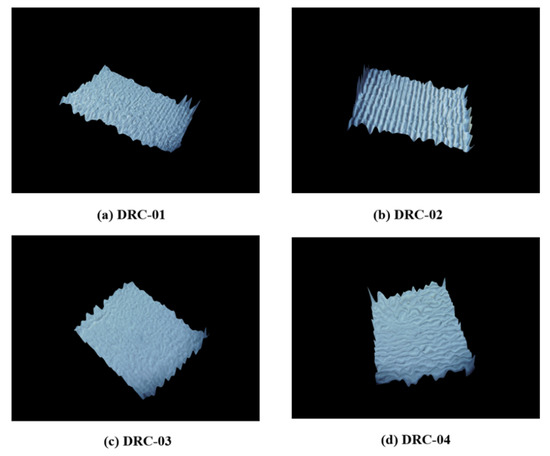
Figure 4.
Three-dimensional structure of microgroove polyurethane coatings.
The groove structures of a series of samples are listed in Table 1. Among the four samples, DRC-01 and DRC-02 are microgroove polyurethane coatings with single-direction groove structures and strawberry-like nanospheres. The groove scale in DRC-01 and DRC-02 is 50 and 80 μm, respectively. DRC-03 and DRC-04 are microgroove polyurethane coatings with multi-direction groove structures and strawberry-like nanospheres. The groove scale in DRC-03 and DRC-04 is also 50 and 80 μm, respectively.

Table 1.
The microgroove polyurethane coating structure of four samples.
After the microgroove polyurethane coatings have been prepared, the coatings are attached to the surface of the cascade. A roller is used as an auxiliary tool to ensure that the surface structure is not touched and no air bubbles are generated in the coating adhesion process. The test section of compressor cascade with microgroove polyurethane coatings is shown in Figure 5.
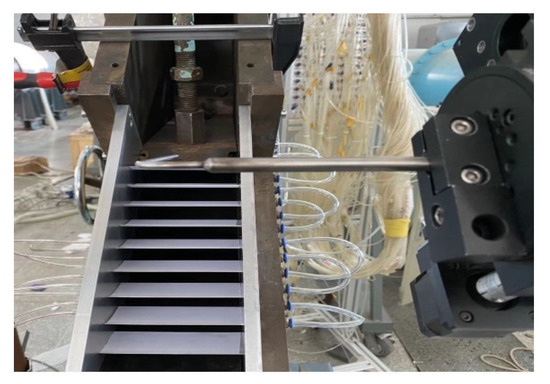
Figure 5.
Test section with microgroove polyurethane coatings.
3. Experimental System
3.1. Test Apparatus
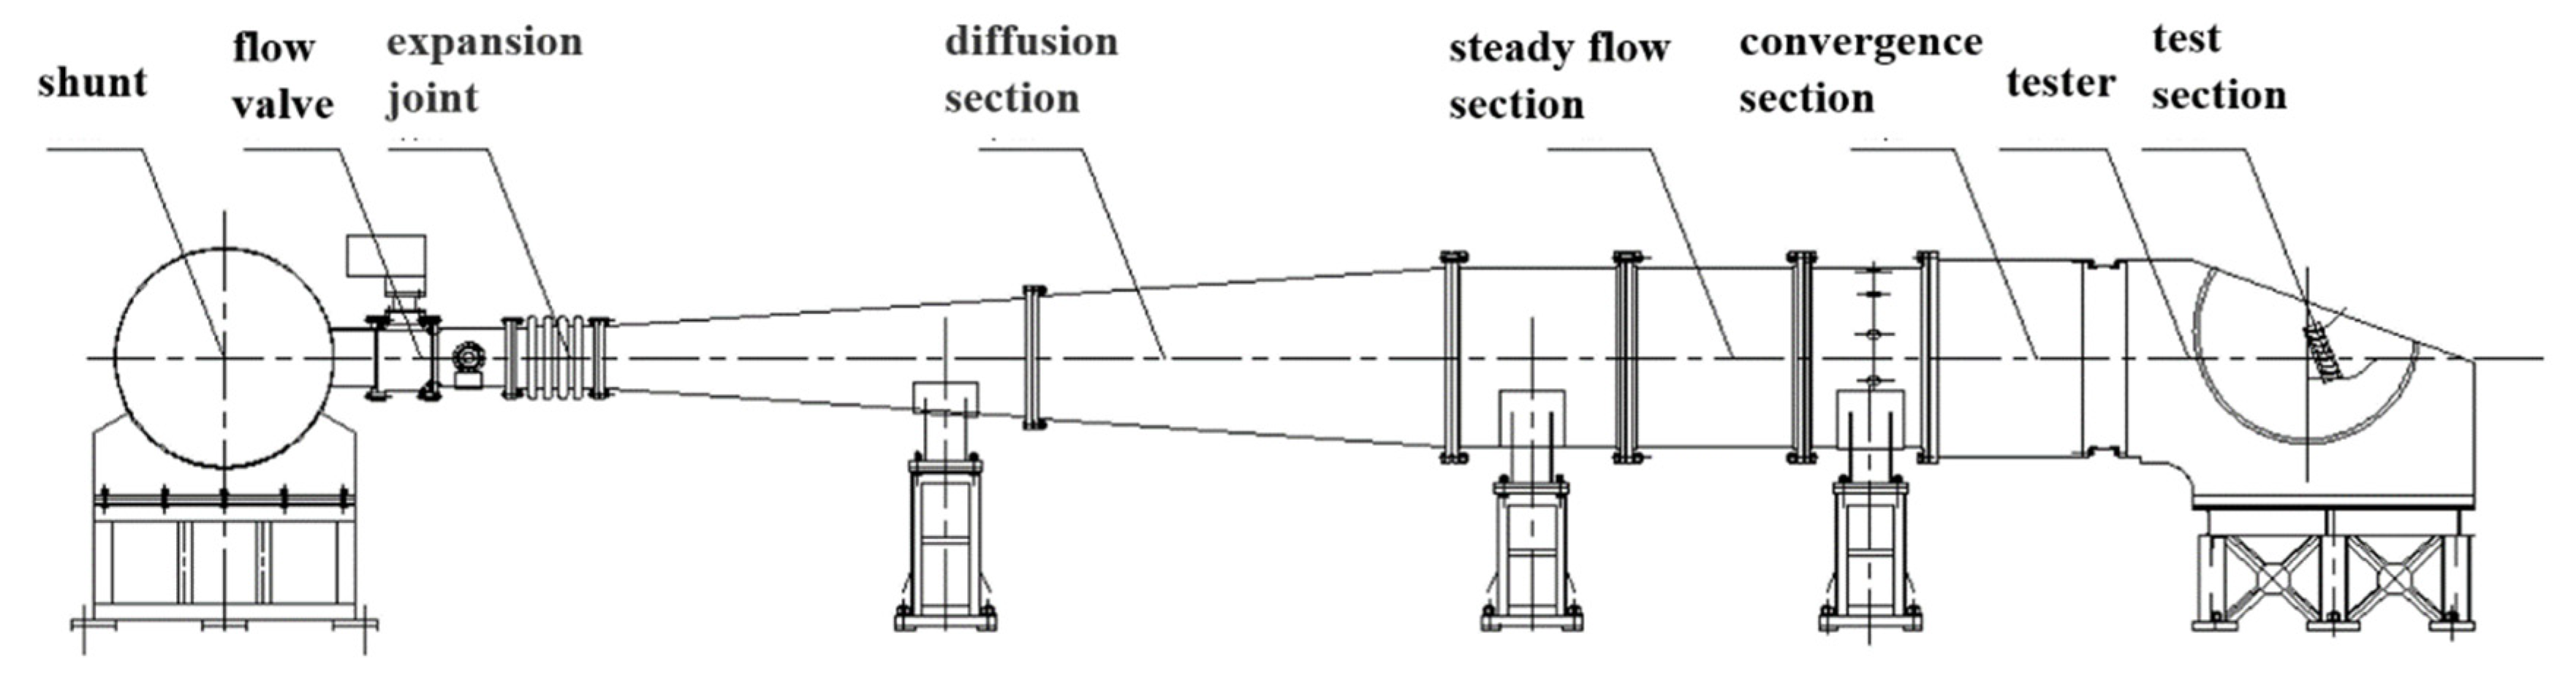
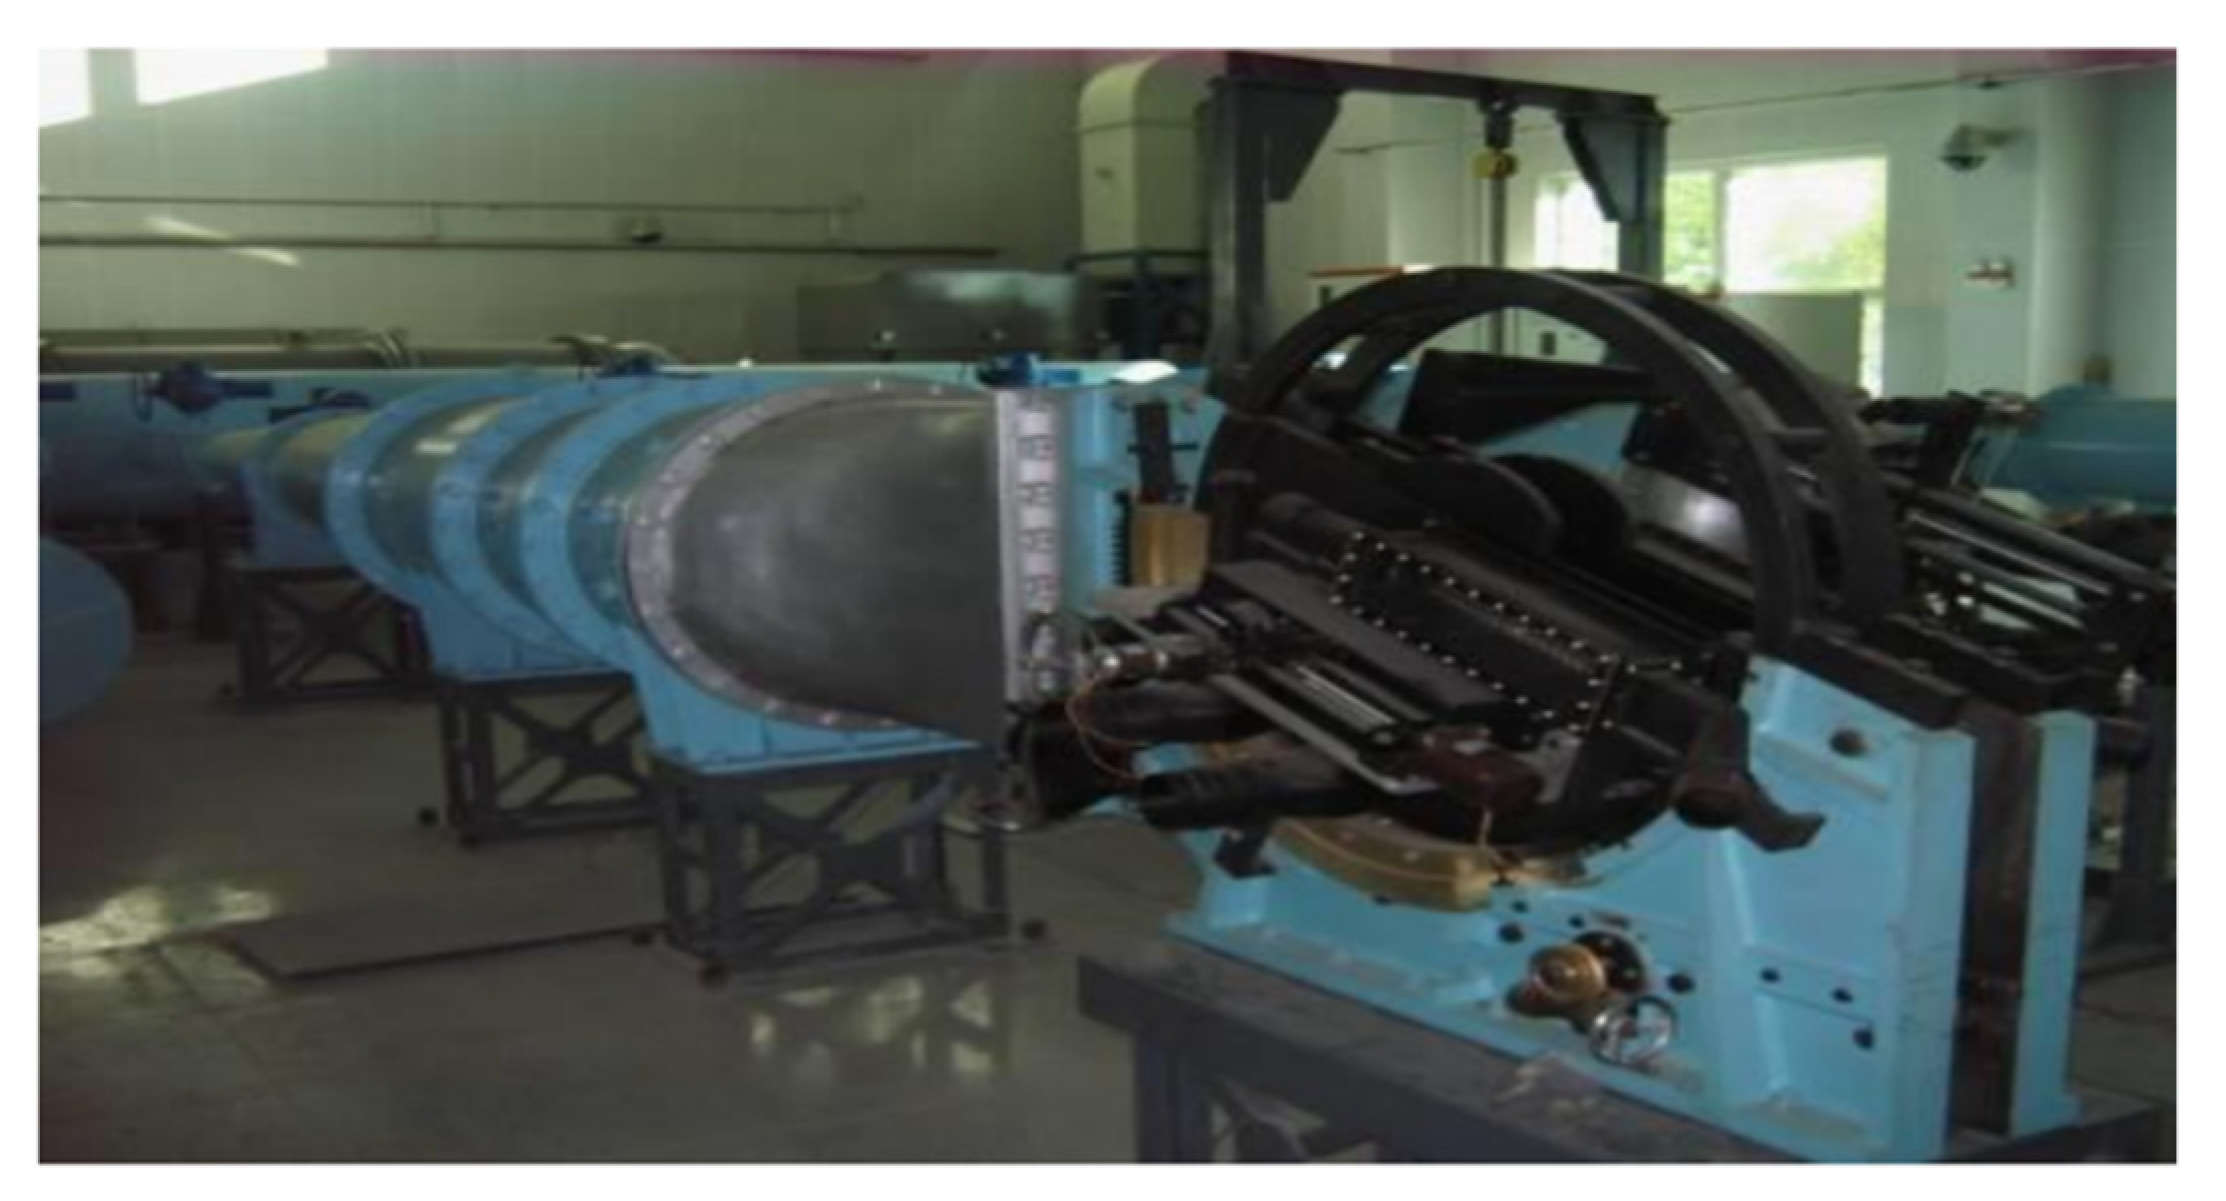
In order to evaluate the aerodynamic performance of compressor blades with microgroove polyurethane coatings at transonic speeds, the experiments are carried out in a high-speed linear compressor cascade wind tunnel in Dalian Maritime University. Figure 6 shows the schematic diagram of the test system in this study, and Figure 7 shows the physical image. The wind tunnel is a continuous normal temperature open-jet wind tunnel, which consists of five parts: air inlet section, diffusion section, steady flow section, convergence section and the test section. The compressed flow generated by the high-pressure blower enters the splitter after water cooling and then enters the wind tunnel. The turbulence intensity in the test section of the wind tunnel is approximately 2%. The effective wind tunnel area is 100 × 250 (mm2).
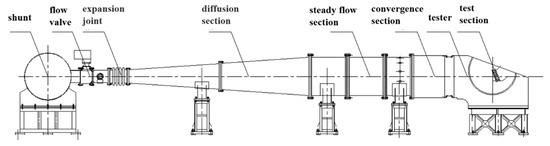
Figure 6.
Schematic diagram of test system.

Figure 7.
Physical image of test system.
3.2. Test Procedure and Conditions
Wake measurements of the compressor cascade [44] with microgroove polyurethane coatings are conducted, which focuses on the total pressure loss to evaluate drag performance. Measurements are made by a calibrated five-hole probe in the wake and separation regions, which is better for capturing the loss under different inlet flow angles. The five-hole probe could be moved by a stepping motor. A digital pressure scanning valve system DSA3217 is used for pressure acquisition, and the detected pressure signals are automatically recorded by a PC with dedicated software. The movement of the probe is controlled by a given program through control of the traverse mechanism. The data obtained are the gauge pressure. The corresponding atmosphere pressure and temperature are also recorded and sampled simultaneously for each acquisition. The scanning valve system acquires data at a rate of 5 frames per second, samples each point for 20 frames and outputs the average value. The probe has a diameter of 2 mm and occupies less than 0.05% of the total outflow area. Extensive measurements are made along with the pitch and spread area by the transverse side of the probe to thoroughly measure the entire passage.
The arrangements of measurement points are as follows. In the inlet, measurement points of total pressure are placed in the pressure box. The number of measurement points of static pressure is 9, located at 0.4–1-fold chord length from the front edge of the blade. The total and static pressures measured are used to calculate the inlet flow Mach number and provide reference for calculating cascade outlet loss. In the outlet, the probe is set at 50% of the blade height, 15 mm from the trailing edge. The number of measurement points is 40 in total and the point interval is 0.7 mm. The total pressure, static pressure, velocity, and outlet flow angle are obtained through the interpolation calculation at the measurement points. In this study, the inlet flow angle is 41.3°, and the Mach number is 0.89.
3.3. Data Reduction
The inlet flow Mach number M1 is defined as:
where k is isentropic index, i is measurement point and n is the total number of measurement points. is the inlet total pressure and P1 is the inlet static pressure.
The total pressure loss coefficient is a key parameter to measure the efficiency of the compressor cascade [45]. The local total pressure loss coefficient γi is defined as:
where is the outlet total pressure. In the curve of local total pressure loss coefficient γi, the maximum value is defined as γmax. The width of the wake region yw can be defined as the width of a region where the measurement point γi is larger than 0.3 γmax. The area-averaged total pressure loss coefficient γ is defined as:
The percentage of loss reduction can be calculated as:
where γb is the area-averaged total pressure loss coefficient in the Blank case, γs is the area-averaged total pressure loss coefficient in other cases. The flow turning angle φ indicates the capacity of blades for guiding the flow in a predetermined flow path [35], which is defined as follows:
where αin is the flow angle of the inlet and αout is the flow angle of the outlet.
3.4. Analysis of Experimental Error
The total pressure loss coefficient γ is a key performance parameter in the compressor cascade test. By deriving the total pressure loss coefficient γ, the error equation can be obtained as follows:
Considering the cumulative effect of errors:
The measuring error of the inlet total pressure probe is less than 0.1%, the measuring error of the atmospheric pressure sensor is 0.05%, and the measuring error of the pressure scanning valve is 0.05%. Considering the interpolation error of non-directional measurement at the outlet, the interpolation error is tested experimentally less than 0.2%. The inlet total pressure error and outlet total pressure error are as follows:
4. Results
4.1. Total Pressure Loss
To ensure the quality of the measurements, boundary layer tests and flow periodicity tests in the outlet of the transonic linear cascade are conducted. The measurement location for the aerodynamic parameters in the outlet is chosen at 50% of the cascade height. The results show that the measurement location is far away from the boundary layer region and meets the test requirements regarding the uniformity of the flow field. Moreover, the periodicity of different flow channels is apparent. The wake measurement range is longer than the cascade pitch length and contains the entire single-channel flow field to meet the test requirements. By adjusting the inlet total pressure and the inlet static pressure P1 at the inlet measurement points, the inlet flow Mach number M1 of 0.89 is obtained.
The pitch-wise distributions of local total pressure loss coefficient γi with different coatings in the surface are shown in Figure 8. Five kinds of cascades with different coatings—Blank, DRC-01, DRC-02, DRC-03 and DRC-04—are tested. Blank is the coating with the same thickness without any structure. The results indicate microgroove polyurethane coatings have a significant effect on the total pressure loss of the compressor cascade, and different variations in the loss coefficient curves appear in the compressor cascade with different surface structures. Compared with Blank, the maximum value γmax of local total pressure loss γi and the positions where the maximum value appears shift for cascade with different microgroove polyurethane coatings. The results show that the width of the wake region yw also changes.
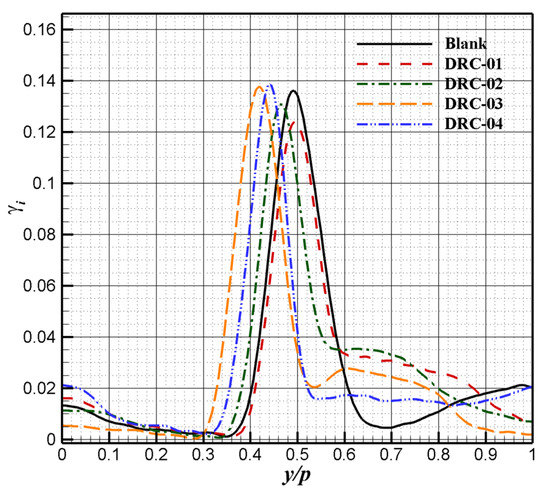
Figure 8.
The pitch-wise distributions of total pressure loss coefficient with different coatings.
The area-averaged total pressure loss coefficient γ and the percentage of loss reduction of cascade with five different coatings are shown in Table 2. DRC-01 with single-direction grooves and DRC-04 with multi-direction grooves reduce the area-averaged total pressure loss coefficient by more than 5% compared with that of the Blank case. The results show that microgroove polyurethane coatings with single-direction grooves and multi-direction grooves both have the capability to reduce the total pressure loss coefficient of the compressor cascade. For DRC-02 and DRC-03, the improvement in aerodynamic performance is not satisfactory, which indicates that the groove arrangement and size greatly influence the positive effect of microgroove polyurethane coatings.
Table 2.
The area-averaged total pressure loss coefficient and percentage of loss reduction.
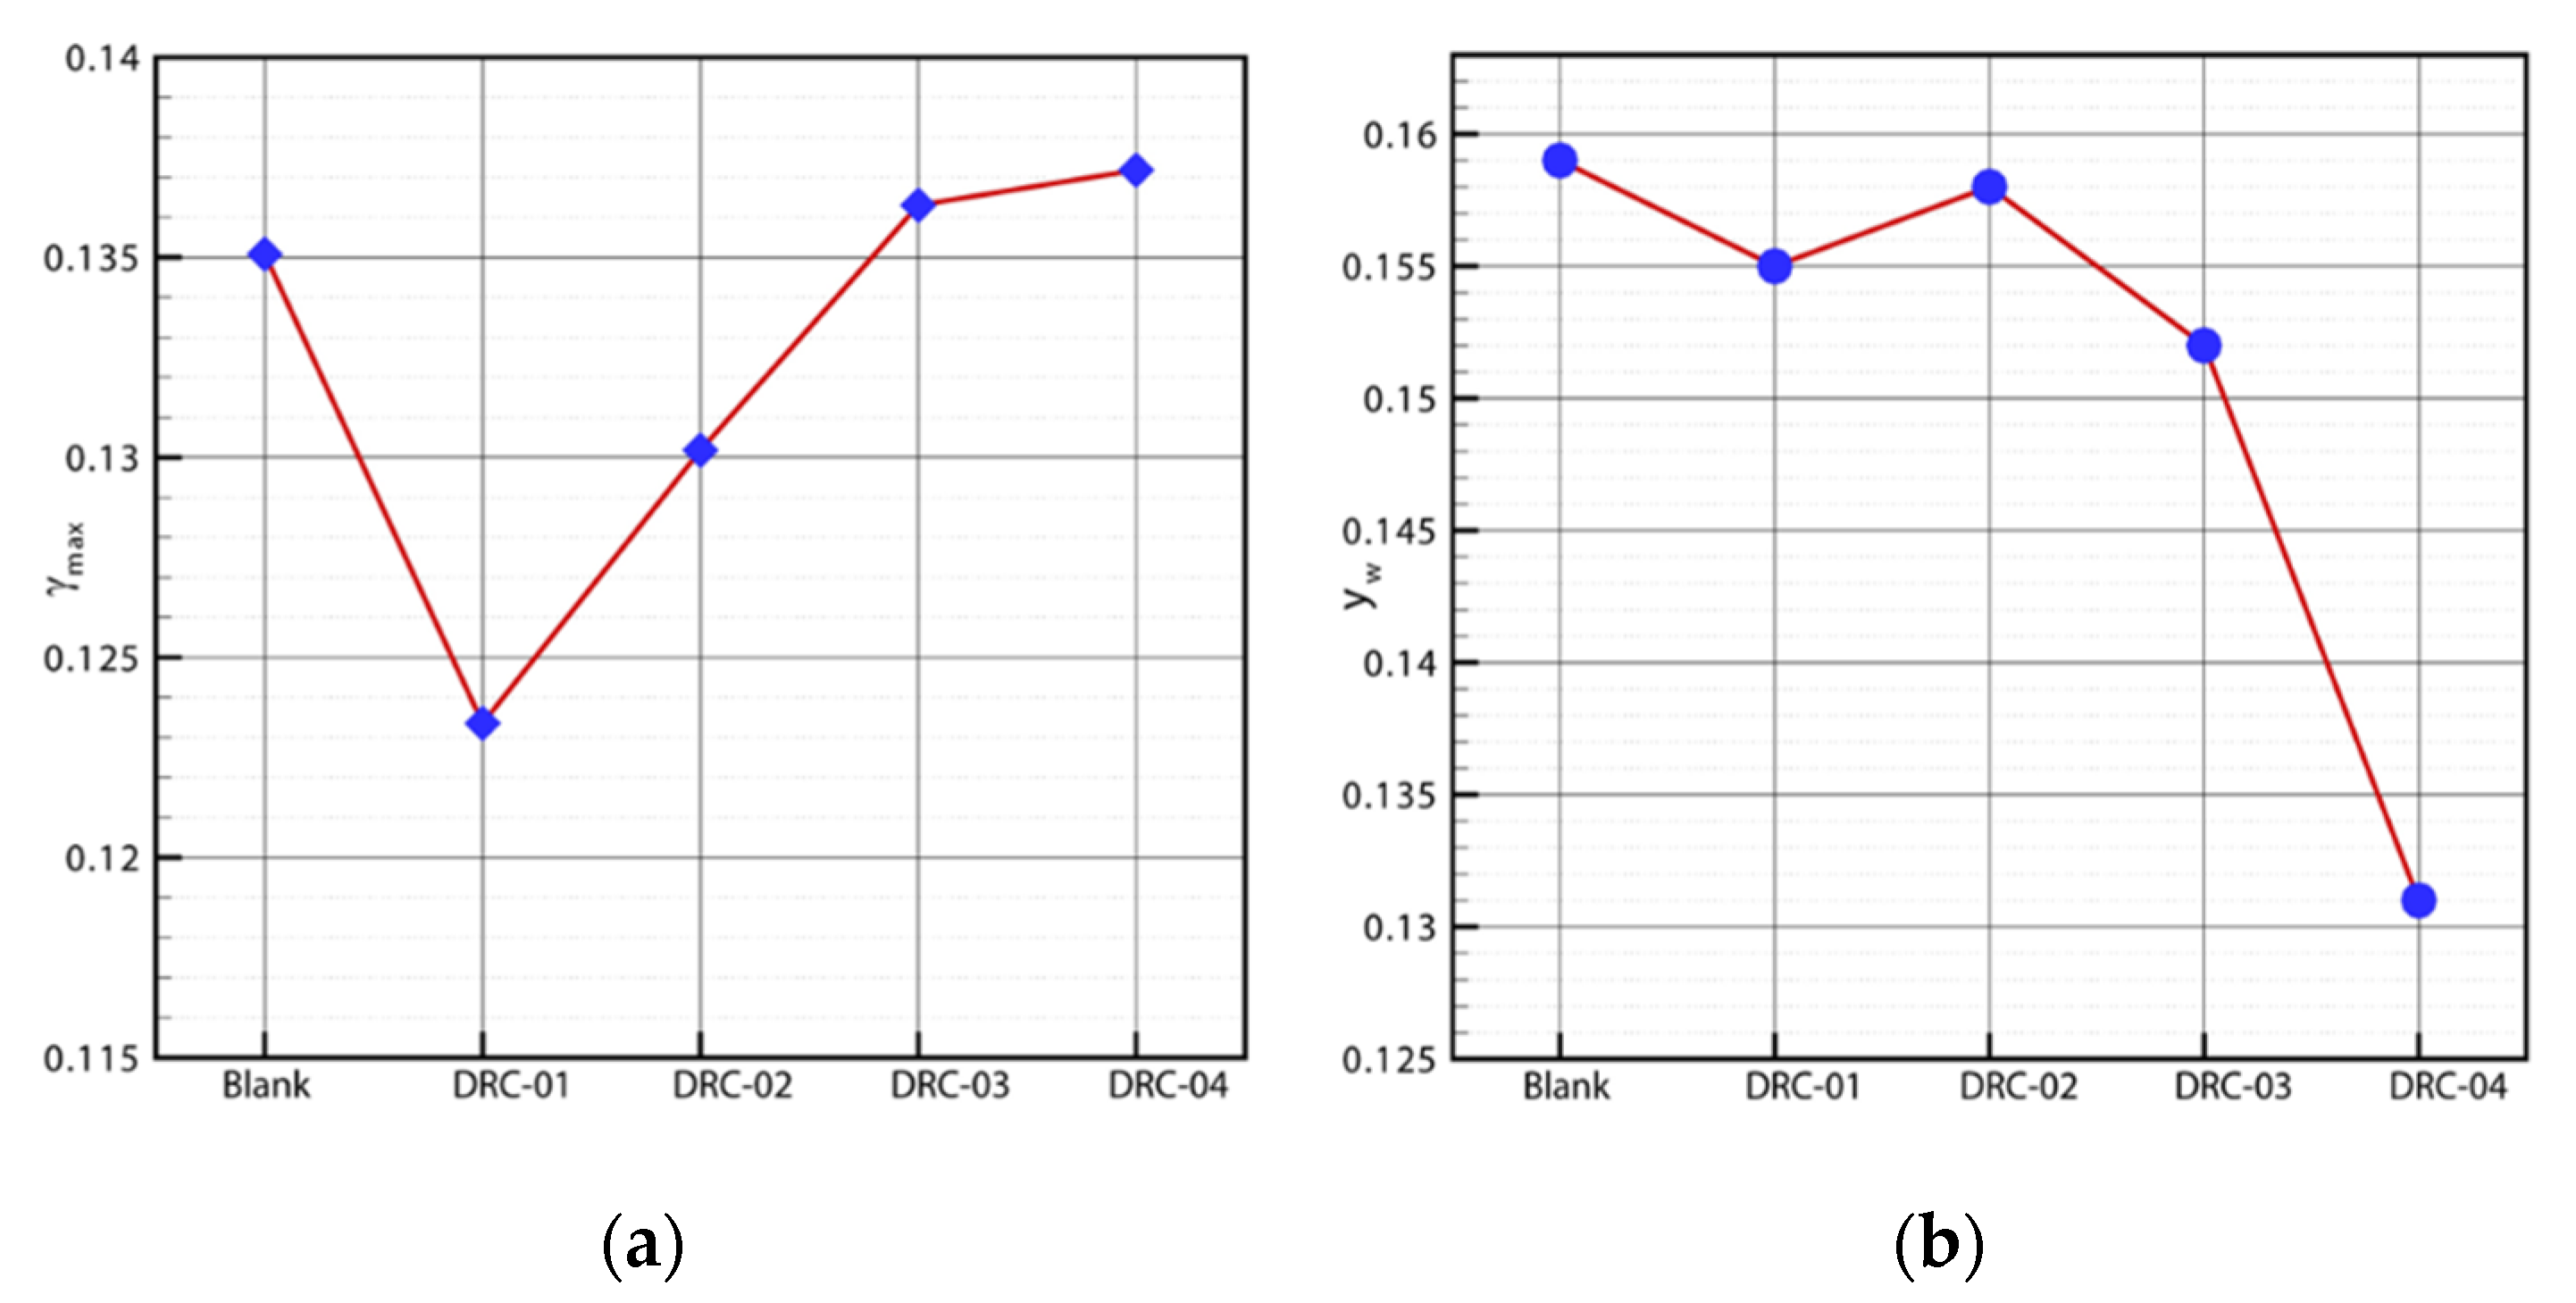
Figure 9a,b shows the maximum total pressure loss coefficient γmax and the width of the wake region yw with different coatings in the surface of the compressor cascade. According to Figure 9, the changes in the pressure loss coefficient curve of DRC-01 and DRC-02 compared to that of the Blank case have similarities, which are both caused by the structure of single-direction grooves. The maximum total pressure loss coefficient γmax is reduced. The results show that the maximum values of the curves of DPC-01 and DPC-02 significantly reduce and the width of the wake region slightly reduces. The reduction in maximum values of the curves of DPC-01 is relatively larger. Different from the above two cases, the changes in the pressure loss coefficient curve of DRC-03 and DRC-04 compared to that of the Blank case have similarities, both reducing the width of the wake region yw and this tendency is caused by the structure of multi-direction grooves. The maximum values γmax of the curves of DPC-03 and DPC-04 slightly increase, and the reduction in the wake region width yw of DPC-04 is relatively larger.
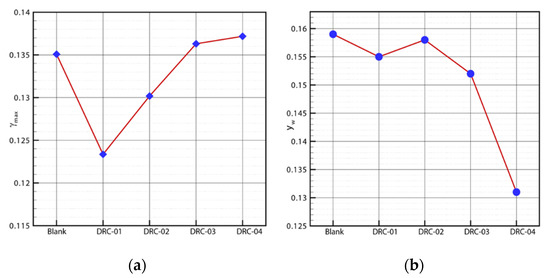
Figure 9.
The comparison of maximum total pressure loss coefficient and width of the wake region. (a) Maximum total pressure loss coefficient; (b) width of the wake region.
Overall, the excellent performances of the total pressure loss exist in DPC-01 and DPC-04. This is due to the significant reduction in the maximum value of total pressure loss by DPC-01 and the significant reduction in the width of the wake region by DPC-04, respectively. The increase in the area-averaged total pressure loss coefficient γ by DPC-03 is due to the sight reduction in the width of the wake region and the increase in the maximum value.
4.2. Flow Turning Angle
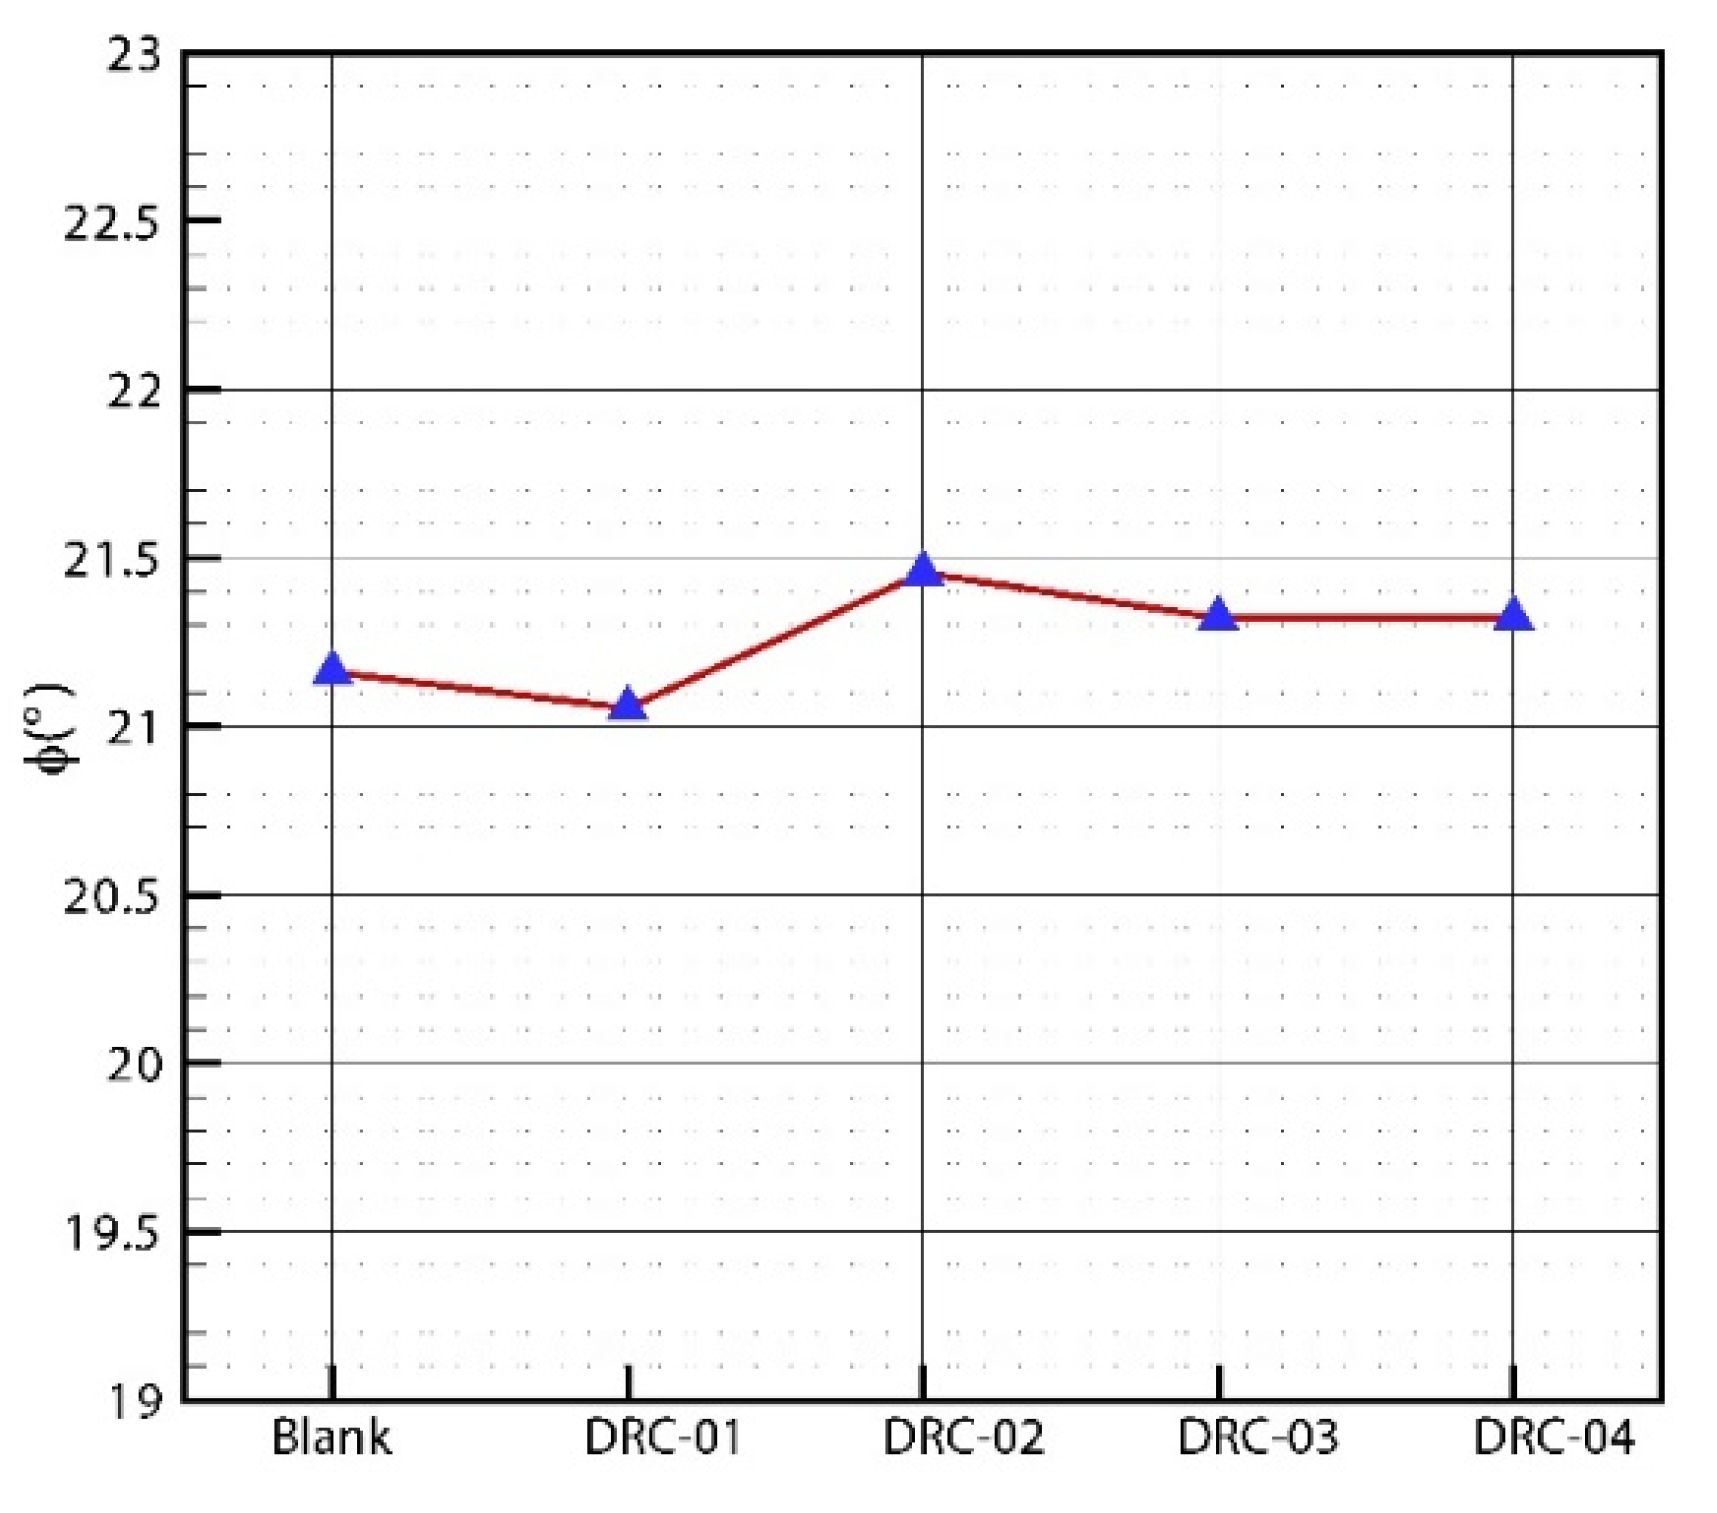
As shown in Figure 10, the flow turning angle ϕ of the hierarchical coating surface does not differ significantly from the Blank control. The most significant change is in the flow turning angle of DRC-03, which is 0.28°. Due to slight changes in the flow turning angle ϕ, the pitch-wise location of the maximum value in the local total pressure loss coefficient curve shown in Figure 8 also changes. The results indicate that the capacity of blades for guiding the flow in a predetermined flow channel is not significantly changed by the microgroove polyurethane coatings, which is favorable for this study.
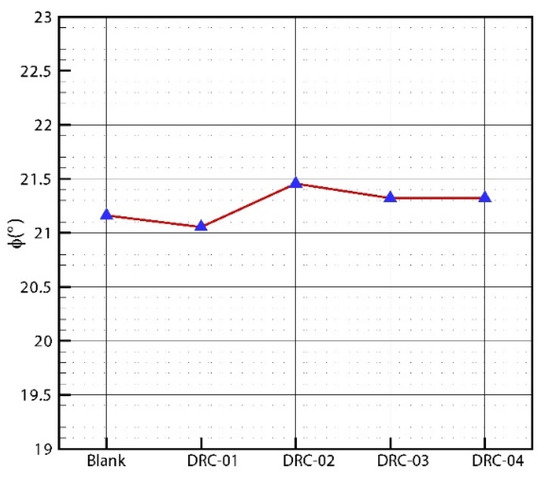
Figure 10.
The comparison of flow turning angle.
5. Discussion
Through analysis of the total pressure loss of compressor cascade with and without microgroove polyurethane coatings, micro-texture surface in this study is reduced flow loss of cascade. In this section, the mechanism is discussed.
Previous studies have shown that the micro-texture surface provides a considerable slip length at the wall interface [46,47,48,49,50]. Micro-texture surface modifies the near-wall flow and reduces the wall shear stress, which suppresses the generation of large-scale vortex structure [51]. As a result, momentum exchange is impeded, and turbulent intensity is decreased in the near-wall flow field [52]. For the flow field of compressor cascade, the primary flow loss results from turbulent dissipation [53,54]. Therefore, the reduction in viscous drag by microgroove polyurethane coatings might correlate with its effect on turbulence control.
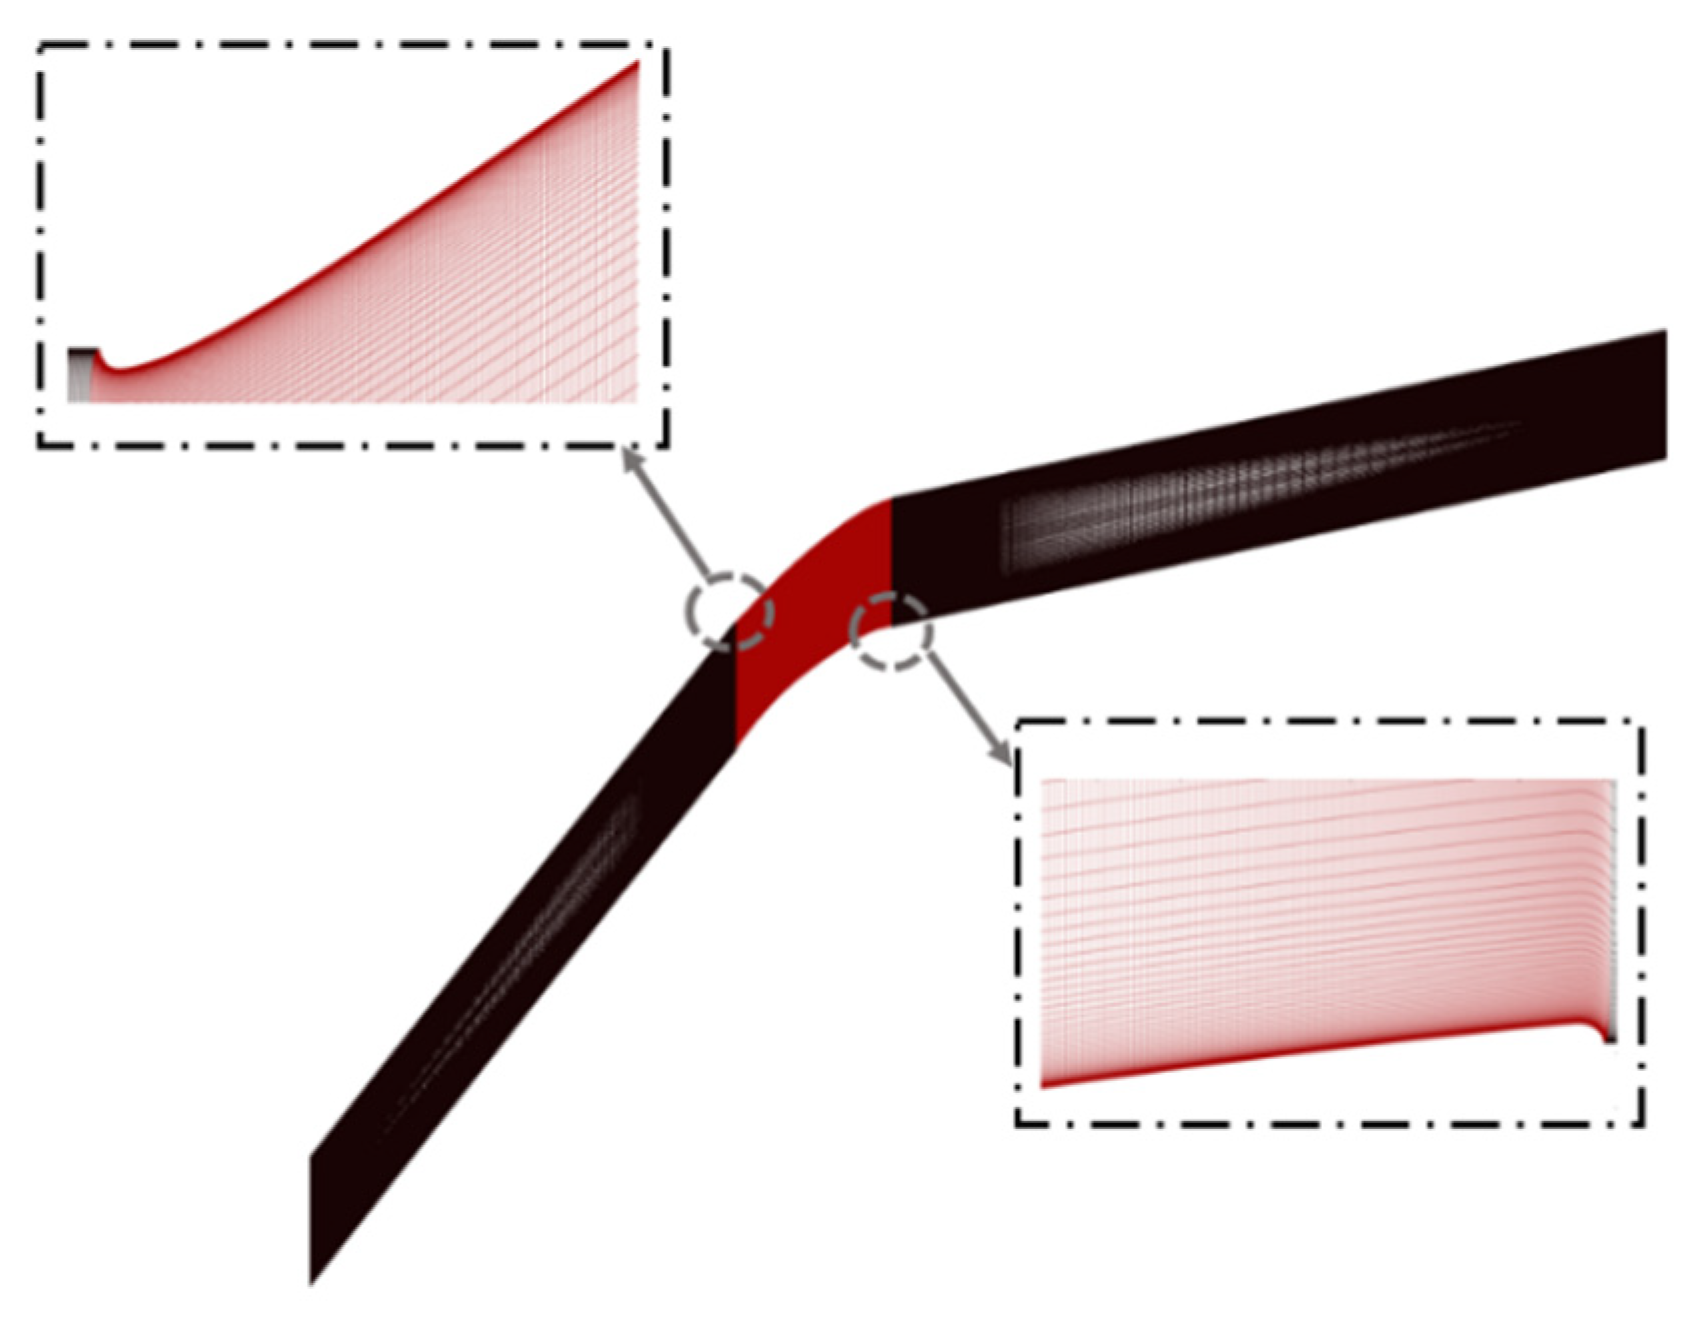
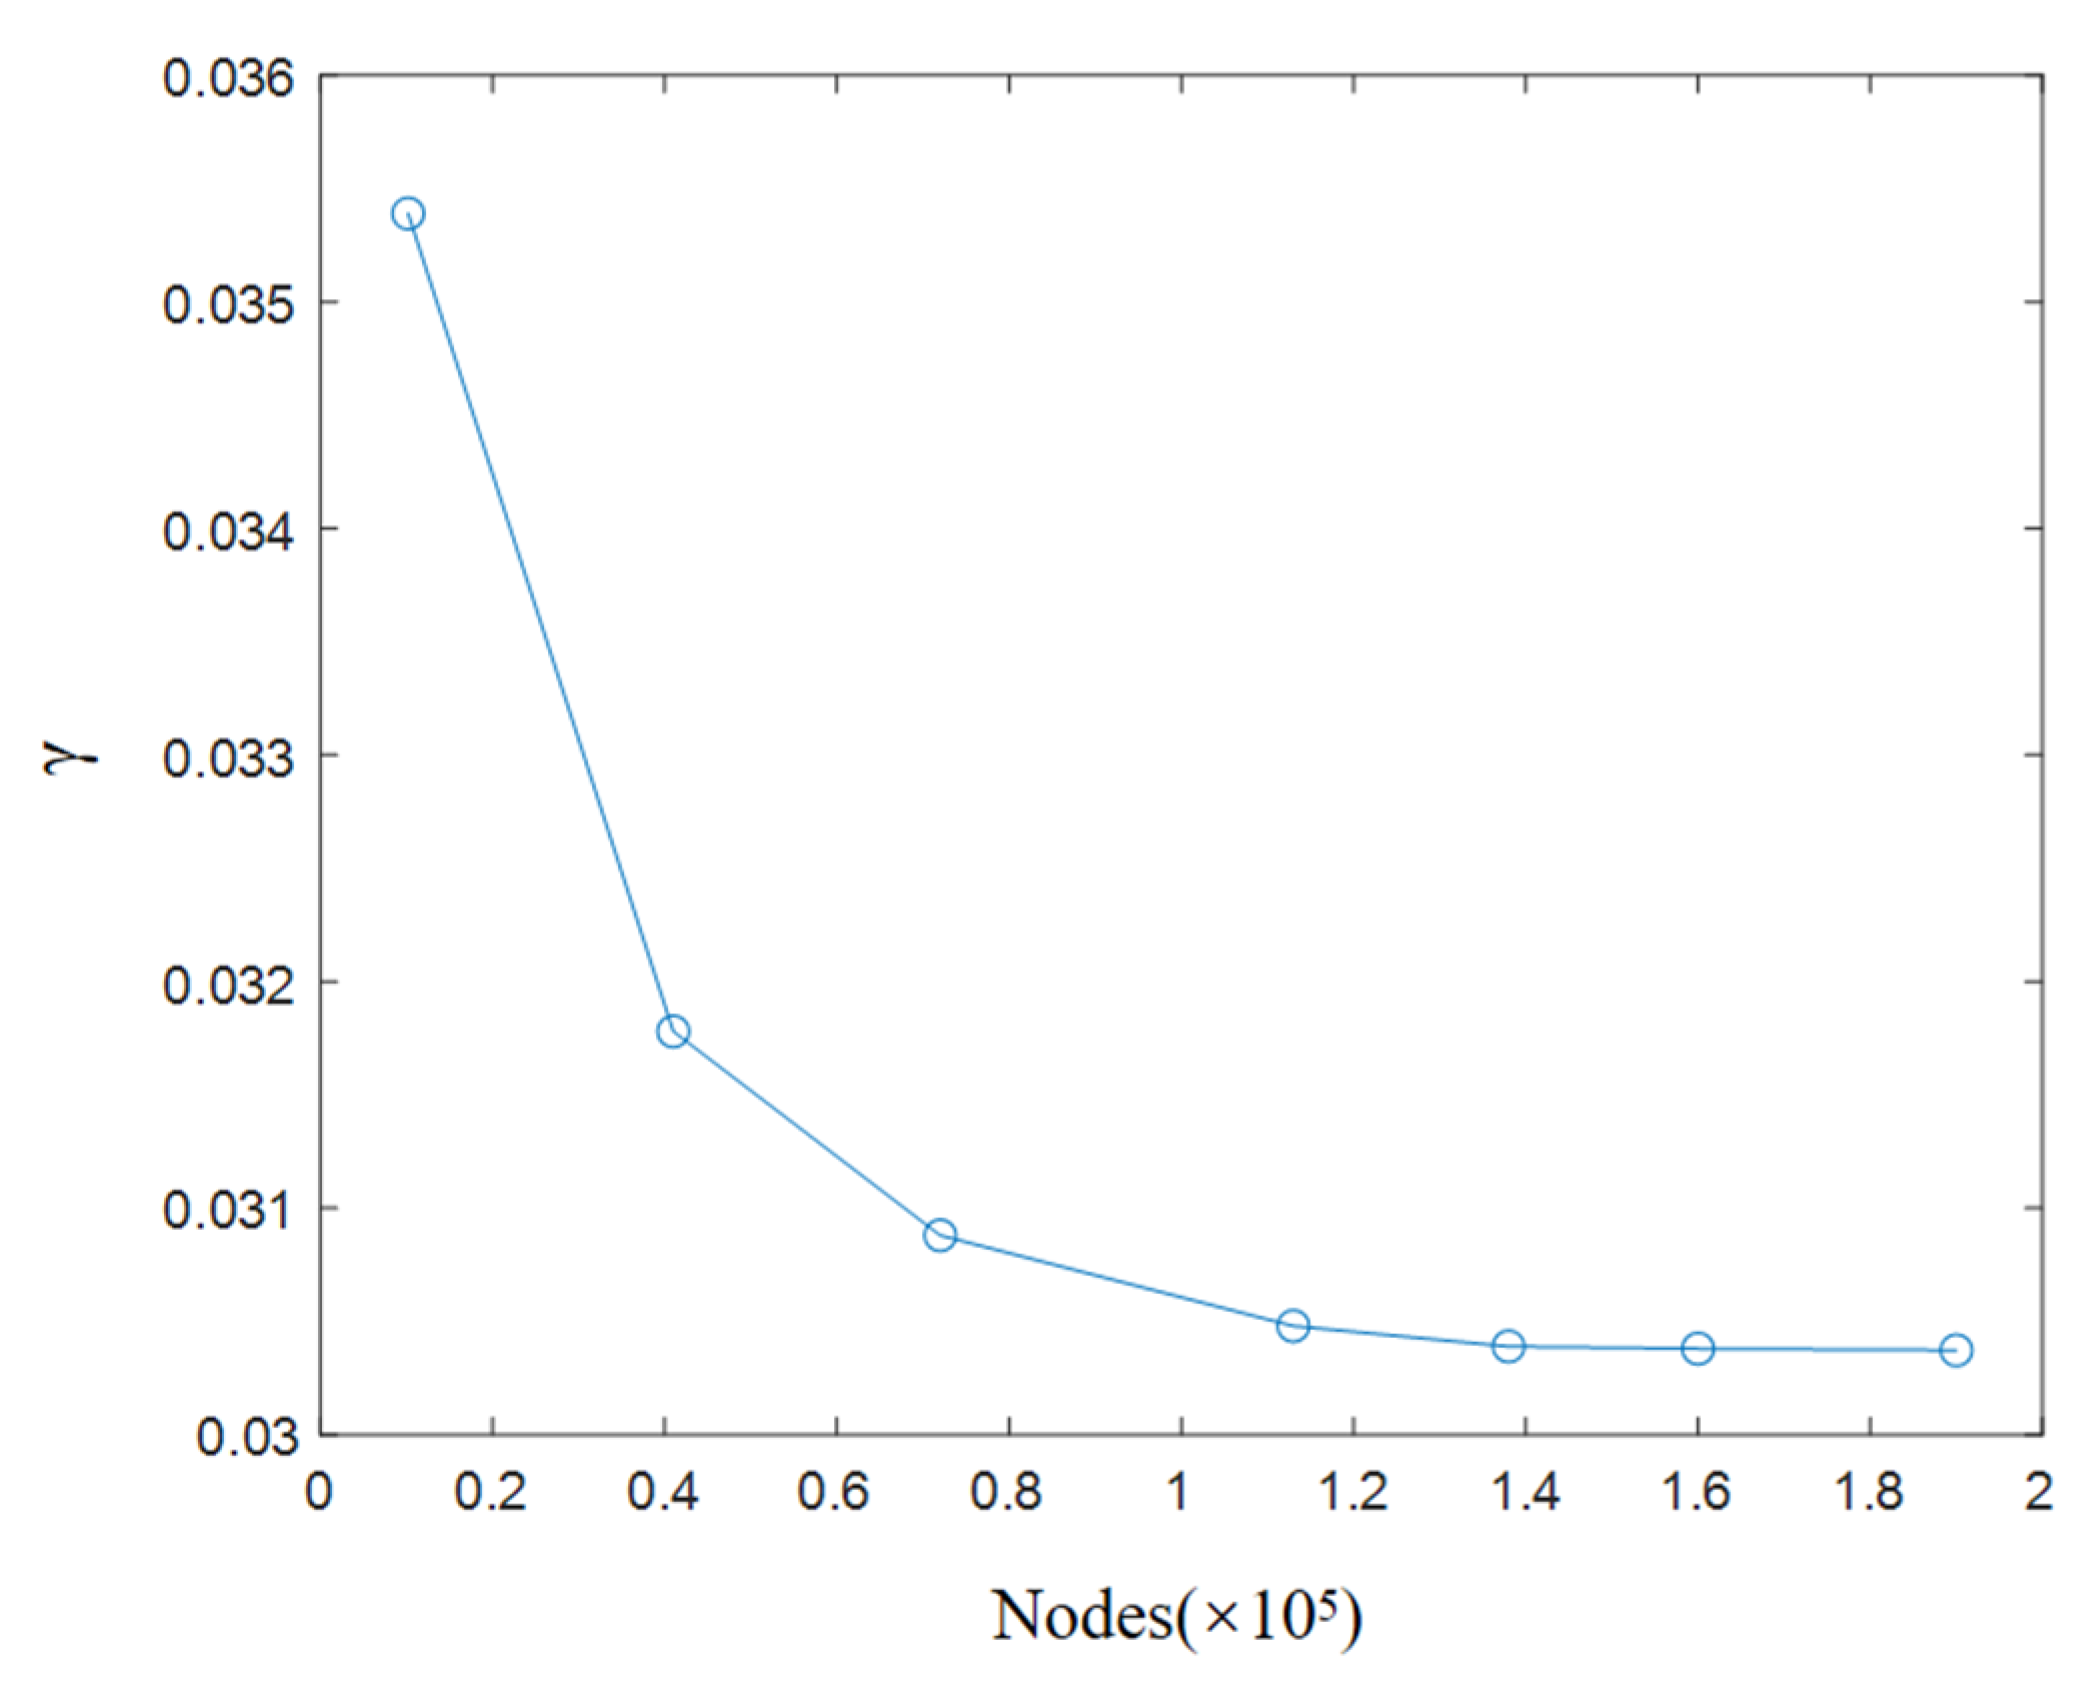
In this study, Roe-FDS flux scheme is used and second-order upwind scheme is applied in the turbulent kinetic energy and dissipative terms. Due to the complexity and the randomness of the surface structure, it is extremely difficult to obtain accurate numerical simulation results for cascade with microgroove polyurethane coatings. Therefore, “Blank” was chosen as the object to investigate the flow loss mechanism in the compressor cascade flow field. The geometry parameters and test conditions are introduced in Section 2.1 and Section 3.2, respectively. Reynolds-Averaged Navier–Stokes (RANS) model is selected for simulation and the transition SST four-equation model [55] is selected as the turbulence model. For the upper and lower boundaries of the computational domain, the no-slip boundary condition is applied in the cascade boundary and the periodic boundary condition is applied in the flow field boundary. The pressure boundary condition is used at both the inlet and outlet, with a total pressure of 122,800 Pa, a total inlet temperature of 293 K, a turbulent intensity of 0.2% and an outlet back pressure of 101,325 Pa. The simulation process is considered to the convergence when the residuals of continuity, x-direction velocity and y-direction velocity reach 10−6. Figure 11 shows the mesh topology of cascade flow channel. The first grid layer near wall satisfies with a grid height ratio of 1.08–1.10. The total number of mesh is 138,000. Figure 12 shows the verification of grid independence. Seven types of mesh topology are tested and the area-averaged total pressure loss coefficients γ are calculated. Convergence of the total pressure loss coefficient is achieved when the number of mesh is 138,000. This grid topology is considered to be optimal for balancing the number of mesh and CFD accuracy. Further, this grid topology is satisfactory in terms of grid quality indicators such as orthogonality, skewness and smoothness. Therefore, it is applied to the subsequent numerical simulations.

Figure 11.
Mesh topology of cascade flow channel.
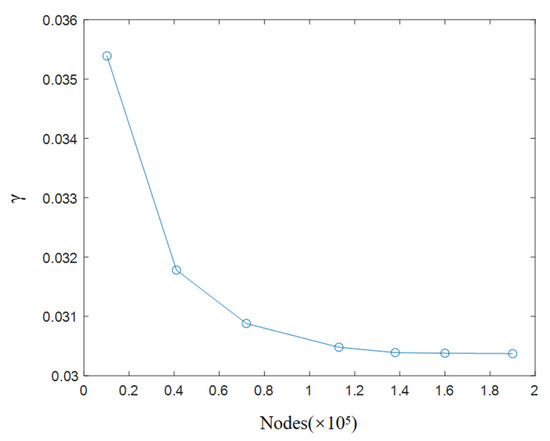
Figure 12.
Grid independence verification.
The energy conversion in the flow channel of the compressor cascade is closely related to the total pressure loss. The total pressure is composed of dynamic pressure and static pressure. The conversion between dynamic and static pressure does not lead to total pressure loss. Actually, the viscous dissipation in the flow field causes the total pressure loss, which is mainly initiated by the turbulence in the flow field. Figure 13 shows turbulence intensity (TI) and total pressure (TP) contours near the section surface. The results indicate that the central turbulence region of total pressure loss is in the near-wall region and the total pressure reduces in the corresponding region. It can be found that the magnitude of turbulent intensity has a strong positive correlation with the total pressure loss in the flow field.
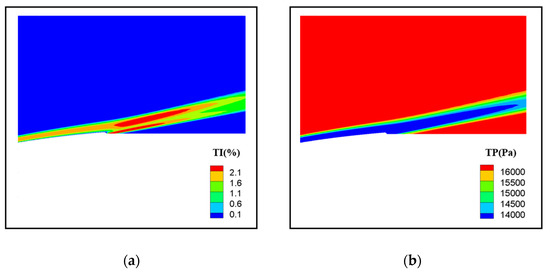
Figure 13.
Turbulence intensity and total pressure contours near the section surface. (a) Turbulence intensity; (b) total pressure.
The flow near the surface of the transonic compressor cascade is mainly turbulent. Thus, the loss due to energy dissipation of turbulence occupies a significant part. A large quantity of energy dissipates in the flow field and the local total pressure reduces, thus increasing the total pressure loss coefficient. Microgroove polyurethane coatings achieve turbulence control by altering the flow in the near-wall region. As shown in Figure 8, the turbulence control of different surface structure gives different impacts on the total pressure loss coefficient γi of the transonic compressor cascade. The reason is that the ordered and directional secondary vortex is induced by the hierarchical surface structure with single-direction grooves (DRC-01 and DRC-02). The induced secondary vortex increases the slip velocity in the surface and reduces the local turbulence intensity through turbulence control. As a result, a reduction in the maximum total pressure loss coefficient γmax is produced. However, the slip velocity in the hierarchical surface structure with multi-direction grooves (DRC-03 and DRC-04) further increases due to the form of multi-direction secondary vortex. Additionally, the location with high turbulence intensity is relatively concentrated, resulting in a narrower width of the wake region yw and a higher maximum total pressure loss coefficient γmax.
6. Conclusions
In this study, the effect of microgroove polyurethane coatings on the performance of transonic compressor cascade is investigated by experiment and the mechanism of performance improvement is discussed. This study provides a new idea for applying synthetic chemical surfaces to reduce viscous drag in the transonic flow field.
In the test section, different hierarchical coatings are attached to the surface of the compressor cascade to evaluate the performance in a high-speed linear compressor cascade wind tunnel. Compared with the Blank case, coatings of single-direction grooves with nanospheres have the capability to reduce total pressure loss of compressor cascade at transonic speeds by reducing the maximum total pressure loss coefficient. Further, coatings of multi-direction grooves with nanospheres have the capability to reduce total pressure loss by narrowing the width of the wake region, respectively. Moreover, the results of flow turning angle indicate that the capacity of blades for guiding the flow in the channel does not significantly change by microgroove polyurethane coatings.
In the mechanism discussion section, the total pressure in the flow channel has been demonstrated to have a strong correlation with turbulence intensity. The results indicate that a large quantity of energy dissipates as the total pressure loss in the flow field due to turbulence dissipation. Microgroove polyurethane coatings modify the near-wall flow and suppress turbulence generation. In other words, microgroove polyurethane coatings act as the turbulence control. Therefore, the flow loss reduction in compressor cascade by microgroove polyurethane coatings correlates with turbulence control.
In the future, the following studies will be conducted: (a) the turbulence characteristics of compressor cascade with microgroove polyurethane coatings will be tested for more specific mechanism analysis; (b) the law of turbulence control effect of microgroove polyurethane coatings with various groove geometry and size will be studied in detail; (c) numerical simulation strategies for random micro-texture surfaces of different scale will be investigated combined with more experimental data.
Author Contributions
Overall planning, G.S.; methodology, G.S., L.W. and C.W.; model design, L.W., C.W. and S.Q.; writing—original draft preparation, L.W. and C.W.; writing—review and editing, X.L.; coating preparation, B.Y.; experiment, M.W. and H.L.; project administration, Y.Z. and Y.H.; funding acquisition, G.S. All authors have read and agreed to the published version of the manuscript.
Funding
This research was funded by AECC Commercial Aircraft Engine Co., Ltd.
Institutional Review Board Statement
Not applicable.
Informed Consent Statement
Not applicable.
Data Availability Statement
Not applicable.
Acknowledgments
The authors thank Gang Wu for his contribution in the process of coating preparation. Moreover, the authors appreciate the support for the publication of this paper from guest editor of the Special Issue, Benedetto Mele.
Conflicts of Interest
The authors declared that they have no conflict of interest to this work.
References
- Kan, X.; Wu, W.; Zhong, J. Effects of vortex dynamics mechanism of blade-end treatment on the flow losses in a compressor cascade at critical condition. Aerosp. Sci. Technol. 2020, 102, 105857. [Google Scholar] [CrossRef]
- Chen, F.-Q.; Li, X.-S.; Hu, B.; Ren, X.-D.; Wang, Z.-Y.; Gu, C.-W. Pressure drop analysis and aerodynamic design of compressor L-inlet duct. Aerosp. Sci. Technol. 2020, 107, 106324. [Google Scholar] [CrossRef]
- Huang, G.; Yang, Y.; Hong, S.; Liu, Z.; Du, S. A new unsteady casing treatment for micro centrifugal compressors to enlarge stall margin. Aerosp. Sci. Technol. 2020, 106, 106176. [Google Scholar] [CrossRef]
- Fu, L.; Hu, C.; Yang, C.; Bao, W.; Zhou, M. Vortex trajectory prediction and mode analysis of compressor stall with strong non-uniformity. Aerosp. Sci. Technol. 2020, 105, 106031. [Google Scholar] [CrossRef]
- Zaman, K. Effect of acoustic excitation on stalled flows over an airfoil. AIAA J. 1992, 30, 1492–1499. [Google Scholar] [CrossRef] [Green Version]
- Zhu, H.; Hao, W.; Li, C.; Ding, Q.; Wu, B. Application of flow control strategy of blowing, synthetic and plasma jet actuators in vertical axis wind turbines. Aerosp. Sci. Technol. 2019, 88, 468–480. [Google Scholar] [CrossRef]
- Bar-Sever, A. Separation control on an airfoil by periodic forcing. AIAA J. 1989, 27, 820–821. [Google Scholar] [CrossRef]
- Lin, J.C. Review of research on low-profile vortex generators to control boundary-layer separation. Prog. Aerosp. Sci. 2002, 38, 389–420. [Google Scholar] [CrossRef]
- Fiebig, M.; Kallweit, P.; Mitra, N.; Tiggelbeck, S. Heat transfer enhancement and drag by longitudinal vortex generators in channel flow. Exp. Therm. Fluid Sci. 1991, 4, 103–114. [Google Scholar] [CrossRef]
- Yang, J.; Zhang, Y.; Chen, H.; Fu, S. Flow separation control in a conical diffuser with a Karman-vortex generator. Aerosp. Sci. Technol. 2020, 106, 106076. [Google Scholar] [CrossRef]
- Suga, K.; Okazaki, Y.; Ho, U.; Kuwata, Y. Anisotropic wall permeability effects on turbulent channel flows. J. Fluid Mech. 2018, 855, 983–1016. [Google Scholar] [CrossRef]
- Rosti, M.E.; Brandt, L.; Pinelli, A. Turbulent channel flow over an anisotropic porous wall—Drag increase and reduction. J. Fluid Mech. 2018, 842, 381–394. [Google Scholar] [CrossRef] [Green Version]
- Mohammadi, A.; Floryan, J.M. Numerical Analysis of Laminar-Drag-Reducing Grooves. J. Fluids Eng. 2015, 137, 41201. [Google Scholar] [CrossRef]
- DeGroot, C.; Wang, C.; Floryan, J.M. Drag Reduction Due to Streamwise Grooves in Turbulent Channel Flow. ASME J. Fluids Eng. 2016, 138, 121201. [Google Scholar] [CrossRef]
- Walsh, M.J. Riblets as a Viscous Drag Reduction Technique. AIAA J. 1983, 21, 485–486. [Google Scholar] [CrossRef]
- Walsh, M. Turbulent boundary layer drag reduction using riblets. In Proceedings of the 20th Aerospace Science Meeting, Orlando, FL, USA, 11–14 January 1982. [Google Scholar] [CrossRef]
- Dean, B.; Bhushan, B. Shark-skin surfaces for fluid-drag reduction in turbulent flow: A review. Philos. Trans. R. Soc. Lond. Ser. A Math. Phys. Eng. Sci. 2010, 368, 4775–4806. [Google Scholar] [CrossRef] [Green Version]
- Dean, B.; Bhushan, B. The effect of riblets in rectangular duct flow. Appl. Surf. Sci. 2012, 258, 3936–3947. [Google Scholar] [CrossRef]
- Goldstein, D.; Handler, R.; Sirovich, L. Direct numerical simulation of turbulent flow over a modeled riblet covered surface. J. Fluid Mech. 1995, 302, 333–376. [Google Scholar] [CrossRef]
- Lee, S.-J. Flow field analysis of a turbulent boundary layer over a riblet surface. Exp. Fluids 2001, 30, 153–166. [Google Scholar] [CrossRef]
- Viswanath, P.R. Aircraft viscous drag reduction using riblets. Prog. Aerosp. Sci. 2002, 38, 571–600. [Google Scholar] [CrossRef] [Green Version]
- Ardakani, S.; McKinley, G. Drag reduction using wrinkled surfaces in high Reynolds number laminar boundary layer flows. Phys. Fluids 2017, 29, 093605. [Google Scholar] [CrossRef]
- Daeian, M.A.; Moosavi, A.; Nouri-Borujerdi, A.; Taghvaei, E. Drag reduction in a channel with microstructure grooves using the lattice Boltzmann method. J. Phys. D Appl. Phys. 2017, 50, 105301. [Google Scholar] [CrossRef]
- Stull, F.D.; Velkoff, H.R. Flow Regimes in 2-Dimensional Ribbed Diffusers. J. Fluids Eng. Trans. ASME 1975, 97, 87–96. [Google Scholar] [CrossRef]
- Lang, A.W.; Jones, E.M.; Afroz, F. Separation control over a grooved surface inspired by dolphin skin. Bioinspir. Biomim. 2017, 12, 026005. [Google Scholar] [CrossRef] [PubMed]
- Mariotti, A.; Buresti, G.; Salvetti, M. Control of the turbulent flow in a plane diffuser through optimized contoured cavities. Eur. J. Mech. B Fluids 2014, 48, 254–265. [Google Scholar] [CrossRef]
- Mariotti, A.; Buresti, G.; Salvetti, M. Separation delay through contoured transverse grooves on a 2D boat-tailed bluff body: Effects on drag reduction and wake flow features. Eur. J. Mech. B Fluids 2019, 74, 351–362. [Google Scholar] [CrossRef]
- Bechert, D.W.; Bruse, M.; Hage, W.; VAN DER Hoeven, J.G.T.; Hoppe, G. Experiments on drag-reducing surfaces and their optimization with an adjustable geometry. J. Fluid Mech. 1997, 338, 59–87. [Google Scholar] [CrossRef]
- Luo, Y.; Wang, J.; Sun, G.; Li, X.; Liu, Y. Experimental Investigations on Manufacturing Different-Shaped Bio-inspired Drag-reducing Morphologies and Hydrodynamic Testing. EXP Tech. 2016, 40, 1129–1136. [Google Scholar] [CrossRef]
- Zhang, Y.; Chen, H.; Fu, S.; Dong, W. Numerical study of an airfoil with riblets installed based on large eddy simulation. Aerosp. Sci. Technol. 2018, 78, 661–670. [Google Scholar] [CrossRef]
- Mele, B.; Russo, L.; Tognaccini, R. Drag bookkeeping on an aircraft with riblets and NLF control. Aerosp. Sci. Technol. 2020, 98, 105714. [Google Scholar] [CrossRef]
- Zhang, C.; Bijay, K.S. Investigation on drag reduction performance of aero engine blade with micro-texture. Aerosp. Sci. Technol. 2018, 72, 380–396. [Google Scholar] [CrossRef]
- Boese, M.; Fottner, L. Effects of Riblets on the Loss Behavior of a Highly Loaded Compressor Cascade. In Proceedings of the ASME Turbo Expo 2002: Power for Land, Sea, and Air, Amsterdam, The Netherlands, 3–6 June 2002; pp. 743–750. [Google Scholar] [CrossRef]
- Lietmeyer, C.; Oehlert, K.; Seume, J.R. Optimal Application of Riblets on Compressor Blades and Their Con-tamination Be-havior. ASME J. Turbomach. 2012, 135, 011036. [Google Scholar] [CrossRef]
- Liu, Q.; Zhong, S.; Li, L. Investigation of Riblet Geometry and Start Locations of Herringbone Riblets on Pressure Losses in a Linear Cascade at Low Reynolds Numbers. J. Turbomach. 2020, 142, 101010. [Google Scholar] [CrossRef]
- Zhu, Y.; Yang, F.; Guo, Z. Bioinspired surfaces with special micro-structures and wettability for drag reduction: Which surface design will be a better choice? Nanoscale 2021, 13, 3463–3482. [Google Scholar] [CrossRef]
- Kim, T.; Shin, R.; Jung, M.; Lee, J.; Park, C.; Kang, S. Drag reduction using metallic engineered surfaces with highly ordered hierarchical topographies: Nanostructures on micro-riblets. Appl. Surf. Sci. 2016, 367, 147–152. [Google Scholar] [CrossRef]
- Tao, J.; Sun, G.; Wu, G.; Guo, L.; Zhong, Y.; Wang, M.; You, B. An innovative study on low surface energy micro-nano coatings with multilevel structures for laminar flow design. Chin. J. Aeronaut. 2019, 32, 577–584. [Google Scholar] [CrossRef]
- Choi, K.-S. Near-wall structure of a turbulent boundary layer with riblets. J. Fluid Mech. 1989, 208, 417–458. [Google Scholar] [CrossRef]
- Pollard, A. Passive and active control of near-wall turbulence. Prog. Aerosp. Sci. 1998, 33, 689–708. [Google Scholar] [CrossRef]
- Luo, Y.; Wang, L.; Green, L.; Song, K.; Wang, L.; Smith, R.L. Advances of drag-reducing surface technologies in turbulence based on boundary layer control. J. Hydrodyn. 2015, 27, 473–487. [Google Scholar] [CrossRef]
- Tang, Y.; Liu, Y.; Lu, L.; Lu, H.; Wang, M. Passive Separation Control with Blade-End Slots in a Highly Loaded Compressor Cascade. AIAA J. 2020, 58, 85–97. [Google Scholar] [CrossRef]
- Wu, G.; Li, W.; Ni, W.; Chen, L.; Sun, G.; You, B. Preparation of Nonspherical Fluorinated Acrylate Polymer Particles by a “Surface Tension Controlling” Method and Their Applications in Light-Diffusing Films. Macromol. Mater. Eng. 2019, 304, 1900174. [Google Scholar] [CrossRef]
- Keerthi, M.C.; Kushari, A.; De, A.; Kumar, A. Experimental Investigation of Effects of Leading-Edge Tubercles on Compressor Cascade Performance. In Proceedings of the Asme Turbo Expo: Turbine Technical Conference and Exposition, Düsseldorf, Germany, 16–20 June 2014. [Google Scholar] [CrossRef]
- Liesner, K.; Meyer, R. Evaluation of Passive and Active Secondary Flow Control in a High Speed Compressor Cascade with Different Measurement Techniques. In New Results in Numerical and Experimental Fluid Mechanics VIII; Springer: Berlin/Heidelberg, Germany, 2013; Volume 121, pp. 125–133. [Google Scholar]
- Ybert, C.; Barentin, C.; Cottin-Bizonne, C.; Joseph, P.; Bocquet, L. Achieving large slip with superhydrophobic surfaces: Scaling laws for generic geometries. Phys. Fluids 2007, 19, 123601. [Google Scholar] [CrossRef]
- Ahmmed, K.M.T.; Kietzig, A.-M. Drag reduction on laser-patterned hierarchical superhydrophobic surfaces. Soft Matter 2016, 12, 4912–4922. [Google Scholar] [CrossRef] [PubMed]
- Lu, S.; Yao, Z.; Hao, P.; Fu, C. Drag reduction in ultrahydrophobic channels with micro-nano structured surfaces. Sci. China Ser. G Phys. Mech. Astron. 2010, 53, 1298–1305. [Google Scholar] [CrossRef]
- Jung, Y.C.; Bhushan, B. Biomimetic structures for fluid drag reduction in laminar and turbulent flows. J. Phys. Condens. Matter 2010, 22, 035104. [Google Scholar] [CrossRef] [PubMed]
- Mele, B.; Tognaccini, R. Slip Length–Based Boundary Condition for Modeling Drag Reduction Devices. AIAA J. 2018, 56, 3478–3490. [Google Scholar] [CrossRef]
- Zhou, H.; Li, X.; Yu, C. Study on turbulence drag reduction of riblet plate in hypersonic turbulent flows. Int. J. Mod. Phys. C 2020, 31, 2050046. [Google Scholar] [CrossRef]
- Bai, Q.; Bai, J.; Meng, X.; Ji, C.; Liang, Y. Drag reduction characteristics and flow field analysis of textured surface. Friction 2016, 4, 165–175. [Google Scholar] [CrossRef] [Green Version]
- Pullan, G.; Harvey, N.W. Influence of Sweep on Axial Flow Turbine Aerodynamics at Midspan. J. Turbomach. 2006, 129, 591–598. [Google Scholar] [CrossRef]
- Wang, M.; Li, Z.; Yang, C.; Han, G.; Zhao, S.; Lu, X. Numerical investigations of the separated transitional flow over compressor blades with different loading distributions. Aerosp. Sci. Technol. 2020, 106, 106113. [Google Scholar] [CrossRef]
- Menter, F.; Langtry, R.; Likki, R.; Suzen, Y.; Huang, P.; Vo¨lker, S. A correlation-based transition model using local variables - Part I: Model formulation. J. Turbomach.-Trans. ASME 2006, 128, 413–422. [Google Scholar] [CrossRef]


Publisher’s Note: MDPI stays neutral with regard to jurisdictional claims in published maps and institutional affiliations. |
© 2022 by the authors. Licensee MDPI, Basel, Switzerland. This article is an open access article distributed under the terms and conditions of the Creative Commons Attribution (CC BY) license (https://creativecommons.org/licenses/by/4.0/).