Article

Detailed Assessment of Nasal Inter-Chamber Anatomical Variations and Its Effect on Flow Apportionment and Inhalation Exposure Patterns

Mechanical & Automotive Engineering, School of Engineering, RMIT University, Bundoora, VIC 3136, Australia
*
Author to whom correspondence should be addressed.
Fluids 2022, 7(3), 89; https://doi.org/10.3390/fluids7030089
Submission received: 15 December 2021 / Revised: 19 January 2022 / Accepted: 22 January 2022 / Published: 23 February 2022
(This article belongs to the Collection Advances in Flow of Multiphase Fluids and Granular Materials)

Abstract

:
Although many parametric studies have been conducted in developing standardized nasal geometry and analysing associated airflow dynamics, most of them are based on symmetrical nasal chambers assumption, while the inter-chamber variations due to the morphological asymmetry of the two nasal chambers are much less investigated. To address this issue, this paper presents an inter-chamber anatomical variability study by developing a shape comparison method to quantify inter-chamber anatomical differences. Then the anatomical deviation is correlated with the flow apportionment and the associated nanoparticle deposition patterns using CFD method. Results show that noticeable inter-chamber difference is observed especially in the inferior and middle passages where most inhaled flow is distributed to. Additionally, the shape of vestibule notch and septum deviation contributes to the discrepancy flow behaviour between two chambers. Consequently, these differences lead to variations in regional nanoparticle deposition, especially for 1 nm particles in the olfactory region, where the inter-chamber differences can reach up to 400%. Our results suggest that the inter-chamber anatomical variation should be considered when developing standardized nasal models.

1. Introduction

Engineered nanomaterials are widely manufactured and applied in various industrial, agricultural and medical fields. Despite of the nanomaterial market prosperity, our knowledge about the health impacts of human exposure to the airborne nanoparticles is still significantly lagging behind. The nose is the first major organ that, being directly exposed to airborne substances, serves as the first line of defence for the respiratory system by regulating humidity and temperature of inhaled air [1,2]. Therefore, the physiology and anatomy of the nose has attracted increasing attention in the research field.
The nasal anatomy plays a fundamental role in enabling normal nasal function while any subtle disorder may result in suffering nasal diseases. Rhinitis is one of the common nasal disorders that undermines life quality with recurrent symptoms such as constant sneezing, sore throat and headache. According to statistics, over four million treatments were purchased from Australian pharmacies in 2007 [3]. It is also shocking that a survey examining 2589 adult patients with ear, nose and throat (ENT) disease found that 89.2% of them struggled with nasal septum deviation [4]. Worse still, 50% of patients reported recurrent symptoms after reconstructive surgery [5].
Varying clinical approach are applied for identifying nasal anatomical features and corresponding flow behaviour. Laine’s research in 1991 conducted an in vivo experiment of defining the minimum cross-sectional area of nasal cavity across 138 healthy children aged 7–15 years, during which nasal airway pressure drop and flow rate were measured respectively by differential pressure transducers and a heated pneumotachograph [6]. The statistical difference observed in the results was particularly due to different maturity of internal nasal structure and size of nasal cavity. In 2001, Huang’s research employed Acoustic Rhinometry (AR) to measure the minimum cross-sectional area and volume of nasal airway of 189 volunteers from Chinese, Malay and Indian, to investigate individual difference for varying ethnics [7]. No significant difference was revealed by the normal range of AR measurements among the three ethnic groups.
Numerical modelling of nasal airflow and exposure characteristics has been studied extensively in literature. Chen et al. [8] adopted a healthy nasal model for heat transfer simulation and operating localized geometry manipulations to imitate the inferior turbinate shape changes and its effect on flow behaviour. Ma et al. [9] reconstructed nasal cavity models of six healthy subjects to explore the influence of anterior anatomical variations on nasal air conditioning. Similarly, Dong et al. [10] adopted three healthy subjects with and without vestibule notch to examine the effect of anterior airway phenotypes on inhalation exposure characteristics to nanoparticles. The results showed that nanoparticle exposure was closely associated with the anatomy and deposition in the olfactory area, and remained sensitive to the shape of nasal vestibule. André et al. [11] reconstructed 15 healthy nasal models as well as 15 patients with nasal airway obstruction (NAO) and simulated the airflow distribution and heat flux within the nasal cavity. Results showed a correlation between the airflow distribution and anterior septal deviations, resulting in less middle flow distribution and weaker mucosal cooling for the NAO patients.
In addition to studies solely focusing on the effects of inter-subject variations, developing a standardized nasal model represents another major research stream in literature. Liu et al. [12] developed a standardized nasal cavity model from 30 healthy nasal subjects by processing median 2D cross-sectional slices with an innovative image processing algorithm. Their numerical analysis showed the standardized nasal model closely matched the median characteristic of the 30 patients. Lee et al. [13] carried out critical comparisons to evaluate the standardized healthy female Malaysian model with eight different models from their previous works, and considerable differences were observed which provided further information to improve standardized model development. Keustermans et al. [14] developed a large-scale statistic nasal geometry extract from 100 CT scans which included patients with various nasal or sinus-related disorders. The standardized model consists of a symmetrical nasal shape and a nasal with a septum that deviated to different degrees, which helps to systematically investigate heating function variation caused by inter-subject nasal geometry difference. Most recently, Brüning et al. [15] developed an averaged nasal model based on 25 symptom-free nasal subjects, and associated airflow dynamics was analysed. Their results suggested that averaged nasal model exhibits less nasal resistance and wall shear stress compared to considered individual models.
Although many parametric studies have been conducted in developing standardized nasal geometry and analysing associated airflow dynamics, the majority of them are based on symmetrical nasal chambers assumption, while the inter-chamber variations due to the morphological asymmetry of the two nasal chambers are much less investigated. To address this issue, this paper presents an inter-chamber anatomical variability study through developing a shape comparison method to quantify inter-chamber anatomical differences. Meanwhile, the influence of inter-chamber difference on the inhaled airflow apportionment and nanoparticle deposition patterns are analysed. The research findings are expected to assist in establishing a comprehensive standardized nasal model with broader coverage in the field.

2. Method

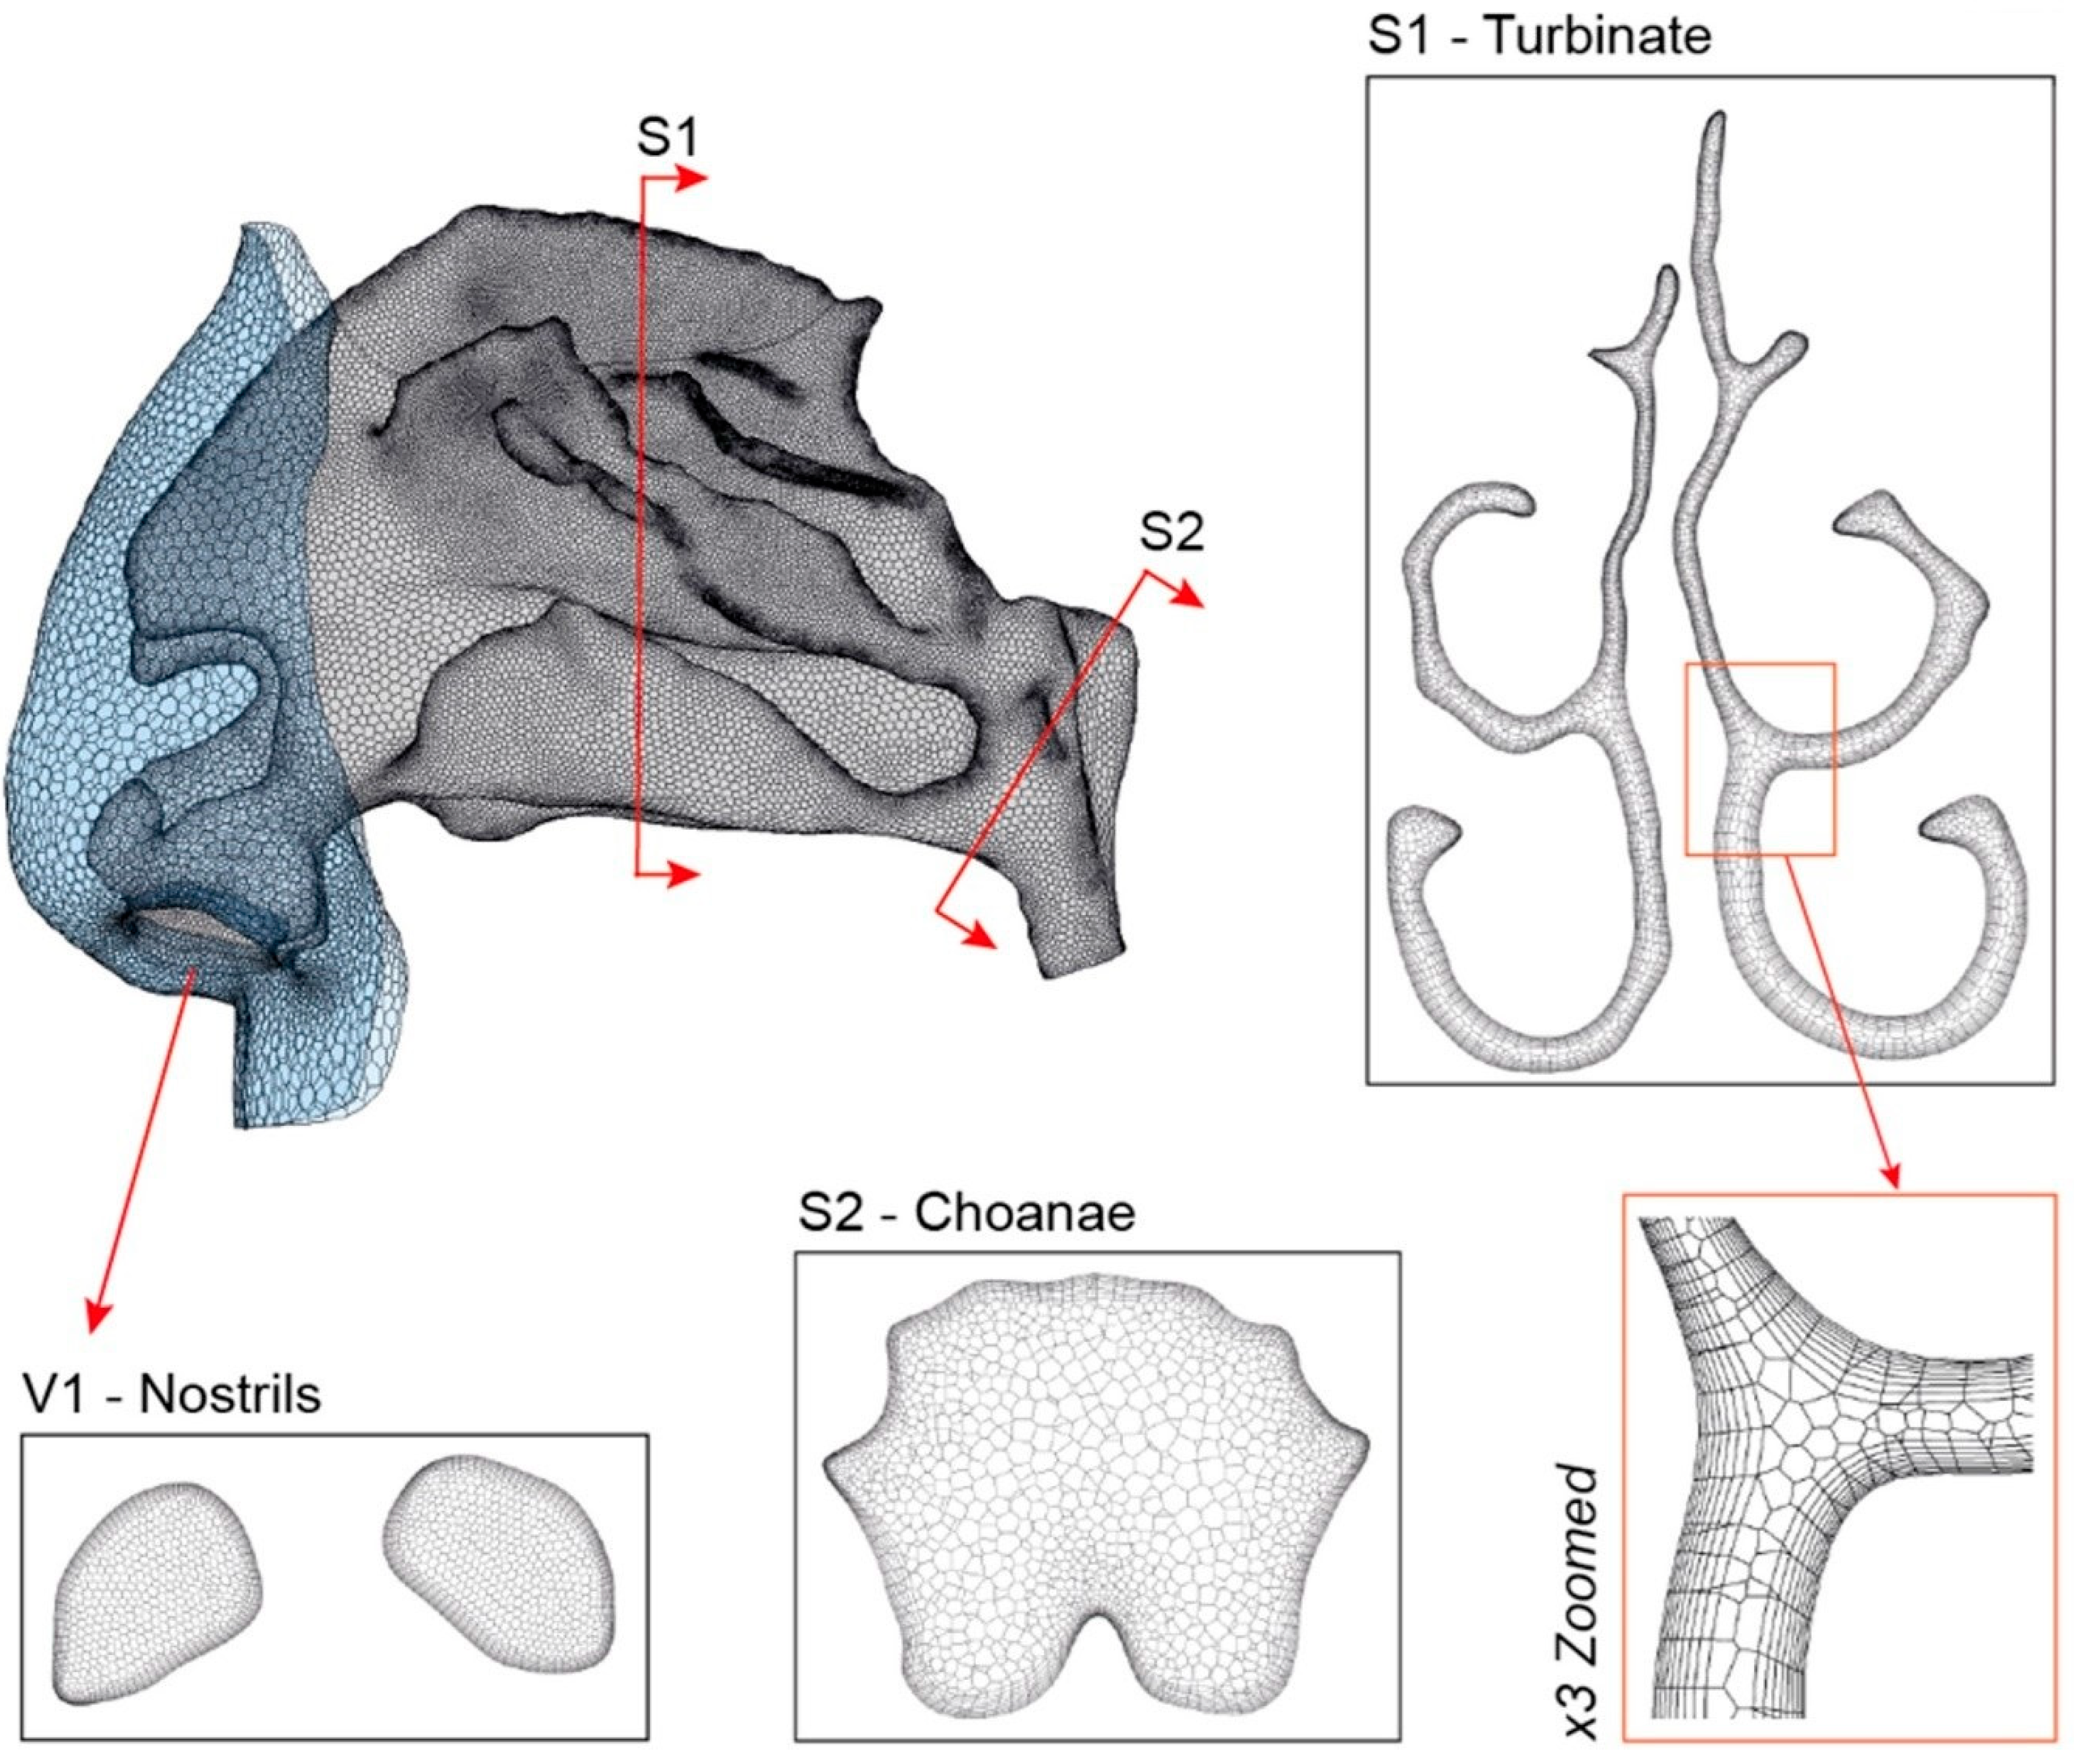
2.1. Airway Model and Computational Mesh

A nasal cavity model of a 77-year-old adult was reconstructed from CT scans; for the detailed reconstruction process and verification, refer to the authors’ previous studies [16,17]. The continuous inhalation path started from nostril, passing through nasal cavities which separated from the middle by septum wall, and extended to the end of pharynx, followed by an artificial extension which provided sufficient space for flow recovering to a fully developed condition and improved numerical convergence. To restore realistic inhalation and particle exposure conditions, external facial features around the nares were preserved (Figure 1), which have been demonstrated to be indispensable features in previous work [18,19]. To facilitate regional flow and particle exposure analysis, nasal surface was divided into multiple local regions, including vestibule, septum, olfactory, middle passage, inferior passage and pharynx.
Fluent Meshing (ANSYS Fluent) was used to generate computational mesh (Figure 2). To supply computational efficient mesh, polyhedral elements with typical cell dimension of 0.5 mm were employed in this study. A total of 8 layers of prism layers were attached along the nasal wall to simulate near wall region. The final mesh elements after mesh independence test were 1.3 million.
Steady inhalation flow with volume velocity of 15 L/min was imposed at the end of the airway and the boundary of the breathing zone worked as a zero-gauge relative atmospheric pressure inlet in this study. It is worth noting that in this case the laminar flow model was used since the laminar flow regime has been widely adopted for flow rates around 15 L/min in the literature [2,20,21,22]. The continuity and momentum equations were solved by using ANSYS Fluent, where the inhaled flow was assumed as incompressible flow.

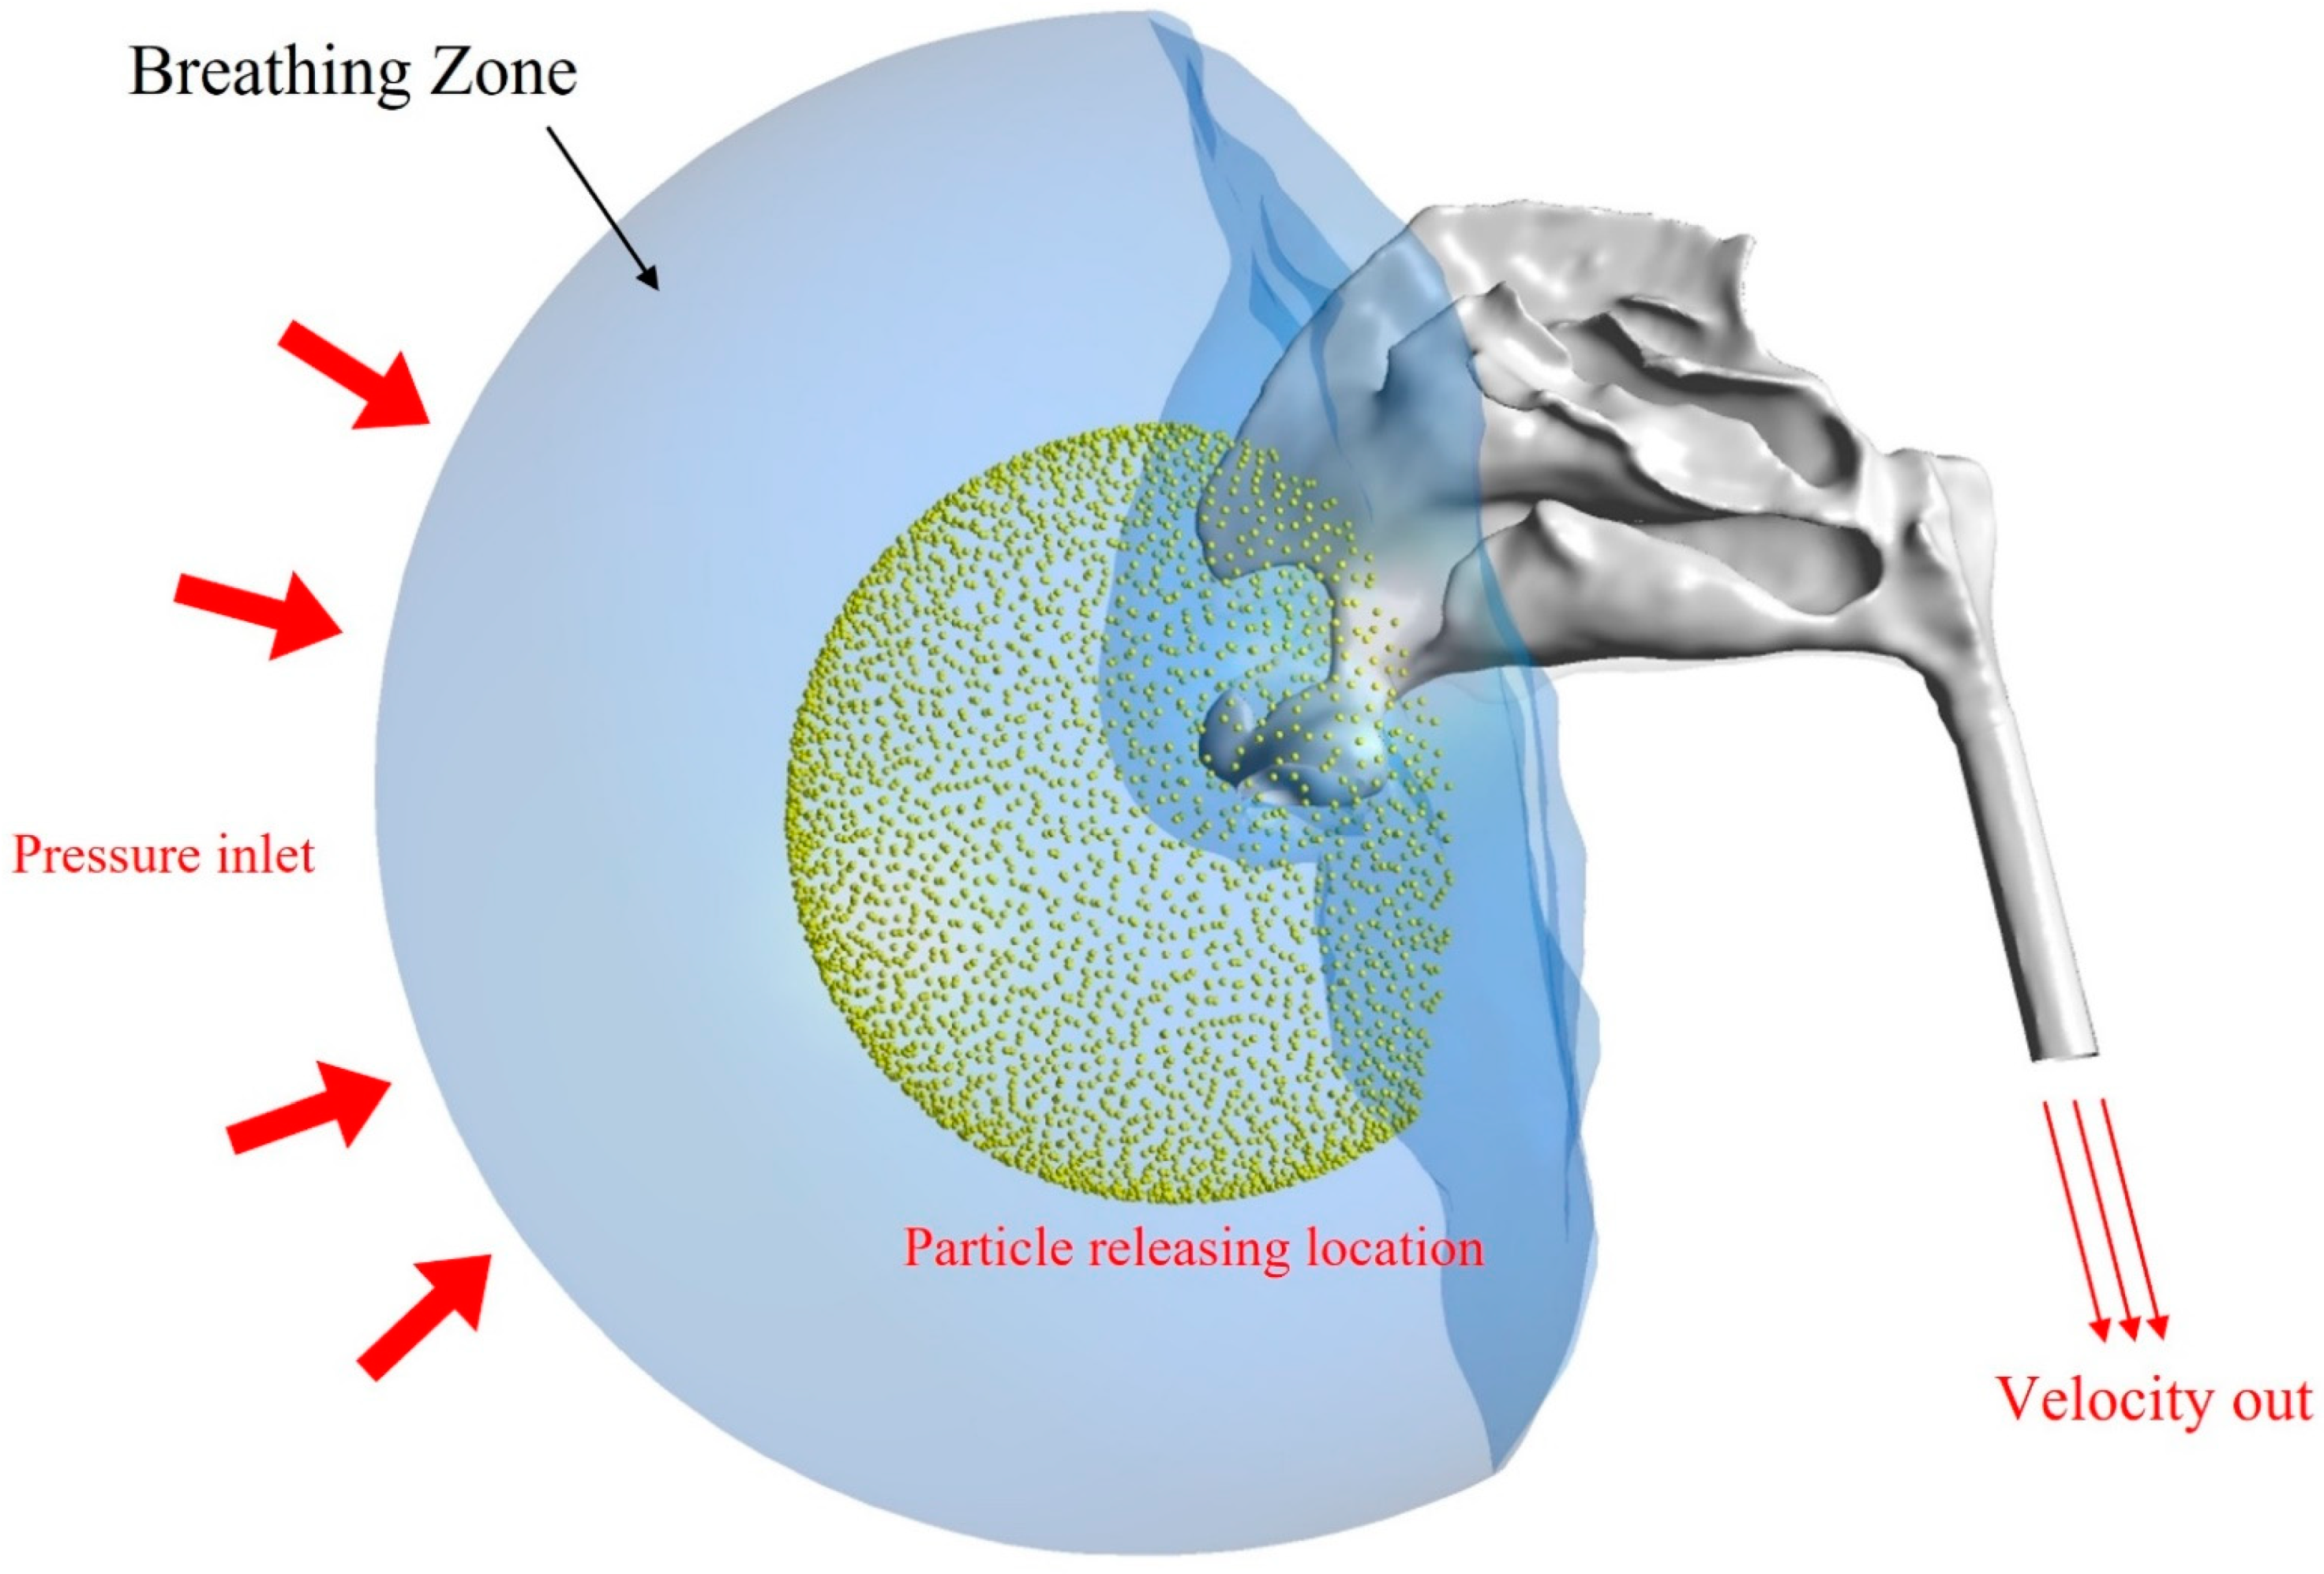
2.2. Particle Simulation

After fluid field was simulated, 10,000 nanoparticles (with diameters of 1, 1.1, 1.2, 1.5, 1.7, 2, 5, 7, 10, 15, 30, 50 and 100 nm) were passively released from a spherical location with the centre at the middle of nose tip (Figure 1). In order to capture a smooth profile variation pattern of the nasal airway deposition efficiency, besides integer size values, more data points, such as 1.1, 1.2, 1.5 and 1.7 nm, were created as this size range experiences dramatic deposition efficiency value changes due to the variation of diffusion effect.
The Lagrangian discrete phase model (DPM) was employed for independent particle trajectories prediction, which involving drag force, Brownian force and gravity:
d u P d t = F D + F G + F B
where u P is the particles velocity, and F D is the drag force per unit particle mass, described as:
F D = 18 μ ( u P u ) C c d P 2 ρ P
where u is the gas flow velocity, μ is the air viscosity, d P is the particle diameter, ρ P is the particle density and C c is the Cunningham correction factor, given by:
C c = 1 + 2 λ d P ( 1.257 + 0.4 e ( 1.1 d P 2 λ ) )
where λ is the molecular mean free path defined as 65 in the present work. Brownian force F B is given by ξ ( ( π S o ) / Δ t ) . ξ is a zero mean, unit variance independent Gaussian random numbers and S o should be explained by the function:
S o = 216 v k T π 2 ρ d 5 ( ρ P ρ ) 2 C c
where v represents fluid viscosity, k is the Boltzmann constant and T is the Kelvin temperature of inhaled air in this case.
Particle deposition efficiency (DE) is an important factor that quantitatively describes the nanoparticle uptake in the nasal cavity. It is defined as
DE = # paticles   deposited   # particles   entering   the   nasal   cavity

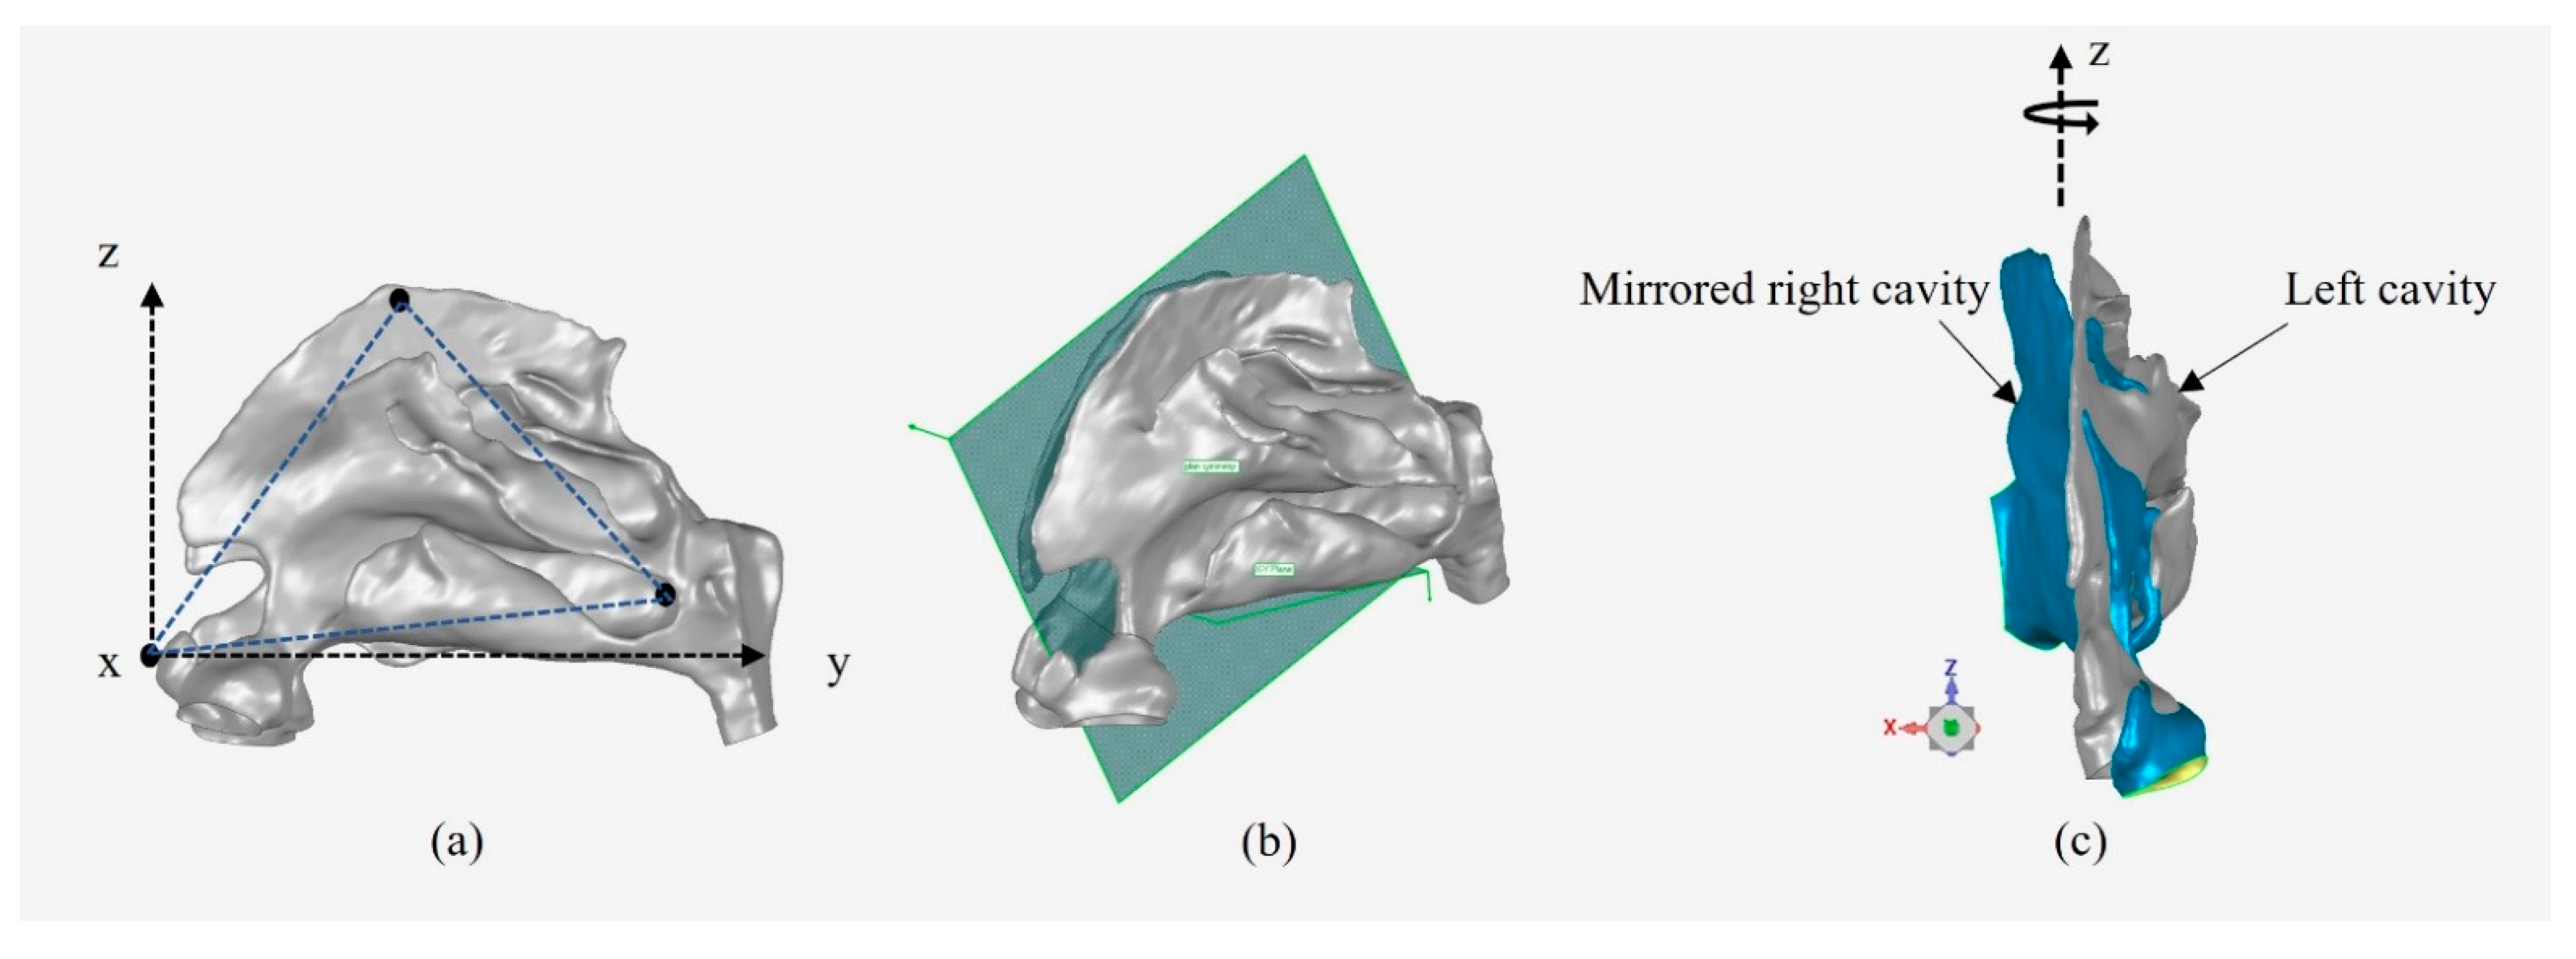
2.3. Alignment Method for Inter-Chamber Anatomical Comparison

In this study, special efforts were focused on the anatomical differences between chamber specific local regions (Figure 3). One side of the nasal chamber was mirrored and aligned to the other side nasal chamber to quantify the asymmetry and analyse geometry deviation. A mirror-and-alignment procedure was defined to achieve accurate quantification of inter-chamber anatomical differences.
The first step was constraining the nasal cavity to a sufficient 3D Coordinate system which including x-y-z origin and three independent rotation angles. In nasal related research, topics such as respiratory flow dynamics, movement of mucous blanket and drug deliver were most concentrated, where gravity is a major factor that cannot be ignored. Thus, the X-Y plane was determined by fitting the virtual plane based on the bottom edge of the inferior turbinate on both sides. This follows the general position of the human body in the natural breathing state, which provides a more rigorous simulation environment to take gravity into consideration. The next part was to find the symmetry plane based on its anatomical structure. The nasal cavity was leaded into two airway passages by septum wall which was mainly supported by cartilaginous section, vomer bone and the perpendicular plate of the ethmoid bone. Three points were picked containing the tip of nose (regarded as the beginning of the septum wall), the top point of the perpendicular plate of the ethmoid bone and the midpoint of the intersection of the septum and the nasopharyngeal airway. This approach aims to take the bony section and the cartilaginous section into consideration, following the physiological structure of the nasal septum and objectively reflecting the septum deviation. The tip of the nose was regulated as the origin point, and then the physical measurement coordinates (six spatial degrees of freedom) and the symmetry plane were constrained.
Then the right chamber was mirrored about the symmetry plane, after which the second step started to align the two chambers for deviation analysis. In this study, inter-chamber deviation was measured for the lateral wall and septum wall, respectively. Septum deviation was analysed directly by the mirrored right chamber and the left chamber. As for the deviation of the lateral wall, several steps were taken to correct the two lateral wall positions. This was done by keeping the X-Y orientation and rotation constrains and registers the beginning of right inferior turbinate bone to the left side, then rotating the right chamber about the Z direction until the maximum overlap choana region was achieved from the front view of the model. Finally, the alignment of local lateral wall regions between both chambers was obtained.

3. Results and Discussion

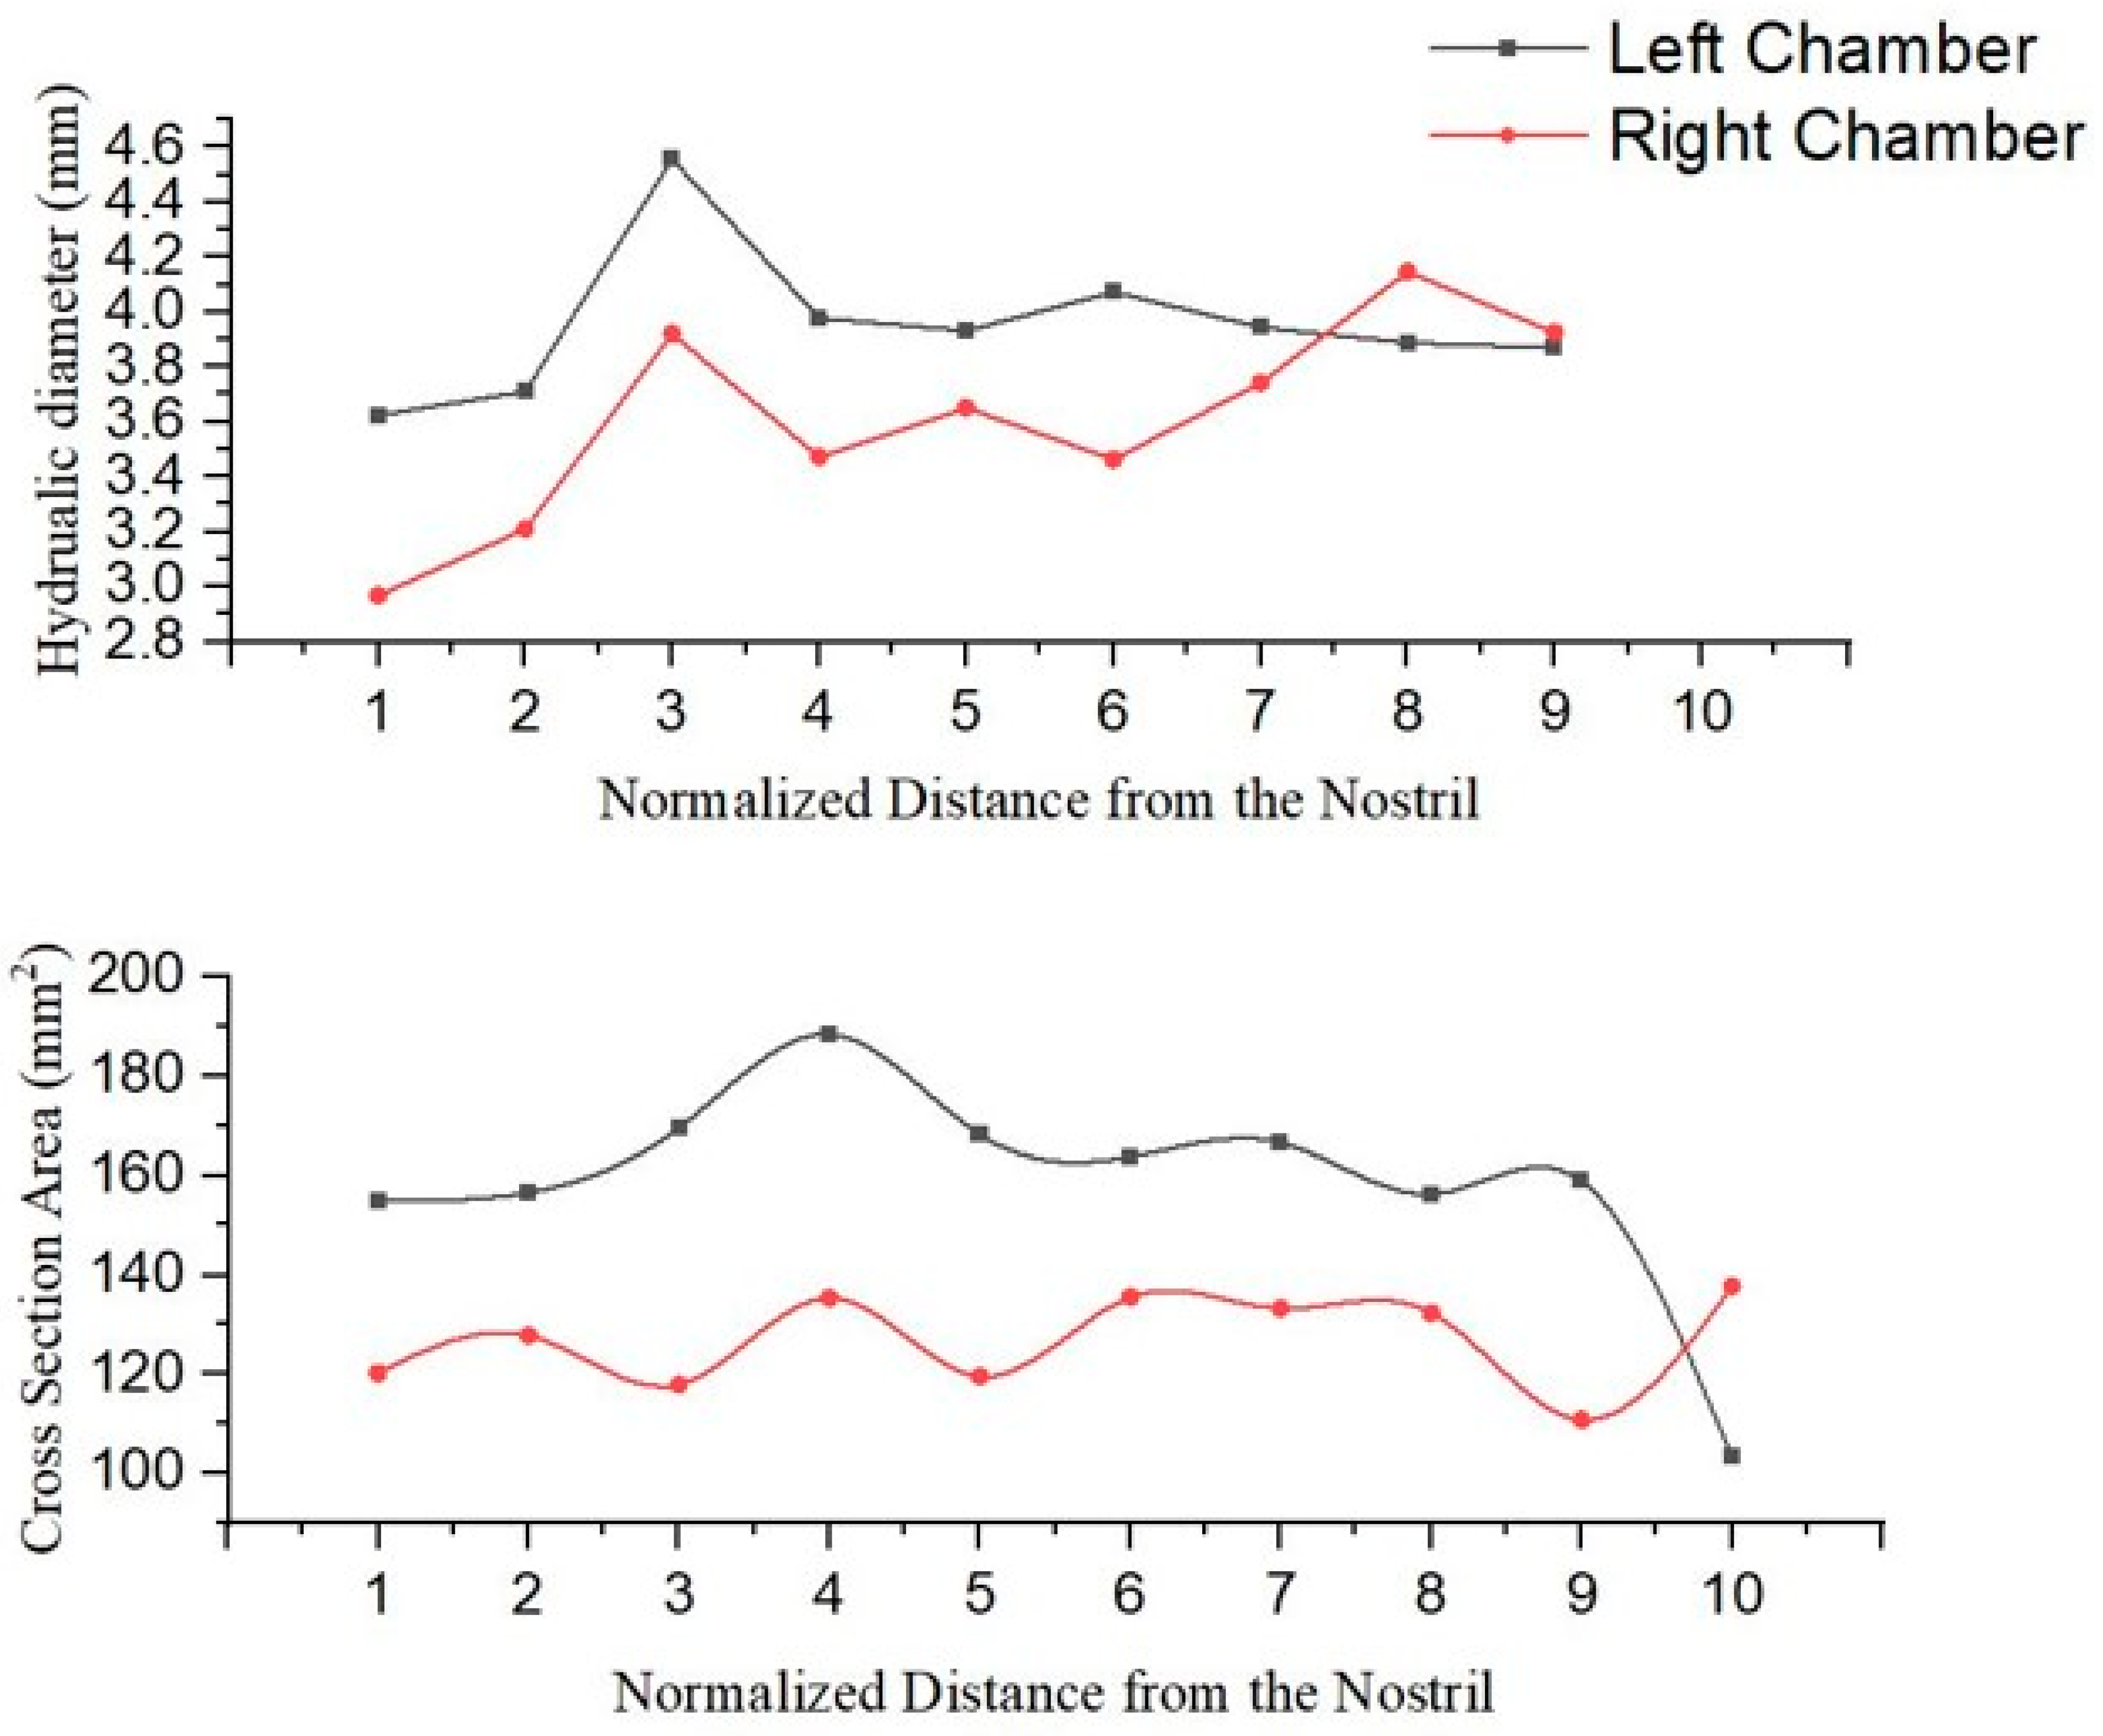
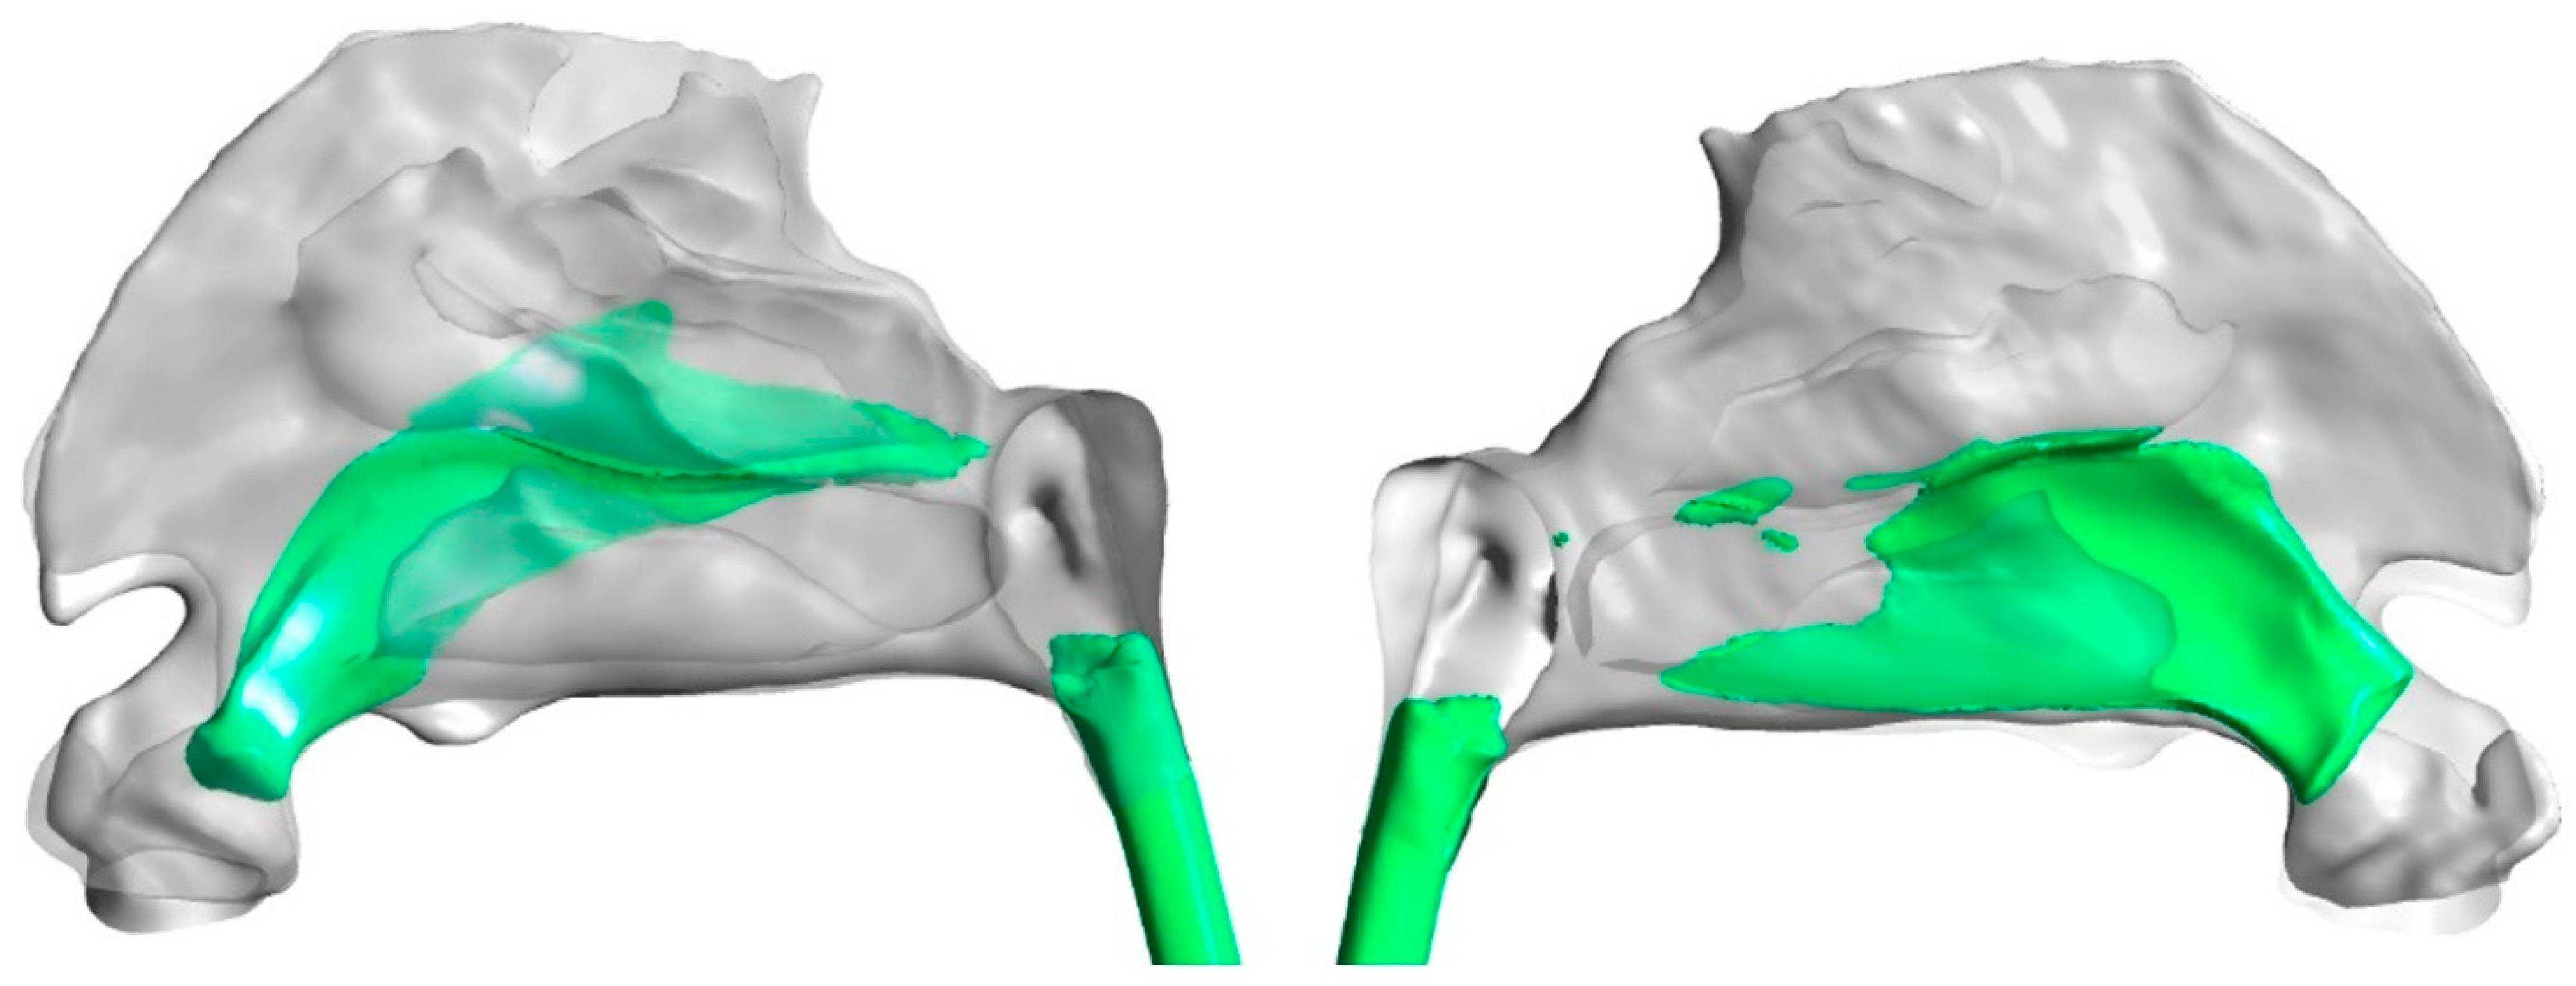
3.1. Anatomical Comparison

Table 1 shows the detailed data of nasal surface area, volume and surface to volume ratio. For this article, the geometry of nasal chambers was paid attention to, thus the surface area and volume were measured following the physiological structure. The nasal cavity was separated by the nasal septum wall and the two independent airways converged at the nasal pharynx region. Thus, the anatomical measurements started from the nostril and lasted until the pharynx region began. From Table 1, the left chamber has a larger surface area of 100.45 cm2, which is 8.6% larger than the right chamber. The left chamber volume is 10.44 cm3 while the right volume is 9.36 cm3 (11.54% smaller than the left). For further comparison of inter-chamber anatomical difference, surface to volume ratio (which describes the interface morphology per unit volume) was used to reflect the anatomical complexity of each chamber. Results showed that both nasal chambers exhibited high-level complexity in terms of morphology and structure with a surface to volume ratio around 9 to 10. The disparity is mainly attributed to the curly turbinate, which further supported the necessity of evaluating detailed flow apportionment in each side of the nasal chamber.
Cross section area and hydraulic diameter were also measured as a function of the distance from the nostril in Figure 4 for quantitative comparison of airway dimensions. Compared to the right cavity, the nasal patency of the left cavity changes drastically, being wider at the front part and sharply narrowed at the end. The hydraulic diameter is used to evaluate the patency of the left and right nasal cavity by equating an irregular airway to a pipe with uniformly distributed shear stress. The left passage exhibits a larger hydraulic diameter until the end of the airway, which indicates the presence of considerable inter-chamber difference along the airway that needs further detailed analysis.

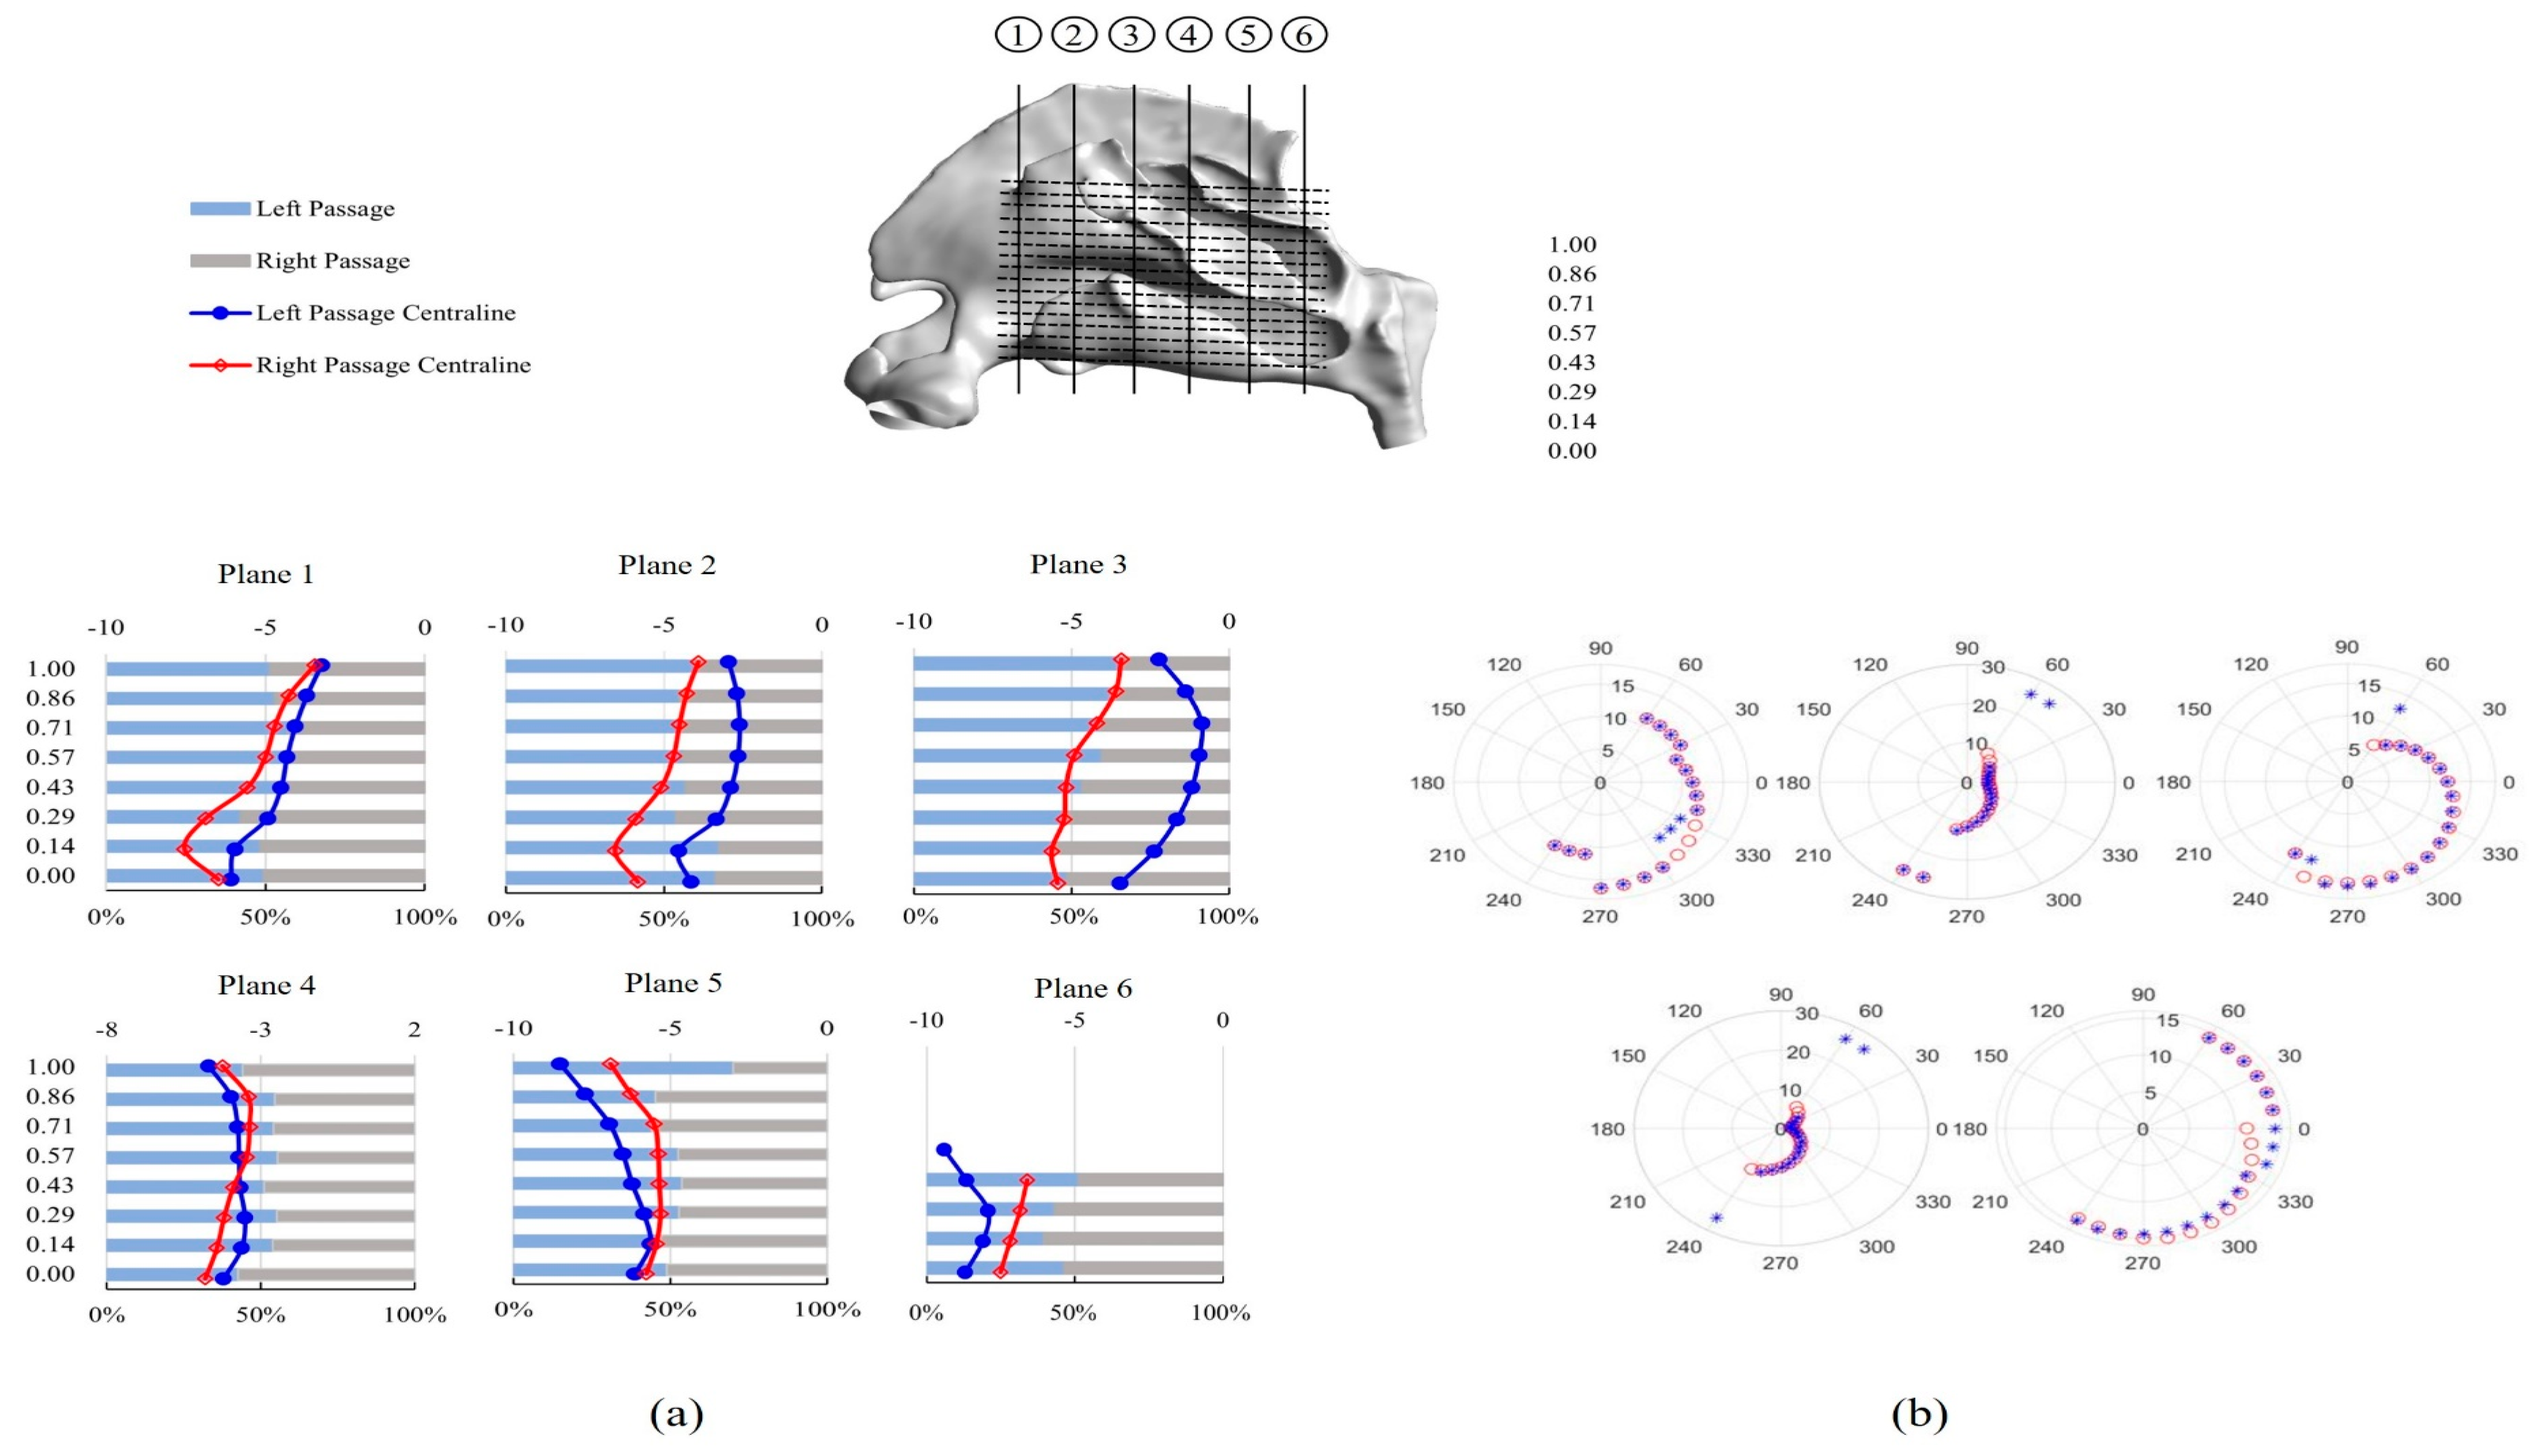
3.2. Inter-Chamber Variability Analysis

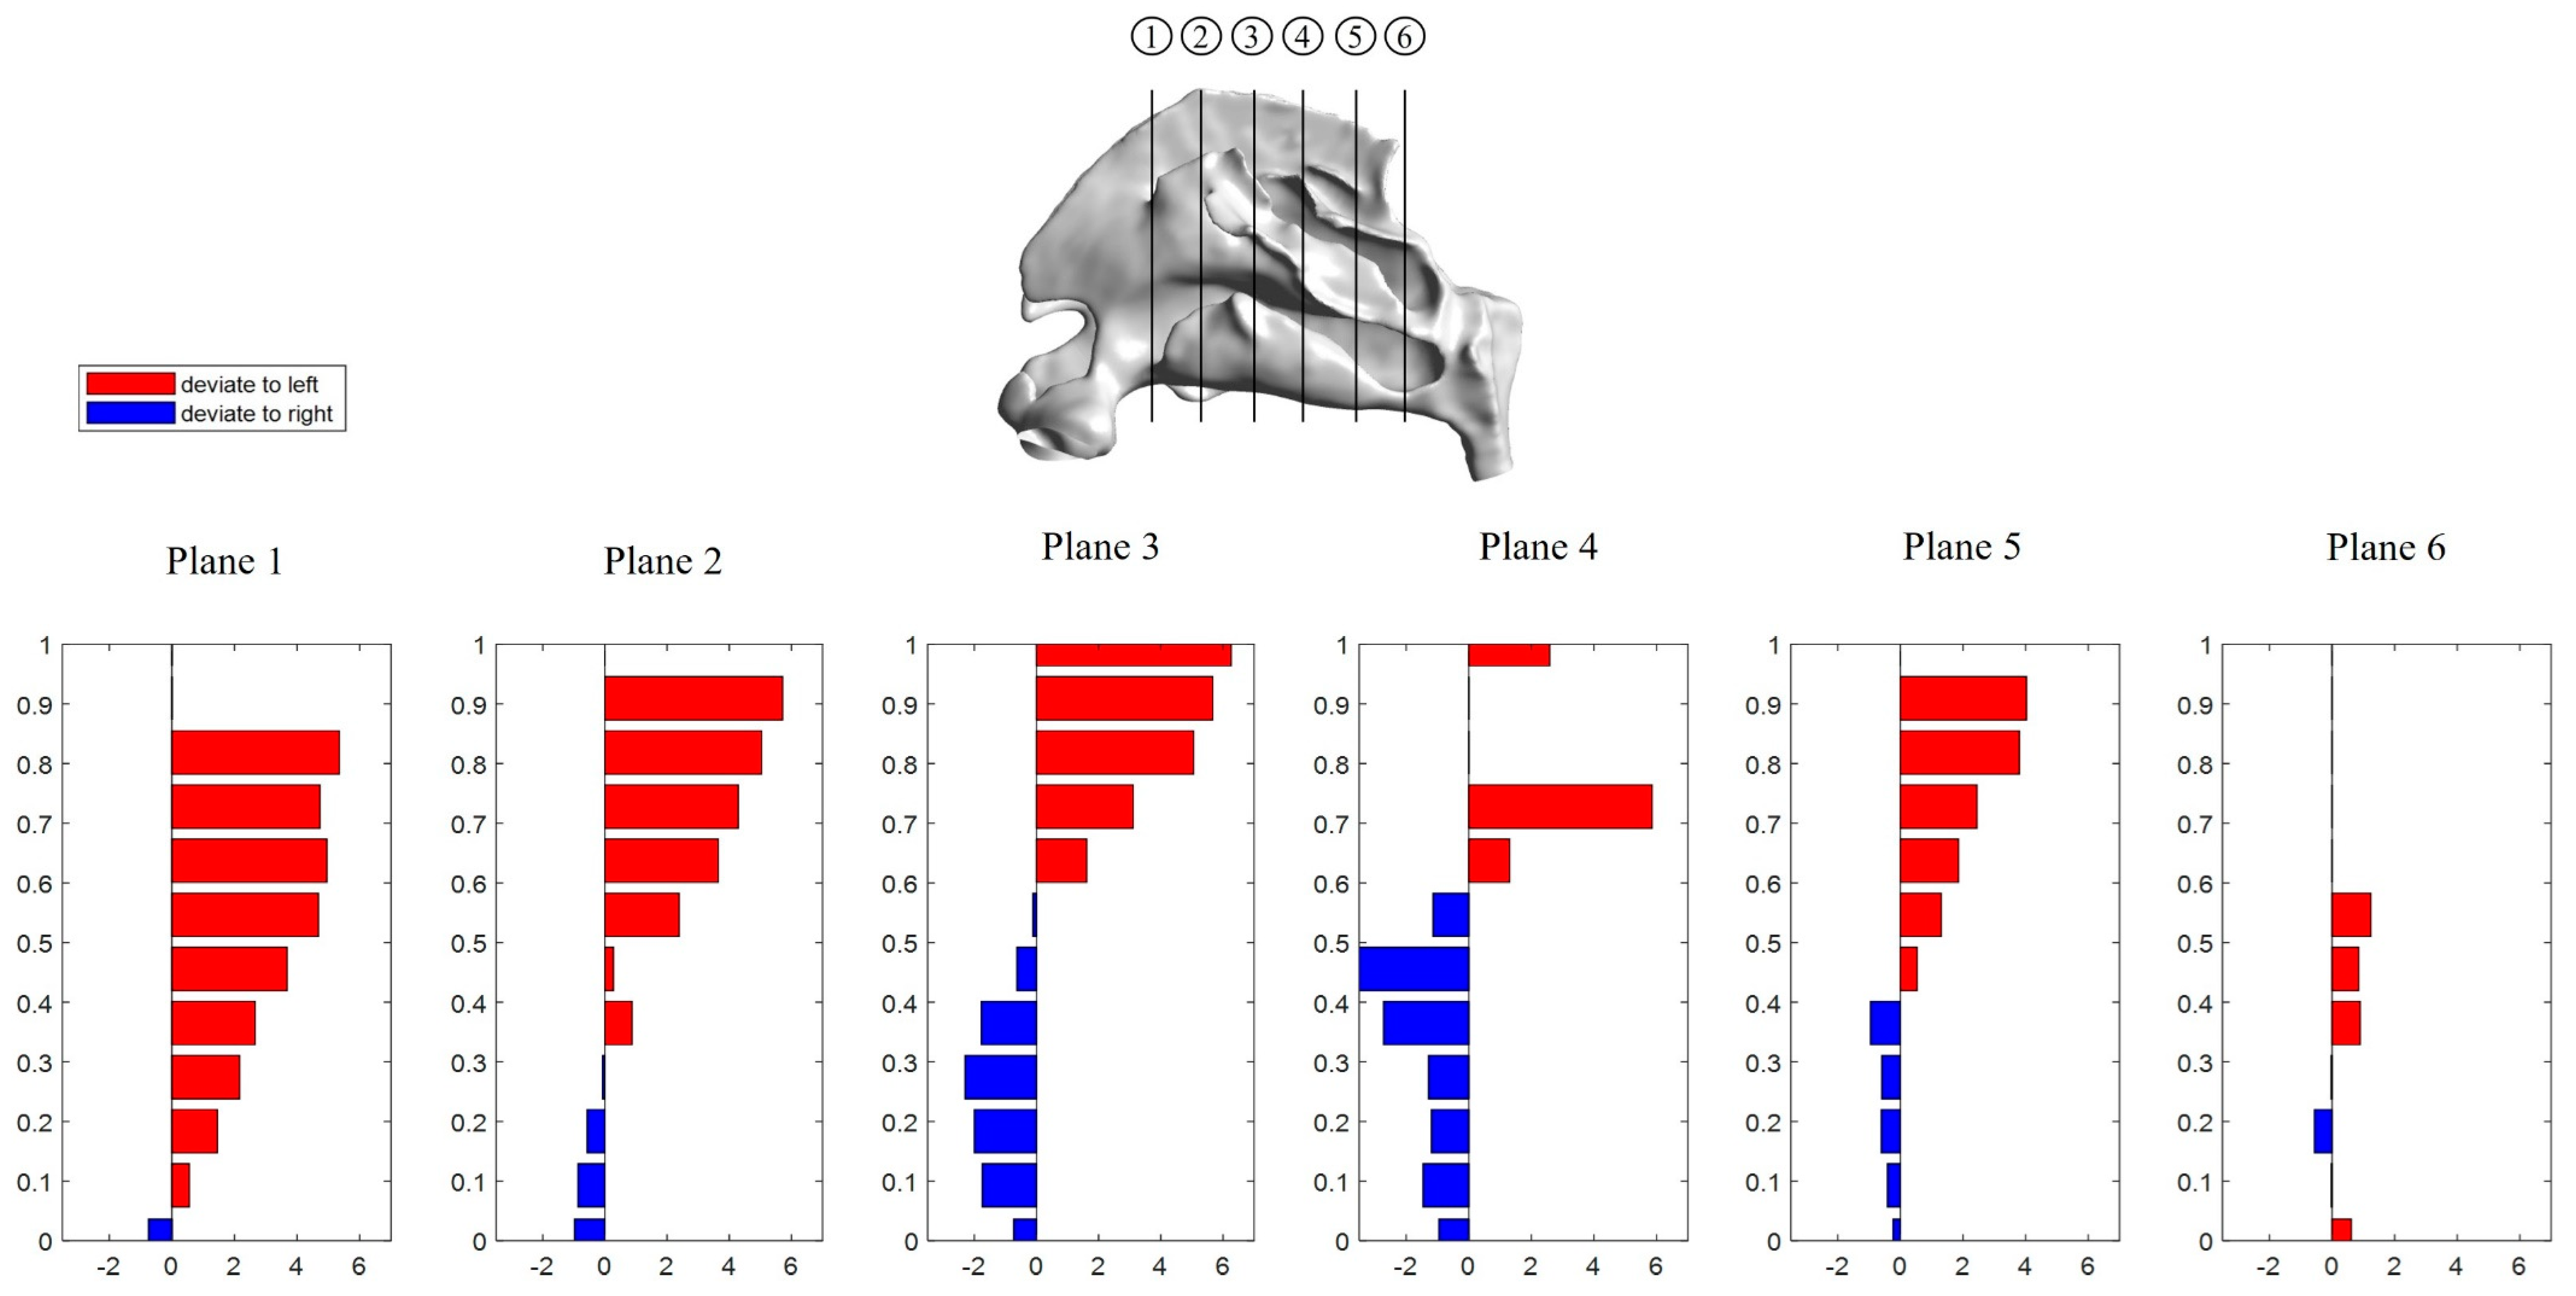
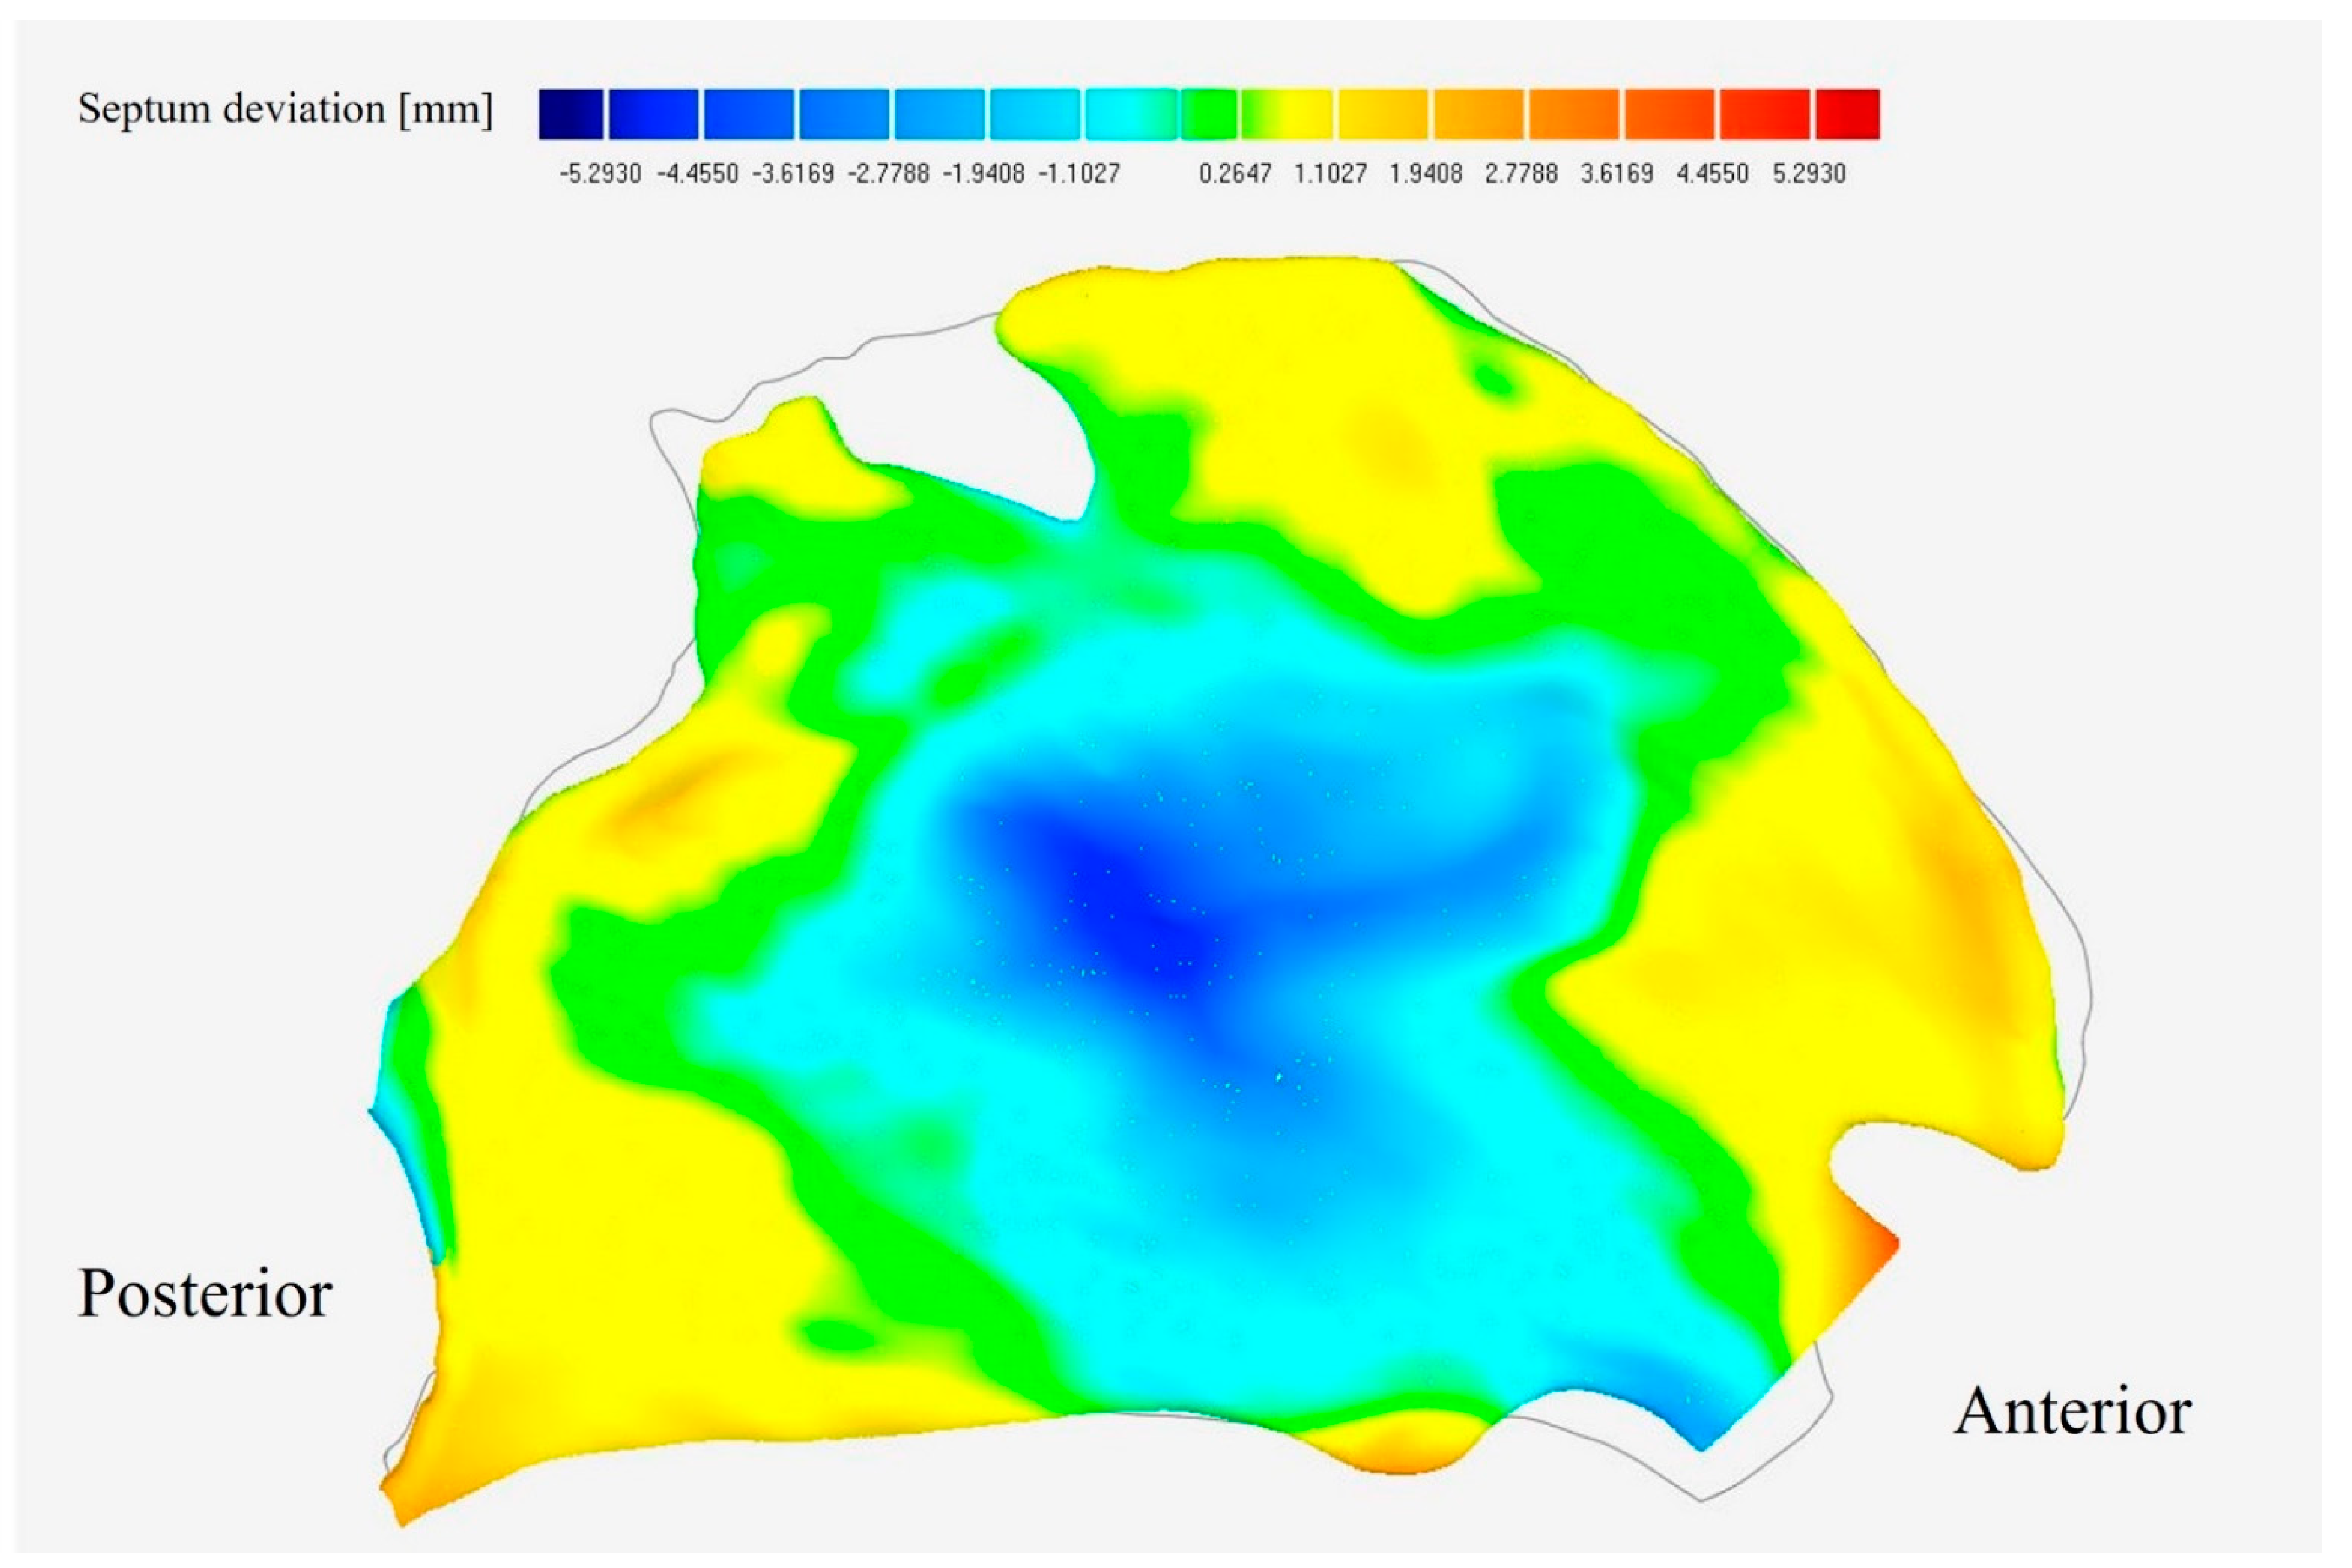
3.2.1. Septum Deviation

Septum deviation is commonly observed in the general population, and has a significant effect on nasal airway patency and breathing health. The septum deviation was directly reflected by the colour map (Figure 5). In general, the nasal septum wall in the right chamber was offset to the left at the main nasal passage region since a large blue area was observed in the middle of the figure. It is noticed that the maximum positive deviation of 4.09 mm appeared immediately behind the nasal vestibule due to the presence of contracted nasal valve in the left nasal chamber. In addition, the minimum negative deviation of 3.7 mm occurred at the middle part, consistent with the overall septum morphological characteristics.
In order to assess the degree of inter-chamber symmetry, six planes along the nasal passage perpendicular to the airflow direction were taken for the inter-chamber coincidence analysis (Figure 6). The surface shape of the septal wall on the right is more similar to that on the left when the colour bar is smaller, from which perspective the inter-chamber variability almost exists along whole passage and is especially obvious at the front part. However, the direction of the septum deflection gradually changes, which means the degree of deflection to the left gradually declines from the dominant position to manifesting in the upper passage while the right-side deviation reaches the top at plane 3 and plane 4. A high degree of symmetry of the left and right septum walls was achieved at plane 6 where the two passages were ready to merge into the nasopharynx.

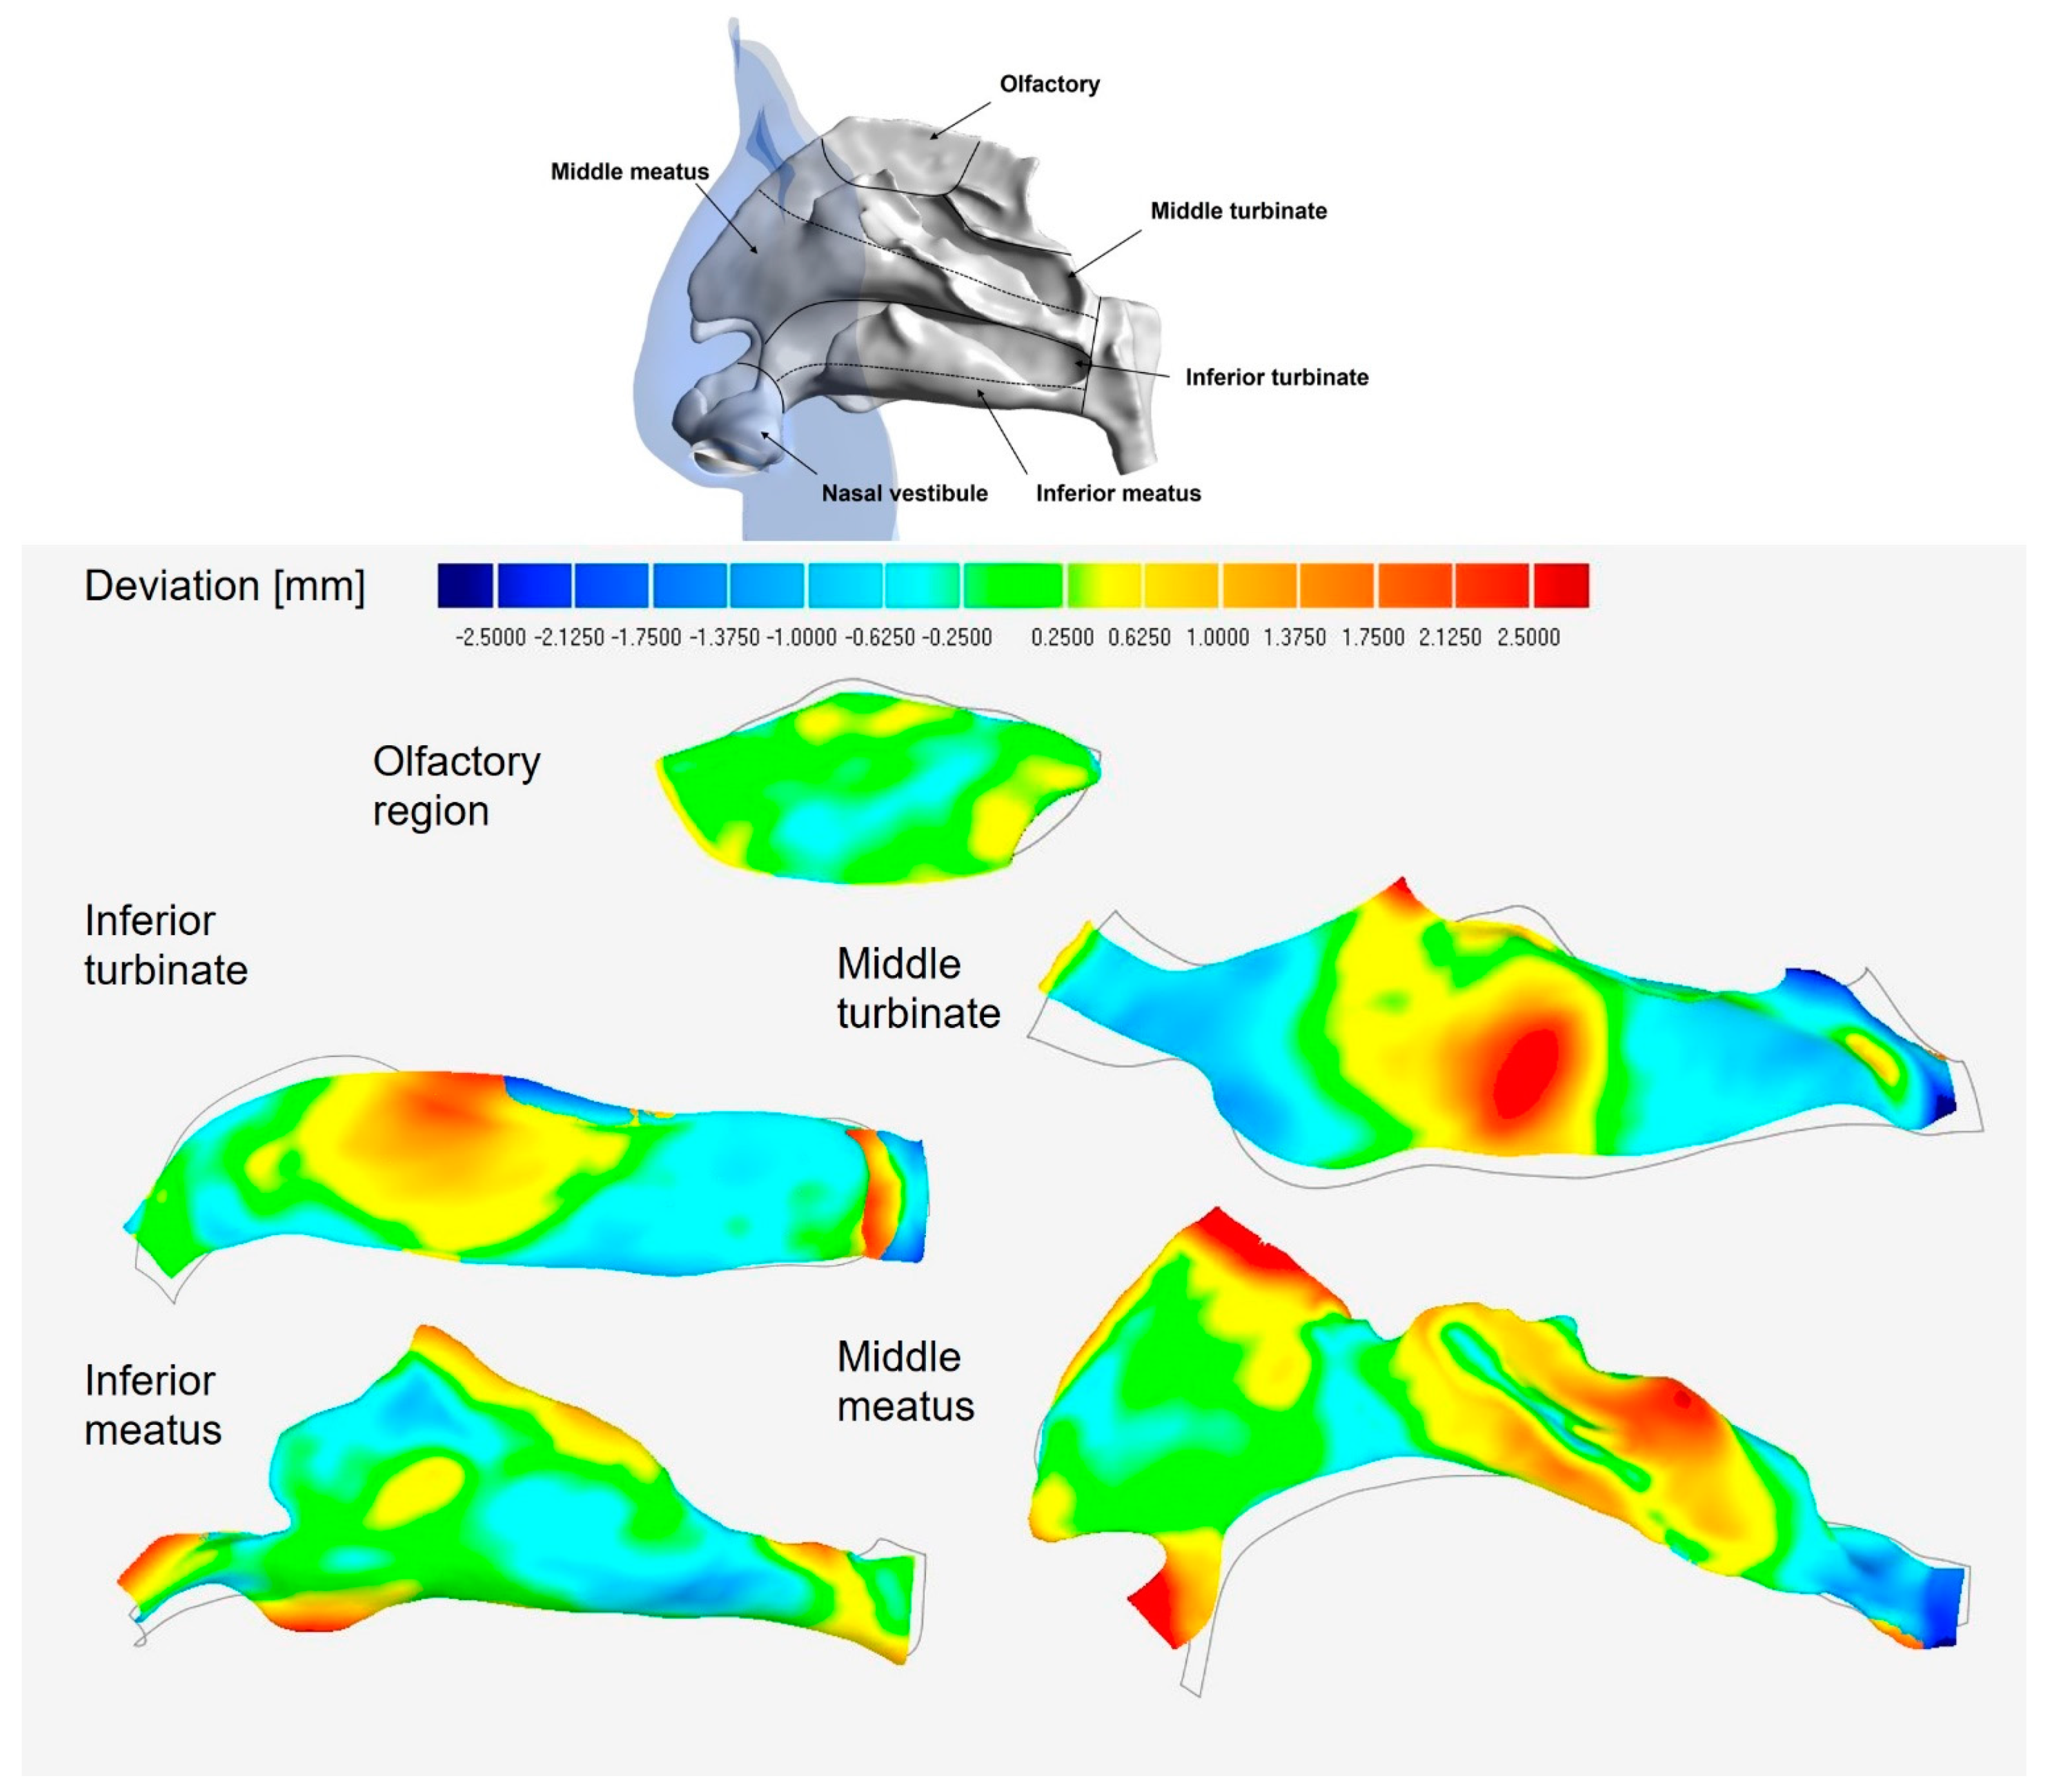
3.2.2. Lateral Wall Regional Deviation Analysis

In this section, local inter-chamber surface deviation for olfactory, middle turbinate, inferior turbinate, middle meatus and inferior meatus was analysed. These five sections divided from lateral nasal wall that enclosed by nasal turbinate bone, where the cavity curls outward to form a pathway to the sinuses. Figure 7 shows the degree of deviation of the right nasal cavity with reference to the left in the form of a colour map (blue means that the right side of the wall is more recessed to the side of the airway than the left side, while red is the opposite). Overall, considerable deviation is observed in several region, mainly in the middle and inferior turbinate regions. The maximum average deviation occurs in the middle turbinate region (0.98 mm) where a deep red mark appeared in the middle and blue coloured area located both in anterior and posterior. It proved that the right middle turbinate shrunk at the front and end while more surplus space was left in the middle section, which would suppress flow stream into lower passage. A very similar situation occurred in the inferior turbinate region, but the deviation was relatively gentle with average deviation of 0.94 mm. It is worth knowing that the maximum deviation of 3.08 mm was measured at the very end of the inferior passage due to the turbinate bone that protrudes toward the airway ending here. As for the meatus regions, the maximum deviation is presented by middle meatus, where three high values of asymmetry accumulated, including above the nasal valve, at edge of merge with olfactory and near the small passage that connects to the maxillary sinus. Among these accumulated areas, the greatest deviation above the nasal valve should be paid attention to because of the right expended nasal valve, while other area could be affected by the error of artificial partitioning. A slightly contracted region was distinguished at the posterior of the inferior meatus, which would restrict the airflow that tends to enter the posterior region. Among all the functional areas, the olfactory region showed the most moderate deviation with the smallest average deviation of 0.29, which means that region was not responsible for the inter-chamber variability. Detailed deviation data is summarised in Table 2.
Since considerable deviation contribution was observed in the middle passage and inferior meatus, airway patency was assessed as shown in Figure 8. The midlines of the middle airway were taken from six planes perpendicular to the flow direction, represented by the vertical broken line in Figure 8a, while the horizontal histogram shows the thickness of the airway. The left airway shows a wider passage at start while the situation changed at the middle of passage. Consistent with the previous analysis, the midlines in the central region hardly coincided since the middle septum and middle turbinate wall showed higher inter-chamber difference. Figure 8b shows the left and right midline of the inferior meatus in polar coordinates. Although the inter-airway morphology was slightly different, the degree of curling shows high similarity. The narrow slit with a high degree of curl is not conducive to the patency of airflow, which explains the low flow flux in that region.

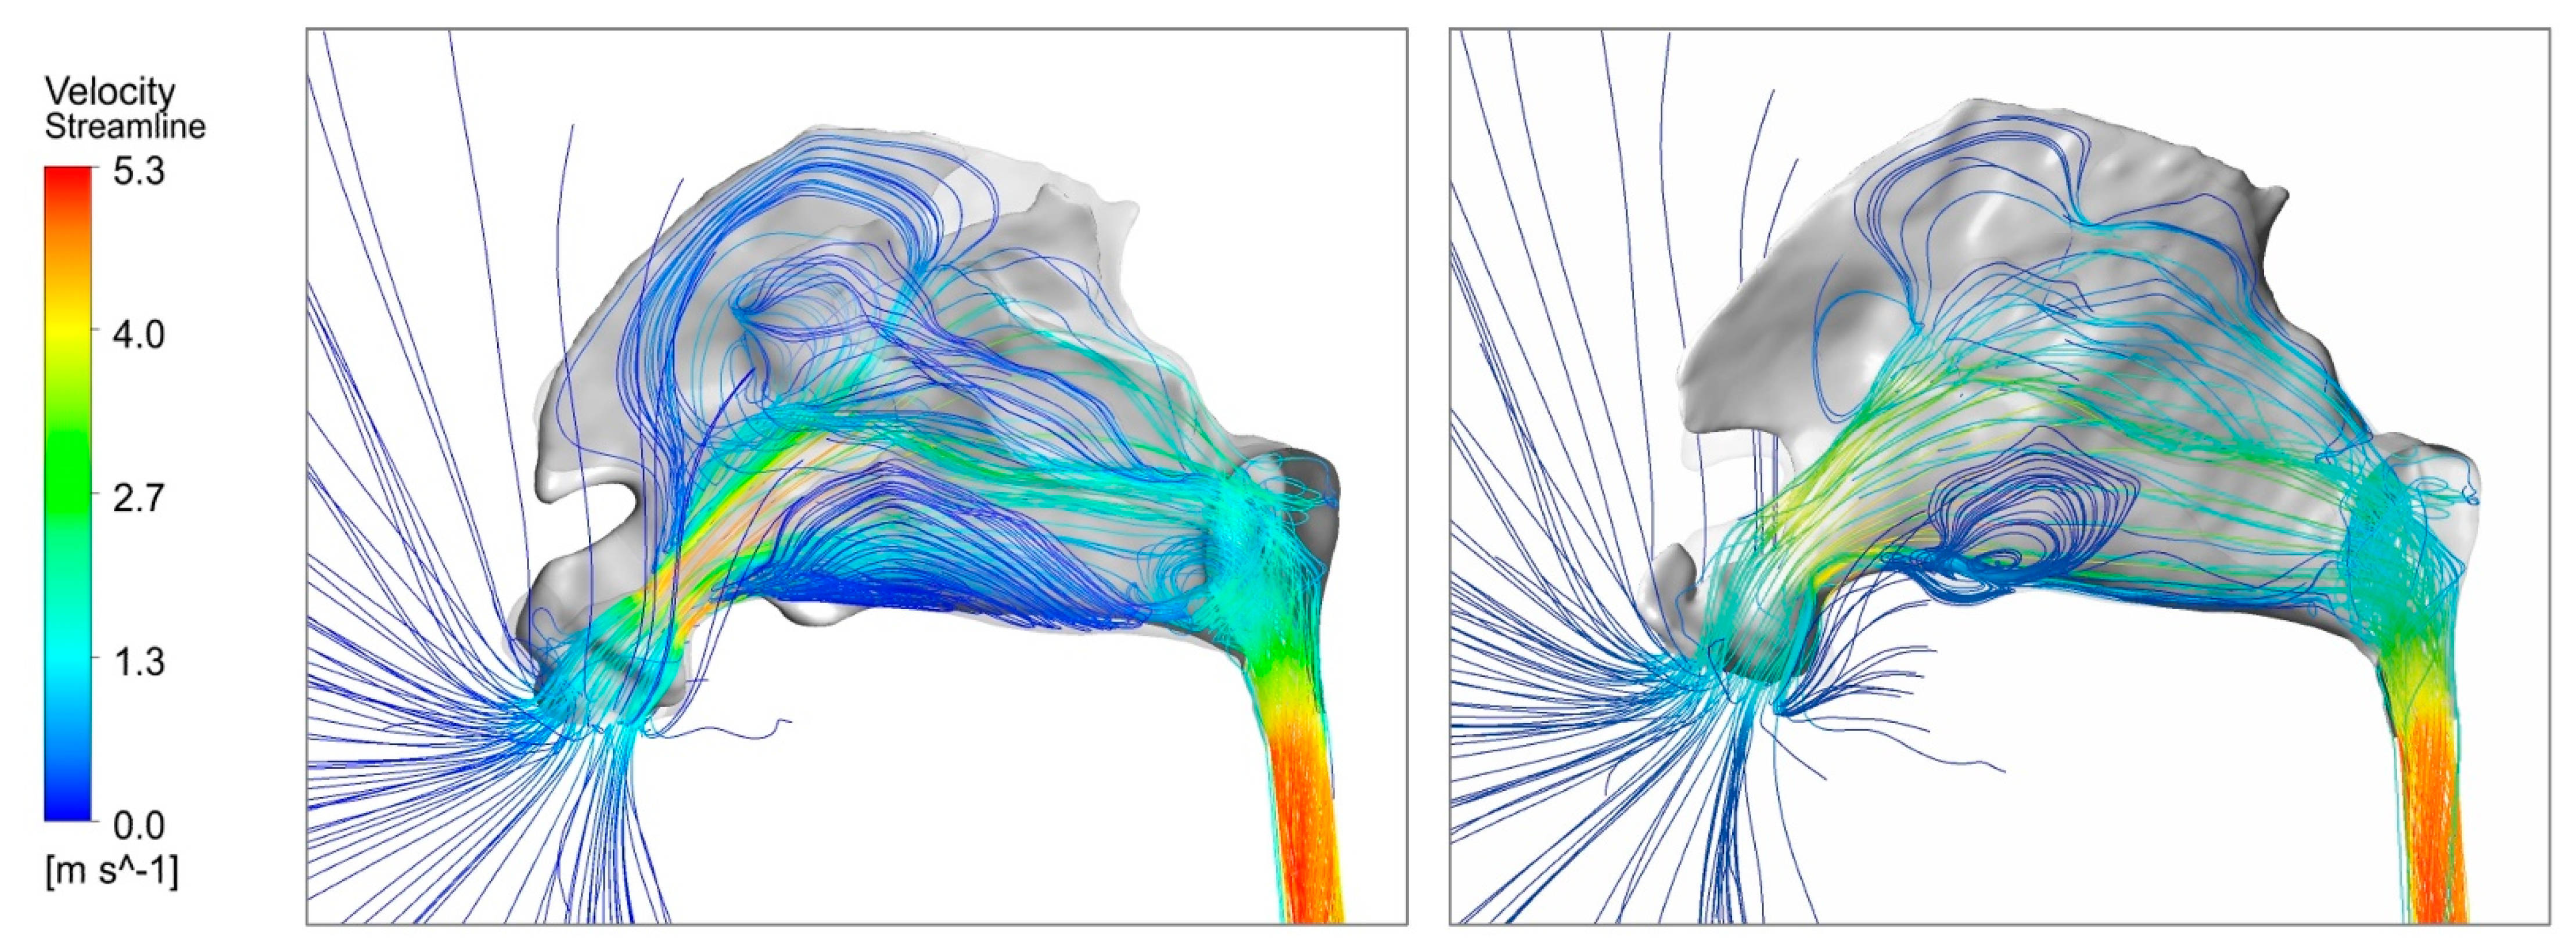
3.3. Airflow Dynamics

Moderate volume flow rate 15 L/min was simulated in this study to restore the streamline characteristics of the subject under steady breathing. Overall, airflow features conform to the anatomical characteristics and streamline patterns shown in Figure 9. Most of the inhaled flow was distributed in inferior and middle passage while very limited flow passed through the upper passage where the olfactory region located due to the narrow slit physiological structure. Relatively high-speed velocity was observed at the downstream of nasal valve and larynx region since the airway cross-sectional area narrowed. General flow features of the two chambers were similar whereas considerable inter-chamber variability was observed, which was consistent with the differences in morphological characteristics of local regions.
Compared to the right-side cavity, the left nasal valve provided a sharply shrink, resulting in flow jet straight into the middle passage (Figure 10). Thus, flow distribution in the left chamber prefers the middle passage, while the airflow in the right is more evenly distributed in the lower and middle region. A larger notch seated above the right vestibule that flow hardly reached the upper anterior region, leading to rare particle distribution here. It is noted that a flow recirculation was founded in the anterior of right inferior meatus slit while a steady streamline performed in the left, since the right inferior meatus had a narrower posterior.

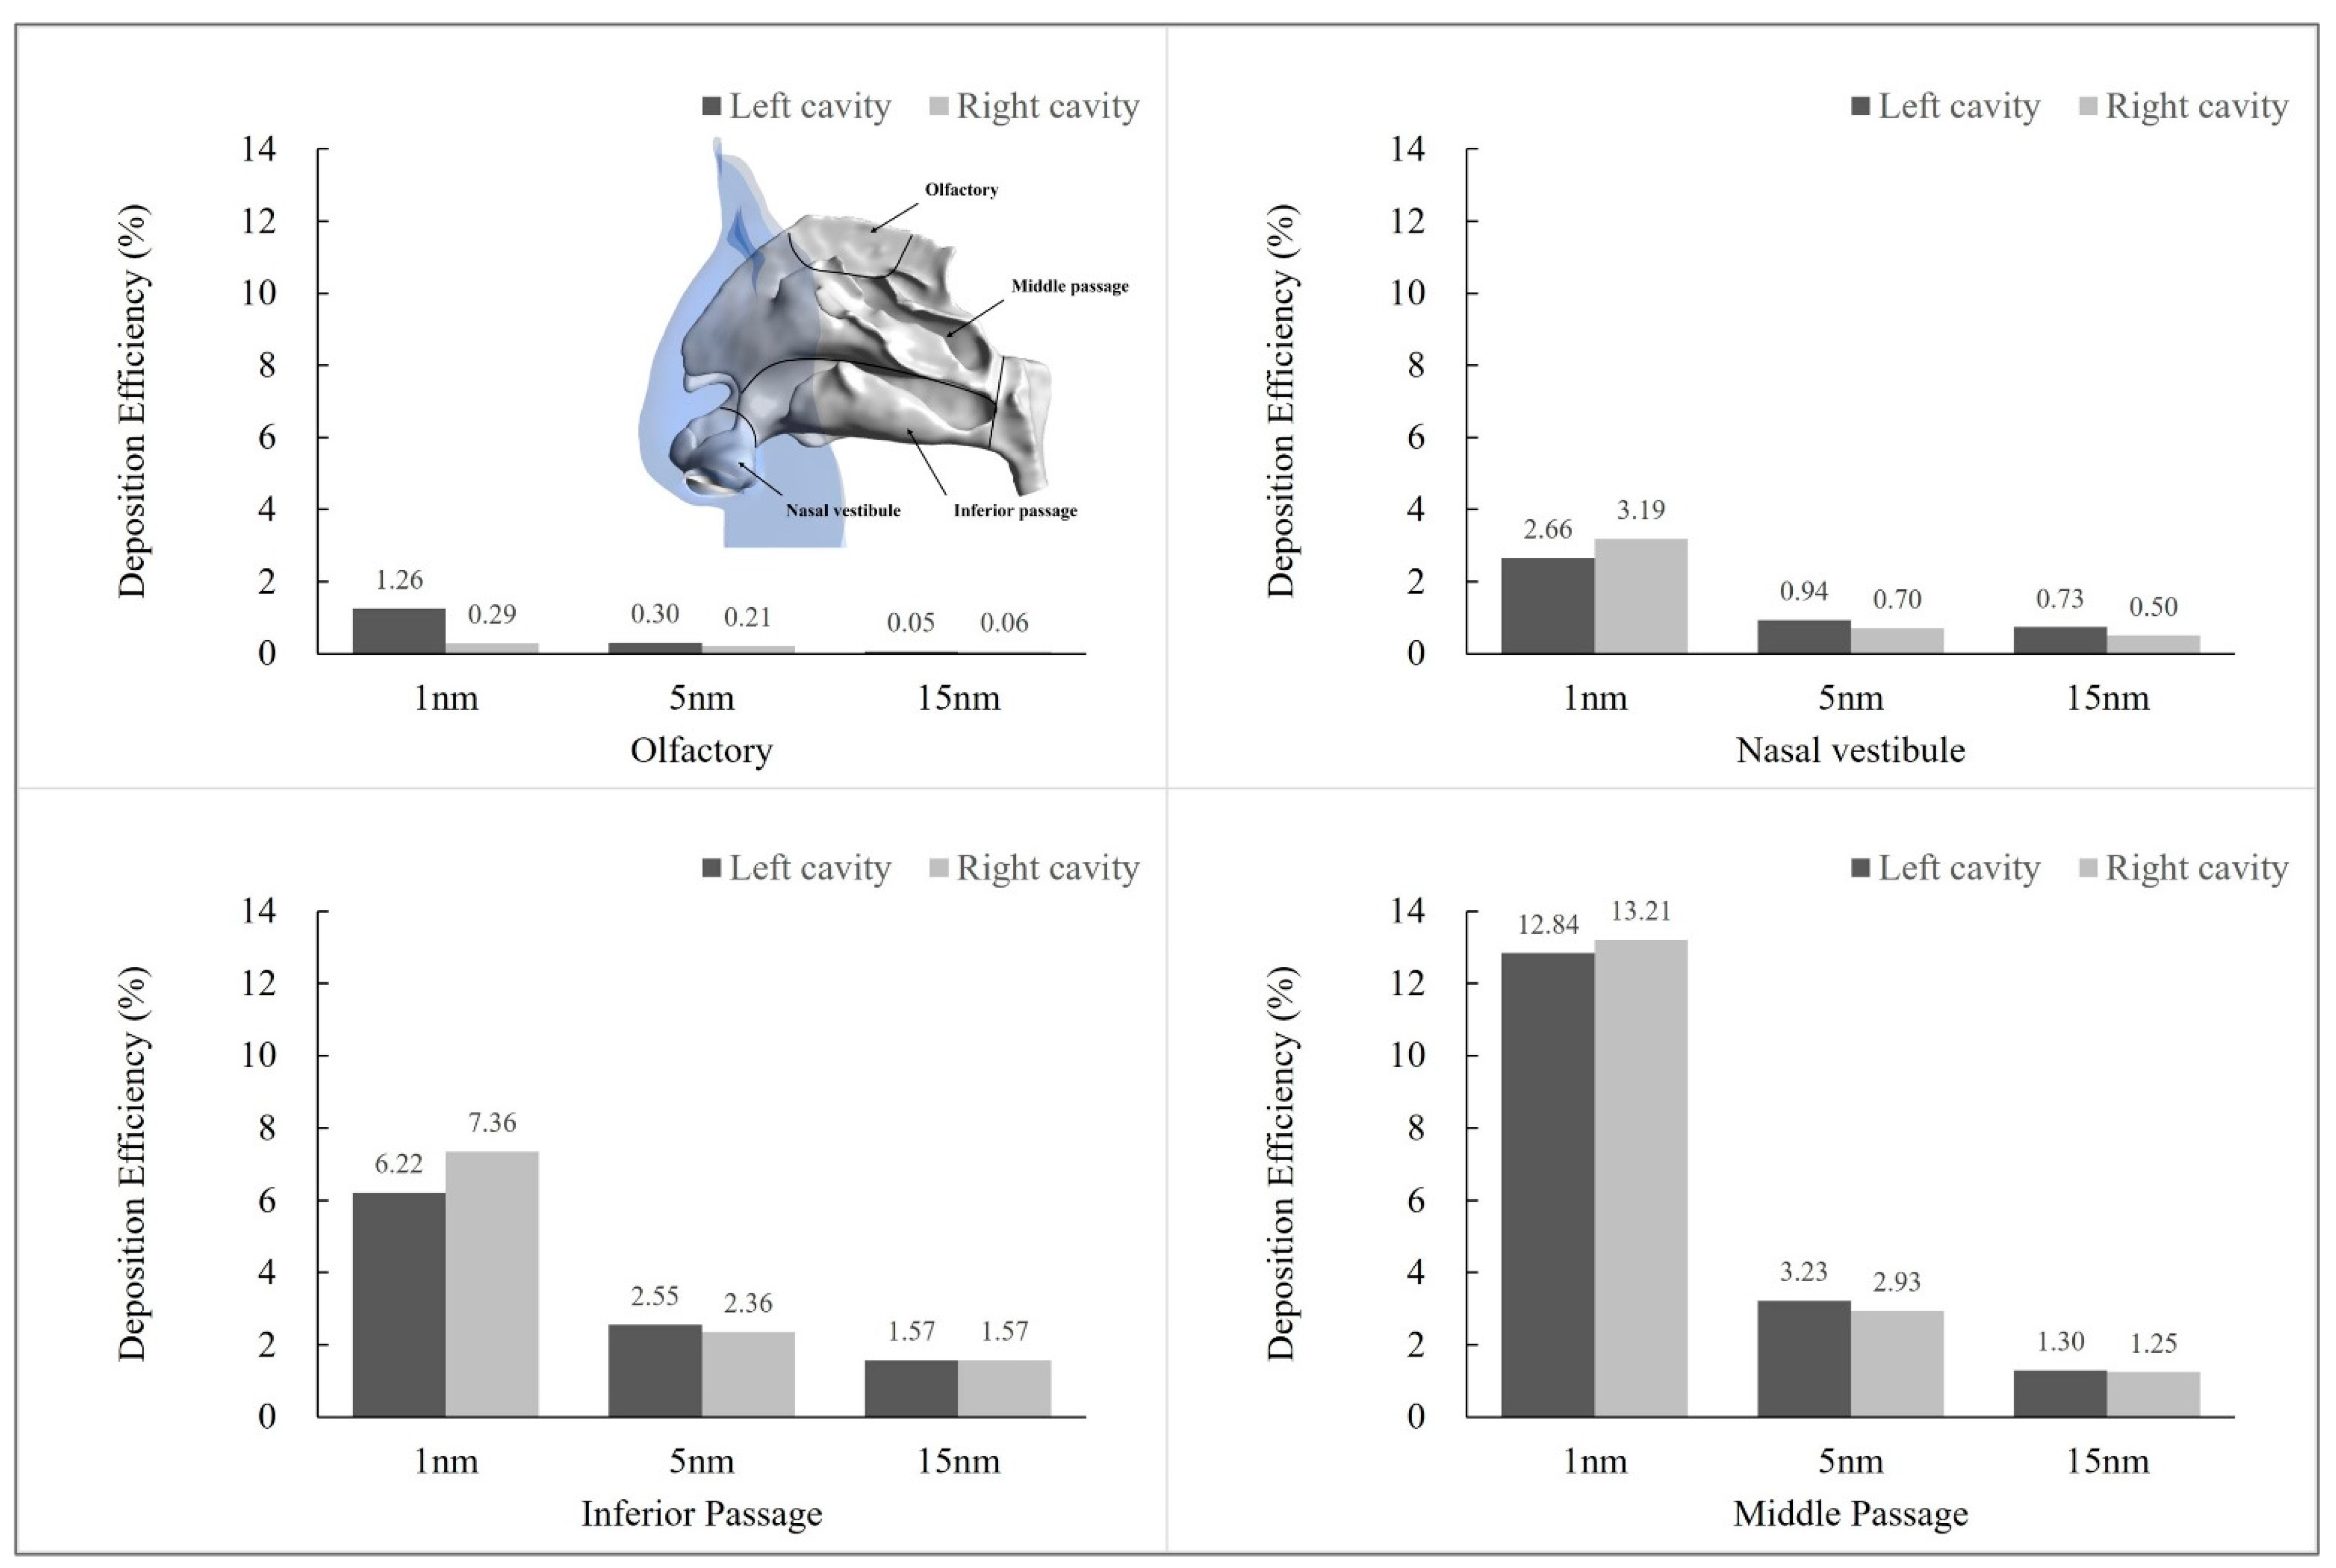
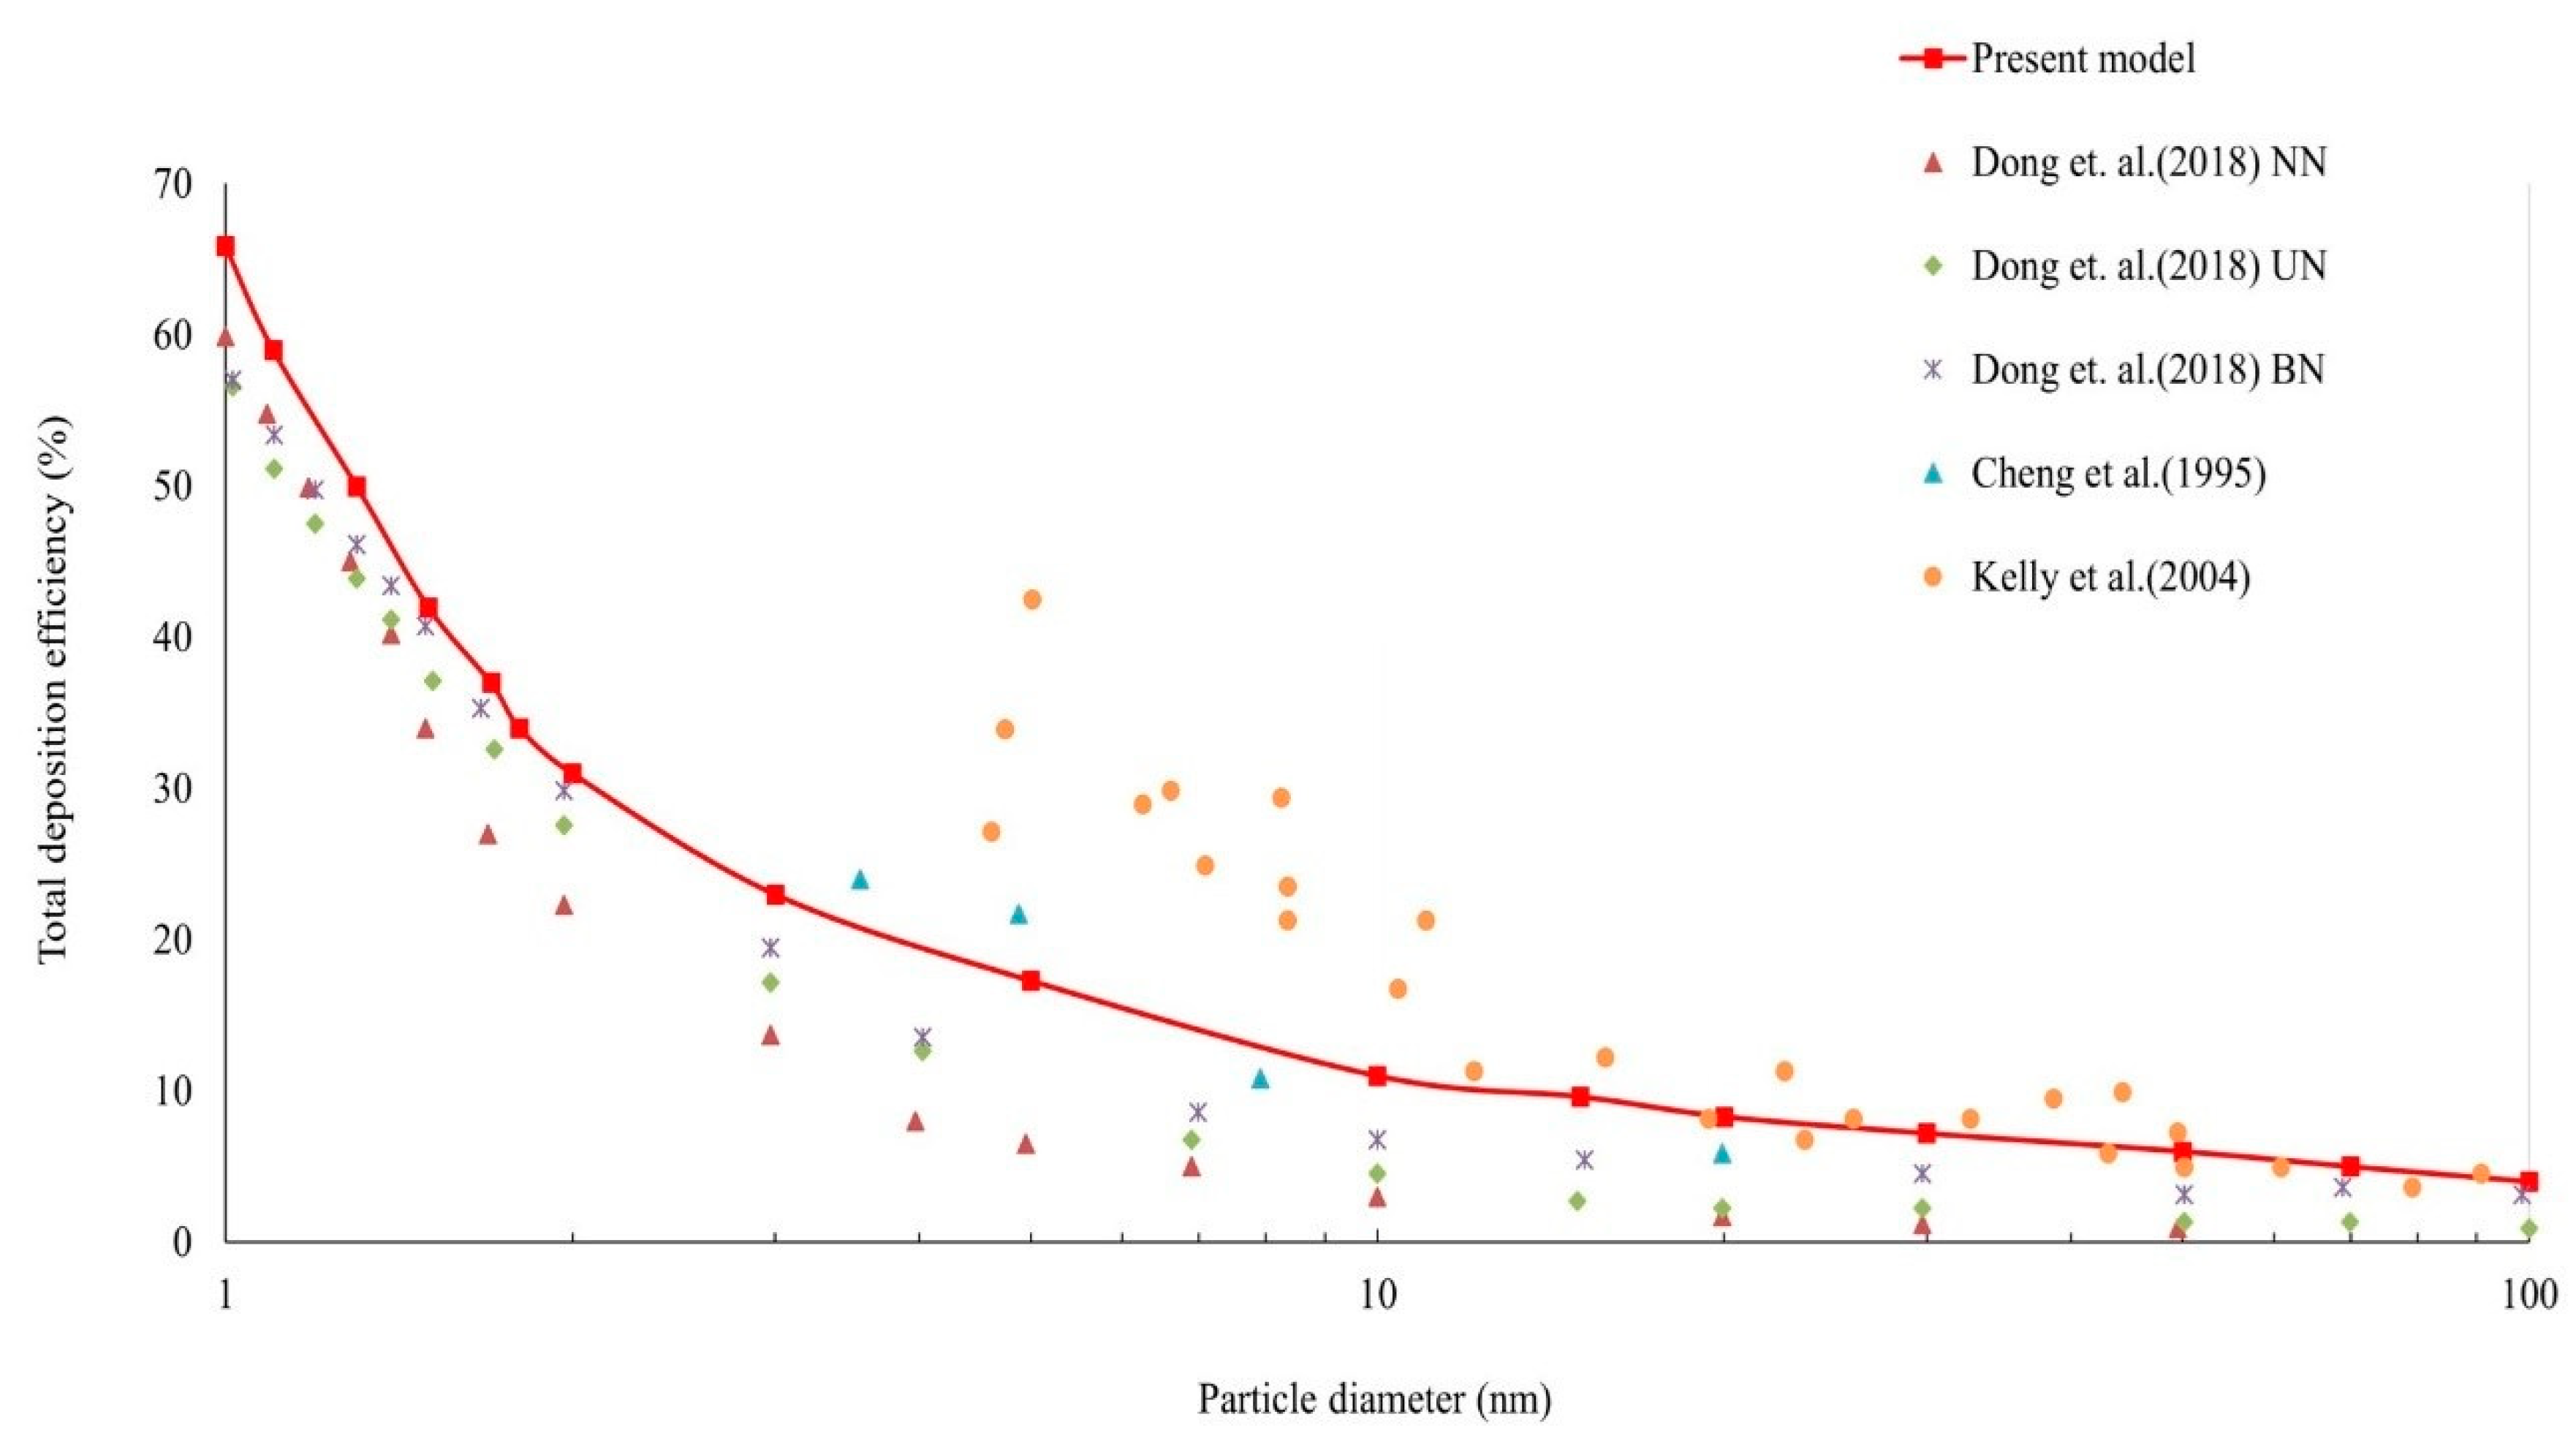
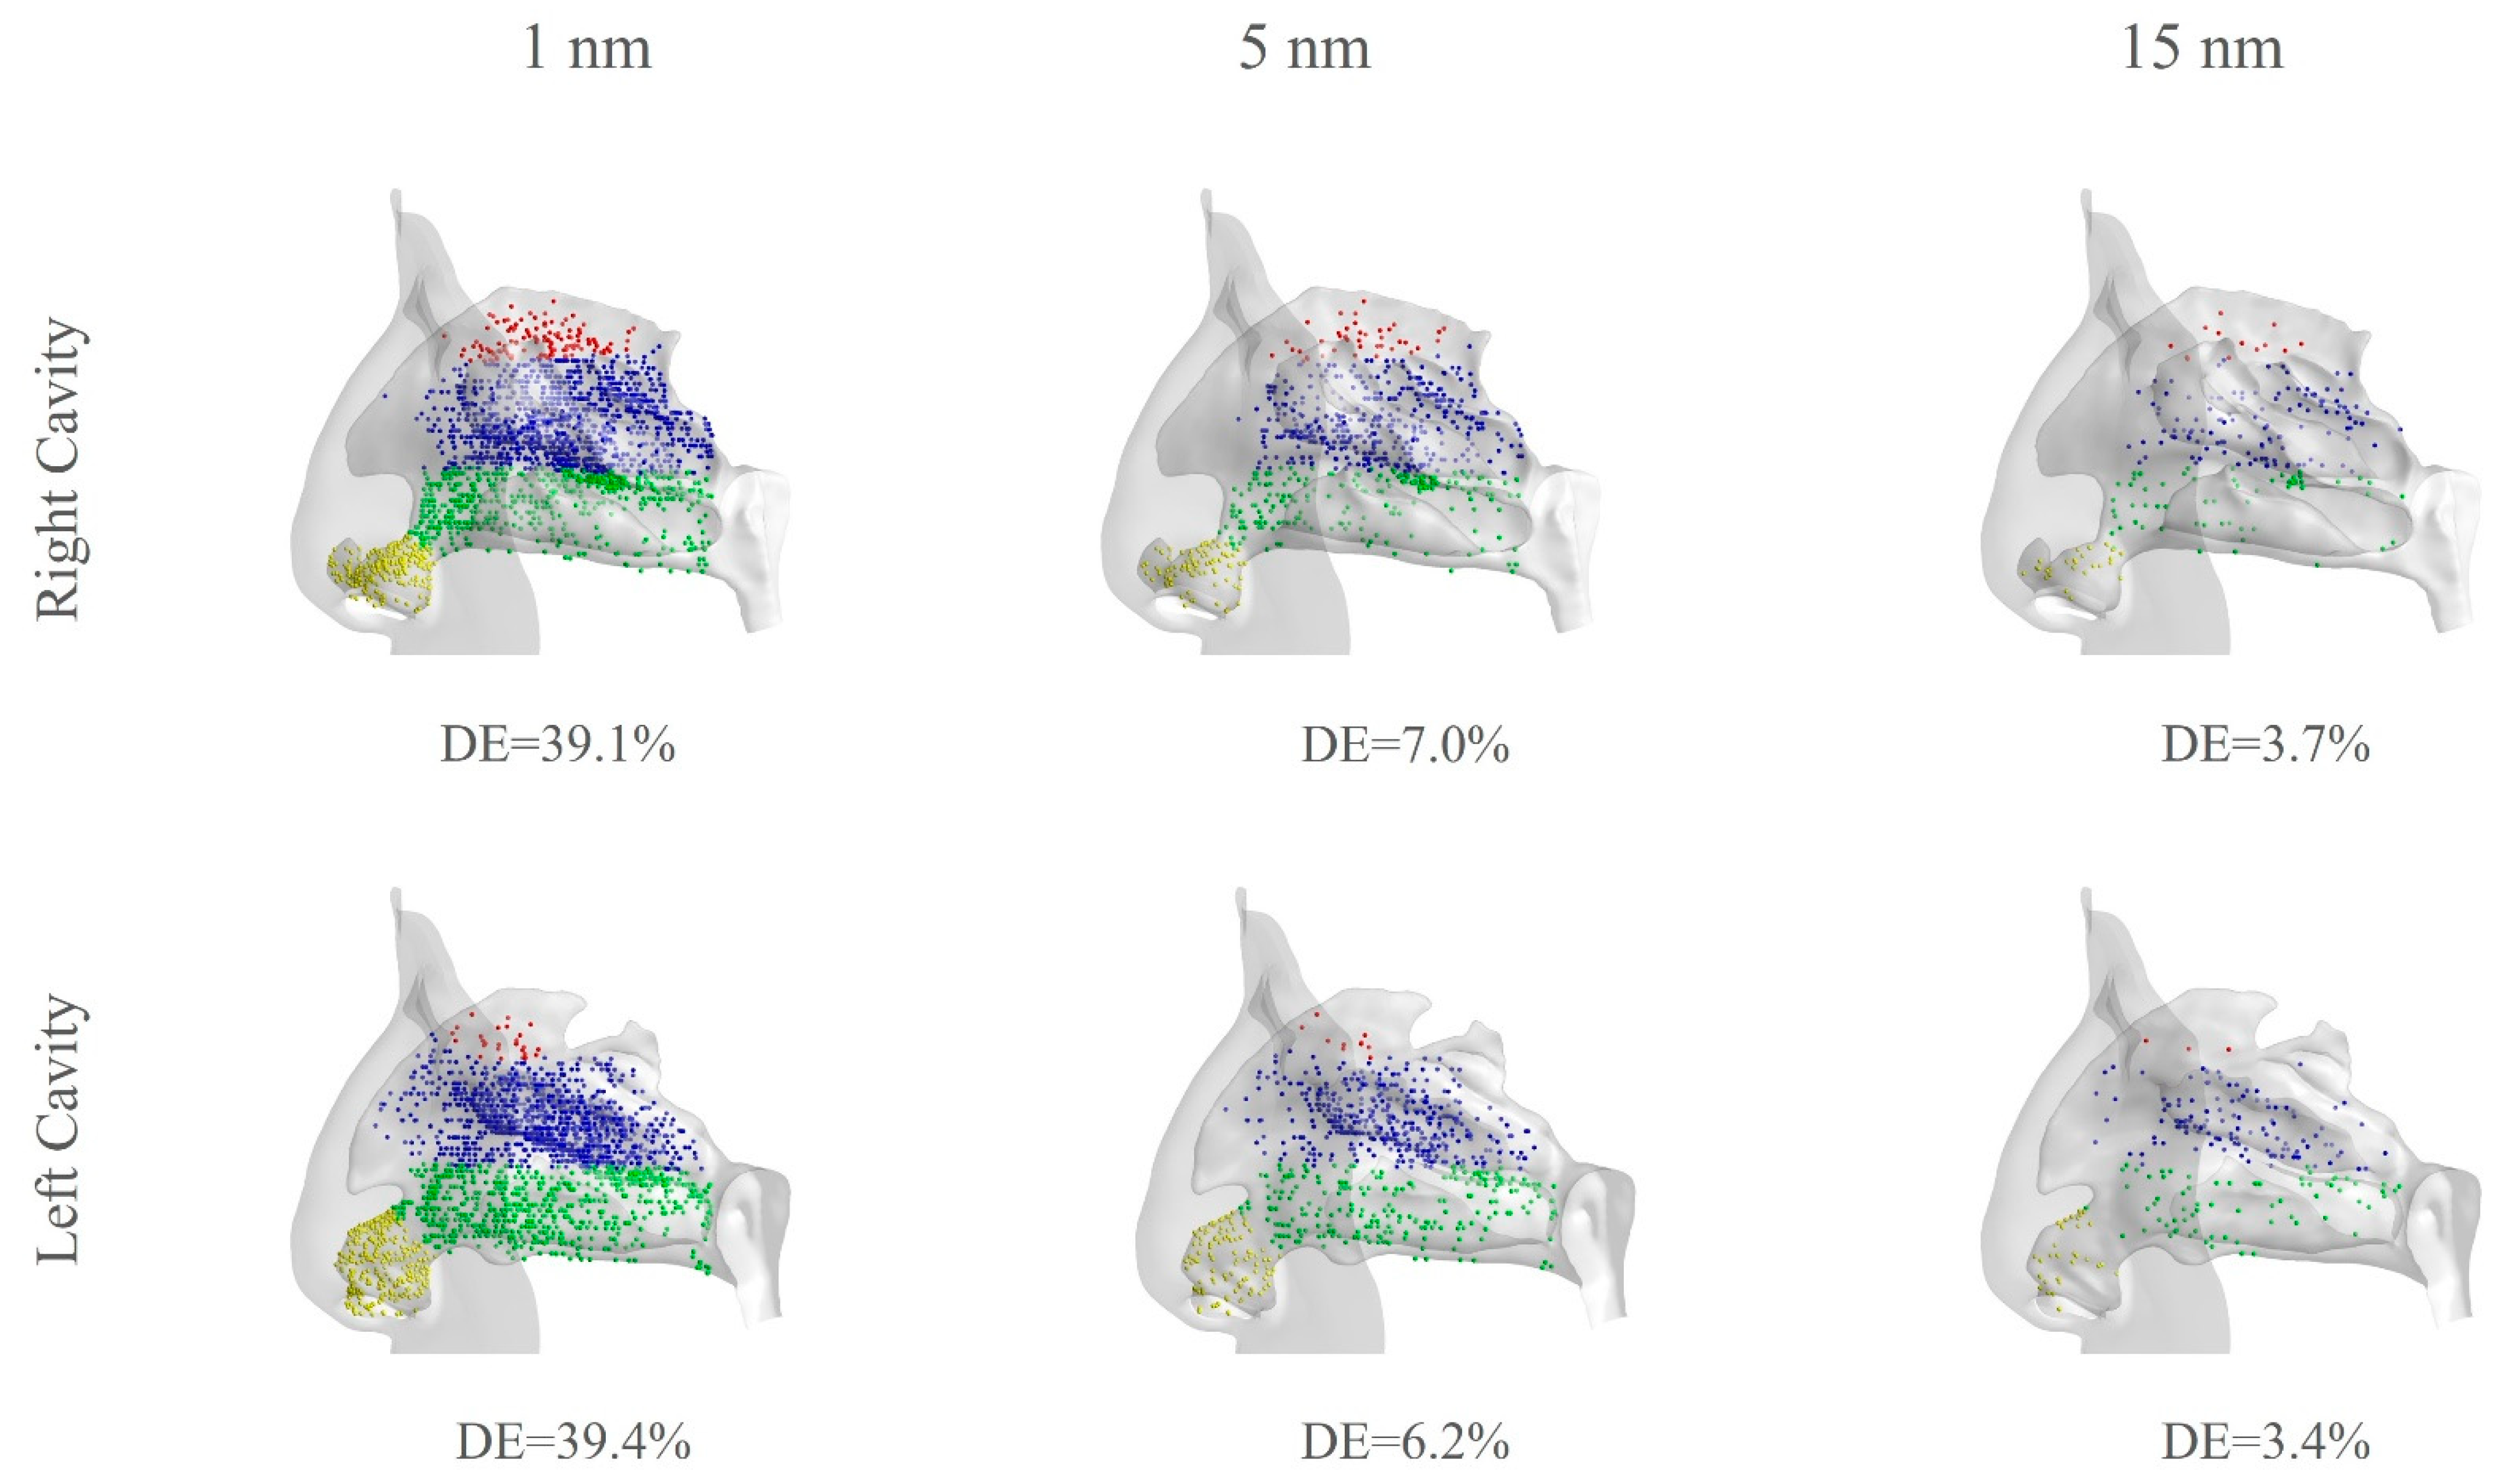
3.4. Particle Exposure Comparison

In this section, the simulated nanoparticle deposition efficiency (DE) was firstly compared with literature data to verify the accuracy of the present model (Figure 11). Our previous study predicted deposition efficiency of particles between 1–100 nm with flow rate of 15 L/min in three types nasal cavities respectively with non-notched, bilateral-notched and unilateral-notched nasal vestibule [10]. In 2004, Kelly reported deposition efficiency of fine particles with a diameter range from 5 to 150 nm under 10 and 20 L/min [23]. Cheng demonstrated nanoparticle (with a diameter range from 3.6 to 150 nm) deposition characteristic at constant flow rate from 4 L/min up to 30 L/min [24]. Our results showed good agreement with relevant studies in the literature. In general, the total nasal deposition efficiency peaks at 1 nm with DE around 60% to 70%, then rapidly drops below 10% as the particle size increases to 100 nm. The discrepancies are mainly attributed to the inter-subject variability and exposure condition differences.
Figure 12 compares the local nanoparticle deposition patterns in left and right chamber, where deposited particles were marked with different colours depend on their trapped regions. Total deposition efficiency in left and right chambers with three tested diameters was measured. It can be observed that 1 nm particles showed the highest possibilities of being trapped by the nasal wall than the other two, and unilateral deposition efficiency were both around 39%. By contrast, 5 nm and 15 nm particles showed rapidly decreased deposition with DE around 6–7% for 5 nm and constantly reduced to slightly over 3% for 15 nm case due to the weaker diffusion effect for particles with larger diameter sizes. It is observed that almost no particles deposited in the upper anterior region of main passage in all three cases, due to the bilateral-Notched vestibule shape which highly restricted inhaled particle transport to that region along with airflow.
Detailed deposition efficiency was investigated based on anatomical partition, respectively defined as vestibule, superior passage, middle passage and inferior passage, as seen in Figure 13. Released particles with a smaller size performed a more concentrated deposition pattern in all four regions. Among all four regions, 1 nm particles had the largest deposition values in middle passage (12.84% in the left and 13.21% in the right corresponding region), with 2.9% inter-chamber difference. The superior region had the smallest deposition efficiency, however deposition contributed extremely unevenly to the superior region since the left regional wall trapped almost four times more particles than the right. Diffusion was dominant force because of weak airflow. Meanwhile, the vestibule and inferior region also showed a chamber-specific deposition feature. The superior region showed the strongest inter-chamber variability for all the three diameters because of the diffusion force domain in this weak airflow contributed region. For future parameterized model, this region should receive more attention due to the inter-chamber difference.

4. Conclusions

In this paper, a systematic method of addressing the anatomical inter-chamber differences between the left and right nasal chamber was established. Based on the results, the nasal septum is mainly offset to the left at the middle passage but the trend gradually weakens. Meanwhile, inter-chamber variability is observed on the lateral wall of the nasal cavity. In this research, the lateral wall was divided into five regions based on the anatomical features, including olfactory, inferior turbinate, middle turbinate, inferior meatus and middle meatus. The highest average deviation, up to 0.98 nm, is found in the middle turbinate region and considerable deviation contribution is observed in the middle and inferior passages. Under 15 L/min inhaled flow rate, most of the inhaled flow distributes in the inferior and middle passage. Airflow is more evenly distributed in the lower and middle region while a flow jet straight into the middle passage occurs in the left because of the sharp constriction of the nasal valve. As for the particle transport, the left and right chamber filtering show a larger difference for 1 nm particle size and superior and inferior regions show chamber-specific deposition features. The quantified anatomical deviation was correlated with the flow apportionment and the associated nanoparticle deposition patterns. Our results suggest that the inter-chamber anatomical variation should be considered when developing standardized nasal models.
Future studies with more realistic nasal airway models at diverse age conditions are necessary to corroborate these findings [25]. Despite remaining limitations, this study demonstrates the influence of inter-chamber anatomical variation on airflow dynamics analysis and inhalation exposure risk assessment. The developed chamber-specific nasal wall deviation analysis method could be used by other relevant professionals in assessing nasal abnormalities in the future.

Author Contributions

Conceptualization, J.D. and J.T.; methodology, Q.S. and J.D.; validation, Q.S. and J.D.; investigation and formal analysis, Q.S.; writing—original draft preparation, Q.S.; writing—review and editing, J.D.; supervision, L.T., J.T. and J.D.; project administration, L.T. and J.D.; funding acquisition, L.T. and J.D. All authors have read and agreed to the published version of the manuscript.

Funding

This research was funded by the Australian Research Council under grant number DE210101549 and DE180101138.

Data Availability Statement

The data are not publicly available due to its proprietary nature. The data presented in this study are available on request from the corresponding author.

Acknowledgments

This effort was financially supported by the Australian Research Council under DE210101549 (Jingliang Dong, program manager) and DE180101138 (Lin Tian, program manager).

Conflicts of Interest

The authors declare no conflict of interest.

References

  1. Garcia, G.; Tewksbury, E.W.; Wong, B.A.; Kimbell, J.S. Interindividual Variability in Nasal Filtration as a Function of Nasal Cavity Geometry. J. Aerosol Med. Pulm. Drug Deliv. 2009, 22, 139–156. [Google Scholar] [CrossRef] [PubMed]
  2. Wen, J.; Inthavong, K.; Tu, J.; Wang, S. Numerical simulations for detailed airflow dynamics in a human nasal cavity. Respir. Physiol. Neurobiol. 2008, 161, 125–135. [Google Scholar] [CrossRef] [PubMed]
  3. Hu, W.; Katelaris, C.H.; Kemp, A.S. Allergic rhinitis—practical management strategies. Aust. Fam. Physician 2008, 37, 214–220. [Google Scholar] [PubMed]
  4. Mladina, R.; Čujić, E.; Šubarić, M.; Vuković, K. Nasal septal deformities in ear, nose, and throat patients. An international study. Am. J. Otolaryngol.-Head Neck Med. Surg. 2008, 29, 75–82. [Google Scholar]
  5. Moghaddam, M.G.; Garcia, G.J.M.; Frank-Ito, D.O.; Kimbell, J.S.; Rhee, J.S. Virtual septoplasty: A method to predict surgical outcomes for patients with nasal airway obstruction. Int. J. Comput. Assist. Radiol. Surg. 2020, 15, 725–735. [Google Scholar] [CrossRef] [PubMed]
  6. Laine, T.; Warren, D.W. Effects of age, gender, and body size on nasal cross-sectional area in children. Eur. J. Orthod. 1991, 13, 311–316. [Google Scholar] [CrossRef]
  7. Huang, Z.L.; Wang, D.Y.; Zhang, P.C.; Dong, F.; Yeoh, K.H. Evaluation of nasal cavity by acoustic rhinometry in Chinese, Malay and Indian ethnic groups. Acta Oto-Laryngol. 2001, 121, 844–848. [Google Scholar]
  8. Chen, X.B.; Lee, H.P.; Chong, V.F.H.; Wang, D.Y. Numerical Simulation of the Effects of Inferior Turbinate Surgery on Nasal Airway Heating Capacity. Am. J. Rhinol. Allergy 2010, 24, e118–e122. [Google Scholar] [CrossRef]
  9. Ma, J.; Dong, J.; Shang, Y.; Inthavong, K.; Tu, J.; Frank-Ito, D.O. Air conditioning analysis among human nasal passages with anterior anatomical variations. Med. Eng. Phys. 2018, 57, 19–28. [Google Scholar] [CrossRef]
  10. Dong, J.; Ma, J.; Shang, Y.; Inthavong, K.; Qiu, D.; Tu, J.; Frank-Ito, D. Detailed nanoparticle exposure analysis among human nasal cavities with distinct vestibule phenotypes. J. Aerosol Sci. 2018, 121, 54–65. [Google Scholar] [CrossRef]
  11. Andrã, R.; Vuyk, H.D.; Ahmed, A.B.; Graamans, K.; Trenitã, G.N. Correlation between subjective and objective evaluation of the nasal airway. A systematic review of the highest level of evidence. Clin. Otolaryngol. 2009, 34, 518–525. [Google Scholar] [CrossRef] [PubMed]
  12. Liu, Y.; Johnson, M.R.; Matida, E.A.; Kherani, S.; Marsan, J. Creation of a standardized geometry of the human nasal cavity. J. Appl. Physiol. 2009, 106, 784–795. [Google Scholar] [CrossRef] [PubMed] [Green Version]
  13. Lee, C.F.; Abdullah, M.Z.; Ahmad, K.A.; Shuaib, I.L. Analytical Comparisons of Standardized Nasal Cavity. J. Med. Imaging Health Inform. 2014, 4, 14–20. [Google Scholar] [CrossRef]
  14. Keustermans, W.; Huysmans, T.; Schmelzer, B.; Sijbers, J.; Dirckx, J.J. The effect of nasal shape on the thermal conditioning of inhaled air: Using clinical tomographic data to build a large-scale statistical shape model. Comput. Biol. Med. 2020, 117, 103600. [Google Scholar] [CrossRef] [PubMed]
  15. Brüning, J.; Hildebrandt, T.; Heppt, W.; Schmidt, N.; Lamecker, H.; Szengel, A.; Amiridze, N.; Ramm, H.; Bindernagel, M.; Zachow, S.; et al. Characterization of the Airflow within an Average Geometry of the Healthy Human Nasal Cavity. Sci. Rep. 2020, 10, 1–12. [Google Scholar] [CrossRef] [PubMed] [Green Version]
  16. Inthavong, K.; Tu, J.; Ahmadi, G. Computational Modelling of Gas-Particle Flows with Different Particle Morphology in the Human Nasal Cavity. J. Comput. Multiph. Flows 2009, 1, 57–82. [Google Scholar] [CrossRef] [Green Version]
  17. Shang, Y.; Dong, J.; Inthavong, K.; Tu, J. Comparative numerical modeling of inhaled micron-sized particle deposition in human and rat nasal cavities. Inhal. Toxicol. 2015, 27, 694–705. [Google Scholar] [CrossRef]
  18. Inthavong, K.; Ge, Q.J.; Li, X.; Tu, J.Y. Source and trajectories of inhaled particles from a surrounding environment and its deposition in the respiratory airway. Inhal. Toxicol. 2013, 25, 280–291. [Google Scholar] [CrossRef]
  19. Inthavong, K.; Ge, Q.J.; Li, X.D.; Tu, J.Y. Detailed predictions of particle aspiration affected by respiratory inhalation and airflow. Atmos. Environ. 2012, 62, 107–117. [Google Scholar] [CrossRef]
  20. Zubair, M.; Riazuddin, V.N.; Abdullah, M.Z.; Ismail, R.; Shuaib, I.L.; Hamid, S.A.; Ahmad, K.A. Airflow inside the nasal cavity: Visualization using computational fluid dynamics. Asian Biomed. 2010, 4, 657–661. [Google Scholar] [CrossRef] [Green Version]
  21. Zubair, M.; Riazuddin, V.N.; Abdullah, M.Z.; Rushdan, I.; Shuaib, I.L.; Ahmad, K.A. Computational Fluid Dynamics Study of Pull and Plug Flow Boundary Condition on Nasal Airflow. Biomed. Eng. Appl. Basis Commun. 2013, 25, 1350044. [Google Scholar] [CrossRef]
  22. Segal, R.A.; Kepler, G.M.; Kimbell, J.S. Effects of Differences in Nasal Anatomy on Airflow Distribution: A Comparison of Four Individuals at Rest. Ann. Biomed. Eng. 2008, 36, 1870–1882. [Google Scholar] [CrossRef] [PubMed]
  23. Kelly, J.; Asgharian, B.; Kimbell, J.S.; Wong, B.A. Particle Deposition in Human Nasal Airway Replicas Manufactured by Different Methods. Part II: Ultrafine Particles. Aerosol Sci. Technol. 2004, 38, 1072–1079. [Google Scholar] [CrossRef]
  24. Cheng, K.-H.; Cheng, Y.-S.; Yeh, H.-C.; Swift, D.L. Deposition of Ultrafine Aerosols in the Head Airways During Natural Breathing and During Simulated Breath Holding Using Replicate Human Upper Airway Casts. Aerosol Sci. Technol. 1995, 23, 465–474. [Google Scholar] [CrossRef]
  25. Dong, J.; Sun, Q.; Shang, Y.; Zhang, Y.; Tian, L.; Tu, J. Numerical comparison of inspiratory airflow patterns in human nasal cavities with distinct age differences. Int. J. Numer. Methods Biomed. Eng. 2021, e3565. [Google Scholar] [CrossRef]
Figure 1. Model setup of the realistic human nasal airway, where the yellow point cloud illustrates the spherical particle releasing location with a radius of 3 cm in front of the nostrils.
Fluids 07 00089 g001
Figure 2. The hybrid prism-polyhedral computational mesh: V1—the nostrils, S1—the nasal turbinate and S2—the choanae.
Fluids 07 00089 g002
Figure 3. (a) Side view of 3D Coordinate system restriction key points. The black dashed line represents the horizontal and vertical planes, and the blue dashed line is the Y-Z Plane. (b) The symmetry plane and the X-Y plane, from an oblique angle of view. (c) Schematic diagram of the lateral wall alignment method. This model was rotated around the Z axis until the maximum overlap choana region was viewed from the front view of the model.
Fluids 07 00089 g003
Figure 4. Hydraulic diameter and cross-section area as function of distance from the nostrils.
Fluids 07 00089 g004
Figure 5. Septum deviation colourmap, where red represents deviated to left and blue is the opposite. Left septum was used as the reference location and the right septum was analysed.
Fluids 07 00089 g005
Figure 6. Septum deviation assessment at six planes taken along the nasal airway passage that being perpendicular to airflow direction. Planes were labelled as Plane 1, 2, 3, 4, 5, 6 and the physical meaning of the zero position of the horizontal axis stands for the location where the right septal wall coincides with the left side.
Fluids 07 00089 g006
Figure 7. Localised deviation colourmap of the lateral wall, of which red represents deviated to left and blue is the opposite. Corresponding regions in the left chamber were used as the reference location and the right septum was analysed.
Fluids 07 00089 g007
Figure 8. Anatomical deviation analysis of the middle passage and inferior meatus. (a) Middle turbinate airway analysis, where horizontal bars represent the percentage of the left airway thickness relative to the right and the polyline reflects the relative position of the airway midline. (b) Midline of inferior meatus in polar coordinates. Blue marks represent the right airway and red marks represent the left airway.
Fluids 07 00089 g008
Figure 9. Streamlines comparison of the left (left hand side pattern) and right chamber (right hand side pattern).
Fluids 07 00089 g009
Figure 10. Isotropic velocity surface pattern in both chambers, where the green regions show the airflow with velocity exceeding 3.5 m/s in the left chamber (left hand side pattern) and the right chamber (right hand side pattern).
Fluids 07 00089 g010
Figure 11. Total nanoparticle deposition curve and its comparison with the data from works of Dong et al. [10], Kelly et al. [23] and Cheng et al. [24].
Fluids 07 00089 g011
Figure 12. Spatial deposition patterns of 1, 5 and 15 nm particles: yellow dots stand for deposited particles in the vestibule region, green dots stand for deposition particle in the inferior meatus, blue dots represent the middle meatus deposition, red dots represent the olfactory deposition.
Fluids 07 00089 g012
Figure 13. Comparison of the regional deposition efficiencies for 1, 5, and 15 nm particles.
Fluids 07 00089 g013
Table 1. Model surface and volume information of the 77-year-old male nasal subject.
Left CavityRight CavityTotal Cavity
Surface area [cm2]100.4592.48192.93
Volume [cm3]10.449.3619.80
Surface to volume ratio 9.629.889.74
Table 2. Nasal lateral wall regional deviation information.
Middle TurbinateInferior TurbinateMiddle MeatusInfer MeatusOlfactory
Max. deviation positive3.163.085.312.760.61
Max. deviation negative−3.56−2.82−2.76−1.34−0.58
Average deviation 0.980.940.890.520.29
Publisher’s Note: MDPI stays neutral with regard to jurisdictional claims in published maps and institutional affiliations.

