Abstract
The flooding of railway ballasts can cause extensive damage. This process has been the subject of several experimental investigations. In the present work, a relatively easy to implement approach to modelling this fluid flow is presented. It is shown that good agreement with the experimental results is obtained. The fluid flow is modelled by Darcy’s law, which we extend to the free fluid flowing above the ballast. The main complexity is in determining the free surface position, which is accomplished using an iterative procedure. The equations are solved using the finite element method. The method is illustrated by careful numerical calculations that are carefully compared with the experimental results reported in the literature. The method is then extended to realistic railway ballast, including the effects of ballast fouling. It is shown that when the flow begins to overtop the ballast, the free surface shifts to greatly increase the chance of ballast scouring.
1. Introduction
One of the critical features of a railway ballast is its high permeability so that water can flow freely through it. In principle, this protects the ballast from damage due to the actions of floodwater. However, under certain conditions, the flow of floodwaters can be sufficiently strong to scour the ballast [1,2]. This scour, in turn, destroys the structural strength of the ballast and leads to a severe accident in the worst-case scenario. Figure 1 shows flood damage to a rail track in the Hunter Valley, NSW, Australia. The porosity of the ballast can change over time, primarily due to ballast fouling, which alters the ballast’s ability to resist water damage. The exact process of ballast scouring is not fully understood, and it is the subject of ongoing research.
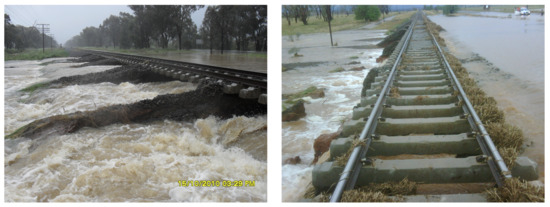
Figure 1.
Scouring of railway ballast during flooding in the Hunter Valley, NSW, Australia, in October 2010. Copyright Australian Rail Track Corporation.
Theoretical and experimental work on the flow of water through the ballast has been reported by [3], who investigated the effect of fouling on the conductivity of railway ballast. This study only calculated the flow through a realistic ballast numerically and did not report any experimental research, although they determined the permeability experimentally. Moreover, their analysis did not account for the free boundary, which is critical to understanding fluid flow. However, it represented the first attempt to model this challenging problem. This work was the starting point for the work of [4], which extended the work of [3] to the case of variable ballast properties and a free surface. However, this work assumed that the free surface was within the ballast itself and could not account for a free surface that extended in any way above the ballast. Such a case occurs both for realistic ballasts and for the experimental studies in the literature. We also note that Darcy’s law was assumed in both [3,4], which is a simplification. More complex fluid models have been considered by [5,6]. These more complex models allow for more complicated fluid flows and more complicated porous media laws. However, they require much greater computational power, and they are also time-dependent and not easily adapted to constant flow problems which appear in typical ballast scouring models [3] and the experiments we examine here.
The problem of fluid flow through porous media with a free boundary has been the subject of extensive research. The benchmark solution was reported in [7,8] based on previous results calculated as far back as the 1940s. However, with the advances in computational power, simple numerical methods based on iterative algorithms have become practical, and that is the method used in [4] and the present work. For a general discussion of the numerical method, see [9].
There are very limited experiments that have been conducted on the flow of floodwaters through railway ballast. Experimental investigation of railway ballast scour was conducted by [5,10]. They conducted a series of experiments in a hydraulic laboratory in which the scour of railway ballast was investigated. In particular, they tried to determine the point at which the breaching of the railway ballast occurred. We note that the exact moment of breaching was found by [11] to be a complex property of the ballast structure.
In this study, we will simulate the two experiments of [5,10] numerically. In particular, we will show that we can compute the flow rate and the free surface position. Our method extends the Darcy’s law formulation to the fluid that flows above the ballast by making the conductivity in the fluid outside the ballast much higher than that for the fluid in the ballast region. We then use the method we have developed to simulate flow through a realistic railway ballast, including the effect of layers with different conductivity.
2. Numerical Modelling of Flow through Railway Ballast
We assume that the fluid flow is incompressible, an assumption which seems entirely reasonable for the kinds of flows we are modelling, and that it is in steady state. Therefore, by conservation of mass, we can write the continuity equation for incompressible fluid and steady-state as:
Ref. [12]. is the velocity of a fluid particle, where u and w represent the velocity in x and z directions, respectively. The velocity of seepage by Darcy’s law is:
where k is a permeability, which may vary spatially, is a viscosity, P is the water pressure, z represents the elevation, is the fluid density, and g is the acceleration due to gravity [13]. We can rewrite Equation (2) as:
where is the hydraulic head that has the atmospheric pressure (which we set to be zero) and represents the hydraulic conductivity, where is a vector. We obtained Equation (3) by letting and , then from the expression for velocity in Equation (2) in two dimensions, we derive the formula of . It follows that:
so that and since the minus sign in represents the direction of velocity of seepage. Hence, the previous calculations led us to:
We then obtain the classical flow equation for fluids governed by Darcy’s law:
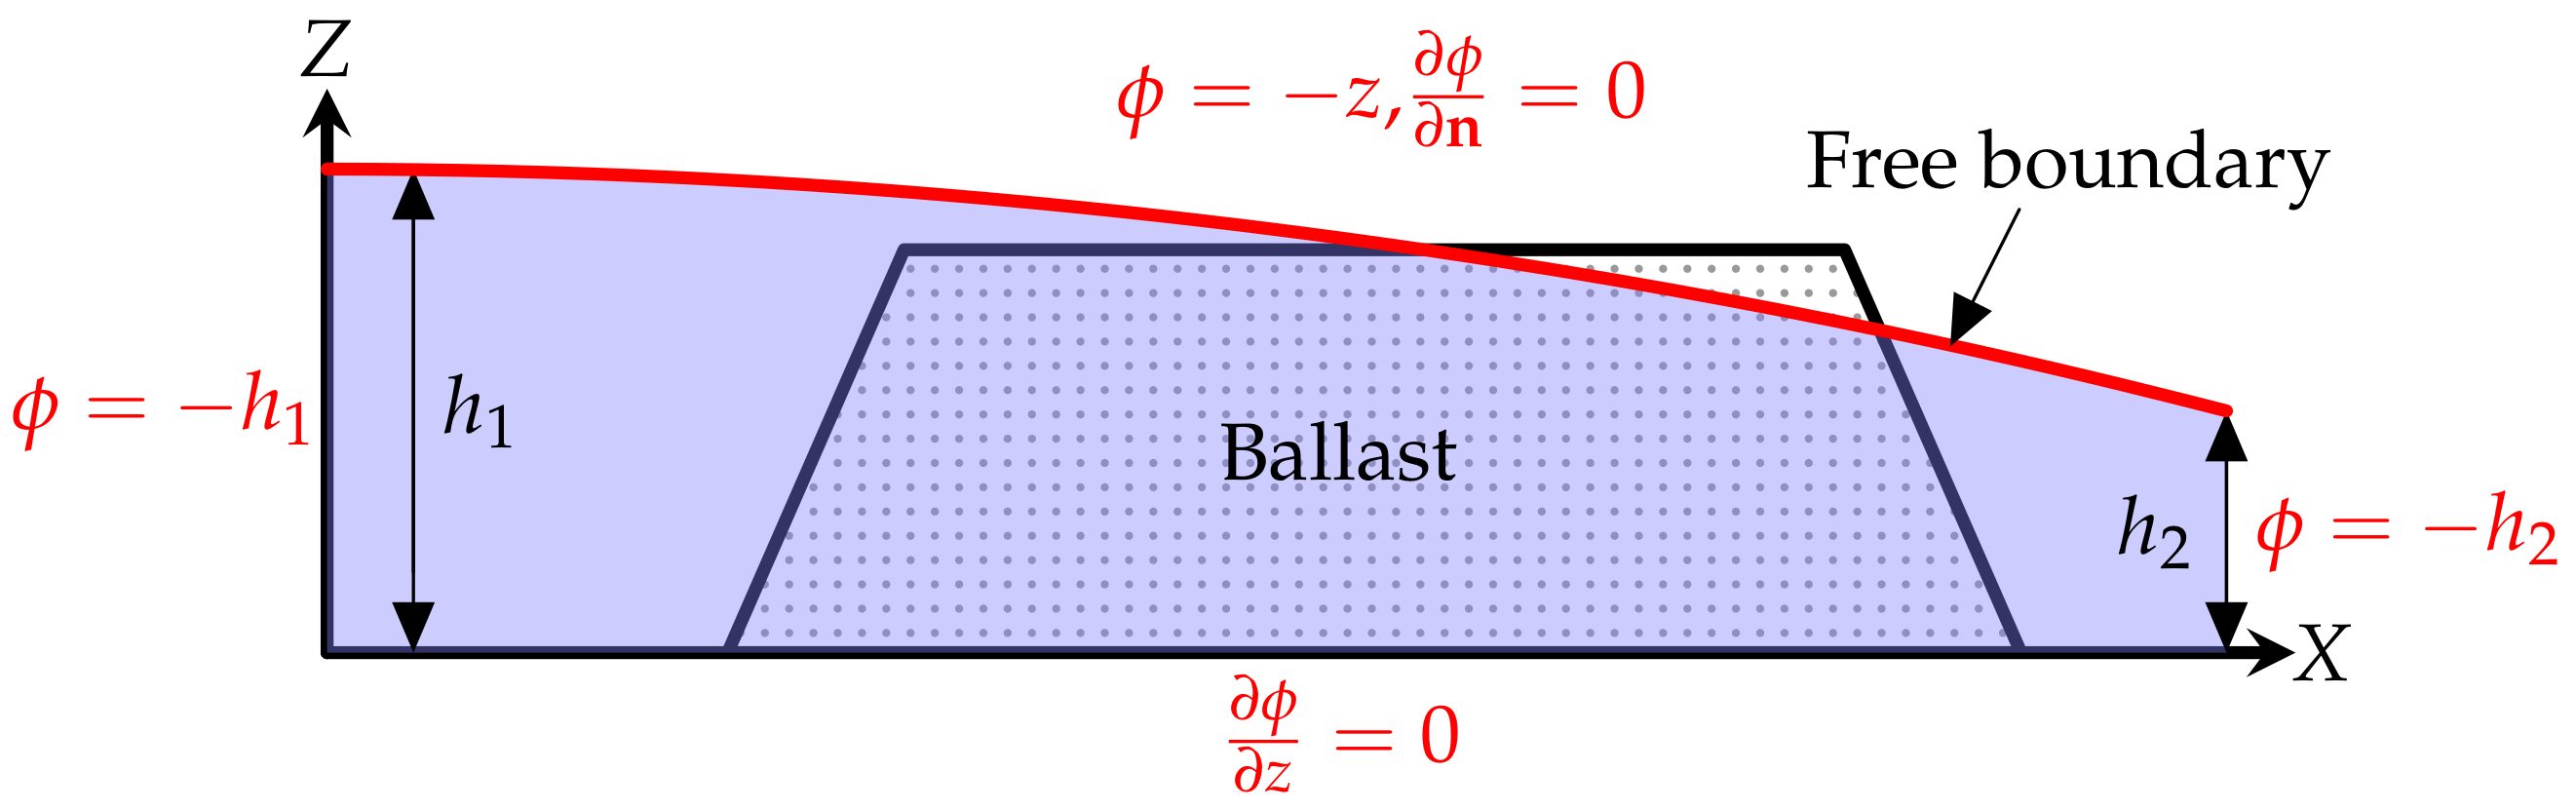
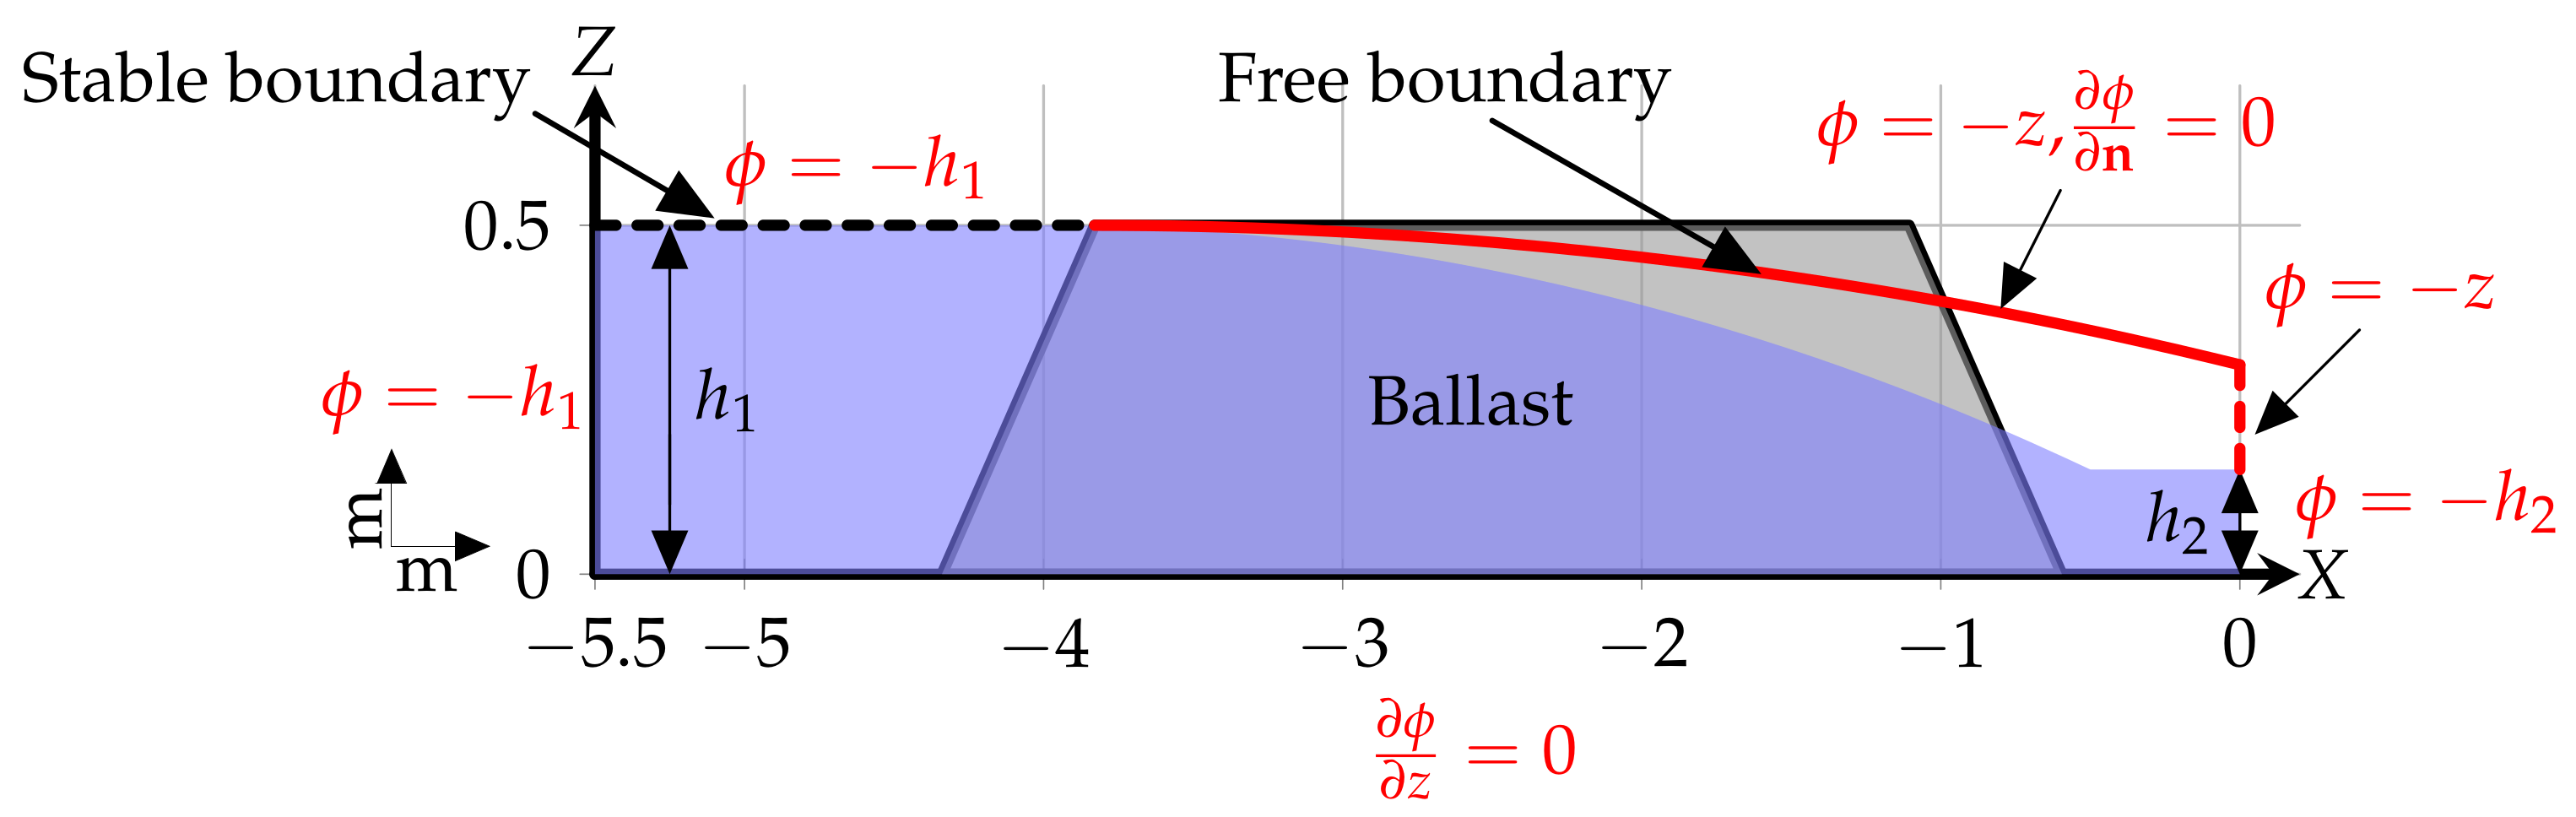
In the calculations which follow, we will assume that is piecewise constant, but more complicated situations can be considered [4]. The boundary conditions are shown in Figure 2. The equations are solved using the finite element method. Details of the solution method can be found in [4].

Figure 2.
Schematic diagram showing the boundary conditions. The governing equation is , where is variable.
The challenge to finding the solution is to calculate the free surface. We use an iterative algorithm here, in which we make an initial guess of the position of the free surface and then compute the solution assuming that on the free surface. We then use the condition to calculate a new free surface, and the calculation is repeated until convergence is achieved. Critical to our method is to treat the water outside the ballast using the same system of equations with a significantly reduced porosity (or higher permeability). As we will see, such a method gives good agreement with the experimental results.
3. Materials and Experiment
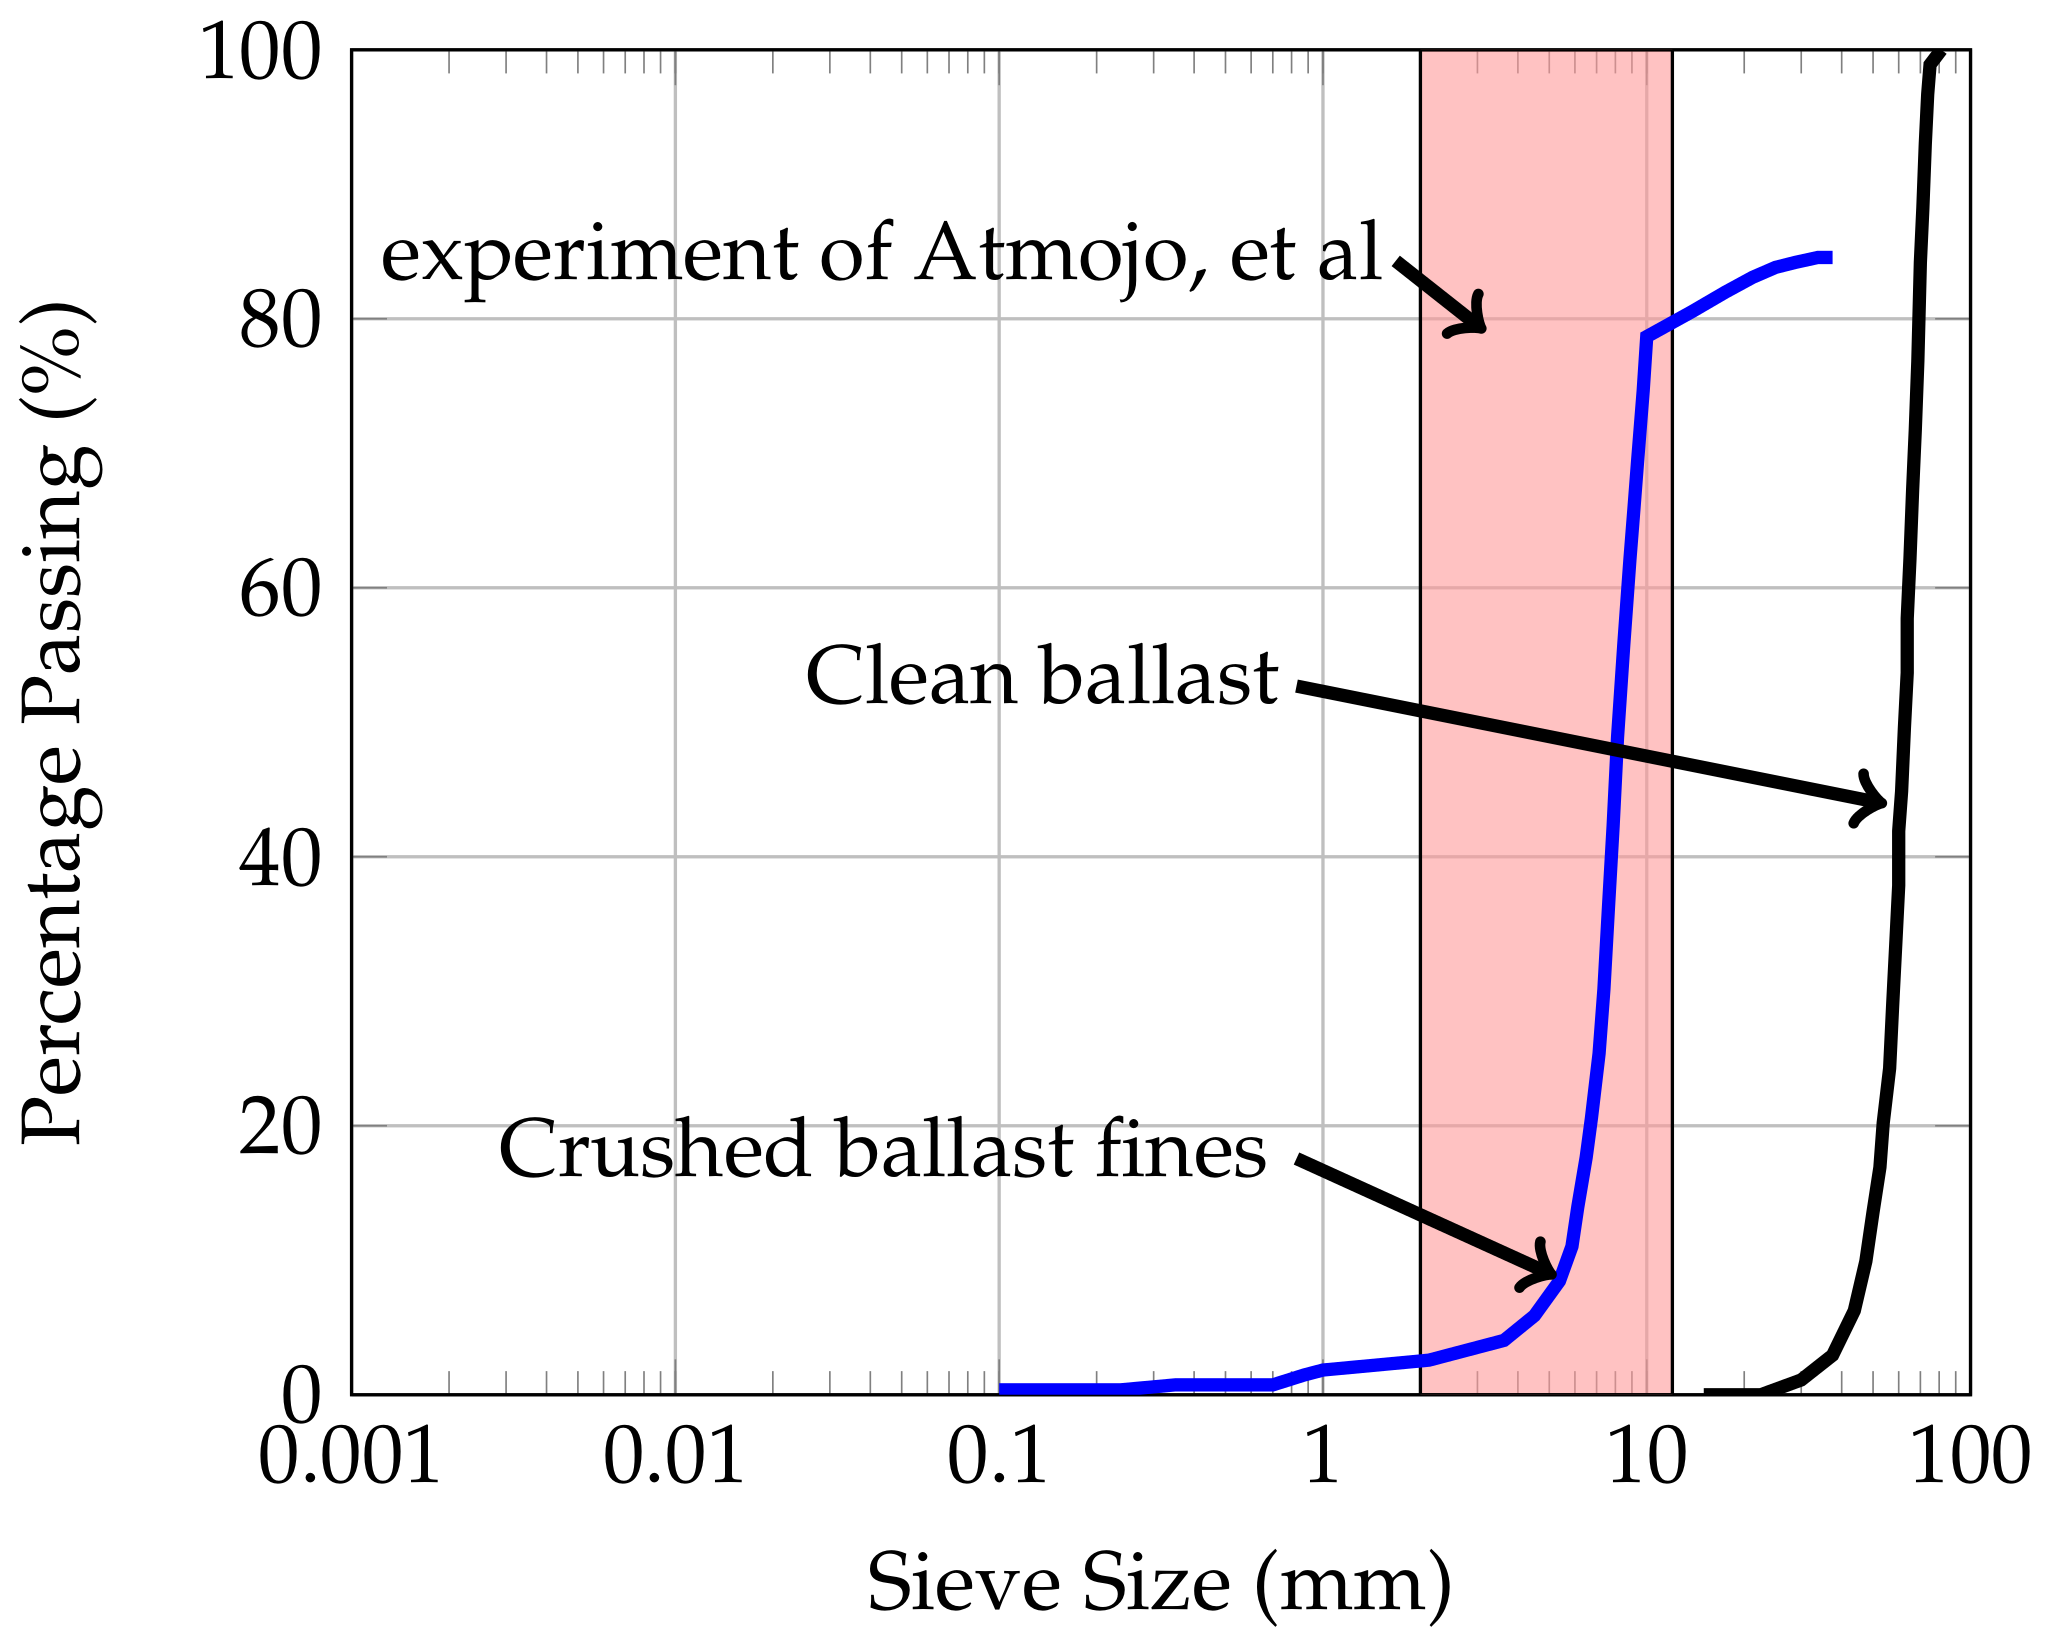
We compare our method to two experiments reported in the literature. The Atmojo experiment is reported in [10] and the Tsubaki experiment in [5]. The experiments were different, and we will explain each of them in detail. In particular, the experiments had different dimensions and different ballast properties. Before beginning our comparison, we must determine the porosity of the ballast from the reported properties. To accomplish this, we use the Sieve size chart Figure 3 reported in [14]. This chart allows us to determine the hydraulic conductivity for the experiments. The hydraulic conductivity of clean ballast gradation in Figure 3 is 0.34 m/s, and it is m/s for crushed ballast fines [14].

Figure 3.
Grain size distribution for ballast as reported in [14]. The red area represents the gradation of the ballast for Atmojo’s experiment.
3.1. Atmojo’s Experiment
Atmojo and others have performed an experiment that simulated the effect of water flow on railway ballast [10]. A schematic of the experiment is shown in Figure 4. They gradually increased the height of inflow, and their study concluded when breaching of the railway ballast commenced at 15 cm. At this point, the height of inflow was higher than the elevation of the railway ballast. It should be noted that we have exchanged left and right here for consistency with Tsubaki’s experiment. The experiment was not conducted on full scale, and the material used for the railway ballast in this experiment was 0.2 to 1.2 cm. We can use this ballast gradation and Figure 3 to determine that the hydraulic conductivity of the railway ballast in Atmojo’s experiment Figure 4 was 1.4 cm/s.
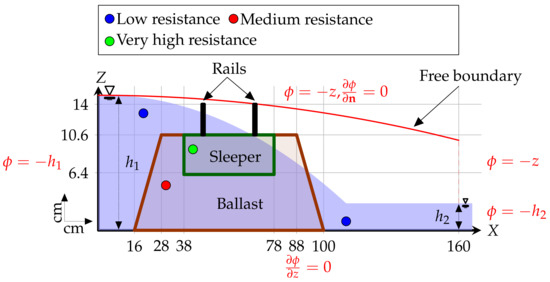
Figure 4.
Schematic diagram of the experiment in [10]. The boundaries conditions of the hydraulic head are for this study. The position of the free boundary is the initial guess above the final water level.
3.2. Tsubaki’s Experiment
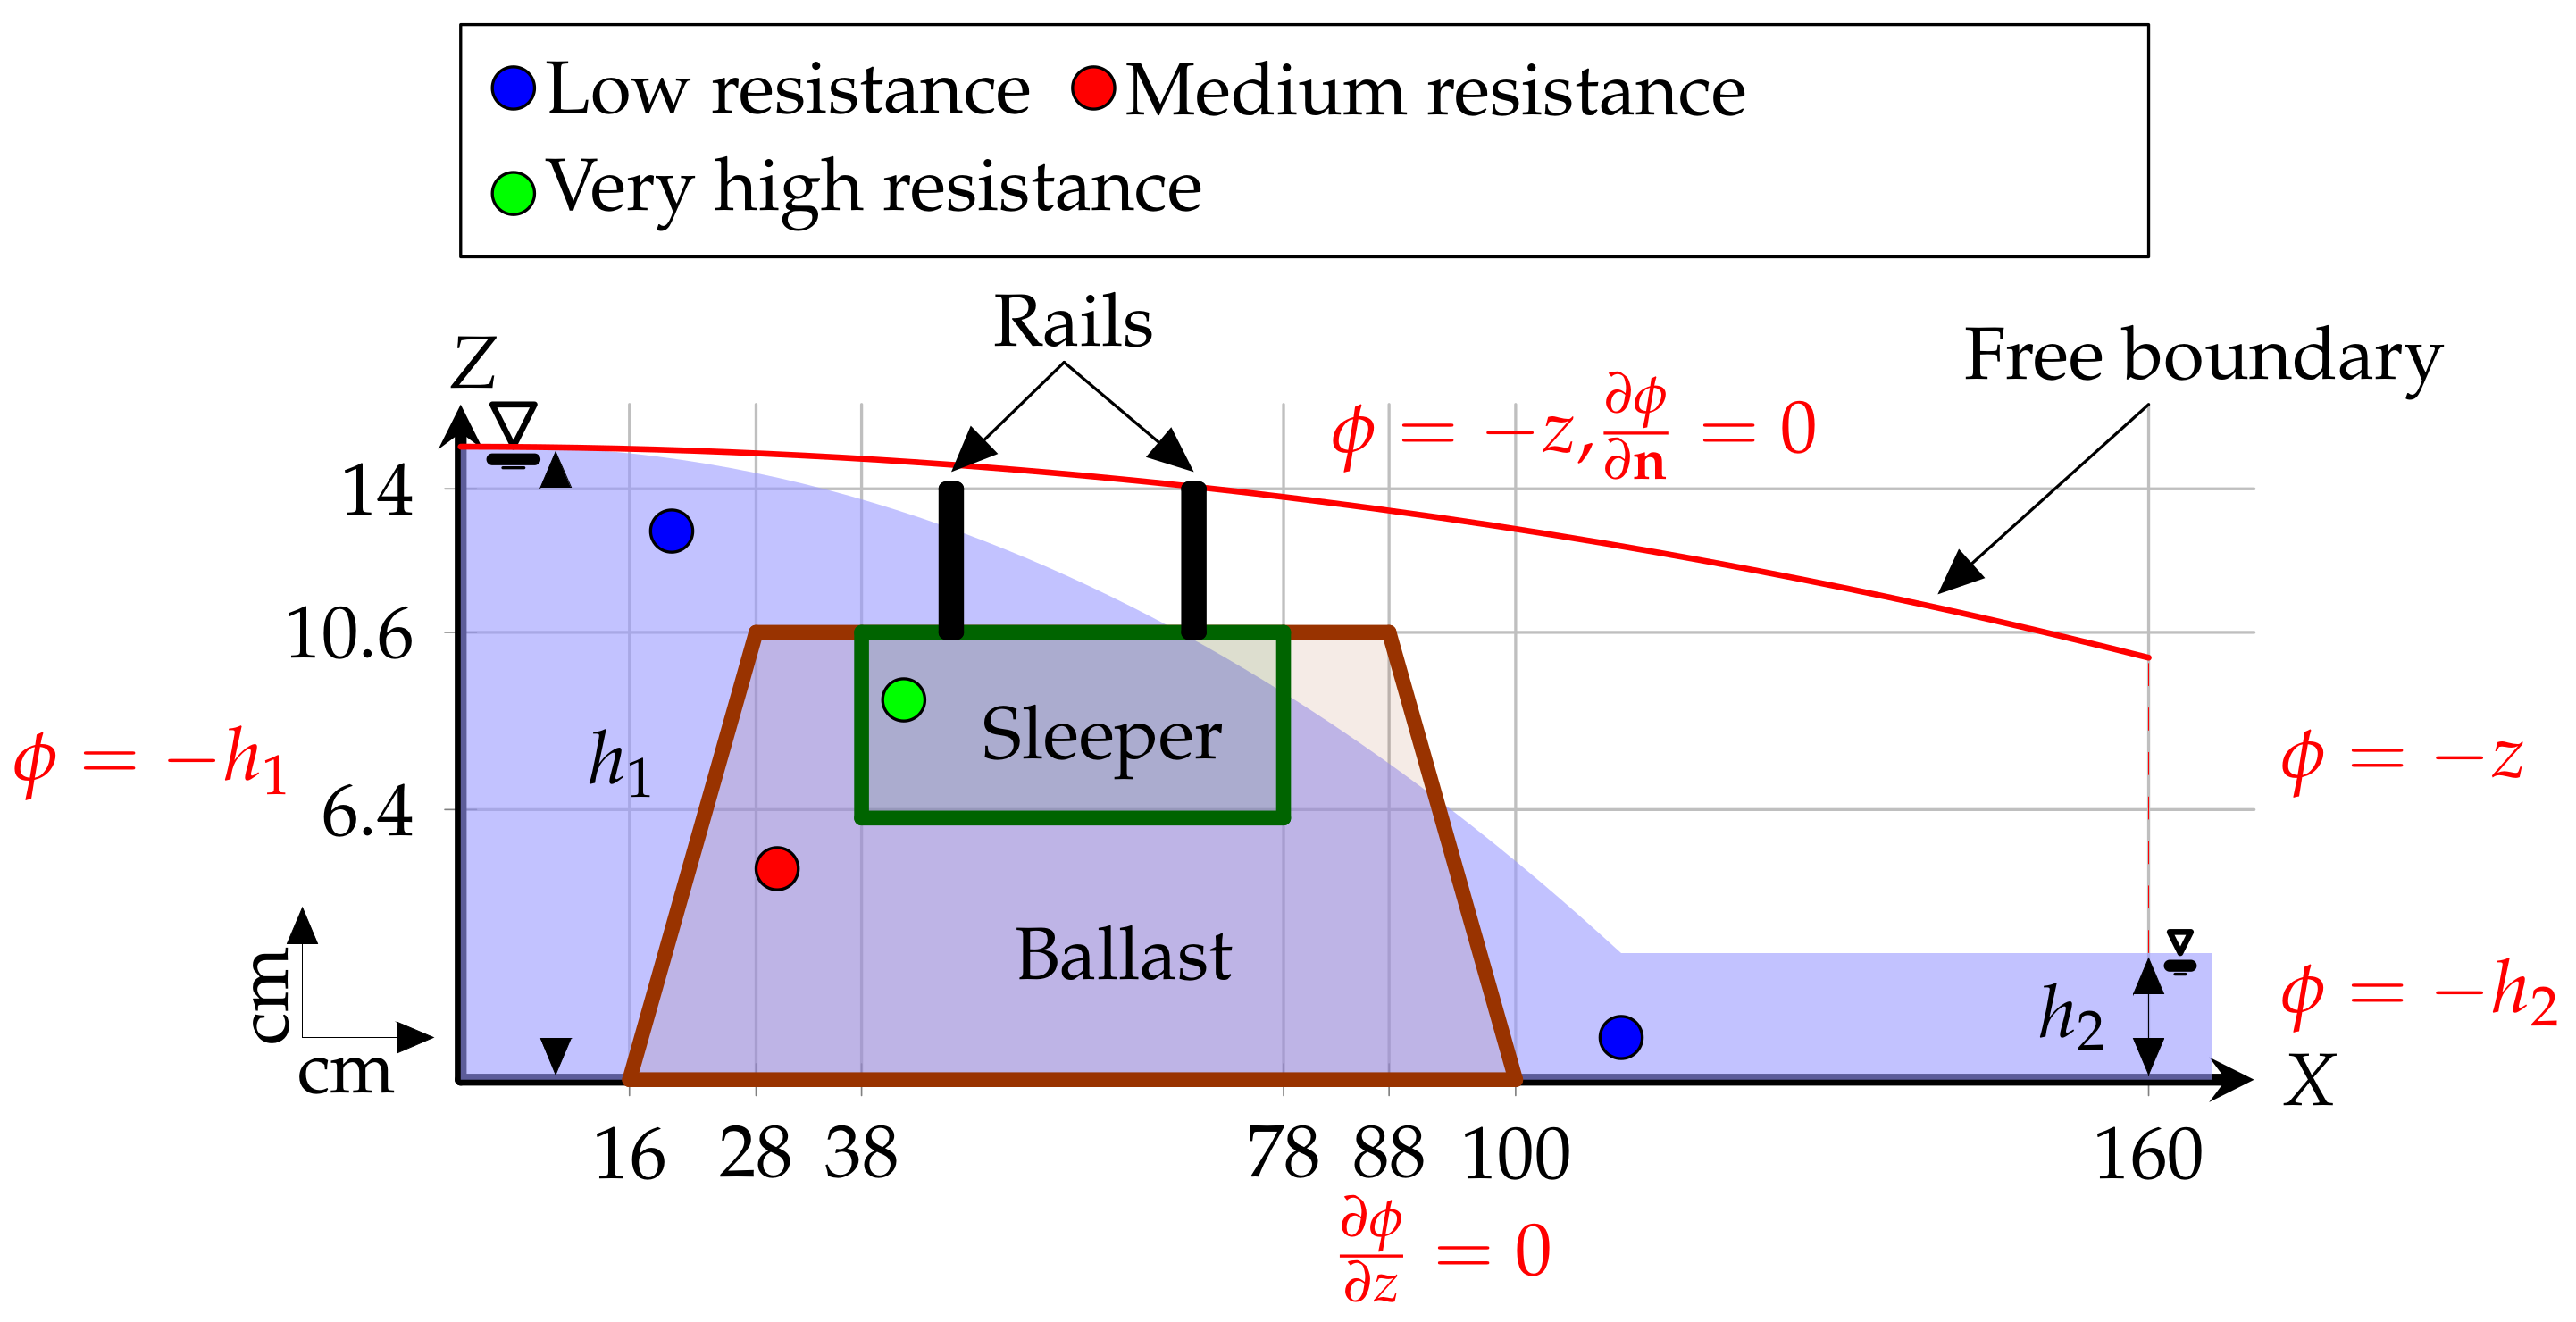
The Tsubaki’s experiment [5] involved many types of railway ballast. We focus on the case of ballast without sleepers and rails since their dimensions were not reported in the study. The study was conducted with a realistic railway ballast, and the gradient of this ballast according to [5] is identical to the distributions of particle sizes as for clean ballast in Figure 3. Therefore, the hydraulic conductivity equals 0.34 m/s. We present a schematic of the experiment in Figure 5.

Figure 5.
Schematic diagram of the Tsubaki’s experiment and the boundaries conditions of the hydraulic head for this study, where is assumed to be 0.001.
4. Results
Our focus here is on comparison with the experiments conducted on railway ballast. In the Appendix A we present validation against other results and study convergence. We begin with the Atmojo experiment. We assume the flow site starts at , and we have maintained the distance of the railway ballast and the observations of the free surface as in [10]. We present their observations of the free surface in Table 1. Figure 4 presents the solution where we have calculated the free surface using Equations (1) and (3). This study only covers these initial experiments of [10] because the inflow at 15 cm or greater caused breached the railway ballast. Therefore, we have focused only when the elevation of inflow equals 10, 12, 14, and 15 cm.

Table 1.
Free-surface observations as in [10] and the x positions used in this study.
As the properties of the ballast and sleeper required for our study were not reported, we have some freedom in choosing them. The results that best matched the experimental observations were , 0.7, and 100 cm/s for the ballast, sleeper, and fluid outside the ballast domain, respectively, as shown in Figure 6, Figure 7, Figure 8 and Figure 9. The convergence of the iterative method is shown in Figure 6 when the height of the flow was 10 cm. There is a low error between the free surface we calculate and the experiment of [10], and the error rate is less than , as shown Table 2. By using the same method for the Tsubaki experiment Figure 5, we obtain approximately the free surface as shown in Figure 10 and Figure 11 for a different flow rate. We have chosen the hydraulic conductivity of the railway ballast equal to 0.34 m/s since it has the same gradations as the clean ballast in Figure 3 and 1 m/s for the flowing outside. The stable boundary in Figure 5 may have affected the result for the free surface in Figure 11, but we can still see convergence if we pay attention to the axis in Figure 11.
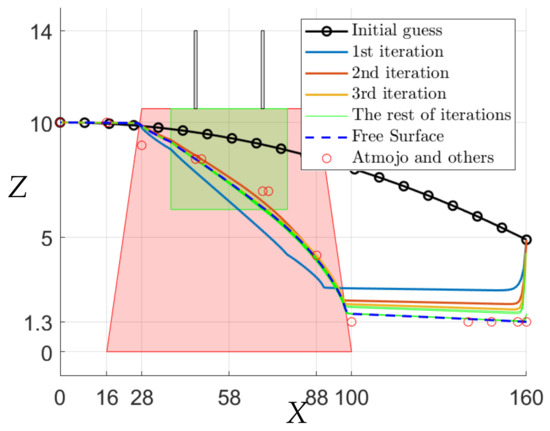
Figure 6.
Free-surface of inflow at 10 cm with the convergence of free boundary by iterative algorithm.
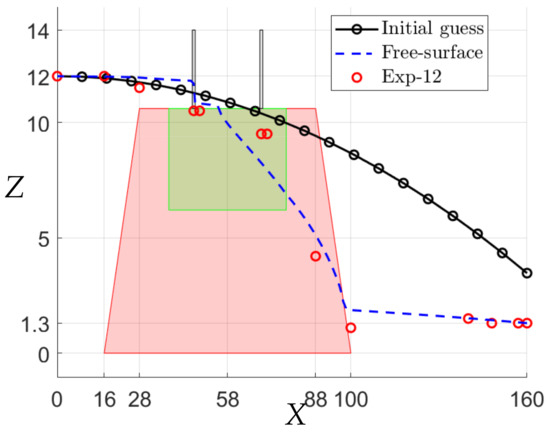
Figure 7.
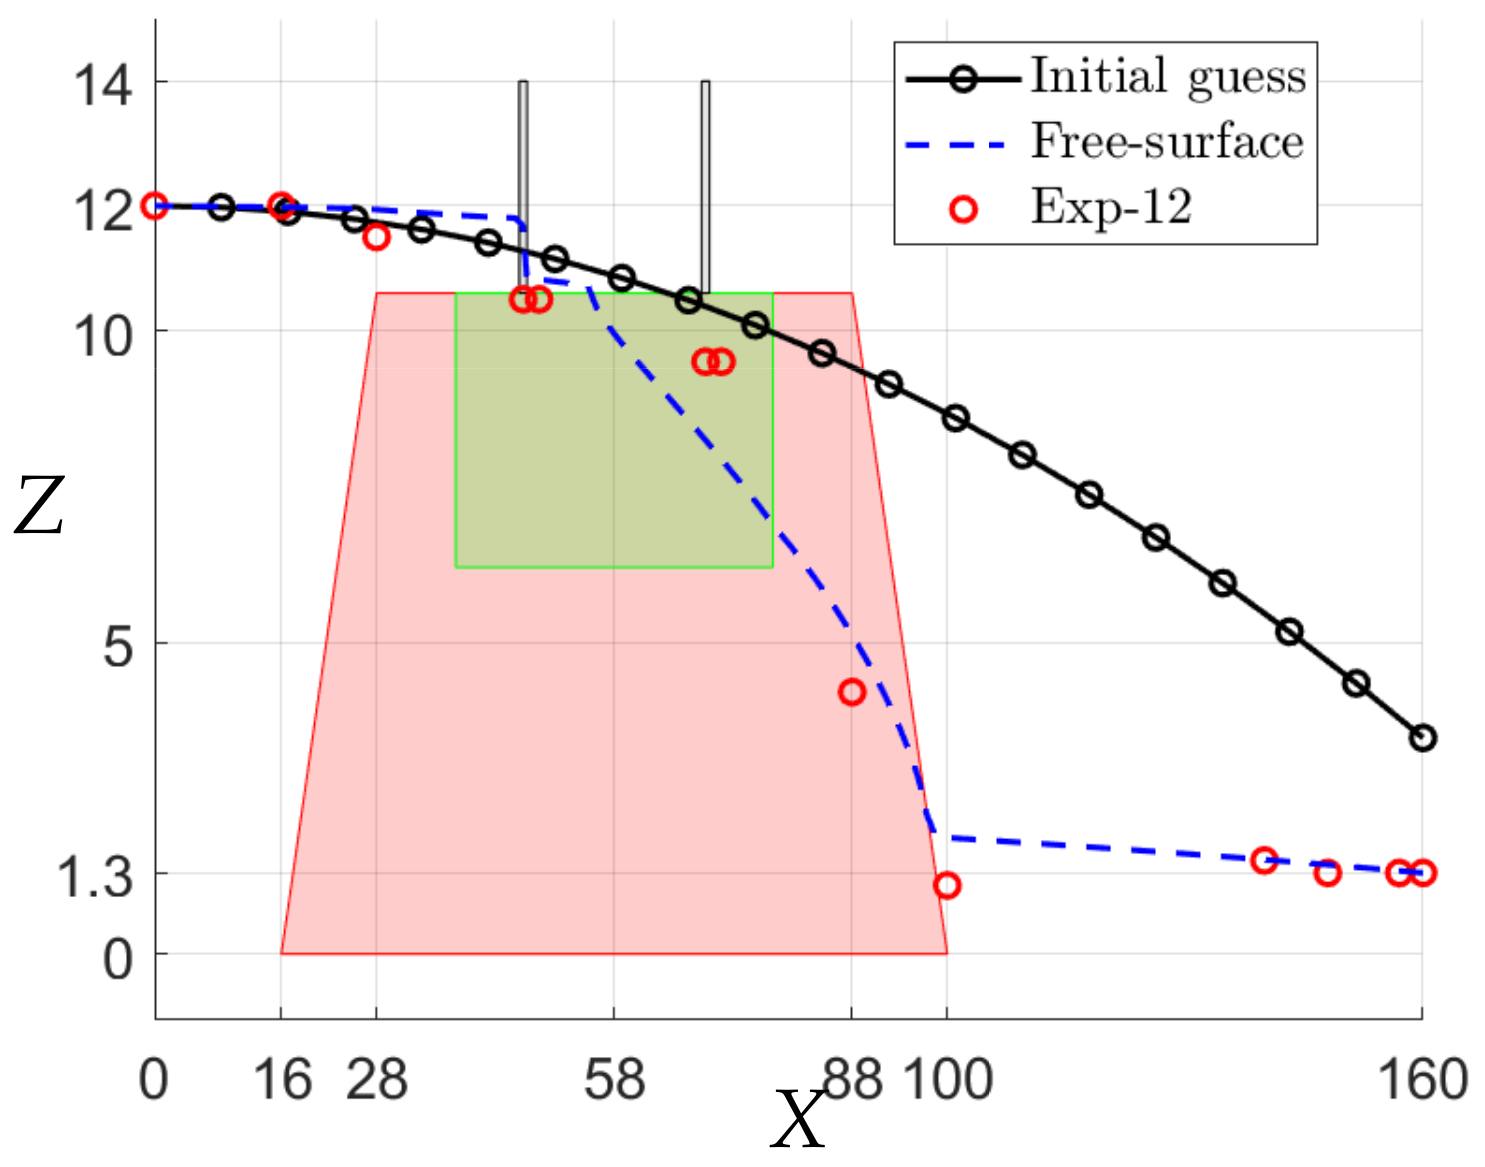
Free-surface of inflow at 12 cm.
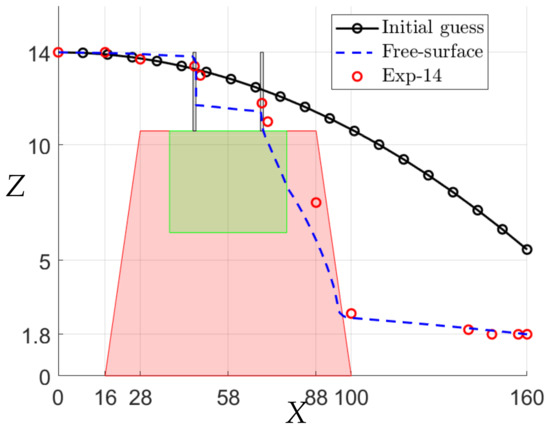
Figure 8.
Free-surface of inflow at 14 cm.

Figure 9.
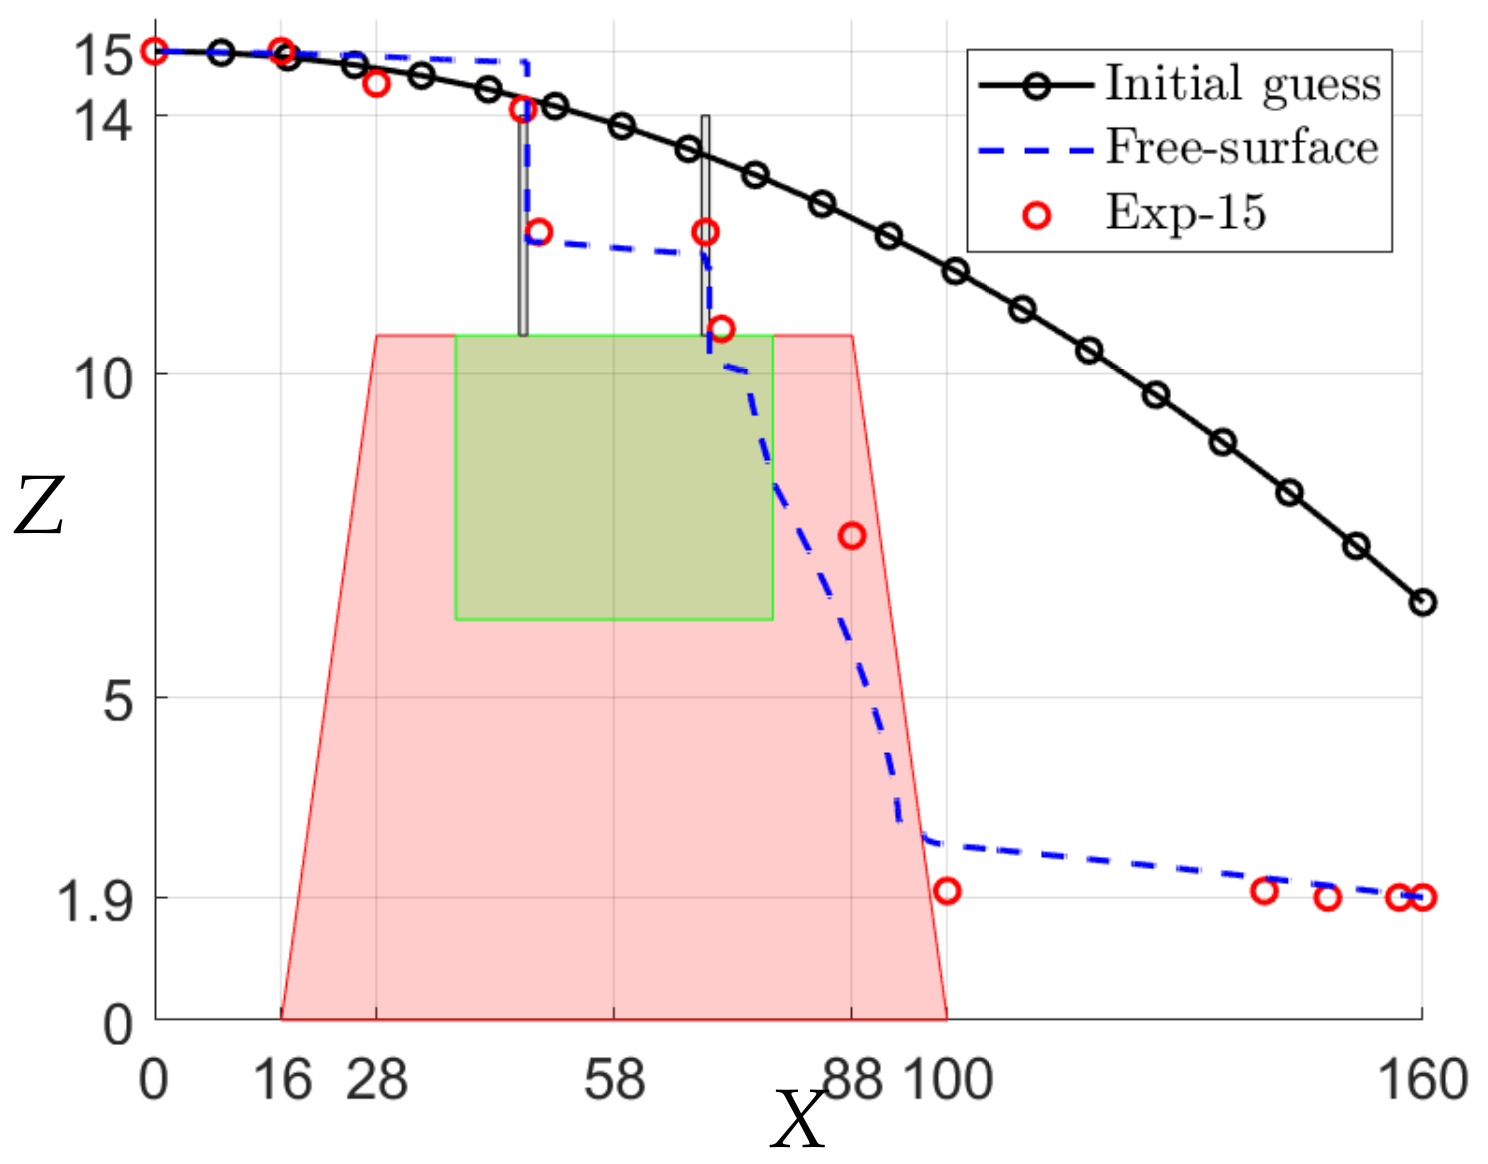
Free-surface of inflow at 15 cm.
Table 2.
The area of flow of the experiment in [10] and this study.
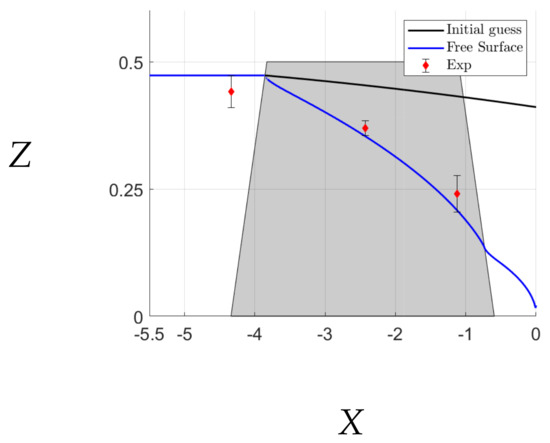
Figure 10.
Free surface at flow rate 0.016 m/s.
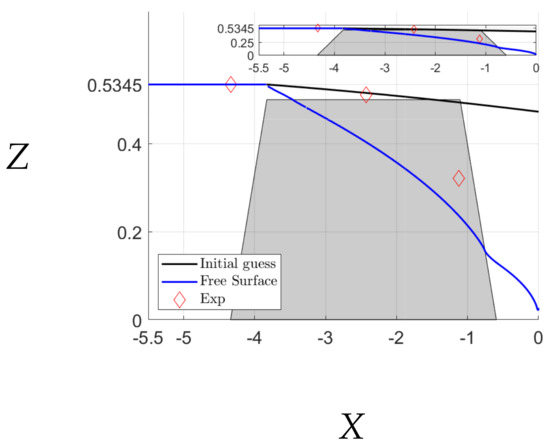
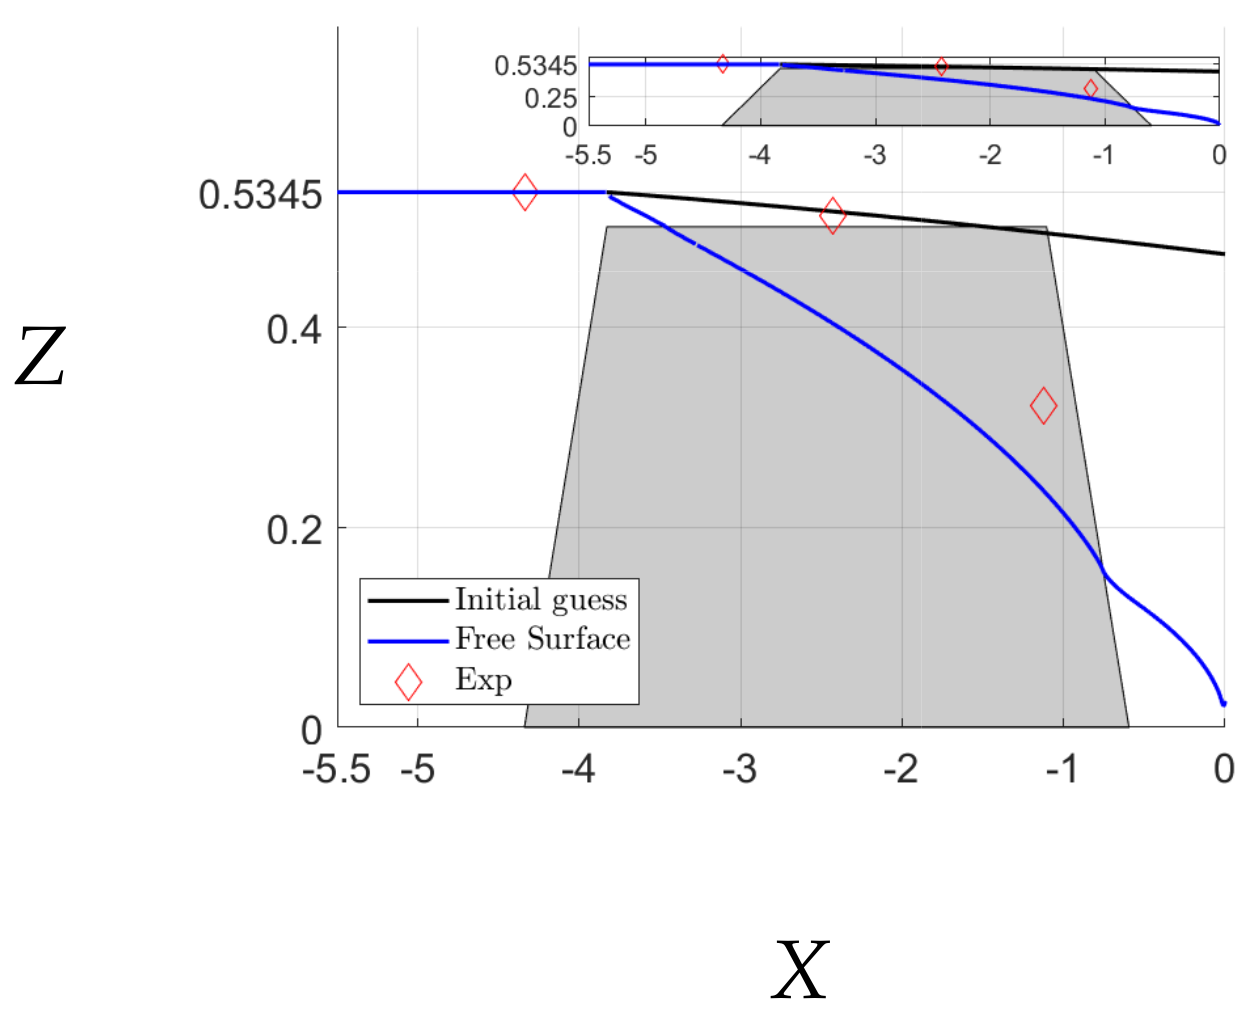
Figure 11.
Free surface at flow rate 0.034 m/s.
5. Computation for Real Railway Ballast
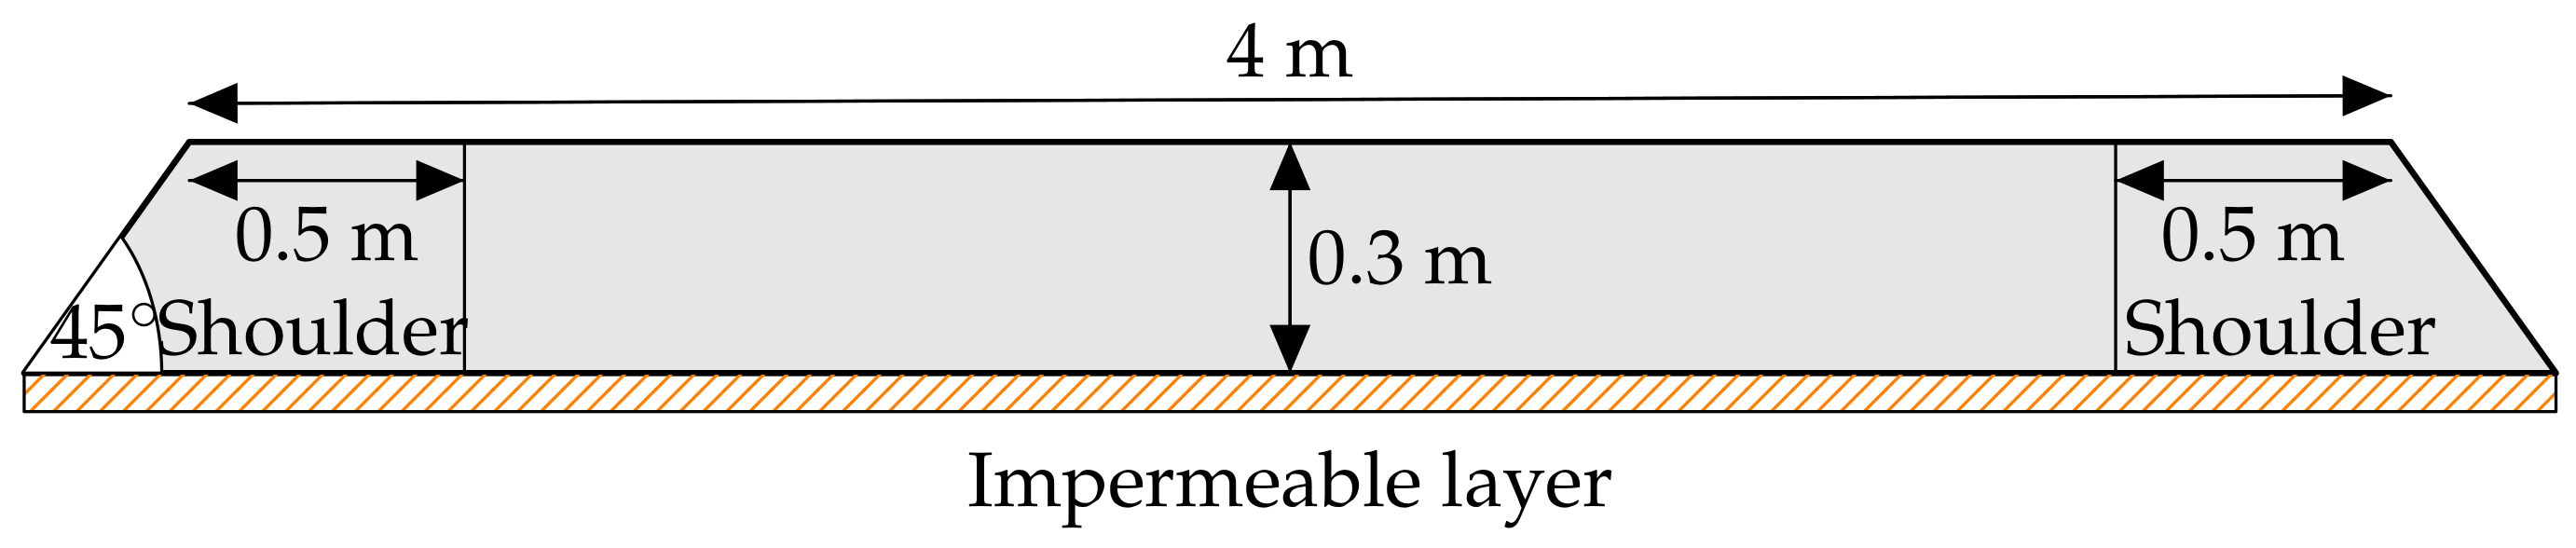
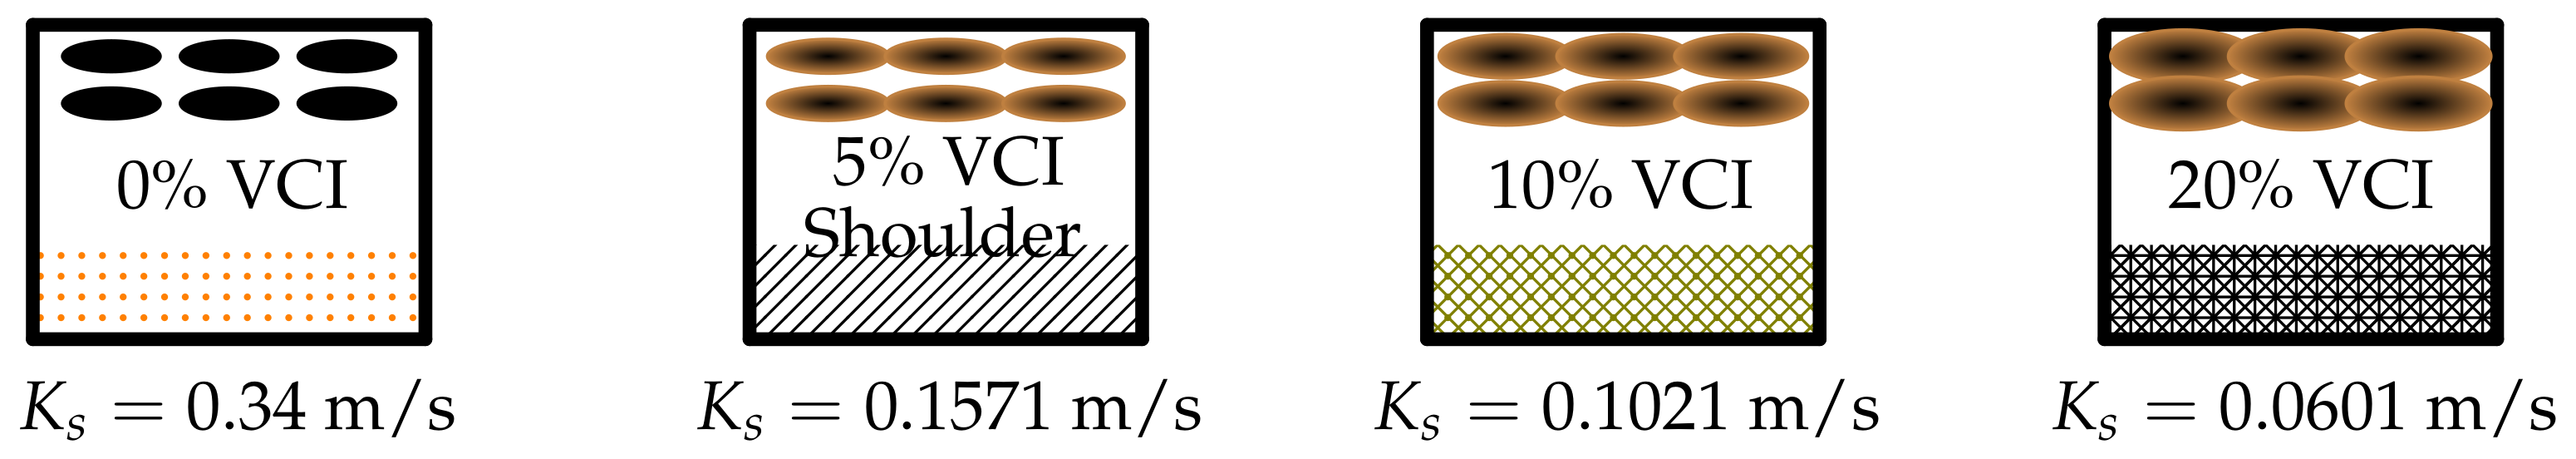
Having validated our method against experiments, we can now predict the solution for the realistic railway ballast. Our previous results are consistent with both experiments using the hydraulic conductivity of each gradation based on sieve size (Figure 3). If we accept this method, we can predict the free surface of water flow through a realistic railway ballast. According to [3], a typical Australian railway ballast is shown in Figure 12. They suggested different models for realistic railway ballasts with fouling, as shown in Figure 13. These show the fouling ratio in the railway ballast depicted in Figure 14. We can calculate the effect of the fouling ratio by following [3]. Further discussion of fouling can be found in [15]. We use the following equation to calculate the hydraulic conductivity:
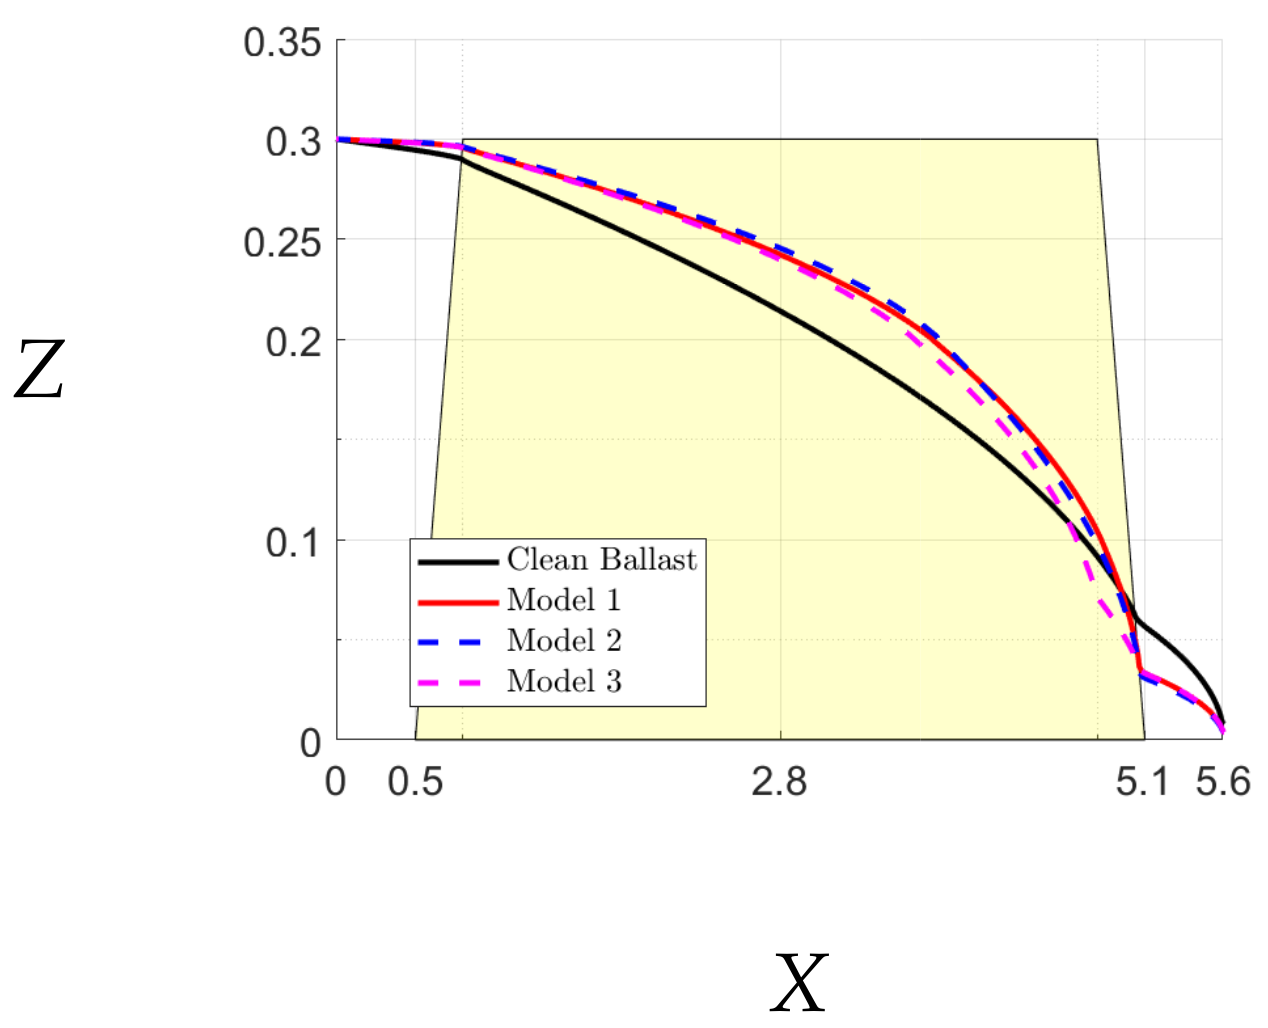
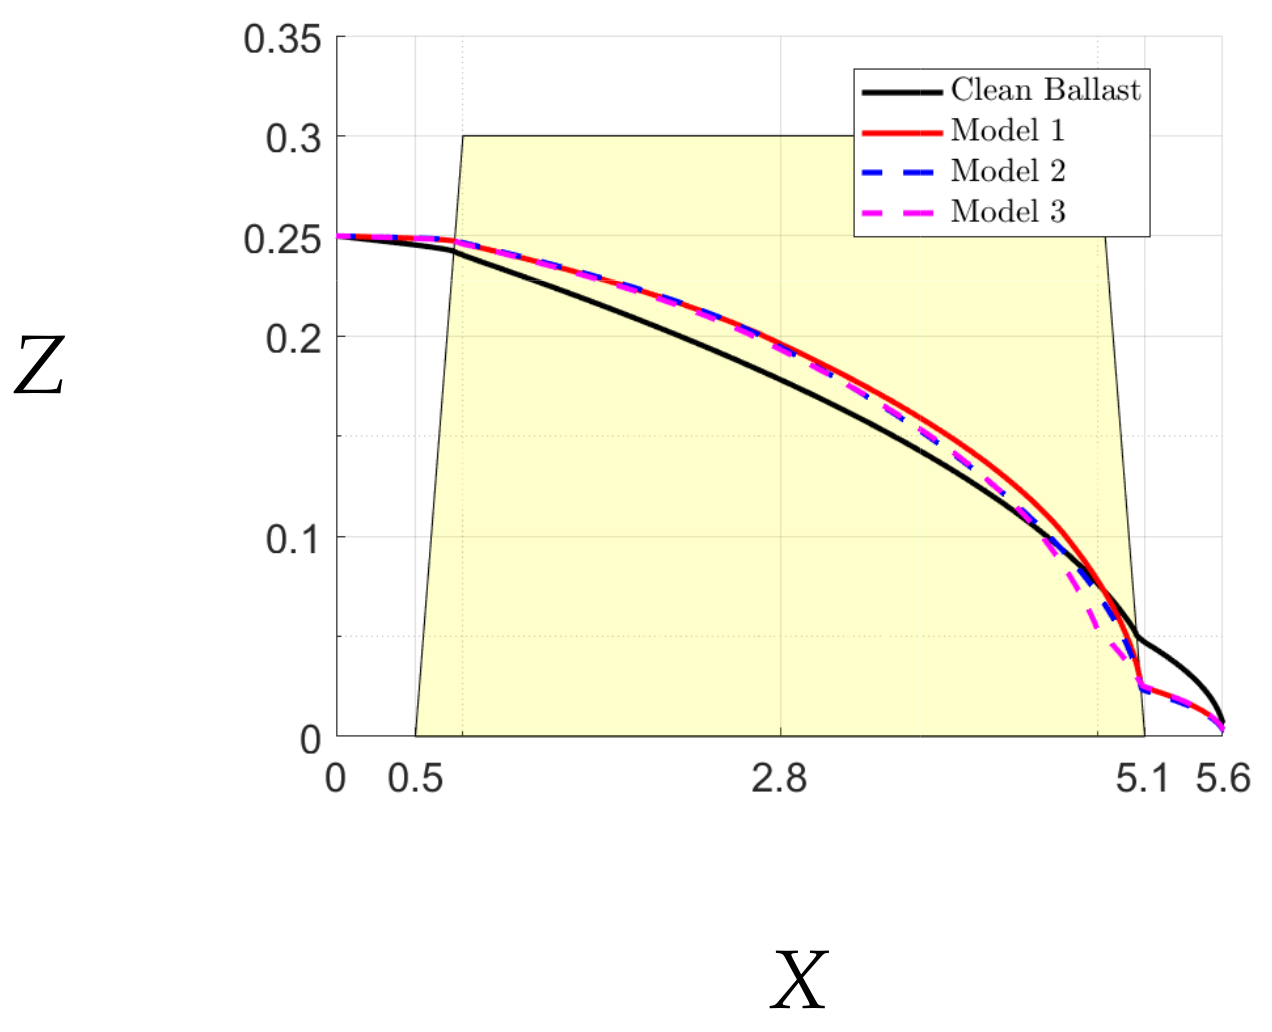
where (VCI) is the void contaminant index, is the speed of hydraulic conductivity for a clean ballast, and is the speed of hydraulic conductivity for crushed ballast fines (as fouling material), which is m/s. The hydraulic conductivity for the ballast is 0.34 m/s based on measurements for a clean ballast, and for the flow outside the ballast region, we assume 1 m/s. The flow starts at to , and the ballast’s width is . We examine different heights for the flow. The free surface for the railway ballast is shown in Figure 15, Figure 16 and Figure 17, where for all of them. We can see the influence of the VCI on model 1 Figure 13 The affect on the free surface is shown in Figure 18. We have increased the height of to 0.1 m to obtain the convergence for the VCI.
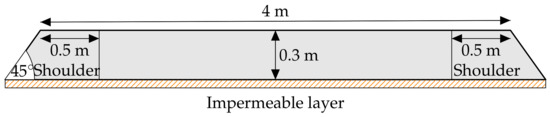
Figure 12.
The railway ballast geometry following the Australian track dimensions [3].
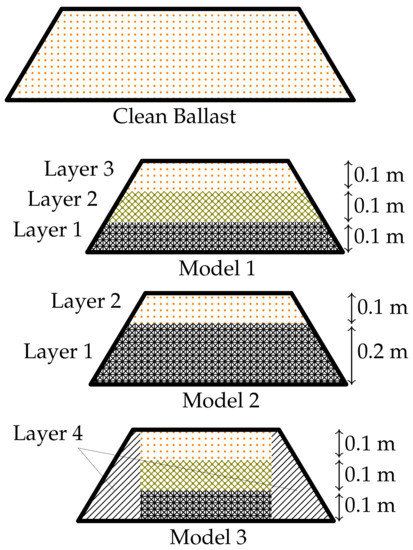
Figure 13.
Models of realistic railway ballast including fouling following [3]. The layers of colour coding correspond to different values for the conductivity, and they are given in Figure 14.
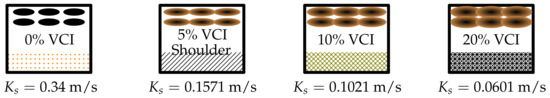
Figure 14.
Fouling ratio or VCI and the equivalent hydraulic conductivity . The lower portion of these figures shows the corresponding colouring used in Figure 13.
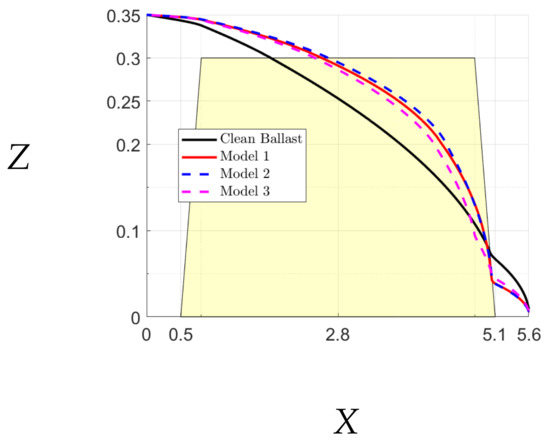
Figure 15.
Free-surface for realistic railway ballast at height .

Figure 16.
Free-surface for realistic railway ballast at height .
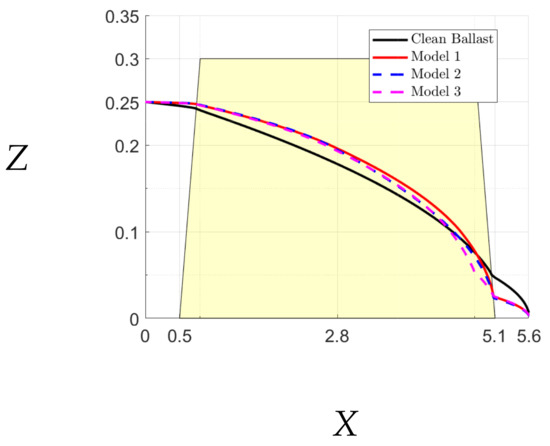
Figure 17.
Free-surface for realistic railway ballast at height .
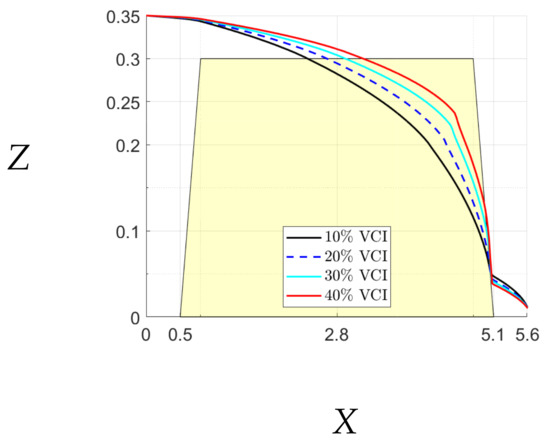
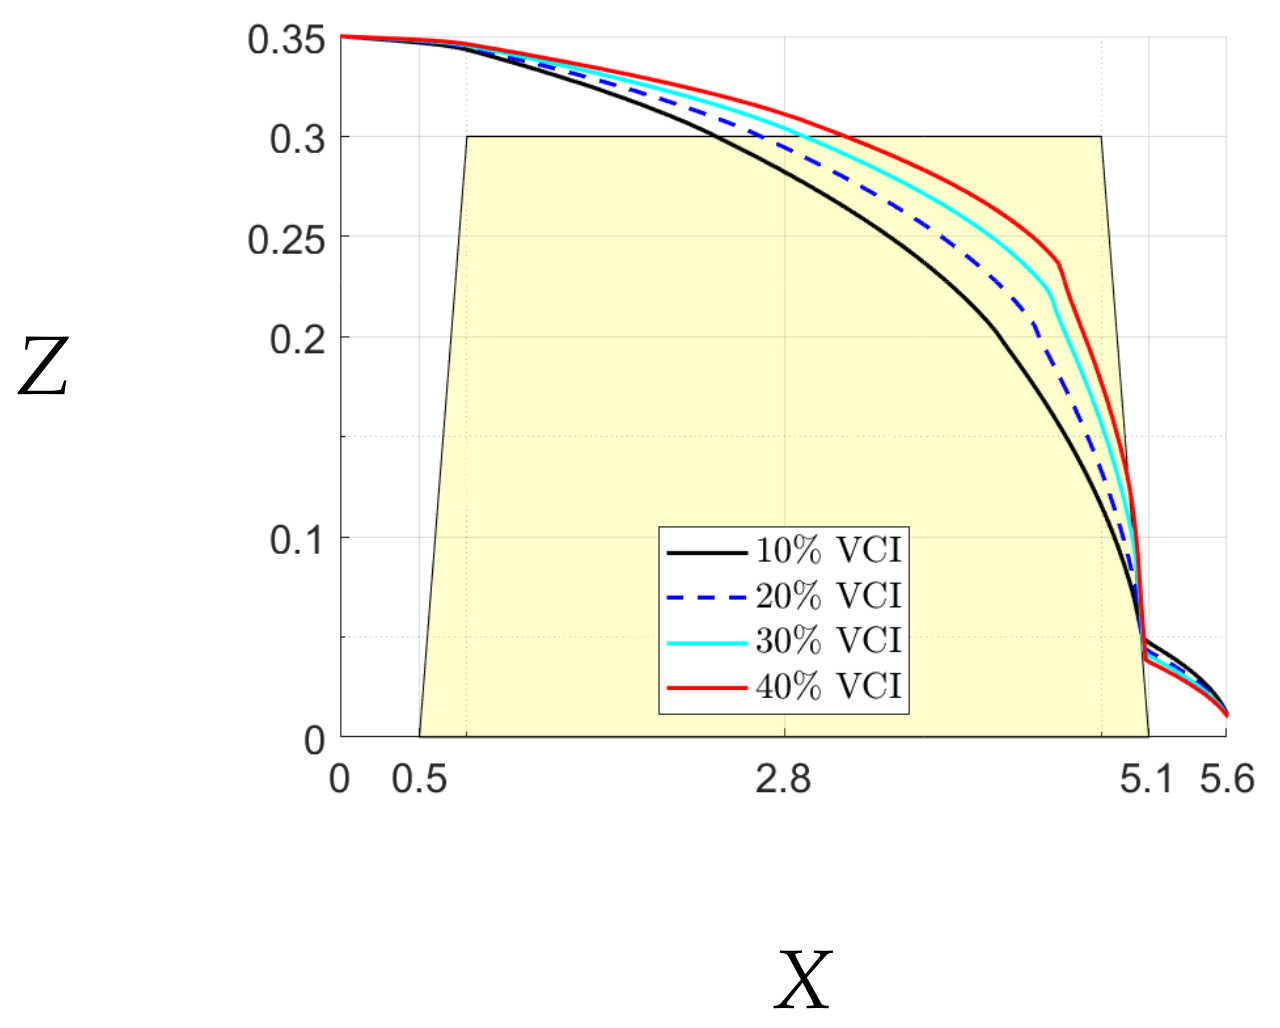
Figure 18.
The influence of the fouling ratio on the railway ballast (Model 2) when the layer 1 has different percentages of VCI where .
These figures show that even a small overtopping flow greatly alters the flow and the free surface moves close to the top far corner of the ballast. This may increase the chance of ballast scouring as the upper layer of the ballast may be less well supported. We can also see that, as expected, the presence of ballast fouling pushes the free surface of the flow further to the right, again increasing the change in the scour. All of these match the experimental results previously reported in the literature.
6. Conclusions
We have shown that we can modify the method to solve for flow through porous media to investigate more complex flows in which the free surface extends beyond the ballast. We have made a detailed comparison with the two previous experiments reported in the literature and have shown that we can obtain a good agreement. Such a comparison has not been reported in the literature previously. Finally, we have presented some preliminary calculations for a realistic rail track. These show that the fluid overtopping the ballast greatly shifts the free surface of the flow to the discharge end of the ballast. Any fouling of the ballast increases this shift in the position of the free surface. This fits with the reported experimental results. The model is relatively straightforward to implement using standard finite element code and can be used to make more detailed predictions and to aid in the prediction of potential flood damage to rail track.
Author Contributions
Conceptualisation, M.H.M. and R.A.; methodology, M.H.M. and R.A.; software, R.A.; validation, R.A.; formal analysis, R.A.; investigation, R.A.; writing—original draft preparation, R.A.; writing—review and editing, M.H.M. and R.A.; visualisation, R.A. All authors have read and agreed to the published version of the manuscript.
Funding
This research was supported under Australian Research Council’s Industrial Transformation Training Centres Scheme (ARC Training Centre for Advanced Technologies in Rail Track Infrastructure; IC170100006).
Institutional Review Board Statement
Not applicable.
Informed Consent Statement
Not applicable.
Data Availability Statement
Not applicable.
Conflicts of Interest
The authors declare no conflict of interest.
Appendix A. Further Validation and Convergence Study
Although our method is designed to solve for railway ballast, it is generally enough to compare it to other problems. We can compare our solution with the well-known test case reported in [8], which in turn follows from the analytical solution of [7]. This problem is shown in Figure A3. The iterative solution procedure is shown in Figure A2, and the final free surface comparison is shown in Figure A3. Further validation is shown in Figure A4 based on the previously reported numerical solution for a trapezoidal shape, and finally, we can compare with other experimental results Figure A5. The robustness and validity of our method are again confirmed.
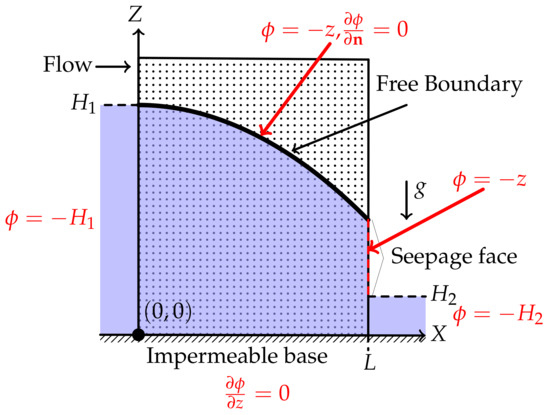
Figure A1.
Schematic diagram of the test problem where and [8].
Figure A1.
Schematic diagram of the test problem where and [8].
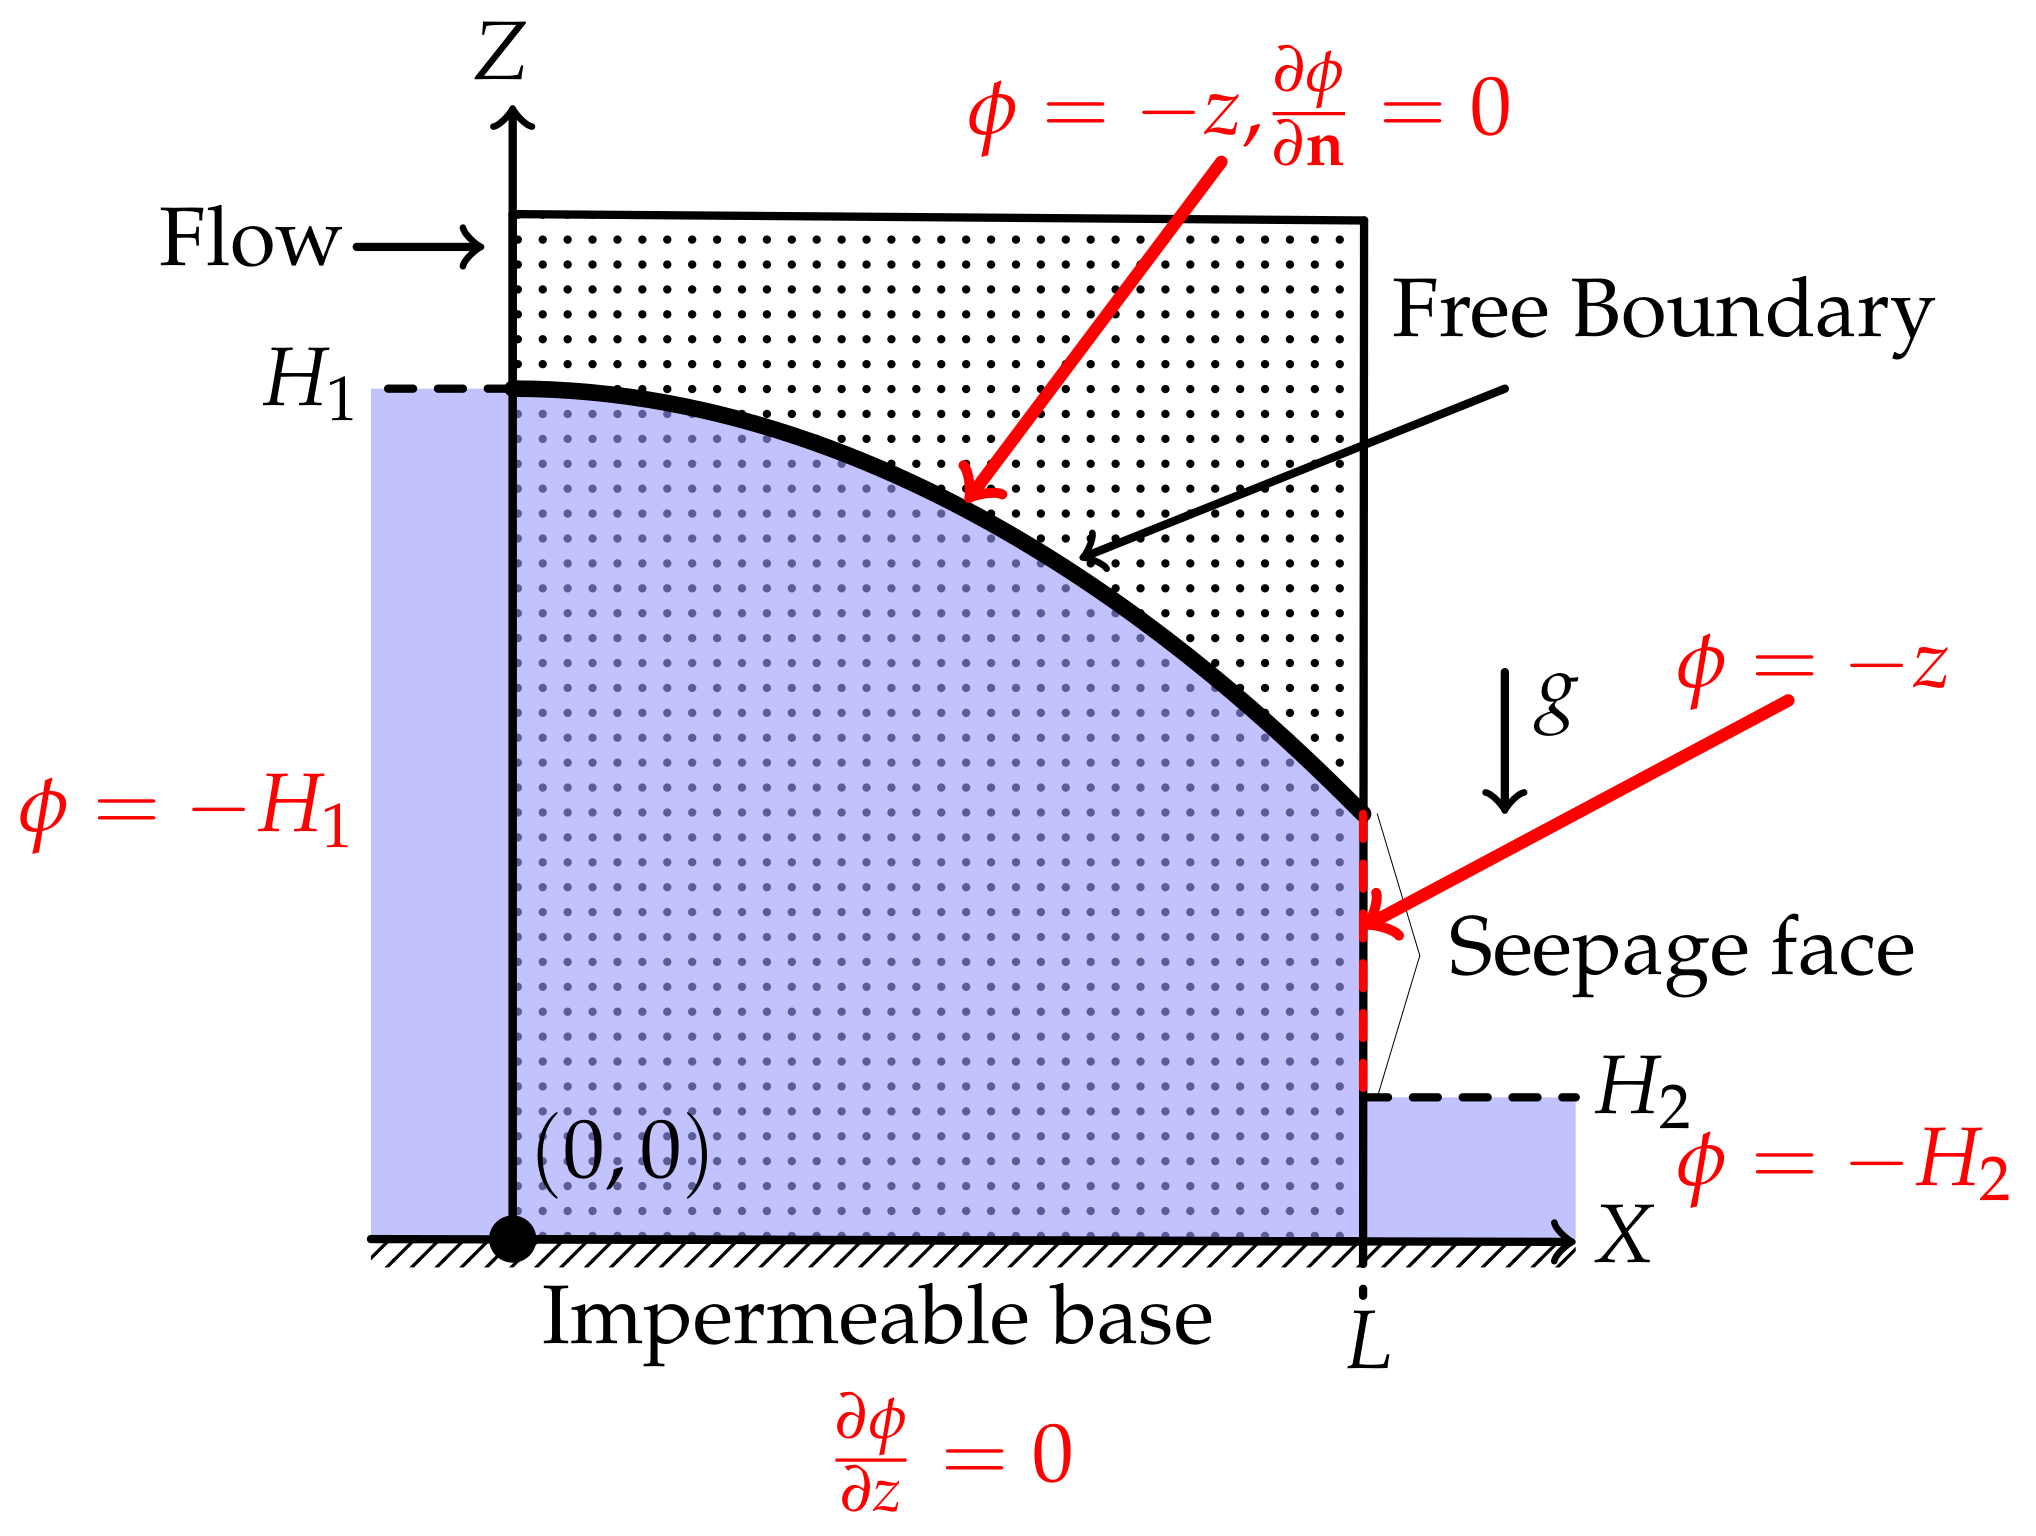
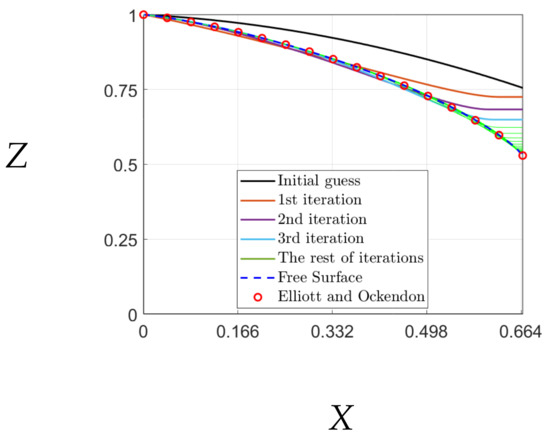
Figure A2.
The iterations of free boundary to obtain the free surface and the comparison for the results reported in [8].
Figure A2.
The iterations of free boundary to obtain the free surface and the comparison for the results reported in [8].
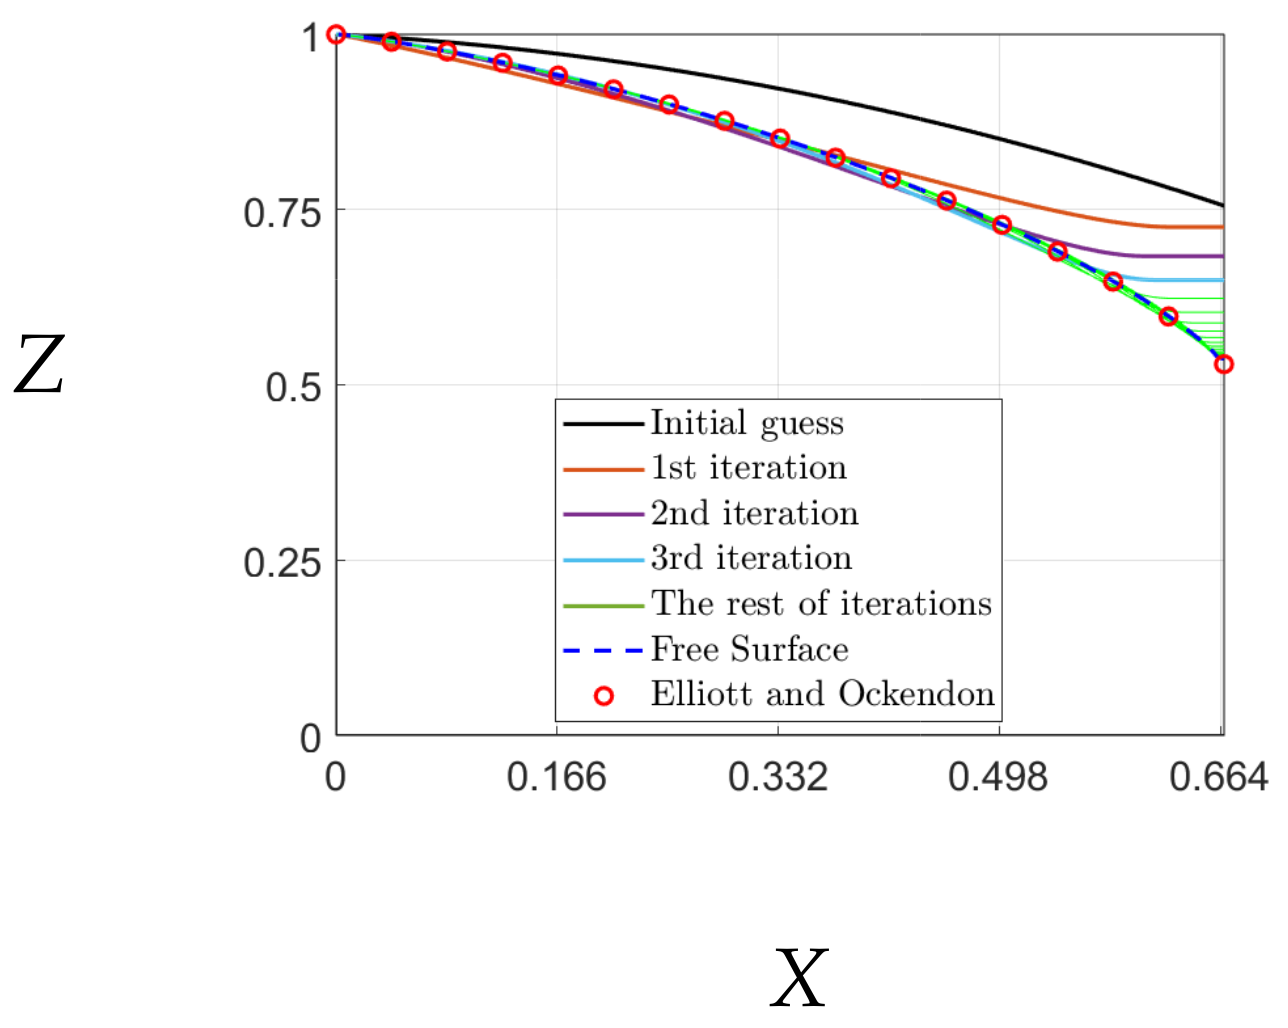
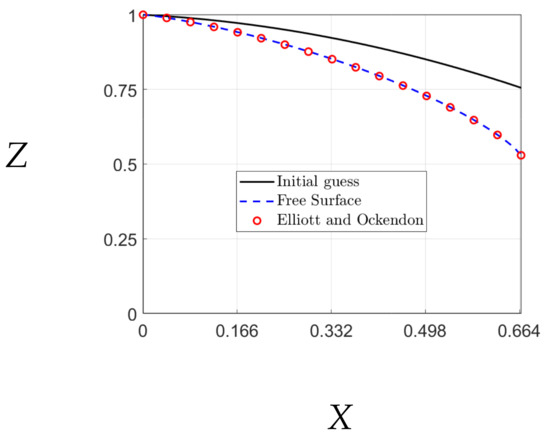
Figure A3.
Position of the free surface from our calculations and from [8] showing the excellent agreement.
Figure A3.
Position of the free surface from our calculations and from [8] showing the excellent agreement.
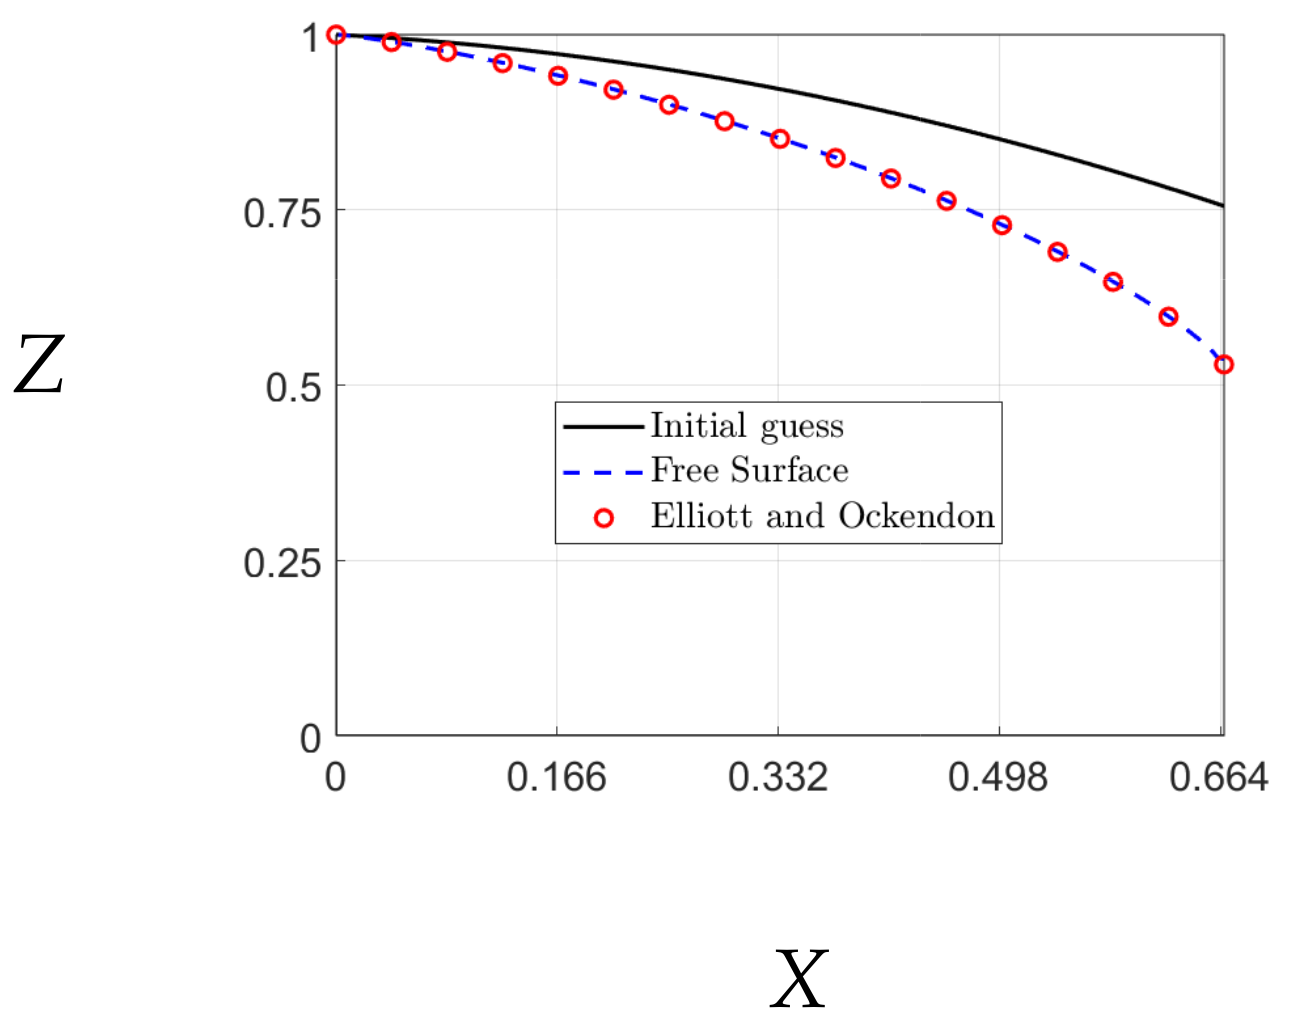
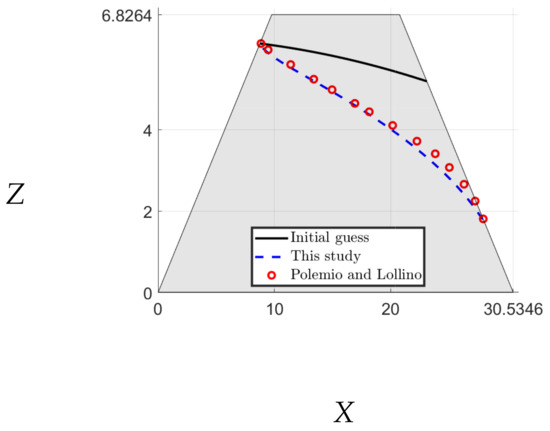
Figure A4.
Comparing our results for free surface for a trapezoid dam with the numerical solution of [11].
Figure A4.
Comparing our results for free surface for a trapezoid dam with the numerical solution of [11].

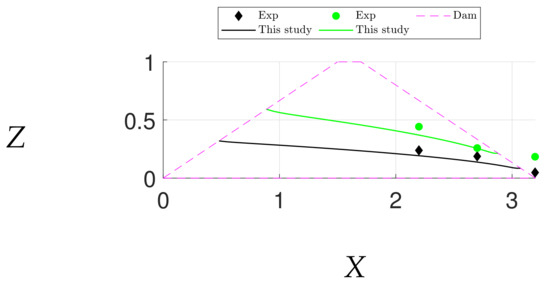
Figure A5.
Validating our results for the free surface for a trapezoid dam with the experiments of [16].
Figure A5.
Validating our results for the free surface for a trapezoid dam with the experiments of [16].

References
- Tsubaki, R.; Bricker, J.D.; Ichii, K.; Kawahara, Y. Development of Fragility Curves for Railway Embankment and Ballast Scour due to Overtopping Flood Flow. Nat. Hazards Earth Syst. 2016, 16, 2455–2472. [Google Scholar] [CrossRef] [Green Version]
- Johnston, I.; Murphy, W.; Holden, J. A Review of Floodwater Impacts on the Stability of Transportation Embankments. Earth-Sci. Rev. 2021, 215, 103553. [Google Scholar] [CrossRef]
- Tennakoon, N.; Indraratna, B.; Rujikiatkamjorn, C.; Nimbalkar, S.; Neville, T. The Role of Ballast-Fouling Characteristics on the Drainage Cpacity of Rail Substructure. Geotech. Test. J. 2012, 35, 629–640. [Google Scholar] [CrossRef] [Green Version]
- Alrdadi, R.; Meylan, M.H. Modelling Water Flow through Railway Ballast with Random Permeability and a Free Boundary. Appl. Math. Model. 2021, 103, 36–50. [Google Scholar] [CrossRef]
- Tsubaki, R.; Kawah, Y.; Ueda, Y. Railway Embankment Failure due to Ballast Layer Breach Caused by Inundation Flows. Nat. Hazards 2017, 87, 717–738. [Google Scholar] [CrossRef]
- Kalyanaraman, B.; Meylan, M.H.; Lamichhane, B. Coupled Brinkman and Kozeny–Carman Model for Railway Ballast Washout using the Finite Element Method. J. R. Soc. N. Z. 2021, 51, 375–388. [Google Scholar] [CrossRef]
- Kochina, P. Theory of Ground Water Movement; Princeton University Press: Princeton, NJ, USA, 1962. [Google Scholar]
- Elliott, C.M.; Ockendon, J.R. Weak and Variational Methods for Moving Boundary Problems; Pitman: Boston, MA, USA, 1982. [Google Scholar]
- Xiao, J.E.; Ku, C.Y.; Liu, C.Y.; Fan, C.M.; Yeih, W. On Solving Free Surface Problems in Layered Soil using the Method of Fundamental Solutions. Eng. Anal. Bound. Elem. 2017, 83, 96–106. [Google Scholar] [CrossRef]
- Atmojo, P.S.; Sachro, S.S.; Edhisono, S.; Hadihardaja, I.K. Simulation of the Effectiveness of the Scouring Prevention Structure at the External Rail Ballast using Physical Model. Int. J. GEOMATE 2018, 15, 178–185. [Google Scholar] [CrossRef]
- Polemio, M.; Lollino, P. Failure of Infrastructure Embankments Induced by Flooding and Seepage: A Neglected Source of Hazard. Nat. Hazards Earth Syst. 2011, 11, 3383–3396. [Google Scholar] [CrossRef] [Green Version]
- Pritchard, P.J.; Mitchell, J.W. Fox and McDonald’s Introduction to Fluid Mechanics; John Wiley & Sons: Hoboken, NJ, USA, 2016. [Google Scholar]
- Vafai, K. (Ed.) Handbook of Porous Media; CRC Press: Boca Raton, FL, USA, 2015. [Google Scholar]
- Danquah, W.O.; Ghataora, G.S.; Burrow, M.N. The Effect of Ballast Fouling on the Hydraulic Conductivity of the Rail Track Substructure. In Proceedings of the XV Danube-European Conference on Geotechnical Engineering (DECGE), Vienna, Austria, 9–11 September 2014; Austrian Society for Soil Mechanics and Geotechnical Engineering: Vienna, Austria, 2014. [Google Scholar]
- Koohmishi, M.; Palassi, M. Effect of Gradation of Aggregate and Size of Fouling Materials on Hydraulic Conductivity of Sand-Fouled Railway Ballast. Constr. Build. Mater. 2018, 167, 514–523. [Google Scholar] [CrossRef]
- Larese, A.N.; Rossi, R.; Onate, E.; Idelsohn, S. A Coupled PFEM–Eulerian Approach for the Solution of Porous FSI Problems. Comput. Mech. 2012, 50, 805–819. [Google Scholar] [CrossRef]


Publisher’s Note: MDPI stays neutral with regard to jurisdictional claims in published maps and institutional affiliations. |
© 2022 by the authors. Licensee MDPI, Basel, Switzerland. This article is an open access article distributed under the terms and conditions of the Creative Commons Attribution (CC BY) license (https://creativecommons.org/licenses/by/4.0/).