Abstract
The flow field development through a simplified shock absorber orifice geometry is investigated using a single phase Large Eddy Simulation. Hydraulic oil is used as the working fluid with a constant inlet velocity and an open top boundary to allow the study to focus on the free shear layer and the flow development in the vicinity of the main orifice. The flow field is validated using standard mixing layer dynamics. The impact of the orifice shape is discussed with regards to the initial free shear layer growth, boundary layer development and the potential appearance of cavitation bubbles. Observations are made regarding the presence of flow field disturbances upstream of and through the orifice, thereby, leading to a notable turbulence intensity level in those regions.
1. Introduction
Aircraft landing gear shock absorbers are used to protect the main aircraft structure from the loads and forces during the landing impact and other ground manoeuvres. Most large commercial airliners use oleo-pneumatic type shock absorbers, which have been the most popular type on jet aircraft for decades. These usually include hydraulic oil being forced through a main orifice creating hydrodynamic resistance to the motion and a pressure differential across the orifice in addition to some gas (often nitrogen), that is either in direct contact with the hydraulic oil or separated in its own chamber to provide a restoring force to an equilibrium position under static loading conditions on the ground.
The hydraulic resistance of fluid moving through the orifice of the shock absorber has been identified by previous studies as the main energy absorption mechanism during the operation of oleo-pneumatic shock absorbers [1,2]. This hydraulic resistance is directly associated with the free shear layer developing downstream of the main orifice in the shock absorber, which contributes to the impact absorption by dissipating the bulk flow energy through the turbulence cascade, as viscous heat from the smallest scales of turbulent eddies. Hence, the orifice design and its impact on the downstream near-field flow development is of particular importance when considering the internal dynamics of shock absorbers and their impact on performance.
Previous investigations into oleo-pneumatic shock absorber performance mostly focused on the use of dynamic systems models to simulate the system [1,3], while others concentrated on the estimate of a particular parameter, such as the discharge coefficient of the main orifice [4]. The task of predicting the performance of an oleo-pneumatic shock absorber usually requires simplifying assumptions due to the complexity of the field and the multiphysics nature of the problem. Furthermore, interest in the overall integral performance often leads to the adoption of lower fidelity methods and, hence, reduces the details available on the internal shock absorber dynamics.
The present study aims to investigate a specific feature of the underlying flow physics inside a typical shock absorber by conducting a single phase simulation through representative oleo-pneumatic shock absorber geometry, which was closely based on the geometry used by Milwitzky and Cook [1] in their drop down experiments. The flow development through the orifice is discussed using a range of flow variables to help identify some key elements of the design and their effects on the flow field.
2. Numerical Methods
OpenFoam (v2006) [5,6] was used to conduct time-dependent scale resolving simulations. OpenFoam uses an unstructured finite volume approach to simulate fluid flow, which facilitates the handling of complex geometries that are expected in industrial type applications, as in the case of the shock absorbers investigated here. Field properties are stored at the centroid of each cell and then calculated at each cell surface "face" by interpolating the values at the centroids of the two cells sharing that face. Conservation laws are then applied based on theses face values, in accordance with the chosen discretization scheme.
The PIMPLE algorithm [7] is selected in the present simulations, as it provides good stability and convergence control options. PIMPLE utilises an outer loop based on the PISO algorithm [8] to capture the field development in time, while an inner loop based on the SIMPLE algorithm [9] solves each field instance as a steady problem. The interpolation method used in the present study is a second order linear interpolation, which is a standard choice in many finite volume solvers. The convective term is discretized using a second order limited linear scheme, which provides a balance between accuracy and stability through limiting the nonlinear term. While the diffusive term is discretized using a second order linear scheme and temporal integration is conducted using a second order Crank-Nicolson method.
After the discretization process, the resulting linear system for the pressure field is solved for using a Preconditioned Conjugate Gradient (PCG) method, while the velocity field system is found using a Preconditioned Bi-Conjugate Gradient method (PBiCG). An adjustable time step is used to insure that the Courant–Friedrich–Lewy (CFL) number remains below throughout the simulation, to aid in achieving a balance between efficiency and stability during these simulations. The WALE subgrid scale model [10] is used to model the eddy viscosity of the subgrid scales in the Large Eddy Simulation, (LES) framework. The flow field is allowed to develop by allowing multiple through-flows across the entire domain, then time averaging is conducted until statistical convergence is reached for all turbulent properties of interest.
3. Methodology and Computational Setup
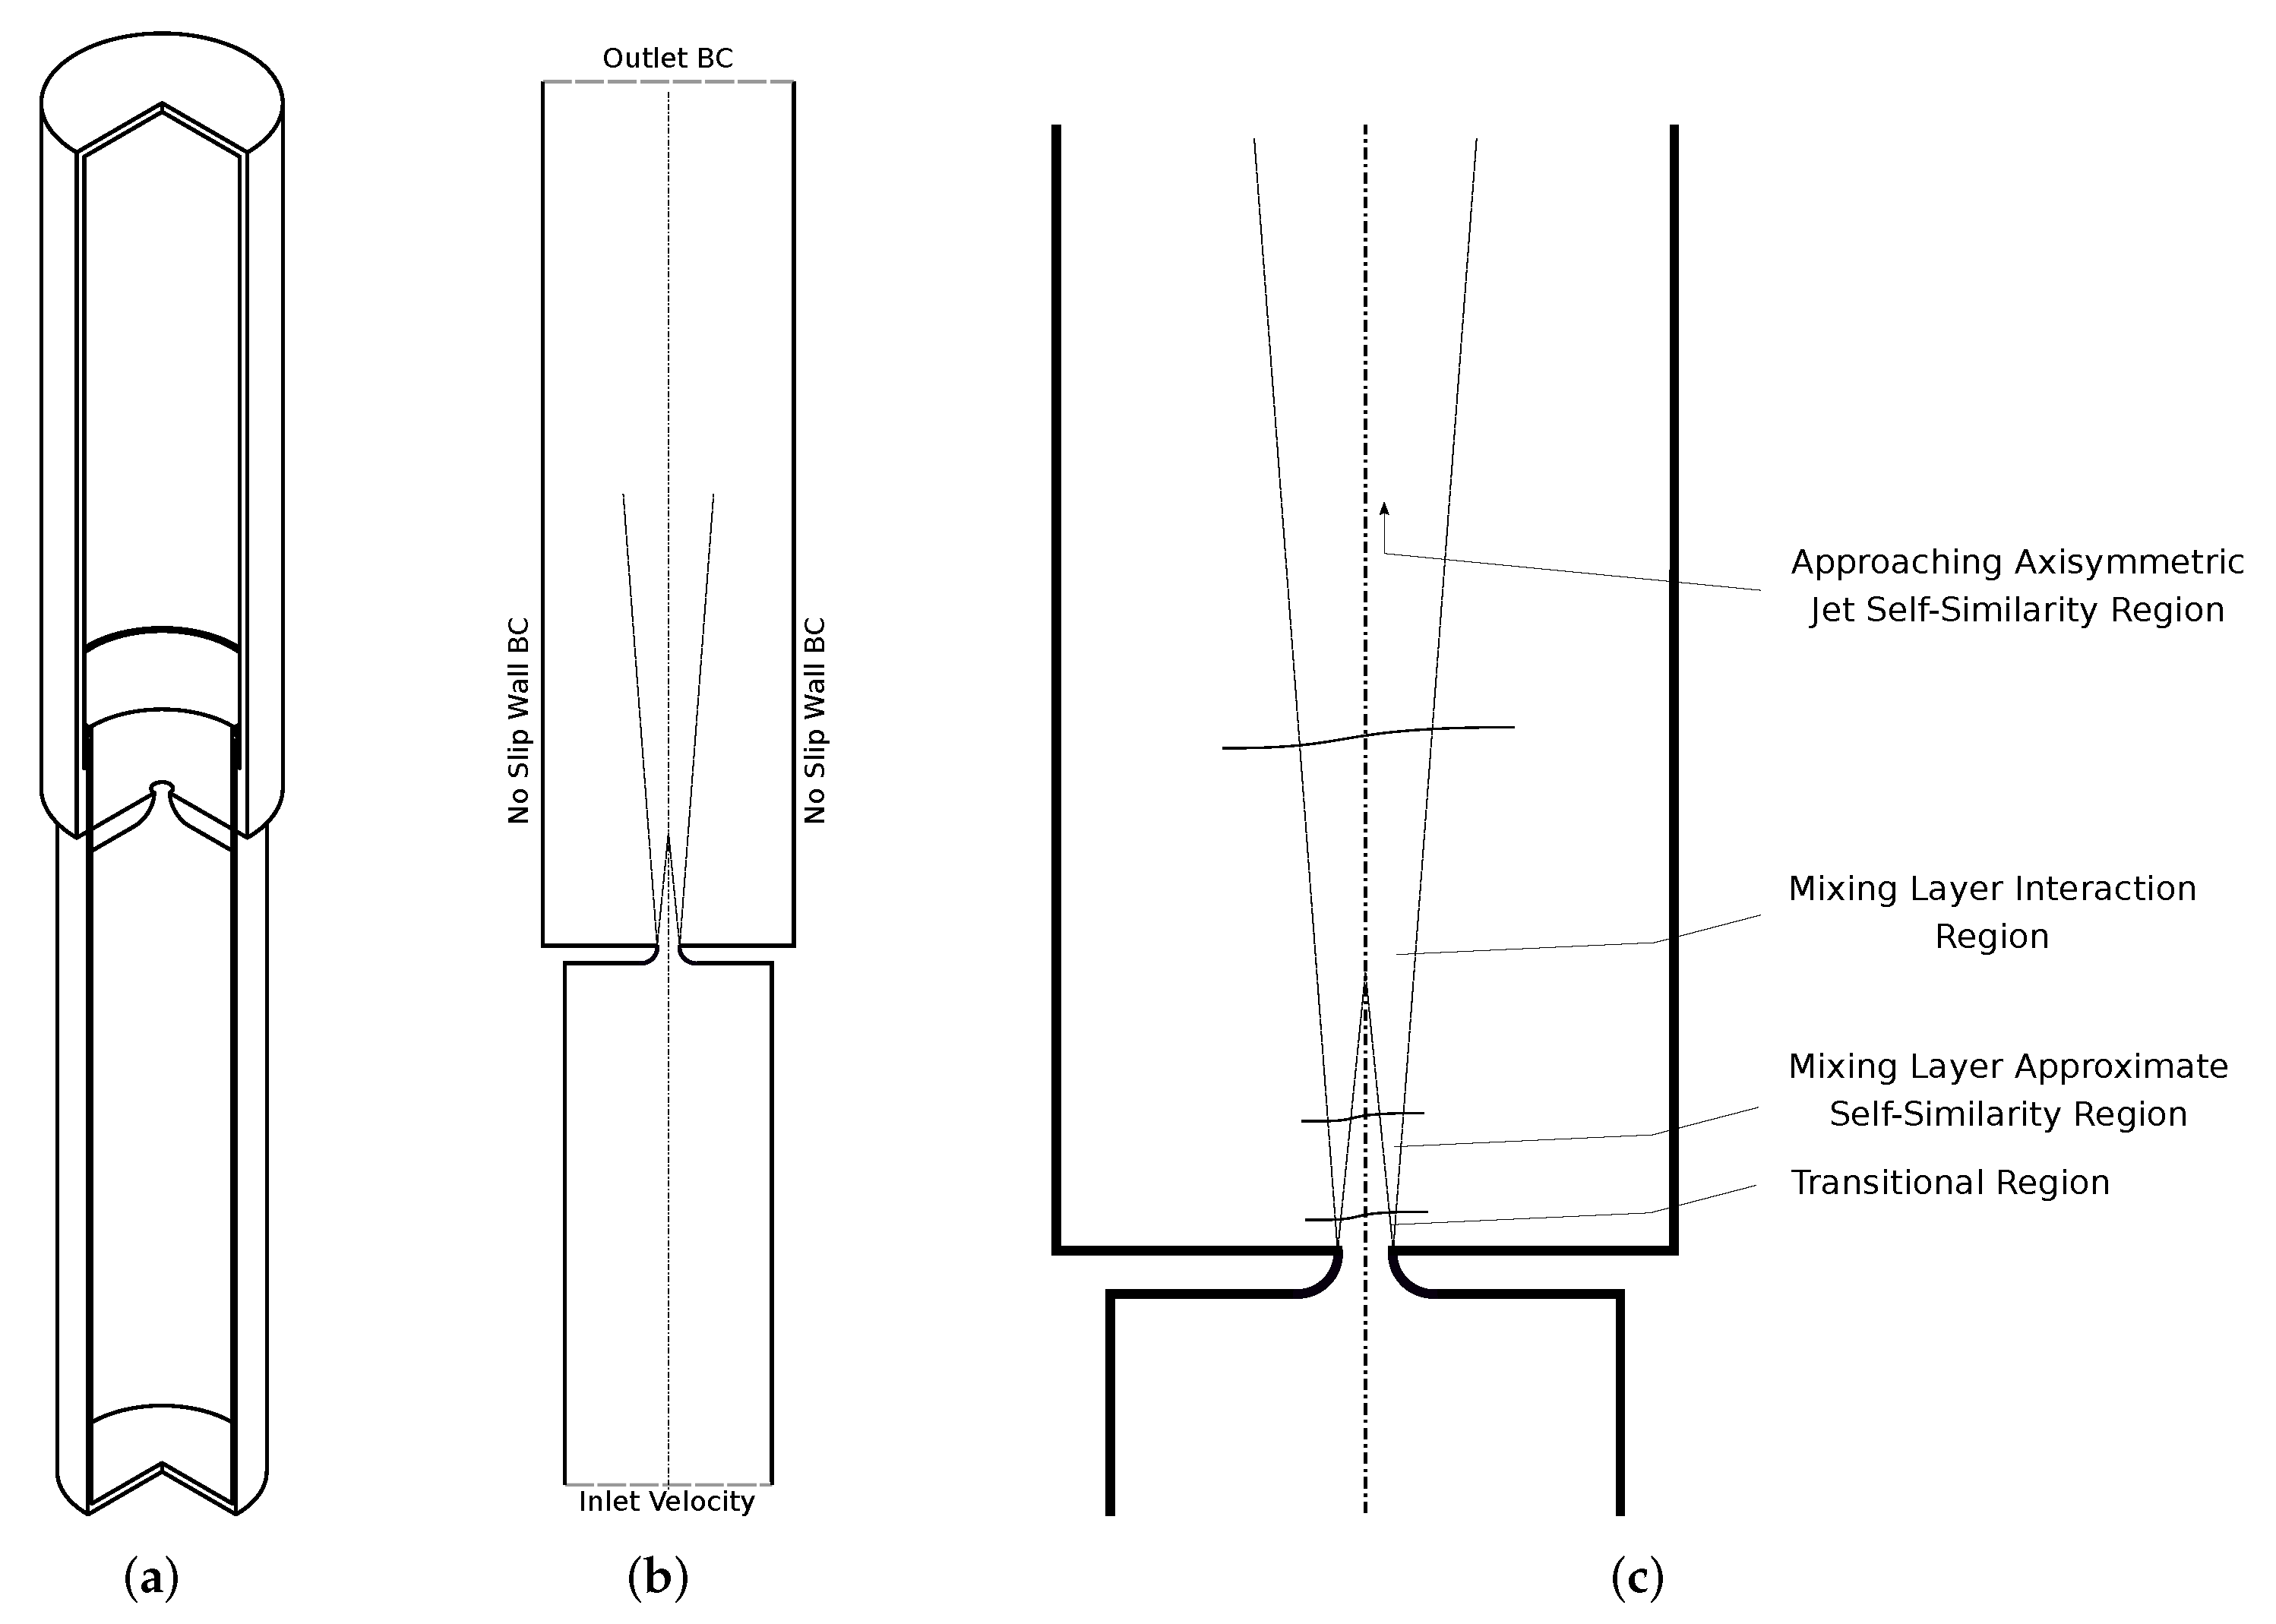
The baseline orifice geometry, illustrated in Figure 1, is essentially similar to that of a convergent nozzle, with the throat being at the orifice exit. The rounded outer (upstream) edge of the orifice helps avoid any boundary layer separation on the orifice’s inner surface, while the accelerating flow through the favourable pressure gradient through the orifice allows relatively strong flow turning in the flow direction so that the flow can be tangential to the axial (streamwise) direction at the orifice exit. An axisymmetric three dimensional simulation is conducted on a simplified geometry of the shock absorber that focuses on the orifice tip region and the developing shear layer in its vicinity.

Figure 1.
Shock absorber geometry and some setup details (a) Schematic view of the simplified shock absorber geometry; (b) The computational domain with the applied boundary conditions; (c) Axisymmetric shear layer development regions, following Bradshaw et al. [11].
Grids of varying resolution were generated and tested to establish grid independence and optimise the setup where possible. The resolution in the shear layer region was tested using a preliminary simulation on a grid with 185,000 nodes. An analysis was conducted to check the required resolution in the main simulation, including looking at the estimated mixing layer thickness near the orifice tip to determine the grid resolution required there. The boundary conditions are illustrated on Figure 1, while further information about the case is provided in Table 1.

Table 1.
Case details for the scale-resolving 3D axisymmetric free shear layer simulation.
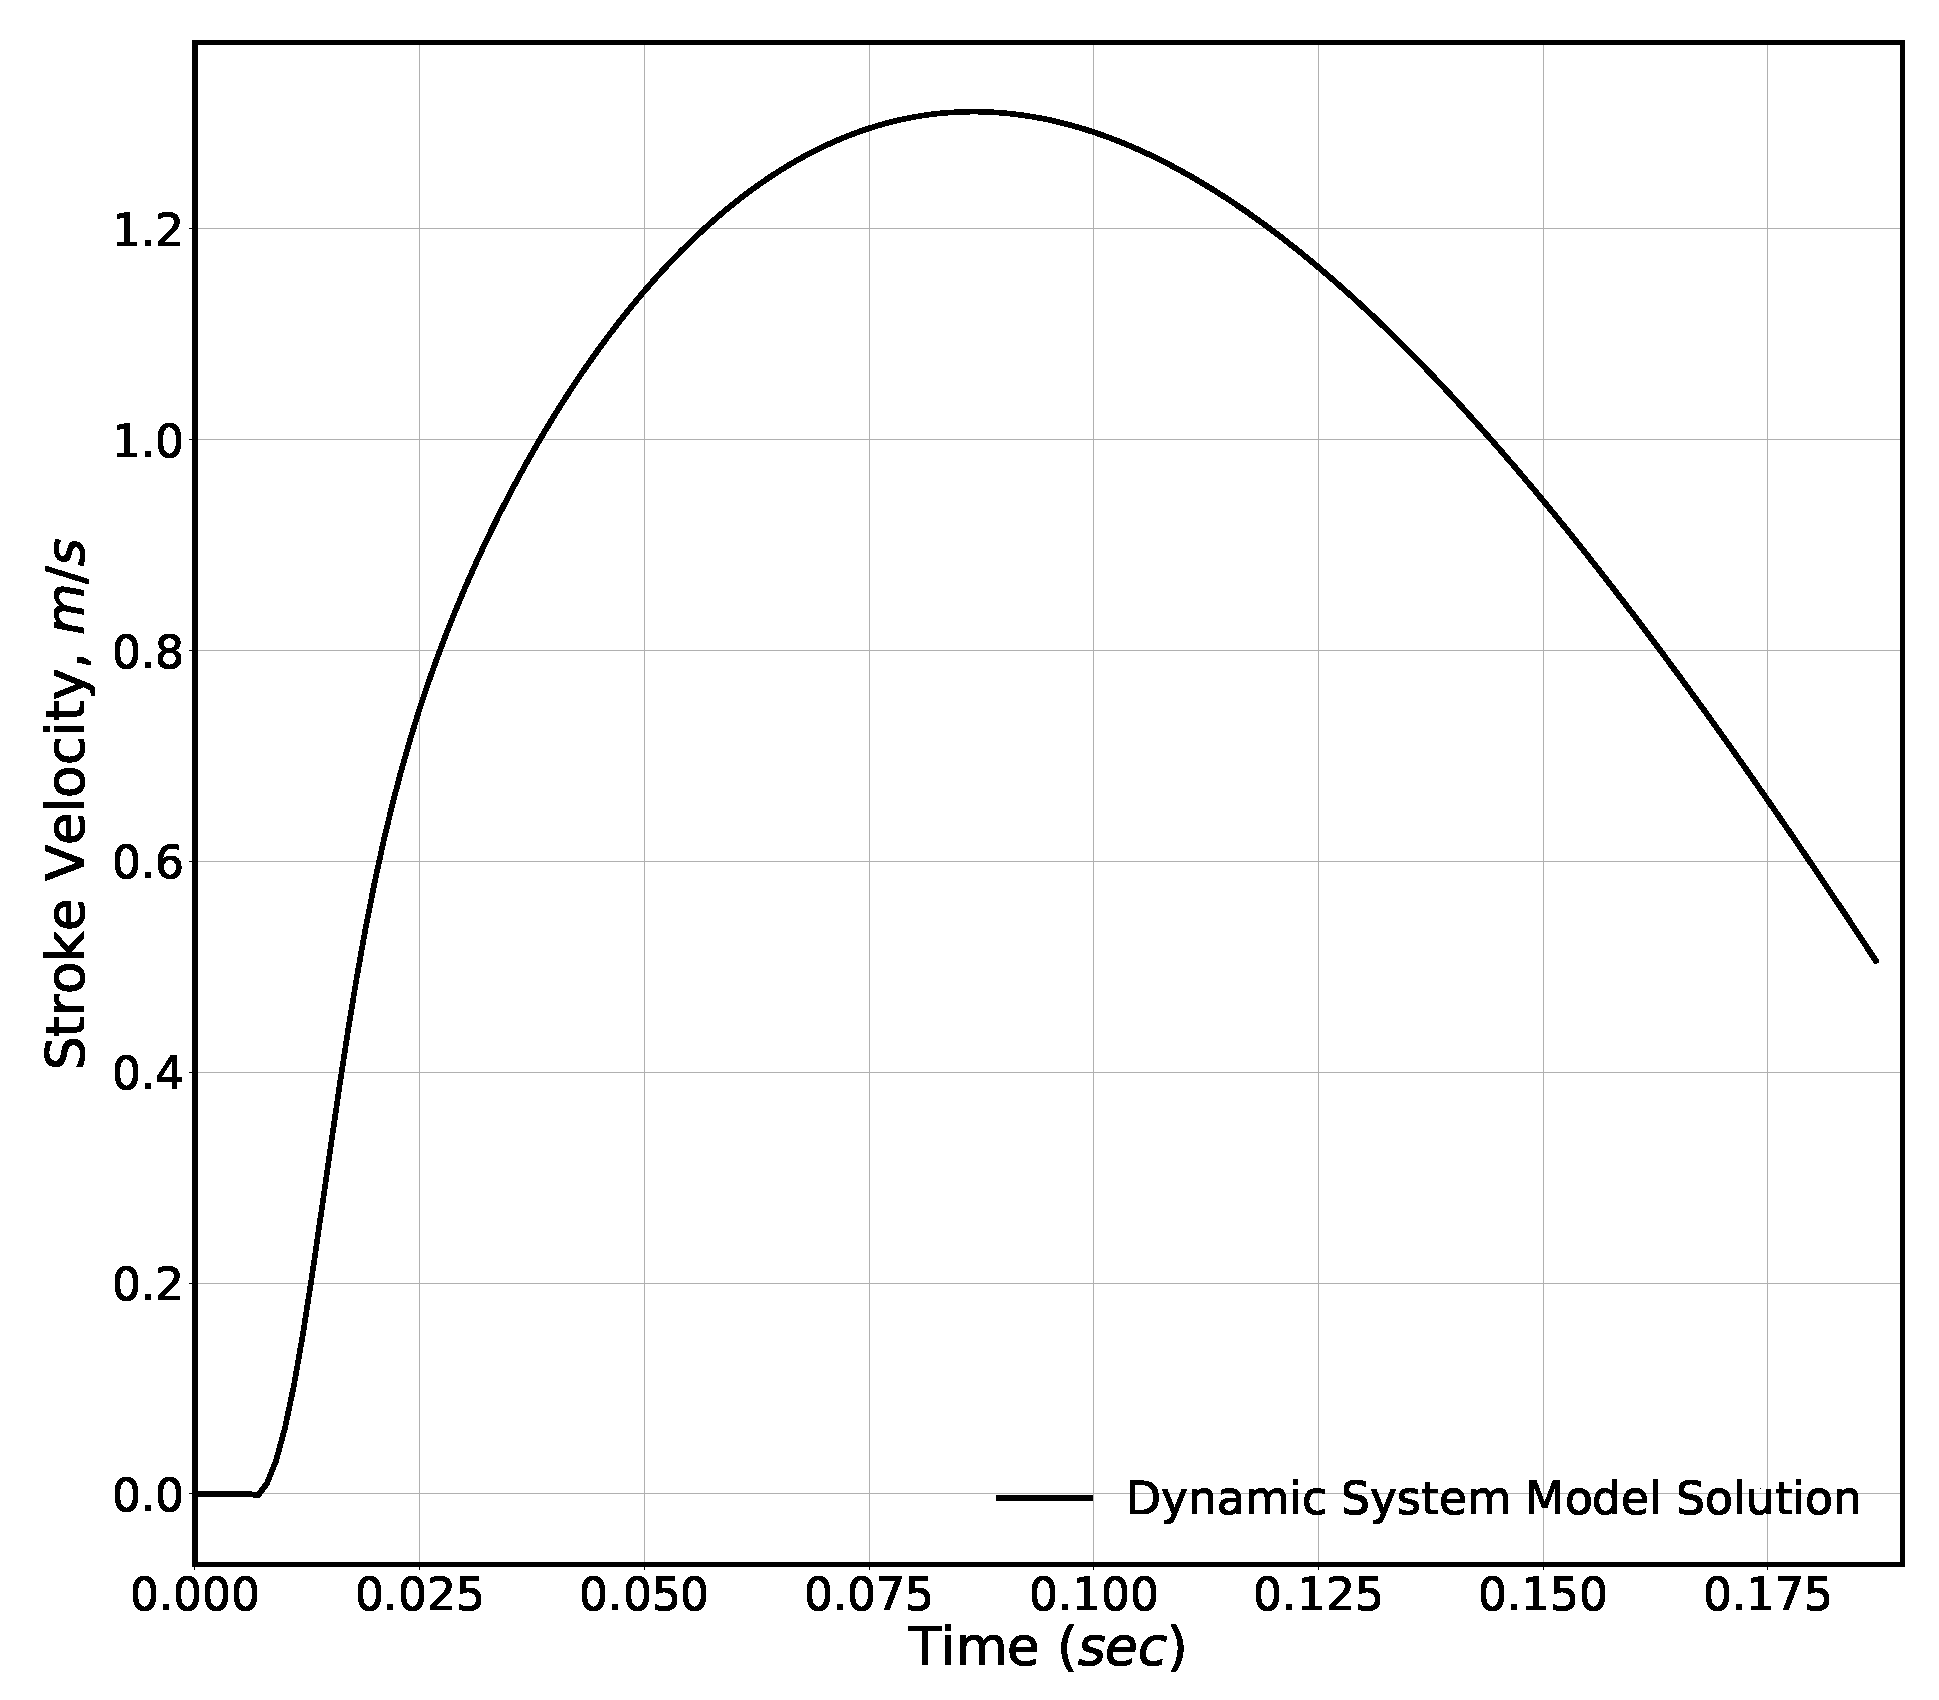
The inlet boundary condition is taken to be a constant vertical flow through the shock absorber m/s as a representative figure of an approximately time-averaged value over the stroke period from the Milwitzky and Cook [1] drop test. The stroke shape and value, corresponding to the drop test, can be seen in Figure 2, and these were obtained using a dynamic system model simulation of the drop test following the analysis in Milwitzky and Cook [1]. The initial delay in the response of the shock absorber, the flat region at time = 0.0 s, is due to the force required to deflect the tire and other internal effects (e.g., the gas pressure force), which leads to the shock absorber behaving as a rigid body during the early stages of impact; however, this is quickly overcome by the impact resulting in the subsequent stroke profile.
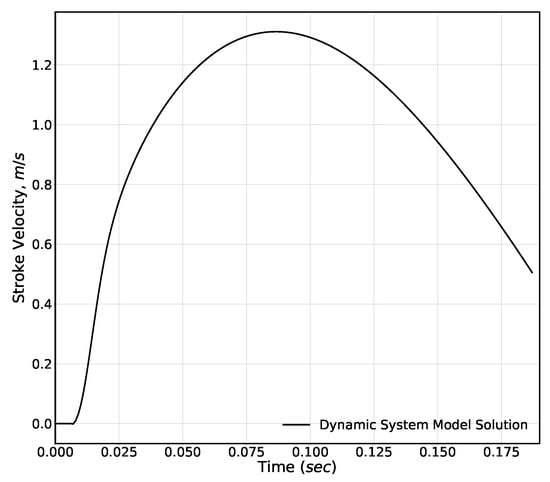
Figure 2.
Shock absorber stroke velocity profile from a dynamic system model simulating a drop test used to choose a suitable inlet velocity value in the LES study.
The flow in the present simulation is assumed to be incompressible, which is justified due to the low Mach number prevalent throughout the computational domain, and, since the focus of the study is on the free shear layer under a constant inlet velocity, we ignore the influence of the transient compression pressure waves associated with the movement of the piston in a real shock absorber. This assumption helps to increase the efficiency of the simulation by allowing the numerical stability to be determined by the hydrodynamic time-scale rather than the more restrictive acoustic time-scale.
Once the free shear layer becomes fully turbulent, it is expected to follow a nearly linear spreading rate, which is a standard result that has been reported in many studies [12]. There are two main methods of measuring the spreading rate of the mixing layer. The first tracks the width of the shear layer defined by the expansion of the lines through specific velocity ratios across the shear layer as detailed in Equations (1) to (3). The other method of calculating the spreading rate focuses on the growth of the shear layer’s momentum thickness as defined in Equations (4) and (5).
The edge of the free shear layer for each profile was found locally based on the vorticity magnitude and streamwise velocity value, and then the high and low velocity values across the profile were defined, and their difference was used for normalisation of the velocity values across that specific profile. The self-similarity distance variable is defined according to Equation (6) where the capital vertical coordinate Y has its origin at the orifice exit.
It should be noted that, in the present simulation, the streamwise direction is along the vertical y-direction with the corresponding velocity component and turbulent (Reynolds) stress component, . For the purposes of analysing the near-field free shear layer development, a two-dimensional (2D) section (x-y plane at ) is extracted from the three-dimensional domain, where the mixing layer is quasi two-dimensional within a distance equivalent to a few orifice diameters downstream of the orifice exit.
In this region, the mixing layer is expected to exhibit standard behaviour that can be used to validate the simulation against similar mixing layer characteristics reported in experimental investigations, which acts as a substitute to the lack of internal shock absorber data available in the literature for validation. Noting that the Cylindrical and Cartesian coordinate systems are equivalent on the extracted x-y plane, the cross-flow Reynolds stress component is , and the spanwise stress component is relative to the mixing layer development in the quasi two-dimensional region.
4. Results and Discussion
The results from the three-dimensional and scale-resolved turbulence simulation of the shock absorber’s shear layer are generally consistent with standard results for the mixing layer and round jet cases found in the literature. Transition occurs relatively quickly due to the strong primary instability associated with the discontinuity in the velocity profile at the orifice tip, thus, leading to an exponentially growing instability. Within about one orifice diameter downstream of the tip, the shear layer develops secondary and tertiary instabilities, and the larger coherent structures start breaking down to smaller eddy scales as the turbulent cascade progressively forms the inertial sub-range and the dissipation range at the smallest scales where energy is dissipated as viscous heating.
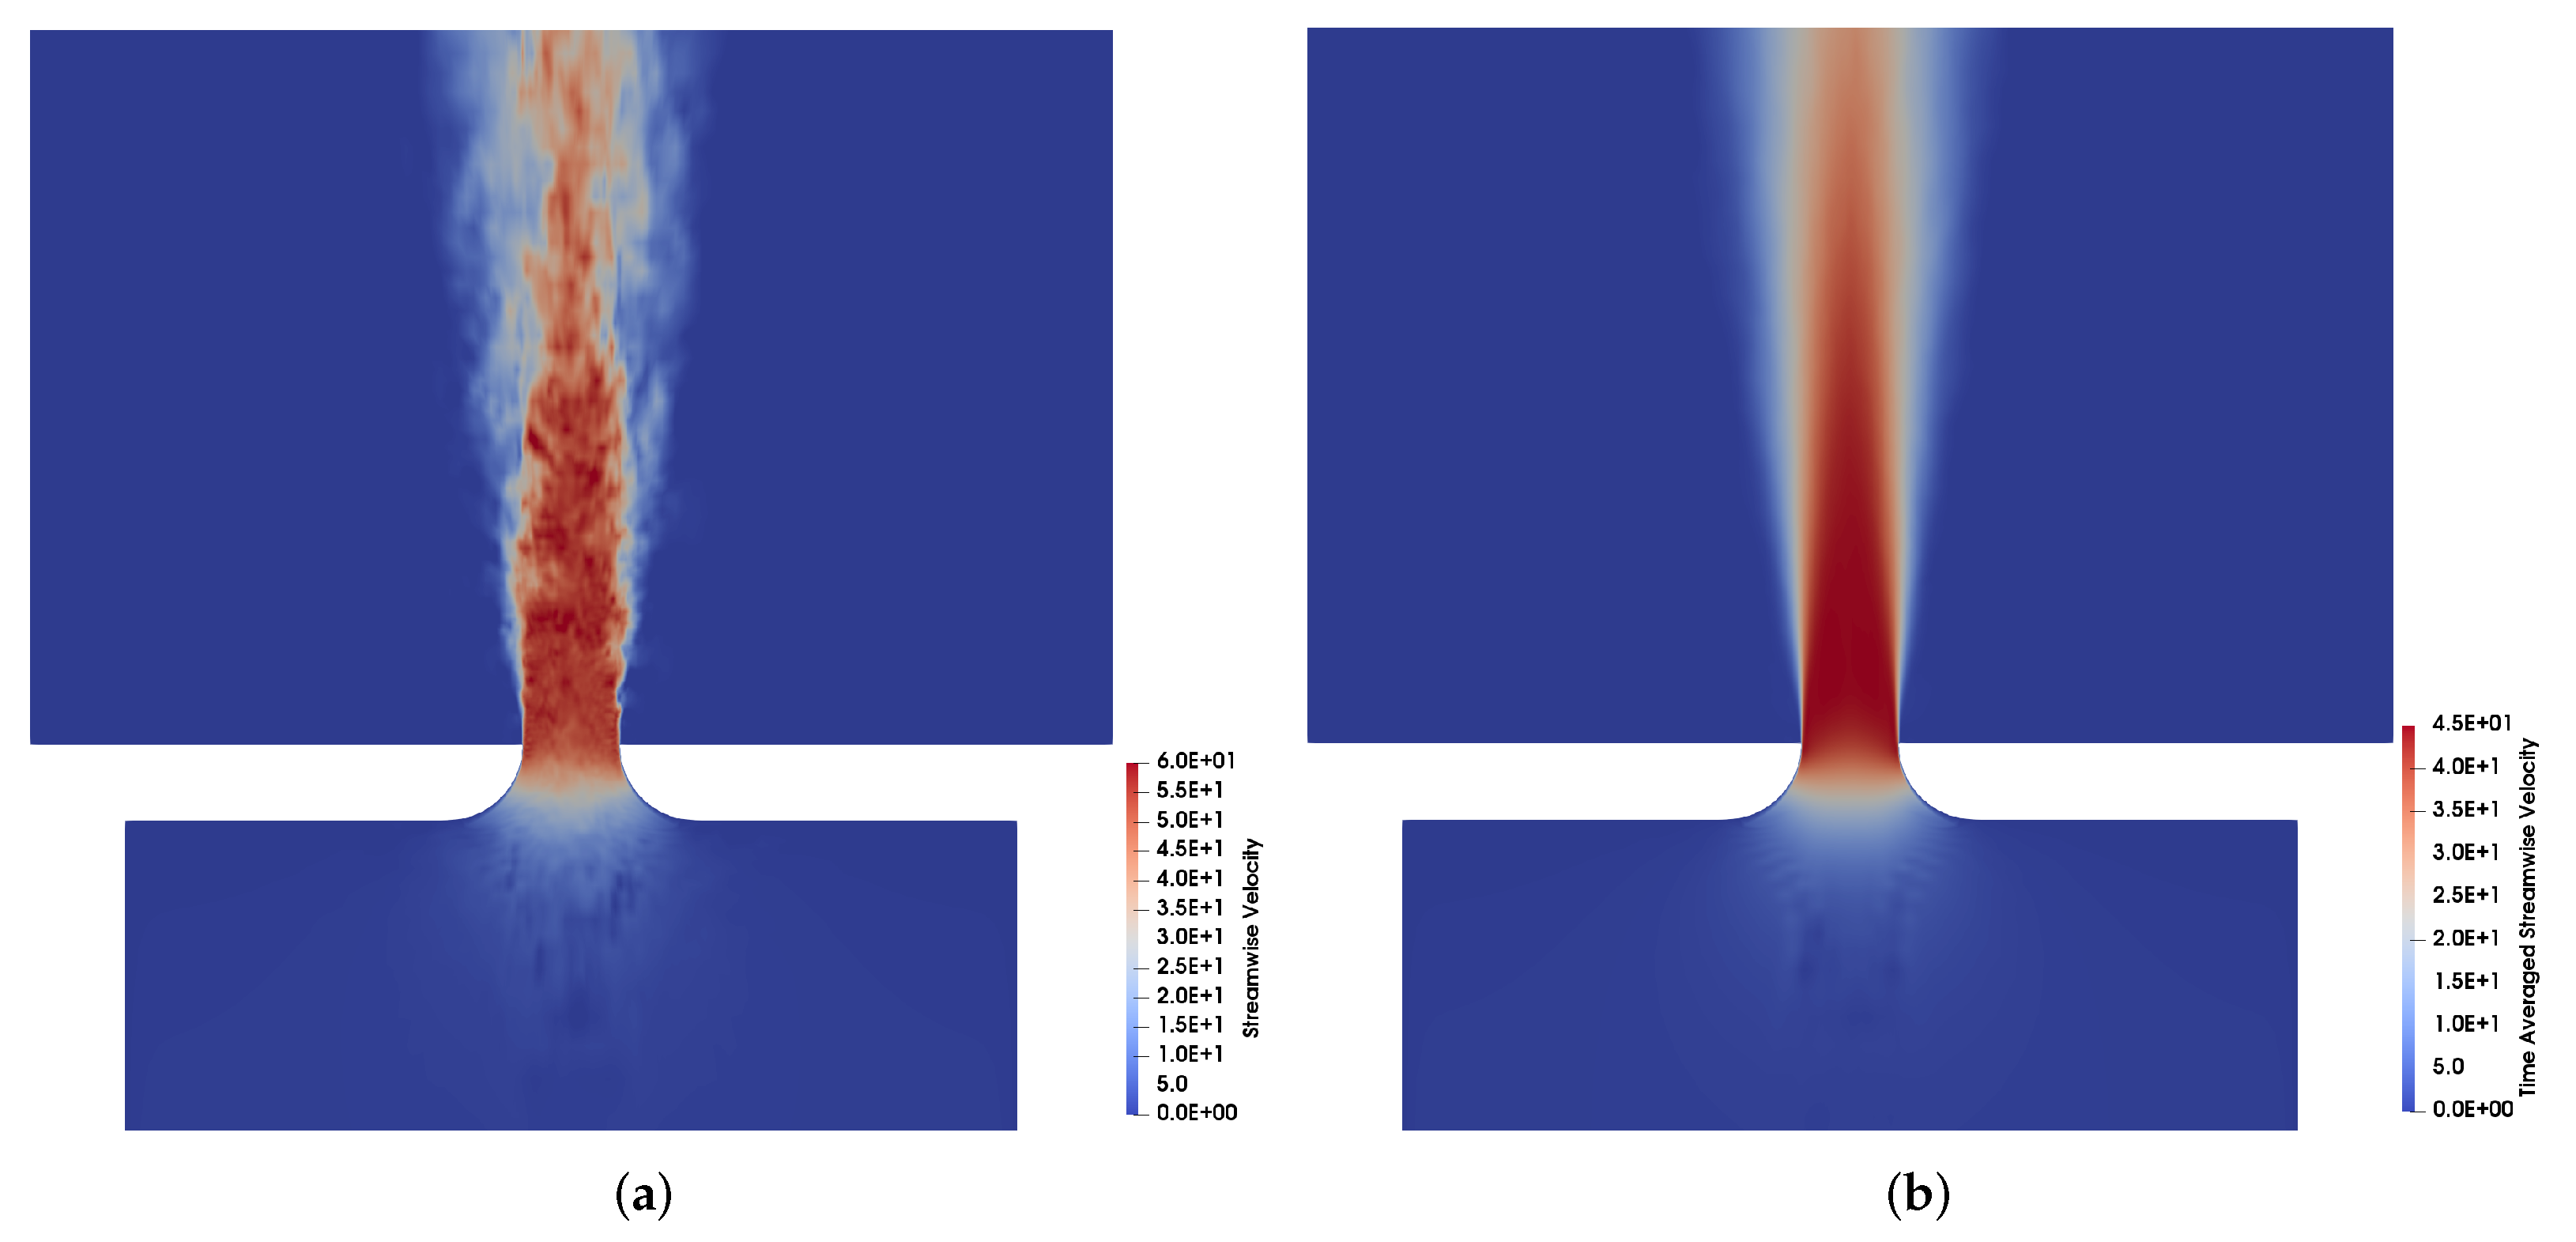
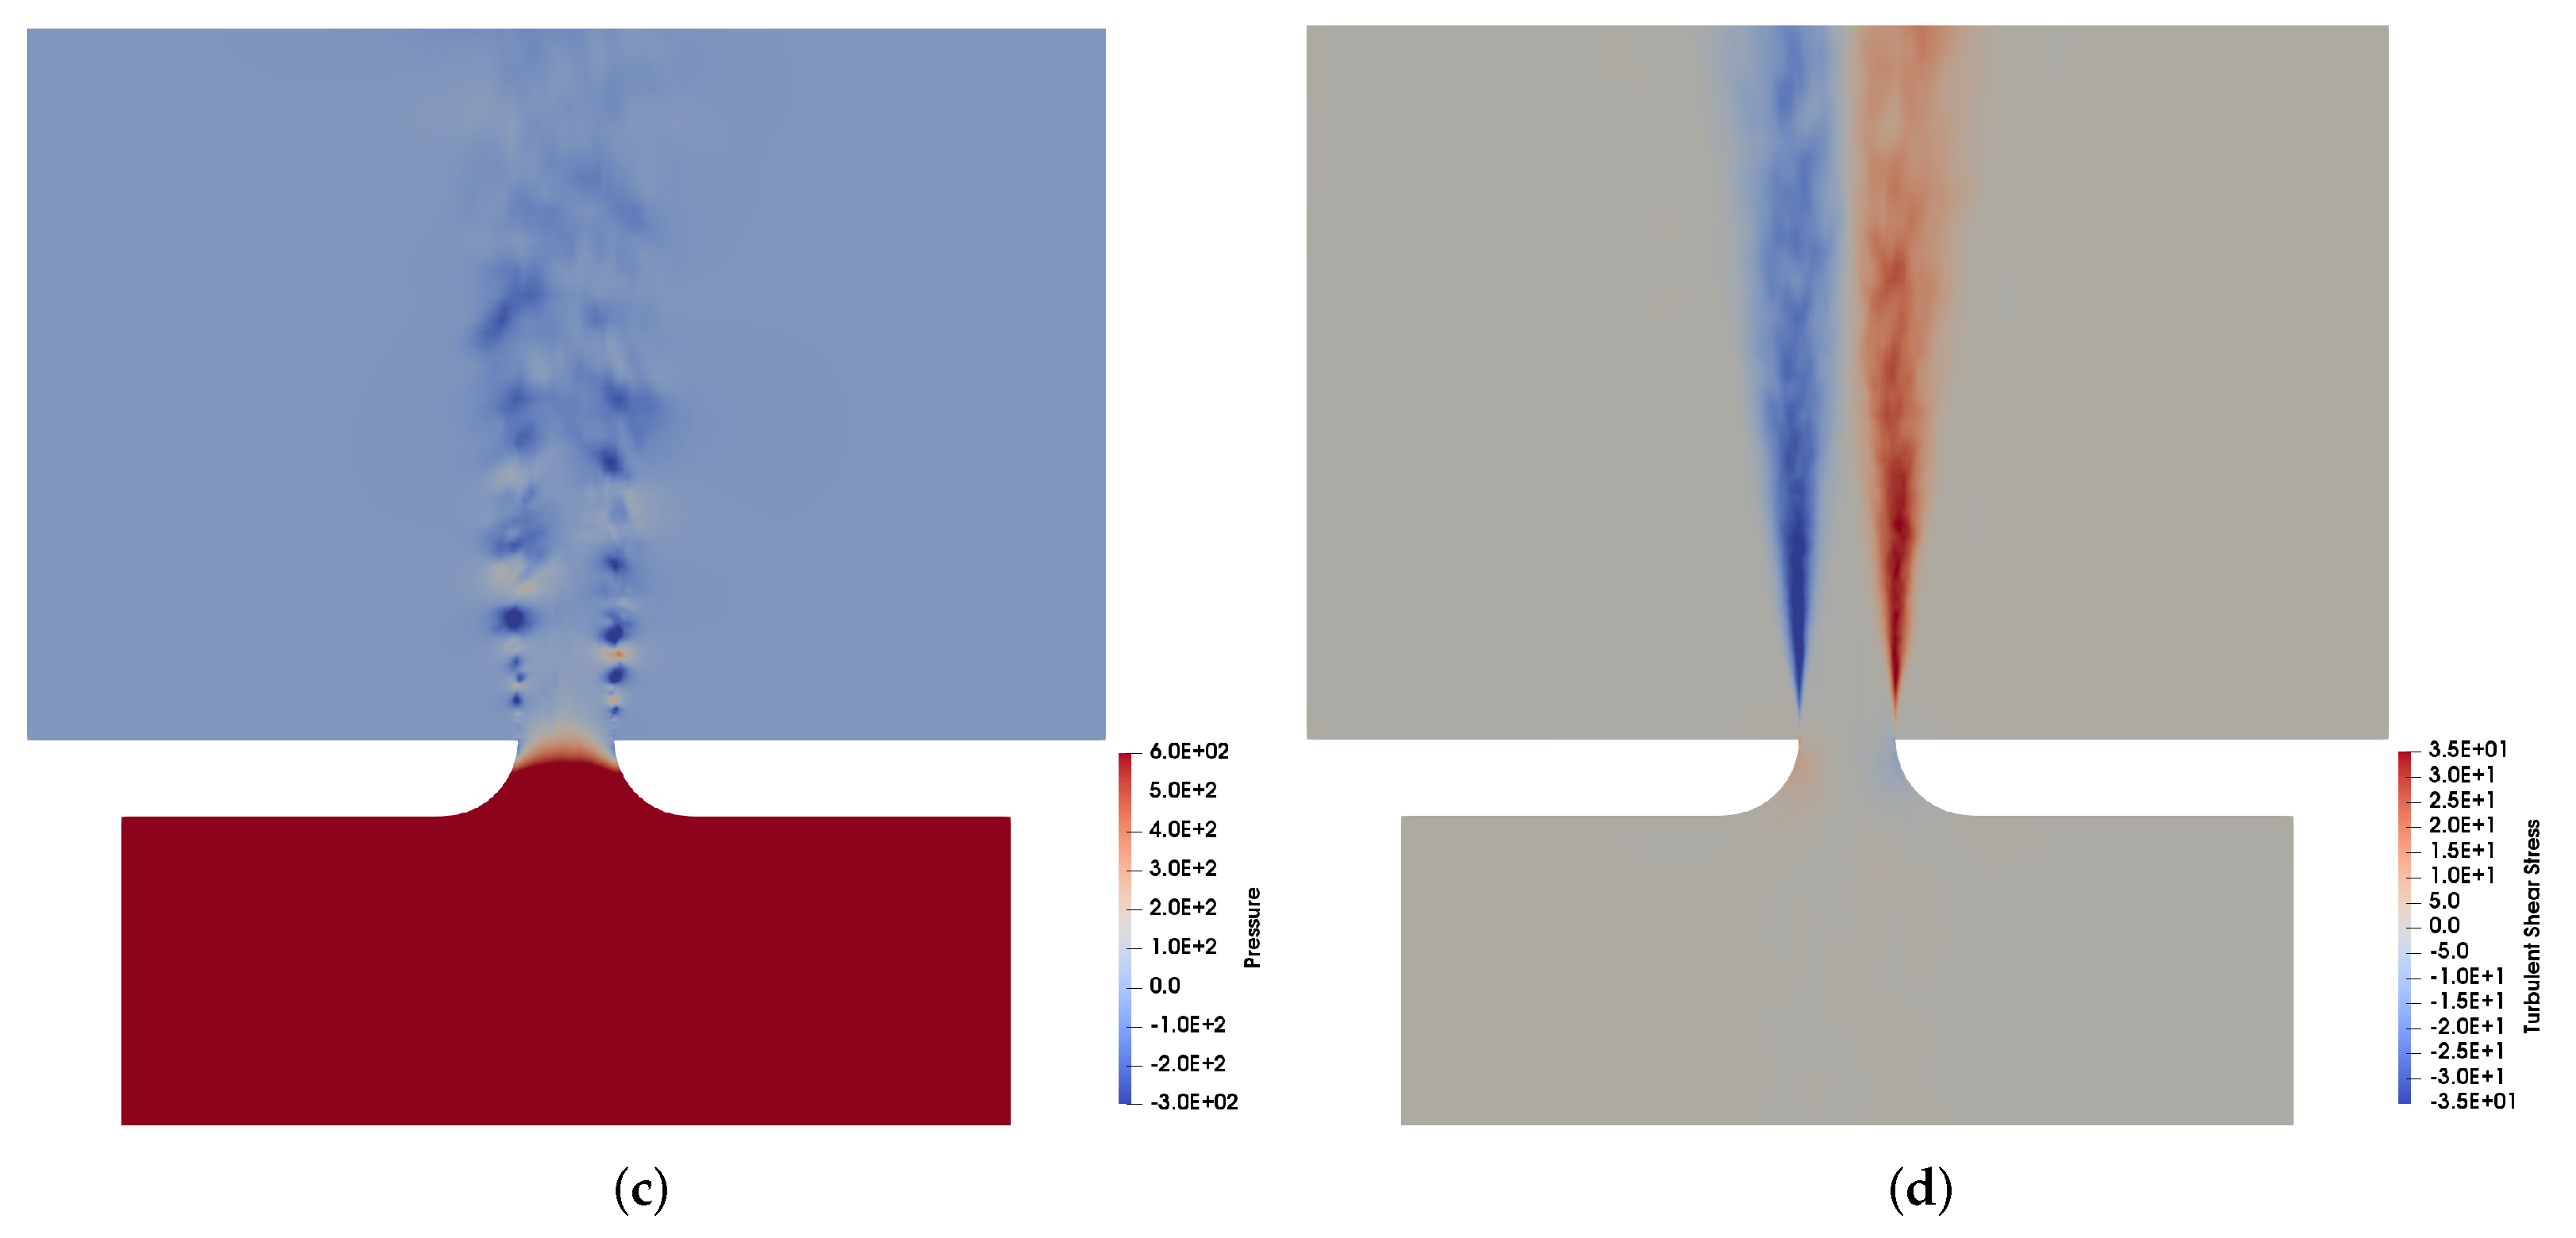
The instantaneous velocity contour in Figure 3a reflects these developments as the initially laminar sides of the shear layer become visibly turbulent with intermittent passage of patches of turbulent flow at the edges. Similarly, the static pressure contours, Figure 3c, show the periodic passage of pressure fluctuations associated with the instabilities developing in the shear layers. The time-averaged velocity contours in Figure 3b show the (expected) more smoothly defined edge of the free shear layers and jet as it spreads travelling downstream. The transition to turbulence is also evident from the turbulence shear stress contours plotted in Figure 3d, where the strong rise in the shear stress downstream of the orifice tip is clearly seen.


Figure 3.
Field contours illustrating the shear layer development through the orifice with the expected turbulent scales appearing in the instantaneous velocity contours while the smoother time-averaged contours show the growth of the shear layers on moving downstream. Pressure fluctuations appear periodically as a result of the developing shear layer instabilities near the orifice exit, while the turbulent shear stress contours help identify regions of high turbulent mixing. (a) Instantaneous Velocity. (b) Mean Velocity. (c) Static Pressure. (d) Turbulence Shear Stress.
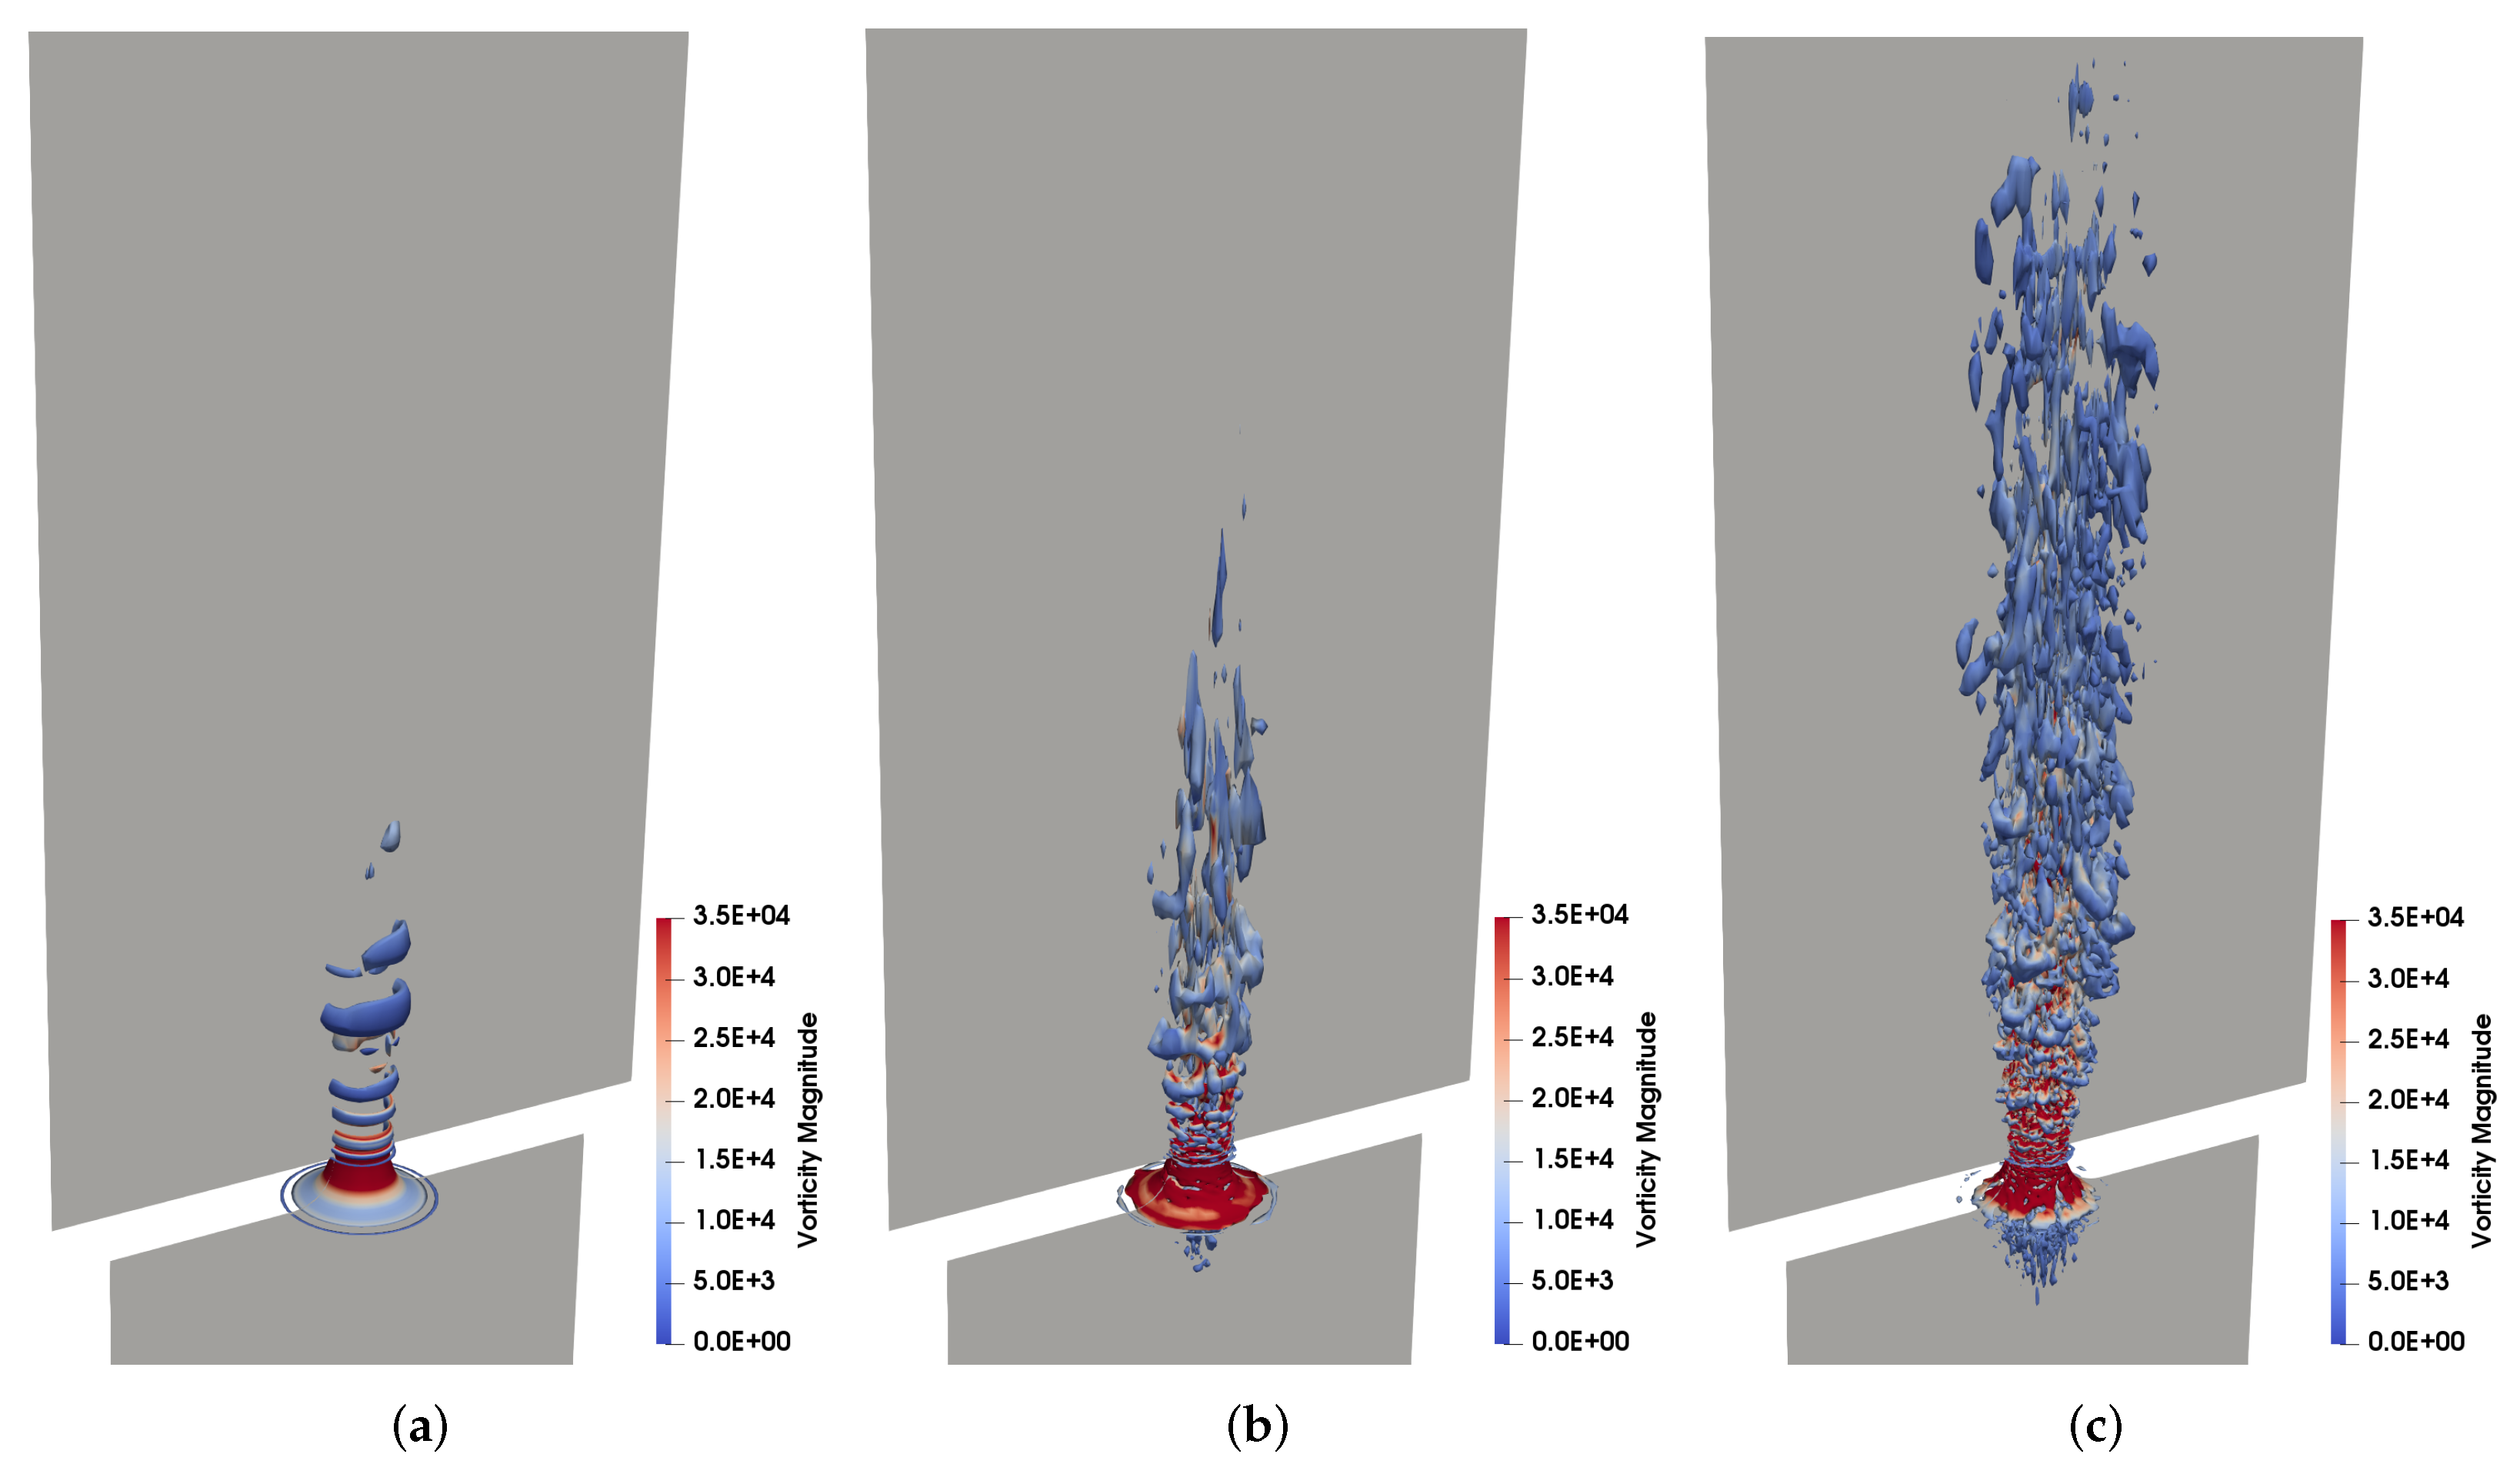
Turbulence can also be visualised using the Q-criterion, which is found by plotting the iso-surfaces of the second invariant of the velocity strain rate tensor as shown in Figure 4. The gradual development of increasingly complex flow structures in the shear layer is clearly demonstrated as initially laminar instabilities, such as ring vortices in Figure 4a, develop into more complex structures and breakdown to smaller scales until the full turbulent cascade is established in Figure 4c.
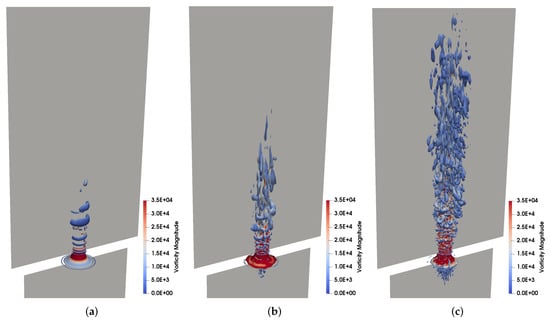
Figure 4.
Q Criterion iso-surfaces used to visualise the development of coherent structures in the vicinity of the orifice and in the mixing layer. The initial laminar rings capture the transitional phase as the flow accelerates from a stationary state through the orifice, leading to the appearance of these axisymmetric Kelvin–Helmholtz type rollers, which then develop secondary instabilities as they are convected in the streamwise direction until they breakdown further downstream forming smaller three dimensional turbulent structures. (a) Initial laminar instabilities. (b) Developing turbulent flow. (c) Developed turbulent shear layer.
Further insight can be attained by more closely examining the development of the mixing layer downstream of the orifice tip. It is worth noting that the mixing layer in this case is not a standard one, due to the potential constraint imposed by the shock absorber casing, which has a blockage effect, similar to other geometrical details that might be included, such as an orifice support tube or bearing structures.
This is in contrast to the unconstrained development region into the far field in most investigations dedicated to the study of mixing layer dynamics, where any physical boundaries are typically more than an order of magnitude away. Nevertheless, comparing the developing axisymmetric mixing layer with standard results could provide useful validation to establish confidence in the simulations. This comparison can also help reach a deeper understanding of the shock absorber flow, by identifying the differences between a standard mixing layer and in a shock absorber.
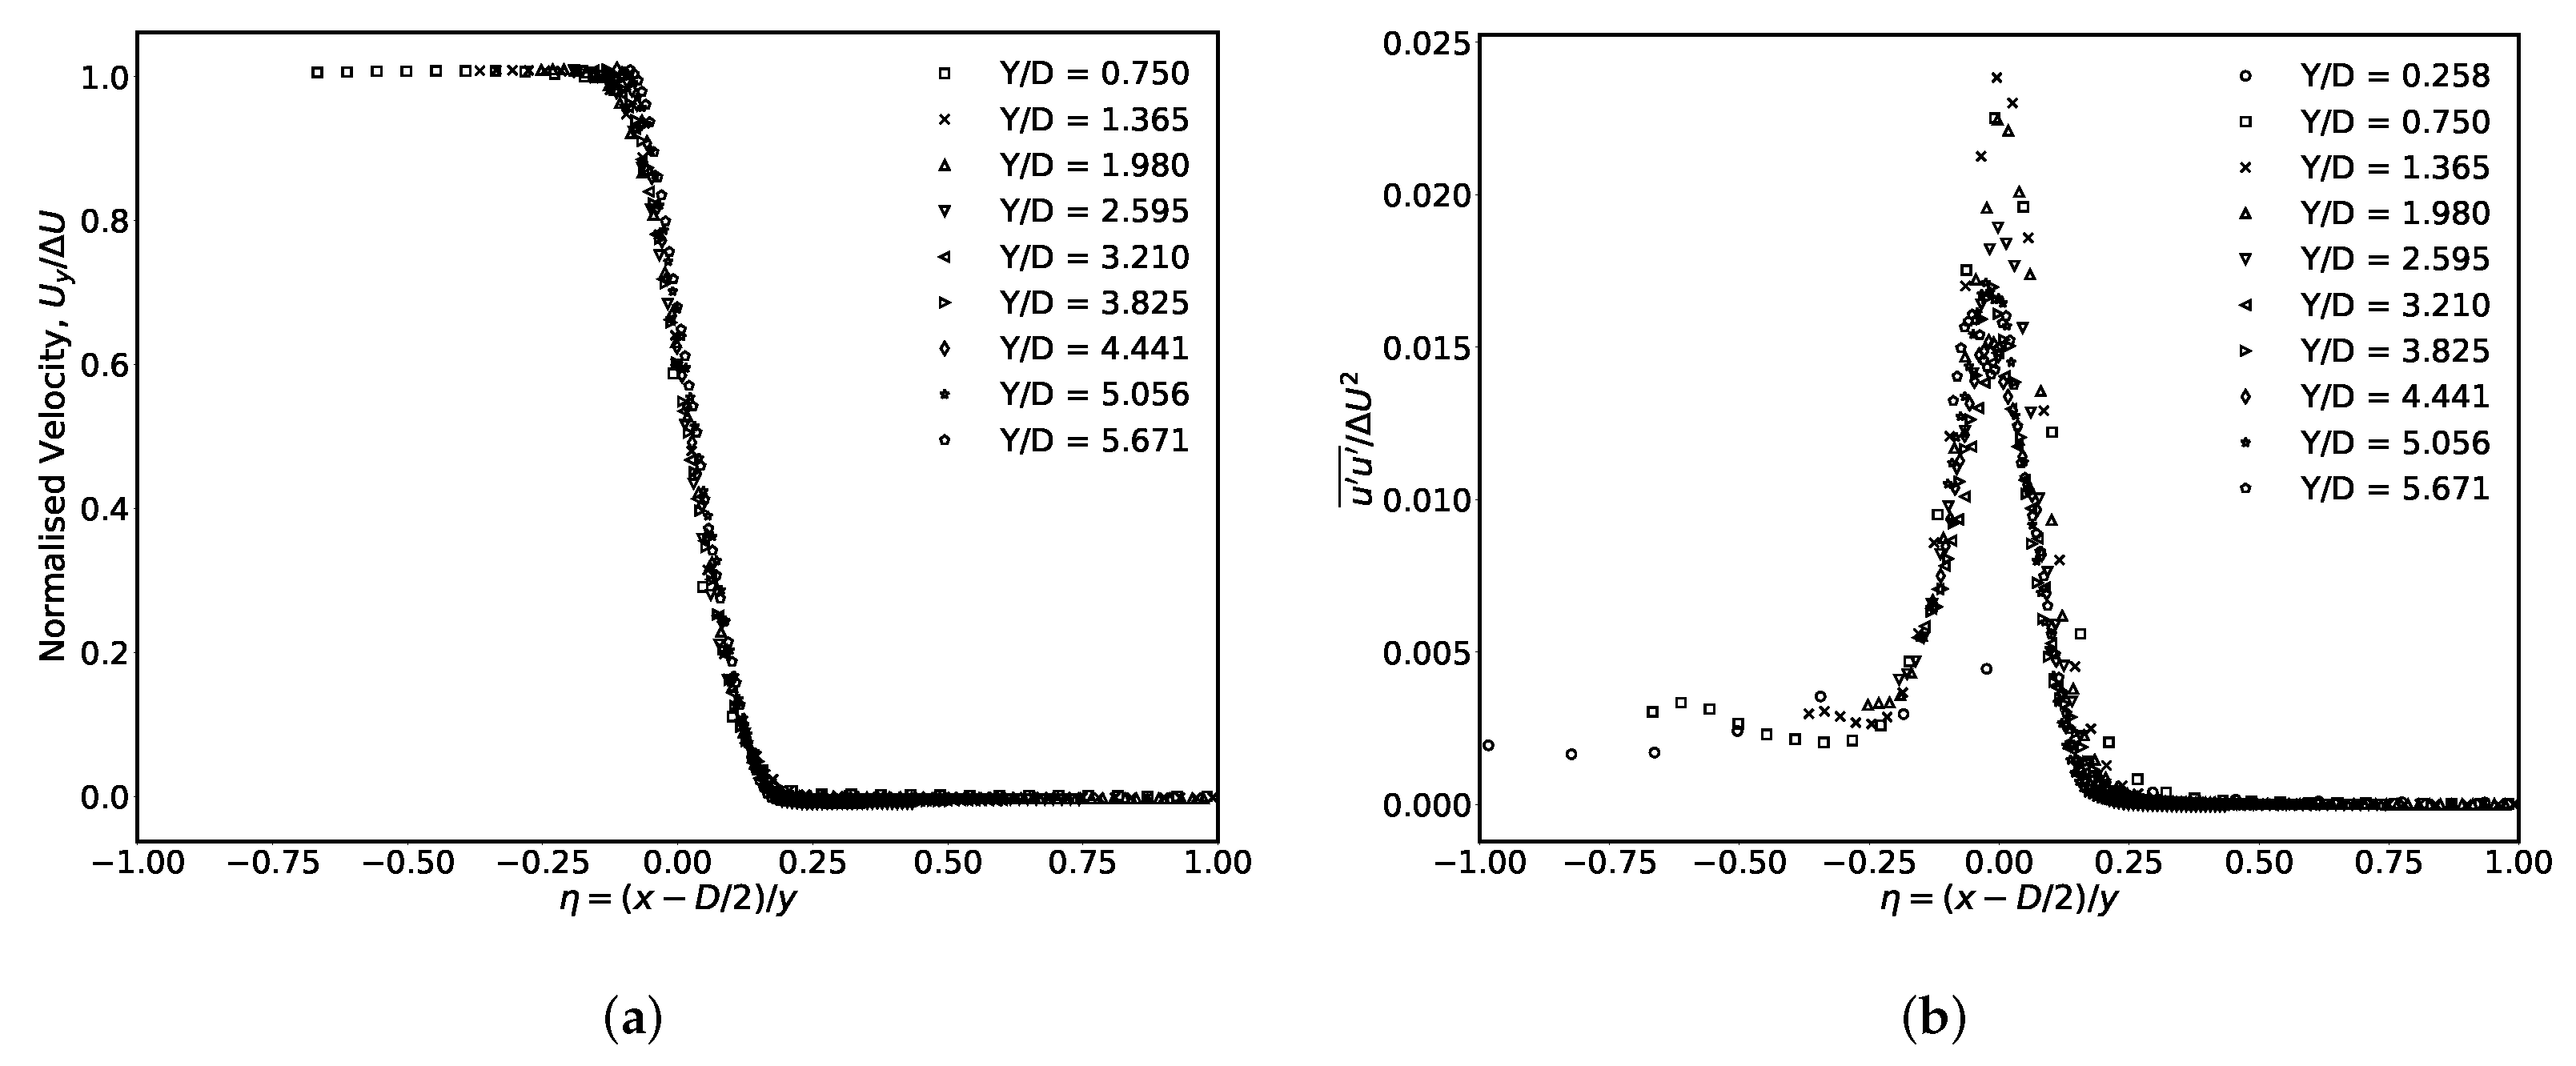
An initial important observation is the tendency of mixing layers towards an approximately self-similar state moving in the streamwise direction [13]. This state is reached once the free shear layer passes the initial transitional stage near the tip and enters the turbulent regime around one orifice diameter downstream of the exit, where the profiles of turbulent flow variables taken across the shear layer tend to collapse onto a single standard profile once they are normalised appropriately.
The velocity profiles are plotted in Figure 5a, in which the tendency towards a self similar profile is clearly manifested. It is seen in Figure 5a that the first profile plotted at exhibits small deviation from the self similar profile, which is not surprising given that the turbulence flow is still developing at that location, as seen in the visualisation in Figure 3 and Figure 4. The profiles downstream become increasingly more conforming to the self-similar profile.

Figure 5.
Self-similarity is detected in the shear layer development as the velocity profiles and Reynolds stress profiles, , are seen to collapse on a single line after appropriate scaling. The turbulent Reynolds stress is observed to require longer streamwise development than velocity to reach this state. (a) Streamwise velocity. (b) Cross-stream Reynolds stress, .
Other turbulent properties are also expected to exhibit self-similarity. Profiles of the cross flow Reynolds stress component are also plotted in Figure 5b, where it is again demonstrated that the normalised profiles tend to collapse towards a single curve when moving downstream.
The stress profiles require a longer streamwise distance to reach approximate self-similarity when compared with the velocity profiles. This observation is consistent with the findings of previous mixing layer investigations. However, the less common observation, in the context of a standard mixing layer, is that the Reynolds stress profiles in Figure 5b seem to have a higher value on the negative side, corresponding to the flow on the high velocity (jet) side of the free shear layer, which will be examined further later in the discussion.
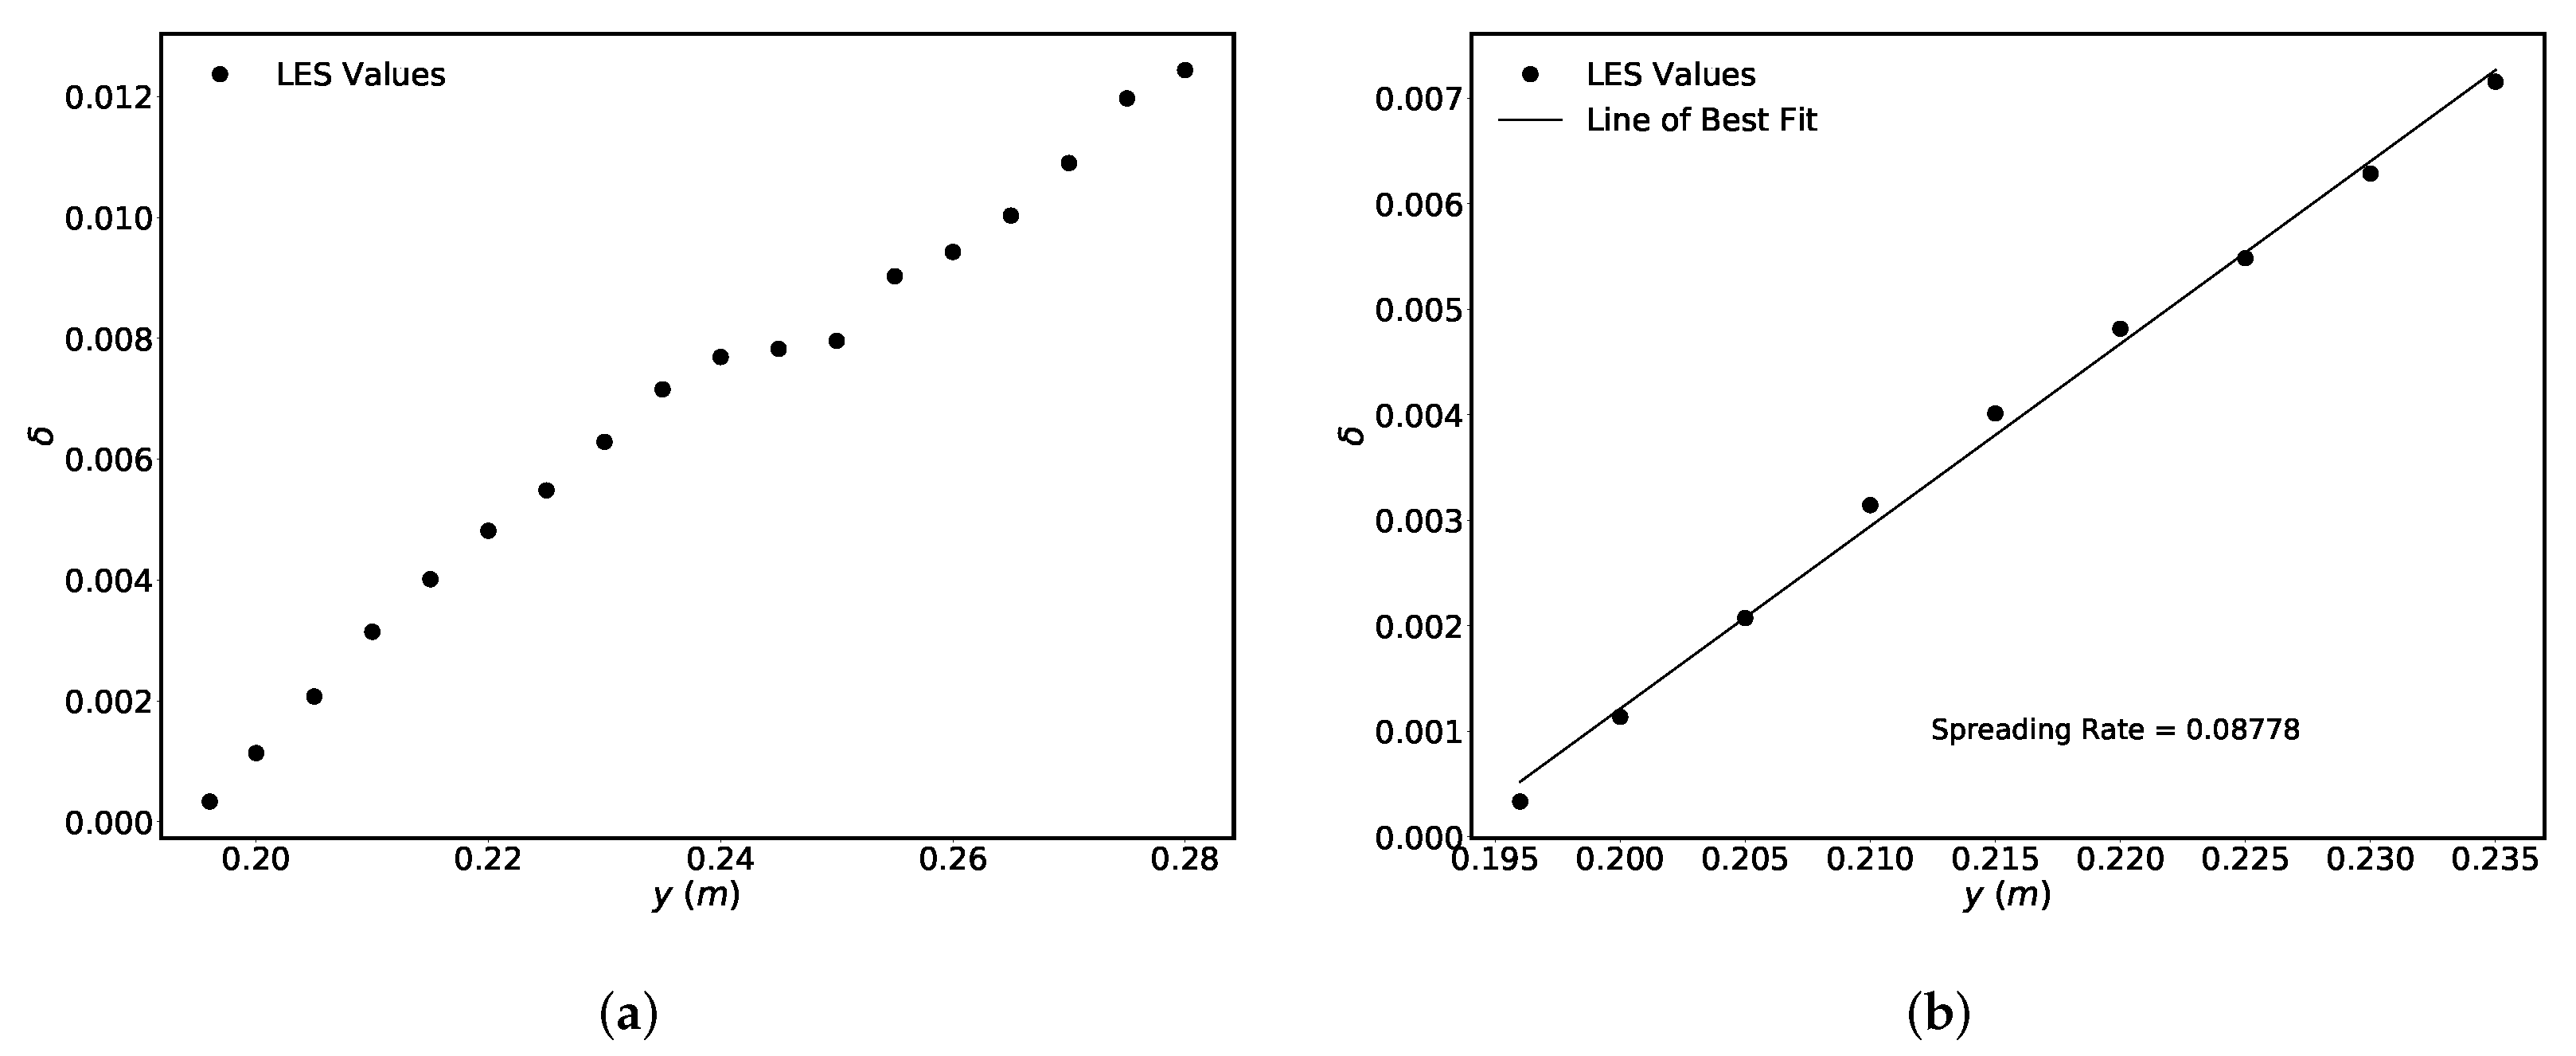
The general pattern of growth is shown in Figure 6a for profiles reaching up to ; however, it is important to remember that the jet’s potential core only usually extends to roughly five diameters downstream of the exit, and after that, there is strong interaction at the mixing layer’s inner edge as the flow tends towards a new self-similar state corresponding to the round jet, which is only achieved much further downstream beyond the boundary of the current simulation domain.

Figure 6.
Mixing layer spreading rate estimation based on the expansion of velocity fraction lines plotted over a streamwise distance covering the initial linear region and well into the region where three-dimensional effects are expected to become significant as the axisymmetric shear layer transitions into an axisymmetric jet. In (b), a line of best fit is inserted through the strongly linear initial mixing layer phase up to approximately , yielding the spreading rate . (a) Points up to . (b) Points up to .
The spreading rate value, , found here for the mixing layer region in Figure 6b falls within the experimental range of observations, , which was reported for planar mixing layers in Dimotakis [14] and Pope [12]. While the mixing layer here is axisymmetric and constrained by the casing to some degree, these values could be regarded as indicative of the general range expected.
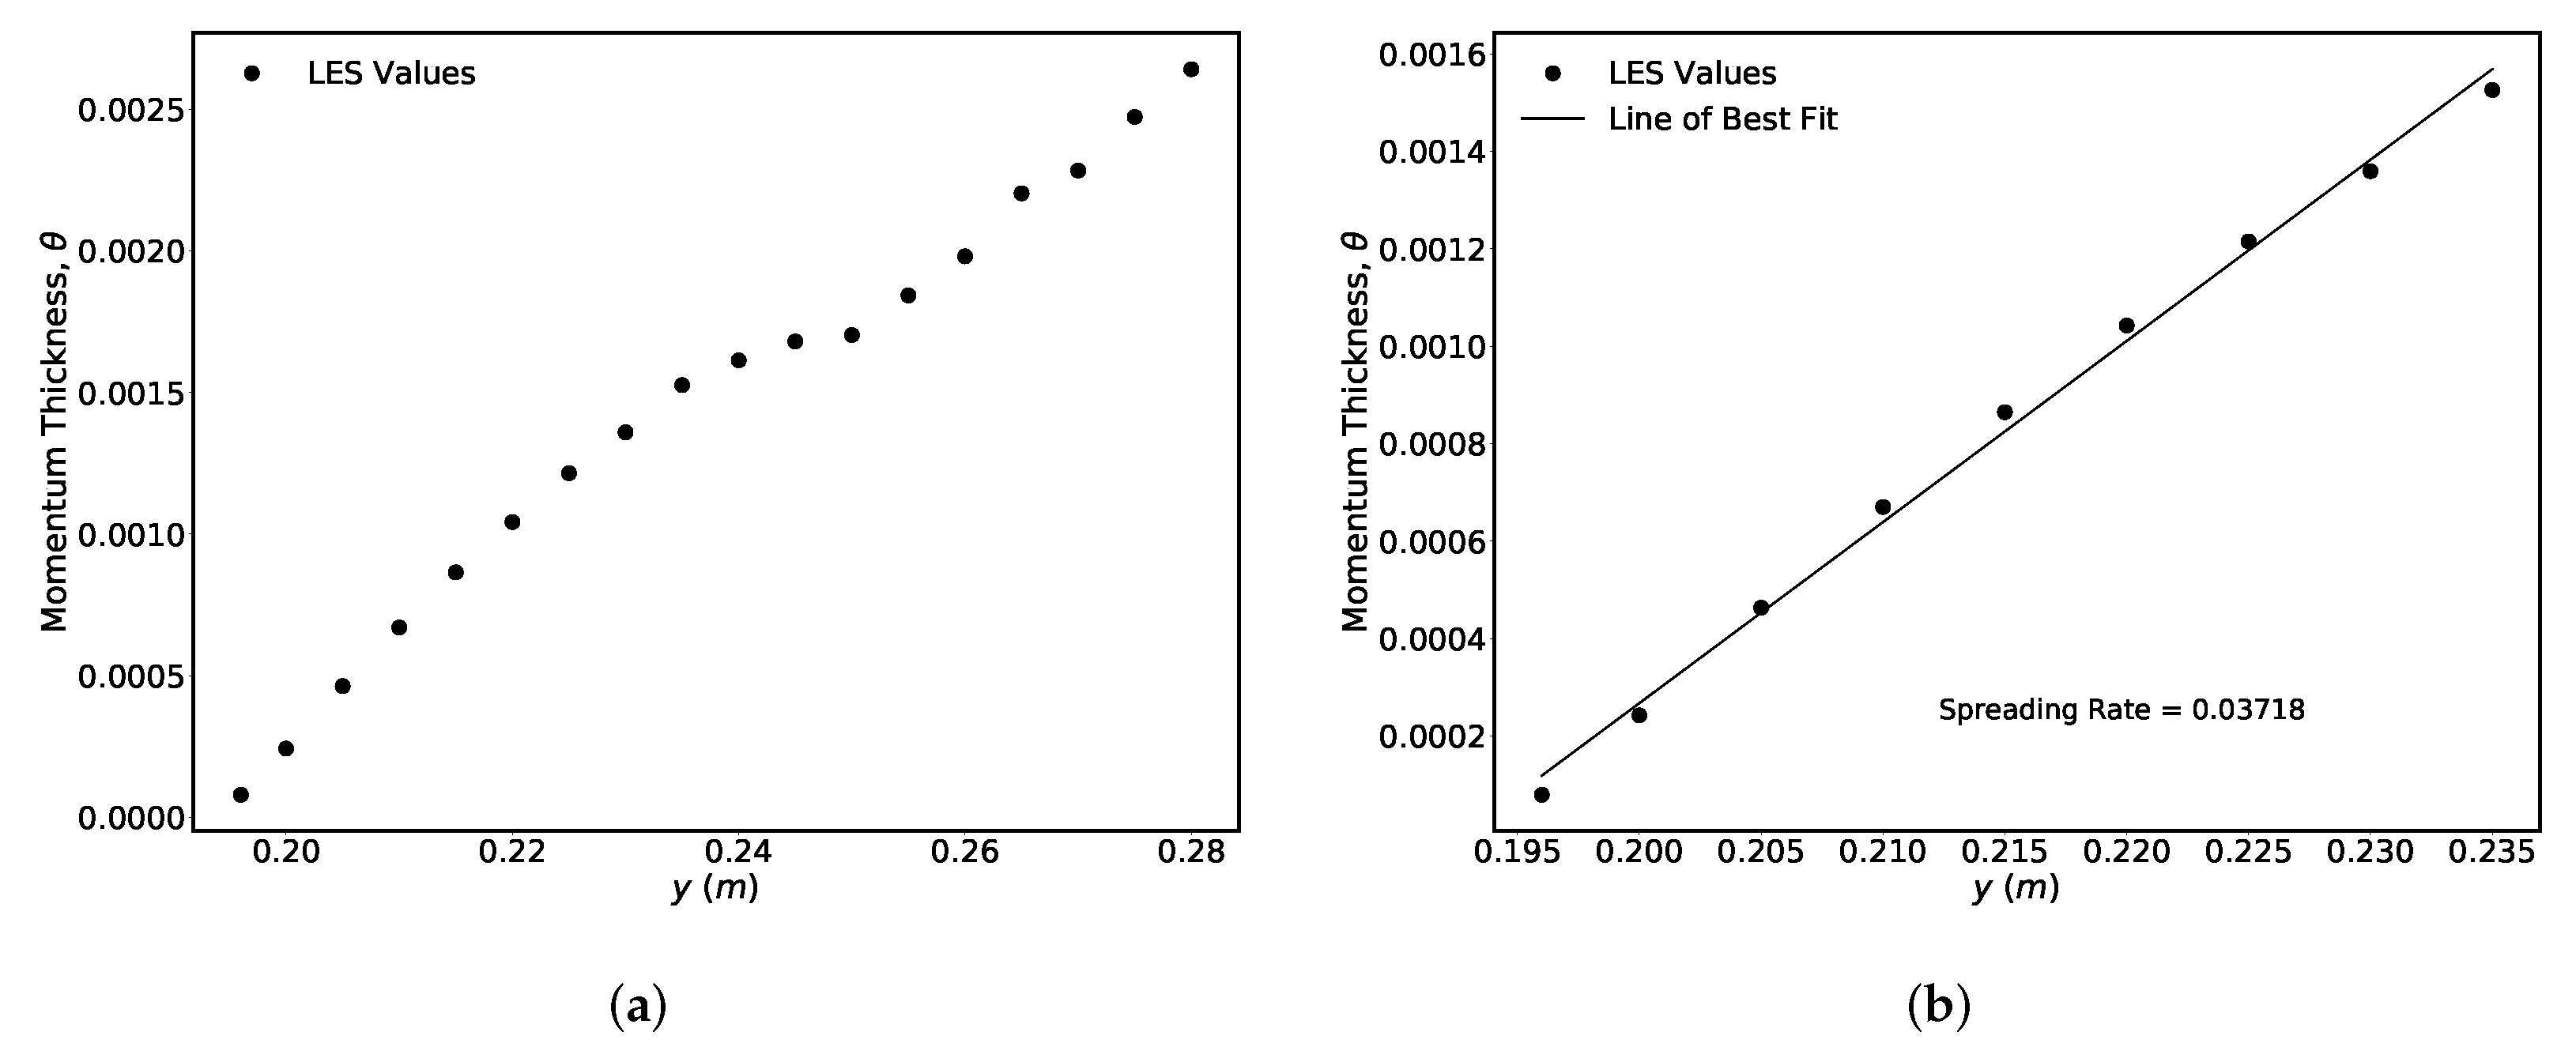
The mixing layer’s momentum thickness results presented in Figure 7 follow a similar pattern to the -based spreading rate. The profiles nearest to the orifice exit plane in Figure 7b are used to calculate the spreading rate, while those in the jet interaction region, more than five orifice diameters downstream, tend to be less reliable as the pattern in Figure 7a shows. The value found here, , is in good agreement with the spreading rate correlation with velocity ratio across the mixing layer that is available in the literature [15], which, for a single stream mixing layer, has a value of .
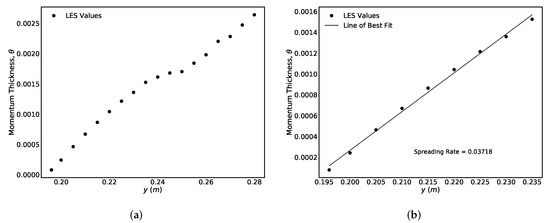
Figure 7.
Mixing layer spreading rate estimation based on the momentum thickness growth plotted over a streamwise distance covering the initial linear region and extending into the region where three-dimensional effects are expected to become significant as the axisymmetric shear layer transitions into an axisymmetric jet. In (b), a line of best fit is inserted through the strongly linear initial mixing layer phase up to approximately , yielding the spreading rate . (a) Points up to . (b) Points up to .
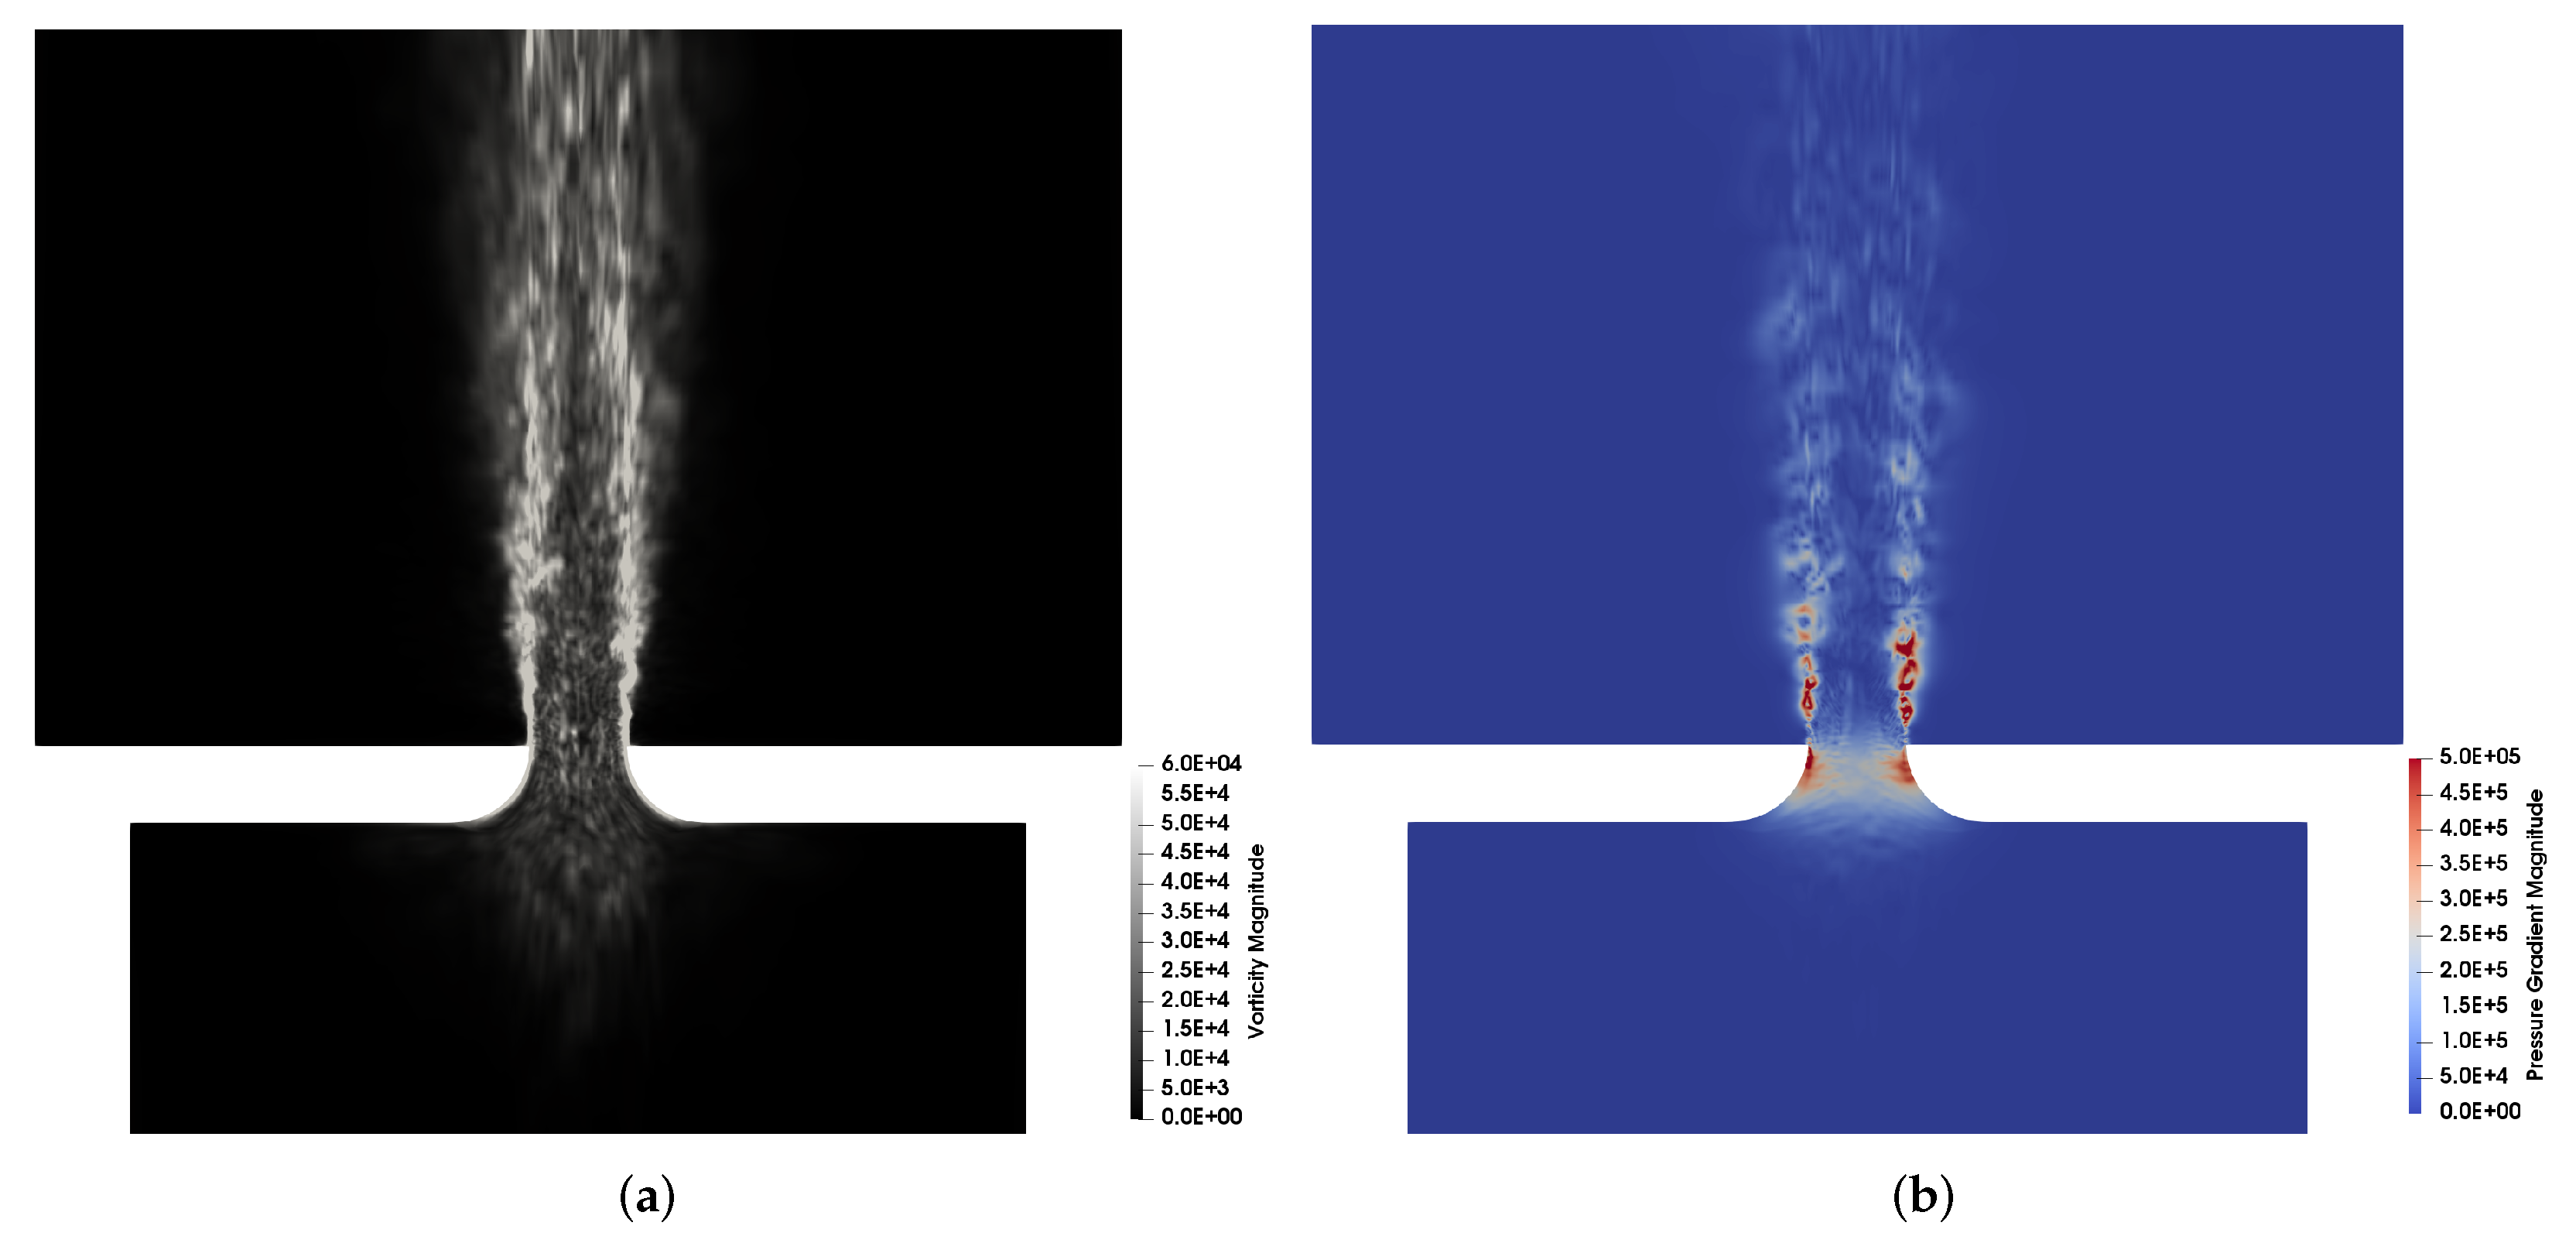
Having verified that the simulated mixing layer exhibits features that are generally consistent with the expected physical behaviour reported in laboratory measurements, it is possible to consider some of the finer details of the specific flow inside this shock absorber case. The contours of the vorticity magnitude and pressure gradient magnitude are shown in Figure 8 for an instantaneous developed flow snapshot.
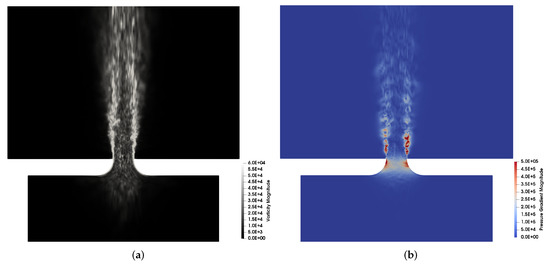
Figure 8.
Contours of the vorticity magnitude (calculated using the instantaneous velocity field) showing the unsteadiness not only in the vicinity of the orifice in the shear layers as expected but also in the central potential flow region of the jet. Contours of the pressure gradient magnitude are also plotted to identify regions susceptible to the appearance of cavitation bubbles, which could lead to high transient stresses on nearby surfaces when these bubbles collapse. (a) Vorticity magnitude contours. (b) Pressure gradient contours.
The pressure gradient magnitude in Figure 8b reaches high intensity values in two regions; the first is in the initial stages of mixing layer development, under the influence of the strong primary instability; the second is on the inner surface of the convergent orifice, where the flow is turned and accelerated as it passes through the orifice leading to a low pressure region near the surface. It is this low pressure region that is of concern, due to its susceptibility to the inception of cavitation bubbles under some loading conditions. These cavitation bubbles usually burst violently when they are convected to higher pressure regions, potentially leading to high-stress transient loading on nearby surfaces. Hence, it can be beneficial to limit the orifice surface area that is subjected to a significantly low pressure value.
A key advantage of the orifice design here is its ability to gradually turn the flow on the upstream boundary of the orifice while avoiding boundary layer separation on the inner surface. The presence of a separation bubble inside the orifice could result in sudden changes in the effective flow area available and the mass flow through it, leading to undesirable variations in the performance under certain loading conditions. This convergent nozzle shape effectively aligns the flow through the orifice in the streamwise direction so that the flow at exit is approximately tangential to the orifice tip. These flow characteristics are confirmed by the instantaneous and mean velocity contours in Figure 3.
The vorticity magnitude contours plot in Figure 8a is consistent with the observations made earlier regarding the flow development in the mixing layer, where, indeed, the high vorticity magnitude is concentrated in the high turbulence intensity zones inside the mixing layer, particularly in the transitional region near the orifice tip. However, it is worth noting that even the potential core of the jet through the orifice has significant vorticity intensity levels and fluctuations within it, indeed there is some notable vorticity fluctuations even upstream of the orifice. Evidently, the orifice design in a shock absorber does not necessarily prioritise settling the flow within the orifice jet’s potential core or having a laminar (quiet) flow at the orifice exit. It could, in fact, enhance mixing in the free shear layers and through the central orifice jet to allow more efficient energy dissipation and, hence, improved shock absorber performance in that respect.
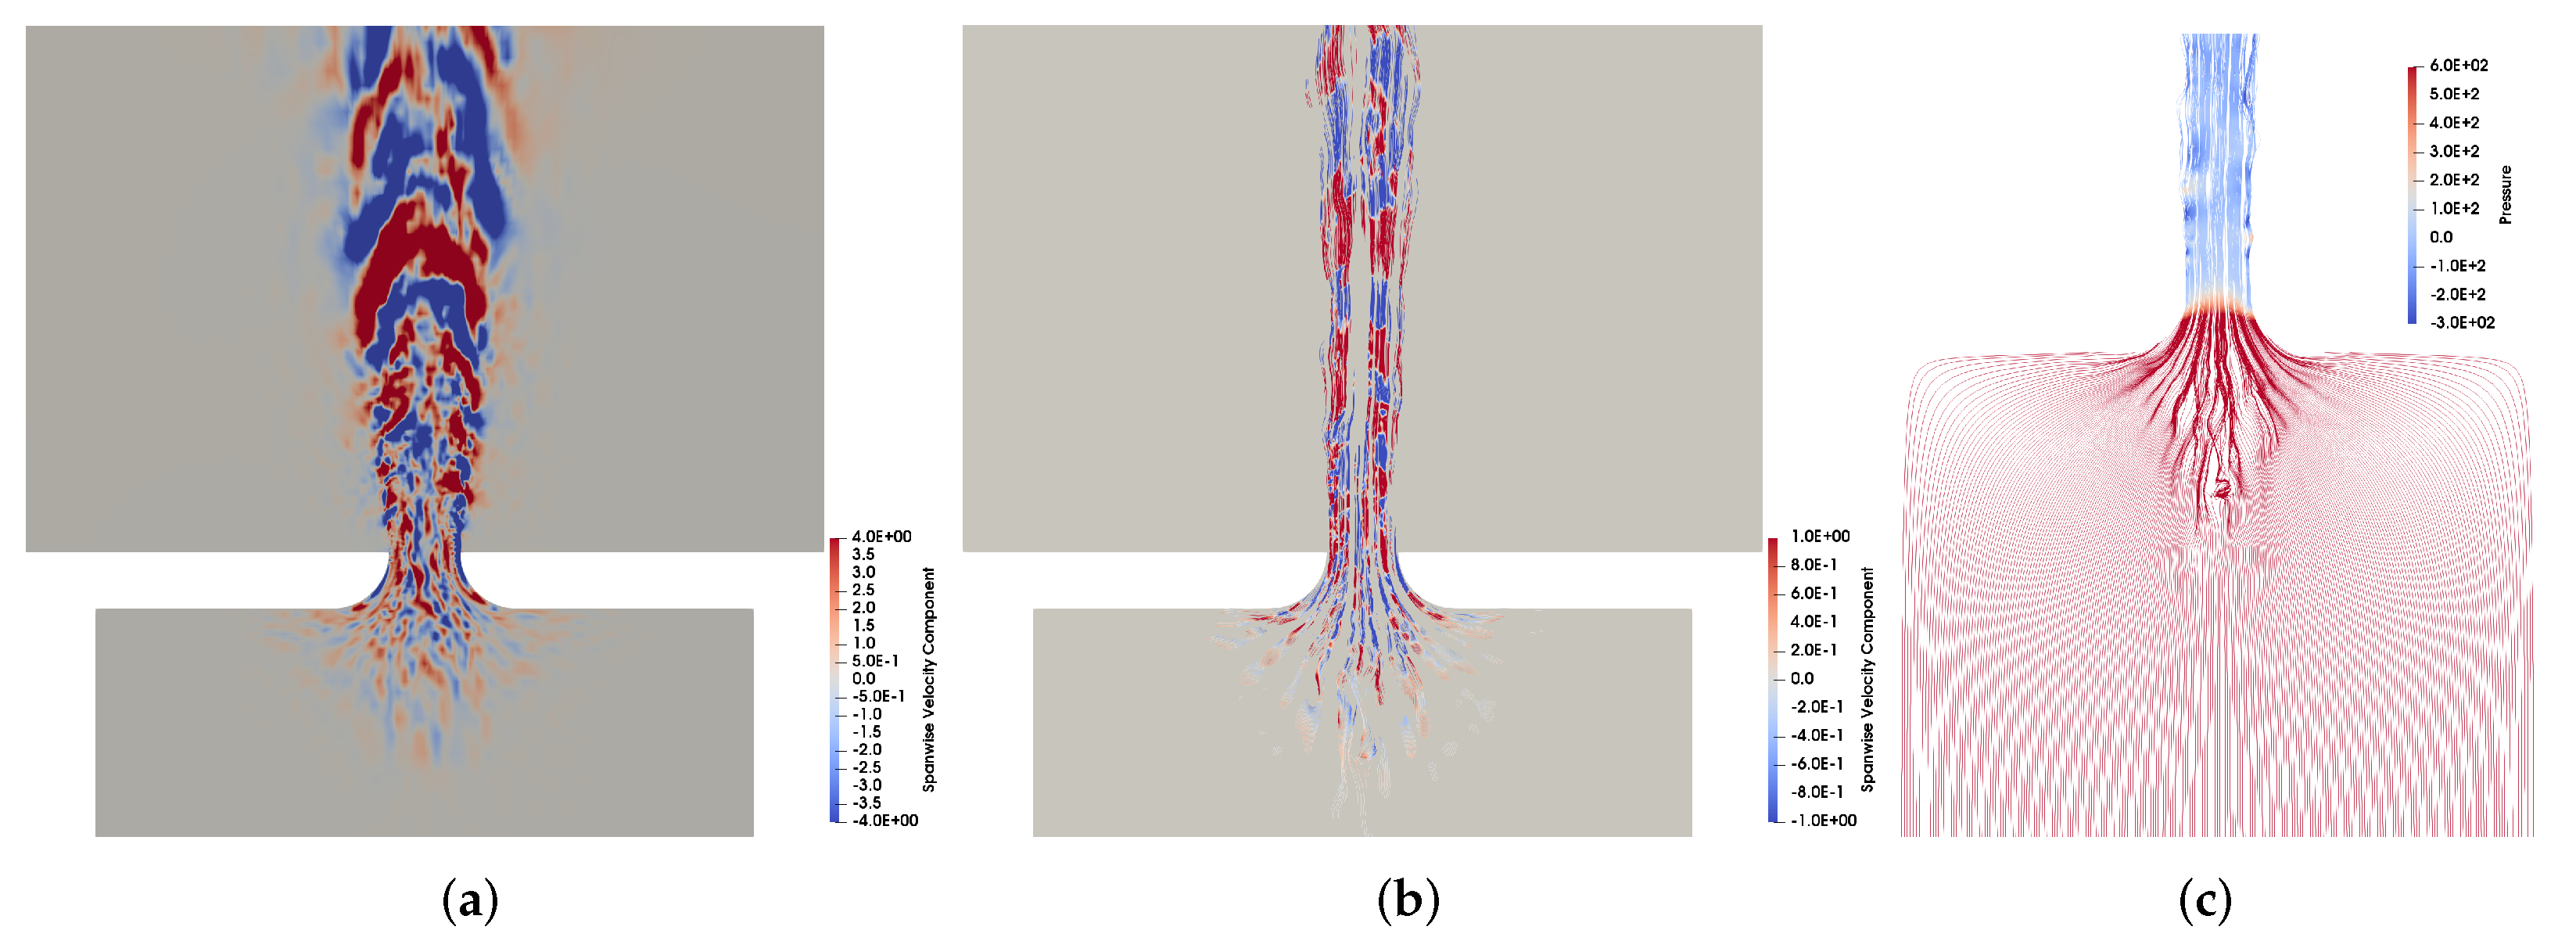
The flow development upstream of the orifice is the focus of Figure 9, where the contours and streamlines of an instantaneous snapshot of the flow are used to visualise the interactions and flow conditions upstream of the orifice. The spanwise velocity component contours in Figure 9a clearly demonstrate the relatively high intensity of its value, even upstream of the orifice. Given that the inlet velocity is simply set to a constant 1 m/s in the vertical y direction, by symmetry, the spanwise velocity component would be expected to maintain a negligible value until some three-dimensional flow mechanism generates local variations in the flow direction, similar to the ones observed in the axisymmetric jet development region downstream of the orifice, for example.

Figure 9.
Contours of the spanwise velocity component can be used to highlight the development of instabilities and turbulent flow in the shock absorber as this component should remain negligible, by symmetry, unless some form of three-dimensional flow structures are detected. The field development here is consistent with the vorticity magnitude contours seen in Figure 8. Traces of the streamlines are plotted to visualise the unsteadiness upstream of the orifice and show the potential cause, which is the influence of the flow turning at the orifice boundary that creates a converging flow around the axis of symmetry rotating the flow from the radial to the streamwise direction. (a) Spanwise velocity component. (b) Streamlines coloured by spanwise velocity component. (c) Streamlines showing disturbances upstream of the orifice, coloured by pressure.
Streamline plots in Figure 9b,c indicate that the unsteadiness is associated with the flow convergence on approaching the orifice. The streamlines in Figure 9c are coloured by the pressure field, showing the strong pressure gradient across the orifice driving the flow through the orifice to the upper chamber, as expected. It is evident in these streamlines plots how the convergent orifice shape helps gradually turn the streamlines adjacent to the walls from a horizontal direction, the x direction, on the lower wall of the orifice, to the vertical direction, the y direction; however, the flow nearer the central axis of symmetry impinges on the radial flow converging in that region, causing a more violent flow turning in the streamwise direction and leading to the observed flow unsteadiness.
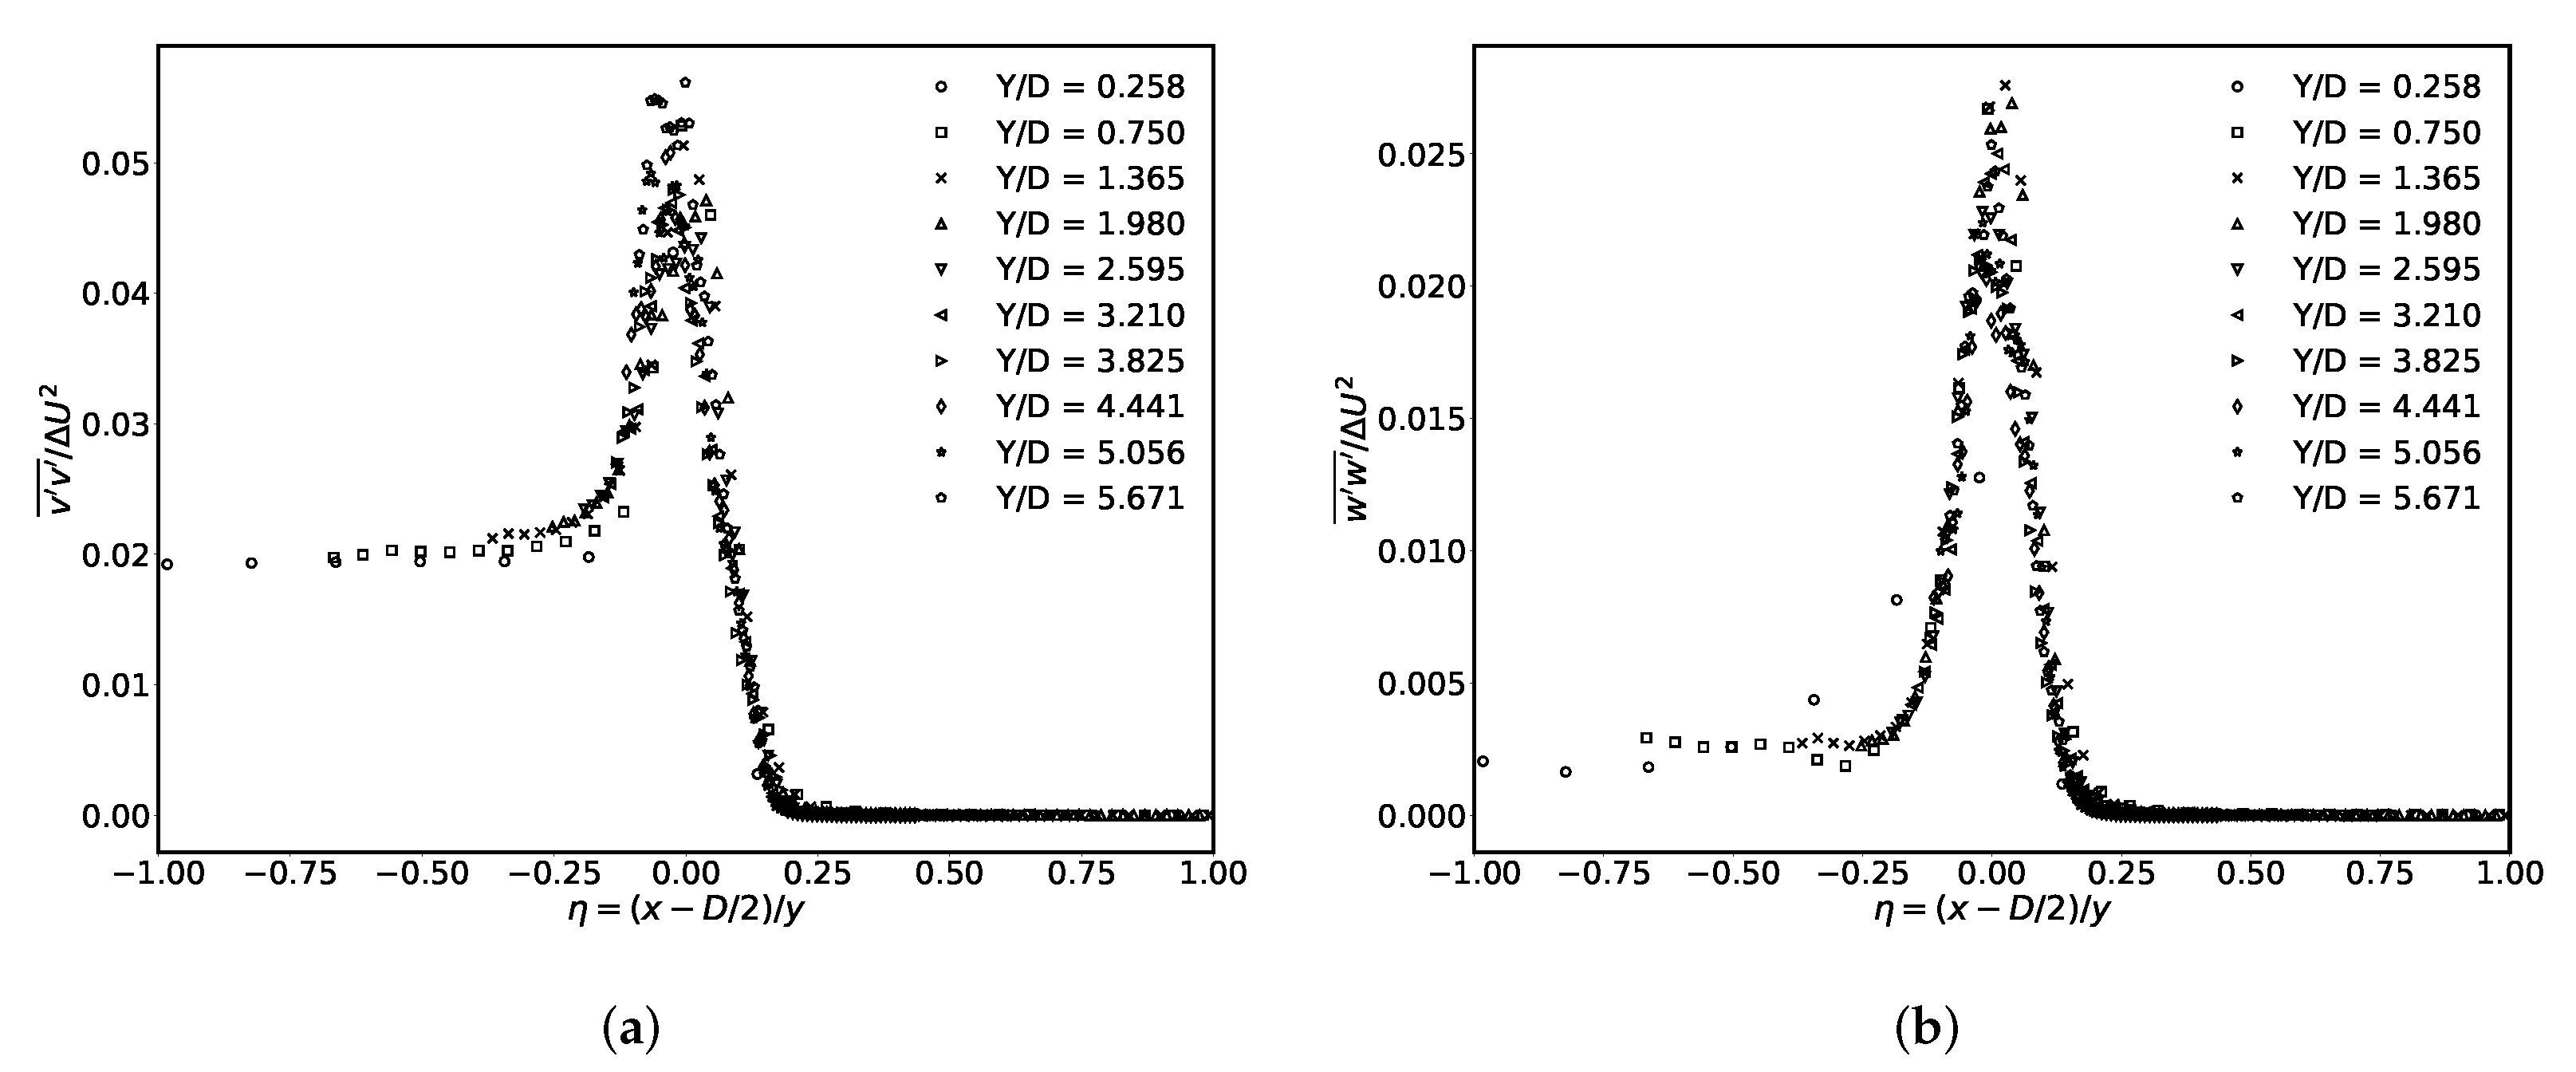
The Reynolds stress profiles, normalised in accordance with self-similarity, are presented in Figure 10, where the relatively high turbulence intensity in the potential core, in comparison with a standard mixing layer case, is observed in both stress components. The disparity between the high velocity and low velocity sides of the mixing layer is greatest in the stress component corresponding to the streamwise direction, , while the other components, and , have a lower level inside the potential core. All the Reynolds stress profiles show a trend of higher maximum amplitude values in the profiles near the orifice exit, a feature associated with the transition process and the strong instabilities present in that region. The profiles settle to a lower more consistent maximum amplitude value for the normalised profiles further downstream in the mixing layer.
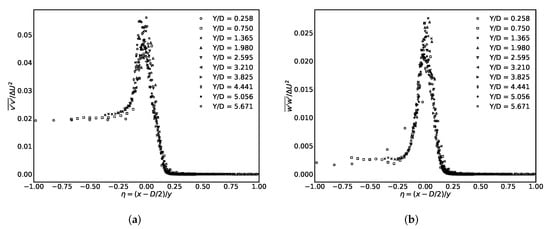
Figure 10.
Self-similarity plots of the mixing layer’s Reynolds stress profiles, and confirm the presence of relatively high turbulent intensity values on the high velocity potential core side of the profiles. (a) Streamwise Reynolds stress, . (b) Cross-stream Reynolds stress, .
The mixing layer development is aided by the convergent nozzle aligning the flow in the streamwise direction at exit. Different orifice design options could potentially reduce the area over which a high-intensity pressure gradient exists and its corresponding low static pressure region, which poses a cavitation risk near the surface. However, that will often involve increasing the streamlines’ radius of curvature near the orifice exit and loosing the gradual flow turning/alignment to have the mixing layer flow exit in the streamwise direction, thus, affecting the mixing layer development, particularly in the transitional near field of the orifice, which could, in turn, have a significant impact on the shock absorber performance.
5. Conclusions
The flow development in a simplified shock absorber setup was investigated using a Large Eddy Simulation. The top boundary was taken to be an outlet, rather than having a closed domain, and a constant inlet velocity, approximately representative of an averaged drop test value, was used. The mixing layer properties, in particular self-similarity and the spreading rate, were found to be consistent with the available literature.
However, significant levels of unsteadiness and turbulence intensity were observed in the orifice jet’s potential core and even in the upstream vicinity of the orifice, potentially due to the converging cross flow in that region. This relatively high unsteadiness is not only relevant to the understanding of the flow field around the orifice but can also be significant if a reduced domain LES is conducted with the computational domain starting at the orifice—in which case, representative inlet boundary conditions have to be specified, including a turbulence intensity value.
Further work will be conducted to identify the impact of the orifice shape and loading conditions on the extent and severity of the unsteadiness upstream of the orifice and inside the potential core, in addition to the tendency to generate cavitation regions near the orifice and the overall impact on the shock absorber performance.
The flow in an actual shock absorber is likely to be significantly more complex due to the highly unsteady nature of the loading and the influence of other physical factors, such as heat transfer and multiphase interaction between the hydraulic oil and the gas, which is expected to have a more pronounced impact on the later stages of the stroke, depending on the exact shock absorber design and loading characteristics.
The relevant multiphase phenomena include aeration and foaming that can influence the working fluid properties and, hence, the shock absorber performance as well as cavitation that could impact the service life of internal components. Future work will increase the complexity and scope of the simulations to allow a more accurate prediction of the shock absorber internal dynamics and overall performance.
Author Contributions
Conceptualization, P.T., A.F.A. and M.S.; methodology and validation, A.A.S.A.-S., B.G. and D.V.; formal analysis and investigation, A.A.S.A.-S., B.G. and D.V.; resources, M.S. and P.T.; data curation, A.A.S.A.-S.; writing—original draft preparation, A.A.S.A.-S.; writing—review and editing, B.G., D.V., P.T., A.F.A. and M.S.; visualization, A.A.S.A.-S., B.G. and D.V.; supervision, P.T., A.F.A. and M.S.; project administration, M.S.; funding acquisition, M.S. All authors have read and agreed to the published version of the manuscript.
Funding
This research was funded by Innovate UK grant number 263261 and Airbus UK.
Data Availability Statement
The underlying data can be accessed at https://doi.org/10.17862/cranfield.rd.17701310, for the data appearing in the figures. Raw data can be made available on request.
Conflicts of Interest
The authors declare no conflict of interest.
Abbreviations
The following abbreviations are used in this manuscript:
| 2D | Two-Dimensional |
| 3D | Three-Dimensional |
| CFL | Courant–Friedrich–Lewy number |
| Diameter of orifice at orifice exit (narrowest point) | |
| LES | Large Eddy Simulation |
| PBiCG | Preconditioned Bi-Conjugate Gradient |
| PCG | Preconditioned Conjugate Gradient |
| PIMPLE | Pressure Implicit Method for Pressure-Linked Equations (combination of PISO and SIMPLE) |
| PISO | Pressure Implicit with Splitting of Operator |
| RANS | Reynolds Averaged Navier–Stokes |
| SIMPLE | Semi-Implicit Method for Pressure-Linked Equations |
References
- Milwitzky, B.; Cook, F.E. Analysis of Landing-gear Behavior. In NACA Technical Note; National Advisory Committee for Aeronautics (NACA): Washington, DC, USA, 1952. [Google Scholar]
- Currey, N. Aircraft Landing Gear Design: Principles and Practices; AIAA Education Series; American Institute of Aeronautics and Astronautics: Reston, VI, USA, 1988. [Google Scholar]
- Daniels, J.N. A method for landing gear modeling and simulation with experimental validation. In NASA Contractor Report R-1154; National Aeronautics and Space Administration (NASA): Hampton, VA, USA, 1996. [Google Scholar]
- Ding, Y.W.; Wei, X.H.; Nie, H.; Li, Y.P. Discharge coefficient calculation method of landing gear shock absorber and its influence on drop dynamics. J. Vibroeng. 2018, 20, 2550–2562. [Google Scholar]
- Weller, H.G.; Tabor, G.; Jasak, H.; Fureby, C. A tensorial approach to computational continuum mechanics using object-oriented techniques. Comput. Phys. 1998, 12, 620–631. [Google Scholar] [CrossRef]
- Jasak, H. Error Analysis and Estimation for the Finite Volume Method with Applications to Fluid Flows. Ph.D. Thesis, Imperial College London, London, UK, 1996. [Google Scholar]
- Holzmann, T. Mathematics, Numerics, Derivations and OpenFOAM®; Holzmann CFD: Loeben, Germany, 2016. [Google Scholar]
- Issa, R. Solution of the implicitly discretised fluid flow equations by operator-splitting. J. Comput. Phys. 1986, 62, 40–65. [Google Scholar] [CrossRef]
- Patankar, S.; Spalding, D. A calculation procedure for heat, mass and momentum transfer in three-dimensional parabolic flows. Int. J. Heat Mass Transf. 1972, 15, 1787–1806. [Google Scholar] [CrossRef]
- Nicoud, F.; Ducros, F. Subgrid-scale stress modelling based on the square of the velocity gradient tensor. Flow Turbul. Combust. 1999, 62, 183–200. [Google Scholar] [CrossRef]
- Bradshaw, P.; Ferriss, D.H.; Johnson, R. Turbulence in the noise-producing region of a circular jet. J. Fluid Mech. 1964, 19, 591–624. [Google Scholar] [CrossRef]
- Pope, S.B. Turbulent Flows; IOP Publishing: Bristol, UK, 2001. [Google Scholar]
- Townsend, A. The Structure of Turbulent Shear Flow; Cambridge University Press: Cambridge, UK, 1980. [Google Scholar]
- Dimotakis, P. Turbulent free shear layer mixing and combustion. High Speed Flight Propuls. Syst. 1991, 137, 265–340. [Google Scholar]
- Jimenez, J. Free Shear Flows; Retrieved from torroja. dmt. upm. es; Universidad Politecnica de Madrid: Madrid, Spain, 2013. [Google Scholar]
Publisher’s Note: MDPI stays neutral with regard to jurisdictional claims in published maps and institutional affiliations. |
© 2022 by the authors. Licensee MDPI, Basel, Switzerland. This article is an open access article distributed under the terms and conditions of the Creative Commons Attribution (CC BY) license (https://creativecommons.org/licenses/by/4.0/).

