
Experimental Investigation on Heat Transfer Enhancement with Passive Inserts in Flat Tubes in due Consideration of an Efficiency Assessment


Abstract
:1. Introduction
2. Methods
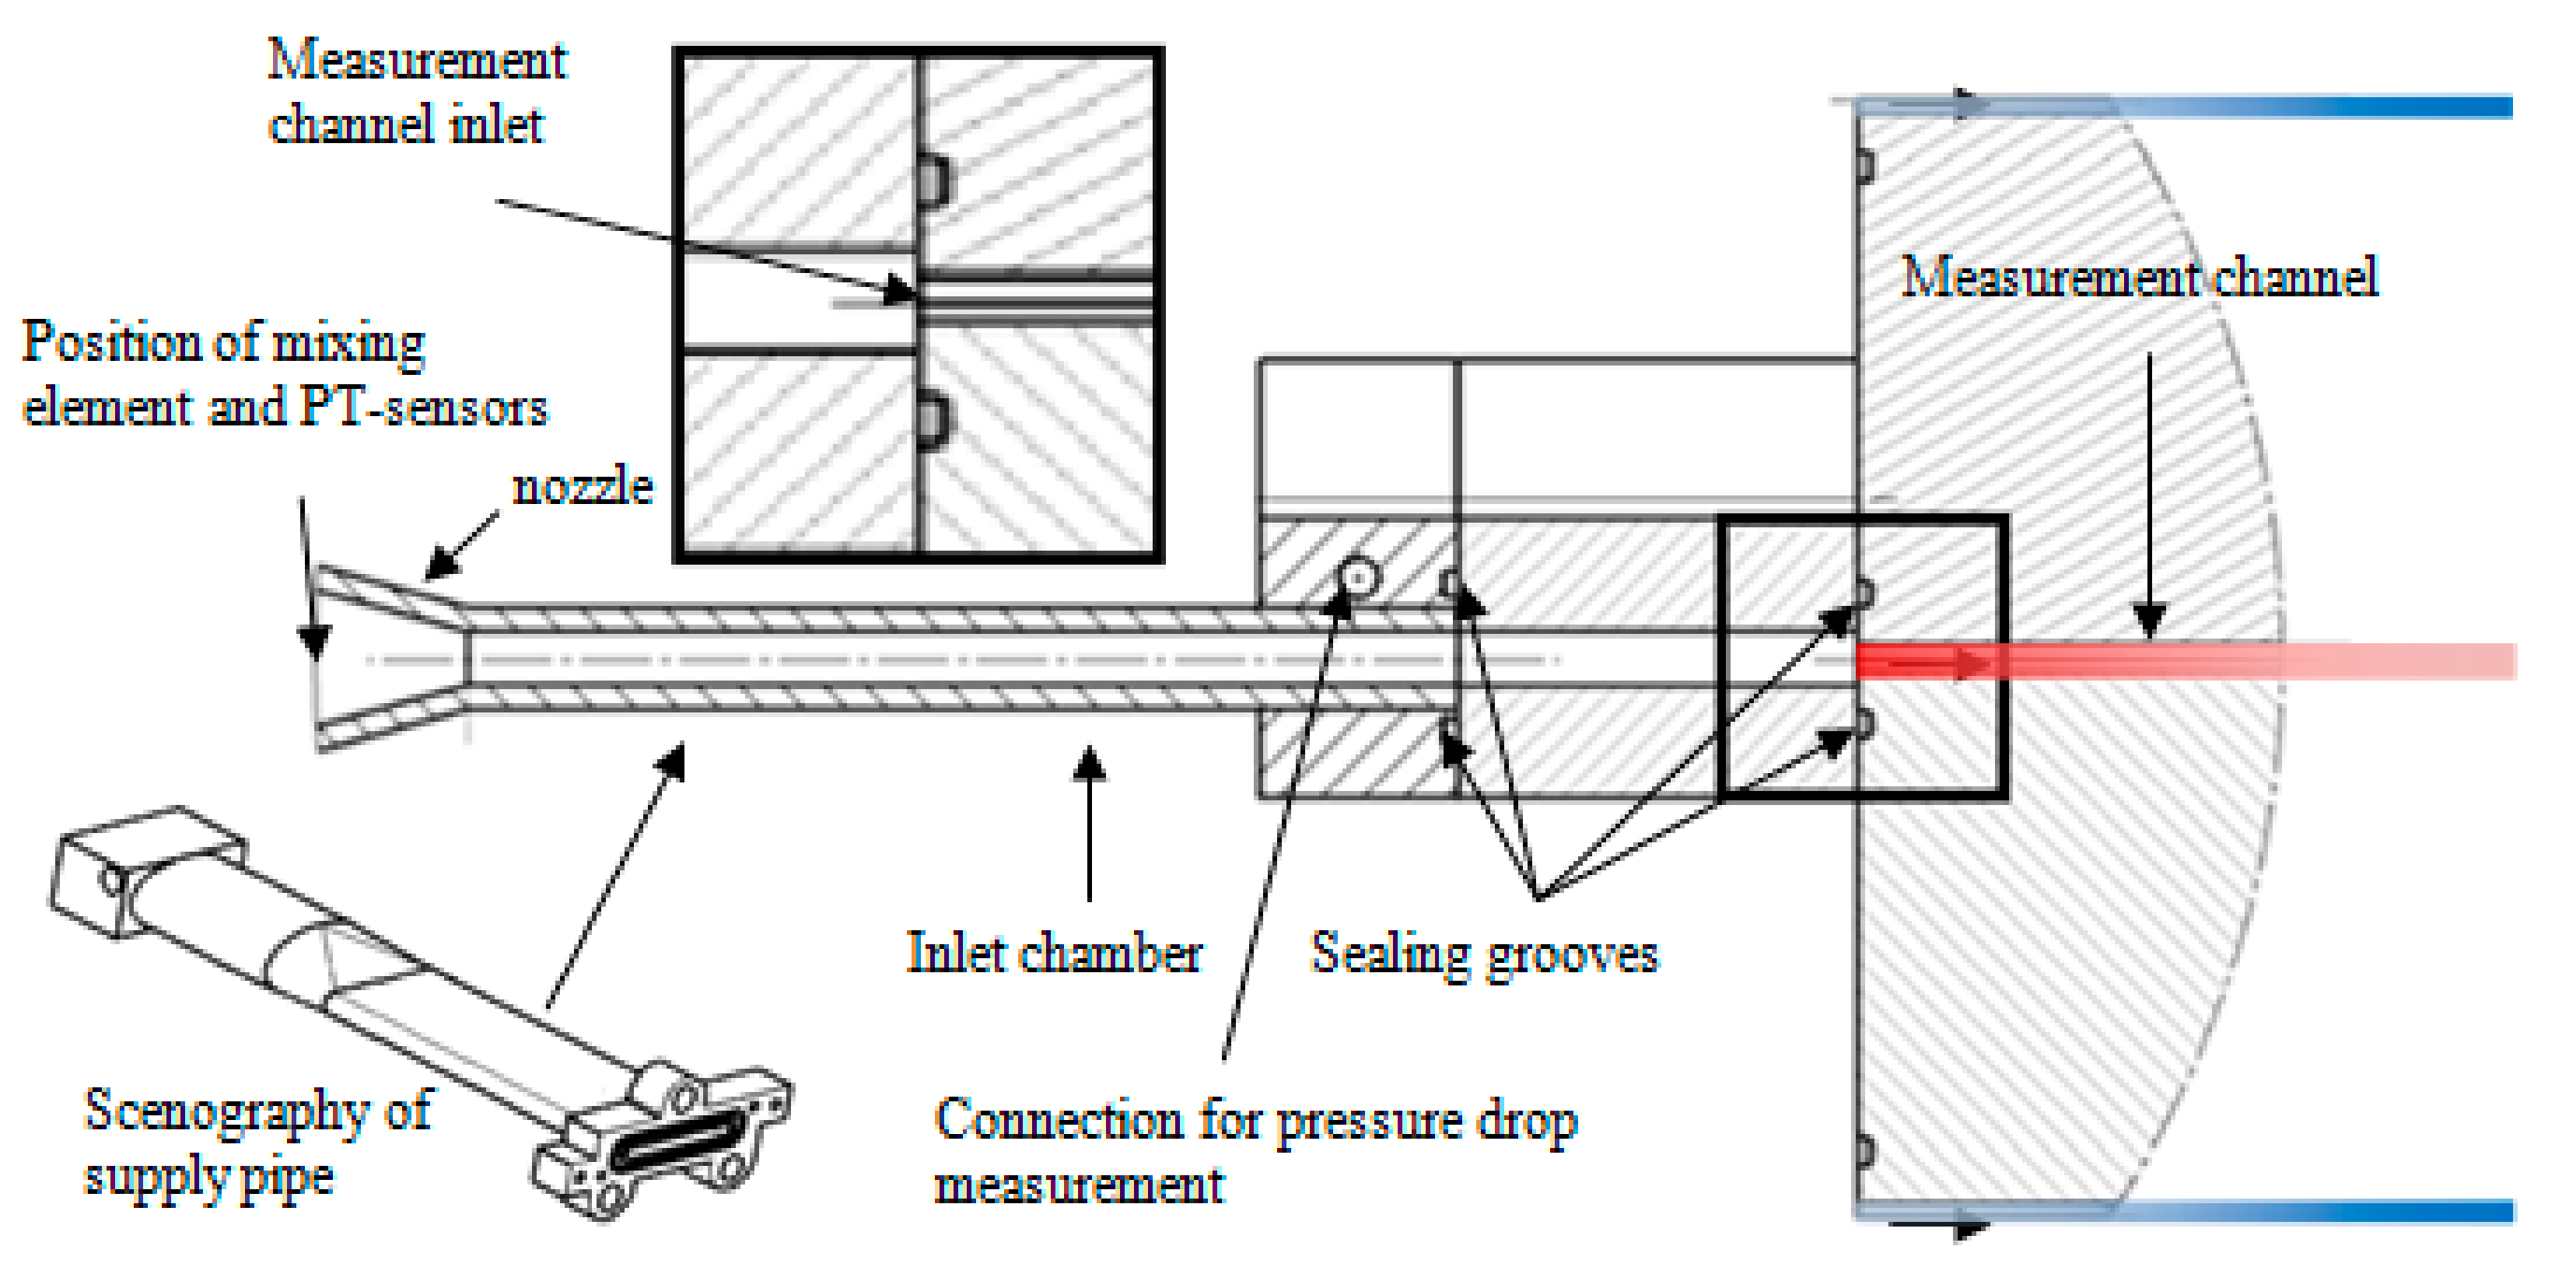
2.1. Test Section
2.2. Hydrodynamic Inlet Boundary Condition
2.3. Thermal Boundary Condition
3. Evaluation Procedure
3.1. Determination of Heat Transfer Coefficients from Measured Data
3.2. Determination of Friction Factor from Measured Data
4. Results and Discussion
4.1. Validation for Flat Tube without Passive Inserts
4.1.1. Heat Transfer
4.1.2. Pressure Drop
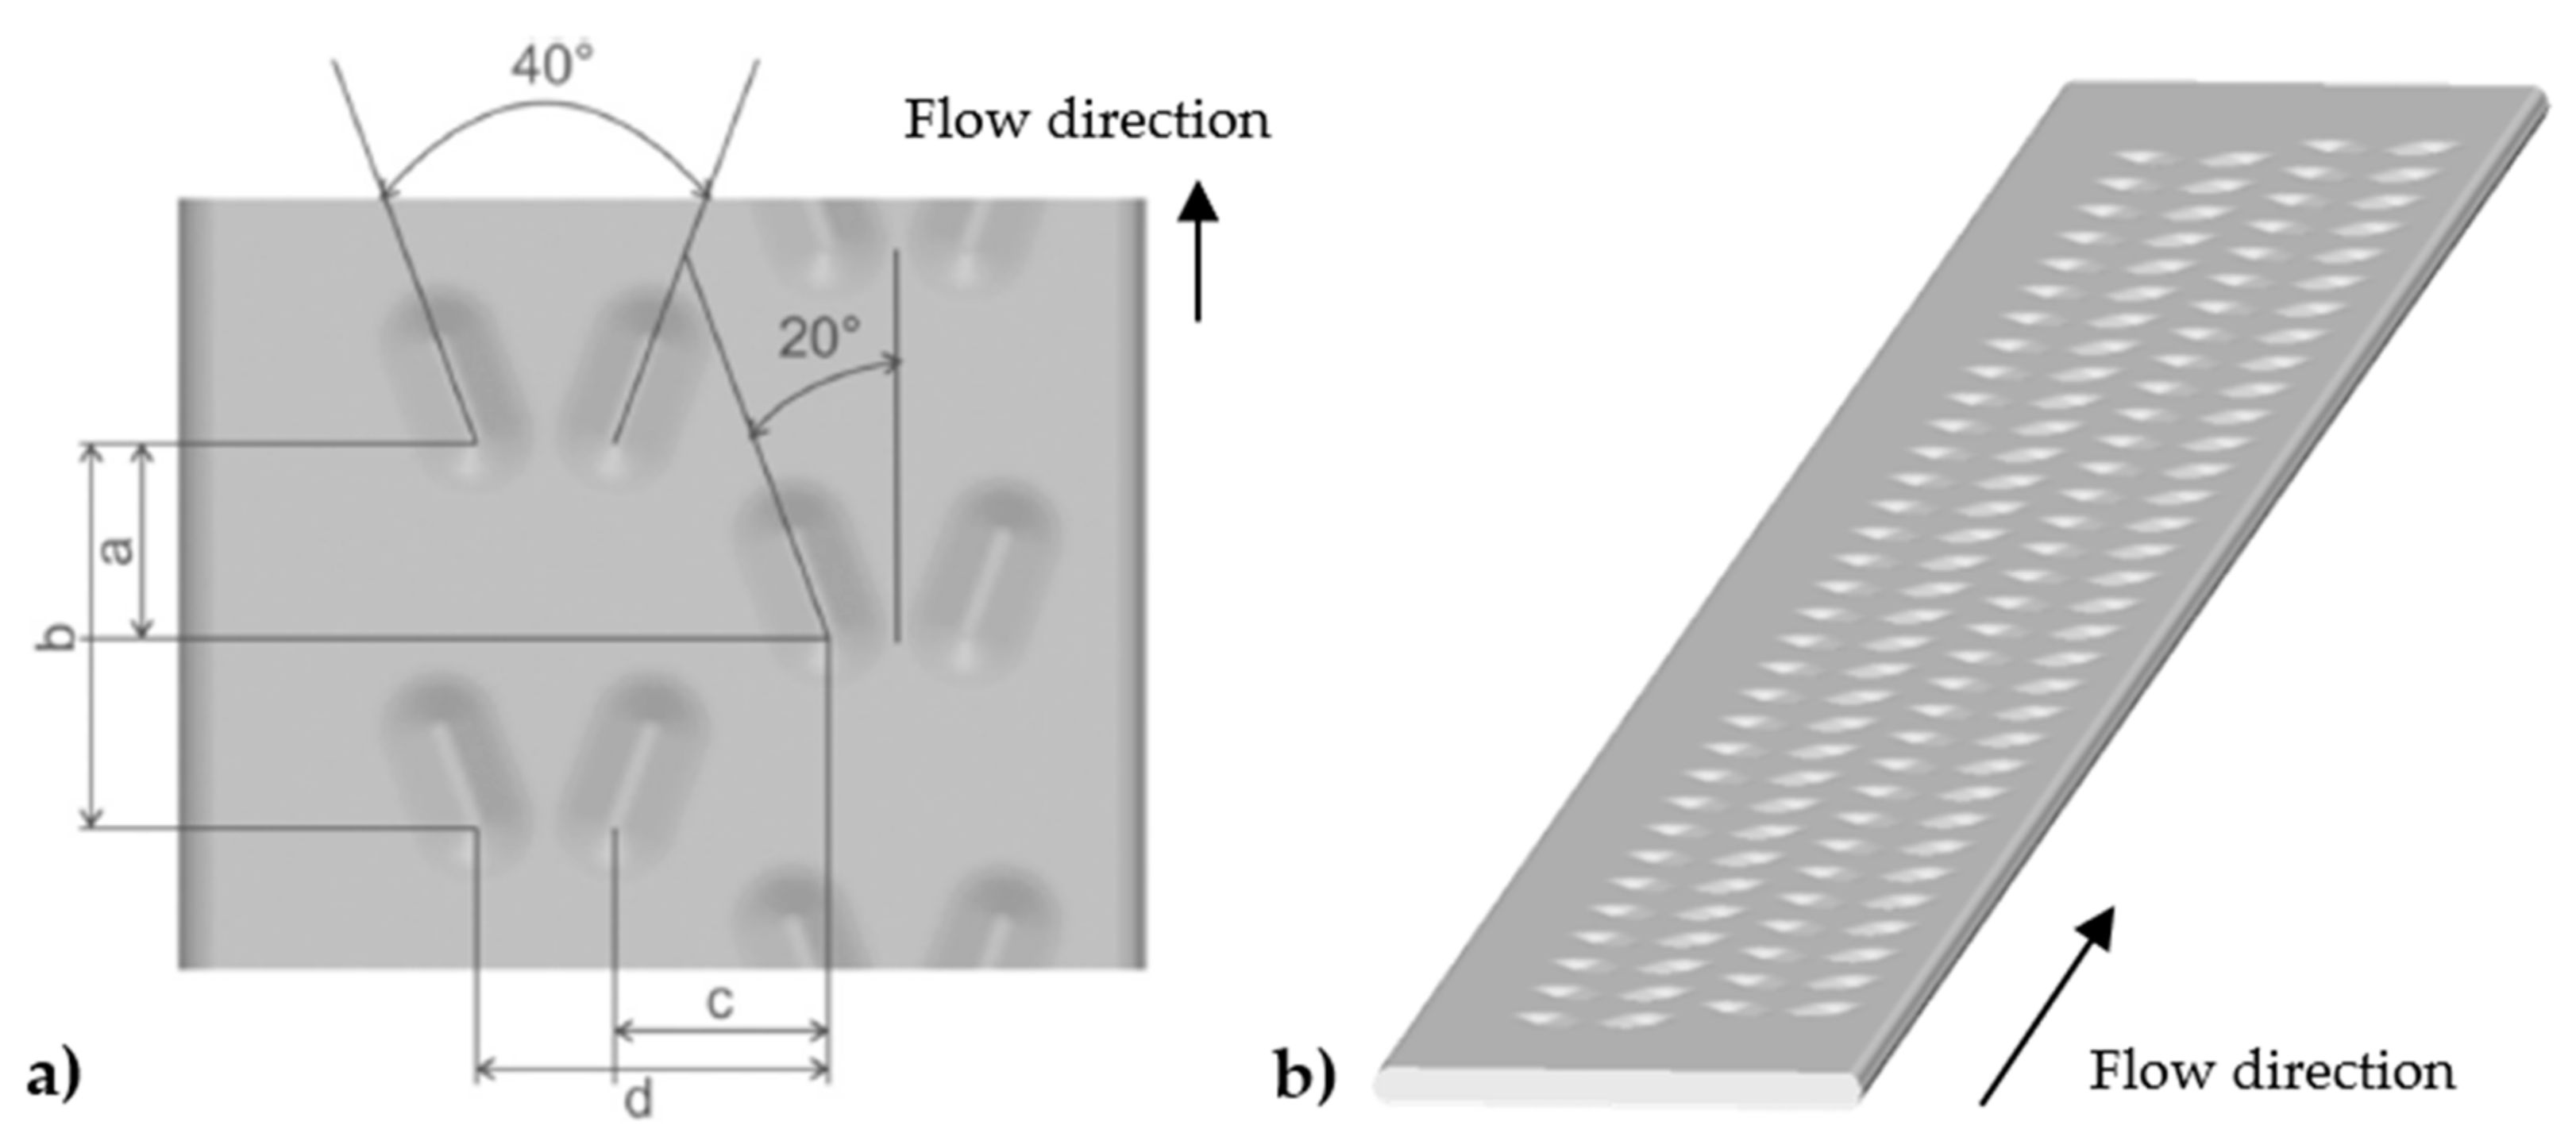
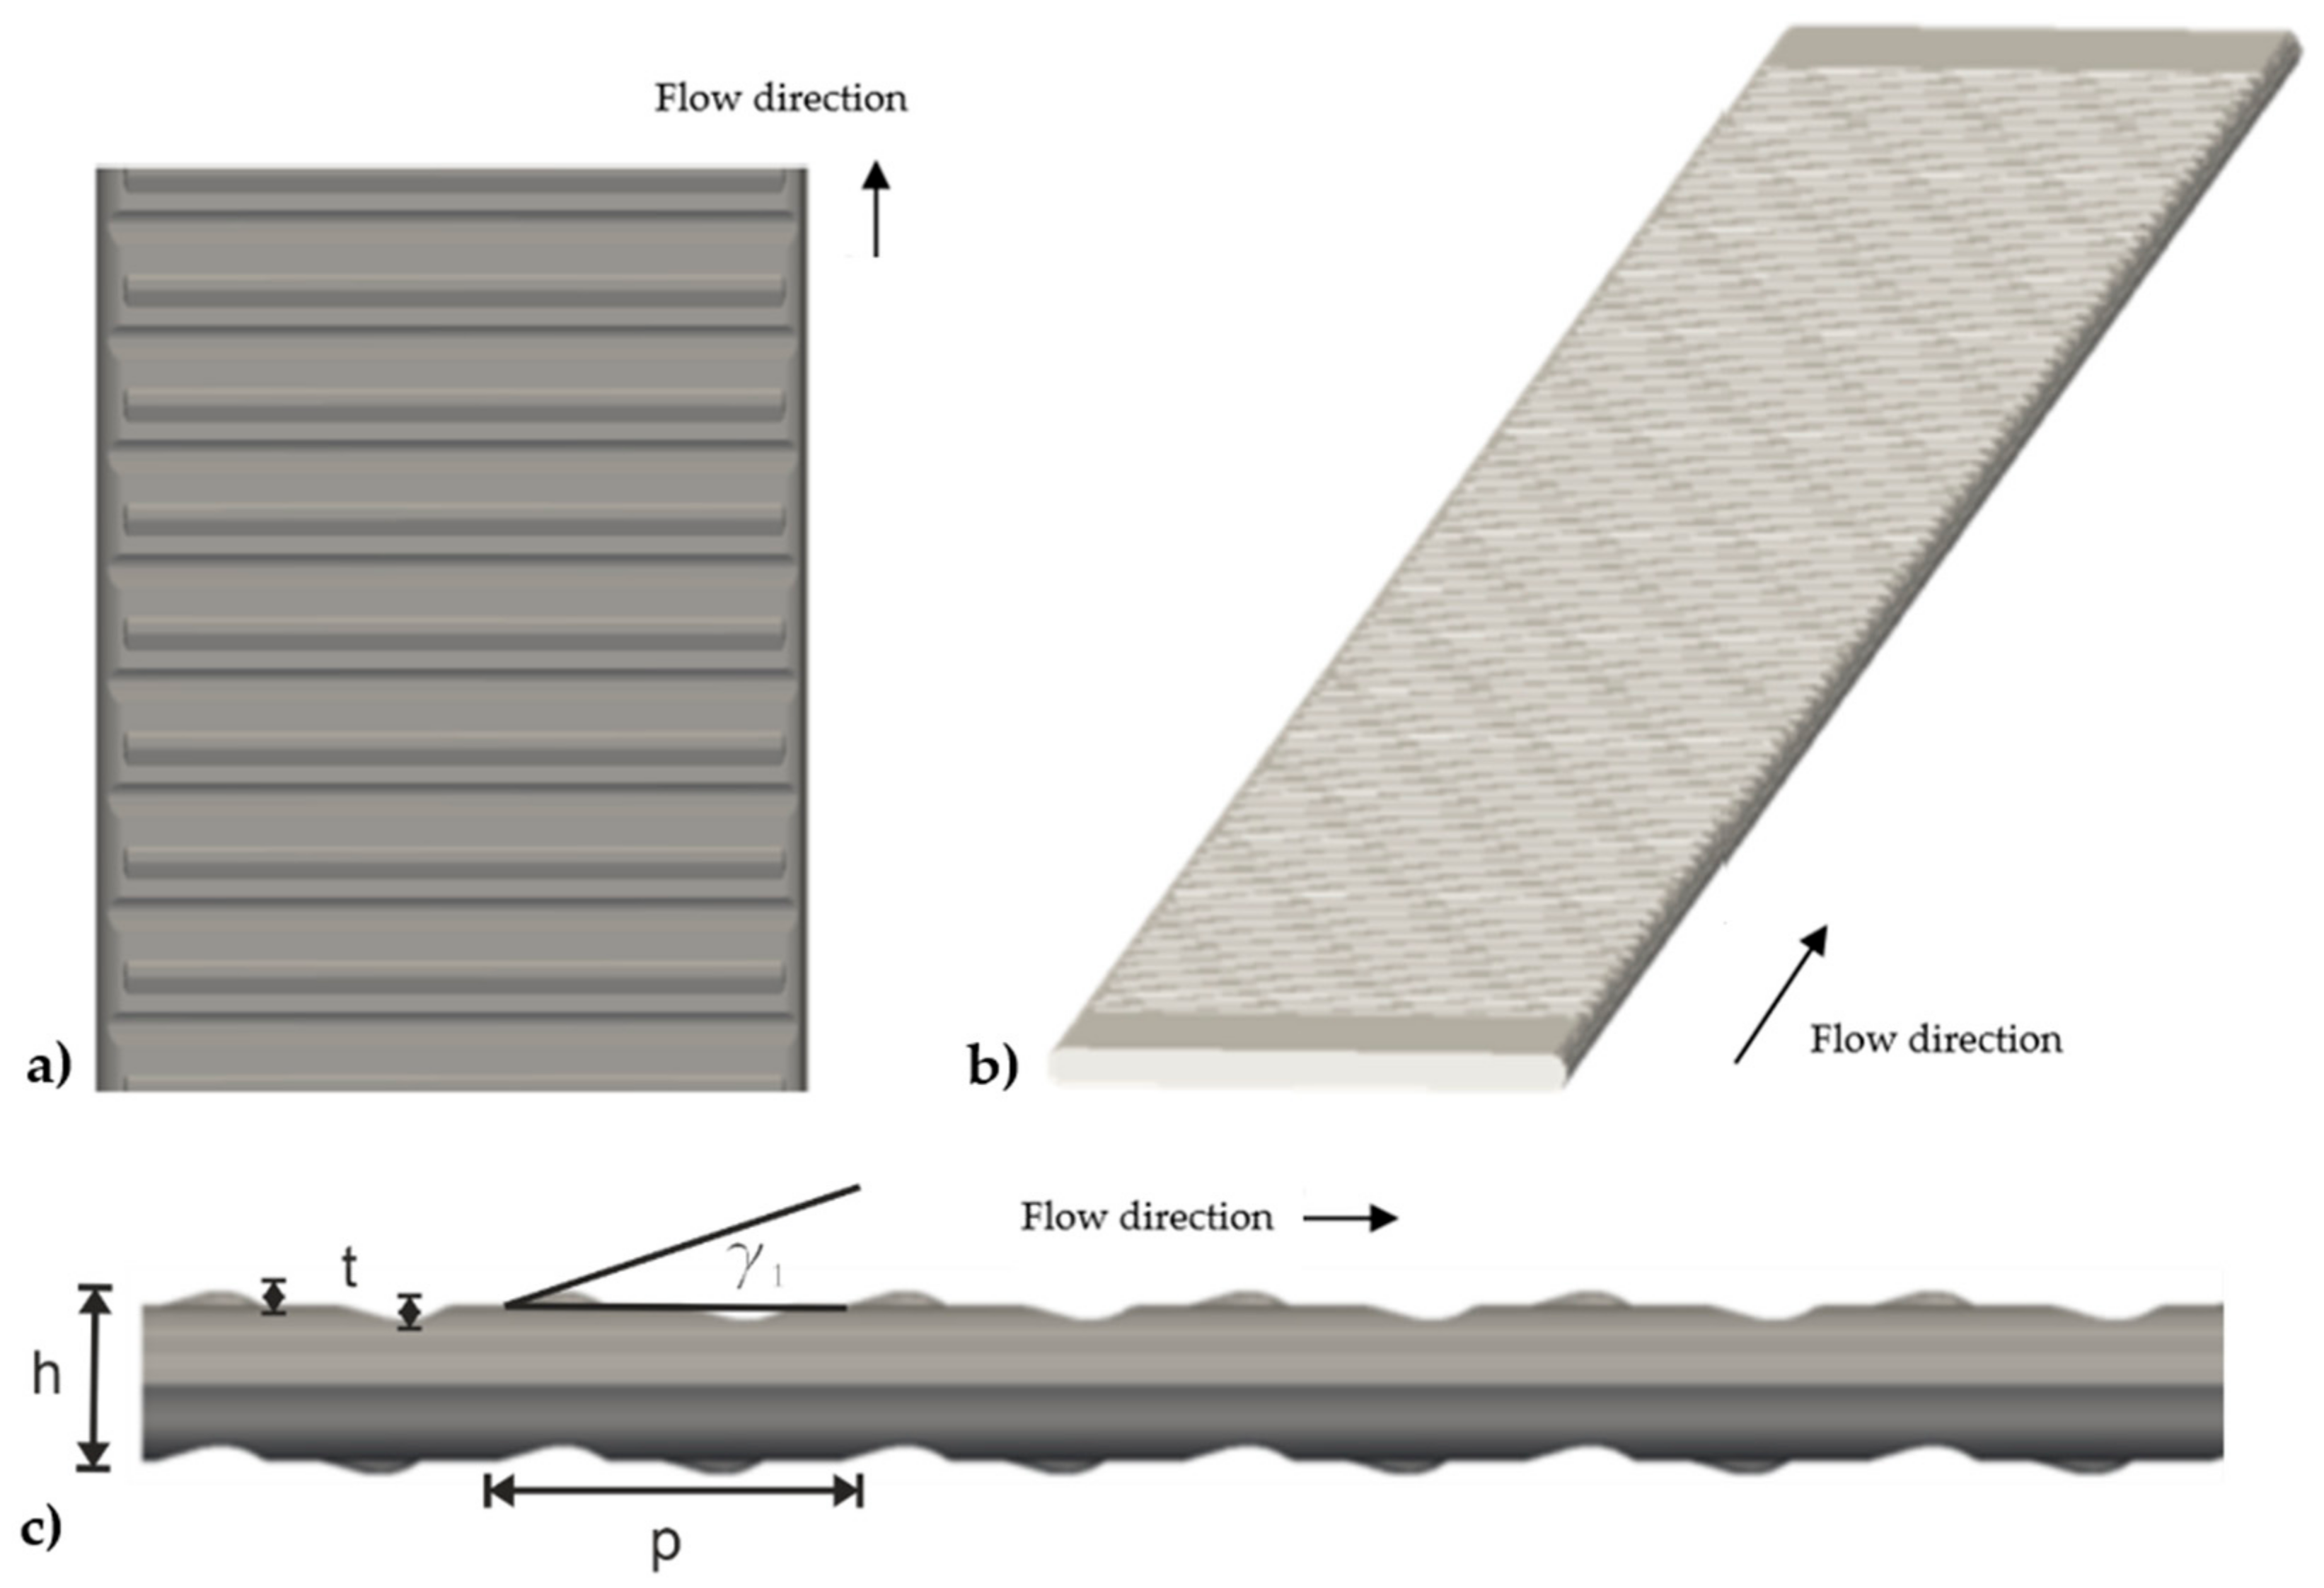
4.2. Geometrical Analysis of Flat Tube Channels with and without Passive Inserts
4.3. Heat and Momentum Transfer without and with Passive Inserts
4.3.1. Friction and Form Drag Analysis
4.3.2. Flow Regime Boundary and Heat Transfer Mechanism Analysis
- -
- Flat tube without passive inserts:
- -
- Flat tube with winglets:
- ○
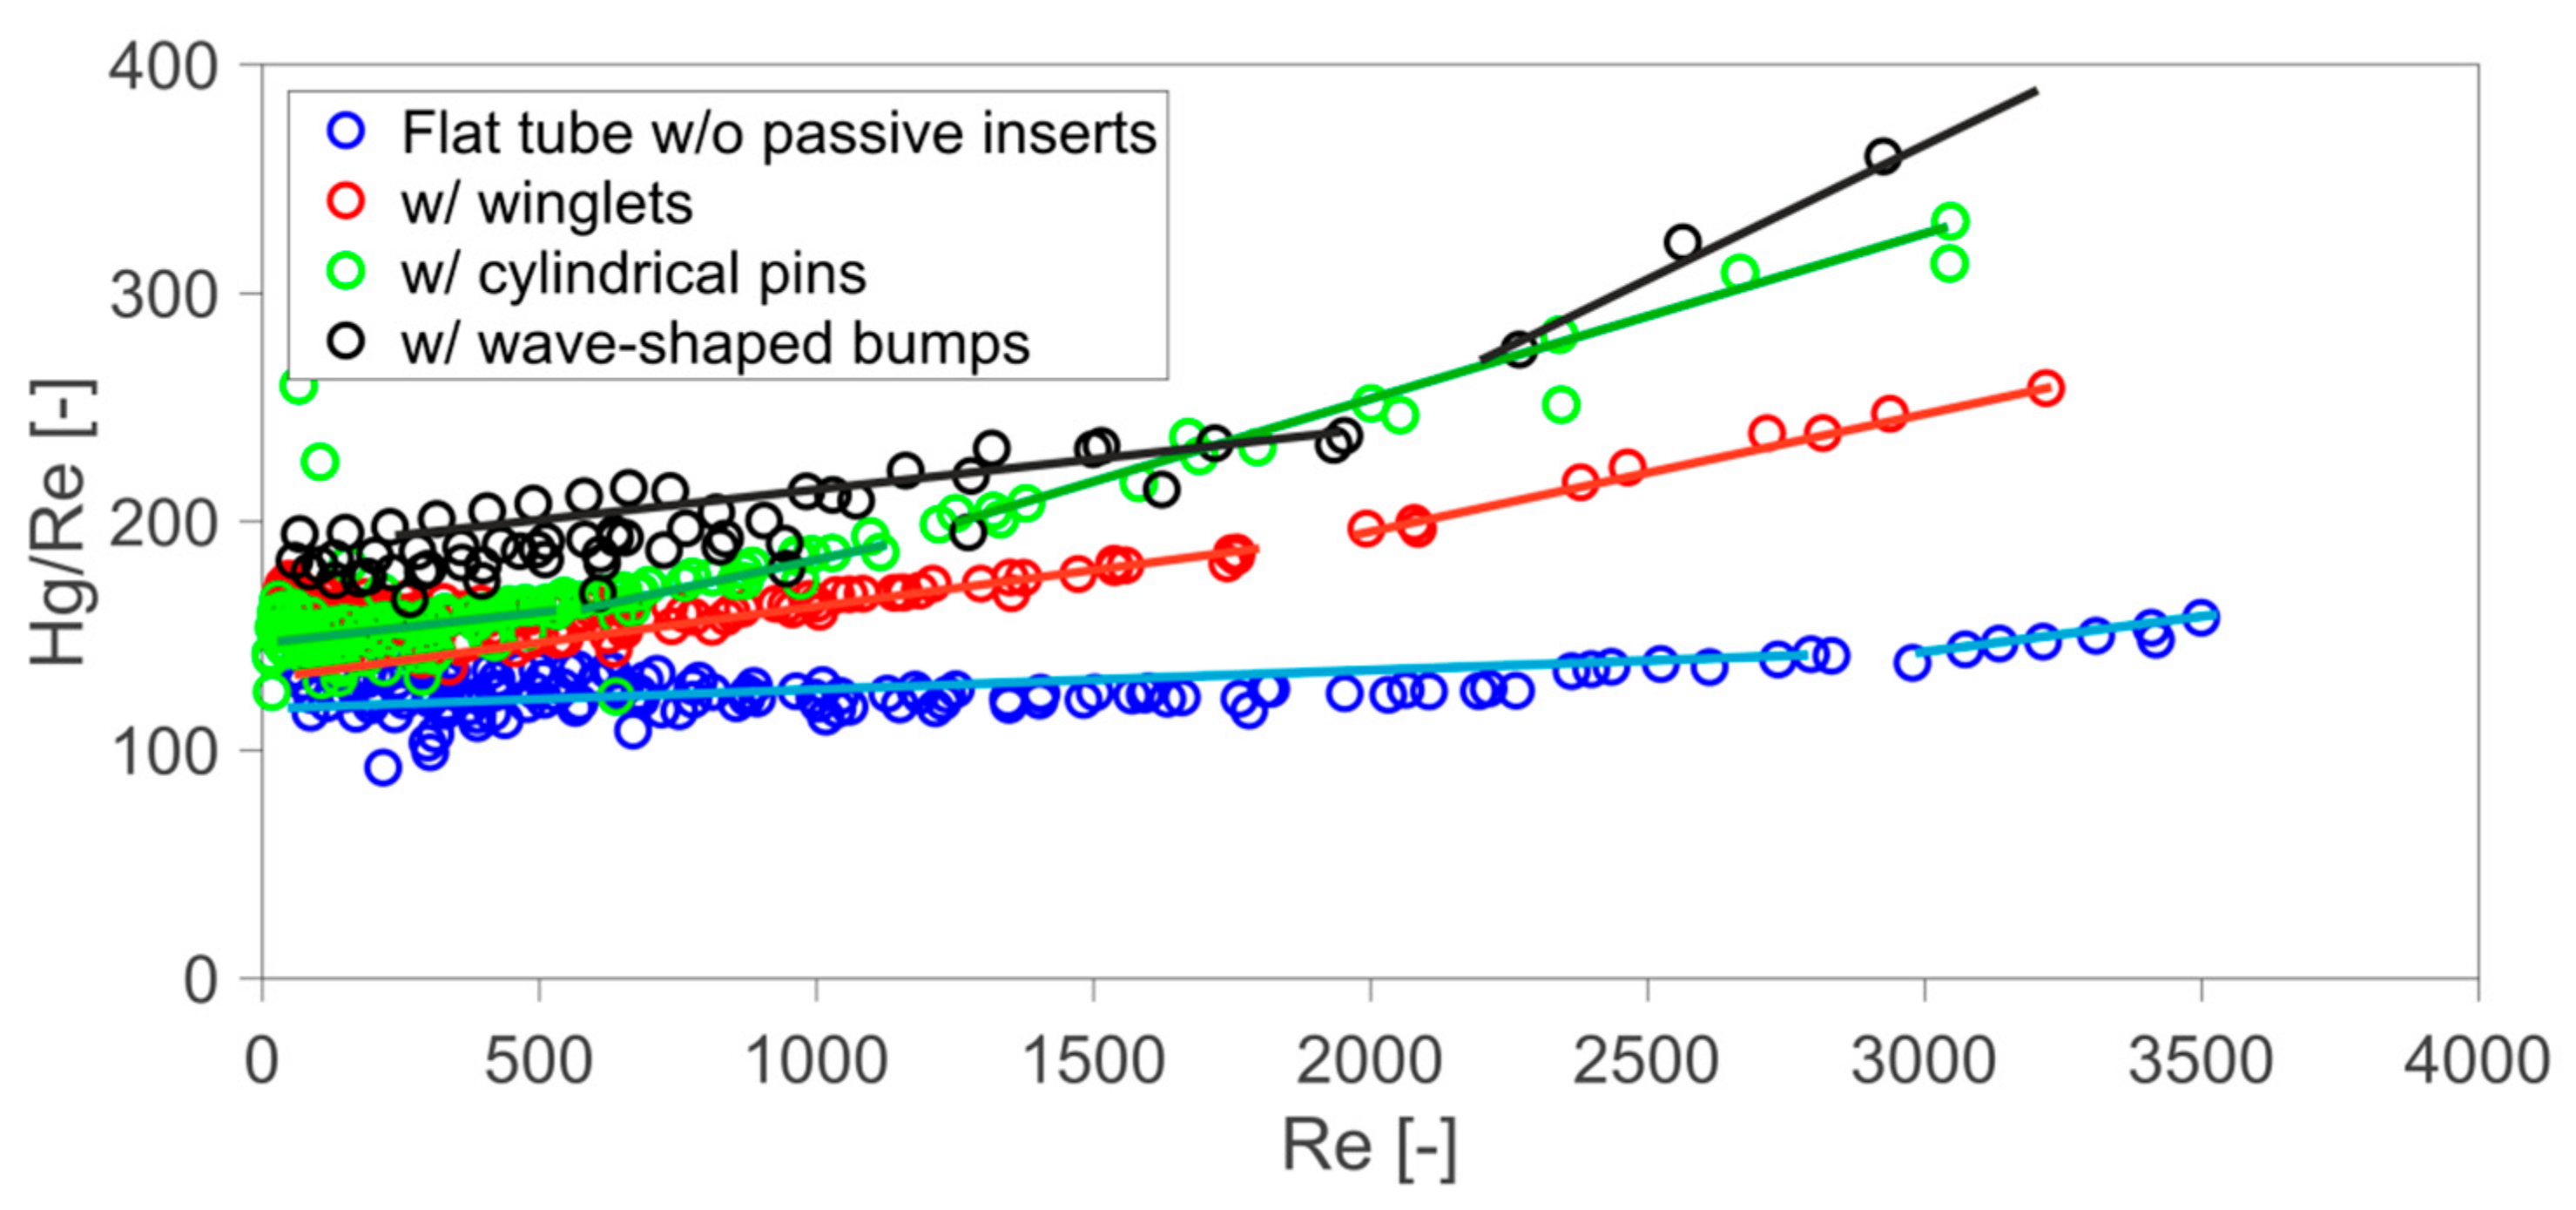
- End of laminar flow regime occurring at Recrit = 1500, indicated by the change in the slope for pressure drop results Δ(Hg/Re)/ΔRe, presented in Figure 13.
- ○
- Therefore, for Re > 1500 we assume that flow separation and local turbulences at the surface of the passive inserts are induced, which changes the character of the flow from laminar to turbulent.
- ○
- These experimental results are confirmed by a numerical investigation with the exact same flat tube channel with winglets by Forooghi et al. [18], who concluded the following:
- ⮚
- “The flow is fully laminar and steady at Re = 1000 and turbulent at Re = 2710. At Re = 1500, turbulence transition is already triggered by formation of unsteady vortices in the region with inserts.”
- ⮚
- “Destruction and reformation of the boundary layer has shown to be the main heat transfer enhancement mechanism due to passive inserts. This mechanism is equally in action in both laminar and turbulent regimes.”
- ○
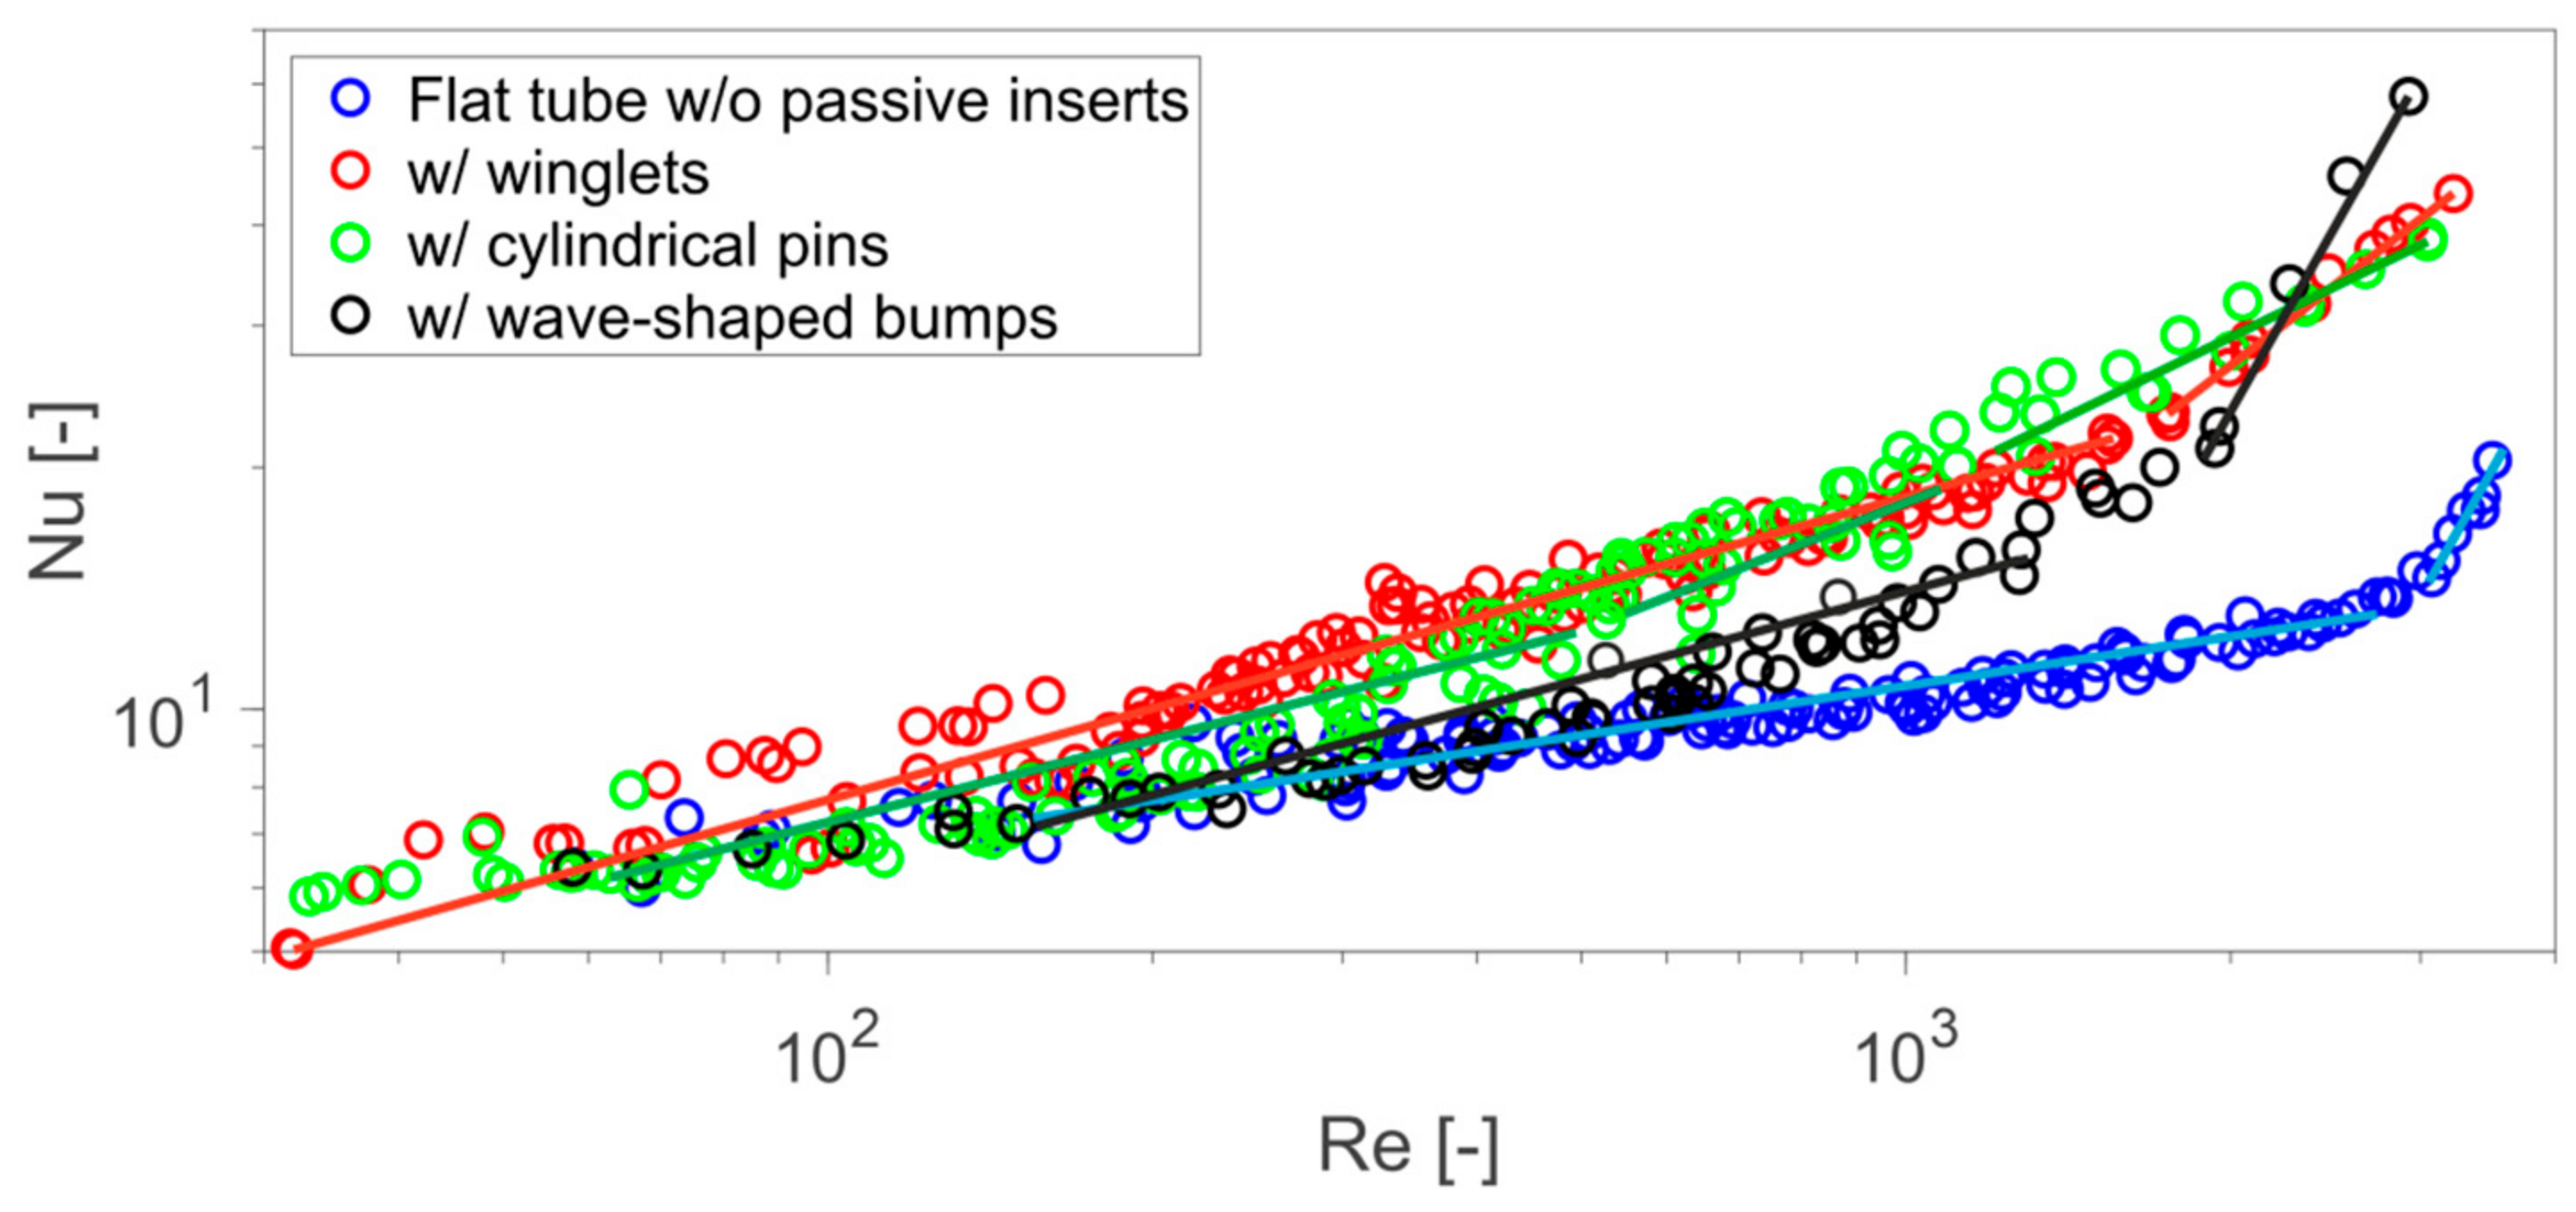
- Confirmation of change in slope for heat transfer results ΔNu/ΔRe at Recrit = 1500 in Figure 12.
4.4. Efficiency Assessment
4.4.1. Energetic Evaluation
- Quasi-local test conditions are required, enabling the use of constant physical properties;
- The heat transferring surface of the channel without passive inserts is used for the calculation of heat transfer of all flat tubes with passive inserts;
- For the calculation of the Reynolds number, the characteristic length of the flat tube without passive inserts is used.
4.4.2. Energetic and Exergetic Evaluation
5. Conclusions
- Pressure drop is mainly induced by friction drag forces. The form drag forces contribute to a significantly minor part on the total pressure drop.
- Laminar flow is present for Reynolds numbers Re < 2800.
- Passive inserts mainly destruct and reform the boundary layer, and form drag and friction pressure drop are increased; however, pressure drop is mainly induced by friction forces.
- Laminar flow is present for Reynolds numbers Re < 1500. Turbulence is induced for Re > 1500.
- “Destruction and reformation of the boundary layer has shown to be the main heat transfer enhancement mechanism due to passive inserts. This mechanism is equally in action in both laminar and turbulent regimes.” [18]
- Passive inserts mainly reduce the critical Reynolds number, inducing turbulence at lower Reynolds numbers, as when using the other passive inserts, which have been investigated in this contribution. Turbulence is induced inside the core flow downstream of the pins for Re > 550.
- Form drag and friction pressure drop are increased; however, pressure drop is mainly induced by form drag forces, arising from local pressure differences.
- Passive inserts mainly destruct and reform the boundary layer, and form drag and friction pressure drop are increased; however, pressure drop is mainly induced by friction forces.
- Turbulence is induced in the near-wall region, which significantly enhances the heat transfer for Re > 2000. Since in near-wall region relatively low velocity components are present, turbulence is induced not before Recrit = 2000 is reached.
Author Contributions
Funding
Acknowledgments
Conflicts of Interest
Nomenclature
| Latin symbols | |
| Heat transfer surface (m²) | |
| Cross section of the measuring channel (m²) | |
| a,b,c,d,e,f | Geometrical distances (m) |
| B, C, B1, C1 | Constant value (—) |
| Specific heat capacity (J kg−1 K−1) | |
| Drag coefficient (—) | |
| d, dh | Diameter (m), hydraulic diameter (m) |
| fD | Darcy friction factor (—) |
| , | Flow forces due to form drag, due to friction drag (N) |
| h | Height of the flat tube channel (m) |
| k | Peak-to-trough roughness height (m) |
| kA | Heat transmission coefficient (W K−1) |
| Length (m) | |
| Mass flow (kg s−1) | |
| n | Normal direction (m) |
| p/h | Pitch-to-height ratio of passive inserts (—) |
| p, Δp | Pressure (bar), pressure drop (bar) |
| Heat flow (W), Heat flow density (W m−2) | |
| Heat transfer resistance (K W−1) | |
| t/h | Depth-to-height ratio of passive inserts (—) |
| Temperature (°C), temperature difference (K) | |
| Mean flow velocity (m s−1) | |
| V | Fluid volume inside flat tube (m³) |
| xm | Mass fraction (—) |
| Greek symbols | |
| Heat transfer coefficient (W m−2 K−1) | |
| Dynamic viscosity (kg m−1 s−1) | |
| Thermal conductivity (W m−1 K−1) | |
| Kinematic viscosity (m² s−1) | |
| Density (kg m−3) | |
| τ | Shear stress (N m−2) |
| Subscripts | |
| Aluminum | |
| crit | Indication of boundary between flow regimes |
| Cold flow | |
| d | Pin diameter |
| fl | Flat tube |
| Hot flow | |
| Inlet | |
| lam | Laminar |
| Outlet | |
| Plane in the aluminum shell | |
| turb | Turbulent |
| UWT | Uniform wall temperature |
| w | Wall |
| Dimensionless numbers | |
| Nusselt number (—) | |
| Reynolds number (—) | |
| Prandtl number (—) | |
| Hagen number (—) | |
Appendix A
References
- Lau, S.C.; Kukreja, R.T.; McMillin, R.D. Effects of V-shaped rib arrays on turbulent heat transfer and friction of fully developed flow in a square channel. Int. J. Heat Mass Transf. 1991, 34, 1605–1616. [Google Scholar] [CrossRef]
- Han, J.C.; Zhang, Y.M. High performance heat transfer ducts with parallel broken and V-shaped broken ribs. Int. J. Heat Mass Transf. 1992, 35, 513–523. [Google Scholar] [CrossRef]
- Kumar, S.; Saini, R. CFD based performance analysis of a solar air heater duct provided with artificial roughness. Renew. Energy 2009, 34, 1285–1291. [Google Scholar] [CrossRef]
- Chung, H.; Park, J.; Park, S.S.; Choi, S.M.; Rhee, D.-H.; Cho, H.H. Augmented heat transfer with intersecting rib in rectangular channels having different aspect ratios. Int. J. Heat Mass Transf. 2015, 88, 357–367. [Google Scholar] [CrossRef]
- Turnow, J.; Kornev, N.; Isaev, S.; Hassel, E. Vortex mechanism of heat transfer enhancement in a channel with spherical and oval dimples. Int. J. Heat Mass Transf. 2011, 47, 301–313. [Google Scholar] [CrossRef]
- Peng, Y. Heat Transfer and Friction Loss Characteristics of Pin Fin Cooling Configurations. J. Eng. Gas Turbines Power 1984, 106, 246–251. [Google Scholar] [CrossRef]
- Armstrong, J.; Winstanley, D. A review of staggered array pin fin heat transfer for turbine cooling applications. ASME J. Turbomach. 1988, 110, 94–103. [Google Scholar] [CrossRef]
- Metzger, D.E.; Berry, R.A.; Bronson, J.P. Developing heat transfer in rectangular ducts with staggered arrays of short pin fins. ASME J. Heat Transf. 1982, 104, 700–706. [Google Scholar] [CrossRef]
- Wang, F.; Zhang, J.; Wang, S. Investigation on flow and heat transfer characteristics in rectangular ducts with drop-shaped pin-fins. Propuls. Power Res. 2012, 1, 64–70. [Google Scholar] [CrossRef] [Green Version]
- Wongcharee, K.; Changcharoen, W.; Eiamsa-ard, S. Numerical investigation of flow friction and heat transfer in a channel with various shaped ribs mounted on two opposite ribbed walls. Int. J. Chem. React. Eng. 2011, 9, A26. [Google Scholar] [CrossRef]
- Dewan, A.; Mahanta, P.; Raju, K.S.; Kumar, P.S. Review of passive heat transfer augmentation techniques. Proc. Inst. Mech. Eng. Part A J. Power Energy 2004, 218, 509–527. [Google Scholar] [CrossRef]
- Bertsche, D.; Knipper, P.; Dietrich, B.; Wetzel, T. The Generalized Lévêque Equation and its application to circular pipe flow. Int. J. Heat Mass Transf. 2015, 90, 1255–1265. [Google Scholar] [CrossRef]
- Bertsche, D.; Wetzel, T. Experimental set-up for investigation of passive heat transfer augmentation in water-air heat exchangers. In Proceedings of the 8th World Congress on Experimental Heat Transfer, Fluid Mechanics and Thermodynamics, Lisbon, Portugal, 16–20 June 2013. [Google Scholar]
- Bertsche, D.; Knipper, P.; Wetzel, T. Experimental investigation on heat transfer in laminar, transitional and turbulent circular pipe flow. Int. J. Heat Mass Transf. 2016, 95, 1008–1018. [Google Scholar] [CrossRef]
- Bertsche, D.; Knipper, P.; Kapfer, K.; Wetzel, T. Experimental investigation on heat transfer in laminar, transitional and turbulent circular pipe flow with respect to flow regime boundaries. Int. J. Heat Mass Transf. 2019, 145, 118746. [Google Scholar] [CrossRef]
- Bertsche, D.; Meinicke, S.; Knipper, P.; Dubil, K.; Wetzel, T. The Generalized Lévêque Equation and its application to flat tubes without and with passive inserts. Int. J. Heat Mass Transf. 2021, 171, 121053. [Google Scholar] [CrossRef]
- Herwig, H. Wärmeübertragung: Physikalische Grundlagen, 3. Erweiterte und Überarbeitete Auflage; Springer: Wiesbaden, Germany, 2014. [Google Scholar]
- Forooghi, P.; Flory, M.; Bertsche, D.; Wetzel, T.; Frohnapfel, B. Heat transfer enhancement on the liquid side of an industrially designed flat-tube heat exchanger with passive inserts–Numerical investigation. Appl. Therm. Eng. 2017, 123, 573–583. [Google Scholar] [CrossRef]
- Ghajar, A.J.; Madon, K.F. Pressure drop measurements in the transition region for a cylindrical tube with three different inlet configurations. Exp. Therm. Fluid Sci. 1992, 5, 129–135. [Google Scholar] [CrossRef]
- Ghajar, A.J.; Tam, L.M. Flow regime map for a horizontal pipe with uniform wall heat flux and three inlet configurations. Exp. Therm. Fluid Sci. 1995, 10, 287–297. [Google Scholar] [CrossRef]
- Ghajar, A.J.; Tam, L.M. Heat transfer measurements and correlations in the transition region for a cylindrical tube with three different inlet configurations. Exp. Therm. Fluid Sci. 1994, 8, 79–90. [Google Scholar] [CrossRef]
- Kast, W. Pressure Drop in Single Phase Flow, VDI Heat Atlas, 2nd ed.; Springer Verlag: Berlin/Heidelberg, Germany, 2010; Chapter Lac 1–6. [Google Scholar]
- ISO/IEC GUIDE 98-3:2008; Uncertainty of Measurement–Part 3: Guide to the Expression of Uncertainty in Measurement (GUM:1995). ISO/IEC: Geneva, Switzerland, 2008.
- Baehr, H.D.; Stephan, K. Wärme-und Stoffübertragung; Springer: Berlin, Germany, 2010; Chapter 2.2.5.1; pp. 154–161. [Google Scholar]
- Della, A.; Torre, G.; Montenegro, G.R.; Tabor, M.; Wears, L. CFD characterization of flow regimes inside open cell foam substrates. Int. J. Heat Fluid Flow 2014, 50, 72–82. [Google Scholar] [CrossRef] [Green Version]
- Garimella, S.; Dowling, W.J.; Van Der Veen, M.; Killion, J.D. The effect of simultaneously developing flow on heat transfer in rectangular tubes. Heat Transf. Eng. 2001, 22, 12–25. [Google Scholar] [CrossRef]
- Shah, R.K.; Bhatti, M.S. Laminar Convective Heat Transfer in Ducts. In Handbook of Single-Phase Convective Heat Transfer; Kakac, S., Shah, R.K., Eds.; Wiley: New York, NY, USA, 1987; pp. 3.1–3.137. [Google Scholar]
- VanFossen, G.J. Staggered Arrays of Short Pin. J. Eng. Gas Turbines Power 1982, 104, 268–274. [Google Scholar] [CrossRef] [Green Version]
- Moon, M.A.; Kim, K.Y. Analysis and optimization of fan-shaped pin–fin in a rectangular cooling channel. Int. J. Heat Mass Transf. 2014, 72, 148–162. [Google Scholar] [CrossRef]
- Schlichting, H.; Gersten, K. Boundary Layer Theory, 10th ed.; Springer: Berlin/Heidelberg, Germany, 2006. [Google Scholar]
- Wang, G.L.; Yang, D.W.; Wang, Y.D.; Niu, X.; Zhao, L.; Ding, G. Heat Transfer and Friction Characteristics of the Microfluidic Heat Sink with Variously-Shaped Ribs for Chip Cooling. Sensors 2015, 15, 9547–9562. [Google Scholar] [CrossRef] [Green Version]
- Park, J.S.; Han, J.C.; Huang, Y.; Ou, S.; Boyle, R.J. Heat transfer performance comparisons of five different rectangular channels with parallel angled ribs. Int. J. Heat Mass Transf. 1992, 35, 2891–2903. [Google Scholar] [CrossRef]
- Fan, J.F.; Ding, W.K.; Zhang, J.F.; He, Y.L.; Tao, W.Q. A performance evaluation plot of enhanced heat transfer techniques oriented for energysaving. Int. J. Heat Mass Transf. 2009, 52, 33–44. [Google Scholar] [CrossRef]
- Bejan, A. Entropy Generation Through Heat and Fluid Flow; CRC Press: New York, NY, USA, 1982. [Google Scholar]
- Bejan, A. Entropy Generation Minimisation; Wiley: New York, NY, USA, 1996. [Google Scholar]
- Zimparov, V.D.; Vulchanov, N.L. Performance evaluation criteria for enhanced heat transfer surfaces. Int. J. Heat Mass Transf. 1994, 37, 1807–1816. [Google Scholar] [CrossRef]
- Zimparov, V.D. Extended performance evaluation criteria for enhanced heat transfer surfaces: Heat transfer through ducts with constant wall temperature. Int. J. Heat Mass Transf. 2000, 43, 3137–3155. [Google Scholar] [CrossRef]
- Prasad, R.C.; Shen, J. Performance evaluation of convective heat transfer enhancement devices using exergy analysis. Int. J. Heat Mass Transf. 1993, 36, 4193–4197. [Google Scholar] [CrossRef]
- Hesselgreaves, J.E. Rationalisation of second law analysis of heat exchangers. Int. J. Heat Mass Transf. 2000, 43, 4189–4204. [Google Scholar] [CrossRef]


| Parameter | Value |
|---|---|
| Number of bumps/- | 168 |
| t/h/- | 0.12 |
| p/h/- | 11.6 |
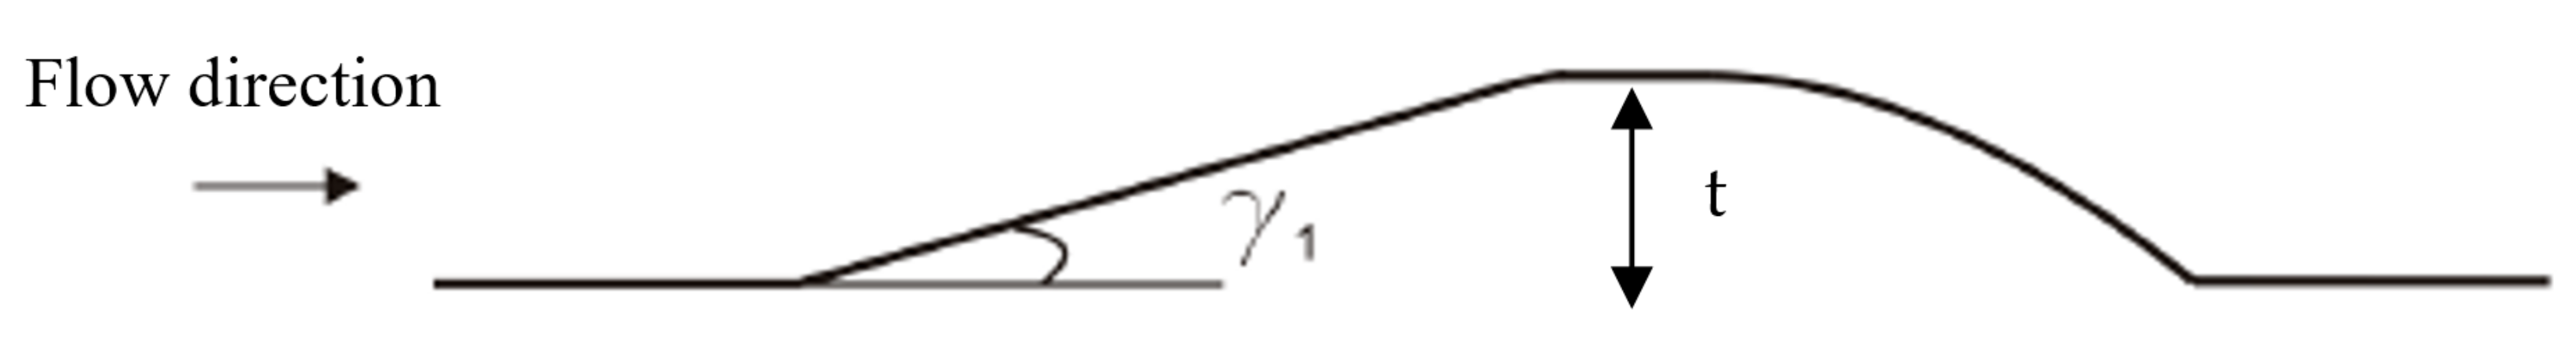
| γ1/- | 16° |
| Measurement Device | Uncertainty |
|---|---|
| Resistance thermometer Pt100 with data logger: NI9213 (National Instruments) | ΔT ≤ ±0.023 K |
| Thermocouple Typ K with data logger: NI9203 (National Instruments) and external reference temperature | ΔT ≤ ±0.14 K |
| Coriolis mass flow meter CMFS015M with evaluation electronics MVD 2500D (Emerson Process Management) | ≤ ±0.05 % |
| Target Values | Uncertainty |
| Nusselt number/- | ΔNu ≤ ±12% |
| Pressure drop/mbar | Δp ≤ ±8.5% |
| Pr | Re | Flat Tube without Passive Inserts | Flat Tube with “Winglets” | Flat Tube with Cylindrical Pins | Flat Tube with Wave-Shaped Bumps |
|---|---|---|---|---|---|
| 8 | 200–3500 | 27 | 9 | 17 | 9 |
| 11 | 150–2700 | 22 | 13 | 0 | 0 |
| 13 | 190–2000 | 9 | 9 | 15 | 9 |
| 15 | 170–1600 | 11 | 11 | 0 | 0 |
| 17 | 150–1500 | 8 | 9 | 14 | 9 |
| 22 | 120–1300 | 8 | 9 | 9 | 9 |
| 26 | 90–1500 | 13 | 10 | 22 | 9 |
| 32 | 75–800 | 9 | 9 | 11 | 9 |
| 36 | 70–750 | 8 | 9 | 30 | 9 |
| 40 | 50–650 | 8 | 9 | 15 | 0 |
| 50 | 45–500 | 0 | 9 | 0 | 0 |
| 60 | 40–400 | 0 | 9 | 0 | 0 |
| Total | 123 | 115 | 133 | 63 |
| Flat Tube Channel | A/m² | (Aw − Aw/o)/Aw/o/% | SV/m²/m³ | SV/% |
|---|---|---|---|---|
| w/o passive inserts | 6.75 × 10⁻³ | - | 1907 | - |
| w/“winglets” | 6.82 × 10⁻³ | 1.0 | 2018 | 5.8 |
| w/cylindrical pins | 6.80 × 10⁻³ | 0.7 | 1928 | 1.1 |
| w/wave-shaped bumps | 6.90 × 10⁻³ | 2.2 | 1976 | 3.6 |
| Flat Tube Channel | Axis Intercept B in Hg/Re vs. Re Plot (Measure for Friction Drag Pressure Drop) | Slope C in Hg/Re vs. Re Plot (Measure for Form Drag Pressure Drop) |
|---|---|---|
| w/o passive inserts | 120 | 0.0048 |
| w/“winglets” | 150 | 0.0200 |
| w/cylindrical pins | 138 | 0.0430 |
| w/wave-shaped bumps | 185 | 0.0200 |
| Flow Regime According to [30] | Rep Taken from [30] | Refl Calculated from Rep [30] | Refl Determined from Exp. Data, see Figure 11 and Figure 12 |
|---|---|---|---|
| Laminar flow | <150 | <522 | <550 |
| Transition to turbulence | 150 < Rep < 350 | 522 < Refl < 1225 | 550 < Refl < 1200 |
| Fully turbulent flow | Rep > 400 | Refl > 1225 | Refl > 1200 |
Publisher’s Note: MDPI stays neutral with regard to jurisdictional claims in published maps and institutional affiliations. |
© 2022 by the authors. Licensee MDPI, Basel, Switzerland. This article is an open access article distributed under the terms and conditions of the Creative Commons Attribution (CC BY) license (https://creativecommons.org/licenses/by/4.0/).
Share and Cite
Bertsche, D.; Knipper, P.; Meinicke, S.; Dubil, K.; Wetzel, T. Experimental Investigation on Heat Transfer Enhancement with Passive Inserts in Flat Tubes in due Consideration of an Efficiency Assessment. Fluids 2022, 7, 53. https://doi.org/10.3390/fluids7020053
Bertsche D, Knipper P, Meinicke S, Dubil K, Wetzel T. Experimental Investigation on Heat Transfer Enhancement with Passive Inserts in Flat Tubes in due Consideration of an Efficiency Assessment. Fluids. 2022; 7(2):53. https://doi.org/10.3390/fluids7020053
Chicago/Turabian StyleBertsche, Dirk, Paul Knipper, Sebastian Meinicke, Konrad Dubil, and Thomas Wetzel. 2022. "Experimental Investigation on Heat Transfer Enhancement with Passive Inserts in Flat Tubes in due Consideration of an Efficiency Assessment" Fluids 7, no. 2: 53. https://doi.org/10.3390/fluids7020053
APA StyleBertsche, D., Knipper, P., Meinicke, S., Dubil, K., & Wetzel, T. (2022). Experimental Investigation on Heat Transfer Enhancement with Passive Inserts in Flat Tubes in due Consideration of an Efficiency Assessment. Fluids, 7(2), 53. https://doi.org/10.3390/fluids7020053