Article

Numerical Study of Multiple Bio-Inspired Torsionally Hinged Flaps for Passive Flow Control

Department of Aerospace Engineering, University of Illinois Urbana-Champaign, Urbana, IL 61801, USA
*
Author to whom correspondence should be addressed.
Fluids 2022, 7(2), 44; https://doi.org/10.3390/fluids7020044
Submission received: 30 November 2021 / Revised: 5 January 2022 / Accepted: 11 January 2022 / Published: 18 January 2022
(This article belongs to the Special Issue Computational Biofluiddynamics: Advances and Applications)

Abstract

:
Covert feathers are a set of self-actuating, passively deployable feathers located on the upper surfaces of wings that augment lift at post-stall angles of attack. Due to these benefits, the study of covert-inspired passive flow control devices is becoming an increasingly active area of research. In this work, we numerically investigate the aerodynamic benefits of torsionally mounting five covert-inspired flaps on the upper surface of a NACA0012 airfoil. Two-dimensional high-fidelity simulations of the flow past the airfoil–flap system at low R e = 1000 and a high angle of attack of 20 were performed. A parametric study was conducted by varying the flap moment of inertia and torsional hinge stiffness to characterize the aerodynamic performance of this system. Lift improvements as high as 25 % were attained. Two regimes of flap dynamics were identified that provided considerable aerodynamic benefits. A detailed investigation of the flow physics of both these regimes was conducted to understand the physical mechanisms by which the passively deployed flaps augmented the lift of the airfoil. In both regimes, the flap was found to act as a barrier in preventing the upstream propagation of reverse flow due to flow separation and trailing edge vortex. The torsional spring and flap inertia yielded additional flap dynamics that further modulated the surrounding flow and associated performance metrics. We discuss some of these fluid–structure interaction effects in this article.

1. Introduction

It is becoming increasingly necessary for unmanned (UAVs) and micro aerial vehicles (MAVs) to be highly agile and maneuverable so that they can navigate more complex scenarios and remain operable in adverse weather conditions [1]. Large angles of attack at low Reynolds number ( R e ), where stall is a serious problem, are typically encountered while performing such maneuvers [2]. Stall is a phenomenon where flow separates over a large portion of the upper (suction) surface of the wing, resulting in a significant drop in aerodynamic lift. Therefore, there is a need for better flow control devices to mitigate the effects of stall at the large angles of attack typically encountered in extreme conditions.
One possible flow control solution for stalled configurations is inspired by a bird’s ability to remain airborne in the presence of highly unsteady flows. This functionality is due in part to the covert feathers along the surface of their wings, which passively deploy during high-angle-of-attack maneuvers such as landing, take-off, hovering and perching. Although birds have some degree of control over the deployment of covert feathers, studies have shown that this deployment is primarily a passive response to the surrounding unsteady flow and associated aerodynamic forces [3].
To enable the utility of covert-inspired design for flow control in UAVs and MAVs, many studies have modeled covert feathers as either a freely moving or rigidly attached flap on the upper surface of a wing. These studies have shown that, at large angles of attack, these flaps can significantly increase the lift on an airfoil [4,5], delay stall [6] and reduce the loss in lift post-stall [7]. These flaps have been found to restrict the upstream propagation of separated flow [8,9], thereby allowing for larger regions of attached flow on the upper surface of the wing [10]. This prevention of reverse flow also maintains a low-pressure region upstream of the flap, known as the ‘pressure dam’ effect [11].
Covert feathers can also be modeled as torsionally hinged flaps mounted on the upper surface of the airfoil with a torsional spring. This model is more emblematic of non-freely-moving covert feathers naturally appearing on birds. Furthermore, from the point of view of a covert-inspired flow control device, a torsionally hinged flap provides a more expansive parametric space involving hinge stiffness and inertia of the flap to be explored for fine-tuning the flap dynamics and extracting better aerodynamic performance. For instance, the hinge stiffness was found to modify the mean flap deflection, which dictated the presence of certain lift-conducive flow regimes, while flap inertia had a secondary effect on lift by altering the amplitude of flap oscillations [12]. In another study, resonance in the flap oscillations was argued to increase lift by enhancing the strength of the leading-edge vortex while decreasing the strength of the trailing-edge vortex [13].
Finally, we note that the aerodynamic benefits found for a single flap leave the question as to how the response would change for a system of multiple flaps deployed simultaneously. While studies have considered multiple rows of flexible ’hairy’ flaps for lift improvement [14], a comprehensive study of an airfoil–flap system with multiple passively deployable, torsionally hinged, rigid flaps has not been performed in the literature.
In this work, we numerically study the performance characteristics of a covert-inspired passive flow control technique involving a system of five torsionally hinged flaps mounted on the upper surface of a NACA0012 airfoil at low R e = 1000 and a post-stall angle of attack of 20 . Two-dimensional (2D) numerical simulations are performed using a strongly coupled fluid–structure interaction algorithm in an immersed boundary framework. A systematic parametric study by varying the stiffness of the hinge and moment of inertia of the flaps is performed to identify performance-enhancing parametric regimes. The physical mechanisms by which the flap dynamics and associated fluid–structure interactions occur are analyzed.
The results indicate that lift is significantly improved by up to 25 % , thereby demonstrating the utility of passively deployable flaps for lift enhancement. These improvements corresponded to two behavioral regimes where (i) only a single flap located at a 65 % chord from the leading edge was deployed and (ii) two flaps positioned at 20 % and 65 % were deployed. The second case produced slightly smaller improvements than the first. A ‘pressure dam’ effect was found to be the dominant mechanism responsible for providing these lift benefits. Lower mass flaps were more beneficial for performance in the first regime, while, in the second regime, larger mass flaps provided more lift. The lift improvements provided by the multi-flap–airfoil system indicate the potential utility of the simple passive control device for increased agility and maneuverability in small-scale MAVs.

2. Problem Setup

In this study, we consider a stationary NACA0012 airfoil fixed at an angle of attack of α = 20 and the Reynolds number based on airfoil chord is set to R e = 1000 . This Reynolds number is emblematic of the small-scale micro aerial vehicles of interest, typically of O ( 1   cm ) chord length and O ( 1   m / s ) speed. For this airfoil and R e , the mean C l vs. α is plotted in Figure 1. The gray shaded region denotes the amplitude of fluctuations in C l about the mean originating due to flow separation and vortex shedding. It can be observed that although the lift continues to increase as the angle of attack is increased, fluctuations in C l begin at α = 10 , implying the initiation of flow separation. Significant fluctuations are present at α = 20 , the angle of attack considered in this work, implying massive flow separation on the entire upper surface of the airfoil and vortex shedding from both the leading and trailing edges. Therefore, α = 20 corresponds to a post-stall angle of attack.
Typically, the choice of the airfoil is governed by the need to delay the location of flow separation, transition from laminar to turbulent flow and achieve desirable boundary layer characteristics [15]. The airfoil choice also modifies the effectiveness of covert-inspired flaps. For instance, on soft stall airfoils such as E387(A), the flaps were found to delay stall, while, on sharp stall airfoils such as NACA2414, the drop in lift post-stall was mitigated without delaying the stall angle of attack [7]. The present study is less sensitive to a particular choice of airfoil since it focuses on lift enhancement at a post-stall angle of attack of 20 , where significant flow separation already occurs over the entire suction surface of the airfoil. Therefore, we choose the canonical NACA0012 airfoil, which has also been widely considered in several studies involving covert-inspired passive flow control techniques [4,5], including at a low Reynolds number of R e = 1000 [16].
The airfoil is modeled with five torsional flaps of length 0.15 c , where c is the chord length of the airfoil. The flaps are positioned at 0.2 c , 0.35 c , 0.5 c , 0.65 c and 0.8 c along the upper surface of the airfoil, as shown in Figure 2. All five flaps are deployed simultaneously at an initial angle of 5 relative to the surface of the airfoil. This configuration allows the flaps to avoid potential collisions with the airfoil surface during their passive deployment to a given deflection angle, β .
The flaps are assigned a stiffness, k β , and a moment of inertia, i β , defined by the following non-dimensional expressions. Here, we also define the chord Reynolds number, R e , and the chord-wise distance from the leading edge, l β .
i β = I β ρ f c 4 , k β = K β ρ f U 2 c 2 , R e = U c ν , l β = L β c
In this article, ρ f is the density of the surrounding fluid, U is the freestream velocity, and ν is the kinematic viscosity. We also have K β , I β and L β , the dimensional counterparts of k β , i β and l β . To restrict the parameter space and facilitate a natural comparison across the different simulations, all five flaps are assigned the same stiffness and inertia values for each simulation. For this investigation, we vary inertia as { 10 5 , 10 4 , 10 3 } while stiffness is non-uniformly varied in the range [ 10 4 , 10 1 ] .

3. Numerical Methodology

The numerical investigation is performed with the immersed boundary method described in Goza and Colonius [17], using a parallel implementation and formulation of the structural dynamics that allows for torsionally mounted flaps [18]. The software numerically solves the following set of governing equations:
u t + u · u = p + 1 R e 2 u + Γ f ( χ ( s , t ) ) δ ( χ ( s , t ) x ) d s ,
· u = 0
i β 2 β t 2 + k β β = Γ f ( χ f χ f 0 ) × f ( χ f ) d χ f ,
Ω u ( x ) δ ( x χ a ) d x = 0 ,
Ω u ( x ) δ ( x χ f ) d x = β t e ^ i × ( χ f χ f 0 ) .
In the immersed boundary method, two separate grids are used for the spatial discretization of the fluid and body. Accordingly, this method makes use of two coordinate systems, a Lagrangian system for the body surfaces of the airfoil and flaps, Γ , and a Eulerian system for the fluid domain, Ω . The body points in Γ are denoted by the variable χ , and s is used to parameterize along surfaces. The fluid coordinates in Ω are denoted with x . The position variables χ , x and s are all nondimensional with respect to the chord length. Other important variables include the nondimensional velocity, u , with respect to U ; the nondimensional time, t, with respect to c / U ; and the nondimensional pressure, p, with respect to ρ f U 2 .
Equations (2) and (3) are the Navier–Stokes and continuity equations, respectively, which have been spatially discretized using a standard second-order central finite difference method (to facilitate solutions with a fast Fourier transform, the far-field conditions are treated by a multi-domain approach, in which the total domain is split into several sub-domains of increasing coarseness for cells further from the airfoil body [19]). For the time discretization, an Adams–Bashforth scheme is used for the nonlinear term and a trapezoid scheme is used for the diffusive term. Equation (4) is Newton’s second law applied to the torsional motion of each flap, with Γ f and χ f respectively representing the surface and coordinates specific to the flap. The right-hand side of the equation is the moment about the hinge at χ f 0 , caused by the surface stress exerted on the flap by the surrounding fluid. This equation is temporally discretized using an implicit Newmark scheme. Equations (5) and (6) respectively define the no-slip boundary conditions for the airfoil and individual flaps, which are important for solving the surface stress term f ( χ ) . In these equations, χ a is the coordinate for the airfoil and e ^ i is the unit vector describing the direction of angular velocity for each flap. The full discrete (nonlinear algebraic) system of equations is solved by performing a block-LU decomposition and iterating on the fluid–structure interaction quantities with Newton’s method until convergence [17]. For completeness, the fully discretized and block-LU factorized equations are provided in Appendix A.
In this study, we use a grid spacing of Δ x / c = 0.00349 , which is chosen so that the immersed boundary spacing is twice the spacing of the finest flow grid. This setup has been verified with a grid convergence study described in Nair and Goza [18]. The authors validate the torsional flap solver more broadly in the same study. The time step is Δ t / ( c / U ) = 0.0004375 and the convergence tolerance for the deflection angle is Δ β 10 7 .

4. Results

4.1. Qualitative Flow Features

We begin with an overview of the flow features for a representative case of flaps with a moment of inertia of i β = 0.001 and hinge stiffness of k β = 0.001 . The flap dynamics and airfoil lift are plotted in 
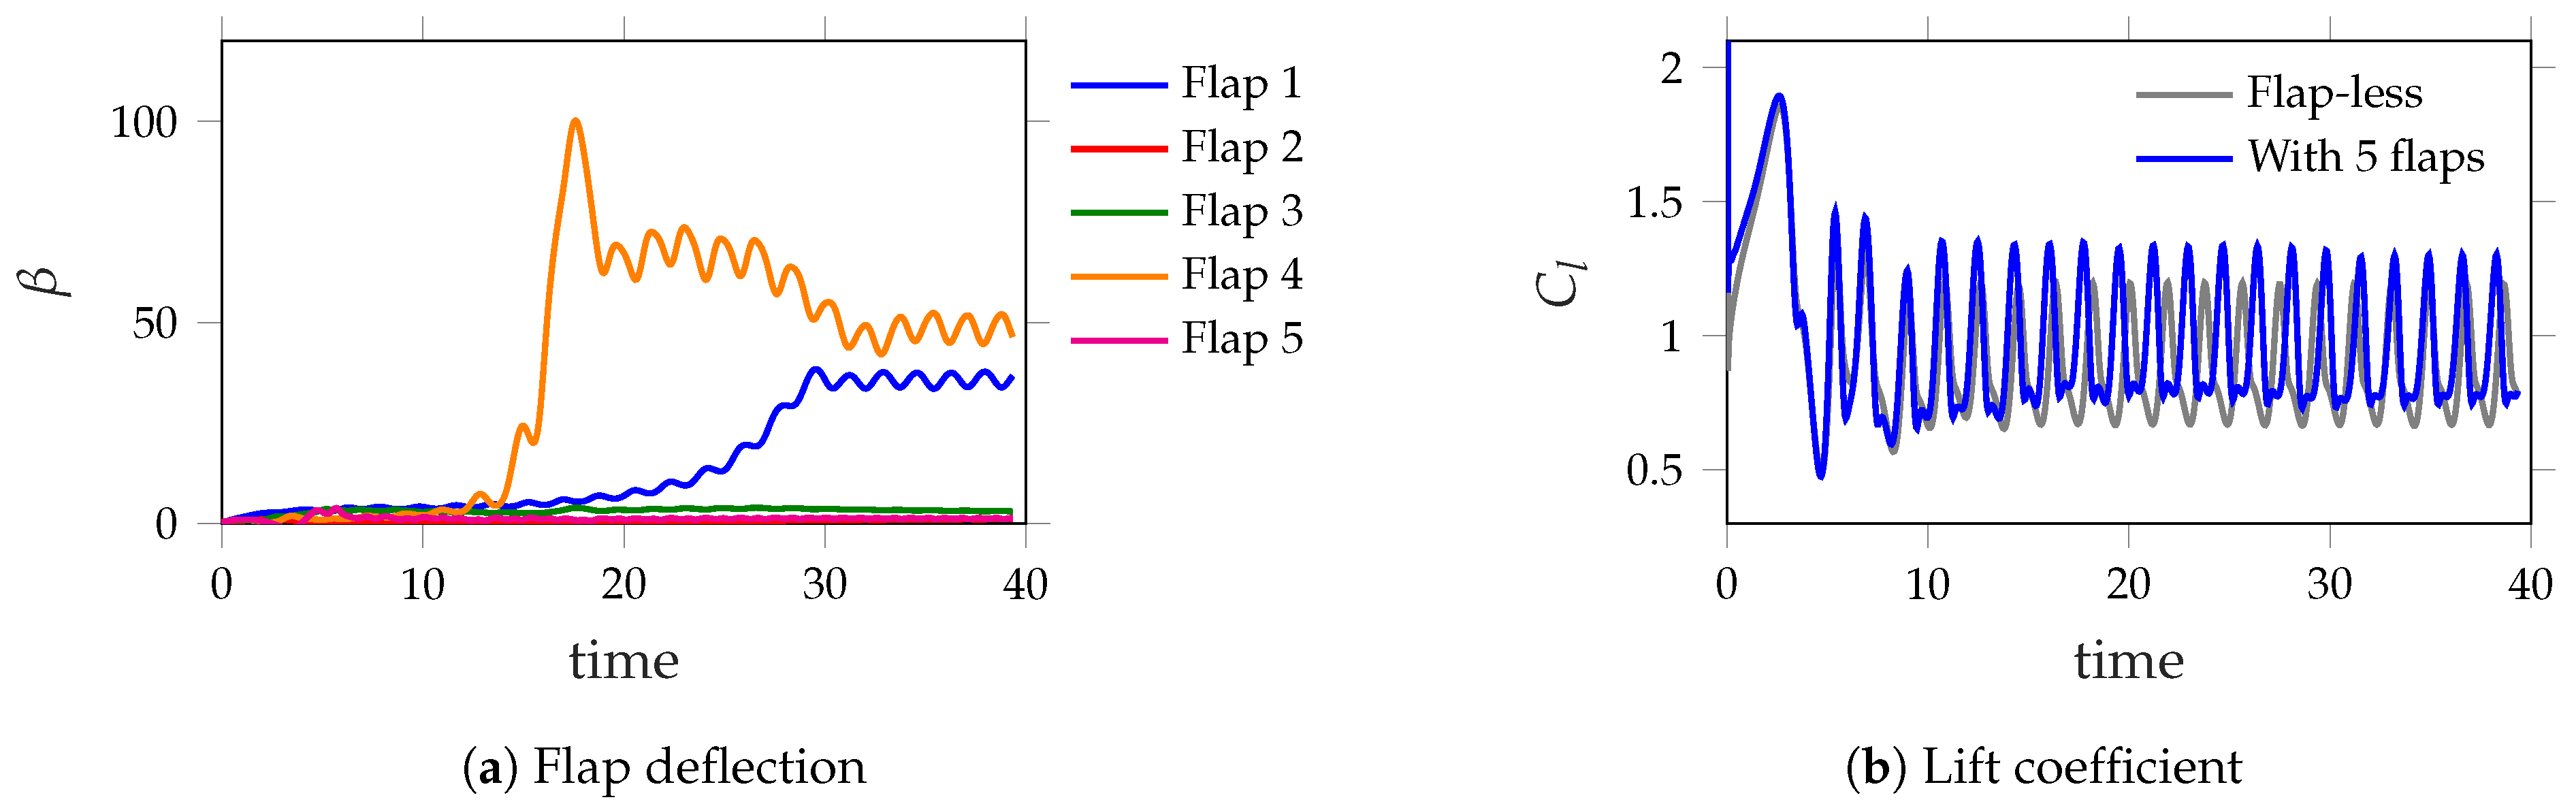
Figure 3. From the flap deflection plots in Figure 3a, we can see that, initially at t = 0 , all the flaps have near-zero deflection, i.e., they are rested near the airfoil surface. As flow separation and vortex shedding occur at the post-stall angle of attack of 20 , the flaps passively deploy into the flow. For the particular combination of i β = 0.001 , k β = 0.001 , the first and fourth flaps are significantly deployed, while the other flaps remain largely unaffected. The initial transients in the flap and lift dynamics progress onto limit cycle oscillations (LCO) after approximately t > 30 
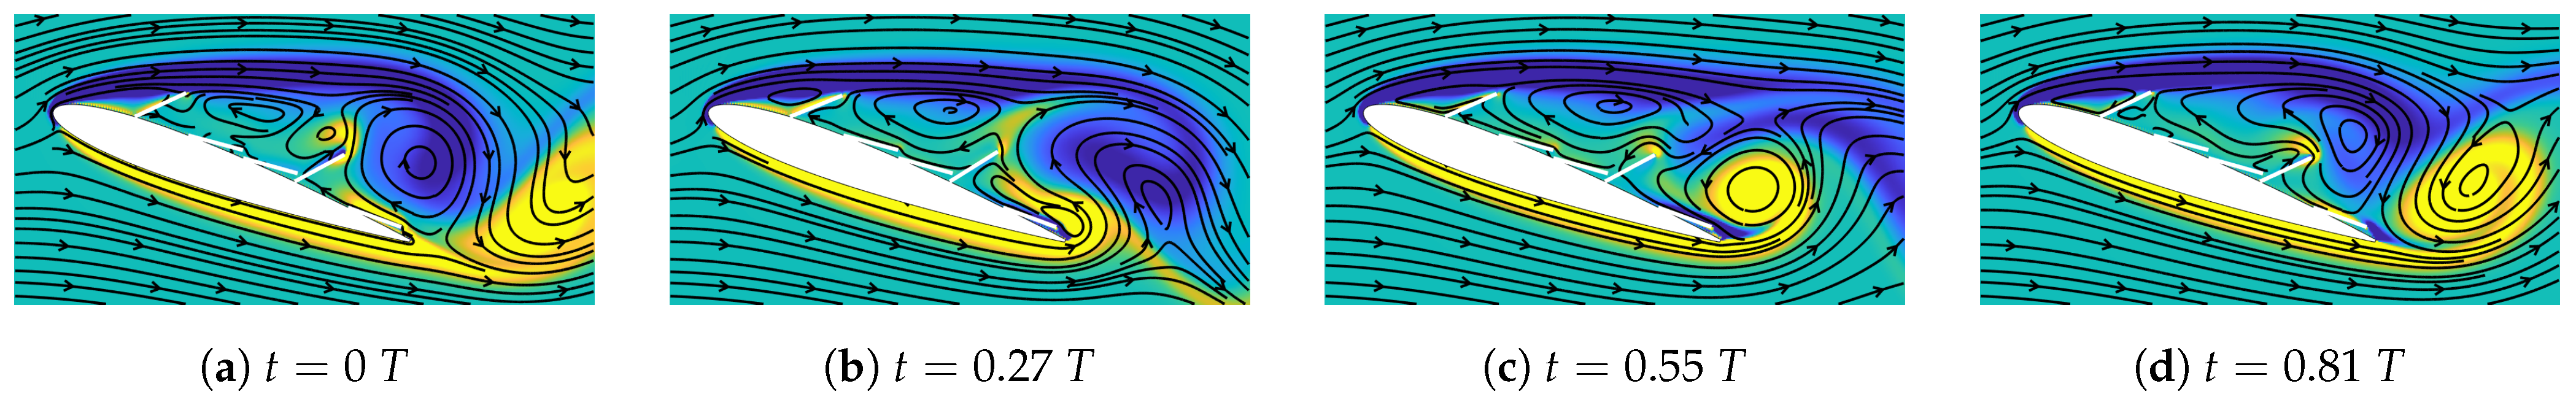
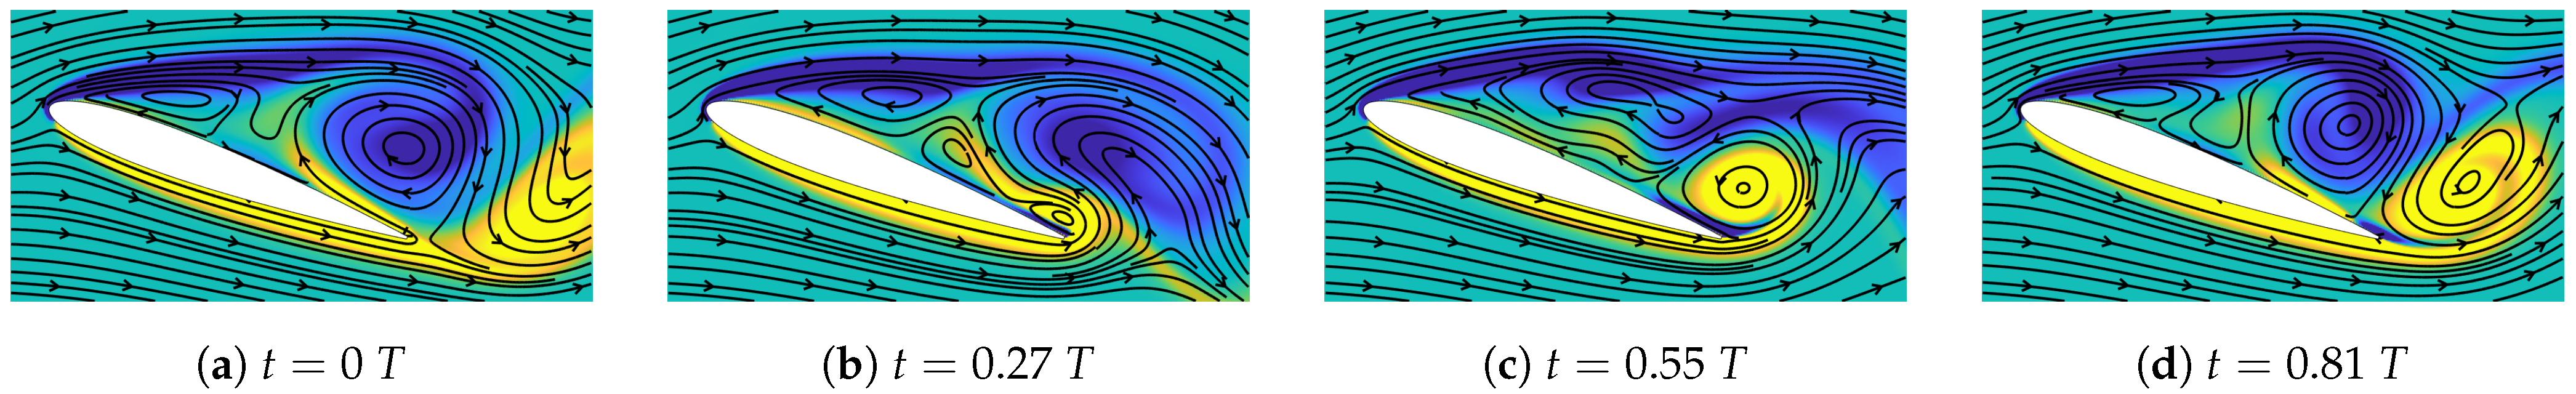
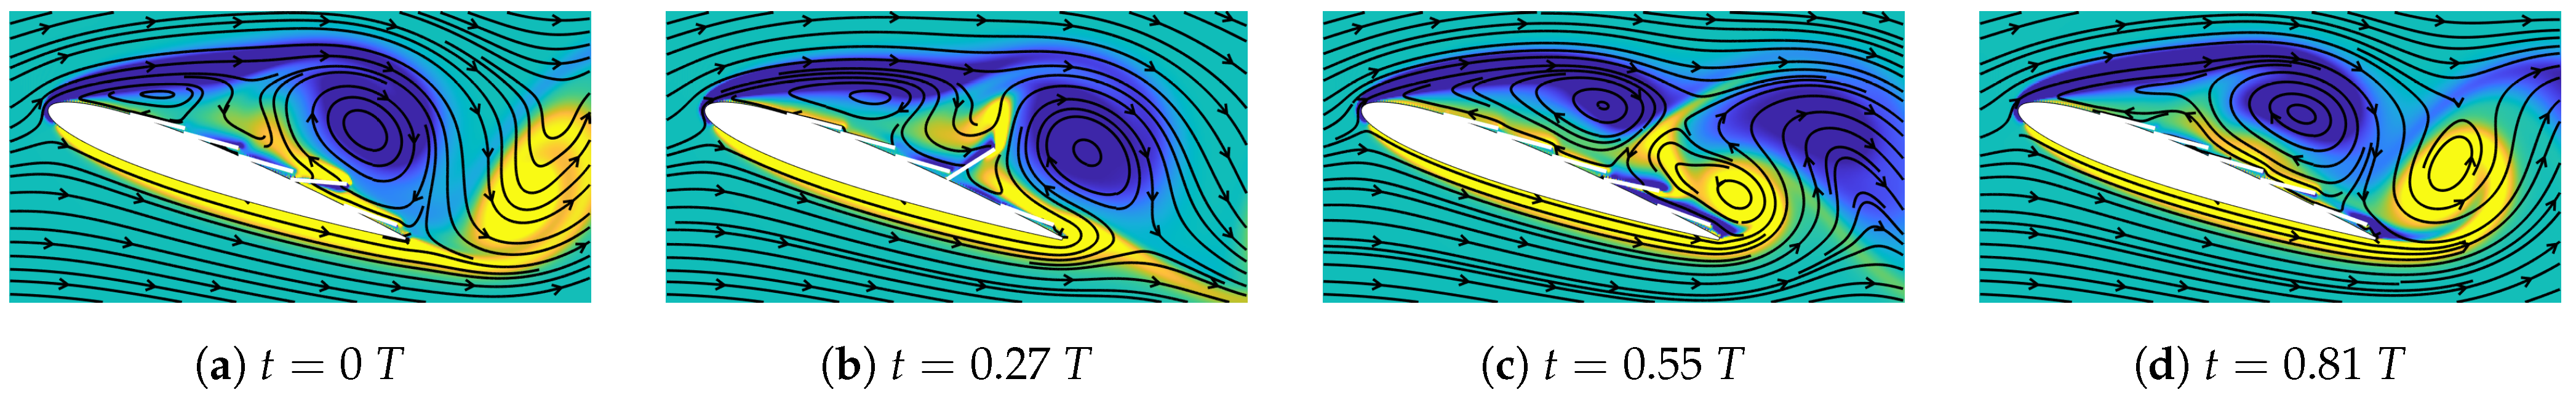
. These oscillations are the result of periodic vortex shedding at the leading and trailing edges of the airfoil. This periodic vortex shedding can be visualized via the vorticity contours plotted in one time period of the lift cycle in the LCO regime; see Figure 4. Here, a lift cycle is defined between two consecutive peaks of C l with time period T 1.86 . The periodic formation, shedding and interaction of the leading- and trailing-edge vortices (LEV and TEV, respectively) can be clearly observed from these plots.
Similar vortex shedding is observed for the flap-less airfoil case, whose lift dynamics and vorticity contours are plotted in Figure 3b and Figure 5, respectively. From Figure 3b, we observe that the mean lift improvement of the airfoil with torsionally mounted flaps is approximately 8 % as compared to the baseline flap-less airfoil. In the following sections, we report the results of a parametric study of the airfoil–flap system and identify key physical mechanisms that yield significant lift improvements.

4.2. Performance Maps and Connections to Flap Dynamics

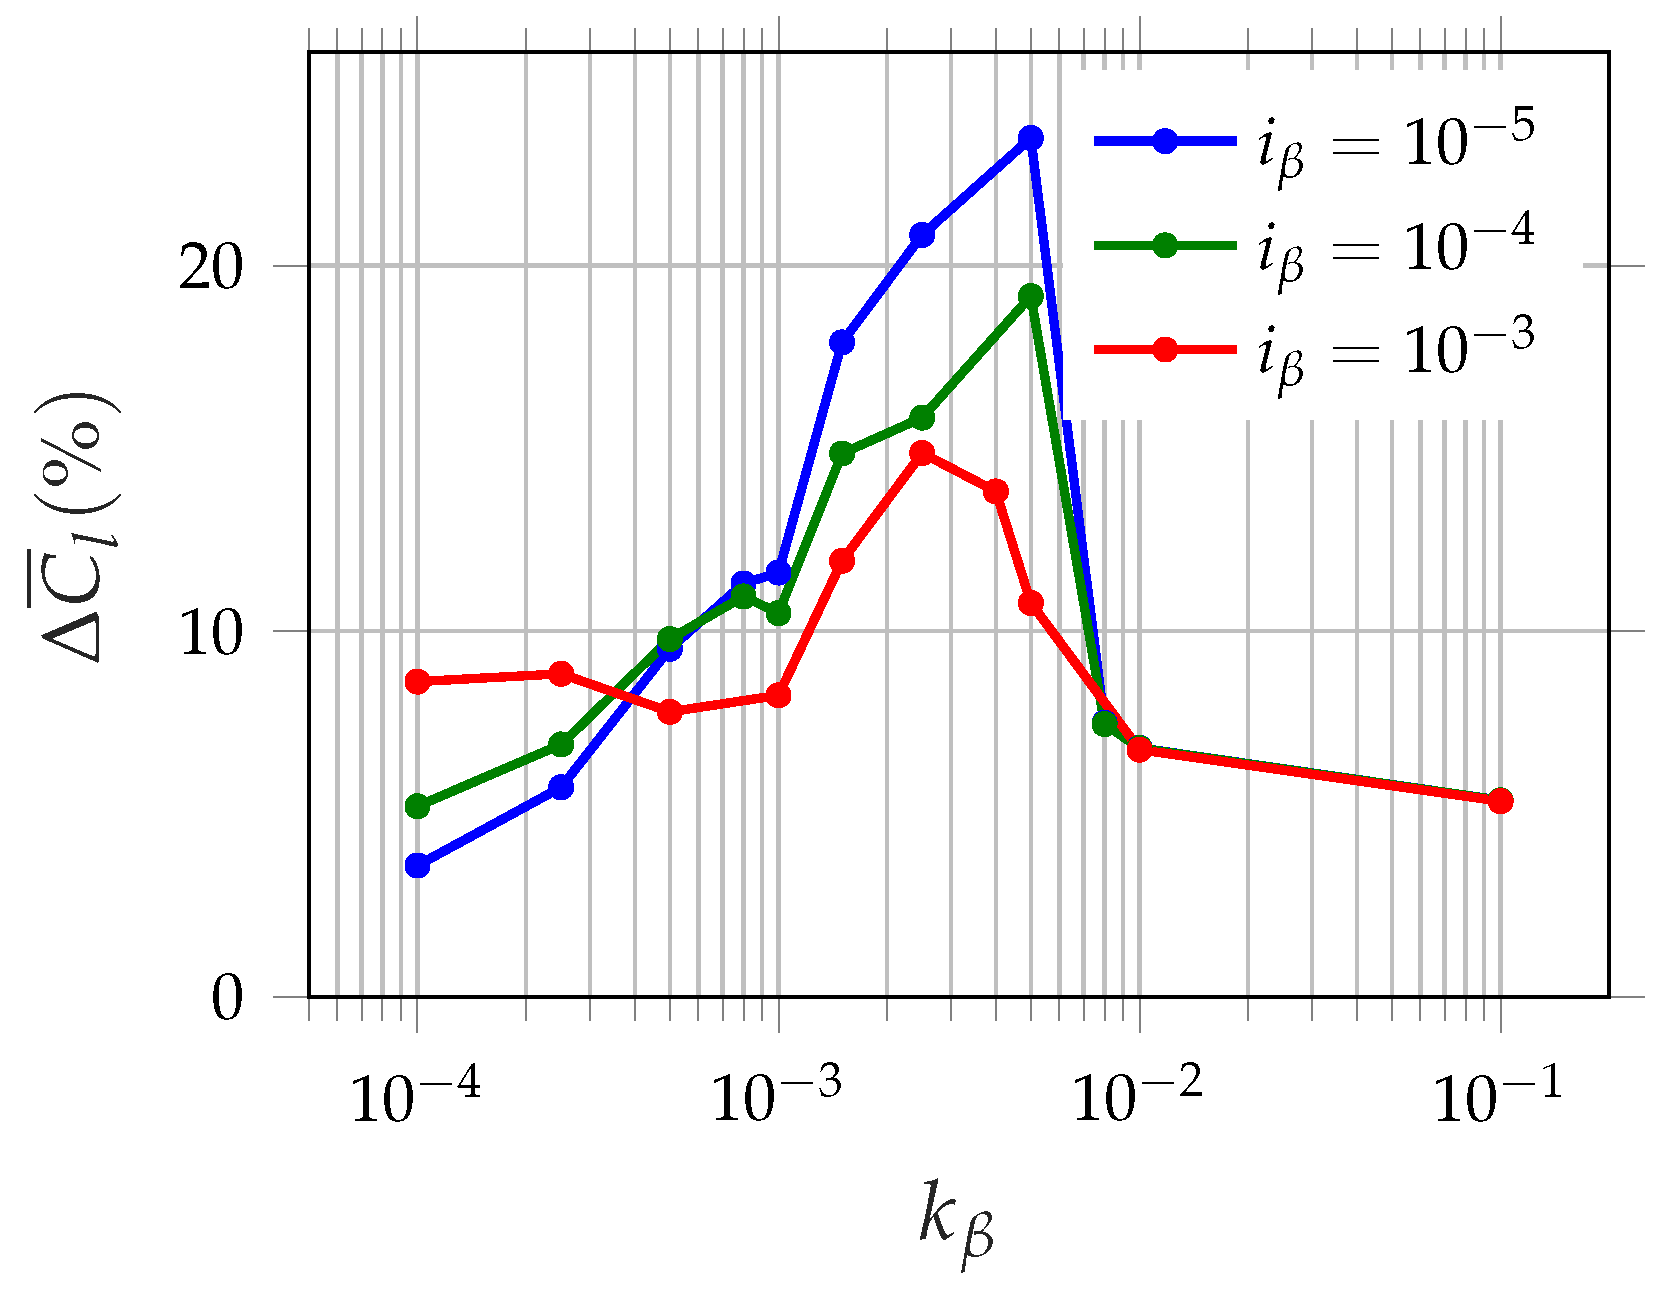
A parametric study is performed to characterize the effects of flap inertia and hinge stiffness on the lift improvements of the airfoil. In Figure 6, we show Δ C ¯ l (lift improvement relative to the flap-less case, in percentage) against k β for various i β . It can be observed that significant lift improvements, up to 25 % , can be achieved owing to the passively deployable flaps. The optimal performance is obtained for the lowest inertia case of i β = 10 5 and stiffness of k β = 0.005 . For a higher inertia of i β = 10 3 , the peak performance is achieved at a similar stiffness of k β = 0.0025 . For all inertia values considered, as the stiffness is increased beyond k β 0.01 , all cases have identical performance. On the other hand, for very low stiffness tending towards k β = 0.0001 , the lift of the airfoil mounted with the lowest-inertia flaps deteriorates, while that with larger-inertia flaps hovers around 8 % .
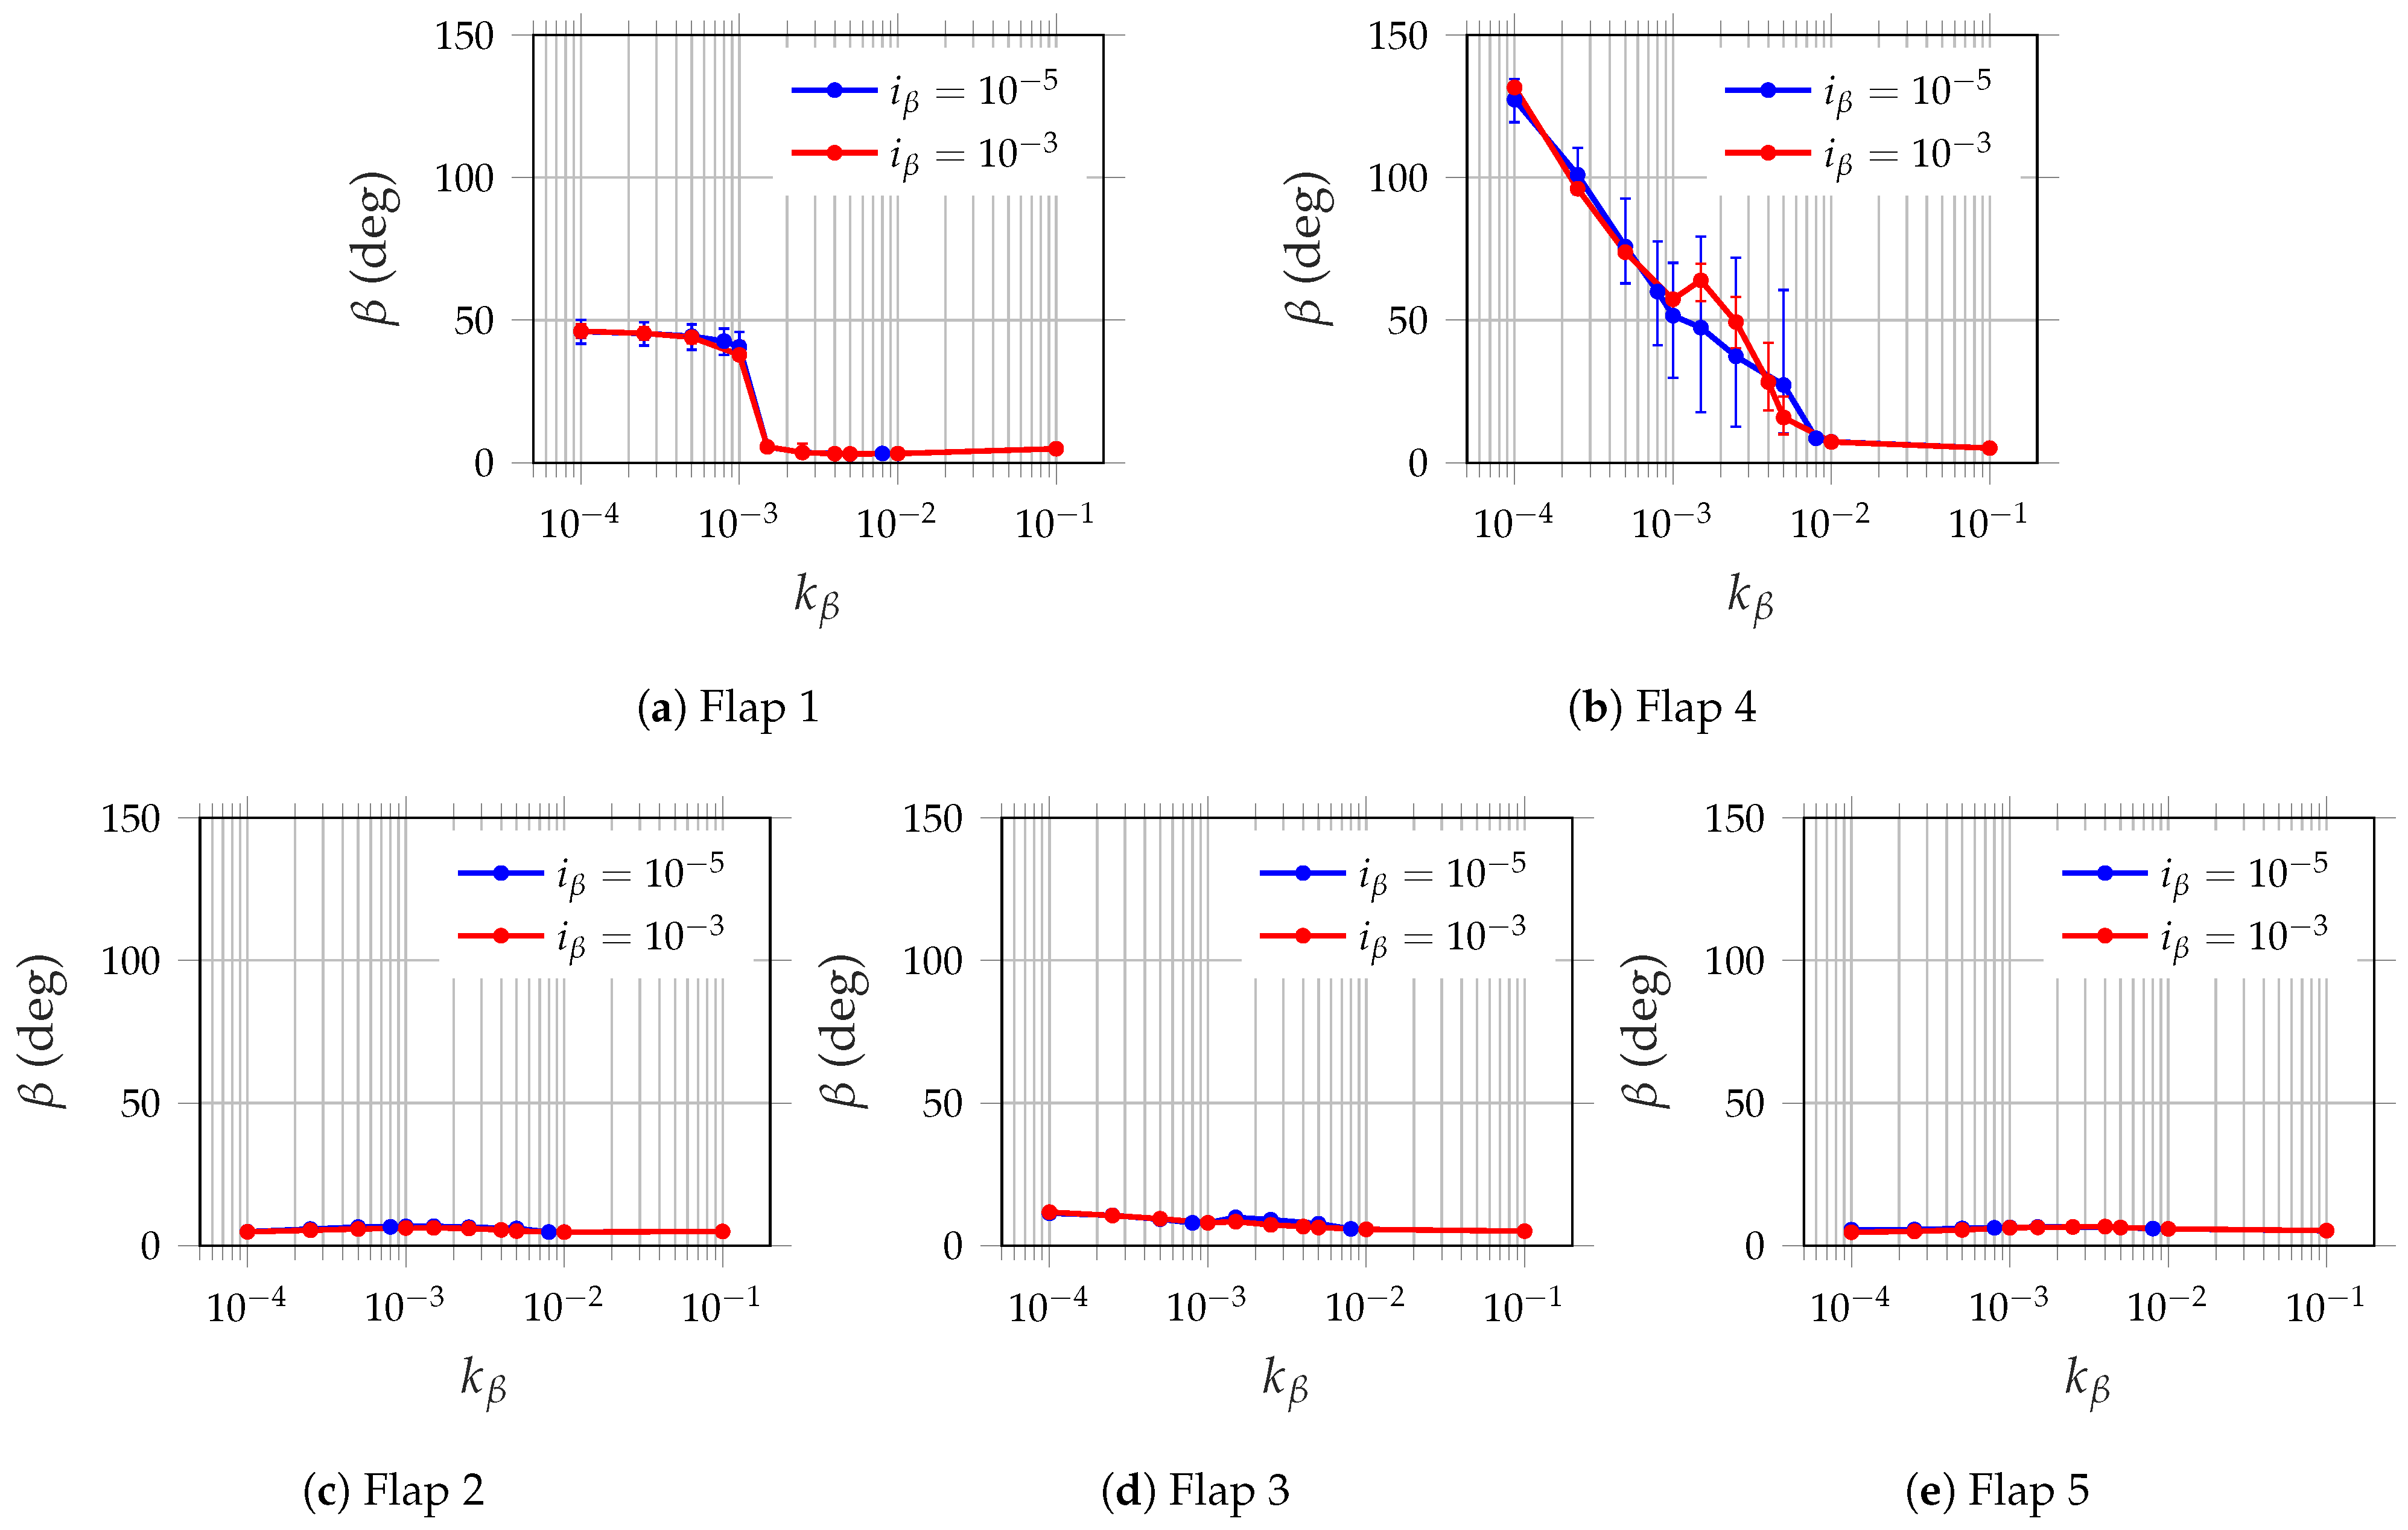
To analyze in detail the effect of flap dynamics on the aerodynamic performance, the mean flap deflections of the five flaps for the various cases of stiffness and inertia are plotted in Figure 7. In this plot, the bars superimposed over the mean deflection markers denote the amplitude of flap oscillations about the mean. It can be observed that for the wide range of stiffness and inertia considered, only flaps 1 and 4 are significantly deployed. Since only flaps 1 and 4 are significantly deployed, hereafter, we only discuss the nature of the flap dynamics and associated effects on the flow physics of these two flaps.
We investigate the role of stiffness and inertia in governing the flap dynamics. From Figure 7a,b, it can be observed that the mean flap deflections of flaps 1 and 4 decrease monotonically with increasing stiffness due to the increasing restoring forces of the torsional spring for all inertia. Furthermore, the mean deflection for a given stiffness is approximately the same across inertia. These similarities in mean deflection indicate that the stiffness determines the mean flap configuration, largely independent of inertia. On the other hand, inertia alters the flap amplitude about the mean, where the lower-inertia flaps undergo large amplitude oscillations, while the larger-inertia flaps have reduced amplitude. These variations in amplitude are more discernible around k β = 0.0025 in the mean deflection plot of flap 4 in Figure 7b. The distinction of the roles of stiffness and inertia in setting the mean flap deflection and amplitude is crucial in analyzing the interaction of the flaps with the flow structures and the associated benefits in aerodynamic performance.
These flap deployment figures provide a means to identify certain flap dynamics (governed by stiffness and inertia) that are beneficial for aerodynamic lift. While the decrease in mean deflection with increasing stiffness is smooth for flap 4, as seen from Figure 7b, a sharp drop in the mean deflection of flap 1 is observed at k β = 0.001 in Figure 7a. To the left of the drop for k β 0.001 , the deflection of flap 1 is approximately constant around 45 . On the other hand, flap 1 is largely undeployed for k β > 0.001 . Now, we note from Figure 6 that a huge boost in lift and peak performance around k β = 0.0025–0.005 is achieved in this stiffness range of k β > 0.001 , where only flap 4 is deployed for all inertia. This shows that a single flap located at 0.65 c with an appropriate choice of stiffness is more beneficial than multiple flaps.
For the larger-inertia flap of i β = 10 3 in the stiffness range of k β 0.001 , where both flaps 1 and 4 are deployed, modest but non-negligible lift improvements of up to 8 % are achieved, as noted from Figure 6. Here, Δ C ¯ l remains approximately constant, with a small peak in performance at k β = 0.00025 , i β = 10 3 . On the other hand, the lower-inertia cases have monotonically decreasing lift with decreasing stiffness in the range of k β 0.001 , where both flaps 1 and 4 are deployed. This demonstrates that for very low stiffness, considerable lift improvements due to the deployment of multiple flaps can be still achieved provided that the flap inertia is relatively large. This result is significant despite the sub-optimal Δ C ¯ l , since many studies involving covert feathers consider a zero-stiffness hinge. Finally, beyond k β 0.01 , since the flap deflections of all flaps are minimal, lift improvements are not substantial.
To summarize the above discussion, we have identified two performance-conducive flap behavioral regimes: (i) only flap 4 deployed at k β > 0.001 and (ii) flaps 1 and 4 deployed at k β 0.001 . In the following sections, we will analyze the fluid–structure mechanisms that yield performance benefits in both these regimes.

4.3. Flow Physics of the Airfoil–Flap System with Dynamics Dominated by Flap 4

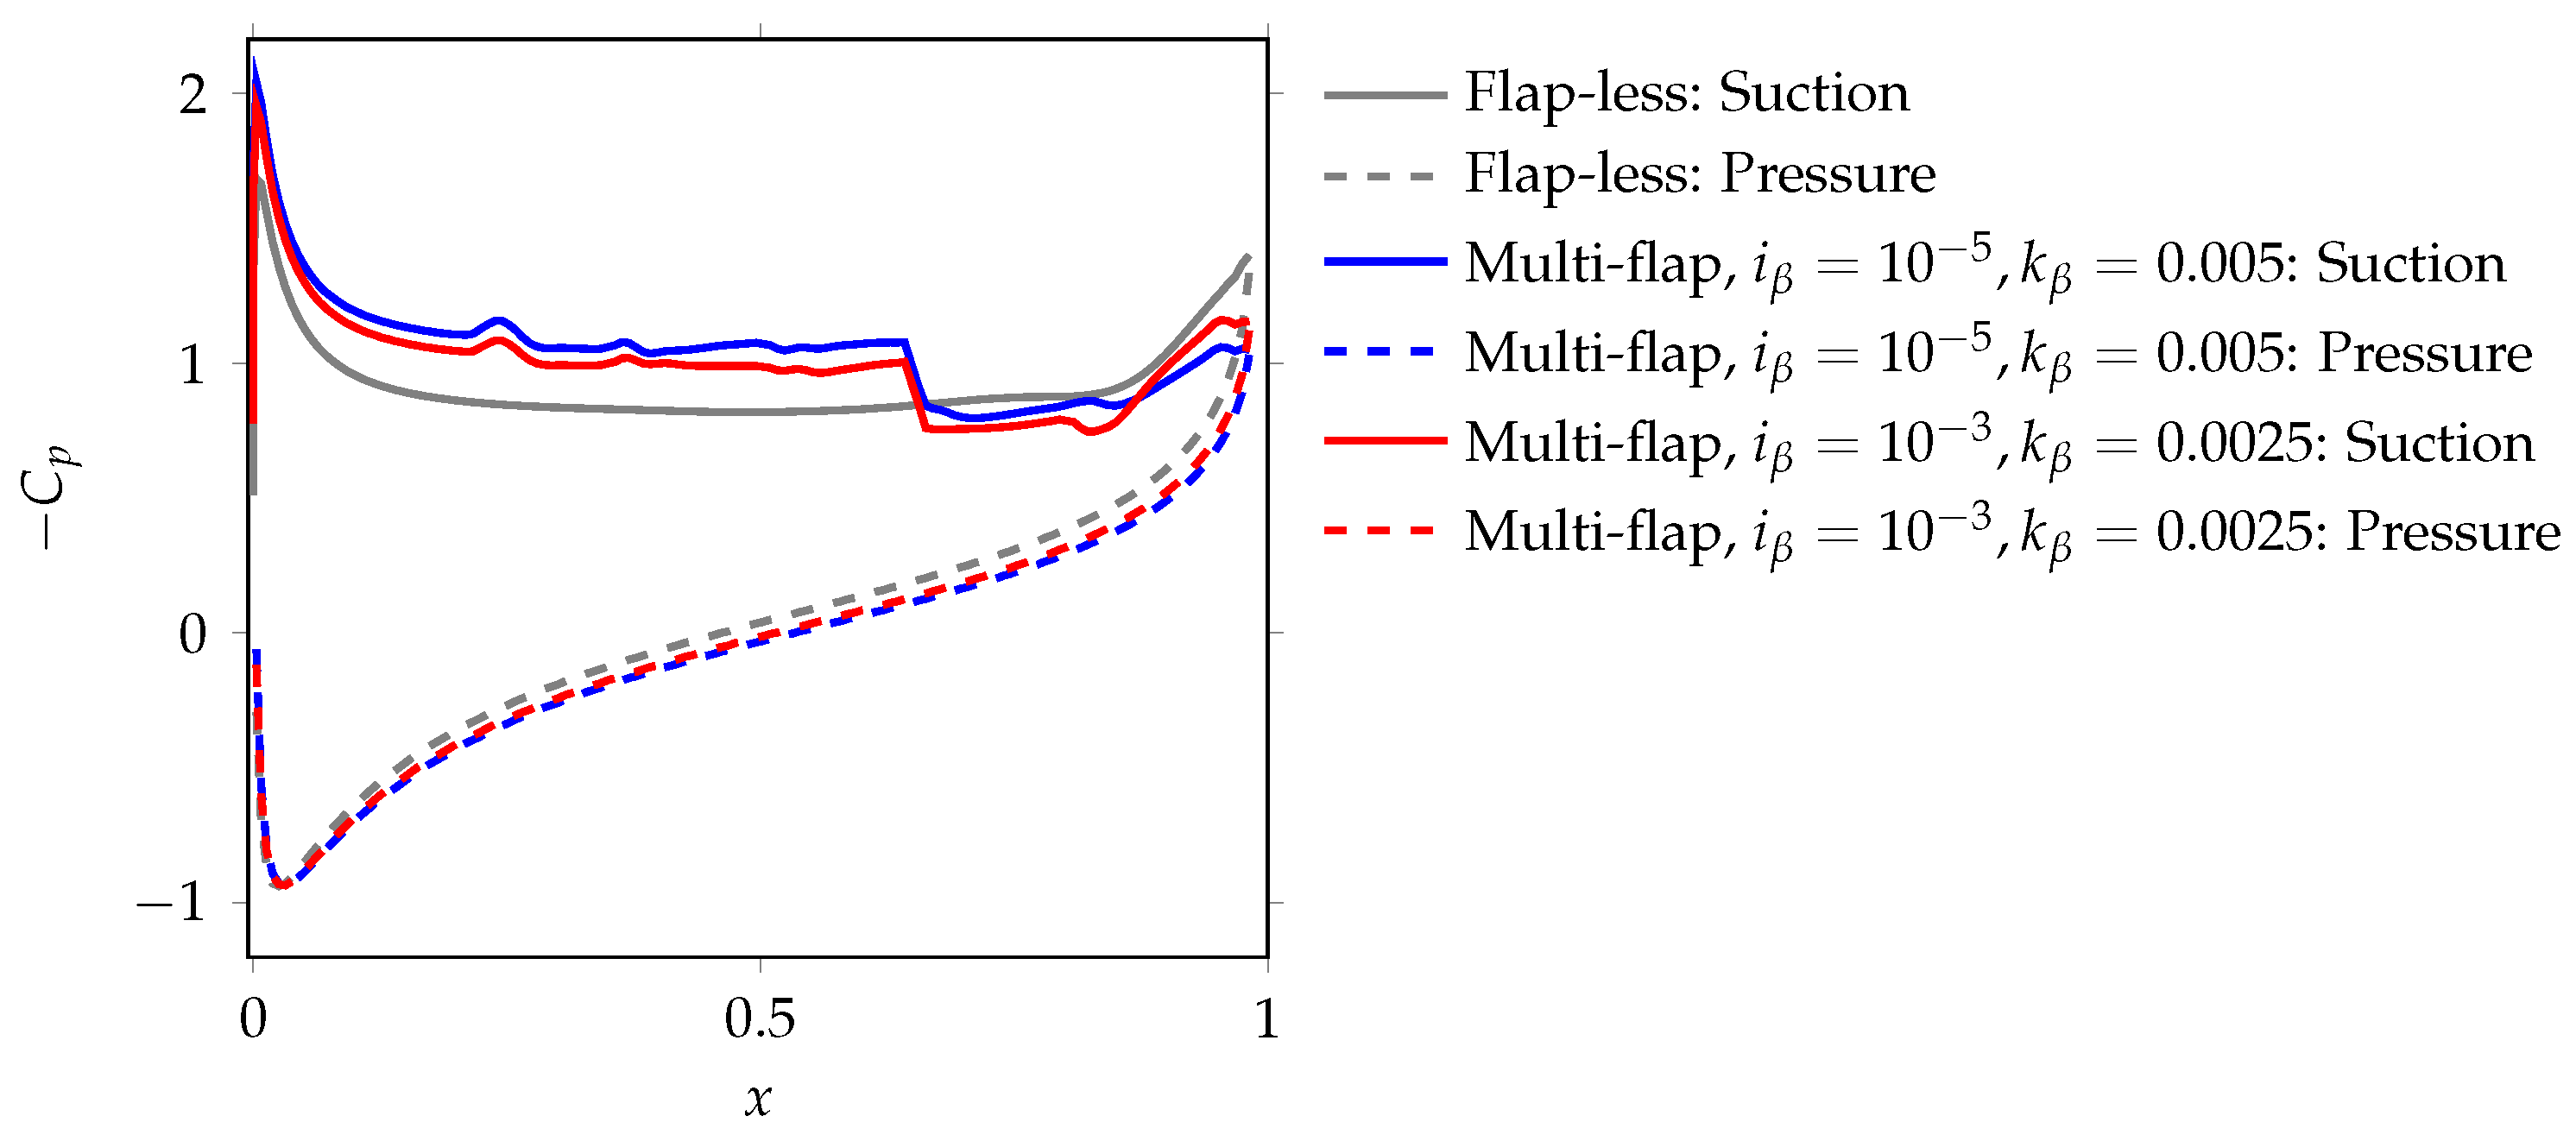
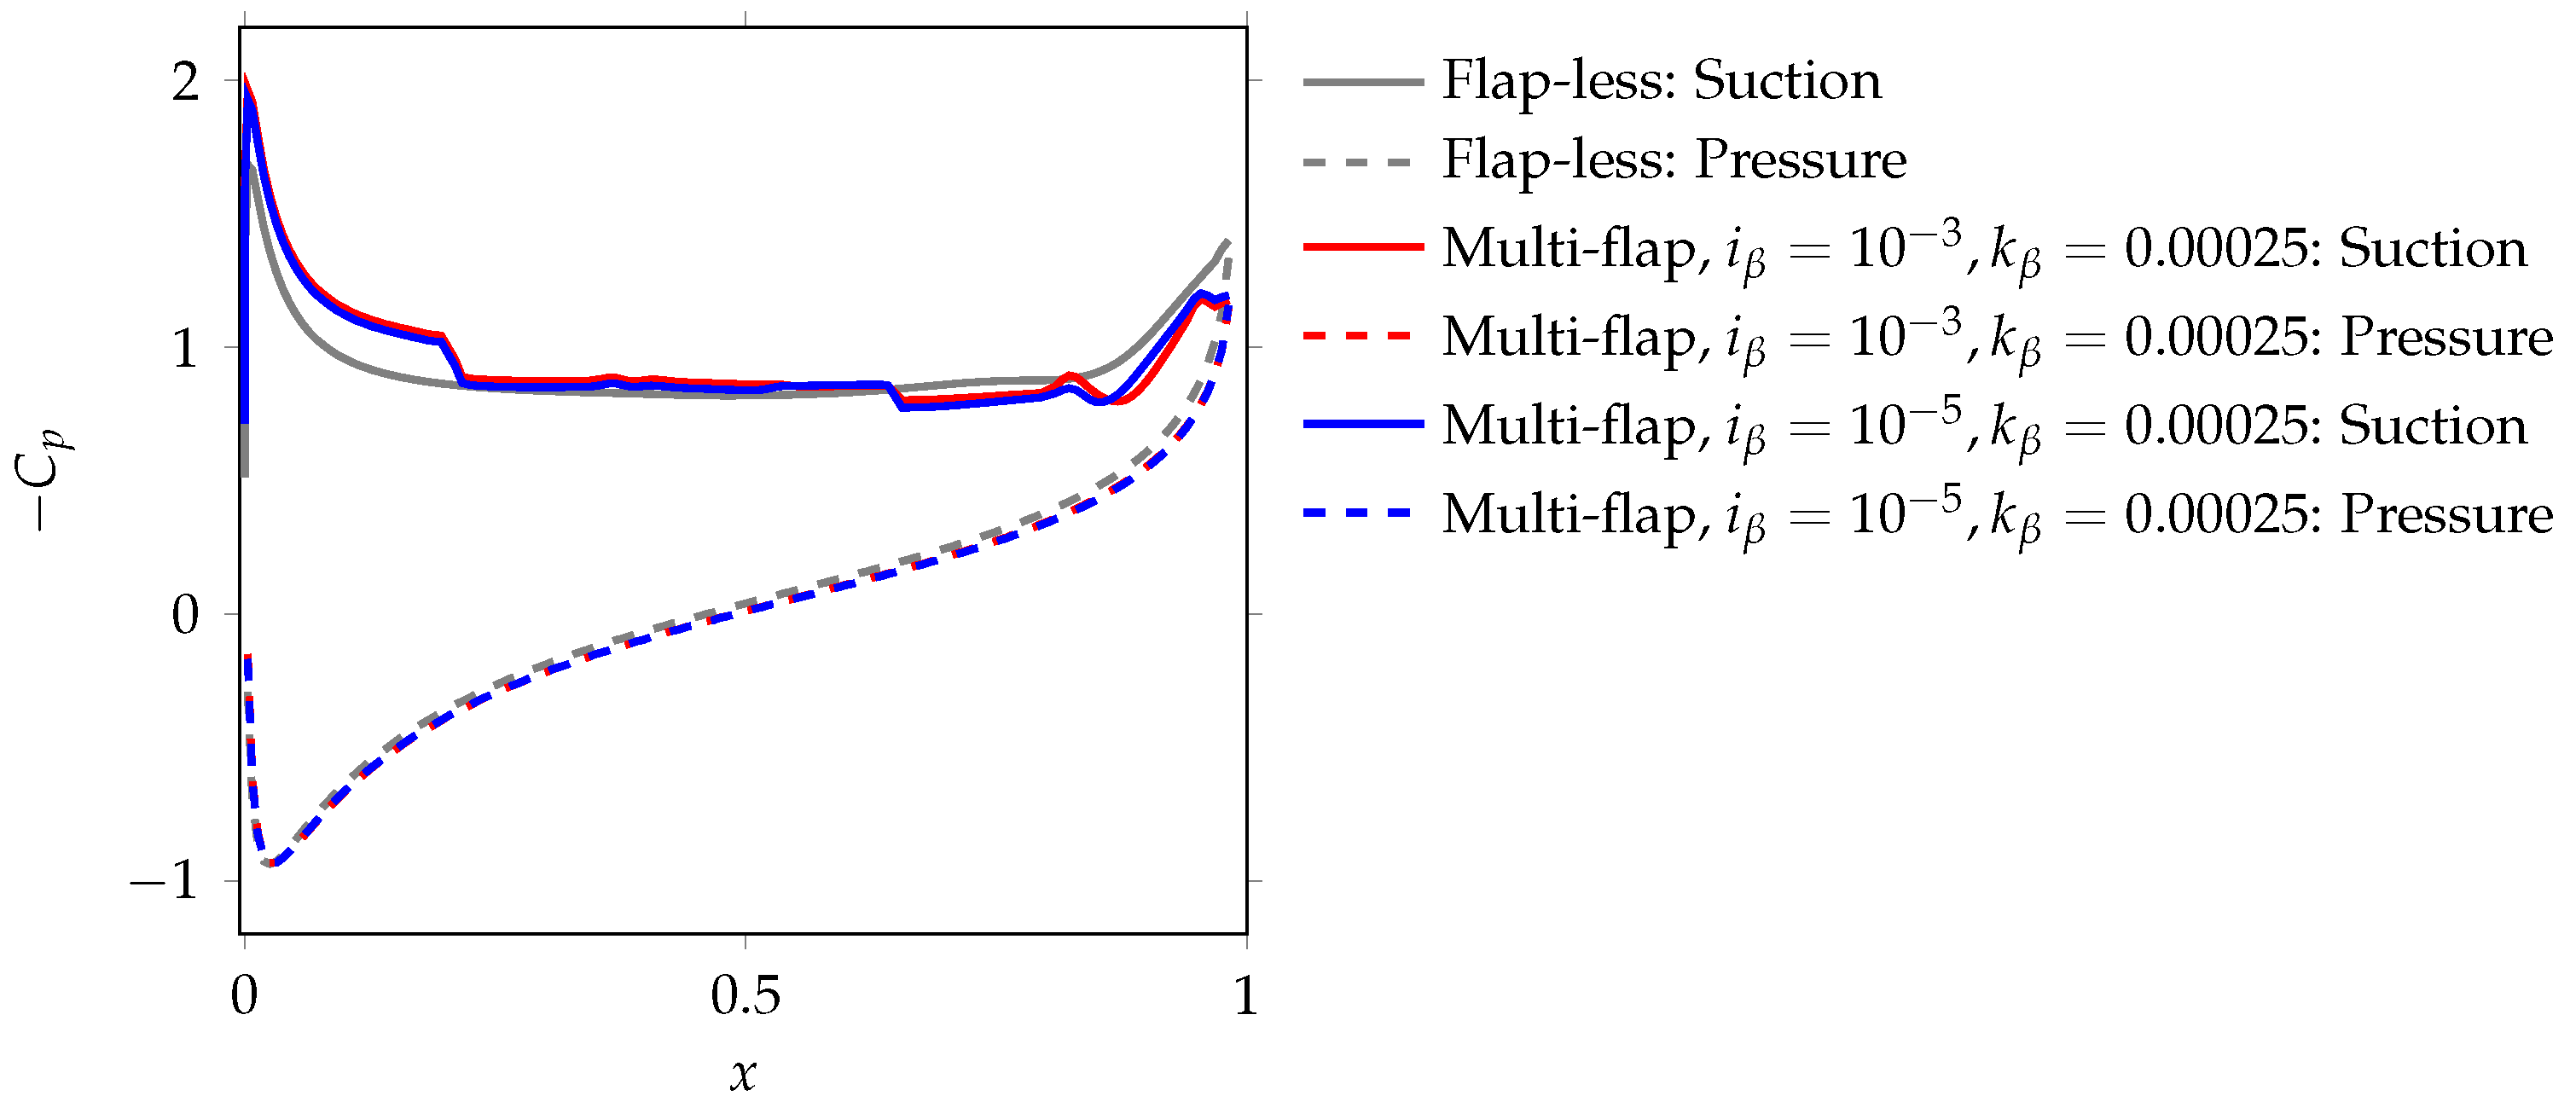
To identify the physical flow mechanisms that enhance lift when the flap 4 dynamics are the most prominent, we plotted the mean C p distribution on the airfoil surface for the highest mean lift case of i β = 10 5 and k β = 0.005 , as shown in Figure 8. For reference, we also plotted the mean C p distribution for the baseline airfoil case, shown in the same figure. A step discontinuity in the suction surface C p at the location of the hinge of the fourth flap at 0.65 c is observed. (Small C p perturbations are also observed at other flap hinge locations). Upstream of this discontinuity, a lower-pressure region as compared to the baseline case is formed. This phenomenon is referred to as the pressure dam effect since the flap acts as a barrier in maintaining a large suction region upstream of the flap.
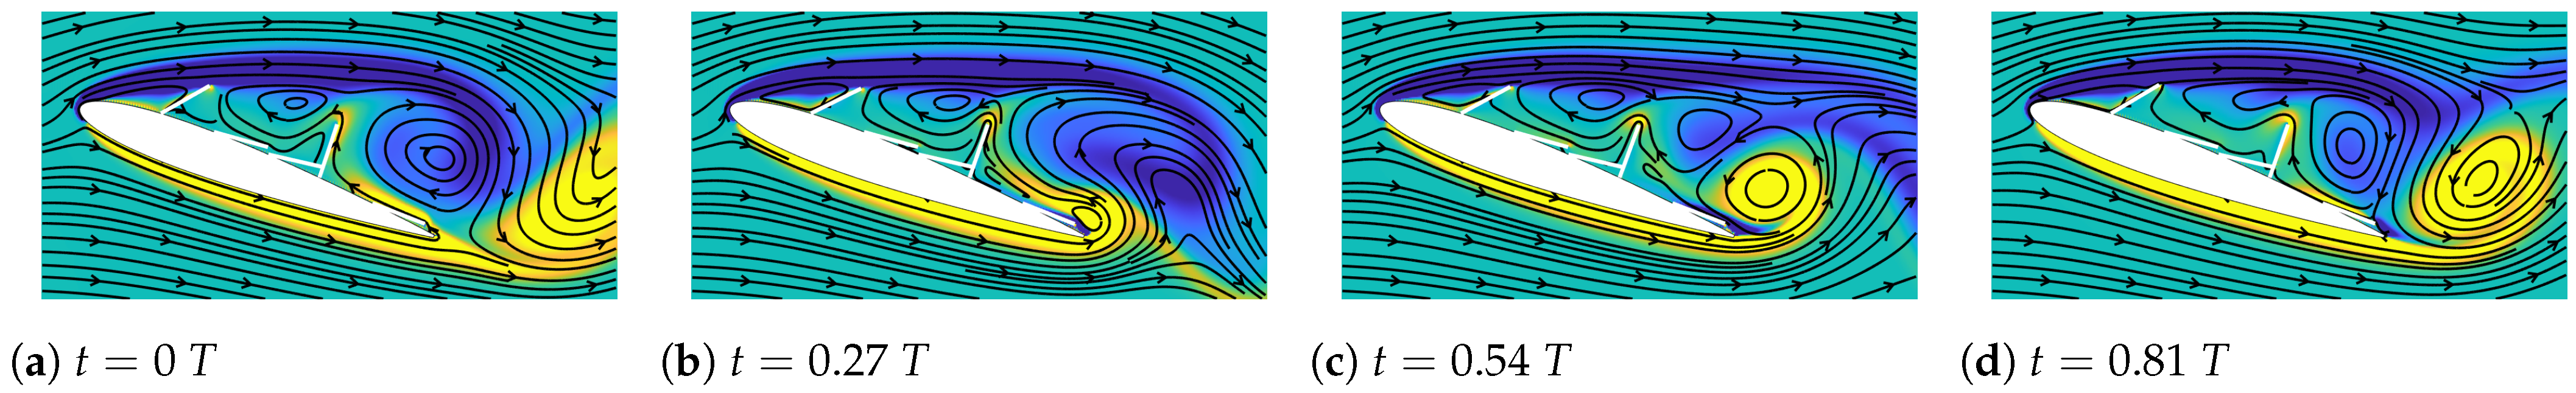
To visualize the barrier constructed by the flap, vorticity contours with streamlines at four time instants in one lift cycle are plotted in Figure 9 and compared with the vorticity contours of the flap-less airfoil case from Figure 5. It can be observed that the number of streamlines propagating upstream from the trailing to the leading edge at t / T = 0.27 and 0.55 in Figure 9b,c is significantly lower than that for the baseline case in Figure 5b,c, respectively. These upstream-propagating streamlines represent the reverse flow induced by the TEV. At t / T = 0.27 , when the TEV is growing in strength, the flap blocks the TEV-induced reverse flow. On the other hand, when the TEV is of approximately maximum strength at t / T = 0.55 , the flap deflection is such that it is unable to fully block the TEV-induced reverse flow. However, at this instant, the reduced flap deflection facilitates the efficient downstream advection of the LEV. This advecting LEV, in addition to the slightly deployed flap, blocks the upstream propagation of TEV-induced reverse flow. Thus, in this behavioral regime, lift benefits are largely driven by the pressure dam effect seen in Figure 8, and, in particular, the rejection of adverse high pressure from the TEV.
A similar pressure dam effect and associated peak performance are observed for the larger-inertia case of i β = 10 3 at k β = 0.0025 , as observed in Figure 8. However, the low-pressure region upstream of flap 4 for this larger-inertia case is not as lift-enhancing as that of the lower-inertia case of i β = 10 5 
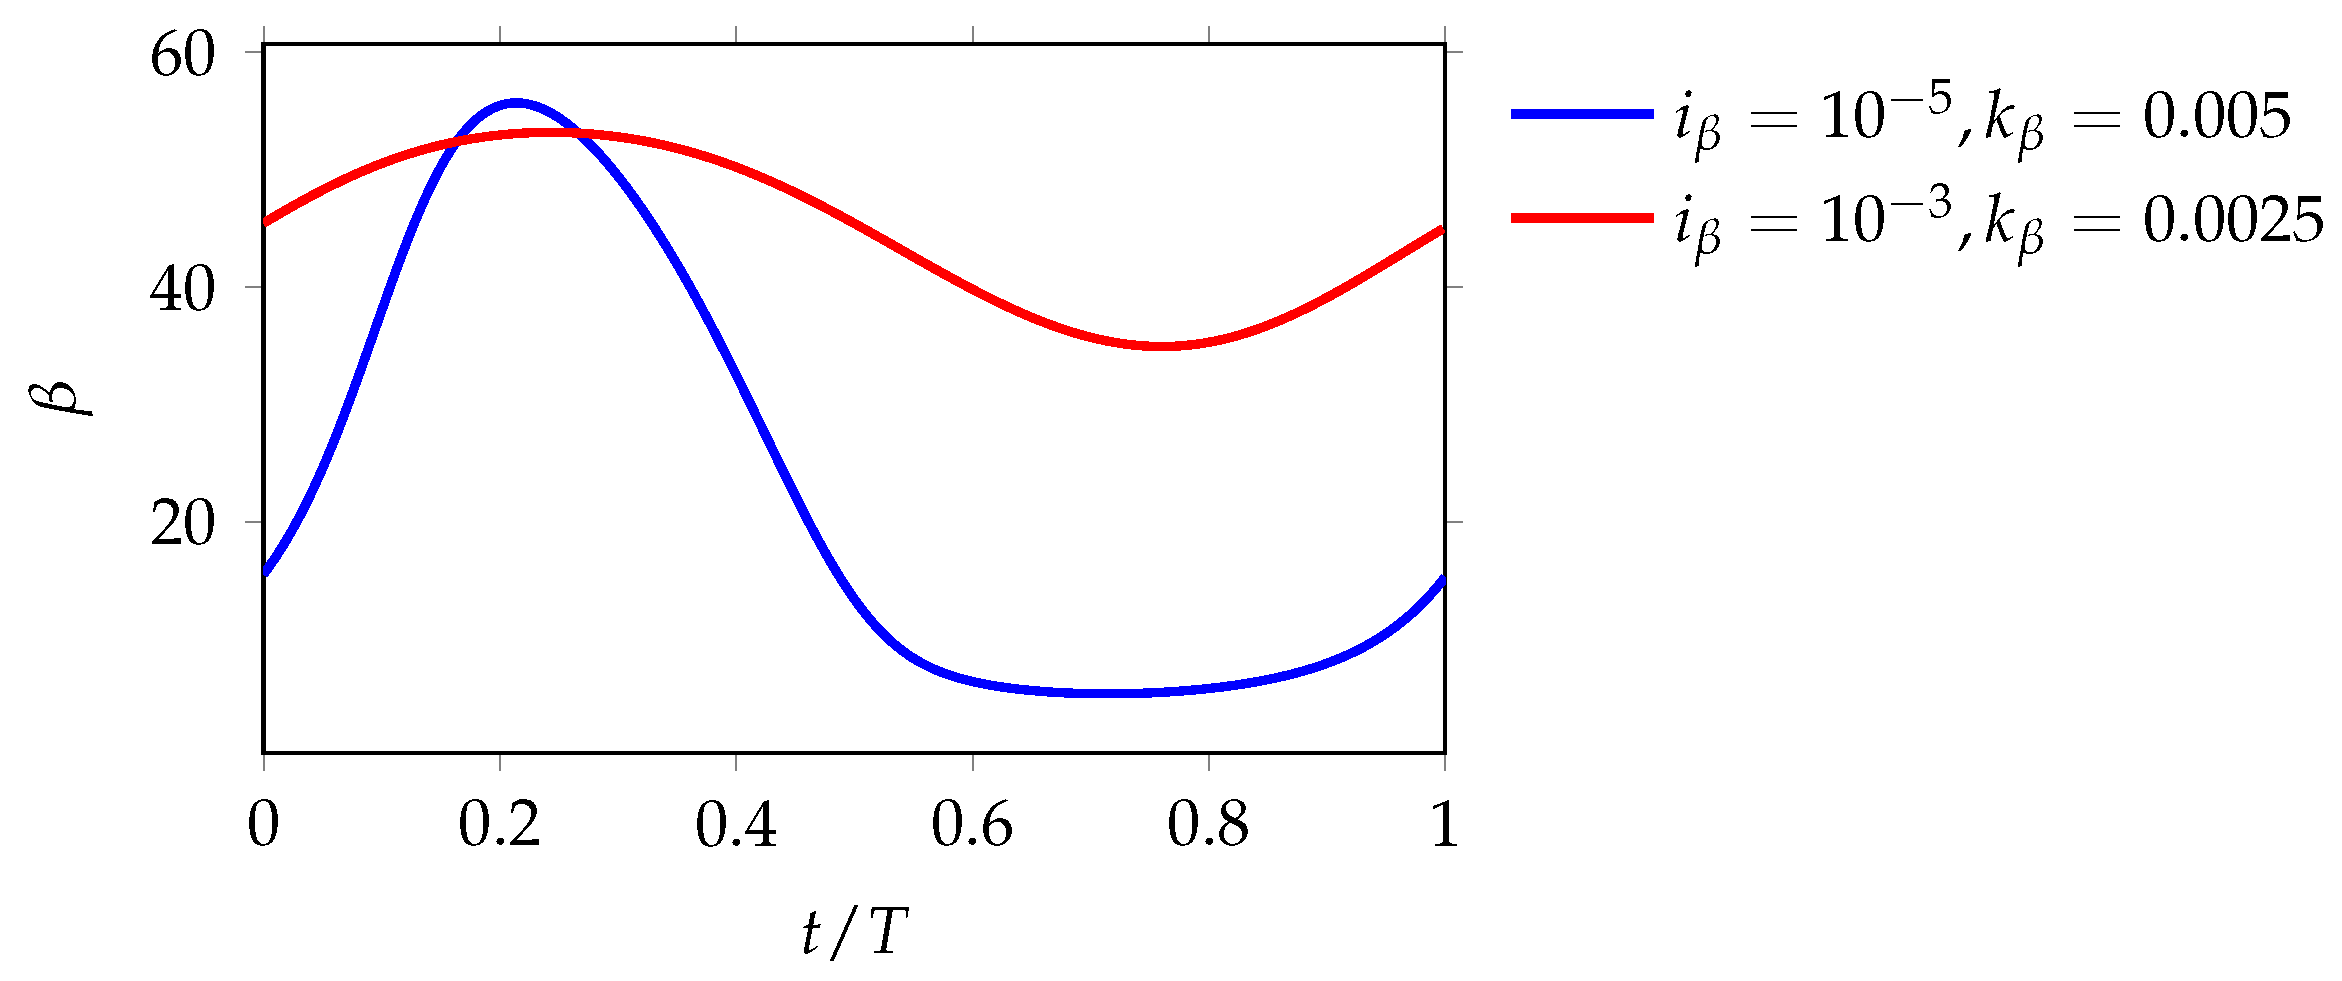
. To identify the distinguishing mechanisms between these inertia cases, the deflection of flap 4 in one time period of the lift cycle for these two cases is plotted in Figure 10. In both cases, the flap oscillates downwards (i.e., decreasing deflection) starting at t / T 0.2 . This time instant approximately marks the moment when the TEV is beginning to grow in strength and induce the lift-deteriorating reverse flow. While the flap itself blocks the reverse flow to some extent, as discussed above, the motion of the downward-moving flap augments this blocking by countering the upstream-propagating reverse flow. This phenomenon can be visualized from the vorticity contour at a representative time instant of t / T = 0.45 for i β = 10 5 , k β = 0.005 in Figure 11a. Here, the downward-oscillating flap induces multiple downstream-moving streamlines through the flap, thereby restricting the TEV-induced reverse flow. We emphasize that the streamlines pass through the flap due to the no-slip boundary constraint enforced by the moving flap and that these streamlines do not imply a permeable flap.
Now, the lower-inertia flap oscillates with a larger angular velocity as compared to the larger-inertia flap, implied by the large-amplitude oscillations for i β = 10 5 observed from Figure 10. The larger-velocity flap counters more productively against the TEV-induced reverse flow. For comparison, the vorticity contour at the same time instant of t / T = 0.045 for i β = 10 3 , k β = 0.0025 is plotted in Figure 11b. Clearly, more upstream-propagating streamlines are discernible for the low-velocity, high-inertia flap in Figure 11b as compared to the high-velocity, low-inertia flap in Figure 11a. Additionally, the augmented blocking of reverse flow for the lower-inertia case mitigates the growth of the TEV, as implied by the smaller TEV size in Figure 11a compared to that in Figure 11b. The combined effect of increased flap velocity countering the reverse flow as well as reduced TEV strength enhances the performance of the airfoil–flap system equipped with lower-inertia flaps. This comparison highlights the need to understand both the mean dynamics (which facilitate a pressure dam phenomenon in the first place), as well as the detailed time-dependent dynamics enabled by distinct spring stiffness and flap inertia values (which allow for complex dynamics and additional lift benefits compared with a stationary flap).

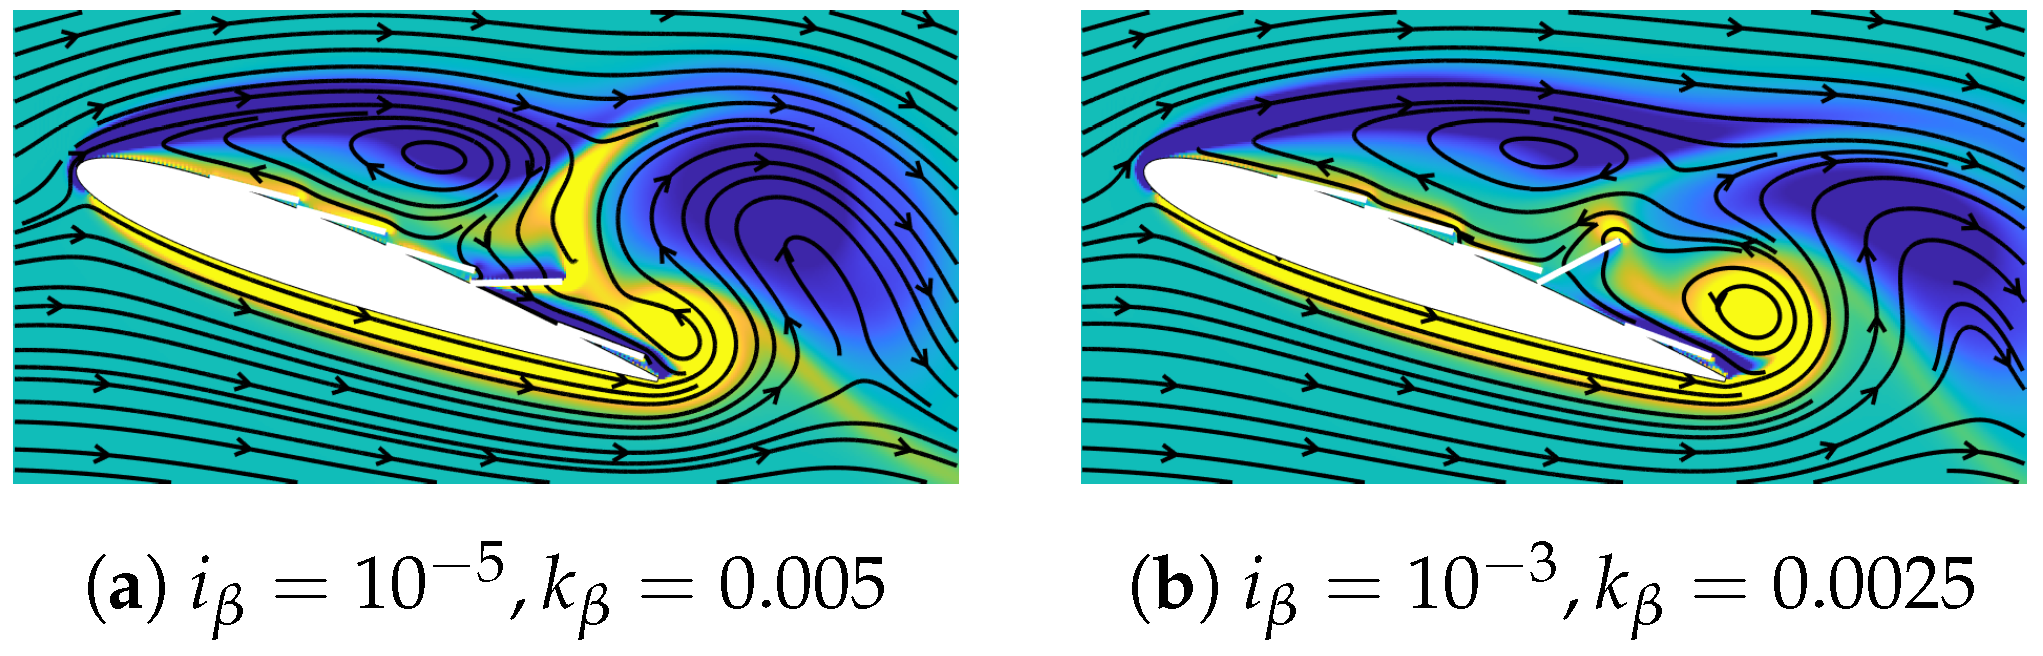
4.4. Flow Physics of the Airfoil–Flap System Dominated by Dynamics of Flaps 1 and 4

In this section, we analyze the regime where both flaps are deployed. To describe the driving physics in this regime, we plot the mean C p distribution on the airfoil surface in Figure 12 for a representative case of i β = 10 3 and k β = 0.00025 . This case corresponds to a local peak in performance observed in Figure 6. Similar to the previous regime, a sharp pressure discontinuity on the suction surface is observed at the location of the hinge of the first flap. Additionally, a smaller discontinuity is observed at the hinge of the fourth flap. Unlike the previous regime, where the pressure dam effect was noticed upstream of flap 4, here, the performance-conducive low-pressure region is dominantly maintained upstream of flap 1. Between hinges 1 and 4, this pressure dam effect is not considerable.
To analyze the flow behavior in detail, vorticity contours at four time instants in one lift cycle are plotted in Figure 13. It can be observed that both flaps 1 and 4 are deployed, with flap 1 extended towards the shear layer. Similar to the previous analysis, the vorticity contours and streamlines at t / T = 0.27 and 0.55 in Figure 13b,c are compared with Figure 5b,c of the flap-less airfoil case, respectively. Flap 1 is observed to restrict the upstream propagation of the TEV-induced reverse flow, resulting in a strong pressure dam effect on the suction surface till x = 0.2 c . Flap 4 only moderately blocks the reverse flow since few streamlines are observed to propagate above the flap. Furthermore, unlike the previous regime, the advection of LEV is hindered due to the deployment of flaps 1 and 4, which detrimentally contributes to lift. Cumulatively, an already strong pressure dam effect generated by flap 1, and a sub-optimal reverse flow blocking by flap 4 and LEV distortion, result in negligible pressure benefits on the suction surface between hinges 1 and 4.
Finally, we note that the lower-inertia case of i β = 10 5 also exhibits this sub-optimal blocking when flaps 1 and 4 are deployed. However, as deduced from Figure 6, the lowest-inertia cases have inferior performance as compared to the higher-inertia counterparts in this flow regime where both flaps are deployed. The mean C p distribution on the airfoil for i β = 10 5 , k β = 0.00025 in Figure 12 also supports this argument since the lower-inertia case has a slightly weaker suction surface C p as compared to the higher-inertia case of i β = 10 3 , k β = 0.00025 
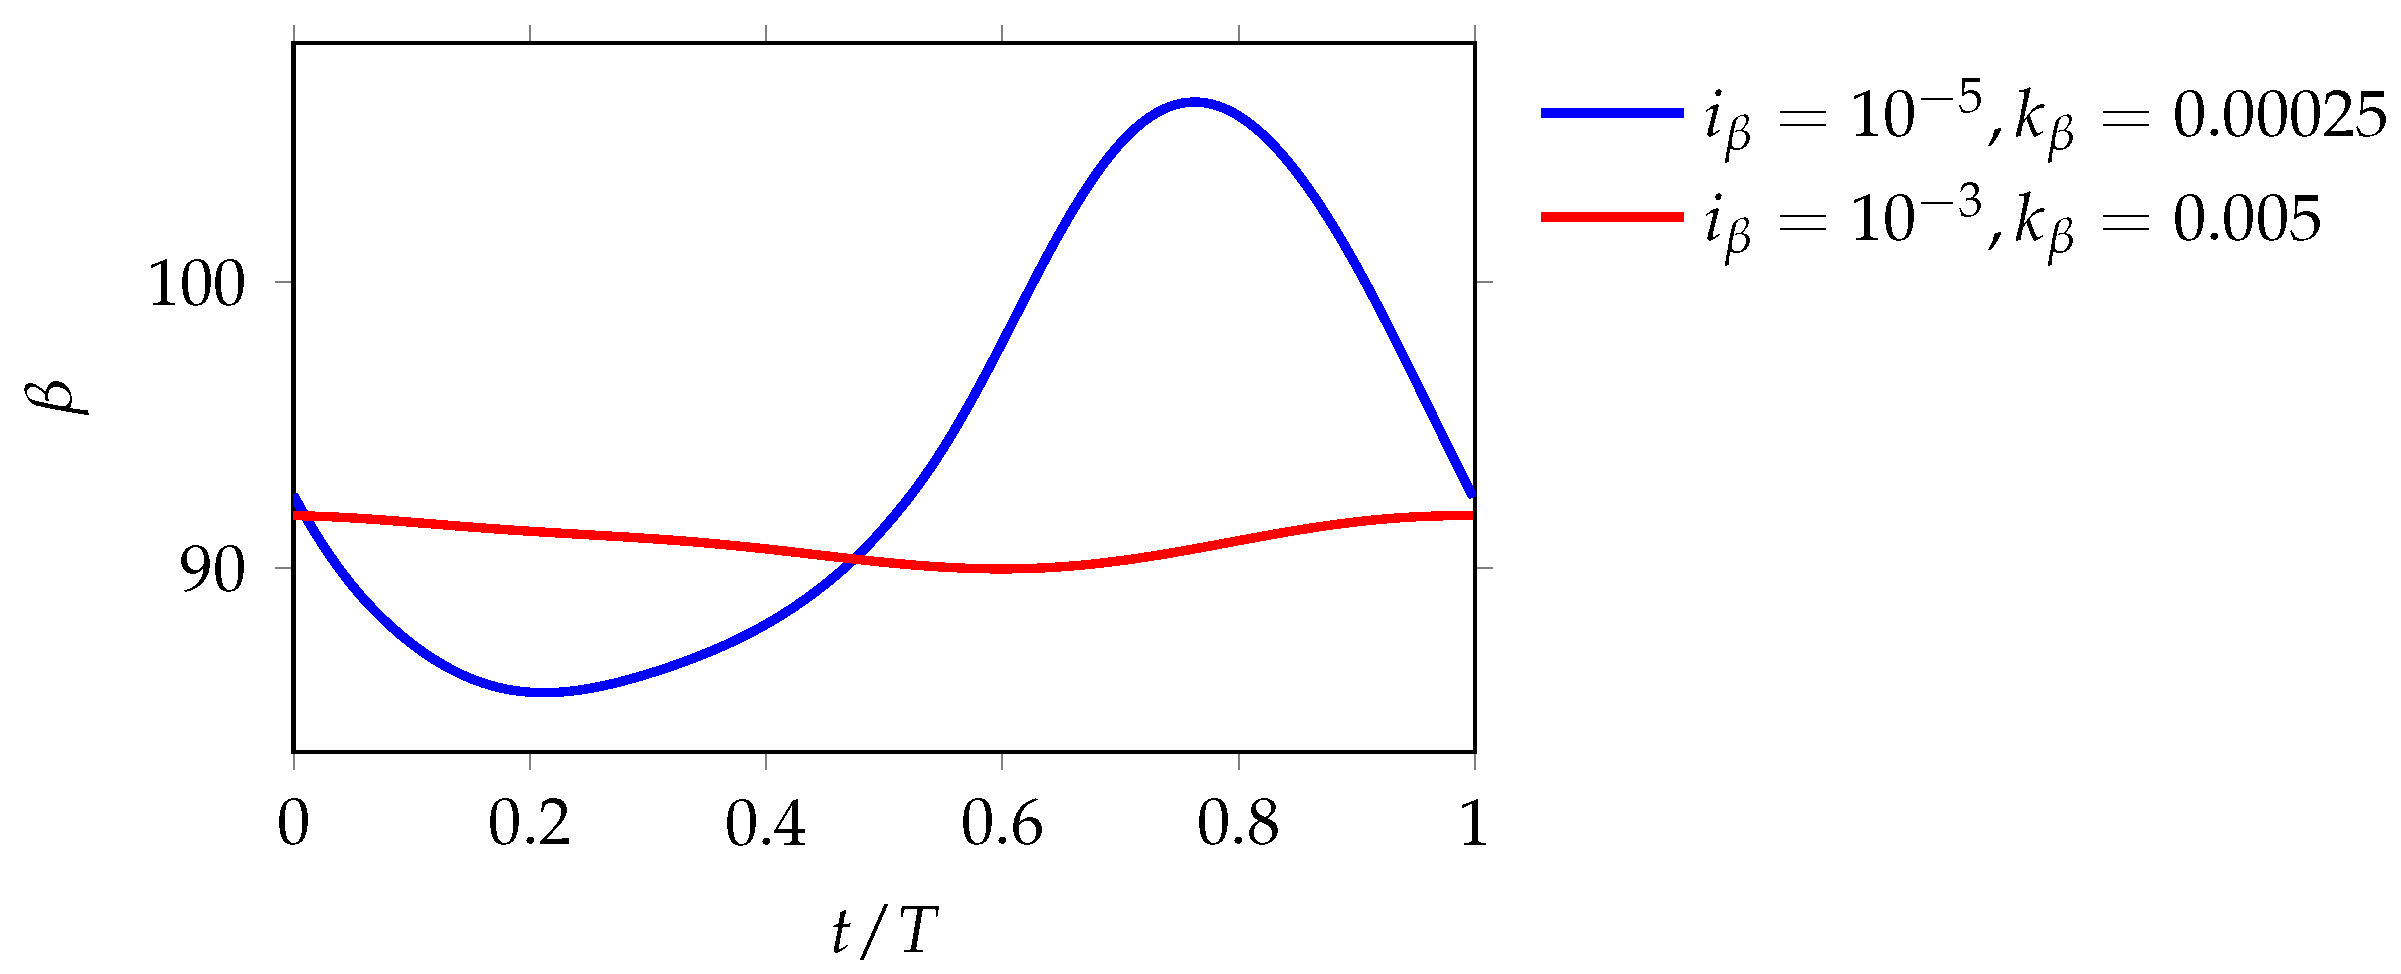
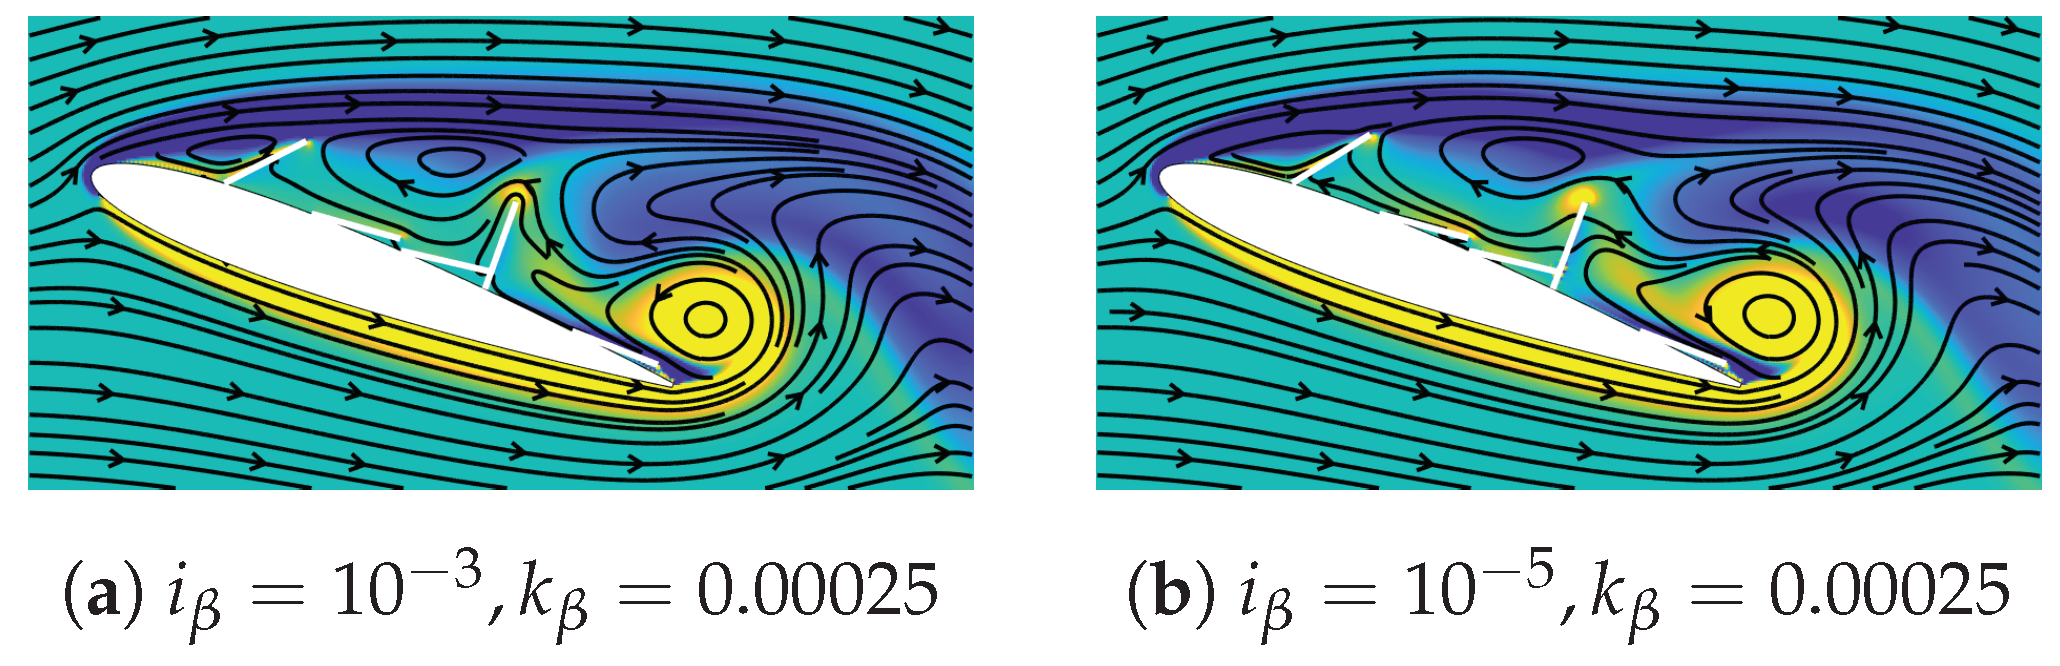
. To identify this deteriorating effect in the presence of lower-inertia flaps, we plotted the deflection of flap 4 in one time period of the lift cycle for these cases, as shown in Figure 14. It can be observed that the lower-inertia case undergoes significantly larger amplitude oscillations as compared to the larger inertia case. Furthermore, during the critical time instances of the growth and shedding of TEV between t / T = 0.2 and t / T = 0.8 , the flap oscillates upwards (i.e., increasing deflection) in response to the TEV-induced reverse flow. To visualize this effect, Figure 15 shows the vorticity contours at a representative time instant of t / T = 0.45 for the low- and high-inertia cases. More upstream-propagating streamlines passing through the flap for the lowest-inertia case in Figure 15b can be observed as compared to the higher-inertia case in Figure 15a. This upward movement of the flap facilitates the upstream propagation of TEV-induced reverse flow. Therefore, the lower-inertia flaps experience additional performance detriments due to their high-velocity upward flap motion as compared to the quasi-static higher-inertia case. Moreover, by comparison with the flap-4-dominated regime from the prior subsection, these results demonstrate the importance of not only flap deflection amplitudes but the phase relationship between these flap dynamics with key flow processes.

5. Conclusions

This study characterized the effect of five self-deploying, torsionally mounted flaps on the aerodynamic performance of a NACA0012 airfoil. We performed 2D numerical simulations of the airfoil–flap system at a low R e = 1000 and a post-stall angle of attack of 20 . A parametric study was performed by varying the flap stiffness and moment of inertia to identify the set of parameters that provided significant lift improvements. A maximum increase in lift of 25% was achieved, thereby demonstrating the utility of passively deployable flaps for post-stall lift enhancement. In all the numerical simulations, flaps 2, 3 and 5 were hardly deployed, thereby indicating that the lift improvement is due to the passive deployment of only flaps 1 and 4.
Two flap behavioral regimes were identified that were beneficial for lift: (i) only flap 4 (located at 0.65 c ) deployed and (ii) flaps 1 (located at 0.2 c ) and 4 deployed. The largest lift benefits were achieved in the former regime where only flap 4 was deployed. Through the plots of mean C p distribution and vorticity contours, a pressure dam effect actuated by the flap was responsible for providing lift benefits. In this phenomenon, the flap acted as a barrier in preventing the upstream propagation of TEV-induced reverse flow and thereby maintained a lower-pressure region upstream of the flap. Lower-inertia flaps maximized this blocking owing to their large amplitude oscillations and favorable phase countering against the reverse flow.
In the latter regime, where both flaps 1 and 4 were deployed for very small torsional stiffness values, lower but non-negligible lift improvements were provided by the larger-inertia flaps. The pressure dam effect primarily established by flap 1 was responsible for the observed lift benefits. On comparison with the previous regime where only flap 4 was deployed, the simultaneous deployment of flaps 1 and 4 hindered the advection of the LEV, which detrimentally affected the lift. In addition, the contribution to the pressure dam effect by flap 4 was not as strong as when this flap was deployed alone. This behavioral regime is important despite the sub-optimal improvement in lift, since many covert-inspired studies focus on zero-stiffness flaps.

Author Contributions

Conceptualization, N.J.N., Z.F. and A.G.; methodology, Z.F.; software, Z.F.; formal analysis, N.J.N. and Z.F.; investigation, N.J.N. and Z.F.; resources, A.G.; data curation, Z.F. and N.J.N.; writing—original draft preparation, N.J.N. and Z.F.; writing—review and editing, A.G.; visualization, N.J.N. and Z.F.; supervision, A.G.; project administration, A.G.; funding acquisition, A.G. All authors have read and agreed to the published version of the manuscript.

Funding

The authors gratefully acknowledge funding from NSF CBET under award number 20-29028.

Institutional Review Board Statement

Not applicable.

Informed Consent Statement

Not applicable.

Data Availability Statement

Data supporting these results can be acquired through direct inquiry to the last author, Andres Goza, at [email protected].

Conflicts of Interest

The authors declare no conflict of interest.

Appendix A. Projection-Based Immersed Boundary (IB) Method for Strongly Coupled Fluid–Structure Interaction (FSI) Problems

The strongly coupled IB method is based on the method of Goza and Colonius [17] and re-derived for bodies that are torsionally mounted to a rigid body in Nair and Goza [18]. For completeness, we give an overview here of the solution procedure employed to advance the system of equations. The reader is referred to the above references for more details.
On the full discretization of the governing equations described in Section 3 and rewriting the resulting equations in the stream function–vorticity formulation, we obtain the following:
C T A C s n + 1 + C T E n + 1 T f n + 1 = r n f
4 Δ t 2 i β i β n + 1 i + k β i β n + 1 i Q t i R t , n + 1 i f t , , n + 1 i Δ s = r n ϕ , i for i = 1 , , m t
2 Δ t β n + 1 i ϕ n + 1 i = r n β , i for i = 1 , , m t
E r , n + 1 C s n + 1 = 0
E t , n + 1 i C s n + 1 R t , n + 1 i T Q t i T ϕ n + 1 i = 0 for i = 1 , , m t
Here, the time step is denoted by the subscript n; the stream function and surface stresses imposed on the bodies by fluid are denoted by s and f, respectively; the stresses on the individual torsionally hinged bodies are denoted by f t , i f for i = 1 , , m t , where m t is the number of torsional bodies. We also define ϕ i = β ˙ i . The curl operator is given by C; A = 1 Δ t I 1 2 L , where I is the identity, L is the discretized vector Laplacian operator (in this case, via a standard second-order finite difference stencil) and Δ t is the time step size. The discretization of the operators in the left-hand side of Equations (5) and (6), E r and E t i , respectively, are the IB interpolation operators that interpolate the fluid velocity onto the rigid and torsional bodies, respectively, and E is simply the block-row aggregation of each of E r and E t i . On the other hand, E T represents the regularization operator involving the delta function in Equation (2), which regularizes the surface stress from each of the bodies onto the flow field. See reference [20] for more details about the IB interpolation and regularization operators that are constructed using regularized delta functions. The operator Q t i R t , n + 1 i denotes the discretization of the term involving the surface stress in Equation (4) and Δ s is the size of discretization of the body. See the Appendix of reference [18] for the detailed construction of these operators, as well as the expressions of the right-hand side terms r n f , r n ϕ , i and r n β , i .
On introducing an iterative scheme and performing a block-LU decomposition of Equations (A1)–(A5), we obtain the final system of equations as given below:
s * = ( C T A C ) 1 r n f
E n + 1 ( k ) C ( C T A C ) 1 C T E n + 1 ( k ) T + 2 Δ s Δ t S t , n + 1 ( k ) T J β 1 S t , n + 1 ( k ) f n + 1 ( k + 1 ) = E n + 1 ( k ) C s * r c ( k ) + S t , n + 1 ( k ) T r β ( k ) 2 Δ t J β 1 r ϕ ( k )
Δ β = J β 1 r ϕ ( k ) + Δ s S t , n + 1 ( k ) f n + 1 ( k + 1 )
s n + 1 = s * ( C T A C ) 1 C T E n + 1 T f n + 1
Here, the FSI iteration is denoted by the superscript ( k ) . The individual structural operators with the superscript i in (A1)–(A5) are aggregated block-diagonally in S t , n + 1 ( k ) and J β . The detailed derivation of the block-LU decomposition can be found in the Appendix of reference [18].
The entire method is divided into three steps. First, a trial stream function s * is predicted without accounting for the body forces in Equation (A6). Next, the FSI coupling Equations (A7) and (A8) are solved iteratively at the next time step n + 1 for the surface stress f n + 1 ( k + 1 ) and body configuration β n + 1 ( k + 1 ) = β n + 1 ( k ) + Δ β . Within each FSI iteration, the linear system in Equation (A7) is solved using an iterative method such as GMRES. Finally, the stream function at the current time step, s n + 1 , is obtained by correcting s * using the updated surface stress in Equation (A9).

References

  1. Mueller, T.J.; Delaurier, J.D. Aerodynamics of Small Vehicles. Annu. Rev. Fluid Mech. 2003, 35, 89–111. [Google Scholar] [CrossRef]
  2. Lissaman, P. Low-Reynolds-Number Airfoils. Annu. Rev. Fluid Mech. 1983, 15, 223–239. [Google Scholar] [CrossRef]
  3. Carruthers, A.; Thomas, A.; Taylor, G. Automatic aeroelastic devices in the wings of a steppe eagle Aquila nipalensis. J. Exp. Biol. 2007, 210, 4136–4149. [Google Scholar] [CrossRef] [PubMed] [Green Version]
  4. Schluter, J.U. Lift enhancement at low Reynolds numbers using self-activated movable flaps. J. Aircr. 2010, 47, 348–351. [Google Scholar] [CrossRef]
  5. Wang, L.; Alam, M.M.; Zhou, Y. Experimental study of a passive control of airfoil lift using bioinspired feather flap. Bioinspir. Biomim. 2019, 14, 066005. [Google Scholar] [CrossRef] [PubMed]
  6. Johnston, J.; Gopalarathnam, A. Investigation of a bio-inspired lift-enhancing effector on a 2D airfoil. Bioinspir. Biomim. 2012, 7, 036003. [Google Scholar] [CrossRef] [PubMed]
  7. Duan, C.; Wissa, A. Covert-inspired flaps for lift enhancement and stall mitigation. Bioinspir. Biomim. 2021, 16, 046020. [Google Scholar] [CrossRef] [PubMed]
  8. Meyer, R.; Hage, W.; Bechert, D.W.; Schatz, M.; Knacke, T.; Thiele, F. Separation Control by Self-Activated Movable Flaps. AIAA J. 2007, 45, 191–199. [Google Scholar] [CrossRef]
  9. Izquierdo, D.O.; Marques, F.D. Experimental analysis of passive bio-inspired covert feathers for stall and post-stall performance enhancement. Meccanica 2021, 56, 2671–2689. [Google Scholar] [CrossRef]
  10. Kernstine, K.; Moore, C.; Cutler, A.; Mittal, R. Initial Characterization of Self-Activated Movable Flaps, “Pop-Up Feathers”. In Proceedings of the 46th AIAA Aerospace Sciences Meeting and Exhibit, Reno, NV, USA, 7–10 January 2008; p. 369. [Google Scholar]
  11. Bramesfeld, G.; Maughmer, M.D. Experimental investigation of self-actuating, upper-surface, high-lift-enhancing effectors. J. Aircr. 2002, 39, 120–124. [Google Scholar] [CrossRef]
  12. Nair, N.J.; Goza, A. Effects of Torsional Stiffness and Inertia on a Passively Deployable Flap for Aerodynamic Lift Enhancement. In Proceedings of the AIAA SCITECH 2022 Forum, San Diego, CA, USA, 3–7 January 2022; p. 1968. [Google Scholar]
  13. Rosti, M.E.; Omidyeganeh, M.; Pinelli, A. Passive control of the flow around unsteady aerofoils using a self-activated deployable flap. J. Turbul. 2018, 19, 204–228. [Google Scholar] [CrossRef] [Green Version]
  14. Brücker, C.; Weidner, C. Influence of self-adaptive hairy flaps on the stall delay of an airfoil in ramp-up motion. J. Fluids Struct. 2014, 47, 31–40. [Google Scholar] [CrossRef] [Green Version]
  15. Selig, M. Low Reynolds number airfoil design lecture notes. In VKI Lecture Series, November; University of Illinois: Urbana, IL, USA, 2003; pp. 24–28. [Google Scholar]
  16. Fang, Z.; Gong, C.; Revell, A.; Chen, G.; Harwood, A.; O’Connor, J. Passive separation control of a NACA0012 airfoil via a flexible flap. Phys. Fluids 2019, 31, 101904. [Google Scholar]
  17. Goza, A.; Colonius, T. A strongly-coupled immersed-boundary formulation for thin elastic structures. J. Comput. Phys. 2017, 336, 401–411. [Google Scholar] [CrossRef] [Green Version]
  18. Nair, N.J.; Goza, A. A strongly coupled immersed boundary method for fluid-structure interaction that mimics the efficiency of stationary body methods. arXiv 2021, arXiv:2103.06415. [Google Scholar]
  19. Colonius, T.; Taira, K. A fast immersed boundary method using a nullspace approach and multi-domain far-field boundary conditions. Comput. Methods Appl. Mech. Eng. 2008, 197, 2131–2146. [Google Scholar] [CrossRef]
  20. Taira, K.; Colonius, T. The immersed boundary method: A projection approach. J. Comput. Phys. 2007, 225, 2118–2137. [Google Scholar] [CrossRef]
Figure 1. Plot of C l v/s α for R e = 1000 . Gray shaded region denotes the amplitude of fluctuations in C l .
Fluids 07 00044 g001
Figure 2. Schematic of the airfoil body with five torsional flaps fixed at 0.2 c , 0.35 c , 0.5 c , 0.65 c and 0.8 c .
Fluids 07 00044 g002
Figure 3. Plots of flap deflection, β , and lift coefficient, C l , versus dimensionless (convective) time. The lift plots provide both the flap-less case and the case of five flaps located at 0.2 c , 0.35 c , 0.5 c , 0.65 c and 0.8 c from the leading edge, k β = 0.001 and i β = 0.001 .
Fluids 07 00044 g003
Figure 4. Vorticity contours at different time instants in one period of a lift cycle for the case of k β = 0.001 and i β = 0.001 .
Fluids 07 00044 g004
Figure 5. Vorticity contours at different time instants in one period of lift cycle for the flap-less airfoil case.
Fluids 07 00044 g005
Figure 6. Performance plots showing percentage change in mean lift with respect to the baseline airfoil case for the various values of inertia ( i β ) and stiffness ( k β ) .
Fluids 07 00044 g006
Figure 7. Mean flap deflection with amplitude of oscillations (denoted by vertical bars).
Fluids 07 00044 g007
Figure 8. Mean C p distribution on the airfoil surface.
Fluids 07 00044 g008
Figure 9. Vorticity contours at different time instants in one period of lift cycle for the case of k β = 0.005 and i β = 10 5 .
Fluids 07 00044 g009
Figure 10. Flap deflection in one time period of lift cycle.
Fluids 07 00044 g010
Figure 11. Vorticity contours at t / T = 0.45 demonstrating the downward-moving flap 4 countering the TEV and its reverse flow.
Fluids 07 00044 g011
Figure 12. Mean C p distribution on the airfoil surface.
Fluids 07 00044 g012
Figure 13. Vorticity contours at different time instants in one period of lift cycle for the case of k β = 0.00025 and i β = 0.001 .
Fluids 07 00044 g013
Figure 14. Flap deflection in one time period of lift cycle.
Fluids 07 00044 g014
Figure 15. Vorticity contours at t / T = 0.45 demonstrating the upward-moving flap 4 facilitating the upstream propagation of TEV-induced reverse flow.
Fluids 07 00044 g015
Publisher’s Note: MDPI stays neutral with regard to jurisdictional claims in published maps and institutional affiliations.

