Abstract
A measurement technique for determination of the global and local equivalence ratios from the flame chemiluminescence for a swirl-stabilized lean premixed combustion of natural gas and kerosene is presented. First, we conducted spectrally resolved chemiluminescence studies using an imaging spectrometer to correlate the ratio of individual chemiluminescence signals to the equivalence ratio. Flame spectra were recorded for a multitude of different lean operating conditions for natural gas and kerosene combustion. The spectra show that, without background correction, the CH*/CO* ratios for both natural gas and kerosene combustion exhibited a monotonic relationship to the equivalence ratio in the investigated range. Subsequently, bandpass-filtered images of CH* and CO* chemiluminescence were acquired simultaneously on one camera chip using an image doubler to investigate the local relationship of the CH*/CO* ratio with the equivalence ratio. The ratio images corroborate the monotonic relationship of the CH*/CO* ratio to the equivalence ratio. Furthermore, the ratio was found to be influenced by the local reaction zone temperature. The presented technique allows high temporal resolution determination of the local equivalence ratio in lean premixed natural gas and kerosene flames and can thus be applied to quantify equivalence ratio oscillations during unstable combustion.
1. Introduction
Lean premixed combustion is utilized in modern gas turbine systems to reduce nitrogen oxide emissions and thus comply with current emissions regulations. However, lean premixed combustion is susceptible to the formation of thermoacoustic instabilities caused by a coupling between acoustic waves in the combustion chamber and fluctuations in the heat release rate [1]. The resulting oscillations can lead to high pressure and temperature amplitudes in the combustion chamber and thereby cause higher emissions and mechanical failure of the system [2,3].
Previous studies of lean premixed combustion dynamics in gas turbine engines have revealed that the fluctuations in the heat release rate are attributable to two coupling mechanisms [4,5]. First, thermoacoustic instabilities are driven by acoustically induced velocity fluctuations at the burner outlet. Additionally, in swirl-stabilized flames, swirl fluctuations at the burner can contribute to the formation of instabilities [6,7,8,9]. Secondly, in technically premixed combustion systems, equivalence ratio fluctuations were found to be an important driver in triggering thermoacoustic instabilities.
These fluctuations are generated by acoustic pressure and velocity fluctuations at the location of the fuel injection. By means of convective transport, the fluctuations reach the flame and then lead to oscillations in the heat release rate. In addition, equivalence ratio fluctuations also influence the flame temperature resulting in the formation of entropy waves that affect the acoustics of the system [10,11].
Fuel flexibility becomes a major issue in modern gas turbines in order to reliably supply electrical energy, especially in times of limited availability of primary fuel. Therefore, the current research focuses on the development of combustion systems that enable the combustion of liquid fuels in gas turbines. While extensive studies on the generation and propagation of equivalence ratio fluctuations have already been conducted using gaseous fuels, this aspect has barely been investigated for the combustion of liquid fuels [12,13,14,15].
For liquid fuel combustion, additional sub-processes involving fuel atomization and evaporation may act as sources of instabilities influencing the generation of equivalence ratio waves. Recent studies indicated that even small velocity perturbations significantly affect the droplet size distribution contributing to the formation of equivalence ratio waves [16,17,18].
Since equivalence ratio fluctuations are a major driver for the formation of thermoacoustic instabilities, the development of a measurement technique to determine these fluctuations becomes of significant importance. Monitoring the chemiluminescence of the flame has been shown to be a possible approach for determining the equivalence ratio. Several numerical and experimental studies have reported a correlation between flame chemiluminescence and the equivalence ratio [19,20,21,22,23].
The most common method for equivalence ratio sensing is to use intensity ratios between different chemiluminescence species. Kojima reported that the OH*/CH*, C*/CH* and C*/OH* ratios were suitable for determining the local equivalence ratio in the reaction zone of laminar methane-air flames under atmospheric conditions [24,25]. Hardalupas and Orain demonstrated that the ratios containing C* were not appropriate for turbulent natural gas flames as C* chemiluminescence depends on the strain rate [20,26].
García-Armingol examined the chemiluminescence spectrum of turbulent swirling flames and showed that CH*/CO* is also suitable for determining the equivalence ratio [27]. The chemiluminescence of OH*, CH*, and C* is superimposed by broadband background radiation that is mainly attributable to CO* and HCO* [28]. The studies presented here have taken this into account, and thus all ratios are corrected for background radiation.
The applicability of utilizing chemiluminescence ratios without background correction for equivalence ratio sensing has been much less elucidated. It was found that the sensitivity of the chemiluminescence ratios without background correction decreases significantly with respect to the equivalence ratio. For very lean natural gas flames, the OH*/CH* ratio even shows the opposite tendency, which would lead to an inconclusive prediction of the equivalence ratio from the chemiluminescence ratio, thus, making this range useless for equivalence ratio monitoring. Without background correction, only the CH*/CO* ratio still exhibits a monotonic relationship to the equivalence ratio for turbulent lean natural gas flames [27].
The reaction kinetics of the formation of chemiluminescence species has been investigated in many studies. In the combustion of hydrocarbons, the following reaction is reported to be the dominant reaction for the formation of OH* [29]:
For the formation of CH*, three reactions are proposed in the literature [30]:
It is not clear which reaction is the major source of CH*, as various studies have identified one or the other reaction as predominant. Previous studies revealed that the chemiluminescence intensity of CO* is proportional to the concentration of CO and O and stated the following three-body reaction as the major source of CO* [31]:
Thus far, the correlation among the ratio of the different chemiluminescence species with the equivalence ratio for premixed spray flames has not been extensively studied. These studies only considered ratios involving the species OH*, CH* and C* [32,33,34]. In contrast to gas flames, the OH*/CO* and CH*/CO* ratio for the combustion of kerosene have not yet been investigated. This study examines the relationship of the chemiluminescence ratios of OH*/CO* and CH*/CO* with the equivalence ratio for turbulent, swirl-stabilized natural gas and kerosene flames under atmospheric conditions. In addition, the influence of background radiation on this relationship and its applicability for equivalence ratio measurements is discussed in more detail.
The paper is structured as follows. First, spectrally resolved chemiluminescence studies are presented correlating the ratio of individual chemiluminescence signals to the equivalence ratio. The objective is to analyse the influence of background radiation on the relationship between these ratios and the equivalence ratio. Secondly, simultaneously acquired images of CH* and CO* chemiluminescence are depicted using the bandpass-filtered chemiluminescence technique developed in previous works [35,36]. Here, the focus is on providing the local relationship between the different chemiluminescence signals and the equivalence ratio.
2. Experimental Setup and Measurement Techniques
2.1. Single Burner Test Rig
All experimental investigations in this study were conducted in an atmospheric single burner test rig. A schematic sketch of the test rig is shown in Figure 1. The main airflow is electrically preheated at the test rig inlet to provide a constant temperature of = 573 K at the combustion chamber inlet. The preheated flow next passes the plenum, which is a cylindrical tube with a length of 1365 mm and an inner diameter of 124 mm. The combustion chamber with a total length of 730 mm has a square cross-section with a side length of 150 mm. The flame can be observed through a quartz glass window at the combustion chamber. The test rig is equipped with a downscaled version of the EV burner [37,38]. The burner consists of a diverging conical swirler followed by a converging mixing tube.
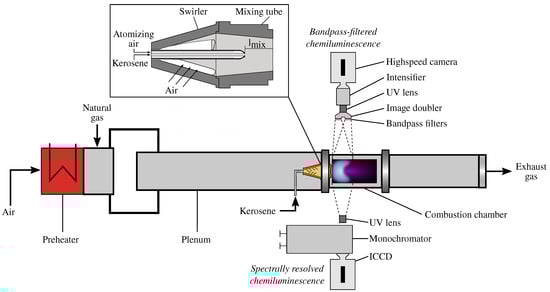
Figure 1.
Schematic sketch of the single burner test rig with modular swirl burner system and measurement techniques.
The swirler has four tangential slots, by which the flow is swirled, and has a length of 68 mm. The mixing tube has a length of 60 mm and an outlet diameter of 32 mm. The burner can be additionally equipped with a central twin-fluid nozzle on the burner axis for the injection of liquid fuel. The burner with the twin-fluid nozzle is also shown schematically in Figure 1. Kerosene and air are supplied to the twin-fluid nozzle. The liquid flow is brought together with a stream of high momentum atomizing air within the nozzle. Therefore, fine droplets at low liquid velocities can be created by this nozzle [39].
The mixing length is defined as the distance between the nozzle outlet and the combustion chamber inlet as depicted in Figure 1. The lance is fixed at a mixing length of = 70 mm. The flame is indicated to be premixed, as a blue oil flame was detected. Moreover, this premixed characteristic can be verified indirectly, as the emissions of the kerosene flame are close to the premixed natural gas flames. To obtain a perfectly premixed natural gas flame, the gaseous fuel can be supplied far upstream of the combustion chamber directly after the electrical preheater.
Due to the long mixing section of air and natural gas, equivalence ratio fluctuations can be avoided. All experiments involving natural gas were carried out without the twin-fluid nozzle installed. The deviations of the flow metering equipment for kerosene were under 0.25% and for air and natural gas were around 1%. The Reynolds number varied from 26,000 to 42,000 referring to the burner outlet diameter of 32 mm. A detailed description of the test rig can be found in previous work [36,40,41].
2.2. Spectrally Resolved Chemiluminescence
The measurement technique for spectrally resolved chemiluminescence is considered in the following subsection. A schematic sketch of the spectrally resolved measurement setup is also shown in Figure 1. The imaging spectrometer SpectraPro 275 from Acton Research Cooperation is the central part of the setup for spectrally resolved investigations. This was a Czerny–Turner monochromator with a grating of 150 grooves per millimeter used for the measurements. The spectrometer had an aperture ratio of 1:3.8 and a focal length of 275 mm. Therefore, approximately 300 nm of the flame spectrum could be observed.
The image of the flame is focused on the inlet slit of the monochromator with a slit width of 10 m using a UV lens. The focal length of the lens is 45 mm, and the maximum aperture is 1:1.8. To record the spectra at the outlet of the spectrometer, a LaVision StreakStar image intensified camera was attached to it.
The intensities of the chemiluminescence spectrum were measured over the single pixels of the camera. In order to obtain the spectrum of the entire flame, an integration over the spatial coordinate of the spectrometer was performed. An additional calibration measurement was conducted to determine a relation for the exact wavelengths correlating to each pixel.
Therefore, a mercury arc lamp spectrum was measured using the spectrally resolved measurement setup. The recorded spectrum consisted of five separate spectral lines that were clearly visible. The corresponding wavelengths of the detected mercury lines were taken from Reader [42]. A conversion rule to derive the nm scale based on the pixel scale can be obtained by approximating the measured data points by a first order polynomial.
Moreover, a second calibration measurement was conducted to account for the unknown, wavelength-dependent sensitivity of the imaging spectrometer coupled with the camera. Therefore, the spectrum of a halogen lamp was recorded. The reference spectrum of this calibrated lamp is known by the manufacturer and can be compared to the measured spectrum. Thus, a calibration function over the measured wavelength range can be computed and applied to all recorded spectra.
Spectrally resolved measurements were conducted for different thermal powers in the range of 40 to 60 kW. The equivalence ratio was varied between = 0.53 and = 0.8 at constant fuel flow rates. For each operating point, 20 images were recorded individually with an exposure time of 5 ms. The resolution of the spectrally resolved images was 384 × 286 pixels. During the post-processing, the images were averaged, and the respective spectra were filtered with a Savitzky–Golay filter using Matlab. Therefore, 19 interpolation points were used to approximate each fifth degree polynomial of the used filter.
A typical chemiluminescence spectrum of a lean kerosene flame under atmospheric conditions is shown in Figure 2. The OH*, CH* and * peaks are labelled in this figure. These peaks are superimposed by a broadband background radiation. This background radiation is mainly attributed to *. The areas inside the dashed lines in the wavelength range of OH* and CH* are subtracted from the total respective areas to determine the true intensities of the different radicals. As part of this evaluation, the background radiation is linearly interpolated within each radical range.

Figure 2.
Typical chemiluminescence spectrum of a lean kerosene flame under atmospheric conditions.
These areas between the linear interpolation and the peak of each radical emission are highlighted in Figure 2. The chemiluminescence intensity of OH* is depicted in blue and the one of CH* in red. In addition, Figure 2 also shows the normalized transmission curves of several bandpass filters used for bandpass-filtered flame imaging. These filters are described in more detail in the following subsection.
2.3. Bandpass-Filtered Chemiluminescence
Flame images were recorded using a Photron FastCam SAX-2 high-speed camera placed perpendicular to the flow direction. The camera was equipped with an image intensifier from Hamamatsu and a silica glass camera lens. The lens had a focal length of 45 mm and a maximum aperture of 1:1.8.
In addition, an image doubler from LaVision was mounted in front of the camera lens allowing a projection of an image pair onto one camera chip. For each operating point, 1000 images were recorded with a frame rate of 125 frames per second. The resolution of the camera was 1024 × 1024 pixels, and the exposure time was set to 200 s. Two different interference filters could be mounted simultaneously on the image doubler. The following filters were used in this study:
- CO*-filter with a centre wavelength (CWL) of 456.42 nm, a peak transmission of 68.18% and a full width at half maximum (FWHM) of 2.4 nm
- CH*-filter with a CWL of 431.39 nm, a peak transmission of 48.63% and a FWHM of 10.6 nm
The wavelengths transmitted by the CH*-filter correspond to the chemiluminescence intensity of CH* superimposed by the broadband background radiation as shown in Figure 2. The CO*-filter transmits in a wavelength range where only background radiation is emitting chemiluminescence. Flame images were acquired using the CH*-filter and CO*-filter. Bandpass-filtered measurements were carried out for various main air mass flows ranging from 20 to 30 g/s. The equivalence ratio was set between 0.55 and 0.8 by adjusting the fuel mass flow rate.
All flame images were post-processed using Matlab. The image pair was first split into two separate images. The separated images were then averaged, and a distortion correction was applied. The distortion corrected images represent the integrated line-of-sight intensity distribution due to the low optical density of the flame. The absorption of chemiluminescence in the flame is not accounted for, as this has been found to be negligible in atmospheric flames [43].
Assuming a rotationally symmetric flame, the intensity distribution in the centre plane can be reconstructed from the time-averaged measurements. Therefore, an Abel inversion using the BASEX method was applied [44,45]. The local CH*/CO* ratio was then calculated for each pixel. The ratio was evaluated only in the area of the flame where the chemiluminescence intensity of the single species involved was at least 50% of the respective maximum intensity. The global mean ratio was then calculated as the average of the local ratios for each operating point. A detailed description of the post-processing procedure can be found in previous work [36].
3. Results
This section presents and discusses the results of this study. First, the spectrally resolved chemiluminescence results and its relationship to the global equivalence ratio are shown. The chemiluminescence intensities from OH*, CH* and * are superimposed with a broadband background radiation as described in Section 2.2. The broadband background radiation must be taken into account and can be subtracted from the respective chemiluminescence intensities. This procedure is referred to as background correction in the following.
Moreover, the background radiation, which is mainly attributed to *, can be evaluated in a specific range of the spectrum, where no characteristic peaks of other radicals are present. For the investigations presented here, the range from 455 to 457 nm was chosen. Hereafter, this evaluated intensity is referred to as * chemiluminescence. The objective of the spectrally resolved investigations is to find a chemiluminescence ratio that is monotonously dependent on the equivalence ratio for the combustion of natural gas and kerosene. In this section, solely the global spectral properties of the various chemiluminescence species are examined.
Secondly, the bandpass-filtered chemiluminescence results are presented in Section 3.2. Here, the influence of the equivalence ratio, air mass flow and the preheating temperature on the flame shape and the chemiluminescence ratio are discussed in detail.
3.1. Global Equivalence Ratio from Spectrally Resolved Chemiluminescence
First, the intensity ratios for the perfectly premixed combustion of natural gas are examined in detail. Figure 3 shows the relationship of different chemiluminescence ratios and the equivalence ratio for the combustion of natural gas under atmospheric conditions. The different symbols represent various thermal powers ranging from 40 to 60 kW. For comparison, all data are normalized by their maximum value in the depicted range. The intensities of CH* and OH* are not corrected in the left plot (a) and background corrected on the right side in plot (b). The three different ratios CH*/OH*, CH*/* and OH*/* are shown in both plots within Figure 3.
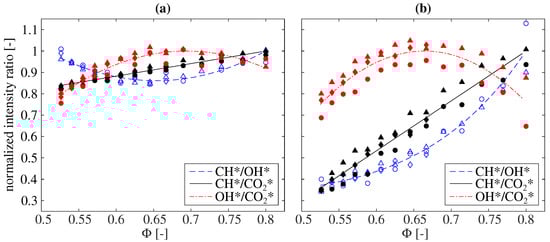
Figure 3.
The dependence of different normalized chemiluminescence ratios on the equivalence ratio for the combustion of natural gas under atmospheric conditions. The intensities of CH* and OH* are uncorrected in (a) and background corrected in (b). Various thermal powers are marked with symbols (diamond: 40 kW, circle: 50 kW, and triangle: 60 kW).
It can be seen that the CH*/OH* and OH*/* chemiluminescence ratios do not show a monotonic dependence on the equivalence ratio within the investigated range using the uncorrected CH* and OH* chemiluminescence intensities. The CH*/OH* ratio can be approximated by a power law for the background corrected case. However, the CH*/* chemiluminescence ratio increases monotonically with the increasing equivalence ratio in both the uncorrected and background corrected cases and can be approximated by a first-order polynomial.
It can also be seen that the CH*/* ratio with background correction exhibits a significantly higher sensitivity to the equivalence ratio compared to the ratio without background correction. While the ratio with background correction decreases to a value below 40% of its maximum value, the ratio only decreases by about 20% without background correction in the investigated range. These results are in line with previous studies indicating that the background correction increases the sensitivity of the CH*/* ratio to the equivalence ratio [27].
Secondly, the same three chemiluminescence ratios are shown in Figure 4 for the combustion of kerosene under atmospheric conditions. Analogously to Figure 3, the ratios are plotted over the equivalence ratio, and the different thermal powers are depicted by various symbols. The chemiluminescence intensities of CH* and OH* are background corrected on the right side of Figure 4 and uncorrected on the left side. Moreover, all data are normalized by their maximum value.

Figure 4.
The dependence of different normalized chemiluminescence ratios on the equivalence ratio for the combustion of kerosene under atmospheric conditions. The intensities of CH* and OH* are uncorrected in (a) and background corrected in (b). Various thermal powers are marked with symbols (diamond: 40 kW, circle: 50 kW, and triangle: 60 kW).
The CH*/OH* and CH*/* ratios show a monotonous dependence on the equivalence ratio both for the uncorrected and background corrected case. These two ratios increase with the increasing equivalence ratio.
The CH*/OH* ratio with background correction exhibits a linear correlation to the equivalence ratio, whereas the ratio without background correction can be approximated better by a power law. This correlation for the CH*/OH* chemiluminescence ratio can also be found in previous work [36]. The CH*/* ratio both with and without background correction is approximated by a first-order polynomial. Similar to natural gas combustion, it is observed that the CH*/* ratio with background correction shows a higher sensitivity to the equivalence ratio than does the ratio without background correction.
In contrast to the first two ratios discussed, the OH*/* ratio shows an opposite trend and a higher spread of the measured data for the most lean investigated range. Since the CH*/* ratio shows a monotonous correlation to the equivalence ratio using the uncorrected intensities both for the combustion of natural gas and kerosene, this ratio was also chosen for the following bandpass-filtered chemiluminescence measurements.
3.2. Bandpass-Filtered Chemiluminescence Results
Figure 5 presents the relationship between the global CH*/* chemiluminescence ratio and the equivalence ratio for the combustion of natural gas and kerosene. A clear correlation between the CH*/* chemiluminescence ratio and the equivalence ratio can also be seen for the bandpass-filtered chemiluminescence measurements.
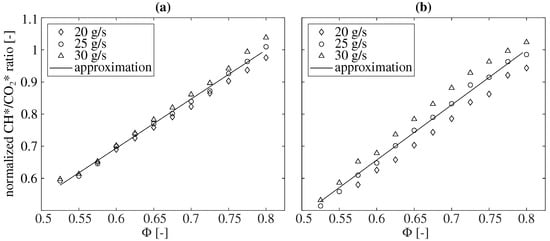
Figure 5.
The dependence of the CH*/* chemiluminescence ratio on the equivalence ratio for the combustion of natural gas in (a) and kerosene in (b) under atmospheric conditions for different air mass flow rates. All values are normalized to the approximation at = 0.8.
In both natural gas and kerosene operations, a linear increase in the ratio with the increasing equivalence ratio is observed. Furthermore, it can be found that the total mass flow rate has an influence on this ratio. For constant equivalence ratios, the CH*/* ratio increases with the increasing mass flow rate. Since previous studies reported the ratio to be independent of the total mass flow rate for the combustion of natural gas [15,46], this aspect is examined in more detail below.
The upper half of Figure 6 shows the CH* flame images for different equivalence ratios ranging from = 0.8 to = 0.55 at a constant air mass flow rate of = 25 g/s for natural gas combustion. Additionally, the 50% isoline of the CO* chemiluminescence intensity is depicted. All images are normalized to their maximum value. In the lower half of Figure 6, the corresponding CH*/* ratio is plotted. The flame images show that the radial flame extension increases with the decreasing equivalence ratio, and the flame is moving downstream due to the decreased reactivity.
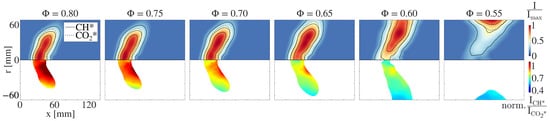
Figure 6.
(Upper half:) Locally resolved CH* chemiluminescence intensity for natural gas combustion at an air mass flow rate of = 25 g/s. The solid black lines represent the 75%, 50% and 25% isolines of the chemiluminescence intensity. The dashed black line represents the 50% isoline of the corresponding CO* chemiluminescence intensity. (Lower half:) Locally resolved CH*/CO* distribution. The values are normalized to the mean CH*/CO* ratio at = 0.8.
A homogeneous distribution of the CH*/CO* ratio can be observed over the major part of the flame front. If the ratio indeed depends only on the equivalence ratio, a homogeneous distribution over the entire flame front can be expected, since no equivalence ratio fluctuations occur in perfectly premixed combustion.
It is noticeable that, for all the ratios presented, the CH*/CO* distribution always deviates from the mean value at the same two areas of the flame. In the region of the inner recirculation zone, a local increase of the CH*/CO* ratio can be identified, and in the region near the walls, the ratio is below the mean value. An interpretation of this observation is provided at the end of this section.
Figure 7 provides the CH* flame images as well as the corresponding local CH*/CO* distribution for a variation of the air mass flow rate between 20 and 30 g/s at a constant equivalence ratio of = 0.775. Contrary to the variation of the equivalence ratio, the flame structure hardly changes over the investigated mass flow range. This is due to the fact that, at a constant equivalence ratio, both air and fuel mass flow rates are varied simultaneously at a fixed ratio, and thus the resulting flow field is self-similar.

Figure 7.
(Upper half:) Locally resolved CH* chemiluminescence intensity for natural gas combustion for an equivalence ratio of = 0.775. The solid black lines represent the 75%, 50% and 25% isolines of the chemiluminescence intensity. The dashed black line represents the 50% isoline of the corresponding CO* chemiluminescence intensity. (Lower half:) Locally resolved CH*/CO* distribution. The values are normalized to the mean CH*/CO* ratio with an air mass flow rate of = 30 g/s.
Only a slight extension of the flame in a radial direction with increasing mass flow rate can be seen. Again, the ratio shows the same characteristics as already observed for the variation of the equivalence ratio. In the area of the inner recirculation zone, higher than average ratio values are seen, whereas, near the wall, the ratio decreases. It is noteworthy that, as the mass flow rate increases, the mean CH*/* ratio increases modestly, although the flame shape and equivalence ratio remain unchanged. It can thus be concluded that there is another parameter influencing the ratio.
Figure 8 presents the mean CH*/CO* ratio for three different equivalence ratios for a variation of the air mass flow rate . All three equivalence ratios exhibit an increase in the mean CH*/CO* ratio with the increasing mass flow rate. Since an approximately constant heat flux is dissipated by the impingement air cooling of the combustion chamber, it can be assumed that the temperature in the reaction zone increases with the increasing mass flow rate due to the increased reaction density. This suggests that the ratio additionally depends on the local temperature in the reaction zone.
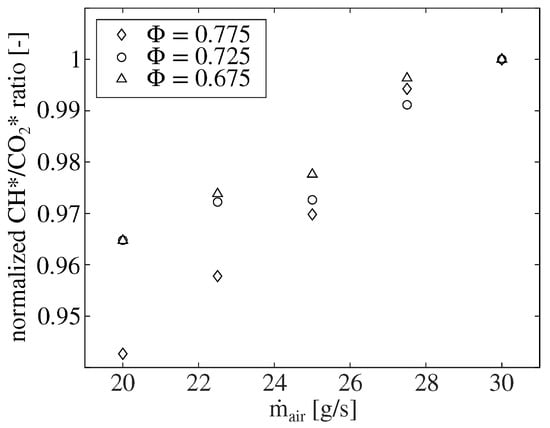
Figure 8.
The dependence of the CH*/* chemiluminescence ratio on the air mass flow rate for the combustion of natural gas under atmospheric conditions for different equivalence ratios. All values are normalized to the respective ratio at = 30 g/s.
To substantiate this assumption, the influence of the preheating temperature on the mean CH*/CO* ratio is shown in Figure 9. The mean ratio for three different equivalence ratios is plotted over the preheating temperature in the range between 200 and 300 °C. All values are normalized to the respective ratio at 300 °C preheating. The ratio shows a linear decrease with decreasing preheating temperature for all equivalence ratios. When decreasing the preheating temperature from 300 to 200 °C, the mean CH*/* ratio decreases by about 6%.
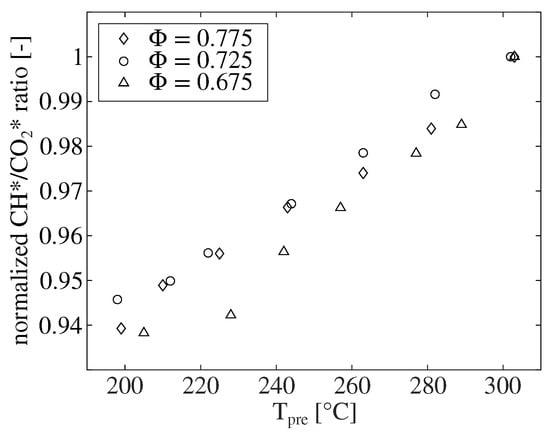
Figure 9.
The dependence of the CH*/* chemiluminescence ratio on the preheating temperature for the combustion of natural gas under atmospheric conditions for different equivalence ratios. All values are normalized to the respective ratio at = 300 °C.
Reducing the preheating temperature from 300 to 200 °C results in a decrease in adiabatic flame temperature of about 70 Kelvin for all three equivalence ratios. This clearly demonstrates that the mean CH*/* ratio is dependent on the flame temperature. This finding supports the assumption made above that the flame temperature in this combustion chamber increases with increasing the mass flow rate, since a linear increase in the ratio was also observed with increasing the mass flow rate.
Assuming that the findings from studying the mean CH*/CO* ratio can also be applied to the local CH*/CO* distribution, an inhomogeneous distribution of the ratio across the flame front can be attributed to temperature gradients in the reaction zone. The distribution of the CH*/CO* ratio and thus the temperature distribution in the reaction zone is in line with expectations, since significantly higher heat losses can be expected in the outer recirculation zone compared with in the inner recirculation zone. As the velocity in the outer recirculation zone is low and the residence time is therefore prolonged, a high heat loss may occur, leading to a significant reduction in reactivity in this area [47].
Finally, Figure 10 depicts the CH* flame images and the corresponding local CH*/CO* ratios for different equivalence ratios ranging from = 0.8 to = 0.55 at a constant air mass flow rate of = 25 g/s for kerosene combustion. Similar trends can be observed for natural gas combustion. Due to the lower reactivity, the radial flame extension increases with the decreasing equivalence ratio, and the flame is shifted downstream. It is clearly visible that the mean CH*/CO* ratio decreases as the equivalence ratio decreases. It is also noticeable in kerosene combustion that the ratio over the flame front deviates from the mean value at the same areas as in natural gas combustion.
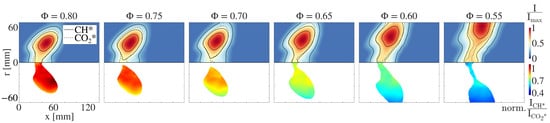
Figure 10.
(Upper half:) Locally resolved CH* chemiluminescence intensity for kerosene combustion at an air mass flow rate of = 25 g/s. The solid black lines represent the 75%, 50% and 25% isolines of the chemiluminescence intensity. The dashed black line represents the 50% isoline of the corresponding CO* chemiluminescence intensity. (Lower half:) Locally resolved CH*/CO* distribution. The values are normalized to the mean CH*/CO* ratio at = 0.8.
Since the flow field in the combustion chamber is similar to that in natural gas combustion, it can be concluded that the local deviation of the ratio is again caused by temperature gradients in the reaction zone. A homogeneous distribution of the ratio is observed over the major part of the flame front suggesting a homogeneous distribution of the equivalence ratio. This could not be assumed in advance, since this is a technically premixed system. This proves that the system examined was indeed a well premixed system, as already indicated by the low emissions.
4. Summary and Conclusions
This paper introduces an optical measurement method for quantifying global and local equivalence ratios in the reaction zone of a dual fuel burner for natural gas and kerosene based on the measurement of CH* and CO* chemiluminescence of the flame. The unique aspect of this study is the reporting of a ratio that can be used for determining the equivalence ratio in lean natural gas and kerosene flames without taking the background radiation for CH* into account, thereby, resulting in a significant simplification of the measurement technique. The measurement method provides a high temporal resolution and thus allows the determination of equivalence ratio fluctuations during unstable combustion.
Initially, spectrally resolved measurements of natural gas and kerosene combustion were conducted to assess the impact of broadband background radiation on the use of chemiluminescence ratios for equivalence ratio sensing. We demonstrated that, without background correction, only the CH*/CO* ratio for both natural gas and kerosene combustion exhibited a monotonic relationship to the equivalence ratio in the investigated range.
Subsequently, bandpass-filtered chemiluminescence measurements were conducted based on the preliminary findings. An image doubler was mounted in front of an intensified high-speed camera and equipped with a CH* and CO* bandpass filter allowing simultaneous acquisition of the two chemiluminescence species on one camera chip. It was shown that the ratio of the two intensity images was directly proportional to the equivalence ratio for both natural gas and kerosene flames.
We also found that the ratio was influenced by the local reaction zone temperature. Particularly in technical applications, where temperature fluctuations over the flame are to be expected, this influence must be taken into account, since otherwise excessively high equivalence ratio gradients over the reaction zone might be the result of the measurement.
Further investigations are planned to determine equivalence ratio fluctuations during unstable combustion using the dual fuel burner in both natural gas and kerosene operations. In addition, reactive CFD simulations with the inclusion of heat losses will be performed in order to provide precise information regarding the temperature field in the reaction zone.
Author Contributions
Conceptualization, M.V., M.B., J.K. and T.S.; methodology, M.V. and T.S.; software, M.V. and M.B.; validation, J.K. and T.S.; formal analysis, M.V., M.B., J.K. and T.S.; investigation, M.V., M.B. and J.K.; resources, M.V., M.B., J.K. and T.S.; data curation, M.V. and M.B.; writing—original draft preparation, M.V., M.B., J.K. and T.S.; writing—reviewing and editing, M.V., M.B., J.K. and T.S.; visualization, M.V. and M.B.; supervision, T.S.; project administration, T.S.; funding acquisition, T.S. All authors have read and agreed to the published version of the manuscript.
Funding
The work was supported by GE Power and the Federal Ministry for Economic Affairs and Energy (BMWi) as per resolution of the German Federal Parliament under Grant No. 0324295C.
Data Availability Statement
The data presented in this study are available on request from the corresponding author.
Acknowledgments
The investigations were conducted as part of the joint research program ECOFlex-turbo in the frame of AG Turbo. The authors gratefully acknowledge GE Power and AG Turbo for their support.
Conflicts of Interest
The authors declare no conflict of interest.
References
- Candel, S.; Durox, D.; Schuller, T.; Bourgouin, J.F.; Moeck, J.P. Dynamics of swirling flames. Annu. Rev. Fluid Mech. 2014, 46, 147–173. [Google Scholar] [CrossRef]
- Lieuwen, T.C.; Yang, V. Combustion Instabilities in Gas Turbine Engines; American Institute of Aeronautics and Astronautics: Reston, VA, USA, 2005. [Google Scholar] [CrossRef]
- Huang, Y.; Yang, V. Dynamics and stability of lean-premixed swirl-stabilized combustion. Prog. Energy Combust. Sci. 2009, 35, 293–364. [Google Scholar] [CrossRef]
- Lieuwen, T.; Torres, H.; Johnson, C.; Zinn, B. A mechanism of combustion instability in lean premixed gas turbine combustors. J. Eng. Gas Turbines Power 2001, 123, 182–189. [Google Scholar] [CrossRef]
- Ducruix, S.; Schuller, T.; Durox, D.; Candel, S. Combustion dynamics and instabilities: Elementary coupling and driving mechanisms. J. Propuls. Power 2003, 19, 722–734. [Google Scholar] [CrossRef]
- Hirsch, C.; Fanaca, D.; Reddy, P.; Polifke, W.; Sattelmayer, T. Influence of the swirler design on the flame transfer function of premixed flames. In Proceedings of the ASME Turbo Expo, Reno, NV, USA, 6–9 June 2005. [Google Scholar]
- Komarek, T.; Polifke, W. Impact of swirl fluctuations on the flame response of a perfectly premixed swirl burner. J. Eng. Gas Turbines Power 2010, 132, 1–7. [Google Scholar] [CrossRef]
- Stöhr, M.; Sadanandan, R.; Meier, W. Phase-resolved characterization of vortex-flame interaction in a turbulent swirl flame. Exp. Fluids 2011, 51, 1153–1167. [Google Scholar] [CrossRef] [Green Version]
- Lieuwen, T.C. Unsteady Combustor Physics; Cambridge University Press: Cambridge, UK, 2012. [Google Scholar] [CrossRef] [Green Version]
- Lieuwen, T.; Zinn, B.T. The role of equivalence ratio oscillations in driving combustion instabilities in low NOx gas turbines. Symp. (Int.) Combust. 1998, 27, 1809–1816. [Google Scholar] [CrossRef]
- Sattelmayer, T. Influence of the combustor aerodynamics on combustion instabilities from equivalence ratio fluctuations. J. Eng. Gas Turbines Power 2003, 125, 11–19. [Google Scholar] [CrossRef]
- Guen Lee, J.; Kim, K.; Santavicca, D.A. Measurement of equivalence ratio fluctuation and its effect on heat release during unstable combustion. Proc. Combust. Inst. 2000, 28, 415–421. [Google Scholar]
- Li, H.; Wehe, S.D.; McManus, K.R. Real-time equivalence ratio measurements in gas turbine combustors with a near-infrared diode laser sensor. Proc. Combust. Inst. 2011, 33, 717–724. [Google Scholar] [CrossRef]
- Bluemner, R.; Paschereit, C.O.; Oberleithner, K. Generation and transport of equivalence ratio fluctuations in an acoustically forced swirl burner. Combust. Flame 2019, 209, 99–116. [Google Scholar] [CrossRef]
- Kather, V.; Lückoff, F.; Paschereit, C.O.; Oberleithner, K. Interaction of equivalence ratio fluctuations and flow fluctuations in acoustically forced swirl flames. Int. J. Spray Combust. Dyn. 2021, 13, 72–95. [Google Scholar] [CrossRef]
- Eckstein, J.; Freitag, E.; Hirsch, C.; Sattelmayer, T.; von der Bank, R.; Schilling, T. Forced low-frequency spray characteristics of a generic airblast swirl diffusion burner. J. Eng. Gas Turbines Power 2005, 127, 301–306. [Google Scholar] [CrossRef]
- Kumara Gurubaran, R.; Sujith, R.I. Dynamics of spray-swirl-acoustics interactions. Int. J. Spray Combust. Dyn. 2011, 3, 1–22. [Google Scholar] [CrossRef] [Green Version]
- Christou, T.; Stelzner, B.; Zarzalis, N. Influence of an oscillating airflow on the prefilming airblast atomization process. At. Sprays 2021, 31, 1–14. [Google Scholar] [CrossRef]
- Docquier, N.; Candel, S. Combustion control and sensors: A review. Prog. Energy Combust. Sci. 2002, 28, 107–150. [Google Scholar] [CrossRef]
- Hardalupas, Y.; Orain, M. Local measurements of the time-dependent heat release rate and equivalence ratio using chemiluminescent emission from a flame. Combust. Flame 2004, 139, 188–207. [Google Scholar] [CrossRef]
- Muruganandam, T.M.; Kim, B.H.; Morrell, M.R.; Nori, V.; Patel, M.; Romig, B.W.; Seitzman, J.M. Optical equivalence ratio sensors for gas turbine combustors. Proc. Combust. Inst. 2005, 30, 1601–1609. [Google Scholar] [CrossRef]
- Panoutsos, C.S.; Hardalupas, Y.; Taylor, A.M. Numerical evaluation of equivalence ratio measurement using OH* and CH* chemiluminescence in premixed and non-premixed methane-air flames. Combust. Flame 2009, 156, 273–291. [Google Scholar] [CrossRef] [Green Version]
- Kathrotia, T.; Riedel, U.; Seipel, A.; Moshammer, K.; Brockhinke, A. Experimental and numerical study of chemiluminescent species in low-pressure flames. Appl. Phys. B Lasers Opt. 2012, 107, 571–584. [Google Scholar] [CrossRef] [Green Version]
- Kojima, J.; Ikeda, Y.; Nakajima, T. Spatially resolved measurement of OH*, CH*, and C2* chemiluminescence in the reaction zone of laminar methane/air premixed flames. Proc. Combust. Inst. 2000, 28, 1757–1764. [Google Scholar] [CrossRef]
- Kojima, J.; Ikeda, Y.; Nakajima, T. Basic aspects of OH(A), CH(A), and C2(d) chemiluminescence in the reaction zone of laminar methane-air premixed flames. Combust. Flame 2005, 140, 34–45. [Google Scholar] [CrossRef]
- Orain, M.; Hardalupas, Y. Measurements of local mixture fraction of reacting mixture in swirl-stabilised natural gas-fuelled burners. Appl. Phys. Lasers Opt. 2011, 105, 435–449. [Google Scholar] [CrossRef]
- García-Armingol, T.; Ballester, J.; Smolarz, A. Chemiluminescence-based sensing of flame stoichiometry: Influence of the measurement method. Meas. J. Int. Meas. Confed. 2013, 46, 3084–3097. [Google Scholar] [CrossRef]
- Najm, H.N.; Paul, P.H.; Mueller, C.J.; Wyckoff, P.S. On the adequacy of certain experimental observables as measurements of flame burning rate. Combust. Flame 1998, 113, 312–332. [Google Scholar] [CrossRef]
- Nori, V.N. Modeling and Analysis of Chemiluminescence Sensing for Syngas, Methane and jet-a Combustion. Ph.D. Thesis, Georgia Institute of Technology, Atlanta, GA, USA, 2008. [Google Scholar]
- Kathrotia, T.; Riedel, U.; Warnatz, J. A numerical study on the relation of OH*, CH*, and C2* chemiluminescence and heat release in premixed methane flames. In Proceedings of the European Combustion Meeting, Vienna, Austria, 14–17 April 2009. [Google Scholar]
- Samaniego, J.M.; Egolfopoulos, F.N.; Bowman, C.T. CO2* chemiluminescence in premixed flames. Combust. Sci. Technol. 1995, 109, 183–203. [Google Scholar] [CrossRef]
- Yi, T.; Santavicca, D.A. Flame spectra of a turbulent liquid-fueled swirl-stabilized lean-direct injection combustor. J. Propuls. Power 2009, 25, 1058–1067. [Google Scholar] [CrossRef]
- Lee, H.; Seo, S. Experimental study on spectral characteristics of kerosene swirl combustion. Procedia Eng. 2015, 99, 304–312. [Google Scholar] [CrossRef] [Green Version]
- Józsa, V.; Kun-Balog, A. Spectroscopic analysis of crude rapeseed oil flame. Fuel Process. Technol. 2015, 139, 61–66. [Google Scholar] [CrossRef] [Green Version]
- Lauer, M. Determination of the Heat Release Distribution in Turbulent Flames by Chemiluminescence Imaging. Ph.D. Thesis, Technical University of Munich, Munich, Germany, 2011. [Google Scholar]
- Vogel, M.; Bachfischer, M.; Kaufmann, J.; Sattelmayer, T. Experimental investigation of equivalence ratio fluctuations in a lean premixed kerosene combustor. Exp. Fluids 2021, 62, 1–14. [Google Scholar] [CrossRef]
- Sangl, J.; Mayer, C.; Sattelmayer, T. Dynamic adaptation of aerodynamic flame stabilization of a premix swirl burner to fuel reactivity using fuel momentum. J. Eng. Gas Turbines Power 2011, 133, 071501. [Google Scholar] [CrossRef]
- Bade, S.; Wagner, M.; Hirsch, C.; Sattelmayer, T.; Schuermans, B. Design for thermo-acoustic stability: Modeling of burner and flame dynamics. J. Eng. Gas Turbines Power 2013, 135, 111502. [Google Scholar] [CrossRef]
- Ashgriz, N. Handbook of Atomization and Sprays: Theory and Applications; Springer: New York, NY, USA, 2011. [Google Scholar]
- Eckstein, J. On the Mechanisms of Combustion Driven Low-Frequency Oscillations in Aero-Engines. Ph.D. Thesis, Technical University of Munich, Munich, Germany, 2004. [Google Scholar]
- Stadlmair, N.V. Influence of Water Injection on the Thermoacoustic Stability of a Lean-Premixed Combustor. Ph.D. Thesis, Technical University of Munich, Munich, Germany, 2018. [Google Scholar]
- Reader, J.; Sansonetti, C.J.; Bridges, J.M. Irradiances of spectral lines in mercury pencil lamps. Appl. Opt. 1996, 35, 78–83. [Google Scholar] [CrossRef] [PubMed]
- John, R.R.; Summerfield, M. Effect of turbulence on radiation intensity from propane-air flames. J. Jet Propuls. 1957, 27, 169–175. [Google Scholar] [CrossRef]
- Dribinski, V.; Ossadtchi, A.; Mandelshtam, V.A.; Reisler, H. Reconstruction of abel-transformable images: The gaussian basis-set expansion abel transform method. Rev. Sci. Instrum. 2002, 73, 2634. [Google Scholar] [CrossRef] [Green Version]
- Hickstein, D.D.; Gibson, S.T.; Yurchak, R.; Das, D.D.; Ryazanov, M. A direct comparison of high-speed methods for the numerical Abel transform. Rev. Sci. Instrum. 2019, 90, 065115. [Google Scholar] [CrossRef] [PubMed]
- Bobusch, B.C.; Cosic, B.; Moeck, J.P.; Paschereit, C.O. Optical measurement of local and global transfer functions for equivalence ratio fluctuations in a turbulent swirl flame. In Proceedings of the ASME Turbo Expo, San Antonio, TX, USA, 3–7 June 2013. [Google Scholar]
- Klarmann, N.E. Modeling Turbulent Combustion and CO Emissions in Partially-Premixed Conditions Considering Flame Stretch and Heat Loss. Ph.D. Thesis, Technical University of Munich, Munich, Germany, 2019. [Google Scholar]
Publisher’s Note: MDPI stays neutral with regard to jurisdictional claims in published maps and institutional affiliations. |
© 2022 by the authors. Licensee MDPI, Basel, Switzerland. This article is an open access article distributed under the terms and conditions of the Creative Commons Attribution (CC BY) license (https://creativecommons.org/licenses/by/4.0/).