Abstract
Recently, the trend towards sustainable energy production and pollution control has motivated the increased consumption of ultra-low-sulfur diesel (ULSD) or bio-fuels. Such fuels have relatively low surface tension with water and therefore, the separation of water from fuel has become a challenging problem. The separation process relies on using porous structures for the collection and removal of water droplets. Hence, understanding the interaction between water droplets and the separators is vital. The simplest geometry of a separator is the wire mesh screen, which is used in many modern water–diesel separators. Thus, it is considered here for systematic study. In this work, pore-scale computational fluid dynamics (CFD) simulations were performed using OpenFOAM® (an open-source C++ toolbox for fluid dynamics simulations) coupled with a new accurate scheme for the computation of the surface tension force. First, two validation test cases were performed and compared to experimental observations in corresponding bubble-point tests. Second, in order to describe the interaction between water droplets and wire mesh screens, the simulations were performed with different parameters: mean diesel velocity, open area ratio, fiber radii, Young–Laplace contact angle, and the droplet radius. New correlations were obtained which describe the average reduction of open surface area (clogging), the pressure drop, and retention criteria.
1. Introduction
Liquid–liquid or liquid–gas separation processes are vital for many applications such as power generators, hydraulic lines, solvent extraction, and aerosol separation. In the special case of diesel fuel, the trend towards a sustainable fuel production and the reduction of hazardous emissions leads to an increasing usage of ultra-low-sulfur diesel (ULSD) and bio-diesel. Such fuels have a low surface tension in contact with water (droplets). Consequently, the dynamics of emulsions of water droplets in diesel have great importance on the overall performance of the separation process [1]. In general, the process of water–diesel separation contains four components: solid particles, water droplets, ambient fluid (diesel), and the surface of the separator (solid). The present work focuses on the interactions between water, diesel, and the wire mesh screen.
The macroscopic behavior of a separator is defined in terms of separation efficiency and the overall pressure drop. Different macroscopic models for the filtration of solid particles are found in the literature either based on empirical correlations [2,3,4,5,6] or mathematical modeling of the transport as a convection–diffusion equation [7,8]. For liquid contaminants, the majority of the experimental investigations in the literature considered viscous droplets (water or silicone oil) in air. Kulkarni et al. [9] studied the effects of wettability on the separation of water from oil. The separator was made of multilayers: hydrophobic and hydrophilic. It was found that when the number of the hydrophobic layers is 3 to 10 times the number of hydrophilic layers, the separation efficiency is optimal. Chase et al. [10] studied the effect of fibrous media on the separation efficiency by combining two types of fibers: microglass and electrospun polypropylene (PP) fibers. The PP fibers had a mean radius less than 1 μm, which increased the hydrophobicity and the overall separation efficiency. Chase and Patel [11] showed that fibrous structures created from electrospun PP fibers can successfully be used for the separation of water from ULSD. Lu et al. [12] studied the effect of the droplet size distribution on the separation efficiency of water emulsion from oil. Moreover, they showed that the decrease of the mean fiber radii increased the separation efficiency. Kampa et al. [13] showed that non-wettable materials lead to less pressure drop in comparison to wettable materials for oil mist filtration.
Although macroscopic (collective) models are successful in describing the evolution of the pressure drop and the distribution of bubbles or particles [14,15,16,17], they require closure relationships. For the problem of liquid–liquid separation, closure relationships model different interactions on the microscopic level. Because of the drag force of the carrier fluid (diesel), the droplet is spread on the surface of the separator and it takes the shape of a spherical cap. In turn, more open surface (area) of the wire mesh screen is blocked and the pressure drop is increased. At a threshold value of the pressure drop, the surface tension force is less than the drag force. Above this threshold, the droplet is pushed through the mesh and flows downstream. When the droplet is released, the open area of the mesh increases again and the pressure drop is reduced. The contact angle of a droplet on a fibrous structure or textures is not unique, which is called hysteresis of contact angle [18,19,20,21]. It has been found that the increase of surface roughness increases the hydrophobicity of the fibrous structure [22]. The surface energy minimization approach has been successful in the prediction and computation of the shape of droplets on different textures [23,24,25,26,27,28]. Tafreshi et al. [29] experimentally and numerically studied the wetting of ferrofluid droplets on fibrous mats. The effect of the number of fibrous layers was investigated. They used the numerical surface energy minimization approach implemented in a software called Surface Evolver (SE) [30].
Lorenceau et al. [31] studied the capture criteria of a single droplet by a single fiber. They used droplets of silicone-oil and water, falling eccentrically on a thin cylindrical fiber. In [32,33], the effect of the relative distance between the droplet and the fiber on the capture criteria was studied and quantified. In [34,35], the eccentric impact of a droplet on a flexible fiber was studied. It was seen that the flexibility of the fibers increases the capturing efficiency with respect to the droplet velocity.
On the other hand, numerical methods and in particular pore-scale simulations of two-phase flows showed an accurate computation of the flow fields in porous media [36,37,38,39,40]. Kuipers et al. [41] simulated the impact of a droplet on a wettable fibrous structure using the volume of fluid method (VoF) [42] coupled with the immersed boundary method (IBM) [43]. Despite the VoF method being applied and validated in the application of modeling two-phase flow in porous media, it produces non-physical velocities at the interface called “spurious currents” [39,44,45,46]. In the particular case of water–diesel separation, the process is capillary-dominated. An accurate computation of the curvature field leads to a significant reduction of the order of magnitude of spurious currents, as was demonstrated in [47].
The existing literature lacks a systematic analysis of the interaction between a single water droplet and the separator. Hence, a macroscopic model capable of taking into account different physical interactions cannot be formulated. In this work, the focus is on studying the interaction between a single water droplet and a hydrophobic idealized wire mesh screen in diesel. The fluids used in this study (in the experiments and the numerical simulations) are considered to be Newtonian. Moreover, the computation of the surface tension force were validated by comparison to experimental measurements. A bubble point test [48,49] was performed to determine the bubble pressure of two samples of plain weaves. In the presented experiments, the wire mesh screen was saturated with glycerol. Air was injected until a stream of air bubbles was observed, which determined the bubble point test pressure (threshold pressure).
This article is organized as follows: the next section is devoted to the materials and the methods: (a) mathematical model and the corresponding numerical details and (b) experimental setup for the bubble point test. In the third section, the measurements, the CFD results, and the corresponding models are discussed. It is divided into two subsections. In the first subsection, the experimental and numerical results of the bubble point test are compared to each other. In the second subsection, the special case of a single droplet single fiber interaction and the interaction between a single water droplet and an idealized wire mesh screen in diesel are discussed. Three closure relationships were found, which describe the spreading of the droplet on the separator, the pressure drop, and the condition for the breakthrough. The fourth section is devoted to the summary and conclusions.
2. Materials and Methods
2.1. Mathematical Model
The volume of fluid method (VoF), as described in [42], is a robust approach for the simulation of two-phase flow by incorporating a function for the volume fraction. The two phases are indexed by (primary phase) and (secondary phase). Both phases (the primary and the secondary) are Netwonian. The choice of the primary and secondary phase is arbitrary. The volume fraction is defined as the ratio of the volume occupied by the primary fluid () and the volume of the computational cell () as follows:
The transport properties (density and dynamic viscosity ) of the mixture are computed as the arithmetic average of the two phases:
The conservation of the volume fraction is described by
where is the velocity vector. Because of the incompressibility of both fluids, the conservation of mass reads
The conservation of the momentum of the mixture is described by
where is the pressure field, is the gravity vector, and is the surface tension force per unit volume. The surface tension is modeled using the sharp surface force (SSF) model [39] as follows:
where is the mean curvature of the fluid–fluid interface and is the sharp volume fraction. The sharp volume fraction is computed as follows:
where is a numerical parameter to tune the sharpness of the volume fraction. In the presented simulations, was set. The introduction of the sharp surface tension force (Equations (6) and (7)) alone does not guarantee that the surface tension approximation is accurate or robust. So-called spurious currents can still occur. In order to improve this, a novel method was proposed in [47], which showed an accurate computation of the mean curvature. The methods showed significant reduction of spurious currents by at least two orders of magnitude. The method approximates the surface tension force based on the signed distance function Φ. The signed distance function is defined as the signed minimum distance between the computational cells near the fluid–fluid interface and an iso-surface (= 0.5). The unit normal vector to the fluid–fluid interface is computed as the unit gradient of the signed distance function:
The mean curvature [50] at each cell center is computed as follows:
and the Gauss curvature [50] reads:
The principal curvatures at each cell center are:
The principal curvatures [51] of the fluid–fluid interface at the nearest point to each cell are:
The corrected mean curvature reads:
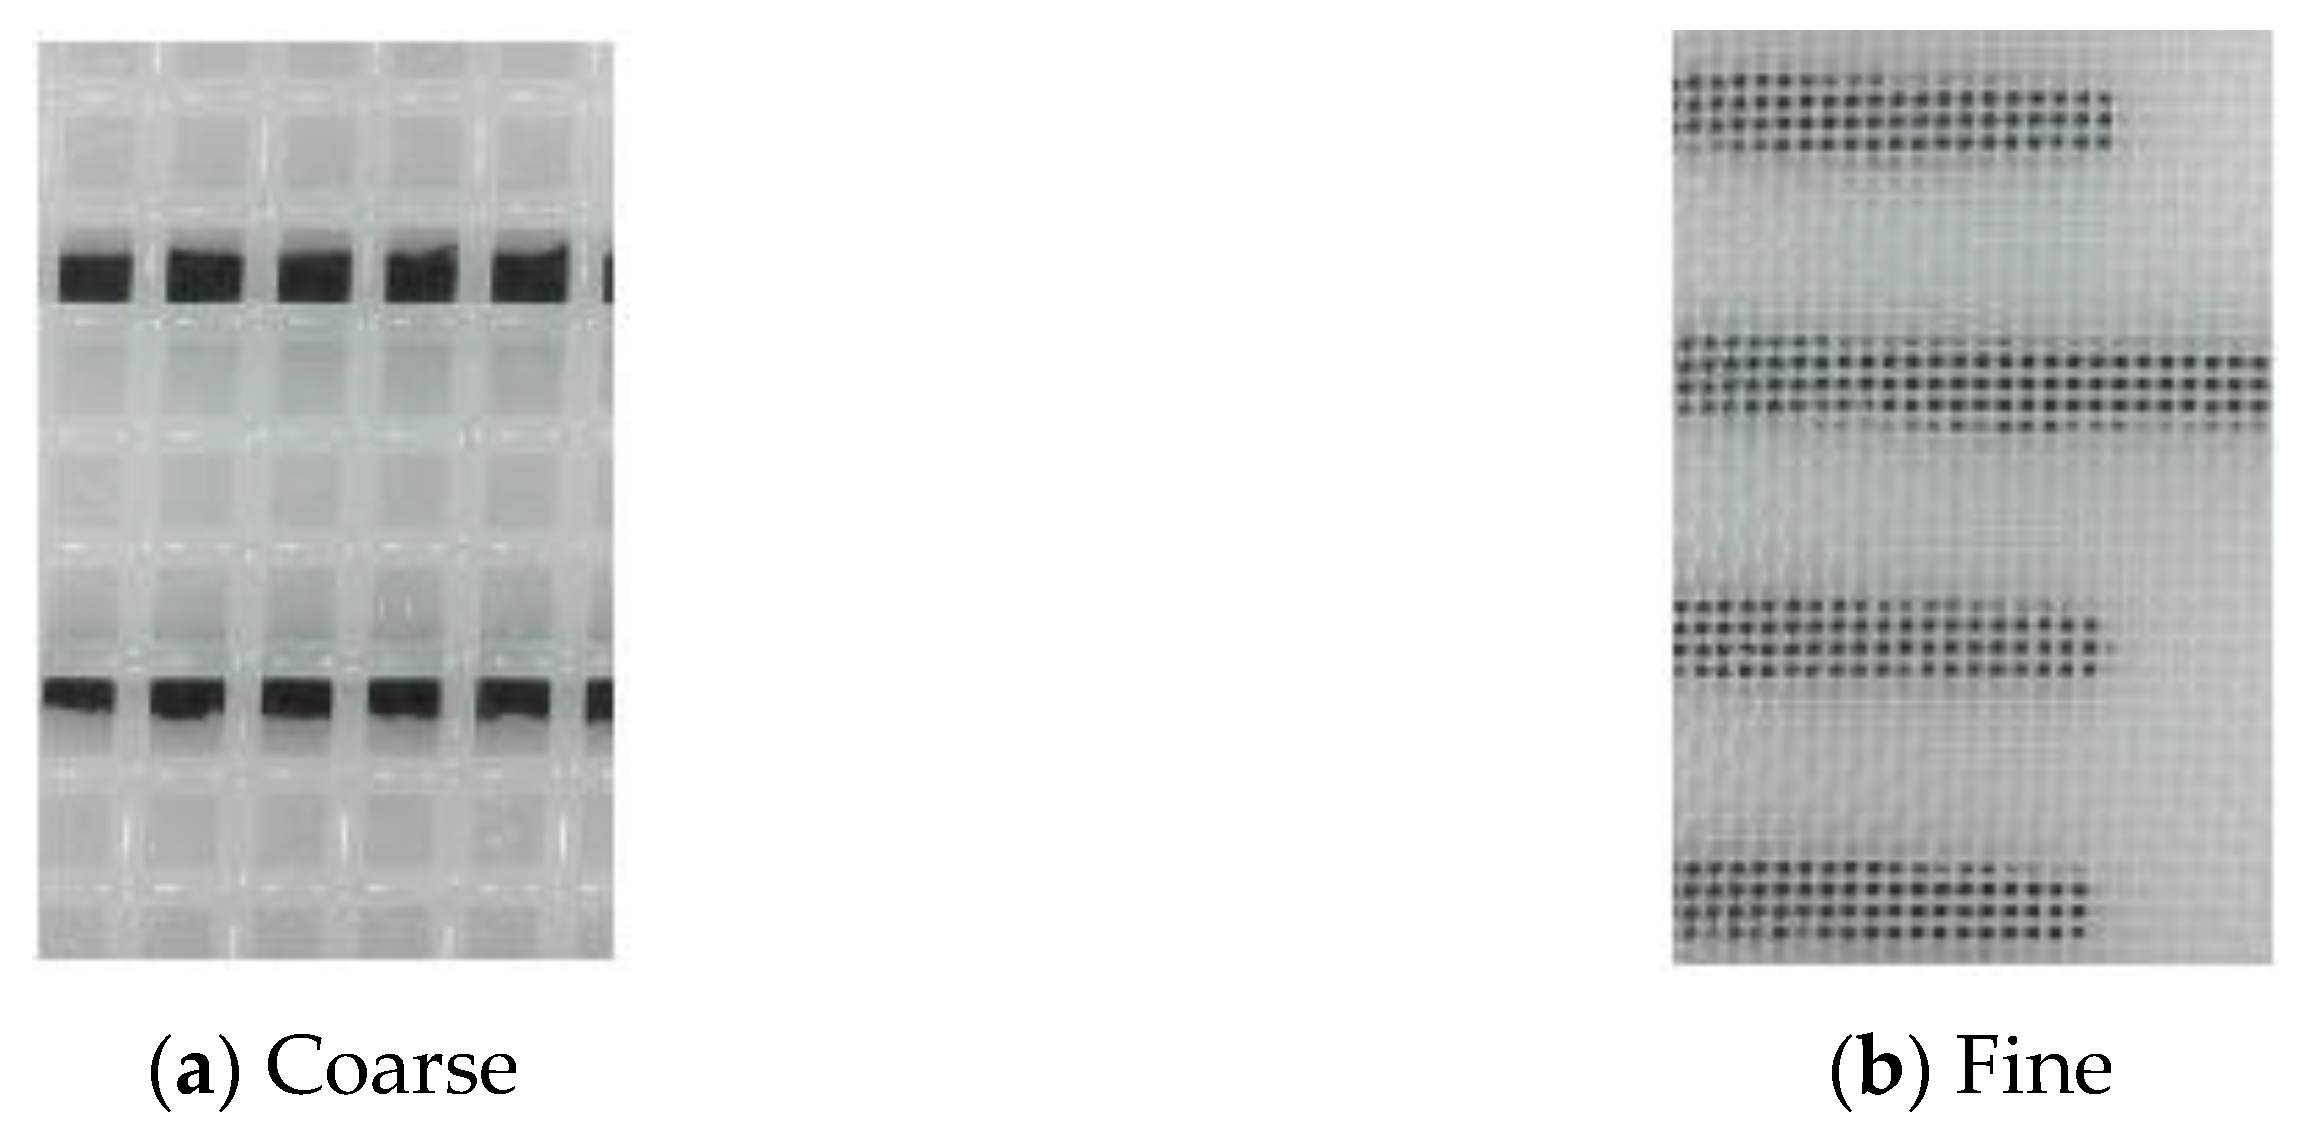
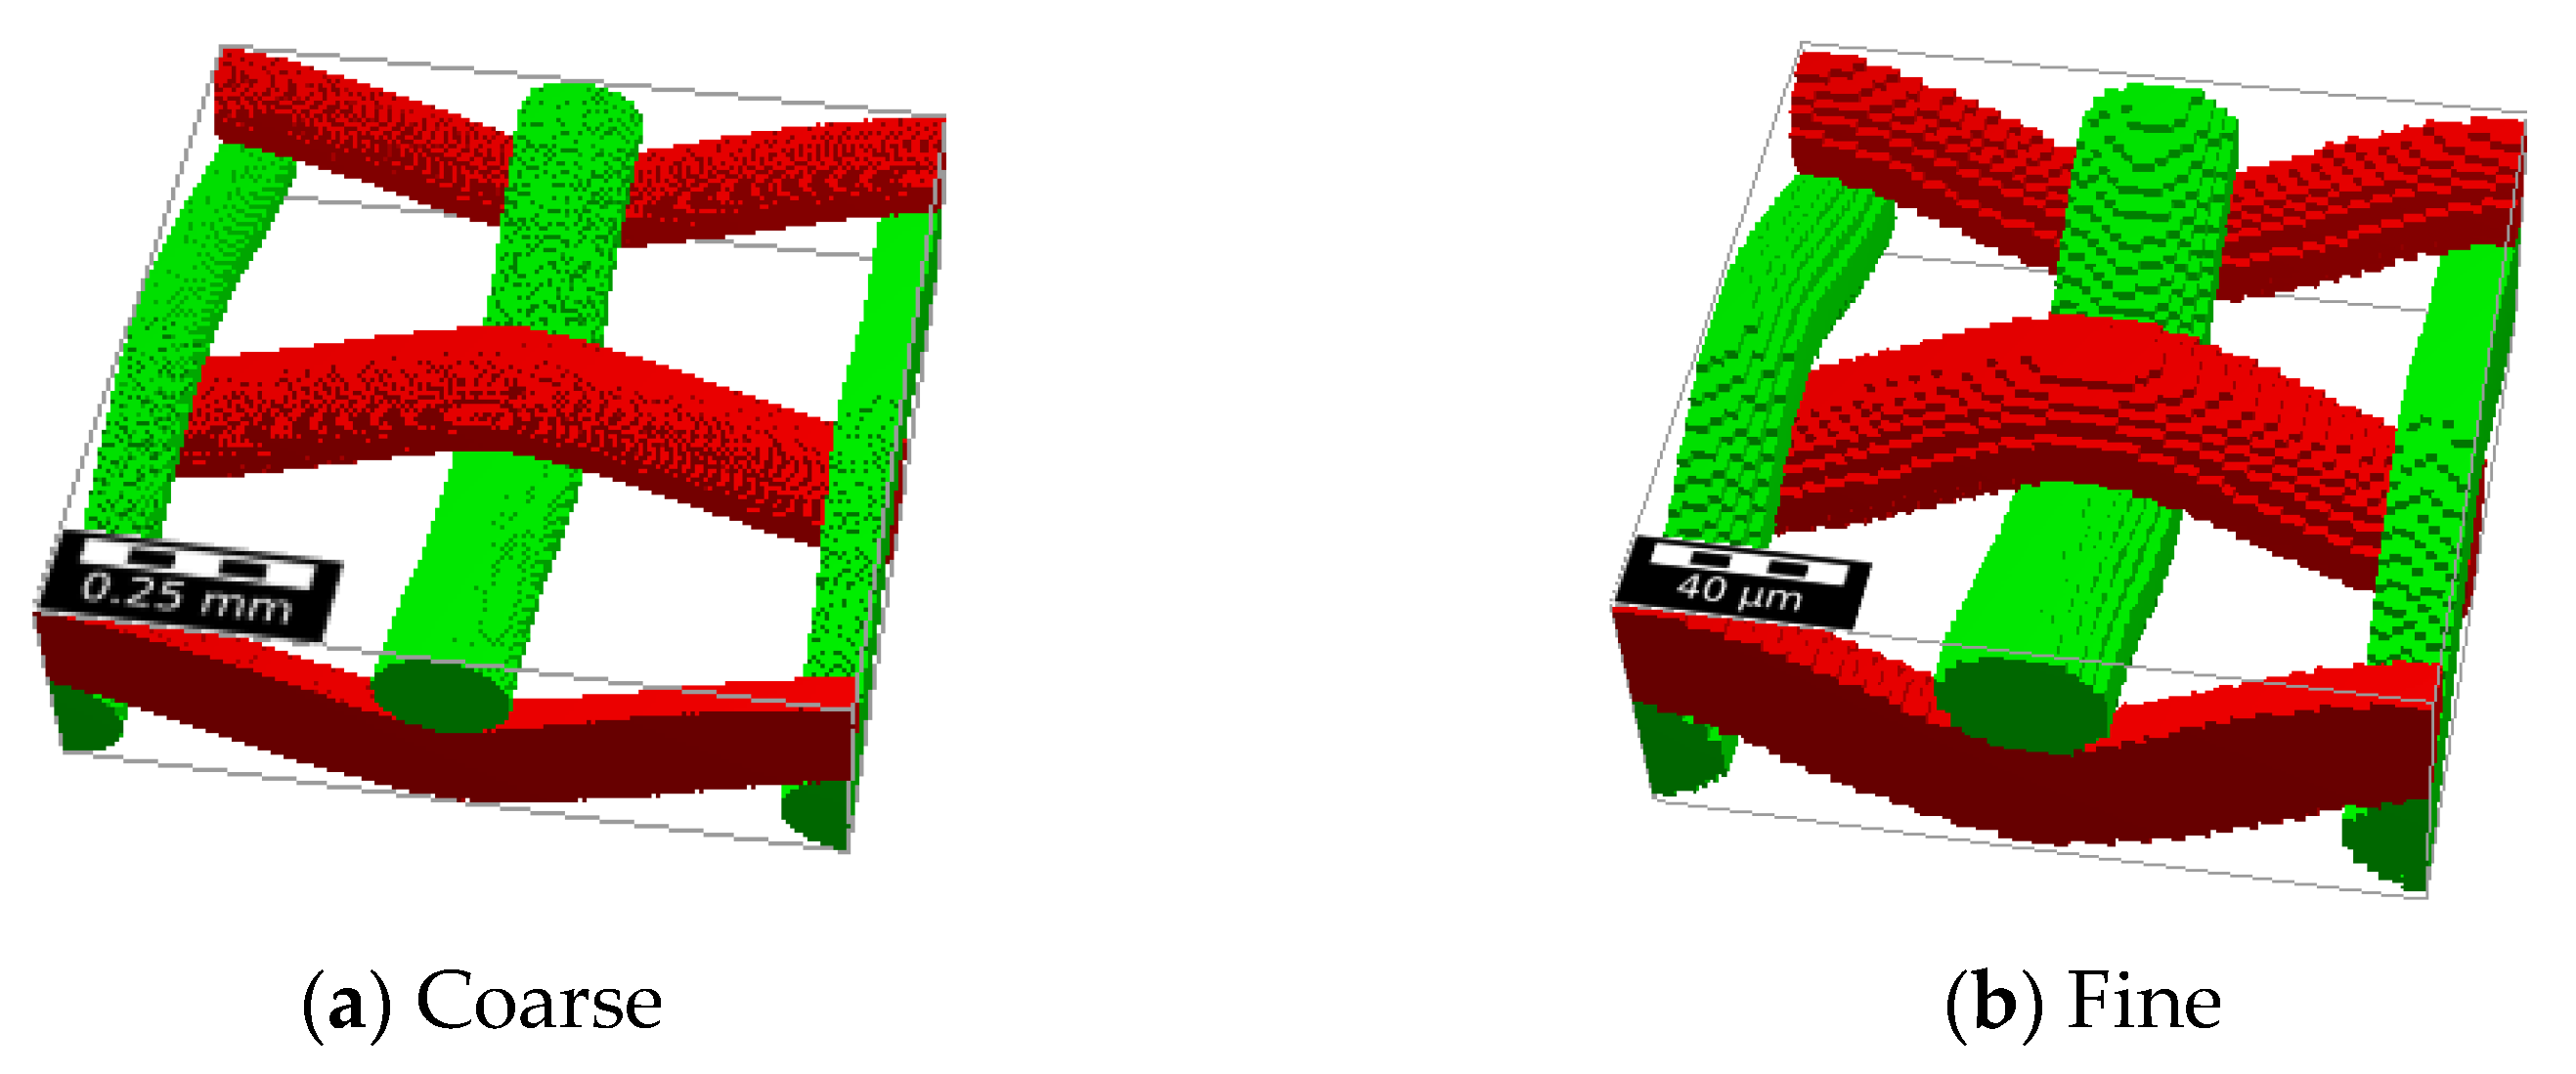
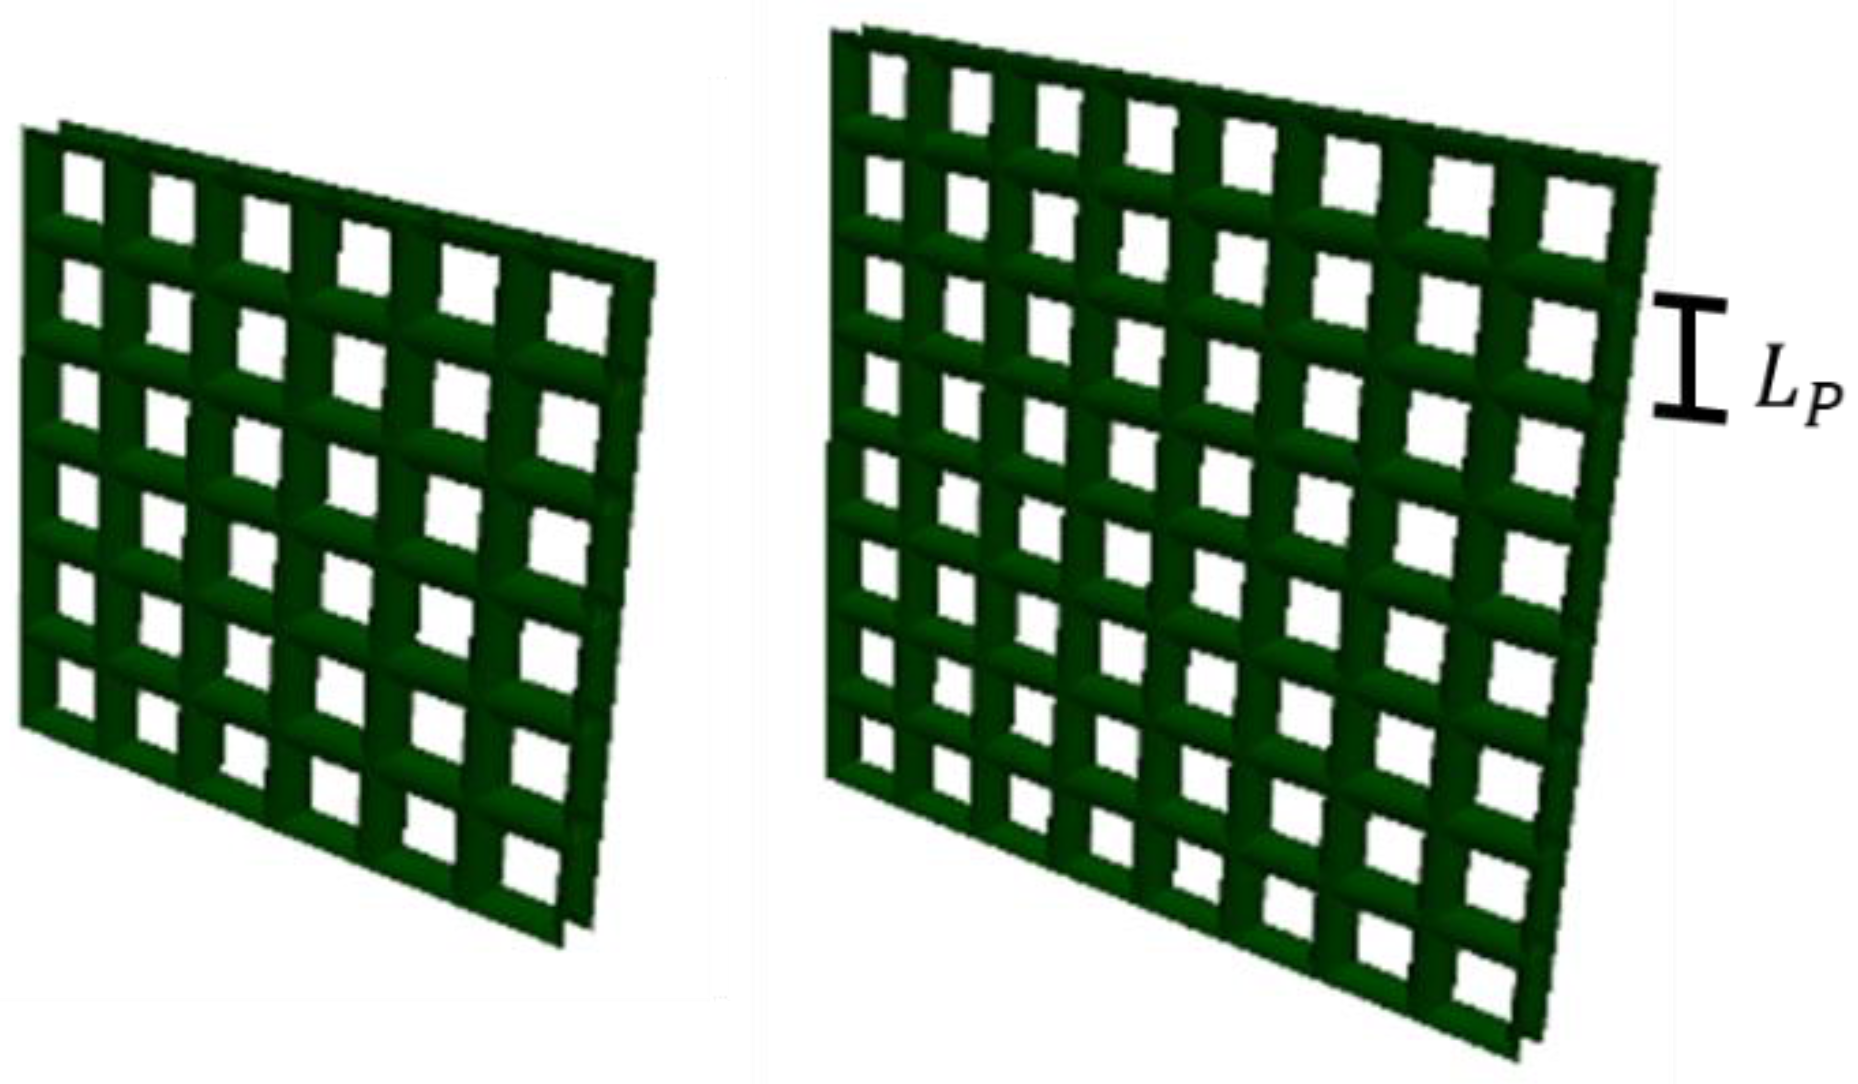
2.2. Geometry and Computational Grids
The bubble point test was performed for two different wire mesh screens. Both screens had a plain weave pattern. The geometry of the wire mesh screen was characterized by the yarn radius, yarn pitch and the total mesh thickness. The mesh with the larger yarn pitch was referred to as ‘coarse’ mesh. The other mesh is referred to as ‘fine’ mesh. The geometric properties of the mesh screens, used in the bubble point test, are given in Table 1.
Table 1.
Geometric properties of the wire mesh screens.
In Figure 1, images of the samples of the wire mesh screens are shown. The images were obtained using a microscope for illustration only. The dimensions of the wire mesh were taken from the manufacturer’s data sheets.
Figure 1.
Samples of the two wire mesh screens used in the bubble point test; (a) coarse and (b) fine. The black bars in the background belong to a millimeter scale.
The computer model of the wire mesh screen was reconstructed using the software GeoDict [52], as shown in Figure 2.
Figure 2.
Computer model of a sample of the (a)coarse and (b)fine screens created by GeoDict [52].
The computational grid was generated using snappyHexMesh, which is an automatic grid generation utility in OpenFOAM. The utility creates unstructured grids made of polyhedra elements. The majority of the computational cells were cubic. The average edge length of the computational cells was 7 μm for the coarse mesh and 0.6 μm for the fine mesh, which was proven to be sufficient in terms of accuracy.
In order to perform a systematic analysis of the interaction between a single water droplet and a wire mesh screen, the special case of the interaction between a single droplet with a single fiber was considered in a stagnant ambient fluid (diesel). A thin long cylinder was placed at the center of a cubic domain. The computational cells were very small near the surface of the cylinder in order to capture the rapid change of the interfacial curvature.
Furthermore, different idealized geometries were used in the simulations of the interaction between a single water droplet and a wire mesh screen in diesel. Each wire mesh screen was assumed to be made of cylindrical fibers. The meshes differed from each other in the fiber radius , number of pores (total size of the domain), yarn pitch , and the open area ratio . The open area ratio was defined as follows:
The geometric properties of the wire mesh screens are given in Table 2. The fibrous structure was generated by orthogonal intersections of the fibers as shown in Figure 3.
Table 2.
Geometric properties of the wire mesh screens.
Figure 3.
Idealized geometry of two wire mesh screens with different total size and open area ratio .
A structured multi-block computational grid was generated using a utility called blockMesh in OpenFOAM [53,54]. An in-house Python script was used to generate the geometry and the corresponding blocks in order to automate the process of grid generation as shown in Figure 4. The number of computational cells between every two fibers was chosen to be 15 cells such that the flow in the pores was fully resolved. The computational cells had aspect ratio of near the upstream boundary of the wire mesh screen and of far away from the regions of significant importance. Since the droplet radius was much larger than the pore length scale, this grid resolution was sufficient to resolve the fluid–fluid interface and the flow inside and outside the droplet.
Figure 4.
Structured multi-block grid for an idealized wire mesh screen.
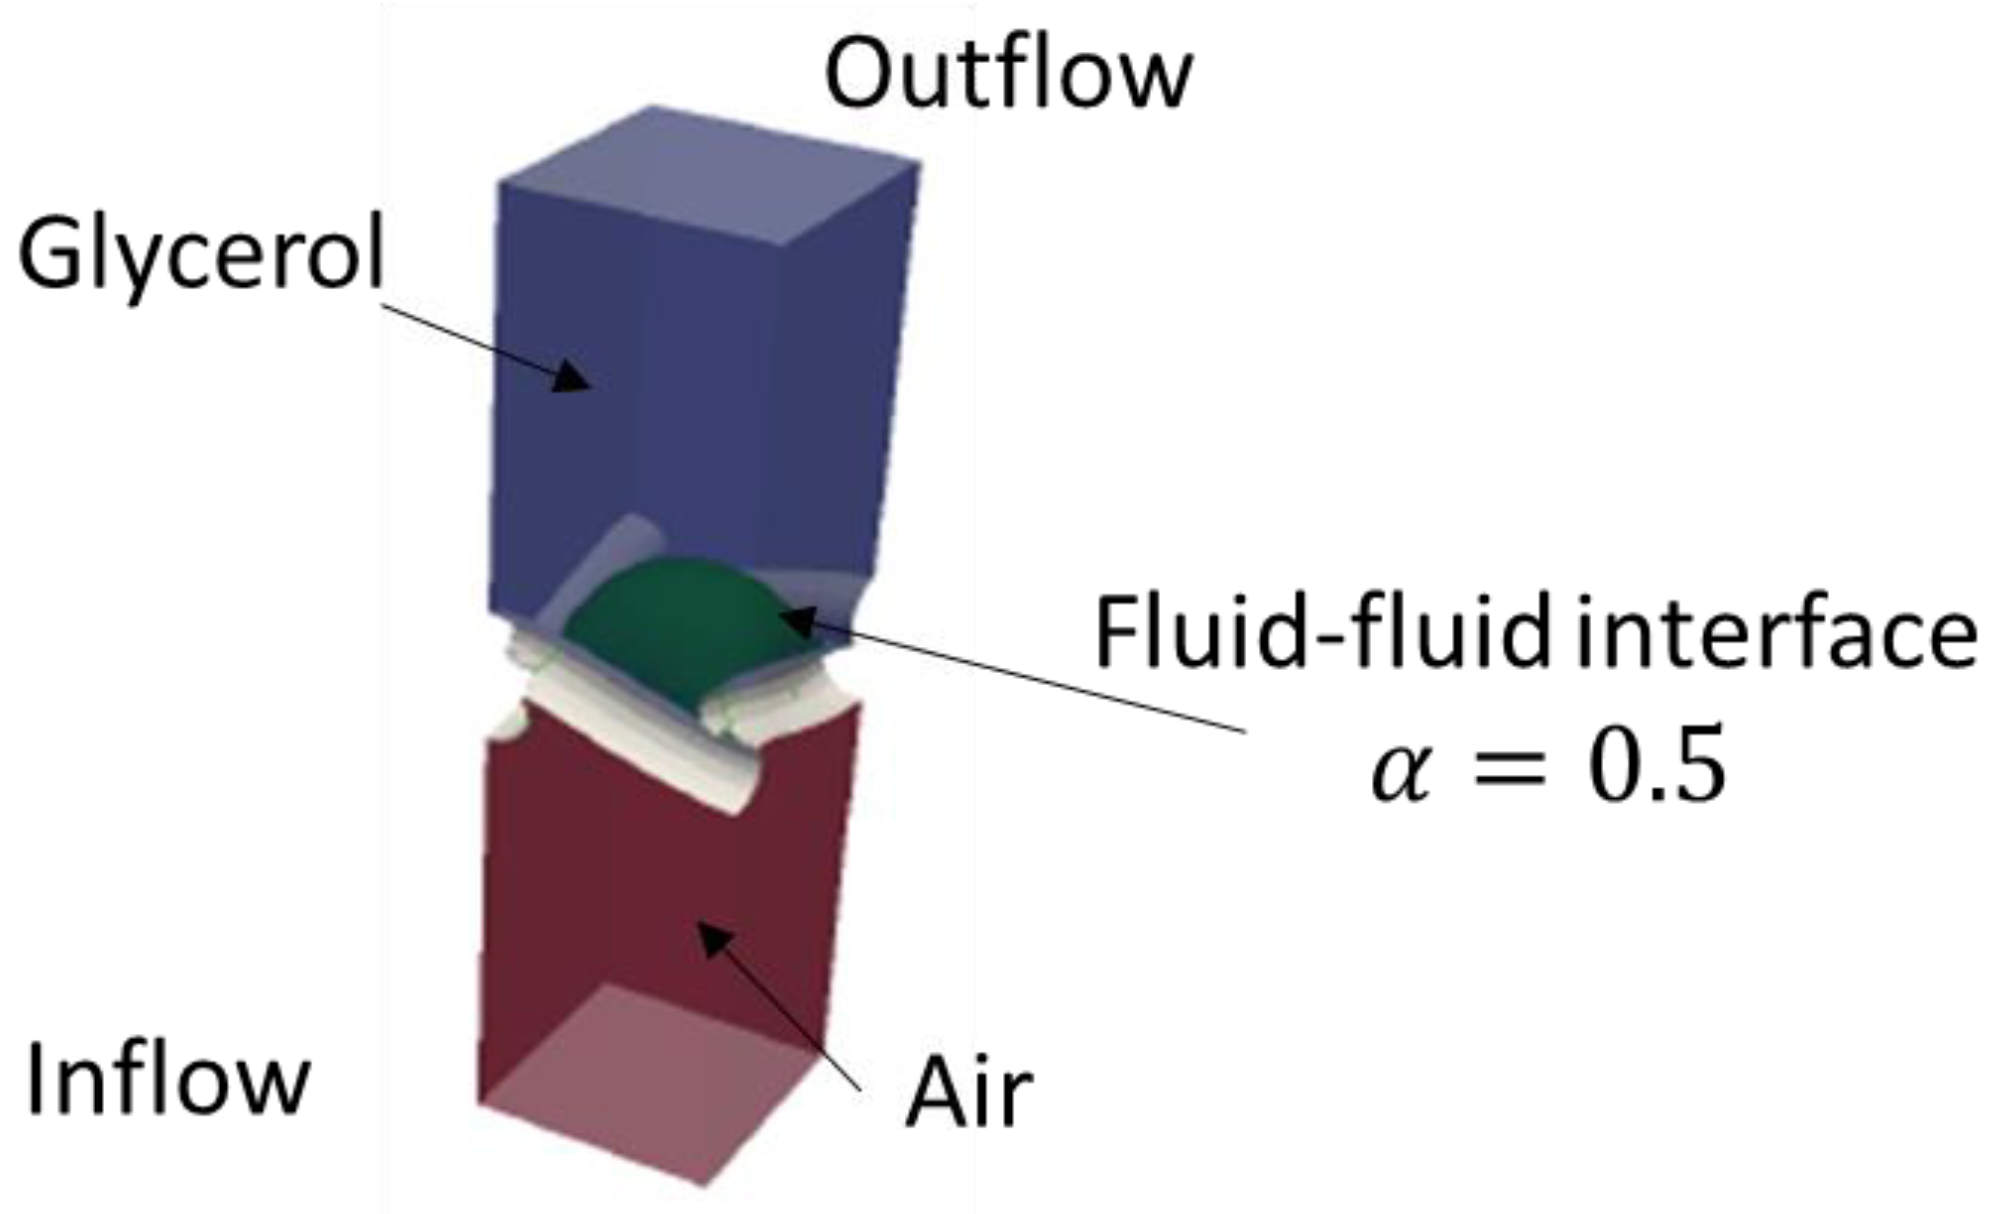
2.3. Initial and Boundary Conditions
2.3.1. Bubble Point Test
The bubble point test was simulated for a single pore as shown in Figure 5. The pressure at the lower boundary was set to a specified value for the differential pressure Δp (Dirichlet boundary condition). At the upper boundary, the pressure value was normalized to 0 Pa. The velocity boundary condition was set to zero flux (Neumann) on both the upper and lower boundary. At the surface of the wire mesh screen, a fixed contact angle condition was imposed using the Young–Laplace contact angle On the side planes, symmetry boundary conditions were imposed. Initially, the domain was filled by two fluids: glycerol in the upper half of the domain and air in the lower half, as shown in Figure 5. As in the real bubble point experiment, the (differential) pressure at the lower boundary was increased gradually until a threshold value was reached, at which the fluid–fluid interface ruptured and the air started to flow through the pores and rise in the computational domain.
Figure 5.
Visualization of the computational domain. Red corresponds to the gas, blue corresponds to the wettable viscous fluid, white corresponds to fibers, and green is the iso-surface defined by the condition = 0.5.
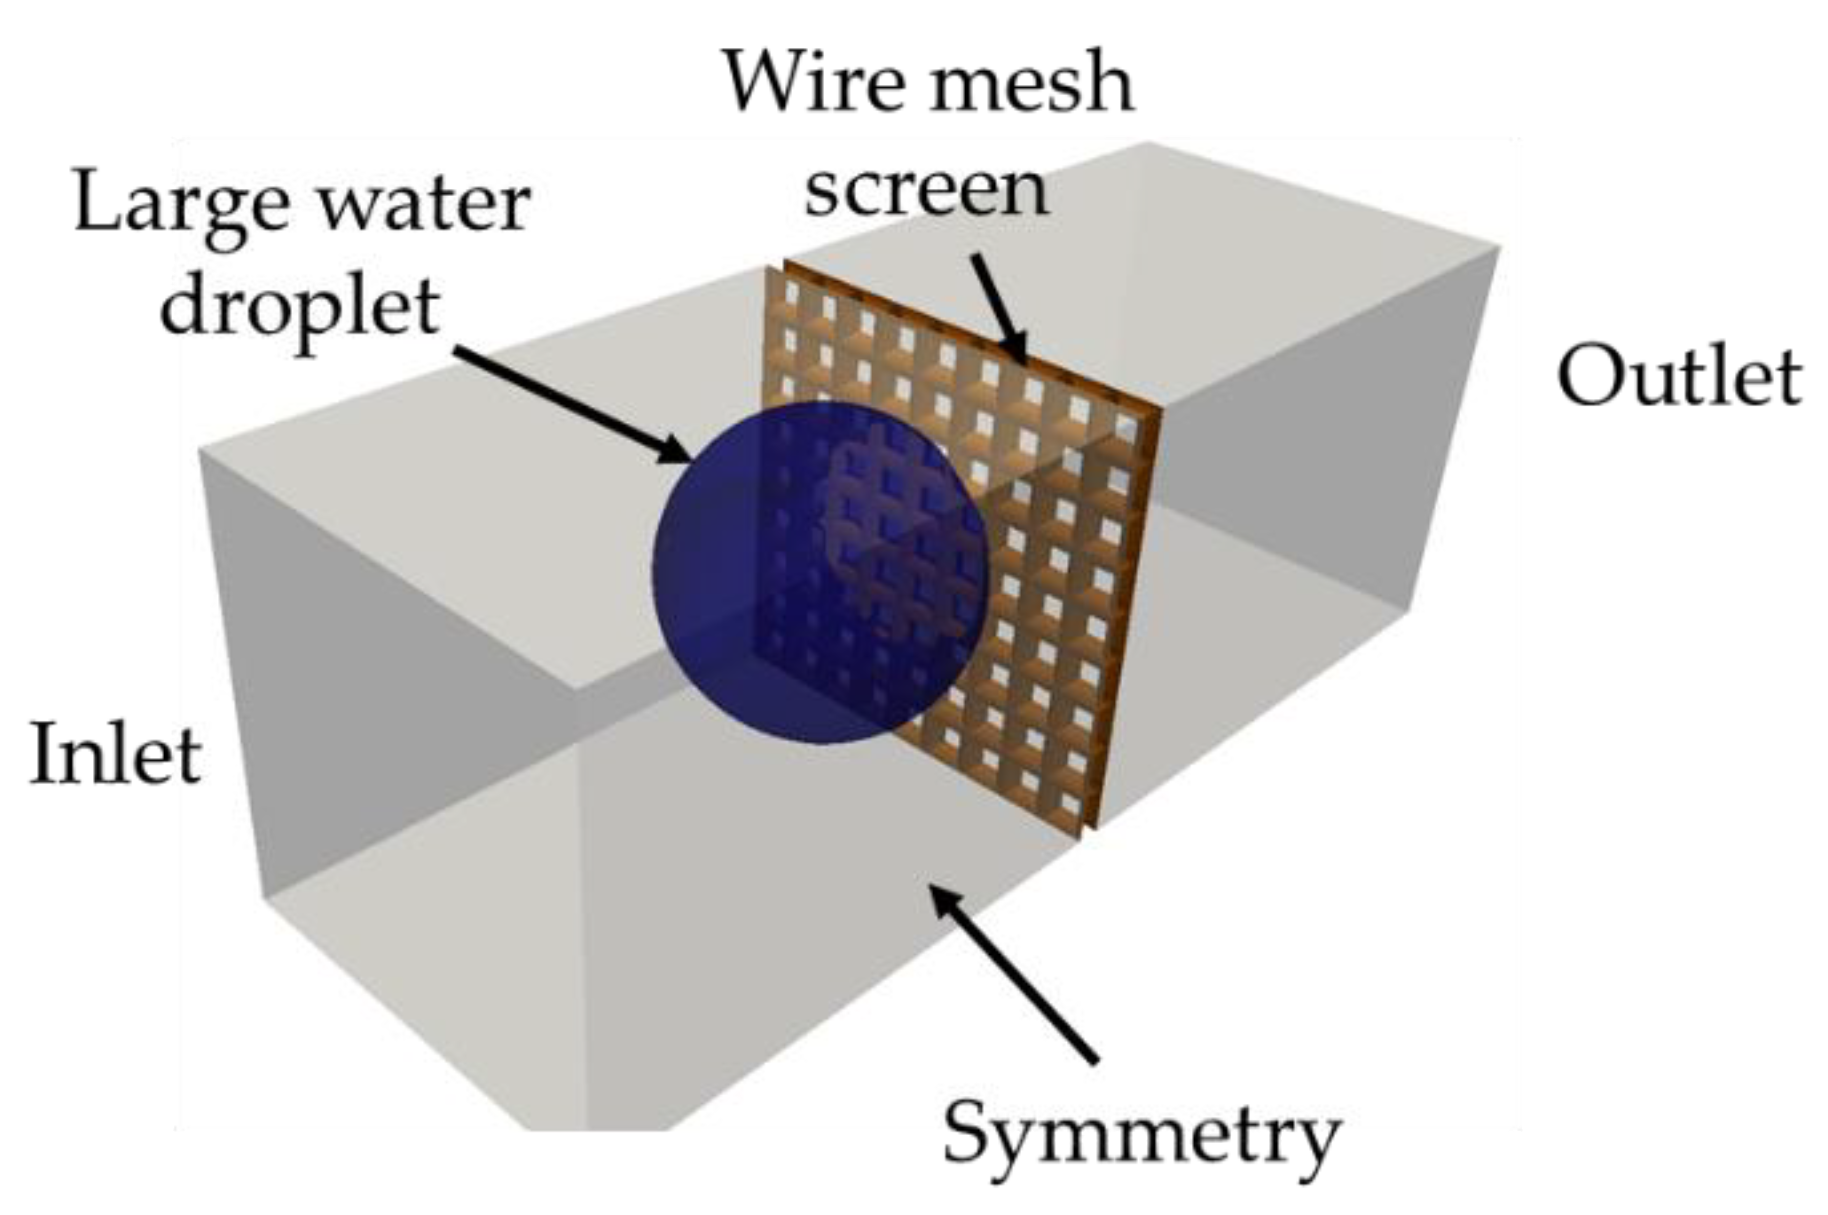
2.3.2. Droplet–Mesh Interaction
In the special case of a single fiber, a perfect spherical droplet was initialized such that it wet few computational cells of the fiber. Because of the contact angle boundary condition imposed on the fiber, the contact line moved and the fluid–fluid interface deformed until an equilibrium was reached. In the present simulations, it was assumed that the single fiber or the wire mesh screen was hydrophobic (. At the inflow (inlet) boundary, the flow velocity was uniformly set to the flow velocity far away from the mesh () and for the pressure, a gradient of zero was prescribed. At the oulflow boundary (outlet), the pressure was uniformly set to zero while a zero-gradient condition was imposed on the velocity. At the boundaries along the flow direction, symmetry boundary conditions for both velocity and pressure were imposed due to the symmetric nature of the geometry.
Second, the interaction between a single water droplet and the wire mesh screen was considered. A spherical water droplet was initialized at a random position upstream to the wire mesh screen. At the inlet, the velocity was set to Dirichlet with a uniform inflow velocity and the pressure was set to Neumann. At the outlet, the pressure was set to Dirichlet and the velocity was set to Neumann. On the side planes, symmetry boundary condition was set. The schematic layout of the domain is shown in Figure 6.
Figure 6.
Computational domain for the simulation of the interaction between a large single droplet and wire mesh screen.
2.4. Discretization Schemes and Solution Control
OpenFOAM uses the finite volume method (FVM) to solve the conservation laws and a co-located grid. A summary of the discretization schemes chosen in the following simulations is given in Table 3. The PISO algorithm [55] was used for the pressure–velocity coupling. The time-step was chosen such that the Courant–Friedrichs–Lewy (CFL) [56] number was less than 0.3. The number of advection sub-cycles for the volume fraction was set to 3 such that each sub-cycle had a corresponding CFL number of 0.1.
Table 3.
Summary of discretization schemes used in the presented simulations.
2.5. Experimental Setup
A clean rectangular sample of the wire mesh screen was prepared by manual cutting using scissors. The sample was . The sample was saturated and covered by glycerol. A capillary flow pore size meter (Topas PSM 165 [58]) was used to measure the pressure drop during the bubble point test. Figure 7 shows the schematic layout of the test rig. The test rig was made of two large hollow cylinders. The sample was placed between the two cylinders, which were locked in place. Manually, a control needle valve was opened gradually to inject air. By increasing the air flowrate, the pressure drop increased. At threshold pressure, a stream of air bubbles was released and detected optically.
Figure 7.
Schematic structure of the porometer test rig.
The relevant material properties of the glycerol are given in Table 4.
Table 4.
Transport properties of the glycerol.
The mesh screen was made of polyethylene terephthalate (PET). Measurement of the contact angle of glycerol on wire mesh screens could not be performed. The Young–Laplace contact angle was assumed to be
3. Results and Discussion
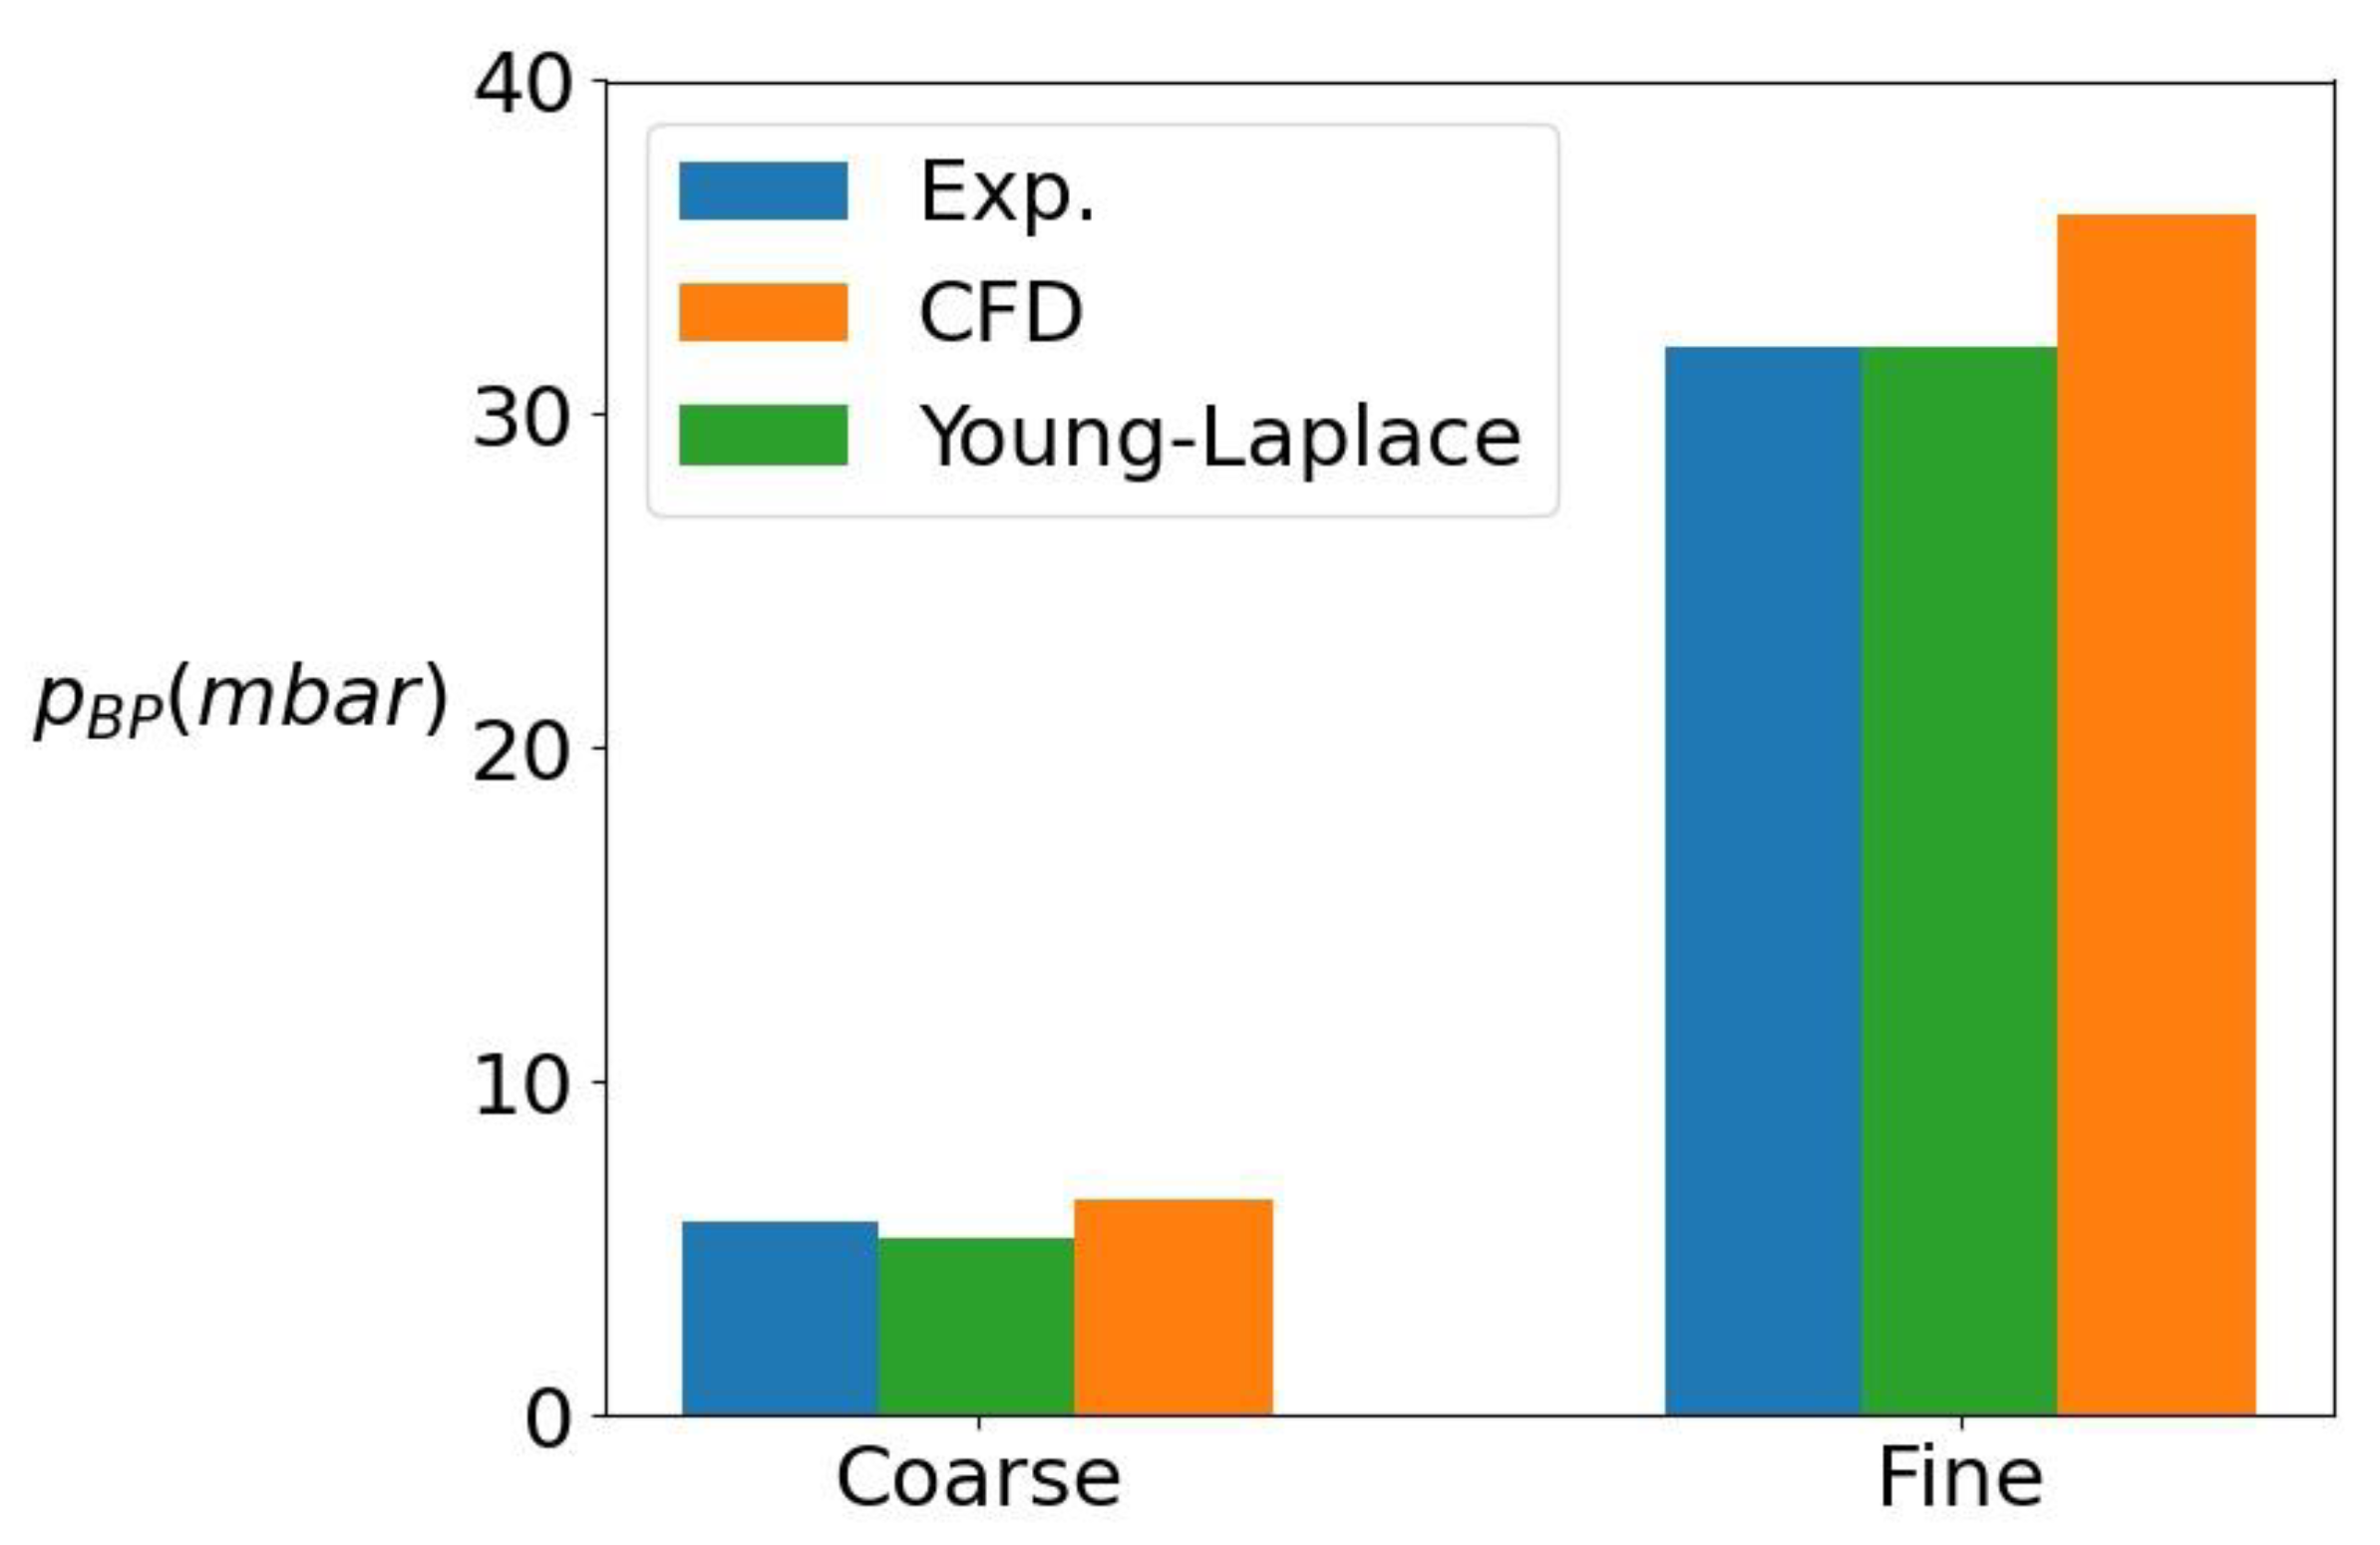
3.1. Bubble Point Test: Validation Case
The bubble point test pressure was the maximum pressure at which the fluid–fluid interface was not ruptured (stable). Figure 8 shows the measurements of the pressure curves during the bubble point test. Each curve represents a single experiment. The pressure dropped rapidly after reaching its threshold value because of the manual control of the needle. The control valve was shut down after noticing the stream of bubbles. In order to ensure that the manual control of the air valve had a negligible effect on the threshold pressure, different measurements were taken. Each curve represents an experiment where the total time to reach the threshold pressure was different. All curves show an upper bound (threshold value). At this value, the glycerol–air interface ruptured and a stream of air bubbles was released. Because of the rupture of the interface, the pressure drop decreased significantly. The upper bound was found to be mbar and mbar for the coarse and the fine mesh, respectively.
Figure 8.
Measurements of the pressure evolution during the bubble point test of two wire mesh screens (a) coarse and (b) fine. The measurements are taken four times for each mesh.
Figure 9 shows the glycerol–air interface simulated at different pressure boundary conditions values. The increase of the pressure resulted in a decrease in the interfacial curvature. At a certain threshold value, the inflated interface collided with the symmetry boundaries followed by rupture of the interface. From CFD simulations, the threshold pressure was found to be be and for the coarse and the fine mesh, respectively.
Figure 9.
Shape of the glycerol–air interface (green) at different pressure boundary conditions (values).
The basic model to describe the bubble point test was the approximated Young–Laplace equation for a simplified pore structure:
where is an empirical correction coefficient [48] which takes into account the mesh hole geometry which deviates significantly from cylinderical pores. For both the coarse and the fine mesh screen, the previous experimental measurements agreed well with both numerical simulations and the simplified Young–Laplace equation using . Figure 10 shows a comparison of the threshold pressure obtained from the experimental measurement, numerical simulations of a single pore, and the approximated Young–Laplace equation (Equation (15)).
Figure 10.
Comparison between the threshold pressure obtained from the approximated Young–Laplace equation, experimental measurement, and CFD simulations.
The relative deviation of the threshold pressure using VoF simulations was evaluated with respect to the experimental measurements as follows:
The relative errors between the CFD simulations and the experimental measurements were 12% and 11% for the coarse and the fine screen, respectively. The agreement is considered to be good, due to the deformations on the pore structure and the deviation between the computer model and the real mesh. Thus, VoF simulations can be used to predict the bubble point test pressure of wire mesh screens.
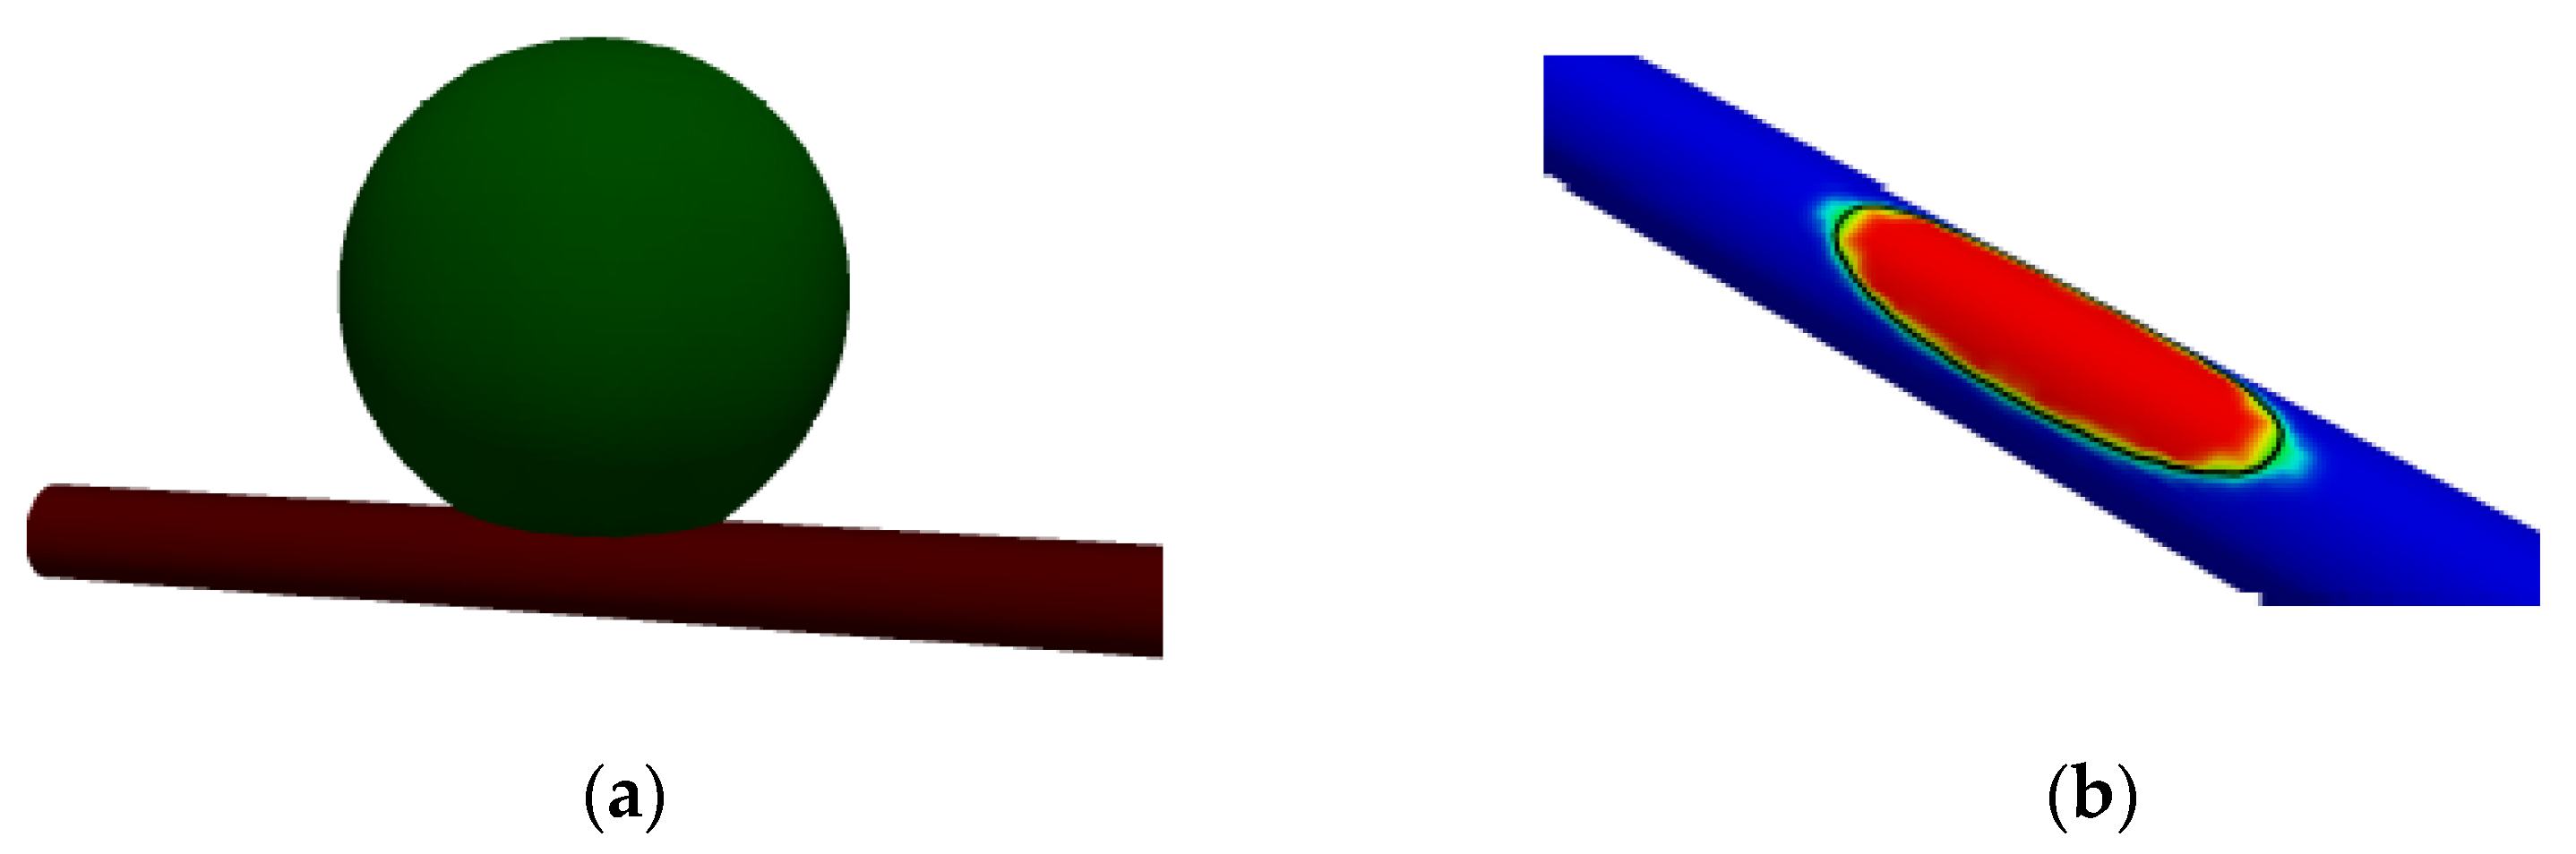
3.2. Single Water Droplet Interaction with Wire Mesh Screen
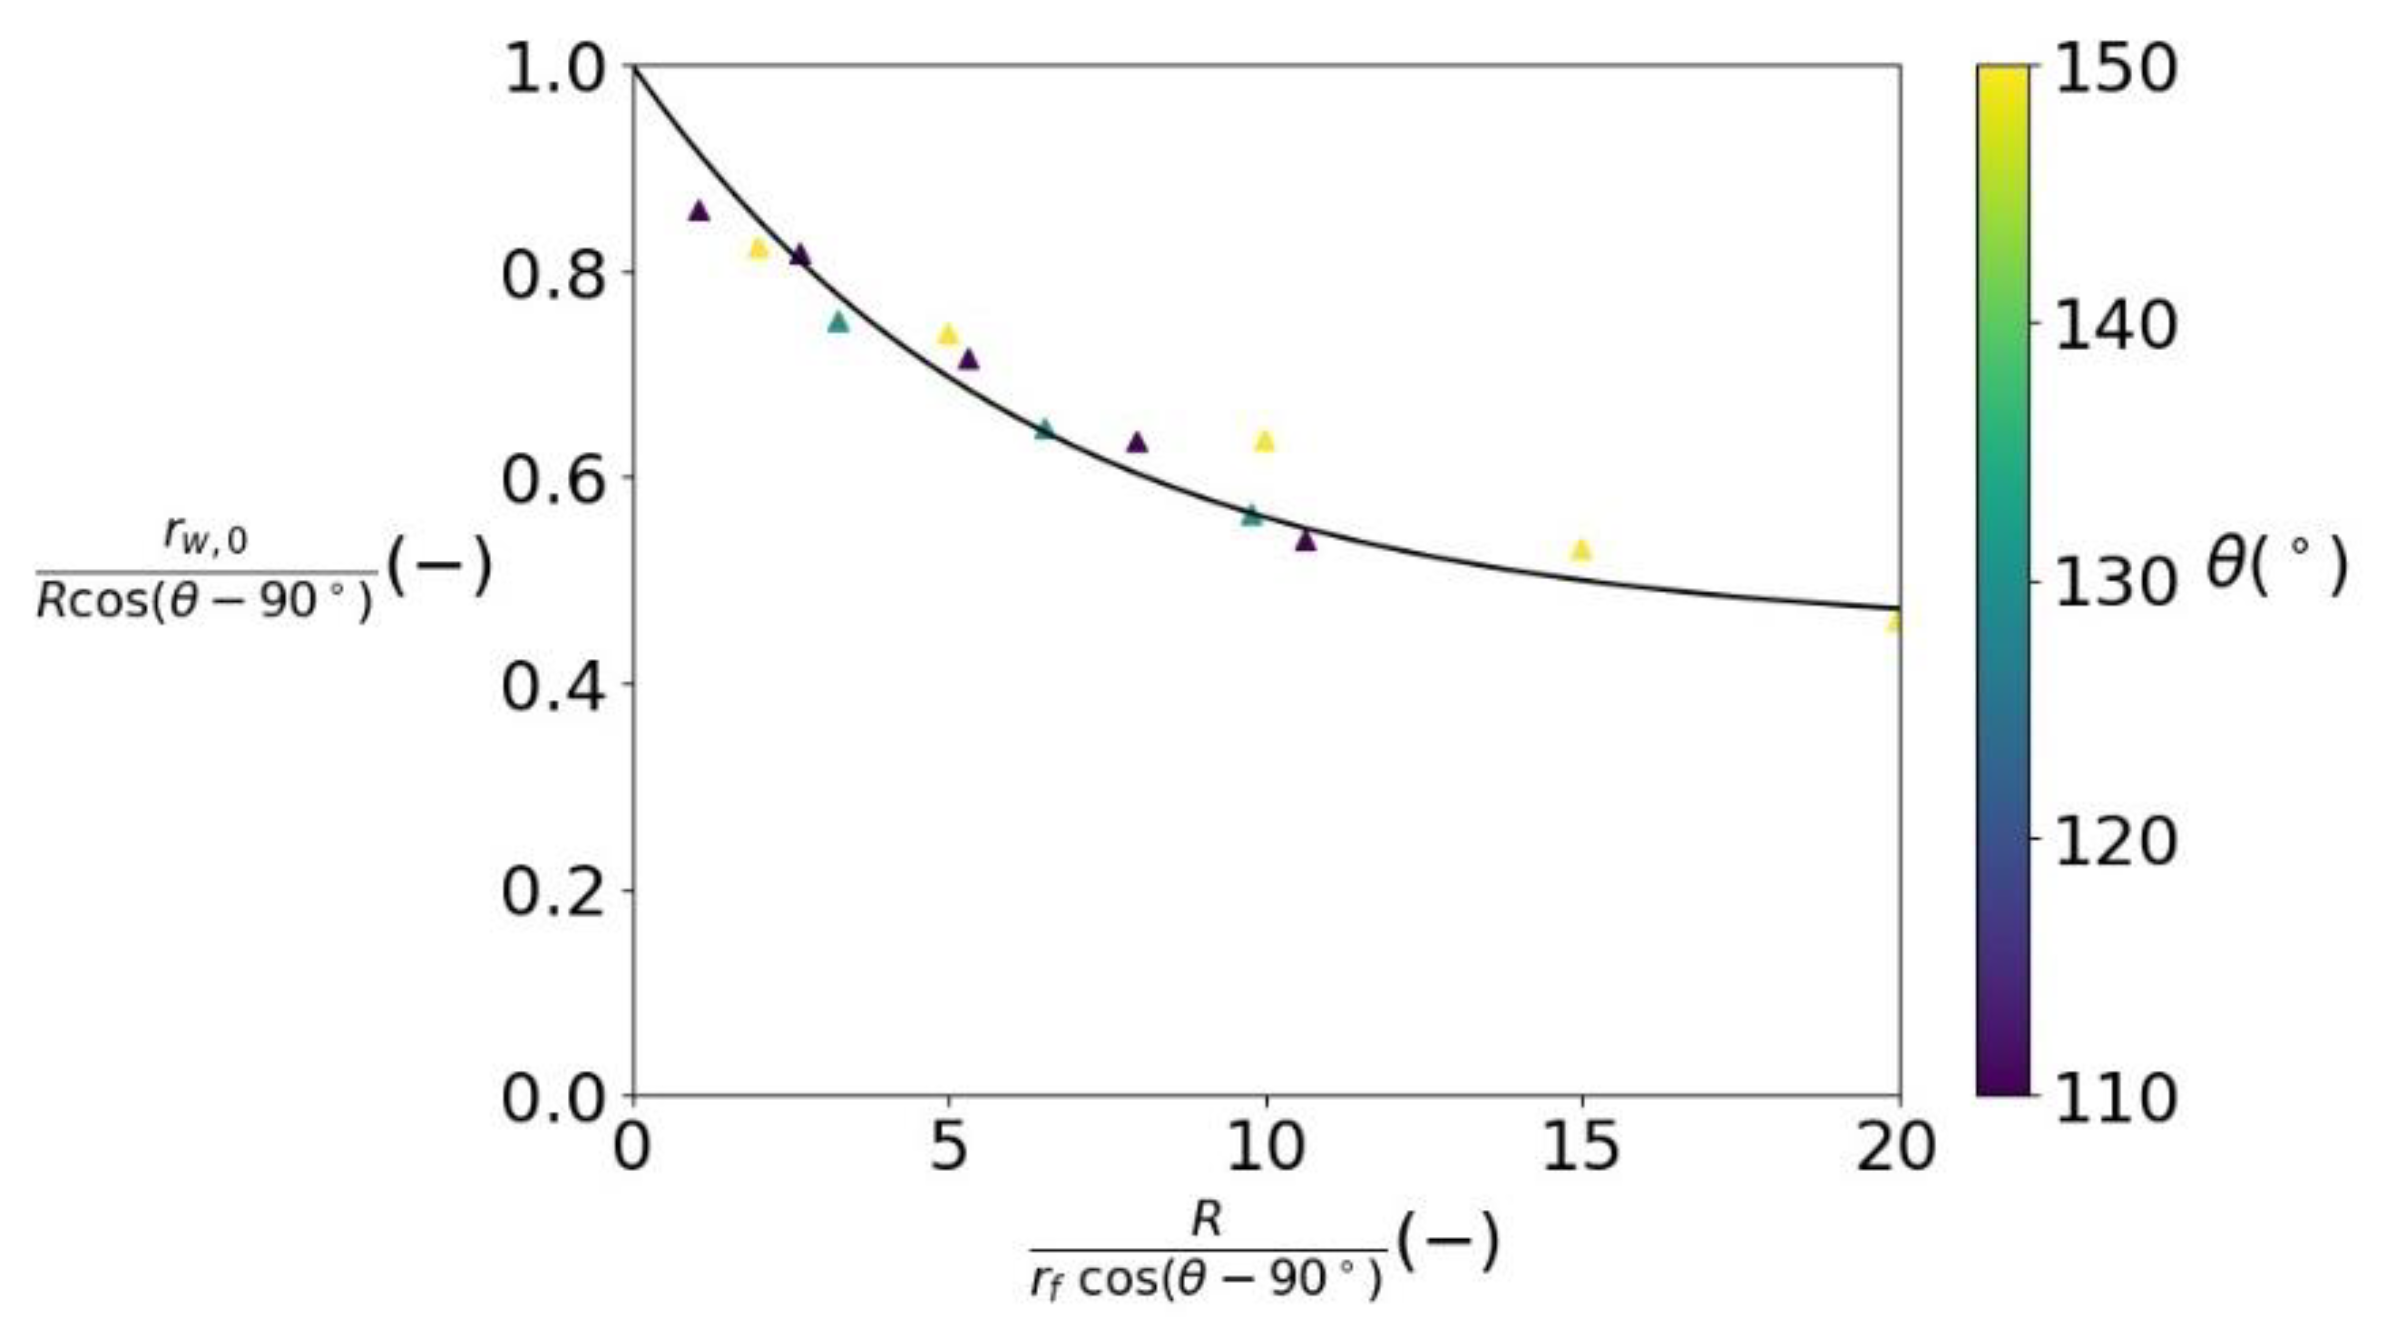
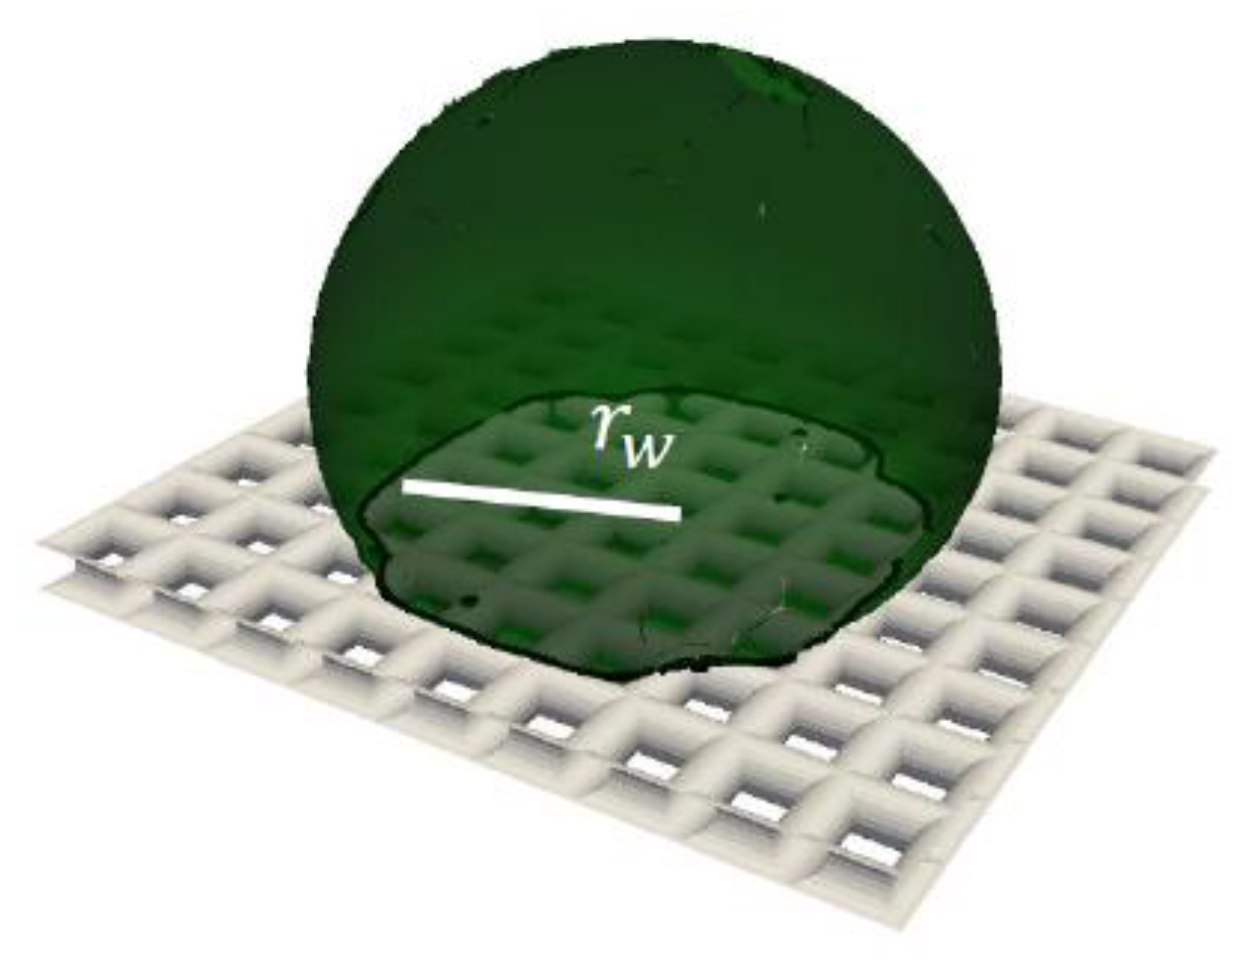
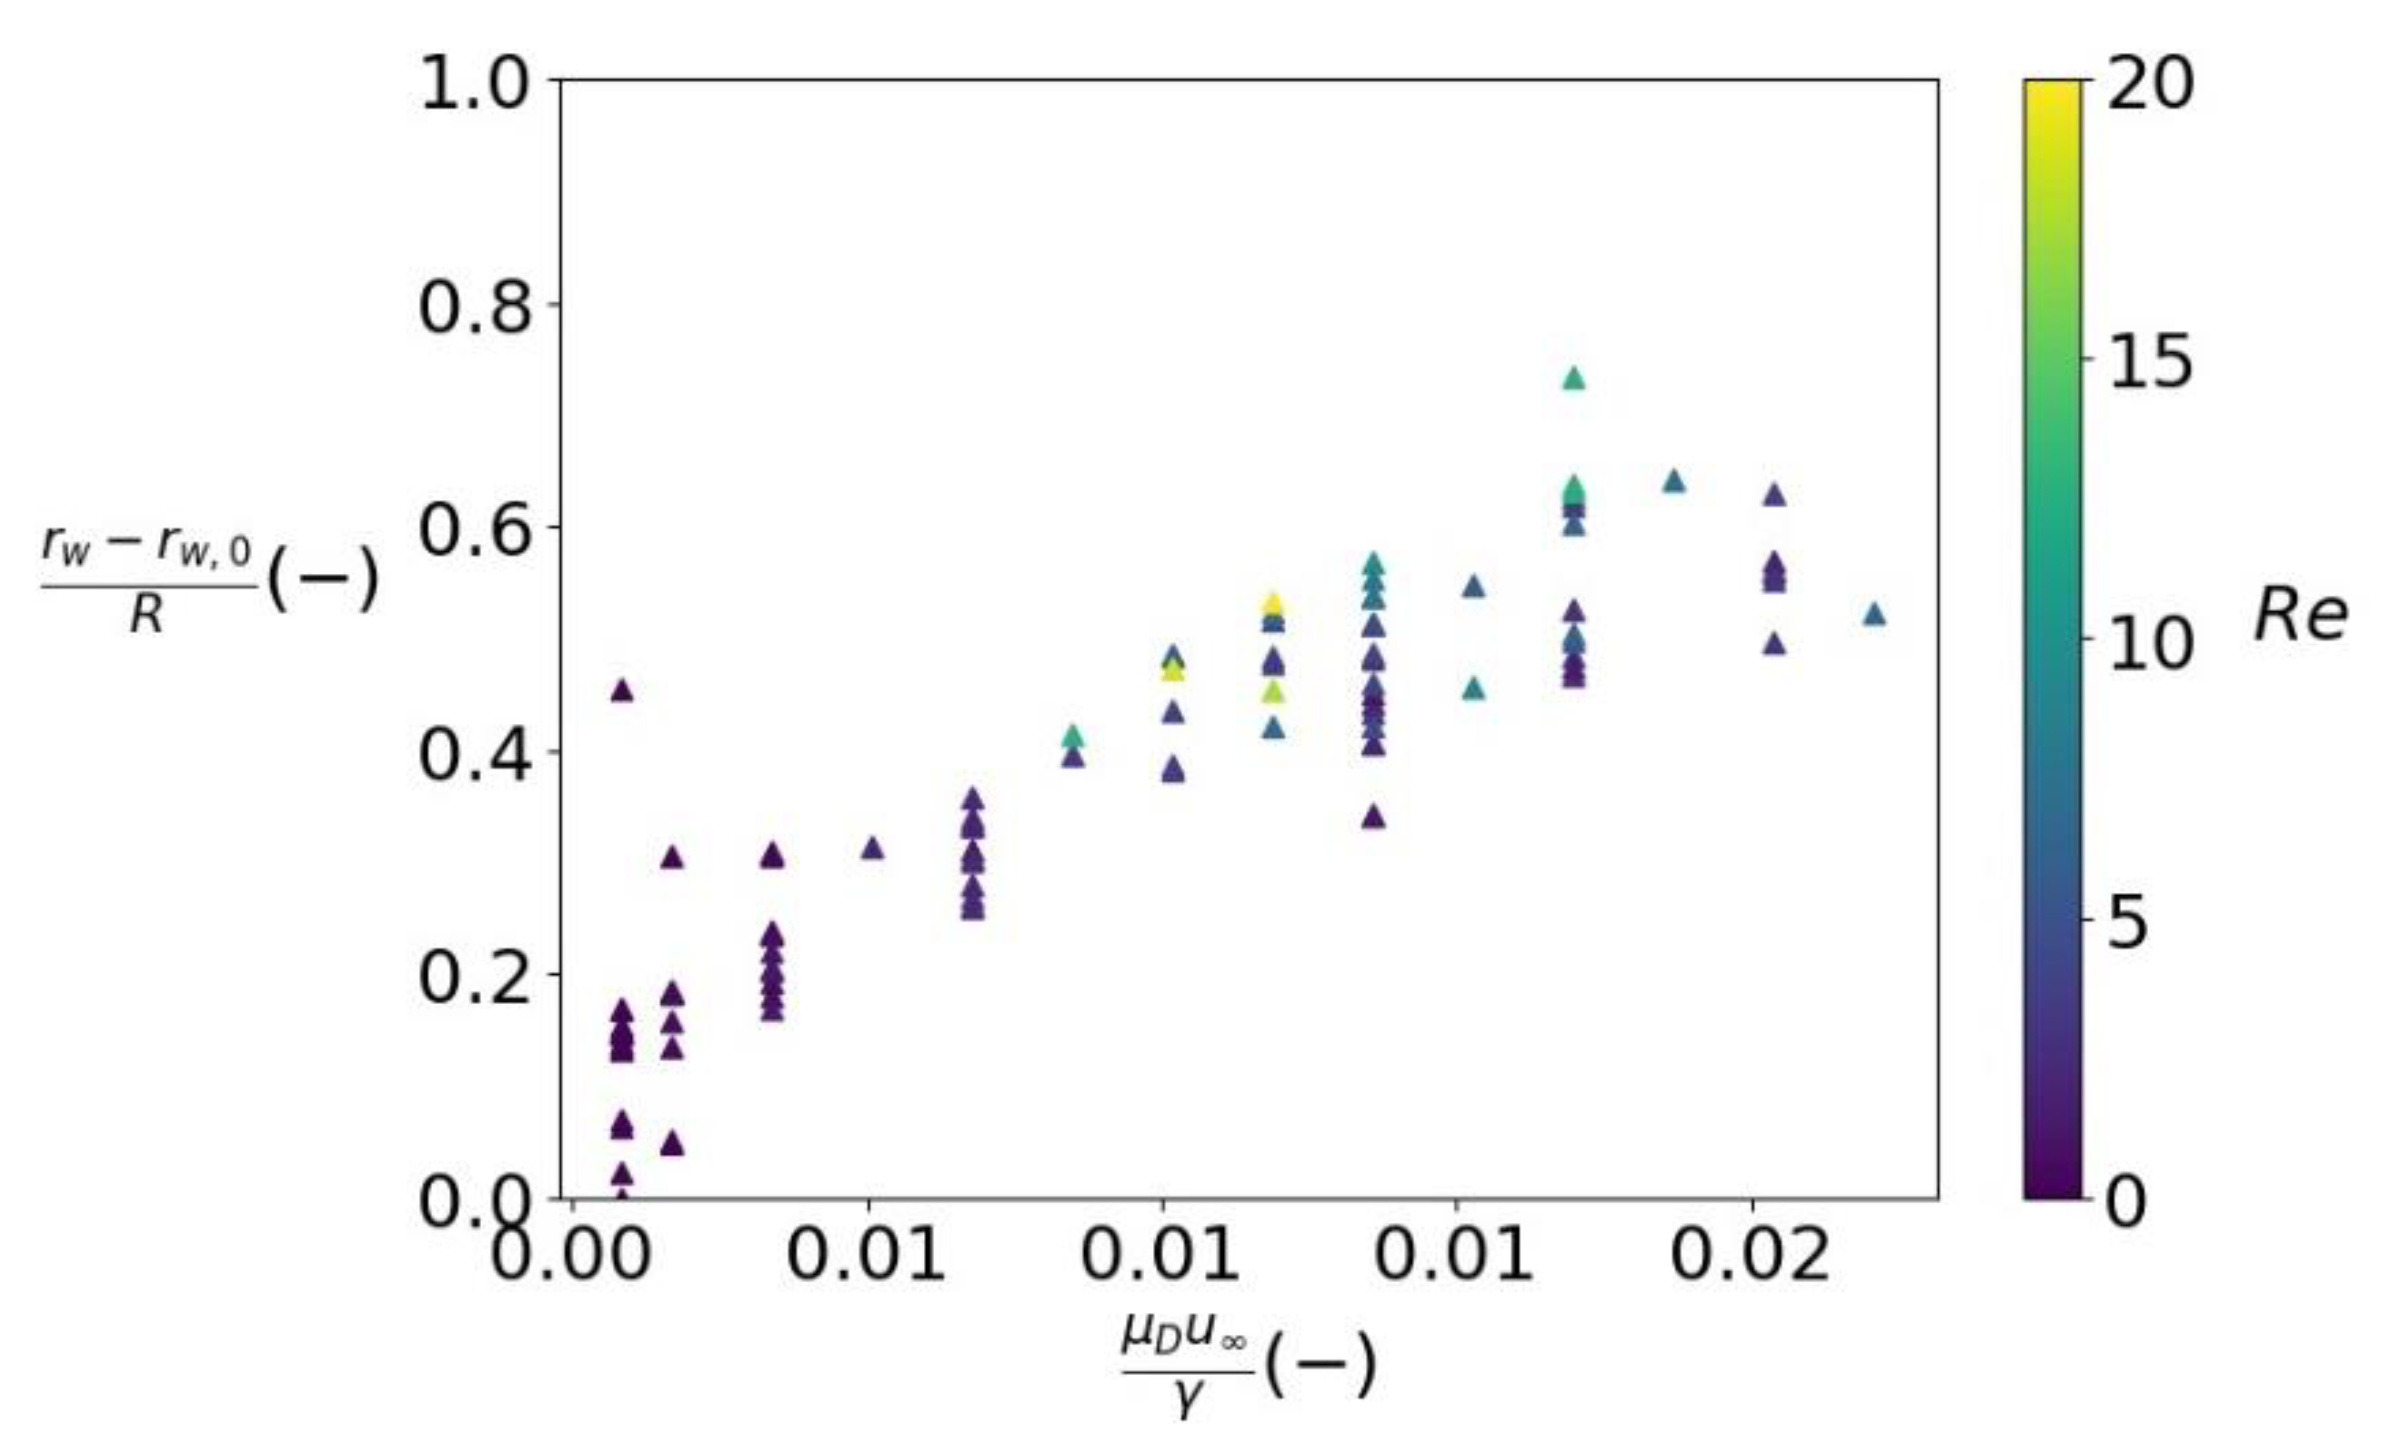
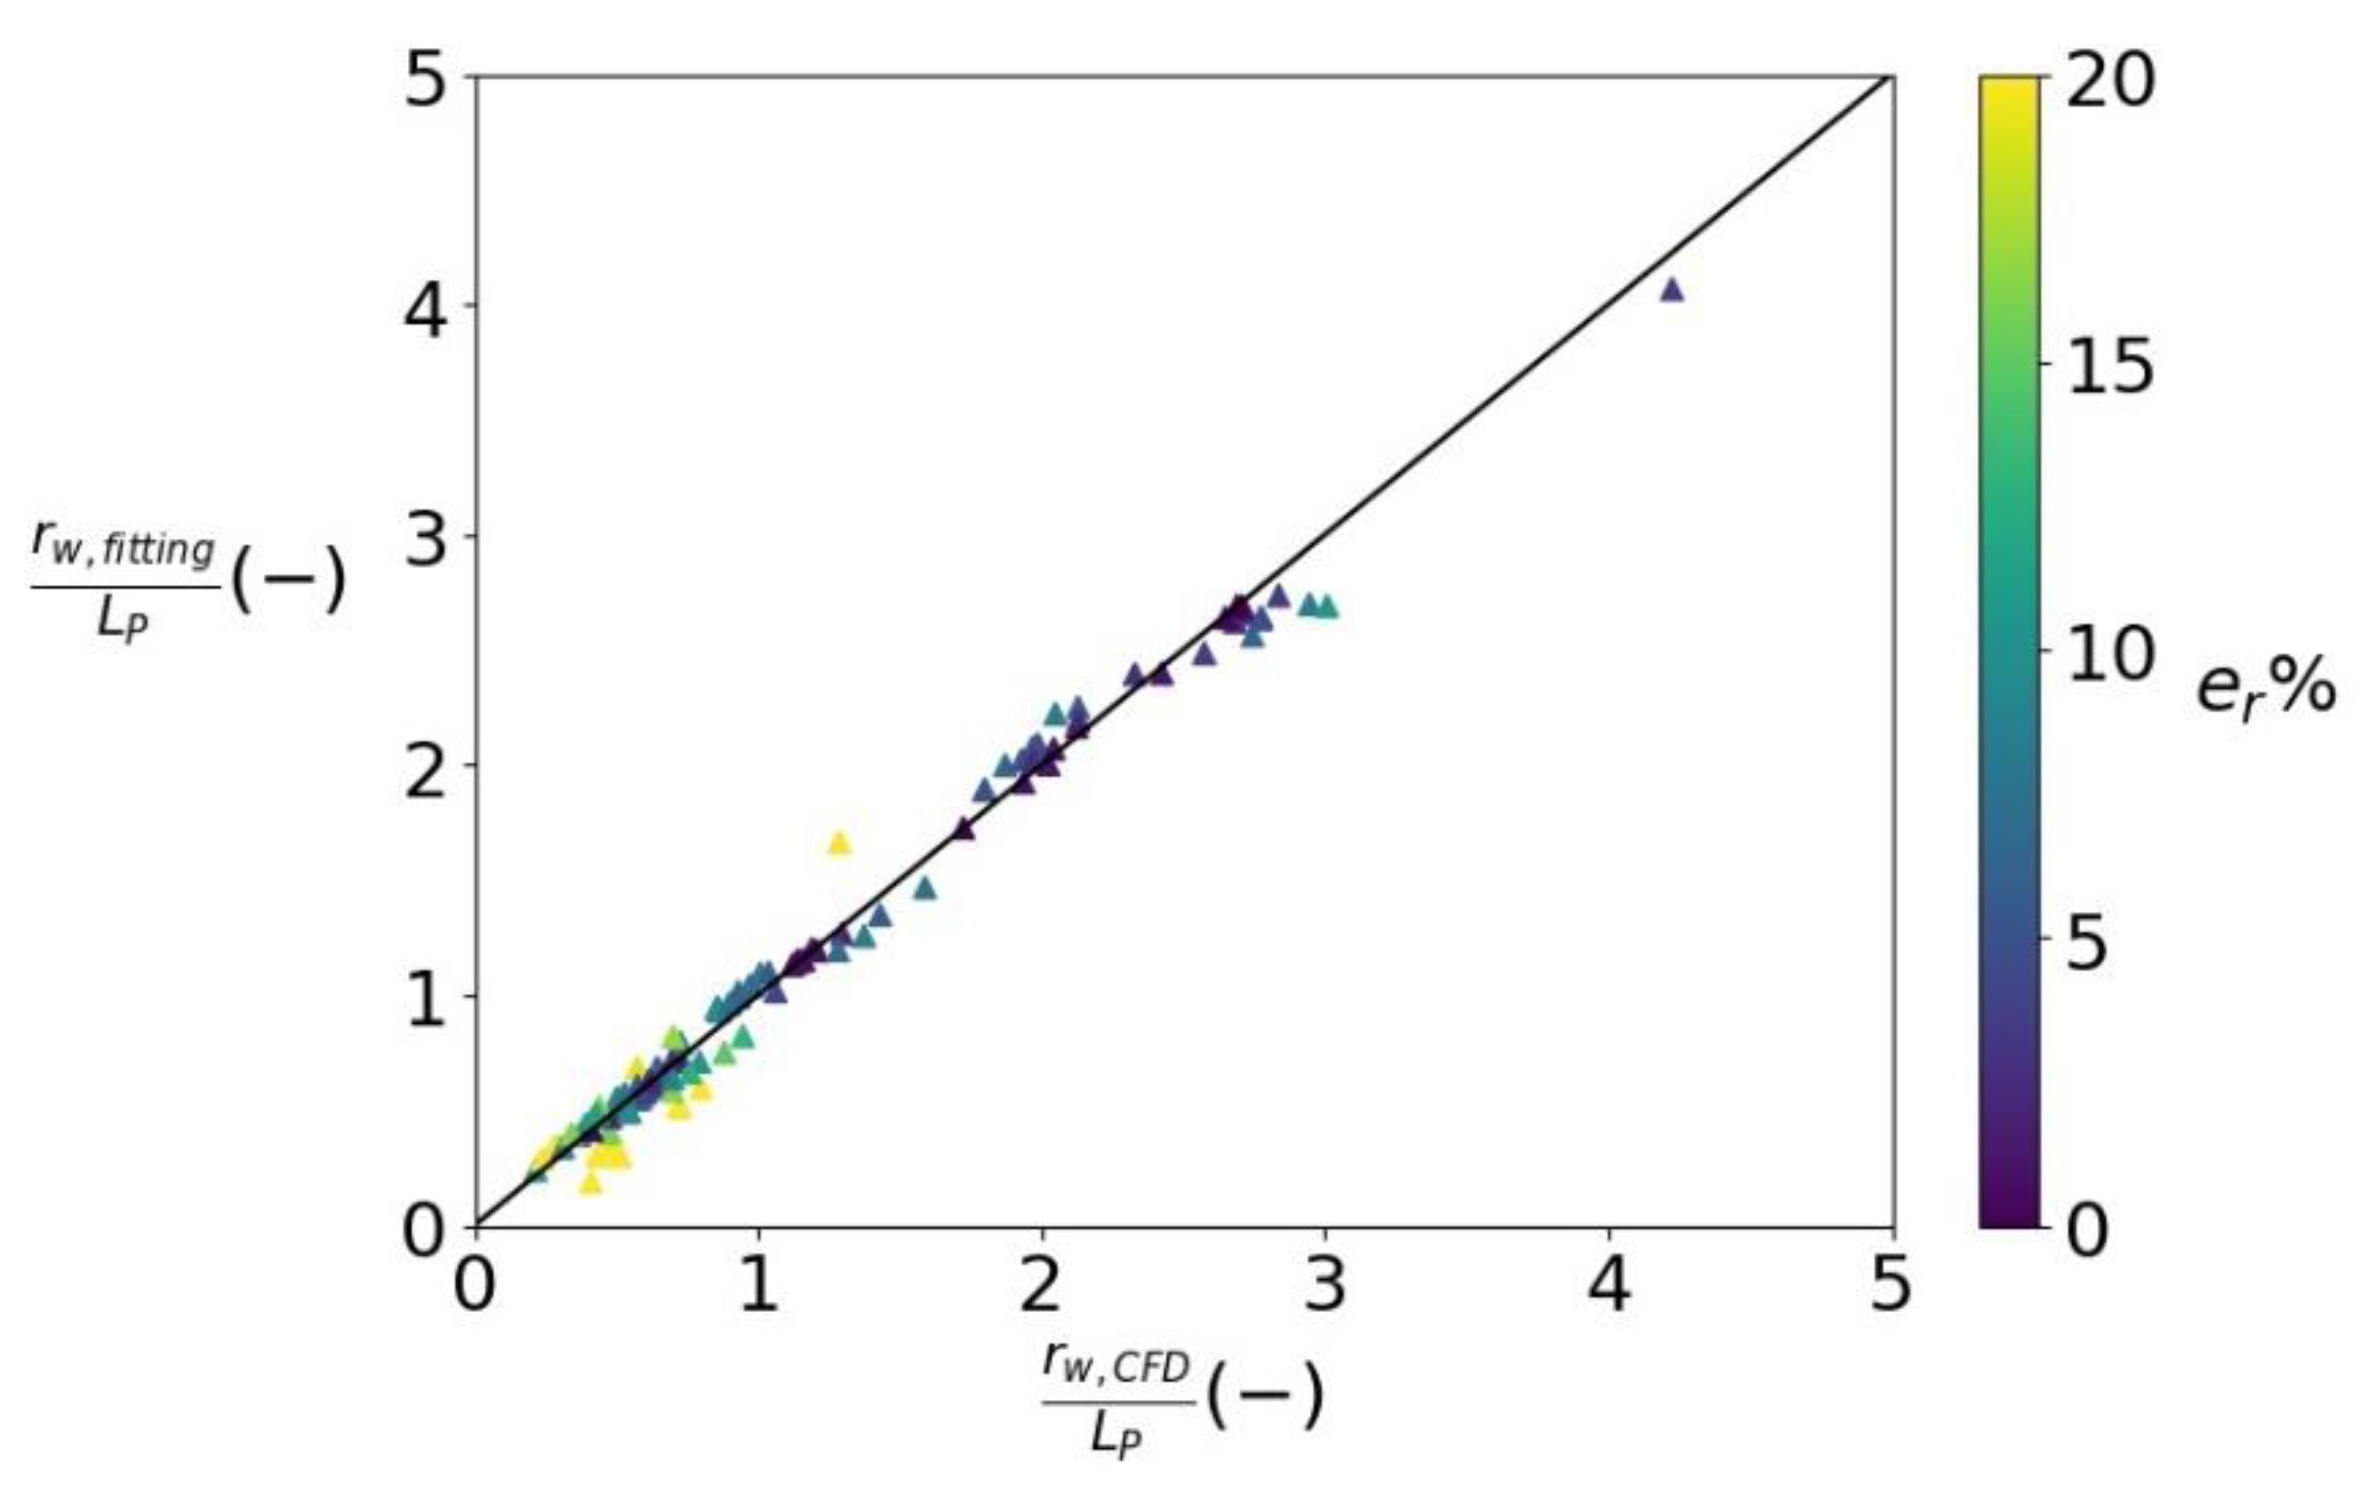
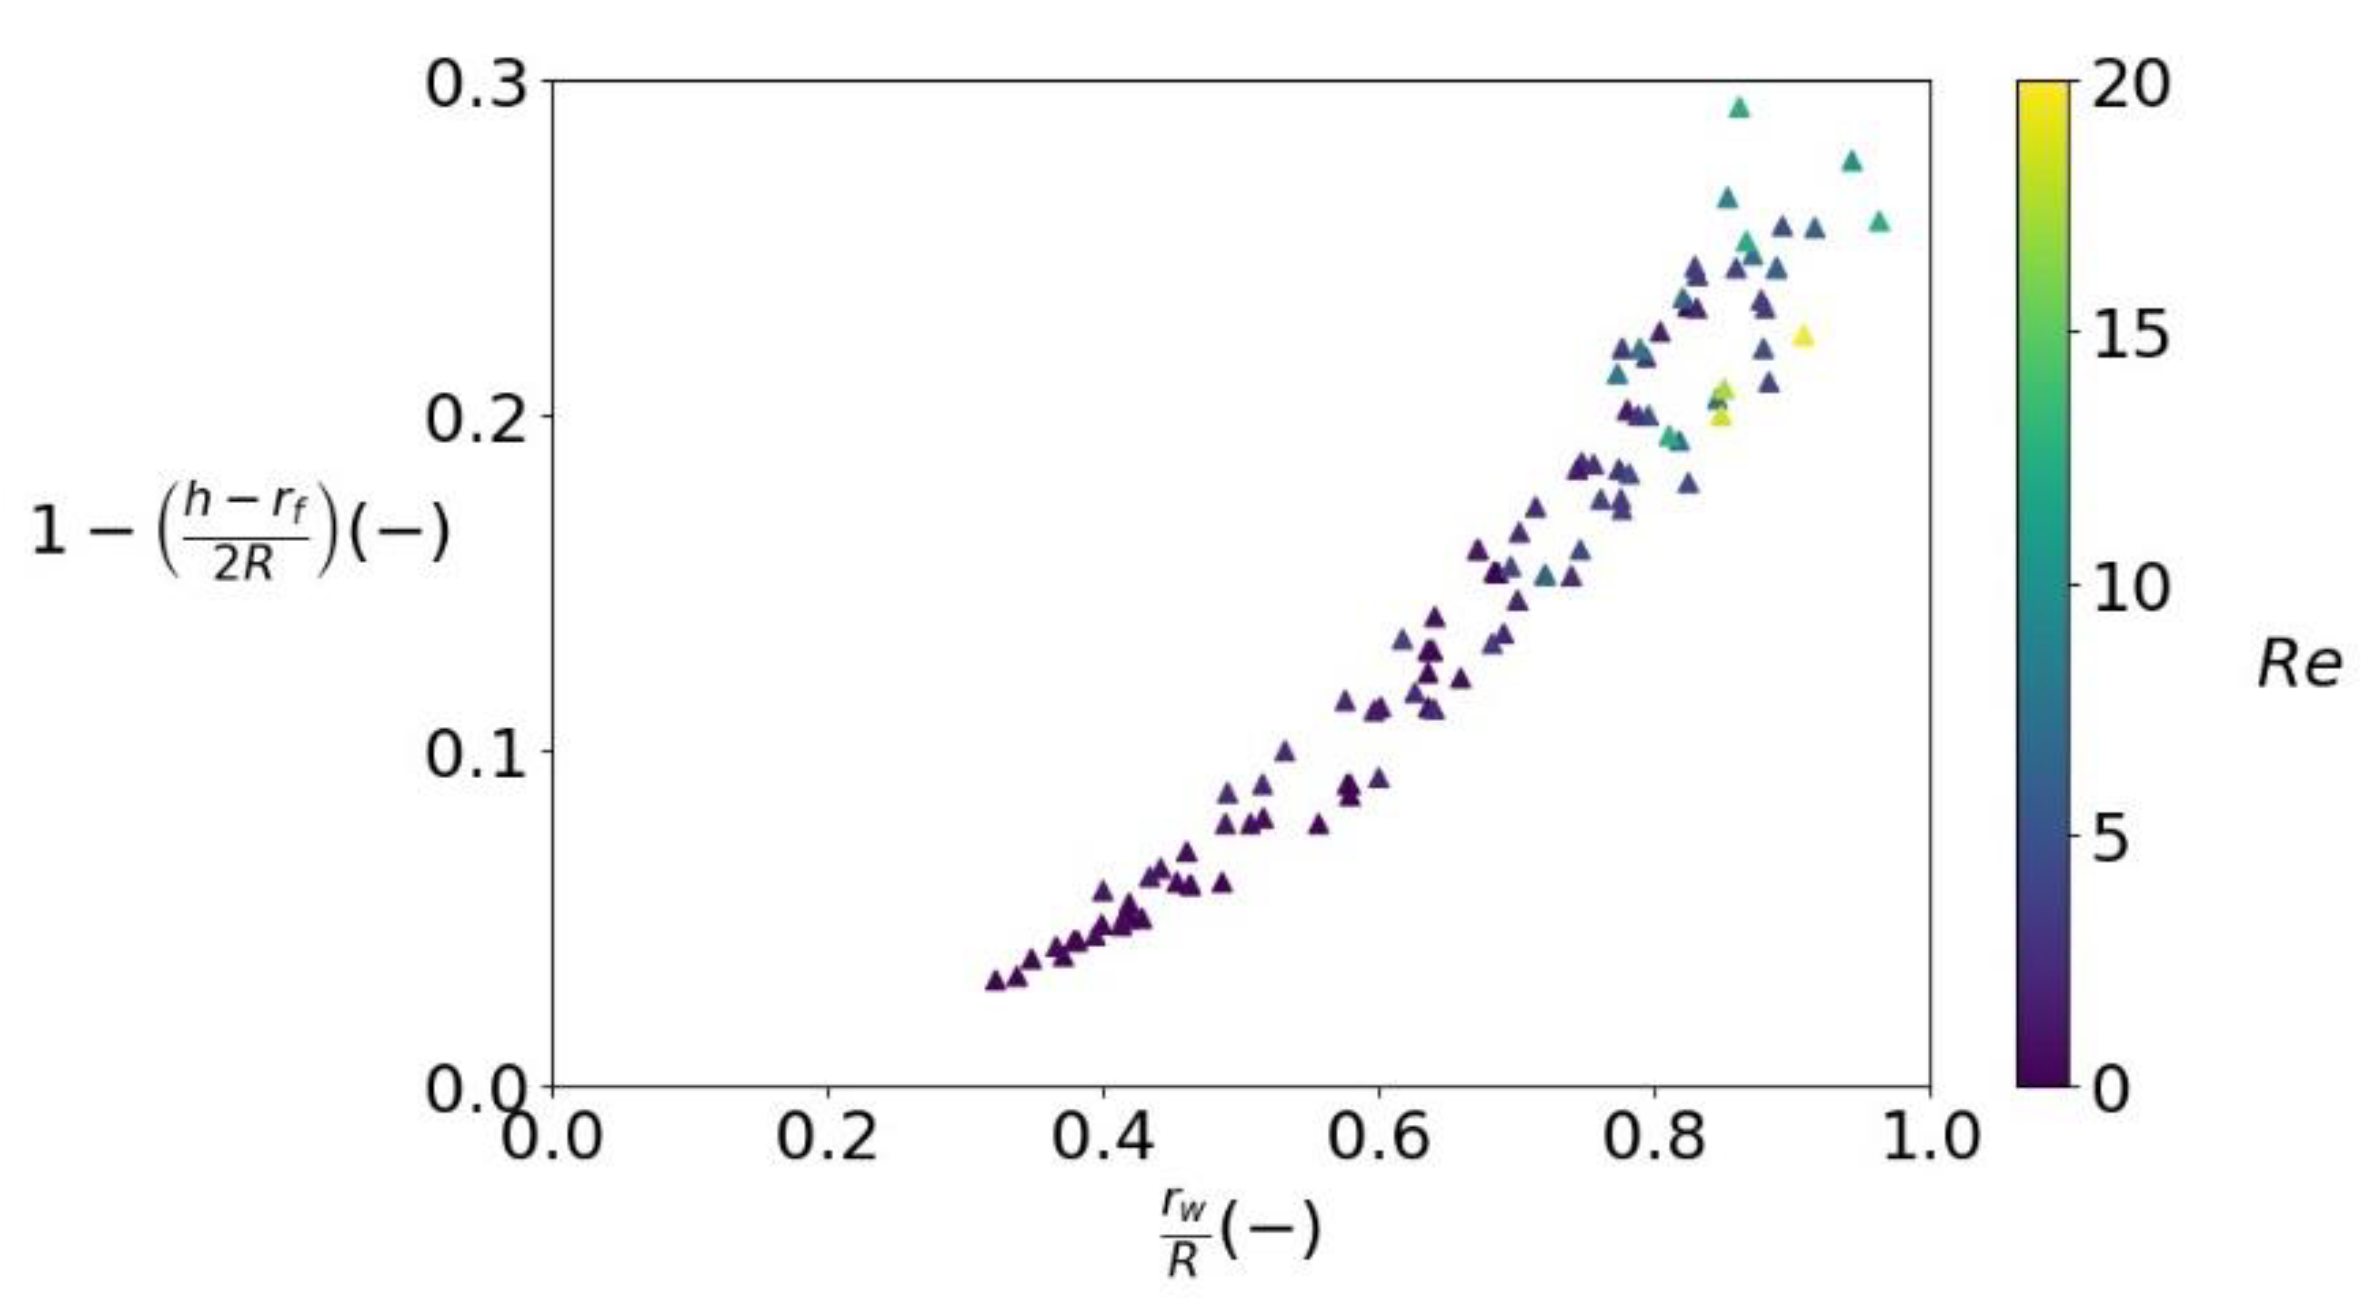
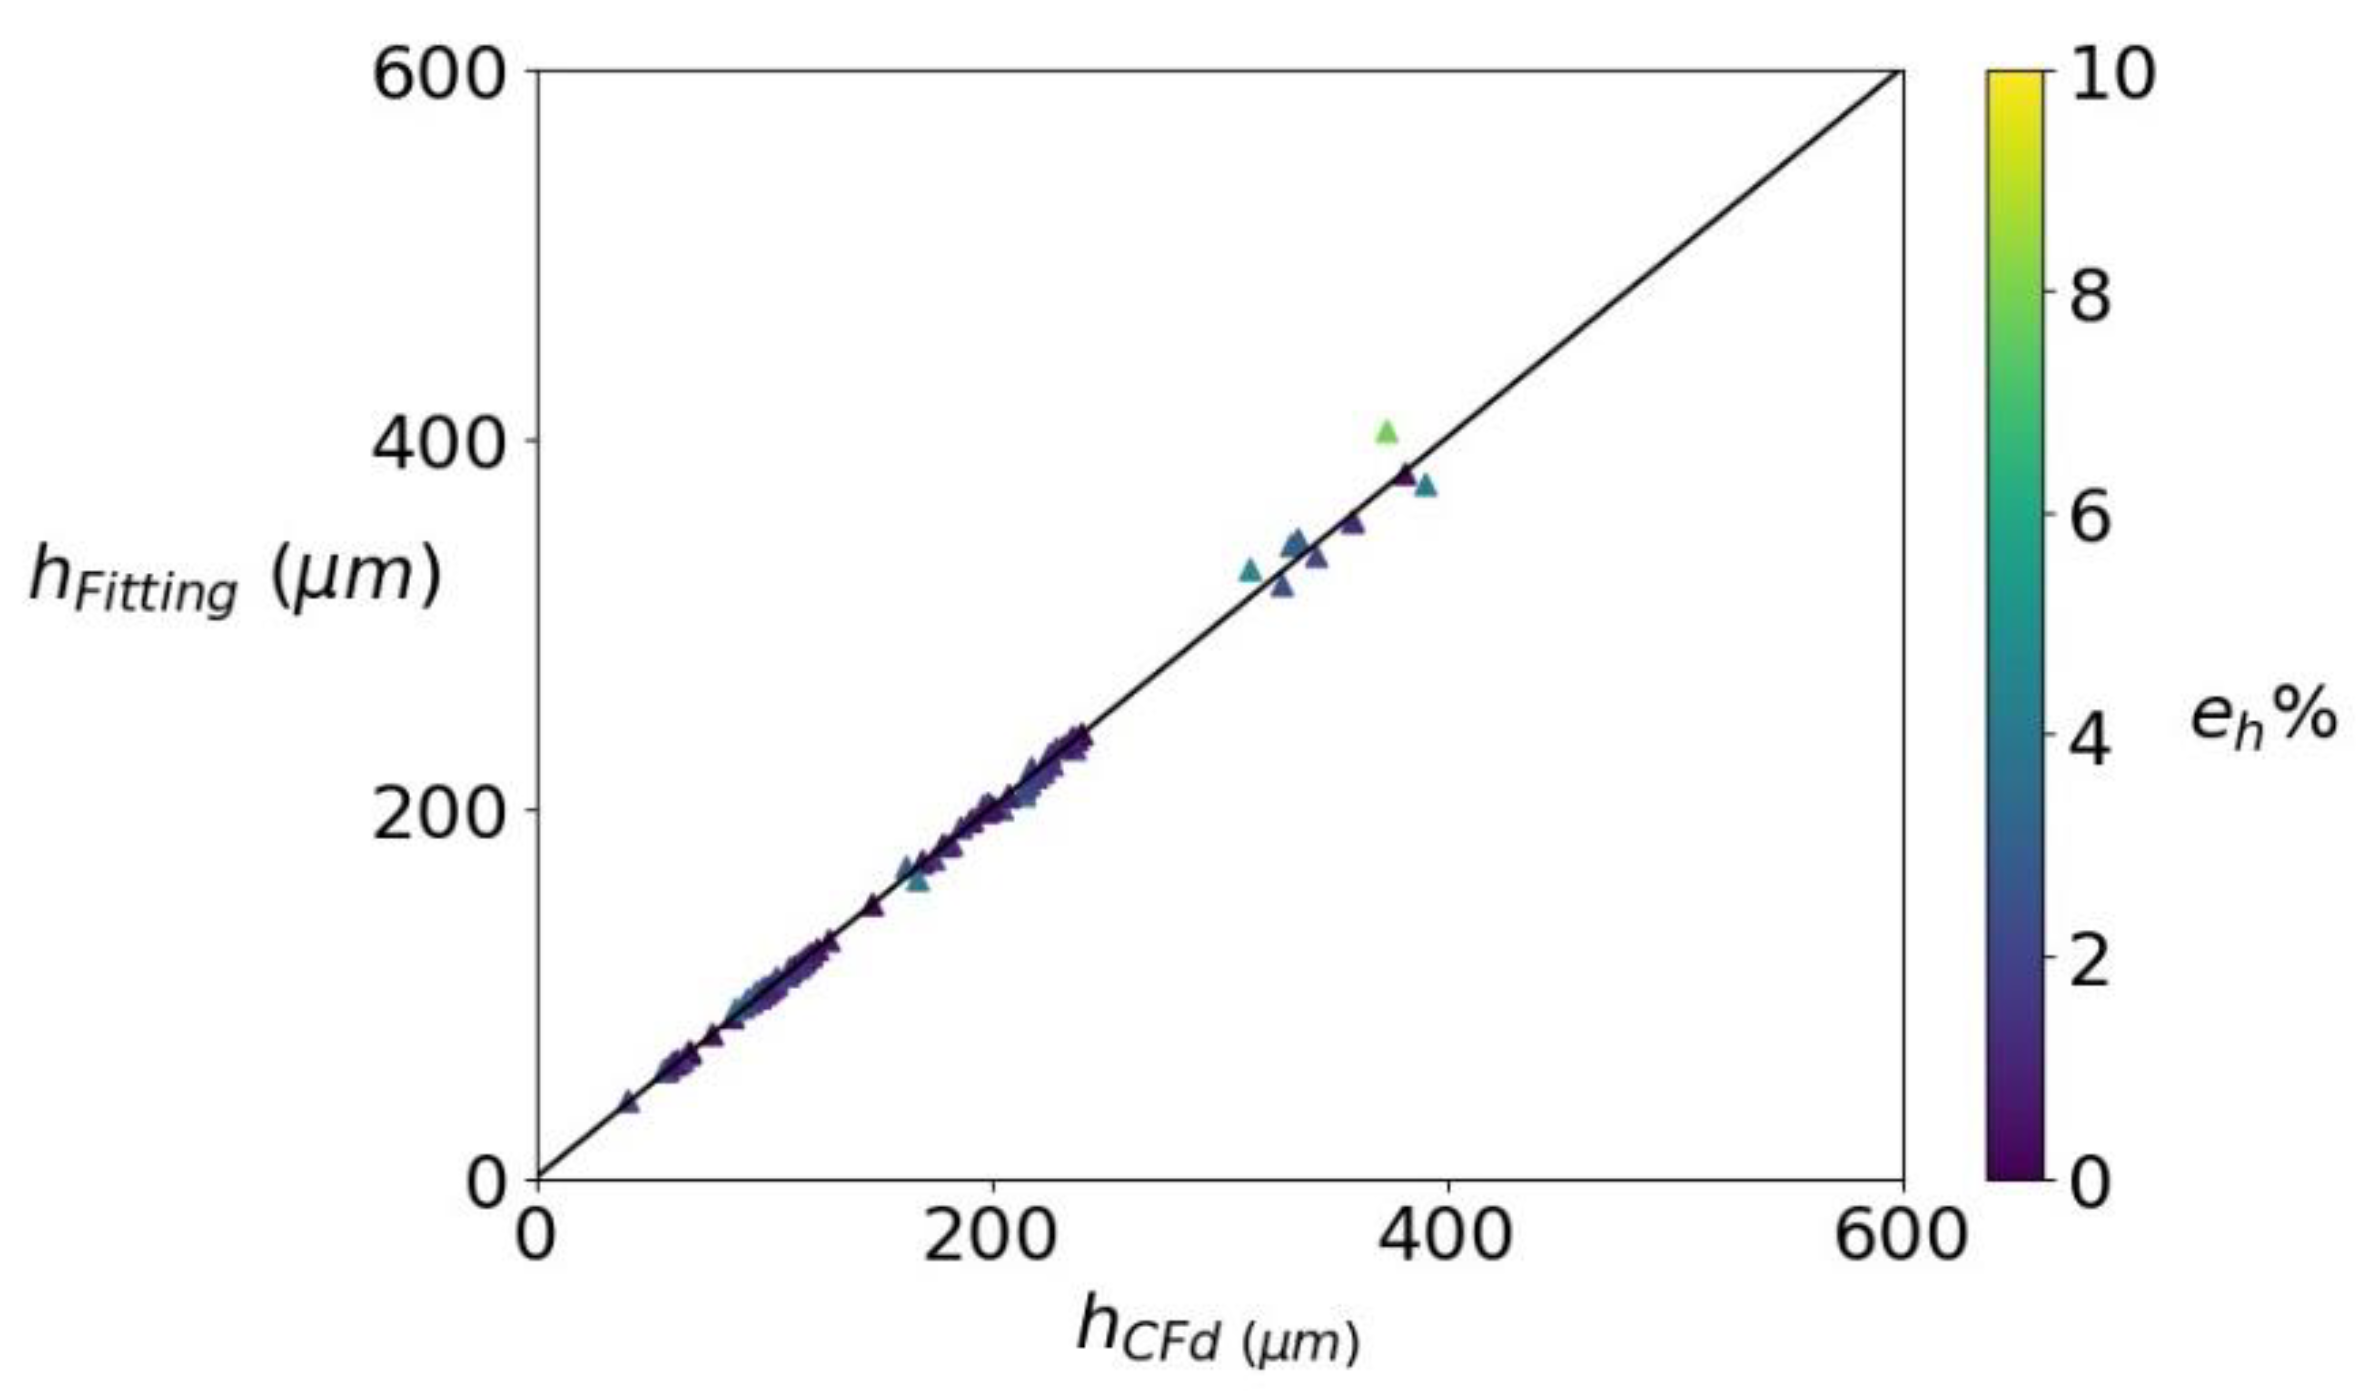
3.2.1. Spreading Radius
First, the special case of a single droplet residing on a thin long cylinder (fiber) was considered. Three different droplets were simulated with radii and . The radius of the fiber was kept constant with value . Three Young–Laplace contact angles were simulated, namely , and . The relevant properties of the water and the diesel are given in Table 5.
Table 5.
Transport properties of water and diesel.
Because the flow fields were static, only two length scales affected the spreading of the droplet: the droplet radius and the fiber radius . Figure 11a shows the shape of the droplet on the fiber. Figure 11b demonstrates the contact line of the droplet on the surface of the fiber.
Figure 11.
Wetting of a single water droplet on a hydrophobic thin fiber in diesel: (a) shape of the water droplet; (b) contact line (black) of a water droplet where red corresponds to water and blue corresponds to diesel.
The contactline is an ellipse projected on the surface of the fiber. The ellipse is described by the major radius and minor radius . The averaged wetting (clogging) radius was defined as the geometric mean value:
It is important to note that when the solid surface is flat (at a very large fiber radius), the contact line is circular with radius:
From dimensional analysis, the averaged wetting radius is normalized by the wetting radius in case of a flat surface. Another non-dimensional length appears by combining the droplet radius, fiber radius, and Young–Laplace contact angle as follows:
where is a fitting function to be determined. An important constraint on the fitting function is that it should tend to unity as the radius of curvature of the fiber goes to infinity:
Figure 12 shows the averaged wetting radius of the contact line. The curve was modeled as a decaying exponential. For very large droplets, it can be seen that the ratio was independent of the radius of the fiber. For relatively small droplets, the wetting tended toward the shape of a droplet residing on a flat surface. A fitting function to model this pattern was found to have the following form:
Figure 12.
Averaged wetting radius of a droplet on a thin cylindrical fiber.
Second, the case of a moving diesel with a mean velocity at the inlet of the domain was considered. The droplet radius was larger than the open pore length scale. In order to cover a wide range of non-dimensional numbers, different droplet radii, inflow velocities, surface tension coefficients, and Young–Laplace contact angles were assumed (as summarized in Table 6). Figure 13 shows a visualization of the averaged wetting (clogging) radius.
Table 6.
Parameter space of the simulations of water–wire mesh screen interaction.
Figure 13.
Visualization of the averaged wetting (clogging) radius.
Table 6 gives the different parameters of the simulations between a single water droplet and a hydrophobic wire mesh screen (the properties of the wire mesh screens were given earlier in Table 2). The choice of the simulation parameter was chosen using a random number generator from the values in Table 6. The total number of performed simulations was .
In the regime of low velocity (dominant viscous force), the deformation of the droplet depends on the capillary number. The capillary number represents the ratio between the viscous force to the surface tension force. The capillary number was modified in order to account for the surface tension force in the direction opposite to the diesel. Moreover, the effect of the open area ratio was plugged into the modified capillary number as an interpolation function. The modified capillary number was defined as follows:
where scaled the ratio between the viscous forces and capillary forces for different open area ratios. For a sparse mesh, we had and the viscous forces were negligible in compraison to the capillary forces. In that vein, it was assumed that the wetting of a droplet on the wire mesh screen was similar to the static case (negligible pressure drop). In the case of dense wire mesh screen, we had , and the viscous forces were dominant and the surface tension force was negligible. At larger velocities, the Reynolds number (ratio between inertial forces and viscous forces) affects the deformation of the droplet. The average wetting was modeled as a function of the modified capillary and Reynolds number as follows:
Figure 14 shows the normalized averaged wetting radius at different Reynolds and capillary numbers. It can be noticed that when the Reynolds number increased, the deformation of the contact line increased as well. For a very low capillary number, there was a lack of correlation between the capillary number and the wetting radius. The reason is that the wetting radius depends on the location of the droplet on the wire mesh screen. For moderate capillary numbers, the normalized wetting radius showed a linear behavior with respect to the capillary number.
Figure 14.
Averaged wetting radius of water droplet on a wire mesh screen.
A good fitting of the normalized averaged wetting radius (Equation (23)) was found to have the following form
The relative deviation between the fitting and the CFD simulations was defined as follows:
Figure 15 shows a comparison between the wetting radius of the contact line computed from CFD simulations and fitting. The color bar indicates the relative deviation. The points collapsed on a line with a maximum relative deviation of 20%. The average relative deviation was around 10%.
Figure 15.
Comparison between the wetting radius computed using CFD simulations and fitting.
The height of a droplet is defined as the distance between its farthest upper point to the center of the fiber. In the case of static droplet single fiber interaction, the change in the height was relatively negligible and was assumed as follows:
Because of the conservation of the volume of the droplet, the height of a deformed droplet was modeled as a function of the radius of the deformed droplet as follows:
where is an arbitrary fitting function. Figure 16 shows the height of a deformed droplet. The maximum change of the normalized height of the droplet was found to be 0.3. The height showed a parabolic pattern with respect to the ratio between the contact line radius and the droplet radius.
Figure 16.
Normalized height of a deformed droplet as a function of the normalized wetting radius.
A good fitting of the normalized height of the deformed droplet was found to take the following form:
The relative deviation in the modeling of the height of the droplet was defined as follows:
Figure 17 shows a comparison between the distance between the droplet uppermost point and the center of the fiber computed from CFD simulations and fitting. The color bar indicates the relative deviation. The points collapsed on a line with a maximum relative deviation of 10%. The average relative deviation was less than 5%.
Figure 17.
Comparison between the height of a deformed droplet obtained using CFD simulations and fitting.
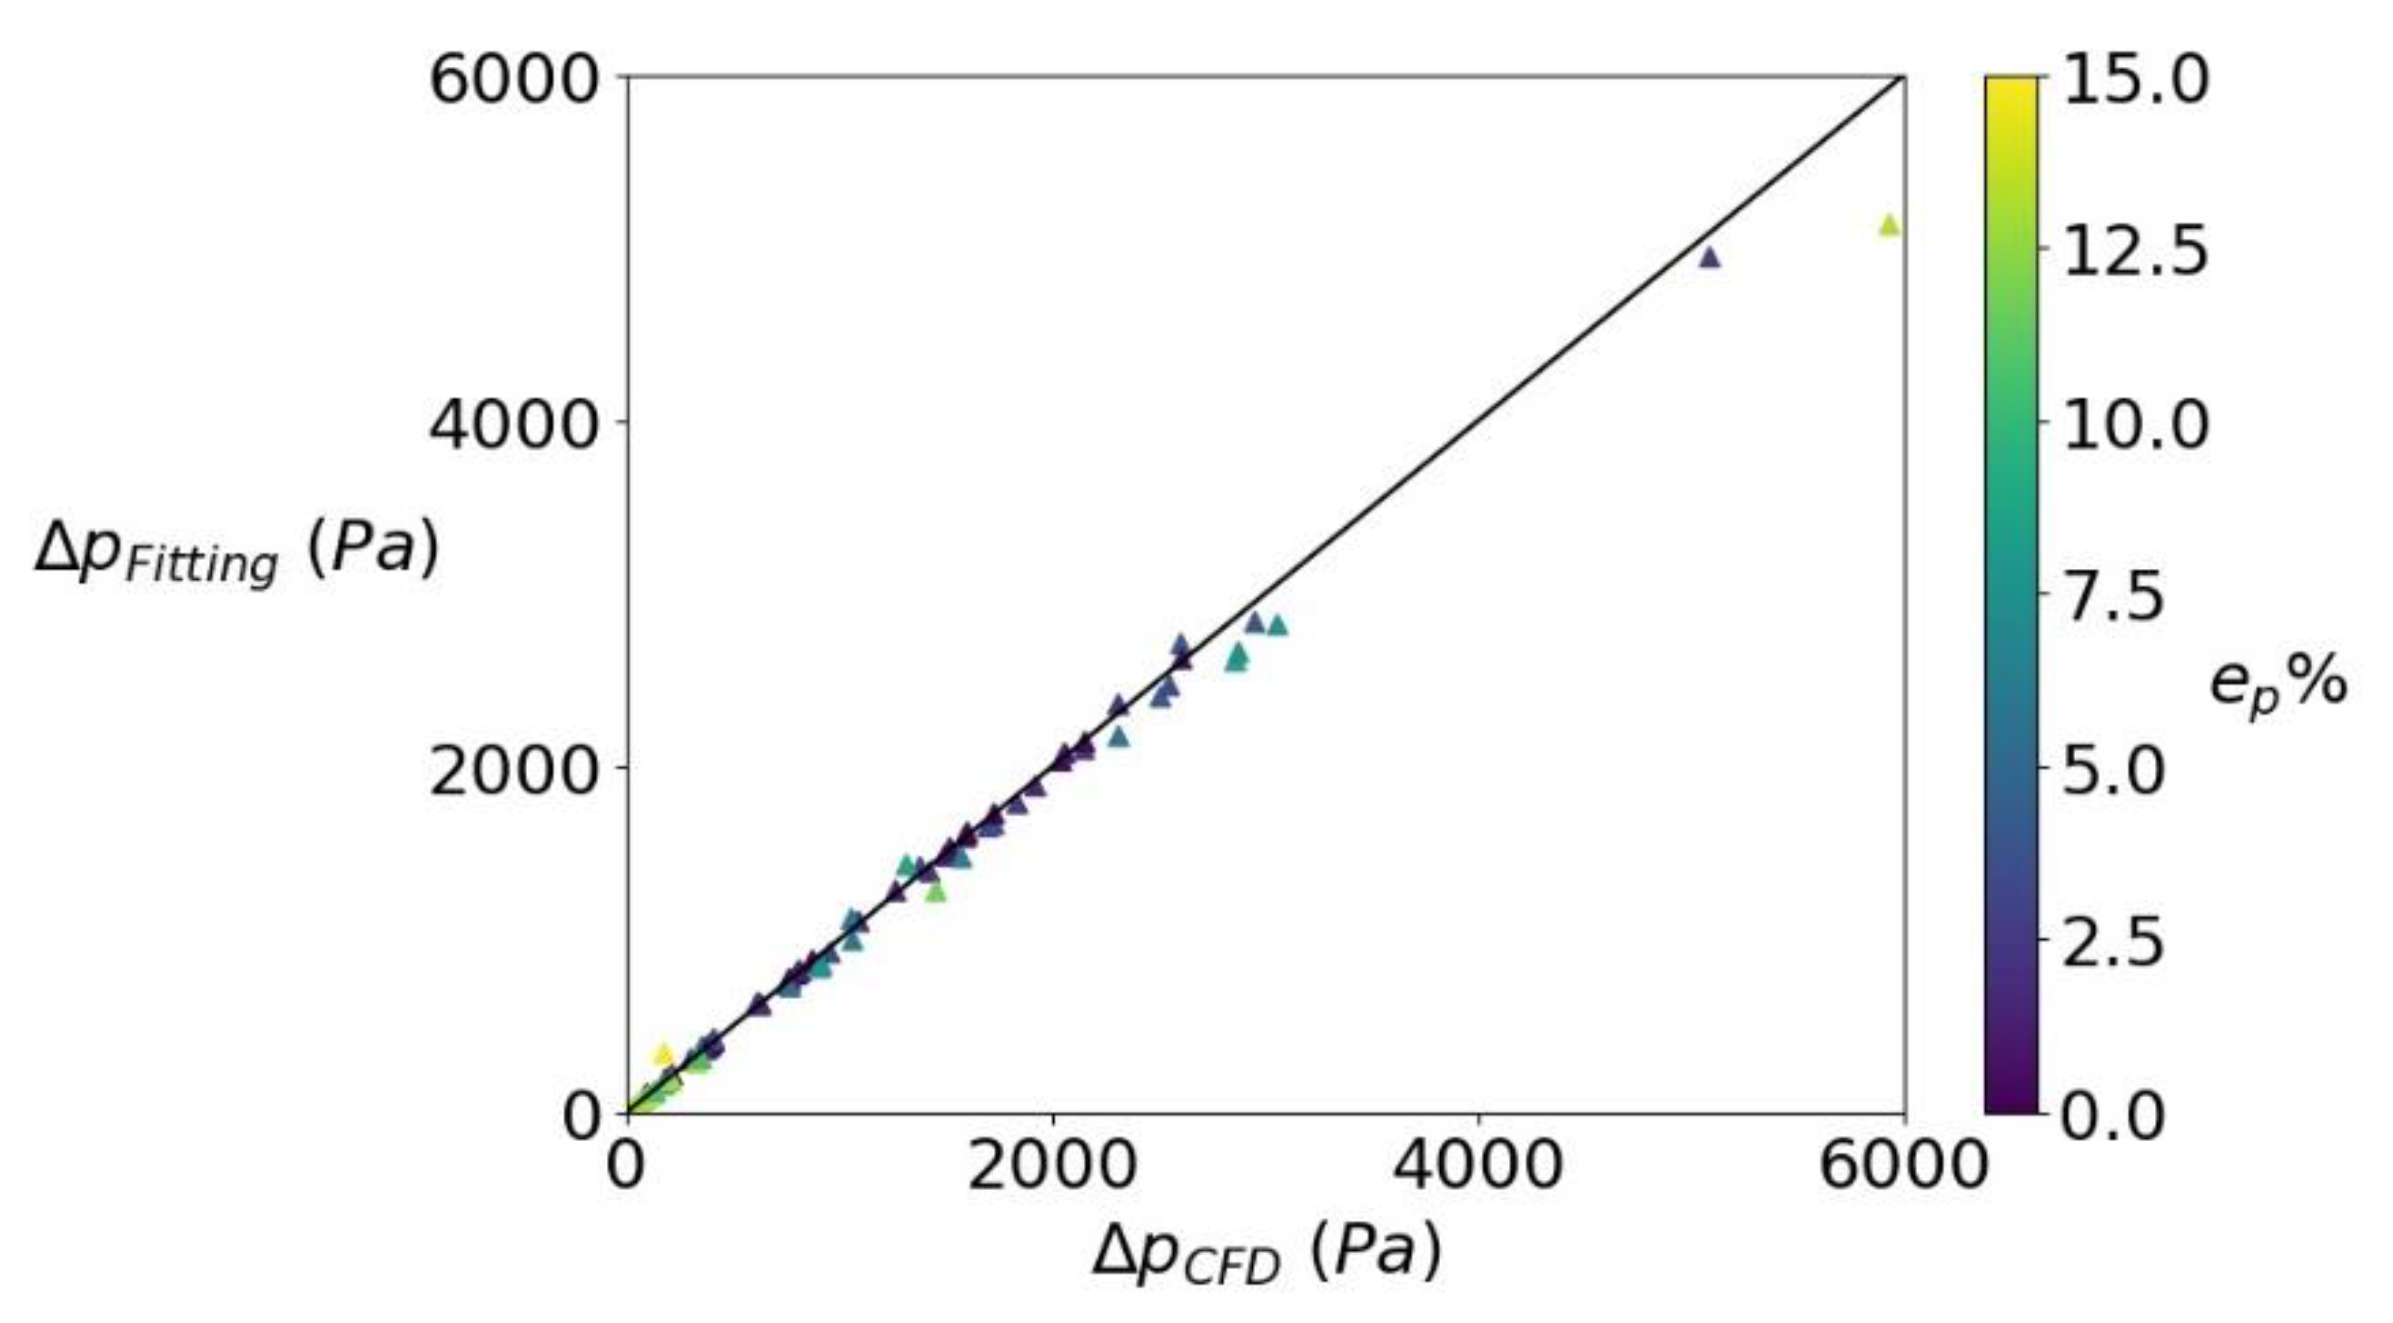
3.2.2. Pressure Drop
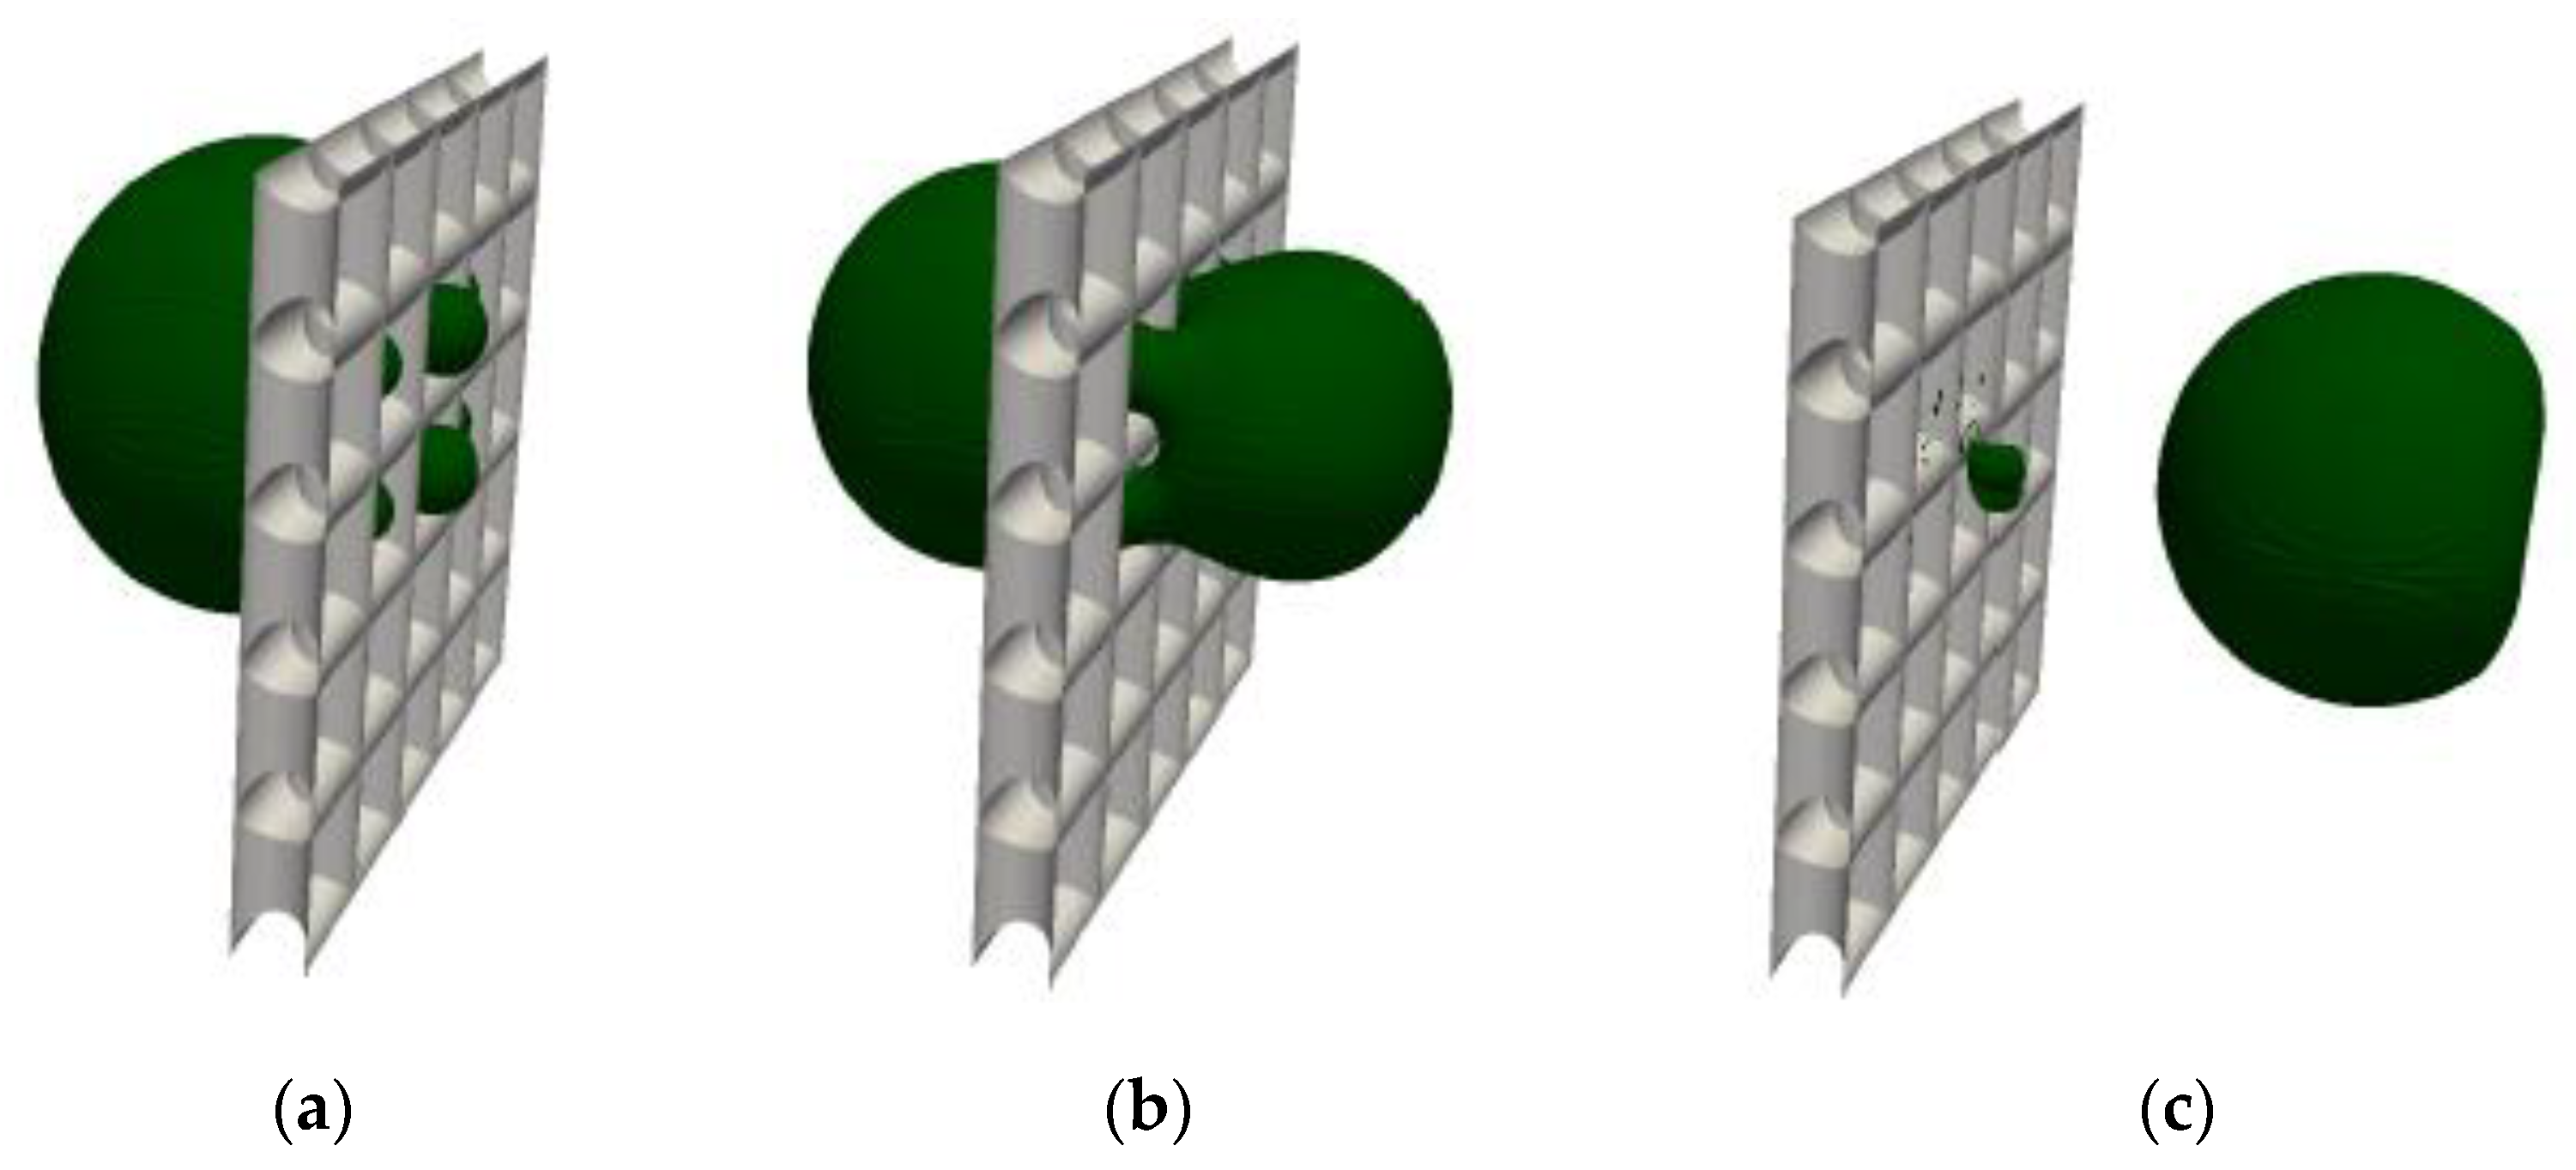
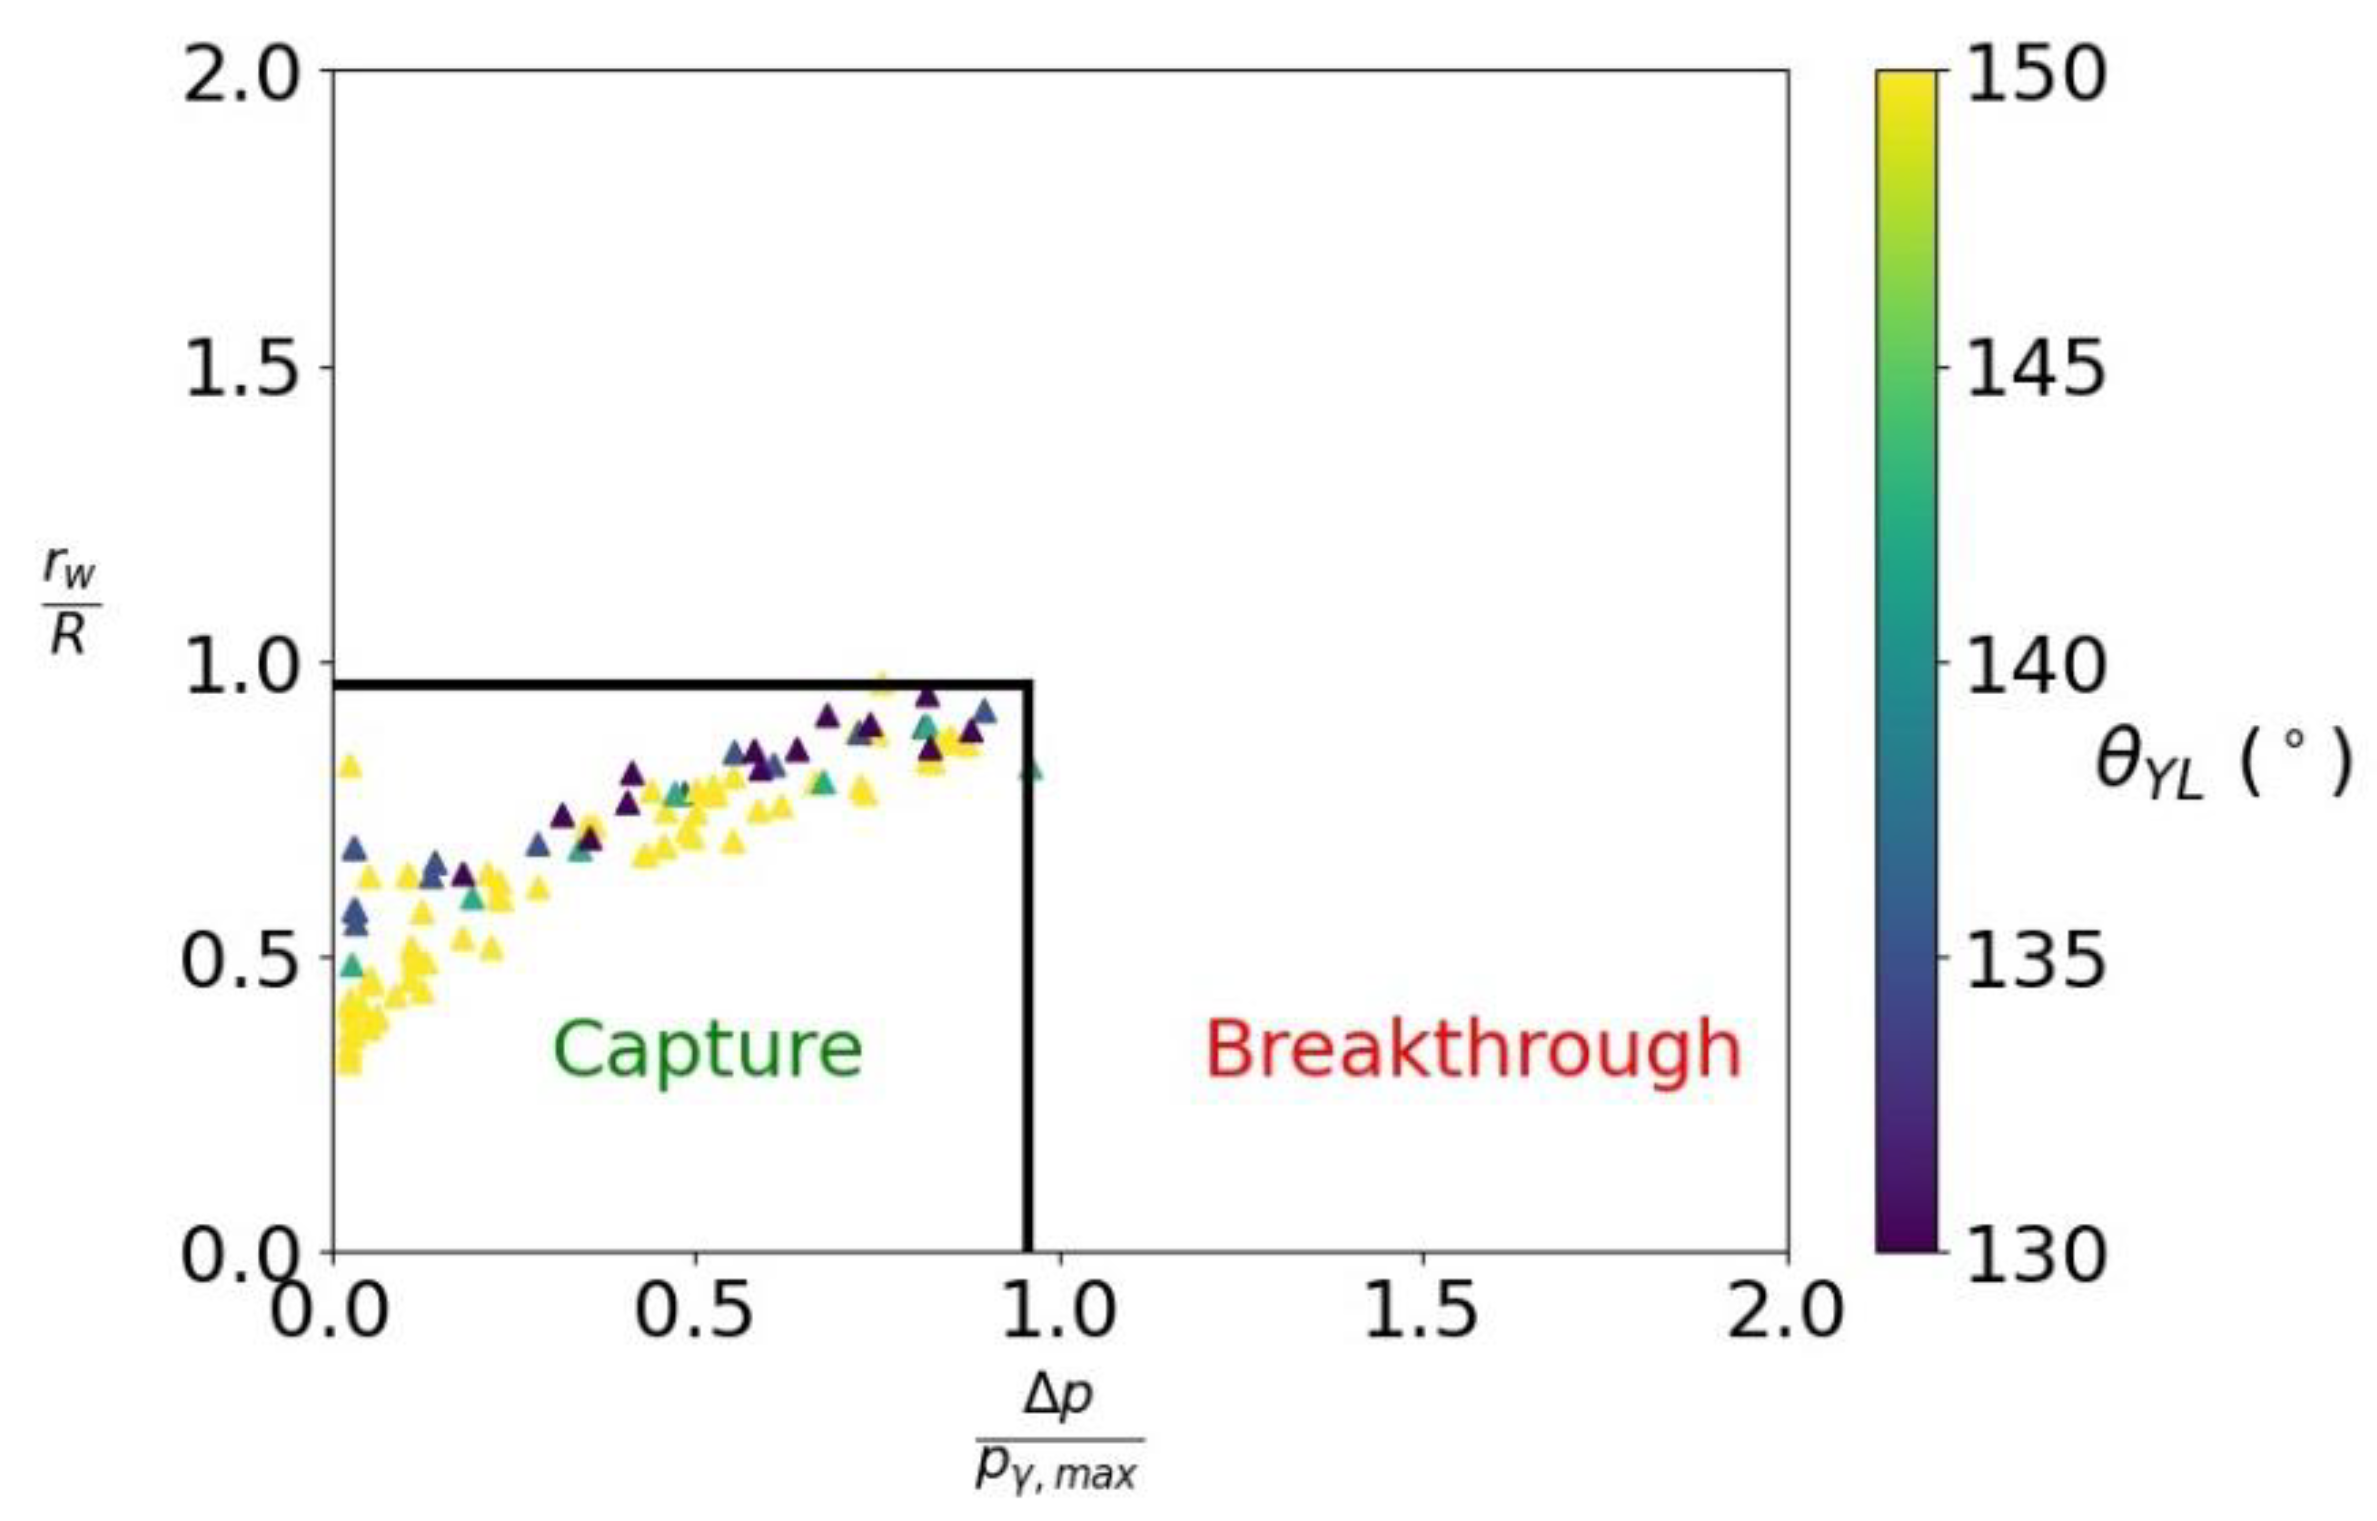
At low velocities (negligible inertial forces), the pressure drop across a clean wire mesh screen was linearly proportional to the mean inflow velocity,
where is a friction coefficient, similar to the flow resistance in Darcy’s law, which essentially depends on the open area ratio . The actual form of dependd on the weave pattern, the geometry of the fiber cross-section, etc. For an unclogged mesh made of pores, the total force is
For a partially clogged mesh with clogged pores, the mass flow rate was assumed to be redistributed uniformly on all the open pores. The total change in the volumetric flow rate because of clogging pores is
Assuming the change in the flowrate is distributed uniformly on the remaining open pores, the mean velocity at each open pore reads
The net force across the domain is
The friction force due to the flow in the open pores is
The pressure force which clogs pores is
The effect of the deformation of the droplet was assumed to be negligible. The drag force on a spherical water droplet was modeled as follows:
where the drag coefficient was computed using the Rivkind and Ryskin model [59] as follows:
Applying the force balance and equating the net force with the friction, clogging, and drag force leads to the following pressure drop model
where the free stream pressure is
The number of clogged pores was assumed to be computed from the clogged area as follows:
where is the total projected mesh area and is a fitting parameter, which takes into account the existence of the ‘shadow region’ between the downstream side of the droplet and the mesh. For the case of small droplets or negligible drag force, the pressure drop scales with the normalized clogged area as follows:
Using was found to fit the pressure drop values well, as shown in Figure 18. The relative deviation between the pressure drop model obtained using Equation (39) and CFD simulations is defined as follows:
Figure 18.
Comparison between the pressure drop from CFD simulations and fitting.
The relative deviation was found to be less than with an average deviation of The outliers and deviations in the results are due to the initial random position of the droplet, which was not always in the center of the domain. Moreover, in the presented simulations, the drag force was found to be negiligible in comparison to the pressure force because of partial clogging.
3.2.3. Breakthrough
The mechanism through which breakthrough occurs is shown in Figure 19. First, the increase of the pressure drop leads to an increase in the curvature of the fluid–fluid interface in the clogged pores as shown in Figure 19a. At a threshold value, the sub-droplets collide with each other and coalescence starts. The droplet starts to move through the pores as shown in Figure 19b. Finally, the coalescence of sub-droplets propagates until the whole droplet is in the downstream region of the wire mesh screen. Because of the hydrophobicity and the existence of pressure drop, the droplet moves downstream and is not captured anymore as shown in Figure 19c.
Figure 19.
Breakthrough mechanism of a water droplet through a wire mesh screen. (a) Sub-droplets start to form through clogged pores; (b) Coalescence of sub-droplets; (c) Breakthrough the wire mesh screen and the droplet is transported downstream.
This mechanism is similar to what was discussed in the bubble point test. Hence, the same model was adopted to describe the threshold pressure at which breakthrough occurs. From the approximated Young–Laplace equation (Equation (15)) for a single pore, the threshold pressure reads
where the maximum capillary pressure in a single pore is
Figure 20 shows the normalized averaged wetting versus the normalized pressure drop. All the data points of the captured droplets were found to be bounded with a pressure value of and an upper bound of the deformation . The data points of the droplets which broke through the mesh are not shown because they leave the domain and therefore they do not have a measurable clogging pressure or deformation on the surface of the wire mesh screen.
Figure 20.
Droplet deformation versus the normalized pressure.
Instead, Figure 21 shows the two possible outcomes (capture or breakthrough) versus the normalized predicted pressure drop using Equation (39). It can be seen that the data points (simulation results) can be separated by the line .
Figure 21.
Capture–breakthrough regimes for a large water droplet clogging a wire mesh screen in diesel. Green triangles represent captured droplets by the wire mesh screen and red triangles represent the droplets which are ruptured by the pressure force.
4. Conclusions
The interaction between small droplets or bubbles and wire mesh screens (separators) is vital for many applications: water–diesel separation, air–oil separation (demister), aerosol filtration, and solvent extraction. In the special case of water–diesel separation, the transport phenomena are capillary dominated because of the large viscosities and densities of both fluids. Fundamentally, the process of liquid–liquid separation combines two scales: (a) on the microscale, where the dominant length scale is the mean fiber radius, and (b) on the macroscale, where the overall pressure drop and the separation efficiency are important to quantify. Although different models describe the collective evolution of the separation efficiency and the pressure drop of separators, those models are empirical. Such models do not provide a clear description of the relationship between the interaction on the microscale and its consequences on the macroscopic model. The main outcomes of this study are:
- 1.
- Validation of the two-phase flow simulations by comparing the bubble point test simulations with experiments. The bubble point test is usually used to find an empirical parameter which fits the Young–Laplace equation to the measurement. The simulations showed validity and predictability in computing the threshold pressure. Hence, the fitting coefficient can be computed with good agreement from direct numerical simulations.
- 2.
- Quantification of the interaction of a single water droplet with a hydrophobic wire mesh screen in diesel. The simulations covered a wide range of capillary and Reynolds numbers. The obtained results were used to find correlations, which describe the radius of the clogging (wetting) contact line, the change in the droplet height, the pressure drop because of the reduction of the open surface area, and the criteria for droplet breakthrough.
Finally, the presented correlations help in understanding the influence of different parameters on the microscale, such as open area ratio, fiber radius, Young–Laplace contact angle, surface tension, and the mean inflow velocity on the dynamics and separation of water droplets. Moreover, the presented correlations can be used as a closure model for a macroscopic model of water–diesel separation based on the population balance equation (PBE).
Author Contributions
All persons who meet the authorship criteria are listed as authors, and all authors certify that they have participated sufficiently in the work as follows: O.E.: methodology, software, writing—original draft, writing—review and editing, experimental measurements, validation, simulations, and visualization. R.K.: conceptualization, methodology, supervision, and writing—review and editing. S.A.: supervision and writing—review and editing. S.O.: methodology and writing—review and editing. F.K.: experimental measurement, writing—review and editing (experimental sections). All authors have read and agreed to the published version of the manuscript.
Funding
This research received no external funding.
Acknowledgments
We would like to thank the Technische Universität Kaiserslautern (TUK), embedded in the emphasis of the Research Initiative “NanoKat” of the Federal State of Rhineland-Palatinate, for financial support.
Conflicts of Interest
The authors declare no conflict of interest.
References
- Stanfel, C. Fuel filtration: Protecting the diesel engine. Filtr. Sep. 2009, 46, 22–25. [Google Scholar] [CrossRef]
- Liu, X.; Guan, B.; Liu, X. Experimental Study on the Filtration Efficiency of Structured Packing Air Handling Processors. Procedia Eng. 2015, 121, 2037–2043. [Google Scholar] [CrossRef] [Green Version]
- Brown, R.; Wake, D. Loading filters with monodisperse aerosols: Macroscopic treatment. J. Aerosol Sci. 1999, 30, 227–234. [Google Scholar] [CrossRef]
- Kim, C.; Pui, D.Y. Experimental study on the filtration efficiency of activated carbons for 3–30 nm particles. Carbon 2015, 93, 226–229. [Google Scholar] [CrossRef]
- Japuntich, D.; Stenhouse, J.; Liu, B. Experimental results of solid monodisperse particle clogging of fibrous filters. J. Aerosol Sci. 1994, 25, 385–393. [Google Scholar] [CrossRef]
- Konda, A.; Prakash, A.; Moss, G.A.; Schmoldt, M.; Grant, G.D.; Guha, S. Response to Letters to the Editor on Aerosol Filtration Efficiency of Common Fabrics Used in Respiratory Cloth Masks: Revised and Expanded Results. ACS Nano 2020, 14, 10764–10770. [Google Scholar] [CrossRef] [PubMed]
- Iliev, O.; Kirsch, R.; Osterroth, S. Combined Depth and Cake Filtration Model Coupled with Flow Simulation for Flat and Pleated Filters. Chem. Eng. Technol. 2018, 41, 70–78. [Google Scholar] [CrossRef]
- Iliev, O.R.; Kirsch, Z.; Lakdawala, S.R.; Steiner, K. Currents in Industrial Mathematics: From concepts to research to education. In Currents in Industrial Mathematics; Springer: Berlin/Heidelberg, Germany, 2015; pp. 1–403. [Google Scholar]
- Kulkarni, P.S.; Patel, S.U.; Chase, G.G. Layered hydrophilic/hydrophobic fiber media for water-in-oil coalescence. Sep. Purif. Technol. 2012, 85, 157–164. [Google Scholar] [CrossRef]
- Kulkarni, P.S.; Patel, S.U.; Patel, S.U.; Chase, G.G. Coalescence filtration performance of blended microglass and electrospun polypropylene fiber filter media. Sep. Purif. Technol. 2014, 124, 1–8. [Google Scholar] [CrossRef]
- Patel, S.U.; Chase, G.G. Separation of water droplets from water-in-diesel dispersion using superhydrophobic polypropylene fibrous membranes. Sep. Purif. Technol. 2014, 126, 62–68. [Google Scholar] [CrossRef]
- Lu, H.; Yang, Q.; Liu, S.; Xie, L.-S.; Wang, H.-L. Effect of fibrous coalescer redispersion on W/O emulsion separation. Sep. Purif. Technol. 2016, 159, 50–56. [Google Scholar] [CrossRef]
- Kampa, D.; Wurster, S.; Buzengeiger, J.; Meyer, J.; Kasper, G. Pressure drop and liquid transport through coalescence filter media used for oil mist filtration. Int. J. Multiph. Flow 2014, 58, 313–324. [Google Scholar] [CrossRef]
- Lao, C.T.; Akroyd, J.; Eaves, N.; Smith, A.; Morgan, N.; Bhave, A.; Kraft, M. Modelling particle mass and particle number emissions during the active regeneration of diesel particulate filters. Proc. Combust. Inst. 2019, 37, 4831–4838. [Google Scholar] [CrossRef] [Green Version]
- Song, M.; Steiff, A.; Weinspach, P.-M. A very effective new method to solve the population balance equation with particle-size growth. Chem. Eng. Sci. 1997, 52, 3493–3498. [Google Scholar] [CrossRef]
- Cheung, S.C.; Yeoh, G.; Tu, J. On the modelling of population balance in isothermal vertical bubbly flows—Average bubble number density approach. Chem. Eng. Process. Process. Intensif. 2007, 46, 742–756. [Google Scholar] [CrossRef] [Green Version]
- Cheung, S.C.; Yeoh, G.H.; Tu, J. A Review of Population Balance Modelling for Isothermal Bubbly Flows. J. Comput. Multiph. Flows 2009, 1, 161–199. [Google Scholar] [CrossRef] [Green Version]
- Koch, B.M.L.; Amirfazli, A.; Elliott, J.A.W. Modeling and Measurement of Contact Angle Hysteresis on Textured High-Contact-Angle Surfaces. J. Phys. Chem. C 2014, 118, 18554–18563. [Google Scholar] [CrossRef]
- Chibowski, E.; Jurak, M. Comparison of contact angle hysteresis of different probe liquids on the same solid surface. Colloid Polym. Sci. 2013, 291, 391–399. [Google Scholar] [CrossRef] [PubMed] [Green Version]
- Wang, J.; Wu, Y.; Cao, Y.; Li, G.; Liao, Y. Influence of surface roughness on contact angle hysteresis and spreading work. Colloid Polym. Sci. 2020, 298, 1107–1112. [Google Scholar] [CrossRef]
- Elhaj, M.A.; Hossain, M.E.; Imtiaz, S.A.; Naterer, G.F. Hysteresis of wettability in porous media: A review. J. Pet. Explor. Prod. Technol. 2020, 10, 1897–1905. [Google Scholar] [CrossRef] [Green Version]
- Wenzel, R.N. Resistance of Solid Surfaces to Wetting by Water. Ind. Eng. Chem. 1936, 28, 988–994. [Google Scholar] [CrossRef]
- Elzaabalawy, A.; Meguid, S.A. Effect of surface topology on the wettability of superhydrophobic surfaces. J. Dispers. Sci. Technol. 2020, 41, 470–478. [Google Scholar] [CrossRef]
- Zhao, H.; Park, K.-C.; Law, K.-Y. Effect of Surface Texturing on Superoleophobicity, Contact Angle Hysteresis, and “Robustness”. Langmuir 2012, 28, 14925–14934. [Google Scholar] [CrossRef] [PubMed]
- Kim, D.; Pugno, N.M.; Ryu, S. Wetting theory for small droplets on textured solid surfaces. Sci. Rep. 2016, 6, 37813. [Google Scholar] [CrossRef] [PubMed]
- Chatain, D.; Lewis, D.; Baland, J.-P.; Carter, W.C. Numerical Analysis of the Shapes and Energies of Droplets on Micropatterned Substrates. Langmuir 2006, 22, 4237–4243. [Google Scholar] [CrossRef] [PubMed]
- Amrei, M.; Davoudi, M.; Chase, G.; Tafreshi, H.V. Effects of roughness on droplet apparent contact angles on a fiber. Sep. Purif. Technol. 2017, 180, 107–113. [Google Scholar] [CrossRef] [Green Version]
- He, L.; Sui, X.; Liang, W.; Wang, Z.; Akbarzadeh, A. Numerical analysis of anisotropic wetting of chemically striped surfaces. RSC Adv. 2018, 8, 31735–31744. [Google Scholar] [CrossRef] [Green Version]
- Jamali, M.; Tafreshi, H.V.; Pourdeyhimi, B. Droplet Mobility on Hydrophobic Fibrous Coatings Comprising Orthogonal Fibers. Langmuir 2018, 34, 12488–12499. [Google Scholar] [CrossRef]
- Brakke, K.A. The surface evolver. Exp. Math. 1992, 1, 141–165. [Google Scholar] [CrossRef]
- Lorenceau, É.; Clanet, C.; Quéré, D. Capturing drops with a thin fiber. J. Colloid Interface Sci. 2004, 279, 192–197. [Google Scholar] [CrossRef]
- Sher, E.; Haim, L.; Sher, I. Off-centered impact of water droplets on a thin horizontal wire. Int. J. Multiph. Flow 2013, 54, 55–60. [Google Scholar] [CrossRef]
- Lorenceau, E.; Clanet, C.; Quéré, D.; Vignes-Adler, M. Off-centre impact on a horizontal fibre. Eur. Phys. J. Spec. Top. 2009, 166, 3–6. [Google Scholar] [CrossRef]
- Dressaire, E.; Sauret, A.; Boulogne, F.; Stone, H.A. Drop impact on a flexible fiber. R. Soc. Soft Matter. 2016, 1, 200–216. [Google Scholar] [CrossRef] [PubMed] [Green Version]
- Comtet, J.; Keshavarz, B.; Bush, J.W.M. Drop impact and capture on a thin flexible fiber. R. Soc. Soft Matter. 2016, 1, 149–156. [Google Scholar] [CrossRef]
- Ramstad, T.; Berg, C.F.; Thompson, K. Pore-Scale Simulations of Single- and Two-Phase Flow in Porous Media: Approaches and Applications. Transp. Porous Media 2019, 130, 77–104. [Google Scholar] [CrossRef]
- Carrillo, F.J.; Bourg, I.C.; Soulaine, C. Multiphase flow modeling in multiscale porous media: An open-source micro-continuum approach. J. Comput. Phys. X 2020, 8, 100073. [Google Scholar] [CrossRef]
- Alamooti, A.H.M.; Azizi, Q.; Davarzani, H. Direct numerical simulation of trapped-phase recirculation at low capillary number. Adv. Water Resour. 2020, 145, 103717. [Google Scholar] [CrossRef]
- Shams, M.; Raeini, A.Q.; Blunt, M.J.; Bijeljic, B. A numerical model of two-phase flow at the micro-scale using the volume-of-fluid method. J. Comput. Phys. 2018, 357, 159–182. [Google Scholar] [CrossRef]
- Fakhari, A.; Li, Y.; Bolster, D.; Christensen, K.T. A phase-field lattice Boltzmann model for simulating multiphase flows in porous media: Application and comparison to experiments of CO2 sequestration at pore scale. Adv. Water Resour. 2018, 114, 119–134. [Google Scholar] [CrossRef]
- Das, S.; Patel, H.V.; Milacic, E.; Deen, N.G.; Kuipers, J.A.M. Droplet spreading and capillary imbibition in a porous medium: A coupled IB-VOF method based numerical study. Phys. Fluids 2018, 30, 012112. [Google Scholar] [CrossRef]
- Hirt, C.W.; Nichols, B.D. Volume of fluid (VOF) method for the dynamics of free boundaries. J. Comput. Phys. 1981, 39, 201–225. [Google Scholar] [CrossRef]
- Xiao, W.; Zhang, H.; Luo, K.; Mao, C.; Fan, J. Immersed boundary method for multiphase transport phenomena. Rev. Chem. Eng. 2020. [Google Scholar] [CrossRef]
- Cummins, S.J.; Francois, M.M.; Kothe, D.B. Estimating curvature from volume fractions. Comput. Struct. 2005, 83, 425–434. [Google Scholar] [CrossRef]
- Raeini, A.Q.; Blunt, M.; Bijeljic, B. Modelling two-phase flow in porous media at the pore scale using the volume-of-fluid method. J. Comput. Phys. 2012, 231, 5653–5668. [Google Scholar] [CrossRef]
- Hoang, D.A.; van Steijn, V.; Portela, L.M.; Kreutzer, M.; Kleijn, C.R. Benchmark numerical simulations of segmented two-phase flows in microchannels using the Volume of Fluid method. Comput. Fluids 2013, 86, 28–36. [Google Scholar] [CrossRef]
- Elsayed, O.; Kirsch, R.; Osterroth, S.; Antonyuk, S. An improved scheme for the interface reconstruction and curvature approximation for flow simulations of two immiscible fluids. Int. J. Multiph. Flow 2021, 103805. [Google Scholar] [CrossRef]
- GKD. Improved accuracy in bubble point measurement. Filtr. Sep. 2017, 54, 38–41. [Google Scholar] [CrossRef]
- BSI. Method for Measurement of the Equivalent Pore Size of Fabrics (Bubble Pressure Test); British Standards Institution: London, UK, 1986. [Google Scholar]
- Goldman, R. Curvature formulas for implicit curves and surfaces. Comput. Aided Geom. Des. 2005, 22, 632–658. [Google Scholar] [CrossRef]
- Mayost, D. Applications of the Signed Distance Function to Surface Geometry. Ph.D. Thesis, University of Toronto, Toronto, ON, Canada, 2014. Available online: http://www.math.toronto.edu/mccann/papers/Mayost_Daniel_201406_PhD_thesis.pdf (accessed on 1 August 2021).
- Geodict, The Virtual Material Laboratory. ©2001–2011 Fraunhofer ITWM, ©2012–2021 Math2Market GmbH, 2001. Available online: https://www.math2market.com/ (accessed on 1 June 2021).
- Weller, H.G.; Tabor, G.; Jasak, H.; Fureby, C. A tensorial approach to computational continuum mechanics using object-oriented techniques. Comput. Phys. 1998, 12, 620–631. [Google Scholar] [CrossRef]
- Jasak, H. Error Analysis and Estimation for Finite Volume Method with Applications to Fluid Flow. Ph.D. Thesis, Imperial College, London, UK, 1996. [Google Scholar]
- Versteeg, H.K.; Malalasekera, W. An Introduction to Computational Fluid Dynamics the Finite Volume Method, 2nd ed.; Pearson Prentice Hall: Hoboken, NJ, USA, 2007. [Google Scholar]
- Courant, R.; Friedrichs, K.; Lewy, H. Über die partiellen Differenzengleichungen der mathematischen Physik. Math. Ann. 1928, 100, 32–74. [Google Scholar] [CrossRef]
- Roenby, J.; Bredmose, H.; Jasak, H. A computational method for sharp interface advection. R. Soc. Open Sci. 2016, 3, 160405. [Google Scholar] [CrossRef] [PubMed] [Green Version]
- Topas-Gmbh. PSM 165—Capillary Flow Pore Size Meter. Available online: https://www.topas-gmbh.de/en/produkte/psm-165/ (accessed on 1 June 2021).
- Rivkind, V.Y.; Ryskin, G.M. Flow structure in motion of a spherical drop in a fluid medium at intermediate Reynolds numbers. Fluid Dyn. 1977, 11, 5–12. [Google Scholar] [CrossRef]
Publisher’s Note: MDPI stays neutral with regard to jurisdictional claims in published maps and institutional affiliations. |
© 2021 by the authors. Licensee MDPI, Basel, Switzerland. This article is an open access article distributed under the terms and conditions of the Creative Commons Attribution (CC BY) license (https://creativecommons.org/licenses/by/4.0/).


