Abstract
Studies of shock-vortex interactions in the past have predominantly been numerical, with a number of idealizations such as assuming an isolated vortex and a plane shock wave. In the present case the vortex is generated from flow separation at a corner. A shear layer results which wraps up into a spiral vortex. The flow is impulsively initiated by the diffraction of a shock wave over the edge. The strength of the shock determines the nature of the flow at the corner and that induced behind the diffracted wave. A wide variety of cases are considered using different experimental arrangements such as having two independent shock waves arriving at the corner at different times, to reflecting the diffracting wave off different surfaces back into the vortex, and to examining the flow around bends where the reflection off the far wall reflects back onto the vortex. The majority of studies have shown that the vortex normally retains its integrity after shock transit. Some studies with curved shock waves and numerous traverses have shown evidence of vortex breakup and the development of turbulent patches in the flow, as well as significant vortex stretching. Depending on the direction of approach of the shock wave it refracts through the shear layer thereby changing the strength and direction of both. Of particular note is that the two diffracted waves which emerge from the vortex as the incident wave passes through interact with each other resulting in a pressure spike of considerable magnitude. An additional spike is also identified.
PACS:
4740Nm
1. Introduction
Shock-vortex interactions have been the subject of extensive computational, theoretical and experimental studies over many years. One of the earliest experiments was a schlieren study of the interaction [1]. They observed the generation of acoustic waves which became a major area of subsequent research. The response to this finding led to an early investigation [2], followed by a more extensive treatment some years later [3]. The theory developed showed good agreement with pressure measurements of the emerging wave [4] done by Dosanjh and Weeks. Following this work important numerical results on the nature of the acoustic waves of different strengths was done by Ellzey et al. [5] who commented on the development of the complex regular and Mach reflection wave systems that evolve between the incident and transmitted waves, and the quadrupolar nature of the acoustic emission. In a later paper [6] more details of the interaction and the reasons for the the development of the acoustic wave were given, as being due to distortion of the shock wave and the associated vortex compression. A later detailed numerical study of the early development in the interaction placed the emphasis on the development of the reflected shock waves [7]. A further detailed numerical study by Zhang et al. [8] between strong shock waves interacting with a strong vortex identified a multistage feature with the development of shocklets and multiple sound waves. The multiple wave feature was examined further by Chatterjee and Vijayaraj [9] using a large computational domain and high-order simulation which showed more waves than previously identified which were produced by the deformed rotating vortex. Various cases of the interaction depending on relative strengths of the shock wave and vortex have been given by Chang et al. [10] using numerical shadowgraphs in order to discuss the interaction process.
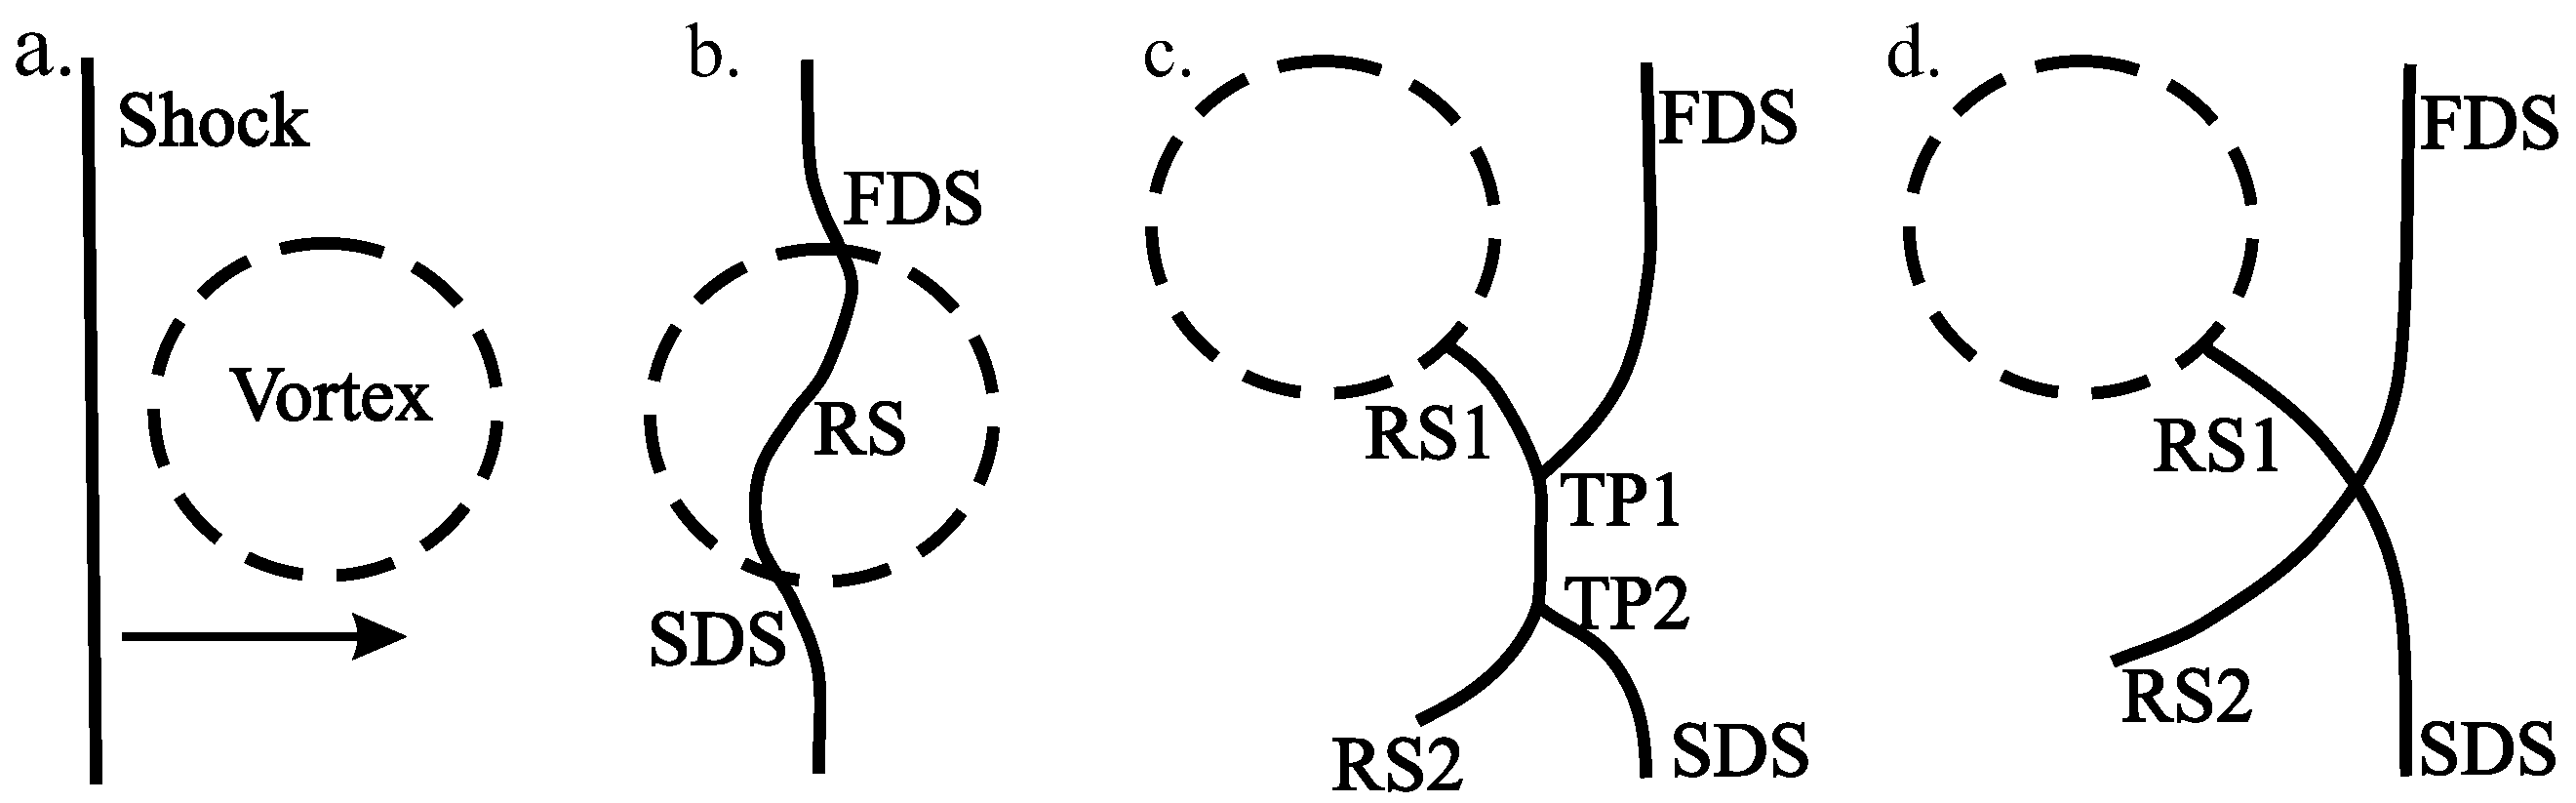
It is evident from the above discussion that the development in the study of shock-vortex interactions has predominantly been numerical, almost entirely so for the past 30 years, and has concentrated on the mechanism for the development of acoustic waves. The predominant model used is for an isolated vortex and a plane shock wave. The pattern of wave interaction as described in [5] is shown in Figure 1 and is that dealt with in many other works.
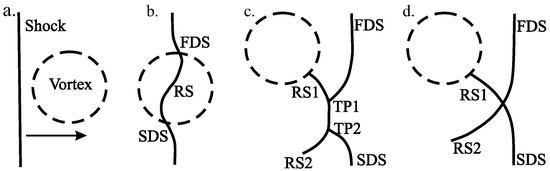
Figure 1.
The complex shock wave-vortex interaction. (a) Prior to interaction, (b) early stages, (c) stage for a strong shock and strong vortex, (d) stage for a weak shock and strong vortex.
As the shock enters the vortex it is distorted due the the vortex velocity distribution which results in refraction of the shock profile, RS, as shown in Figure 1b. This results in the fast diffracted shock, FDS, as the shock is pushed forward and a slow diffracted shock, SDS, where it is retarded. For a strong shock interacting with a strong vortex the waves then interact producing a pair of Mach reflections with associated reflected waves, RS1 and RS2, and triple points, TP1 and TP2. For the interaction of a weak shock and strong vortex the interaction between the diffracted shocks results in a regular reflection.
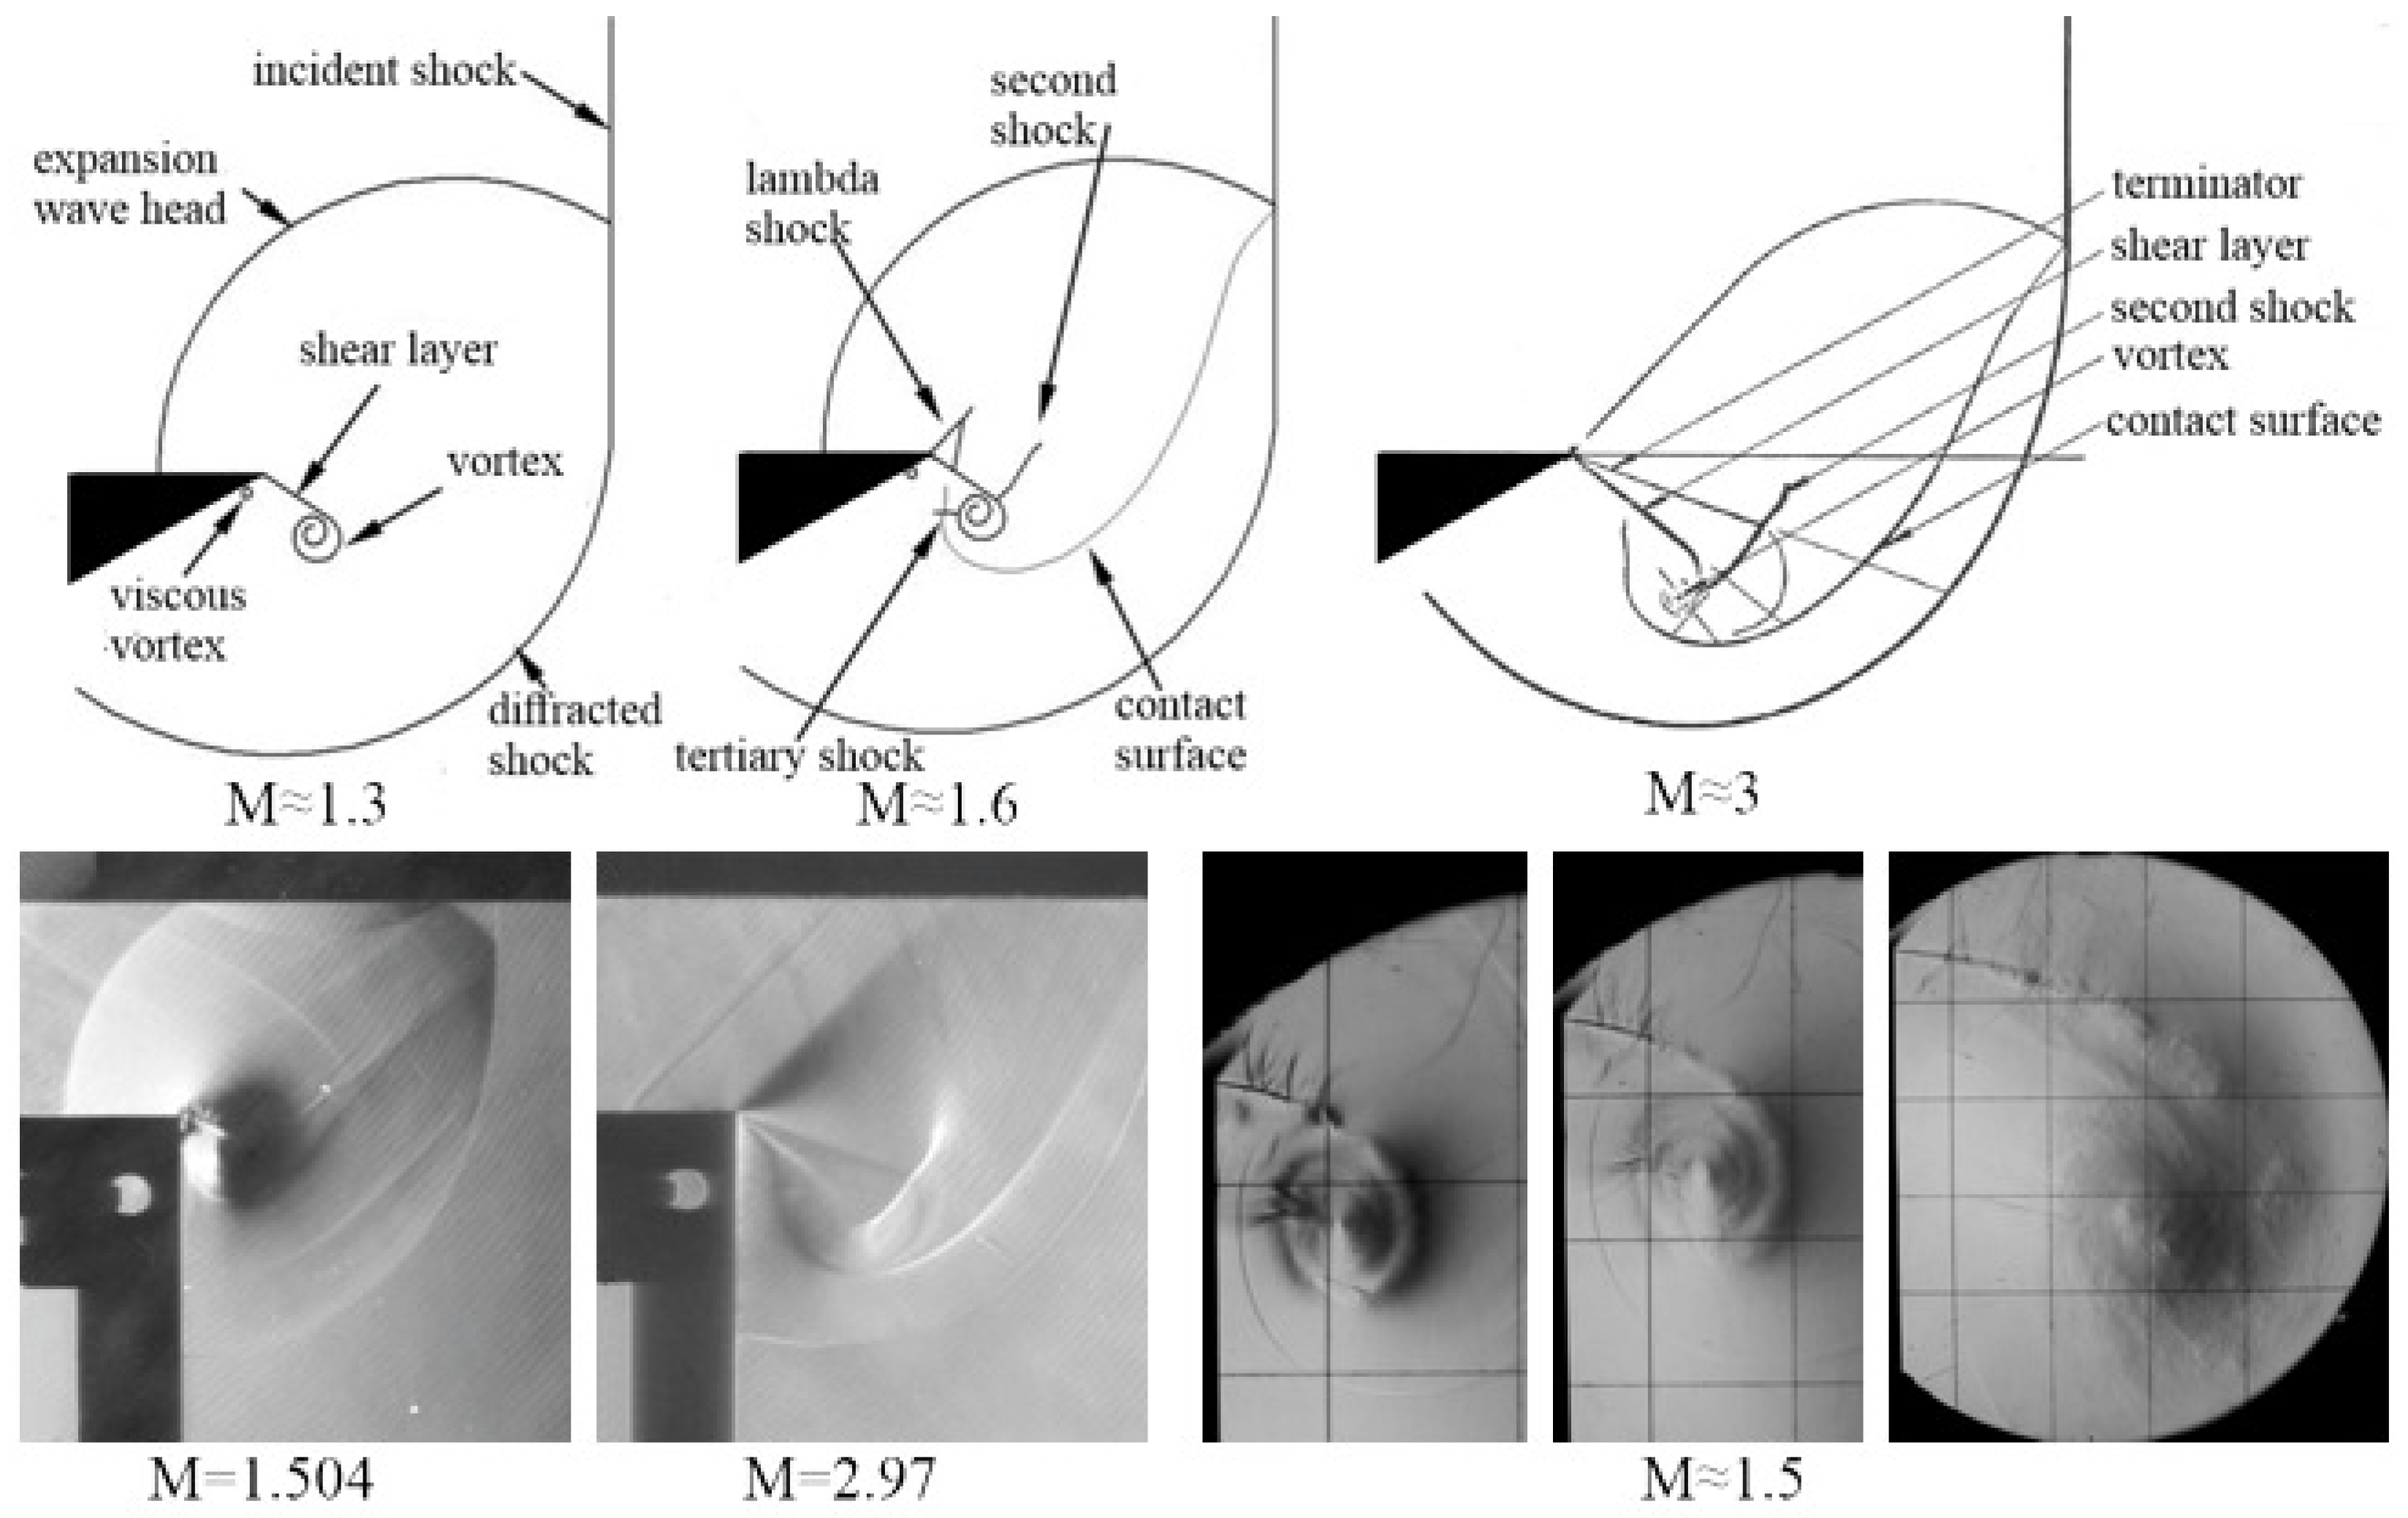
The experimental work reviewed in this paper was initiated based on the study of shock wave propagation around bends [11,12]. In that case and others discussed subsequently the vortex produced results from the diffraction of a shock wave around a corner and is significantly different from the ideal isolated vortex case. This shock wave diffraction is treated in [13]. The vortex in that realistic case is spiral in nature with typical cases given in Figure 2. For a shock Mach number greater than 2.07 the flow behind the shock becomes supersonic resulting in a markedly change in the downstream flow.

Figure 2.
Flow development due to shock wave diffraction. Sketches show the main features noting the differences between subsonic and supersonic post-shock flow. The first two images of the bottom row show flow features, and the remaining three images a large scale experiment showing the nature of the shear layer and vortex. The reference lines are 50 mm apart.
The row of sketches show the main features for different incident shock Mach numbers. The main items of interest are the shear layer which wraps around the shed vortex, the vortex structure, and the appearance of embedded shock waves. As the incident shock Mach number is about 1.6 the flow immediately above the shear layer becomes supersonic with the appearance of weak shocks in a lambda format. A further shock may appear further downstream as the flow accelerates around the vortex. Additional shocks can appear on the opposite side as the flow must decelerate as it approaches the underside of the shear layer. The vortex is also surrounded by a contact surface which is the dividing surface between the gas that was there before the shock arrived at the corner and has moved downstream and the gas that has been influenced by the diffracting shock. The first two frames in the bottom row shows typical experimental results of the full flow field and the remaining frames an unusually large scale experiment showing the evolution of the shear layer and vortex. Both the lambda shock and embedded shock are evident but in addition small vortices develop along the length of the shear layer as well as it becoming increasingly turbulent.
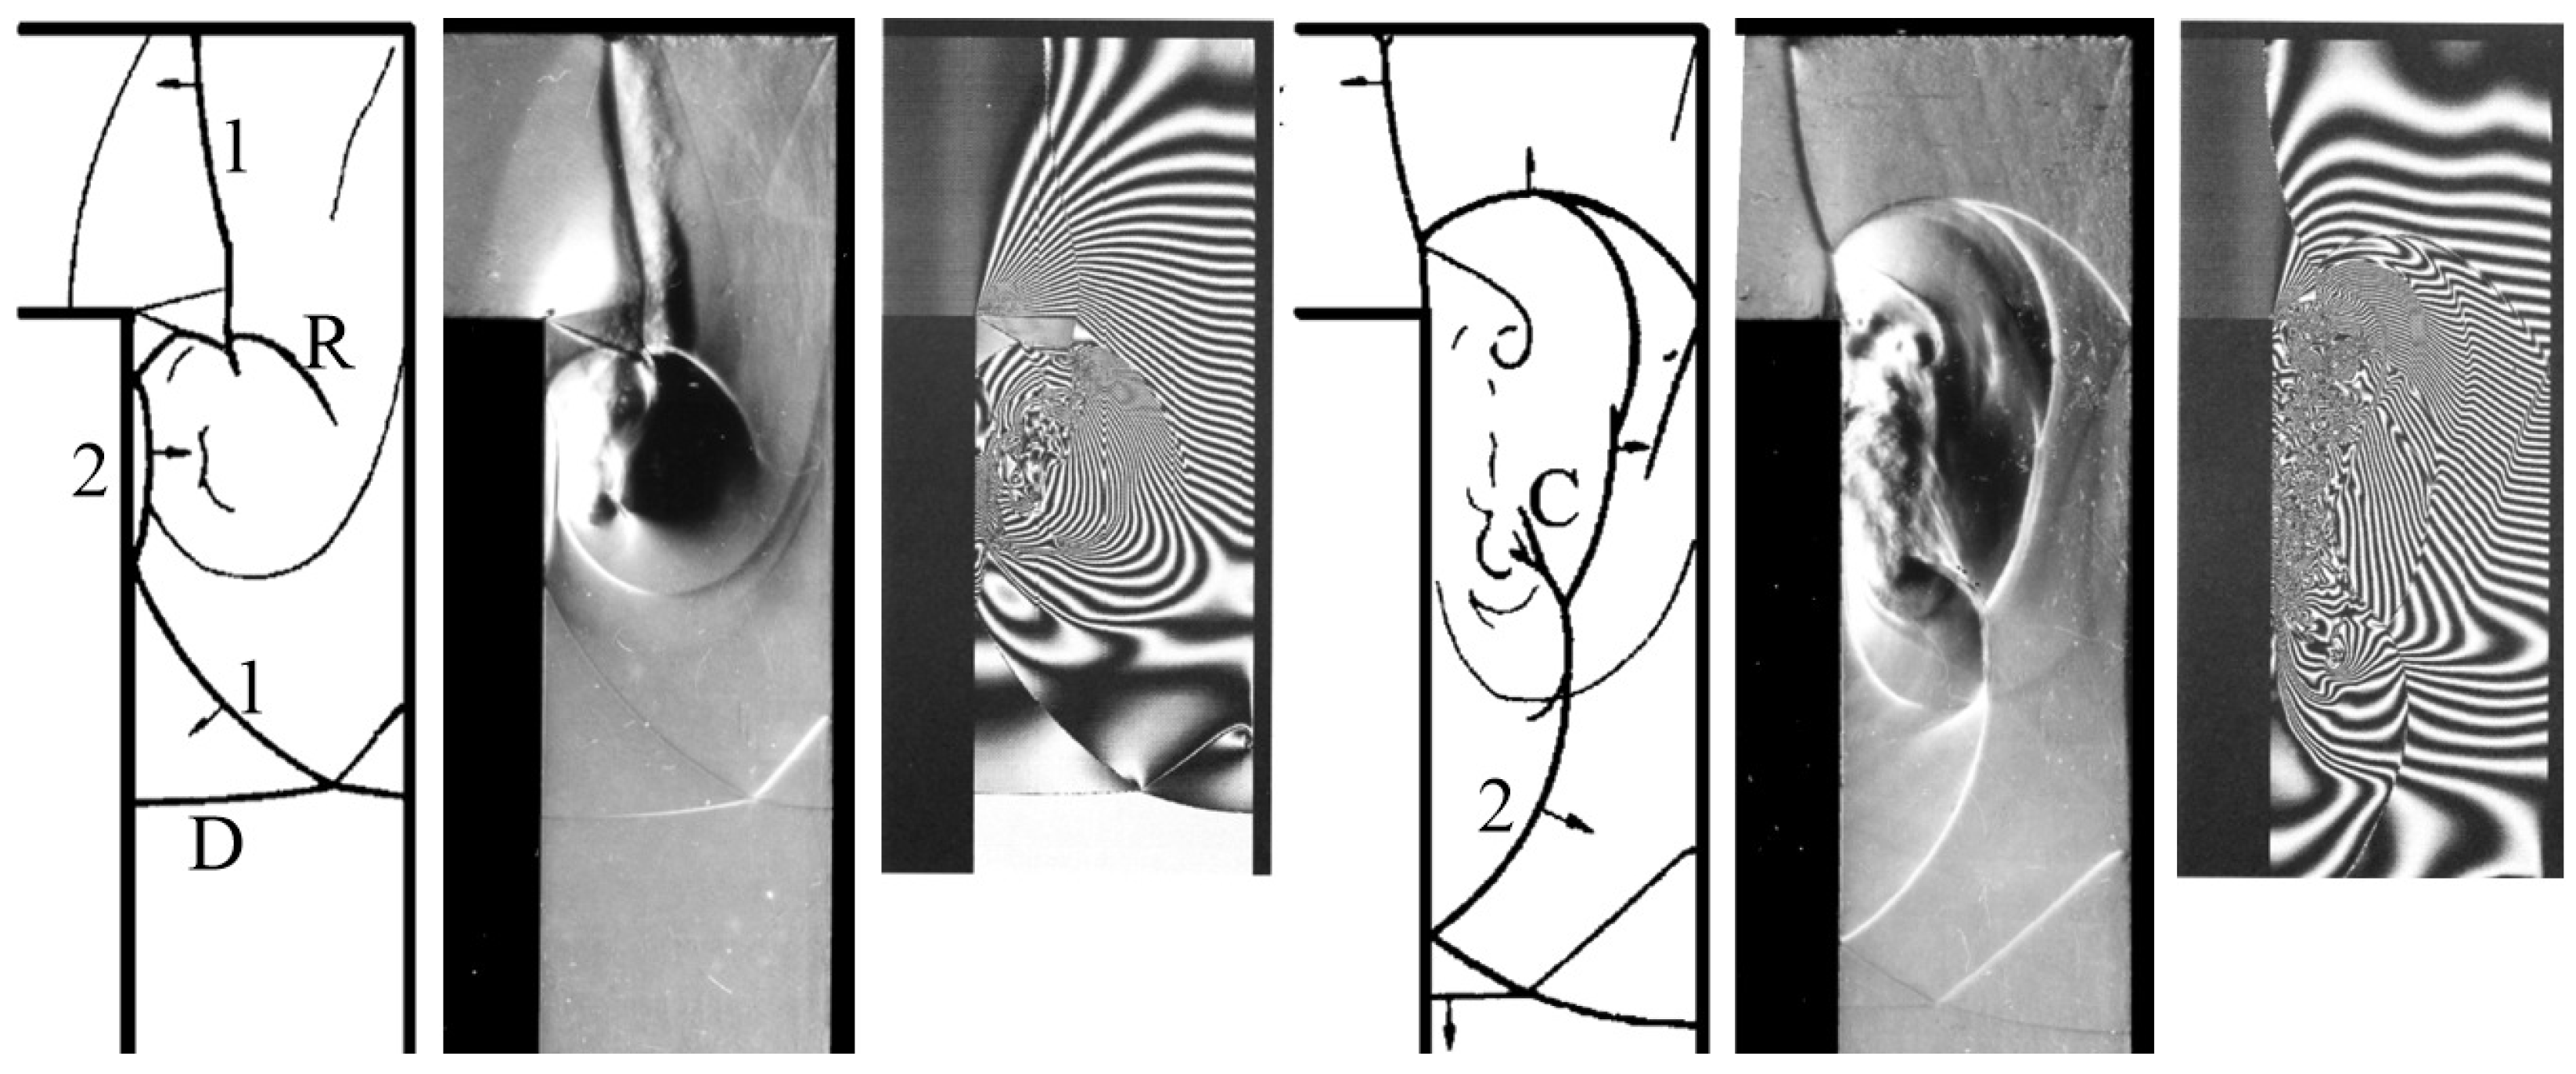
The flow around a bend is particularly interesting since it gives evidence of some vortex disruption and regions of turbulence, which contrasts to the general view of a vortex being very stable. Examples for propagation around a number of bends was given in [12]. A detailed interferometric study for comparison with some results of the above experimental study was undertaken by Timofeev et al. [14] for the case of a Mach 2 wave around a bend. A sketch of two cases, as the flow progresses, are given in Figure 3 together with corresponding experimental results and the comparative interferograms. In both cases a sketch of the main features is given followed by a schlieren image and an interferogram taken at similar times. The first set covers the case after the first transit of the vortex. The shock, D, is part of the initial diffracted wave on the corner which has reflected off the right-hand surface as shock, 1, which passes through the vortex and has just started to reflect off the left-hand surface as wave 2. Wave 1 propagates all the way up to the upper surface of the bend. The center of the vortex is well defined in the schlieren image, with the contact surface below it, but the upper region of vortex flow is influenced by the expansion wave and shear layer arising from the bend corner and their interaction with shock 1 giving rise to a reflected wave, R. The wide region behind wave 1 at the top of the bend is due to the development of a lambda shock on the tests section window as the wave propagates into the oncoming flow.
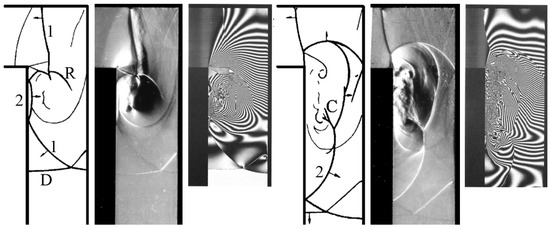
Figure 3.
Sketch, schlieren and interferograms. The first three are after first shock transit and the second three after second transit.
As wave 2 propagates through the region disturbed by wave 1 it merges with it near the top surface and interesting effects occur in the region of the vortex center at C. The upper part of wave 2 is accelerated due to the vortex motion whilst the lower part is slowed down. These then meet in a regular reflection resulting in a reflected wave which appears to fan out in the region of the vortex. This unusual feature is examined later. An important feature of the overall interaction is that the flow adjacent to the left-hand surface becomes turbulent.
2. Materials and Methods
The major facilities for generating shock waves are shock tubes in a variety of arrangements. In the current study two formats are used: In the first; a simple tube with two chambers initially at different pressures separated by a frangible diaphragm. A shock wave propagates down one section on diaphragm removal. The arrangement in the test section is shown in Figure 4. Part of the incident shock is cut out to pass over the diffracting edge which can have different profiles. The diffracting shock wave is then reflected off a surface situated downstream in order to generate a reflected wave to impact the vortex.
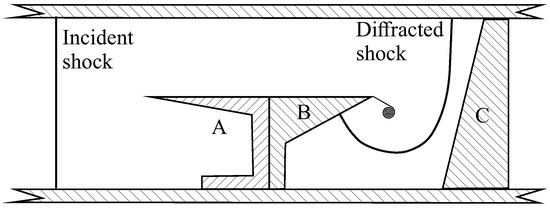
Figure 4.
Testpiece arrangemnt. Part A is the ‘cookie cutter’, part B the diffracting wedge and part C the reflecting surface to produce the transmitting wave into the vortex.
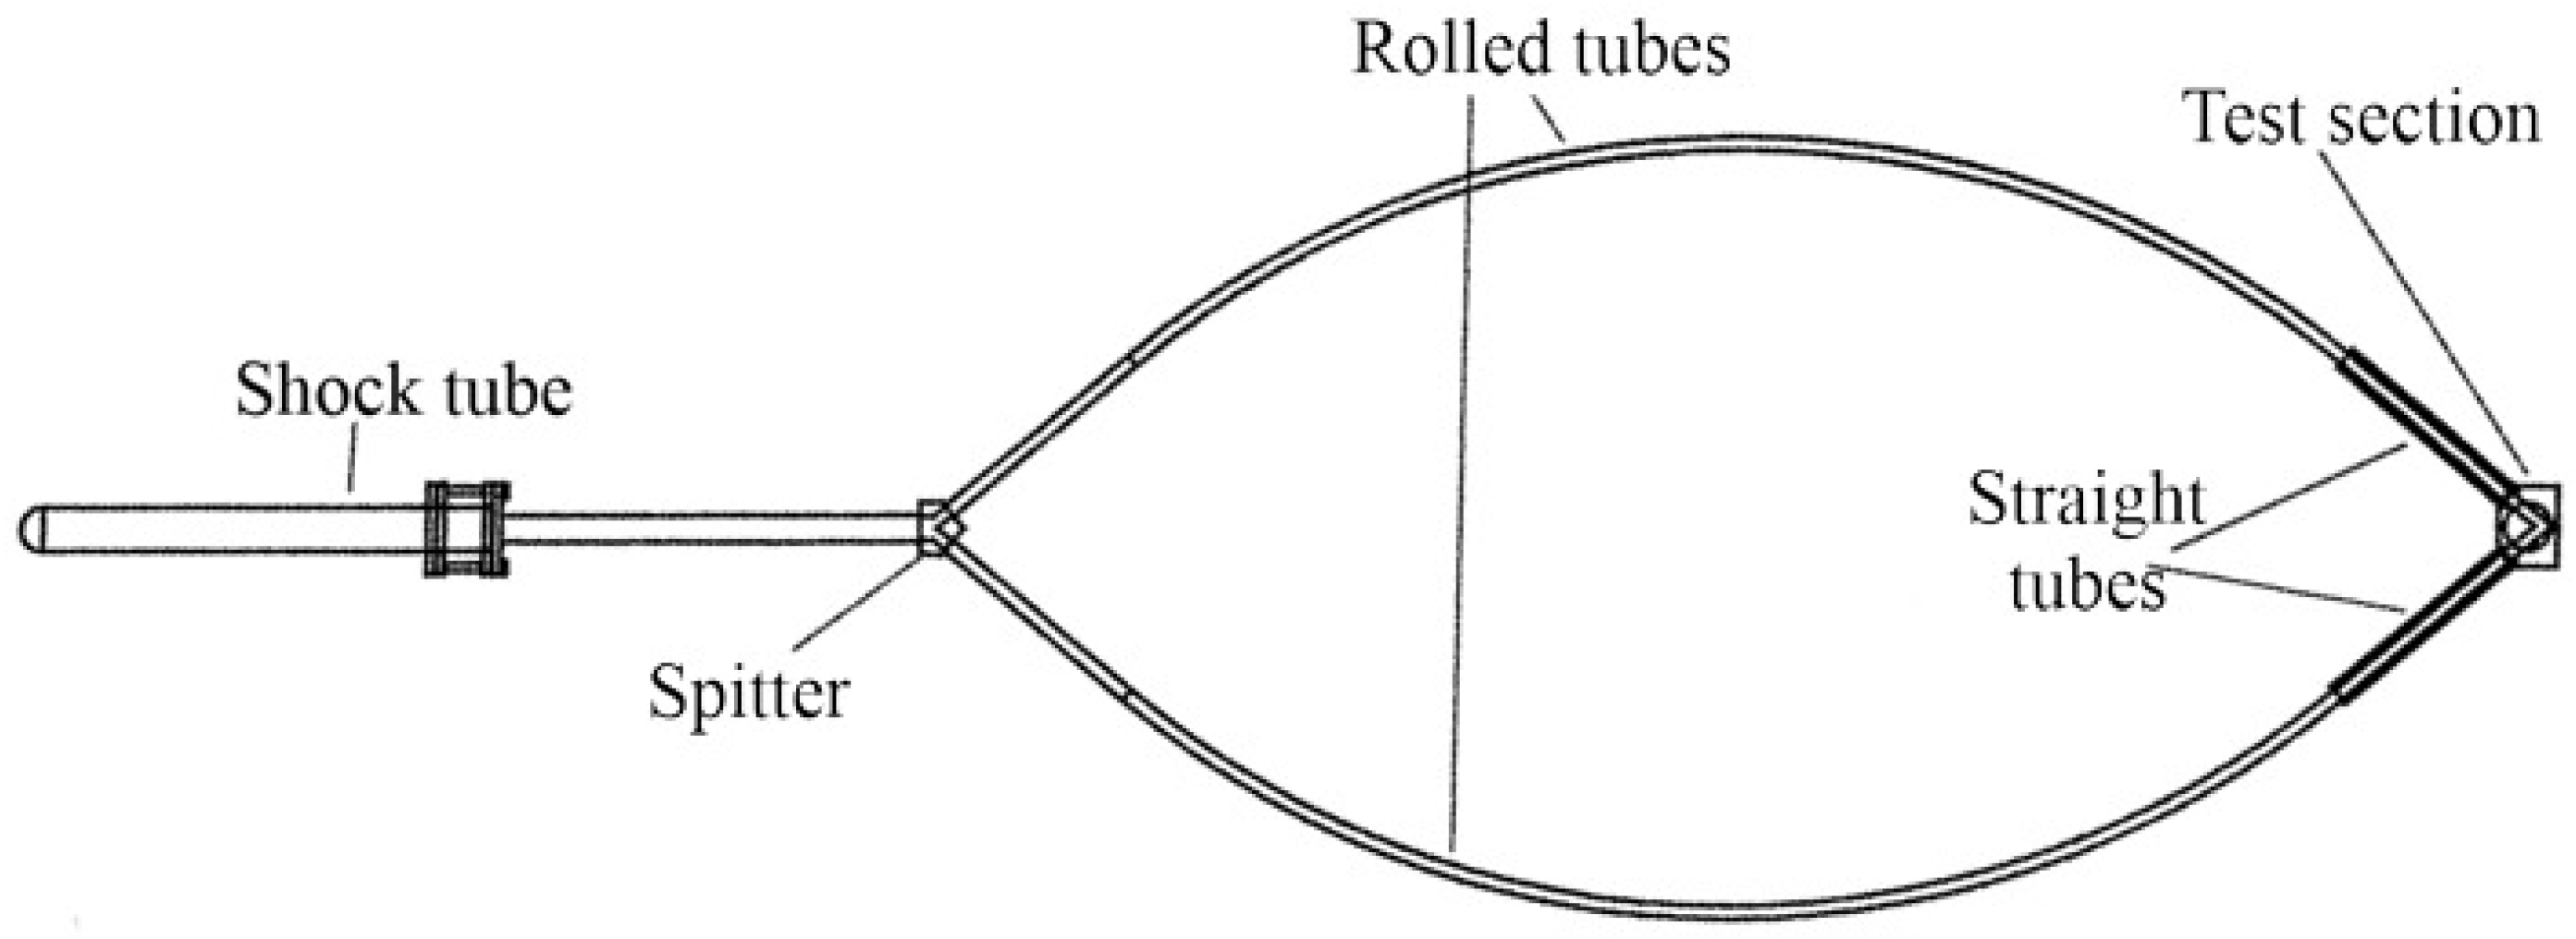
In the second format, shown in Figure 5, the shock wave from the shock tube is spit into two waves which then interact with each other in the test section with arrival times determine by the lengths of the rolled tubes. The tube heights are 44 mm. In all cases the vortex is generated from the diffraction of the early arriving shock around the edge of a test piece which is then impacted by the late arriving wave.

Figure 5.
Bifurcated shock tube for generating two independent shock waves.
Contact laser shadowgraphs were employed in many cases. This was done by placing a 4 inch by 5 inch holographic film against the far-side test-section window.A pulsed ruby laser with an expanded beam was used, with a pulse duration of 30 ns, for illumination. Thus a high resolution image was obtained with a magnification of unity and minimal optical aberration.
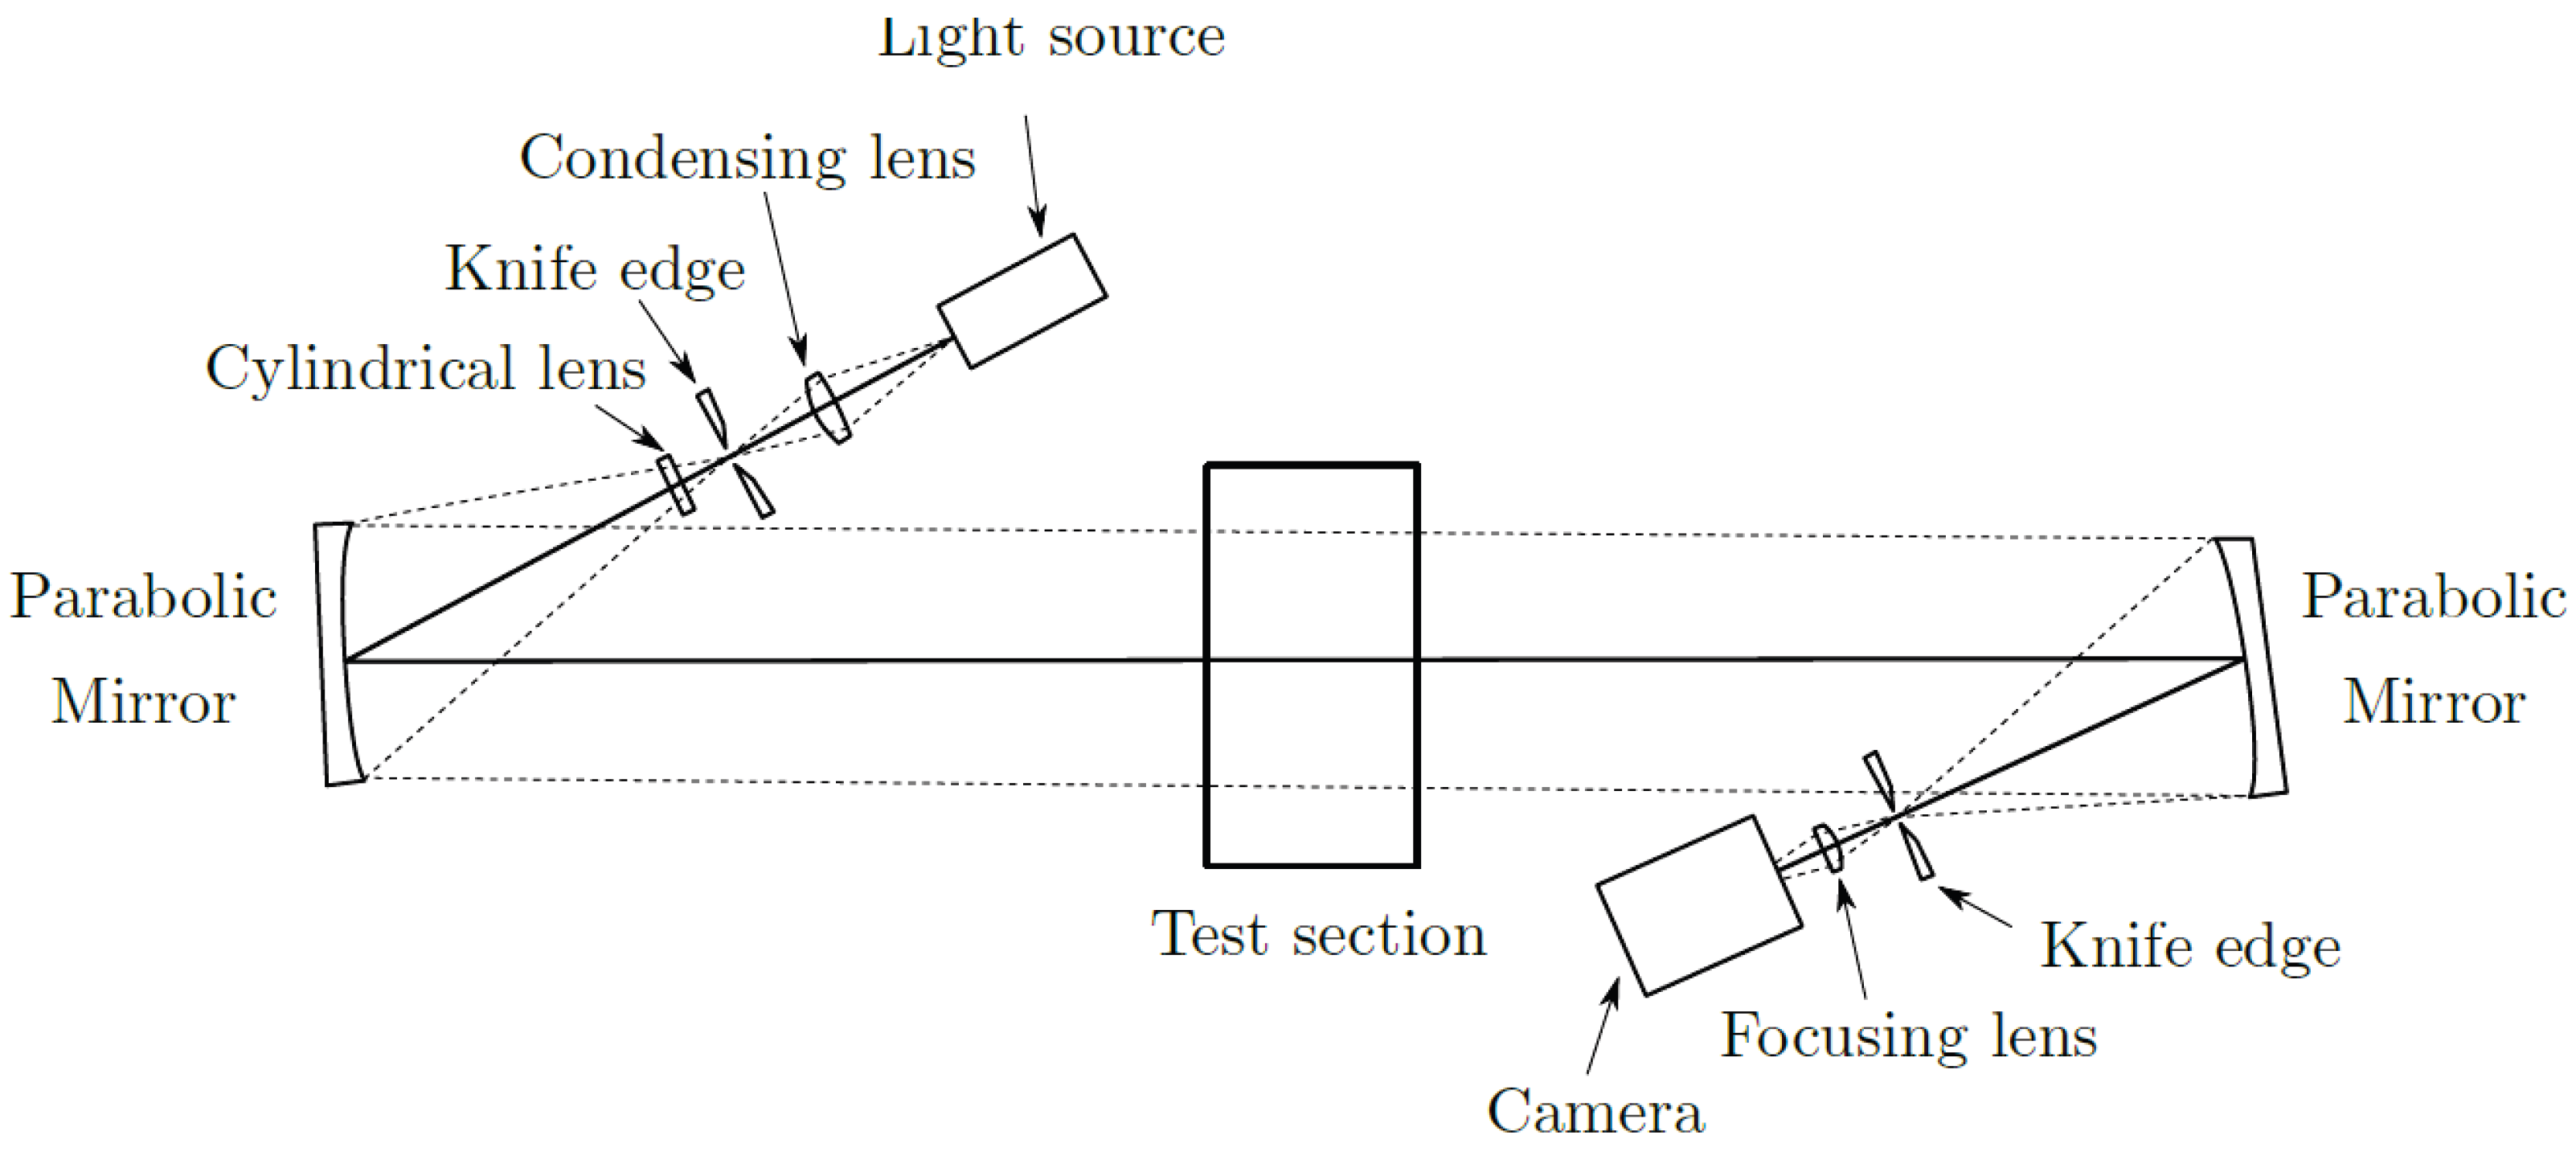
For standard shadowgraphs a schlieren visualization system is used based on the standard z-format shown in Figure 6 and is used in either schlieren or shadowgraph mode. Either single shot images are taken with a short duration light source or movies with a continuous source and a high-speed camera.
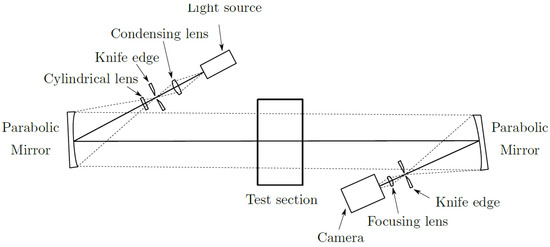
Figure 6.
Z-format schlieren optical arrangement.
Numerical simulations were done with an in-house code using a finite element Taylor-Galerkin scheme [15] which has been validated through a number of studies as well as in this work, as discussed below. A Flux-Corrected Transport algorithm together with an adaptive refinement algorithm was used to obtain high resolution of discontinuities. In order to facilitate comparison with experiment and to enhance the visibility of the flow structure, numerical schlieren images were computed. These were formed by calculating the first derivative of the density matrix. In order to compute numerical colour schlieren images the density gradient matrices in the x and y directions were first calculated. The components of the density gradients perpendicular to three virtual cut-off colour filters (knife-edges) inclined at to each other, (red along the x-axis, green inclined at to the x-axis and blue inclined at to the x-axis), were then obtained using the x and y density gradient matrices. The three resulting matrices were first thresholded by a factor of 10 and then combined to form the red, green and blue components of a true-colour RGB image. The resulting colour schlieren image is more sensitive to gradual changes in density than shadowgraphs and thus shows additional features such as expansion waves.
3. Results
3.1. Single Shock Passage
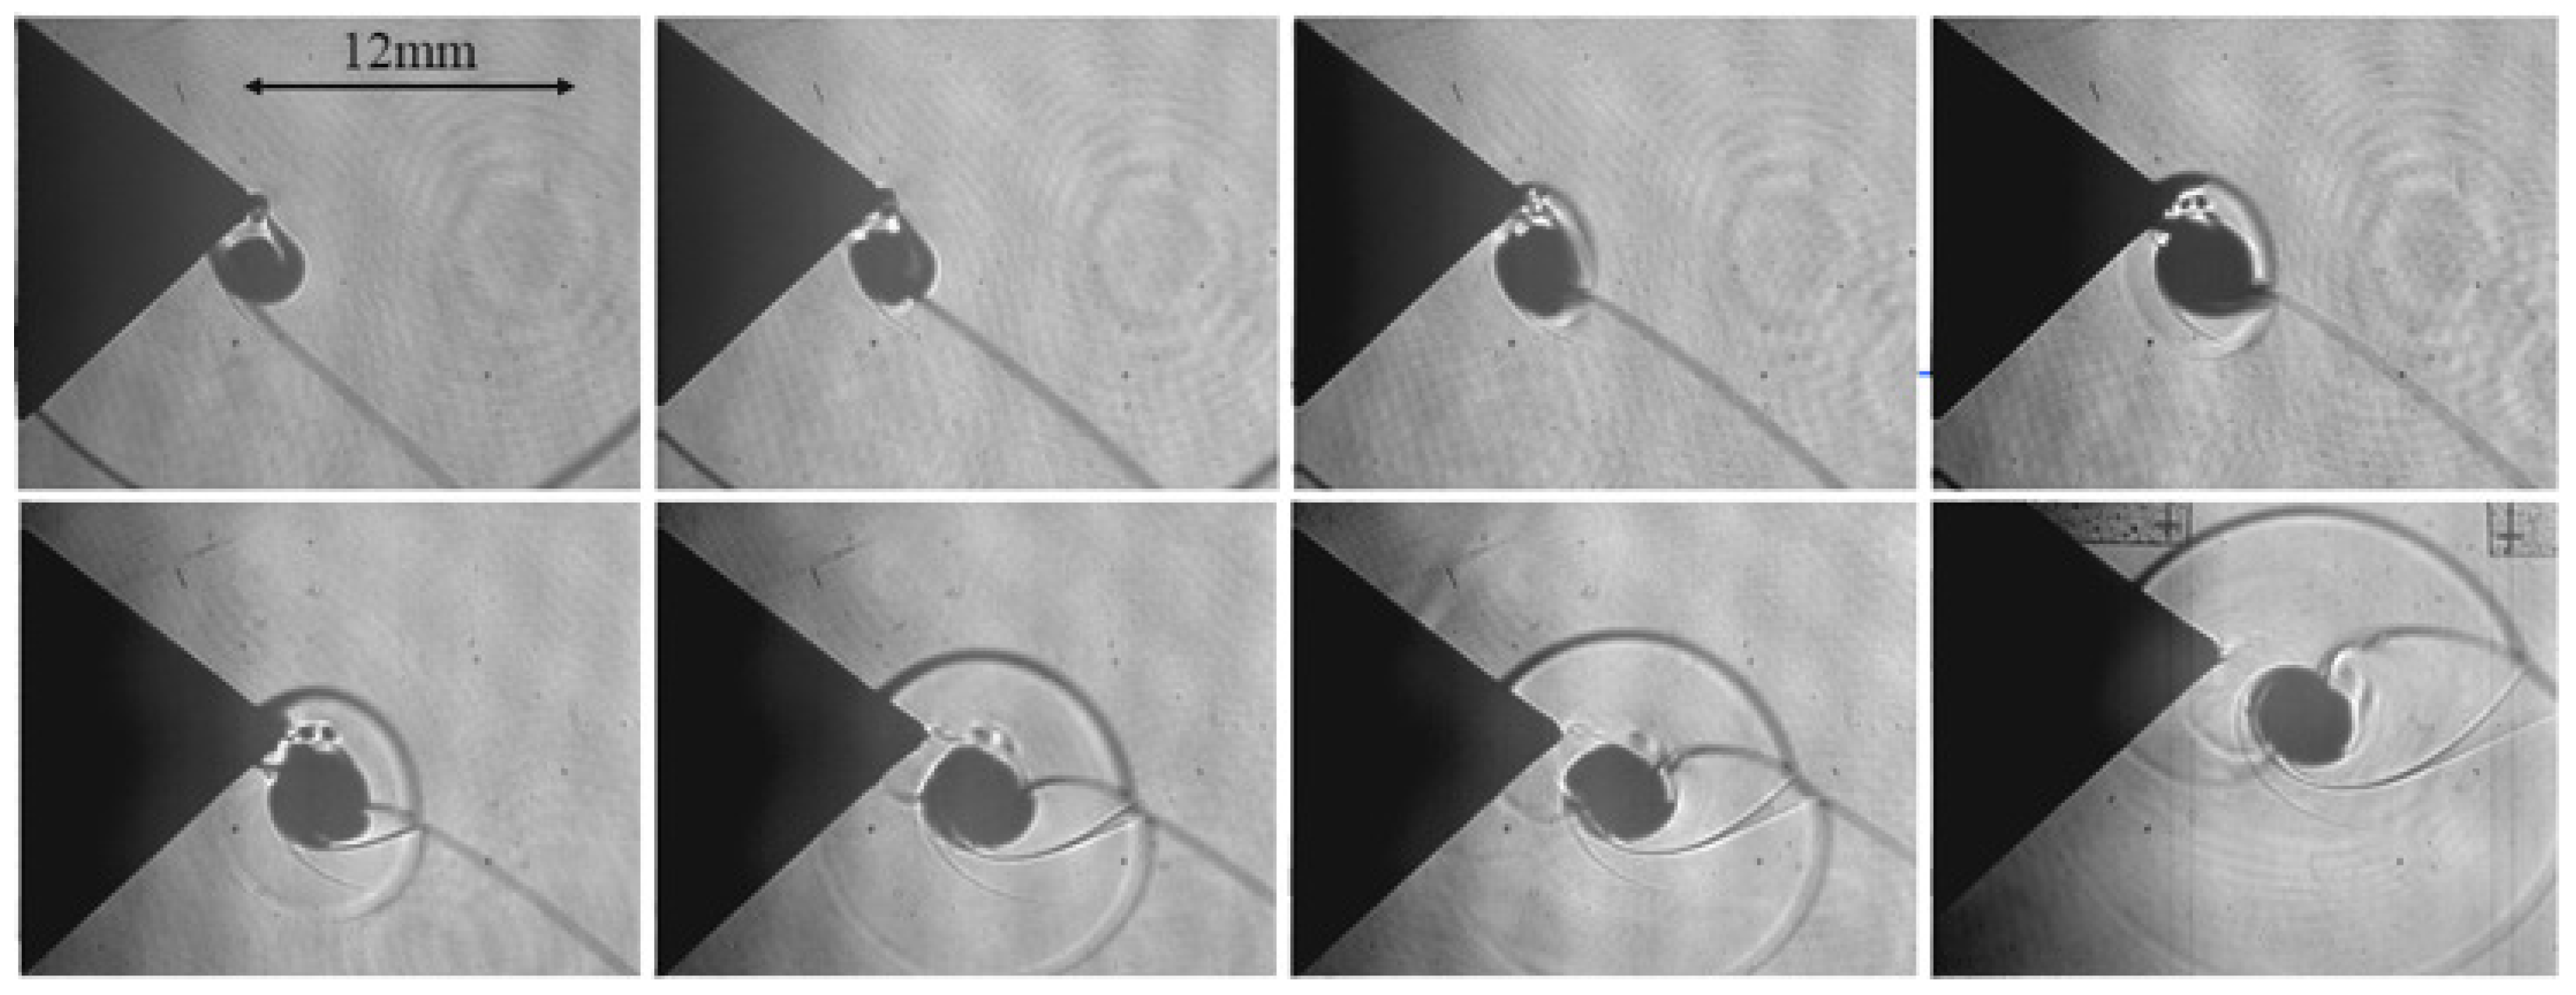
Preliminary experimental results using the facility of Figure 5 were reported in [16]. A number of magnified images using a laser light source are given in Figure 7. The test piece at the exit of the two legs of the rig is a wedge. The shock wave from the top leg of the rig arrives early entering from the upper right, shedding a vortex, and that from the lower leg, bottom right, transverse over the vortex. The difference between the arrival times at the corner, , are given in the figure. The left and right images, with similar delay times, are taken at different times thereby showing the evolution of the interaction in time. The first image shows the development of the double Mach reflection with the shear layers propagating to the vortex with the two triple points corresponding to the pattern in Figure 1c. The centre image is at an earlier stage of development because of the much larger delay time between the two waves arriving at the corner. The fast diffracted shock, FDS, and and associated reflected shock, RS2, appear to be doubled into separate waves. Similar effects are evident for the reflected shock in previous work [4,5] although the geometry of the experiment is somewhat different. There is no clear Mach stem and the reflection appears to be regular but with a clear shear layer. Whether this is due to different shock strengths on either side which would produce a shear layer, or a small Mach stem which is not resolved is not clear. There is an additional feature of a shock between the vortex and the wall which does not appear in the two cases with a lower synchronization delay. There are also two vortices shed from the corner. The details of this flow is that the vortex induced flow is up the surface towards the corner and separates there with the shock acting to decelerate the flow to meet the shear layer.
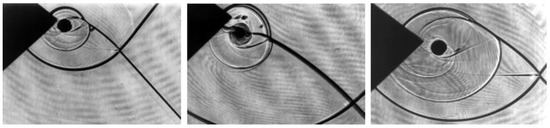
Figure 7.
Contact shadowgraphs, M = 1.33. left: s; centre: s; right s.
Additional work was presented in [17]. Figure 8 shows more images from a series of tests at the same nominal Mach number and same delay time between arrival of the two shock waves at the corner. The vortex appears as dark blob because of the high density gradients and corresponding refractive index gradients resulting in total internal reflection of the laser beam. There is some correspondence with previous numerical predictions for the isolated vortex case but noticeable differences due to the presence of the shear layer and with the vortex being close to the wall. Both the last frame in the top row and first frame in the bottom row show small vortices being shed off the corner and a shock between the vortex and the wall as also noted in Figure 7. These slowly dissipate as the vortex moves away from the wall. The shock moves away from the corner in the opposite direction to the clockwise upward flow of the vortex. The last frame shows a complex interaction as the reflected wave from the upper triple point enters the influence of the vortex where it becomes distorted.
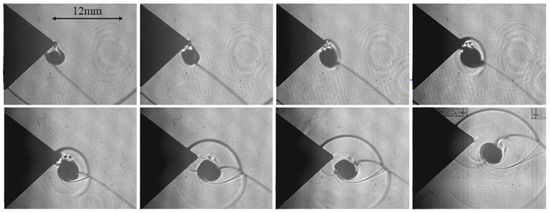
Figure 8.
Contact shadowgraphs, M = 1.33. synchronization delay time s.
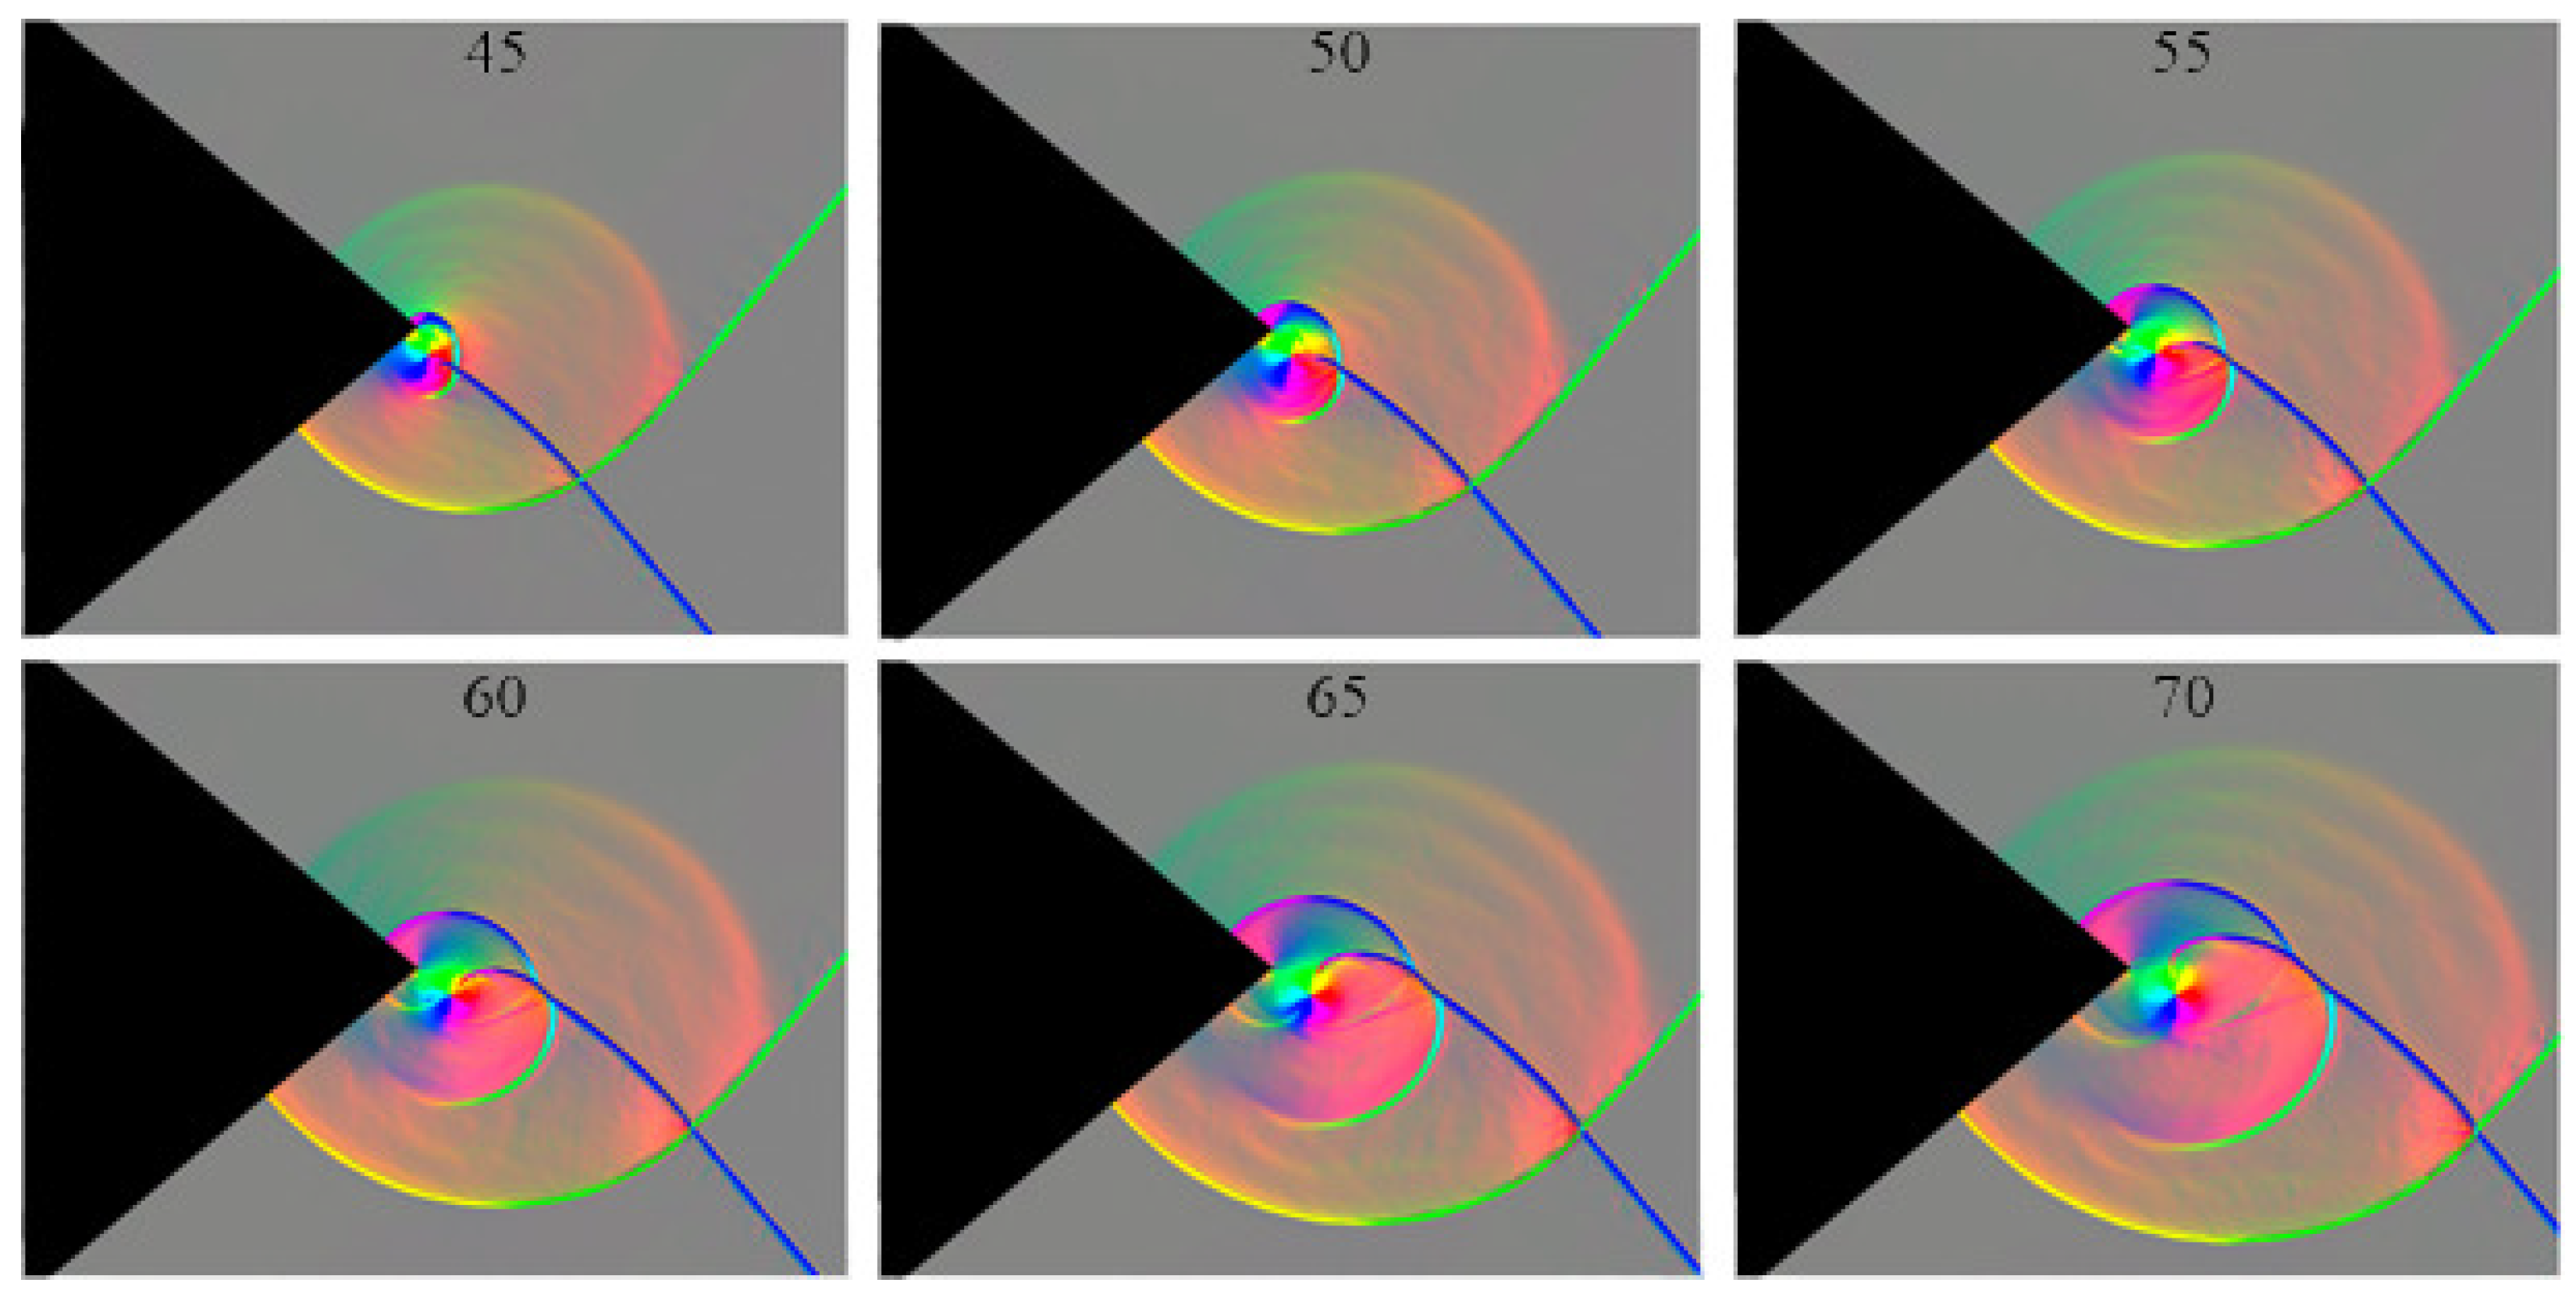
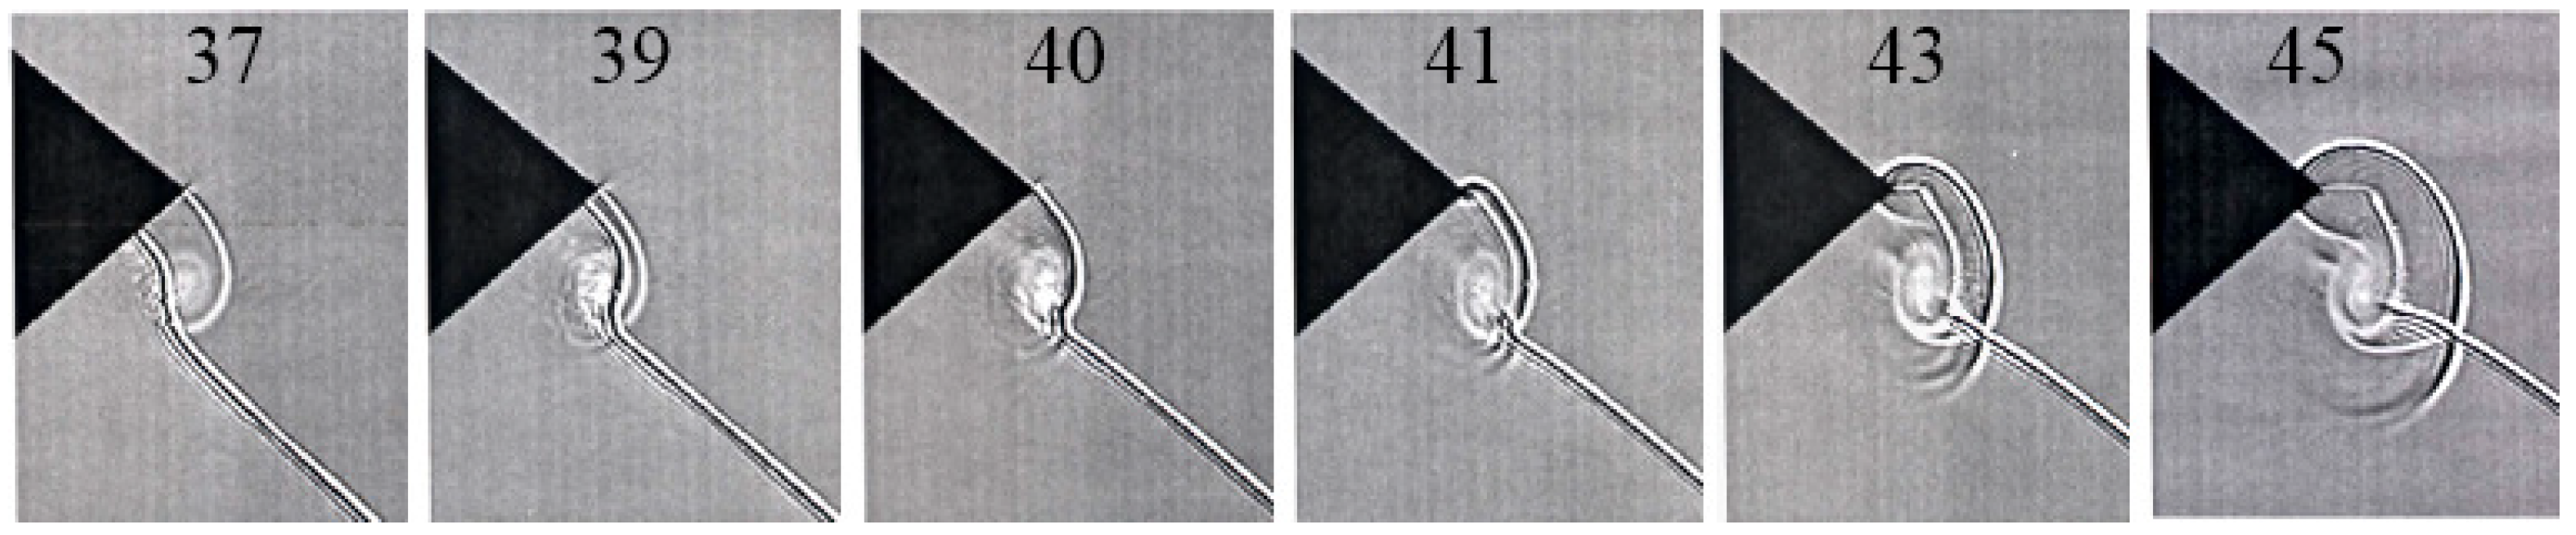
Detailed numerical simulations of this case were undertaken. Figure 9 shows a series of colour schlieren images for a single Mach number and constant difference in time interval between arrival time of the two shocks. This technique clearly defines the vortex centre where the six colours: red, magenta, blue, cyan, green, and yellow meet at a point. At s the diffraction pattern of the first wave and associated vortex are well developed. This is the fast diffracted shock, FDS, defined earlier. The later arriving second wave is about halfway into the vortex. There is no slow diffracted shock near the wall but rather a jet like flow as described when dealing with Figure 8. As the wave propagates through the diffracted part emerges and meets the blue incident wave in a regular reflection, as shown at s, with the development of associated reflected waves. The highly curved diffracted wave expands and moves up the upper surface of the wedge. The angle between the incident and diffracted wave becomes larger resulting in the reflection becoming a Mach reflection. The slipstreams that develop from the triple points are wound up into the vortex, with the end of the reflected wave from the upper triple point also merging with the vortex. More detail, at much larger scale, is given in the numerical shadowgraph of Figure 10. The physical area covered in these images is about 7 mm with the vortex being about 0.4 mm in diameter. As the wave enters the vortex field it is distorted more and more, part becoming almost parallel to the shear layer which results from the the earlier shock diffraction. It then develops a cusp with the forming of a regular reflection after having passed through the shear layer. These images also identify the development of the shock between the vortex and the wall, which propagates away from the corner. It is associated with the diffracted wave reflecting off the corner. This interaction, with the jetting effect up the surface, also results in significant distortion of the shear layer.

Figure 9.
Colour schlieren, M=1.33. synchronization delay time s. Numbers refer to time, in s, since the first shock reached the corner.
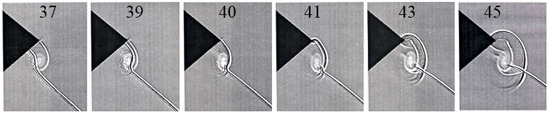
Figure 10.
Detail of passage of shock wave through the vortex field.
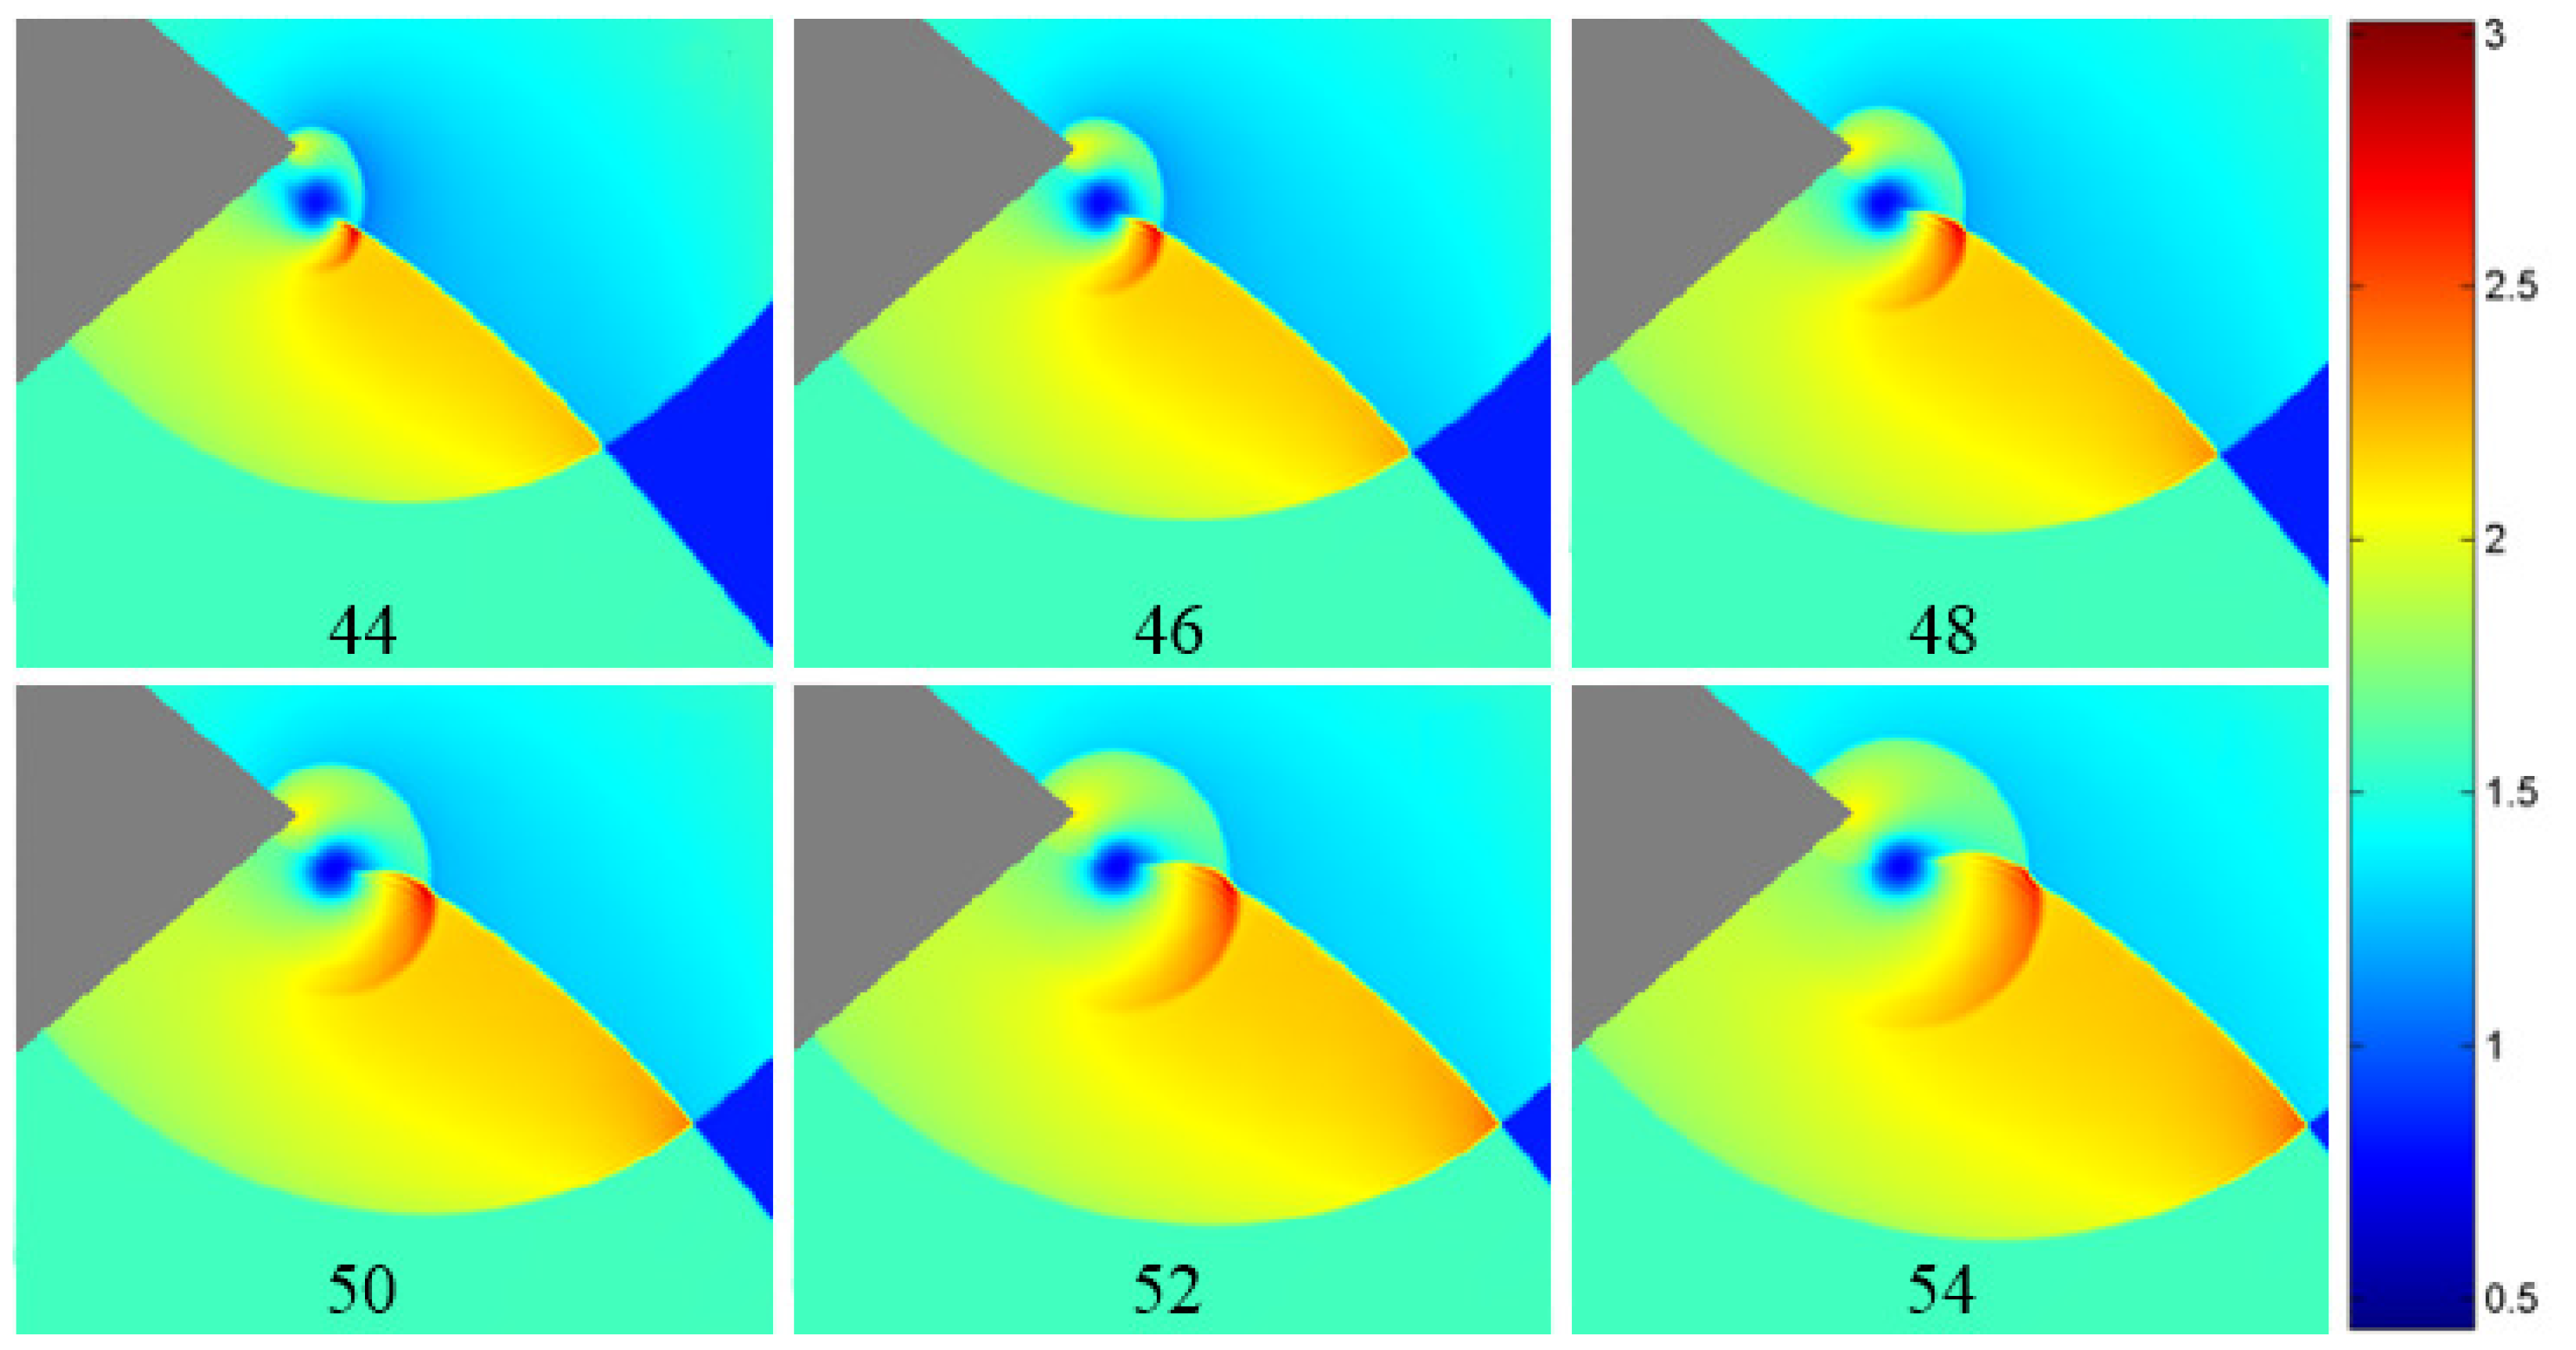
Previous work dealing with shock interaction with an ideal isolated vortex paid particular attention to the pressure field. Figure 11 shows numerical results for the present case with the spiral vortex from shock diffraction, corresponding to the test case above. The slightly variable yellow region correspond to the gas which has experienced passage by both shocks being modified slightly by the changing strength of the diffraction of the early arriving wave, which also results in a slight curvature of the late arriving wave. This plateau of pressure changes significantly in the region of the vortex, shown in blue. A high pressure region shown in red, grows in space and time behind the reflected wave which results from the appearance of the regular and Mach reflections at the cusp between the incident and diffracted waves. This pressure spike is very close in position to that of the vortex, resulting in extremely high pressure gradients. As the flow progresses the pressure at the intersection between the two incident waves moving into undisturbed gas starts to rise as noted in the figure and can exceed that of the pressure spike developed at the cusp but is not part of the shock-vortex interaction itself. There is also a pressure increase at the wedge corner when the diffracted shock reflects off it.
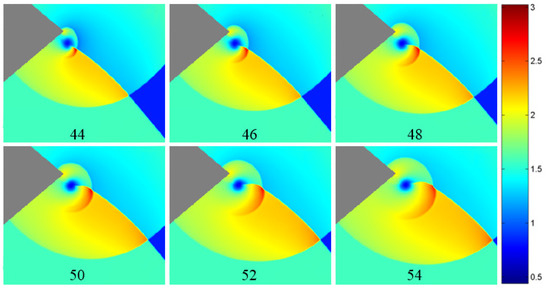
Figure 11.
Pressure flood plots, M = 1.33. Synchronization delay time s. Image numbers refer to time, in s, since the first shock reached the corner. Pressure values are factors of the initial pressure of 83 kPa.
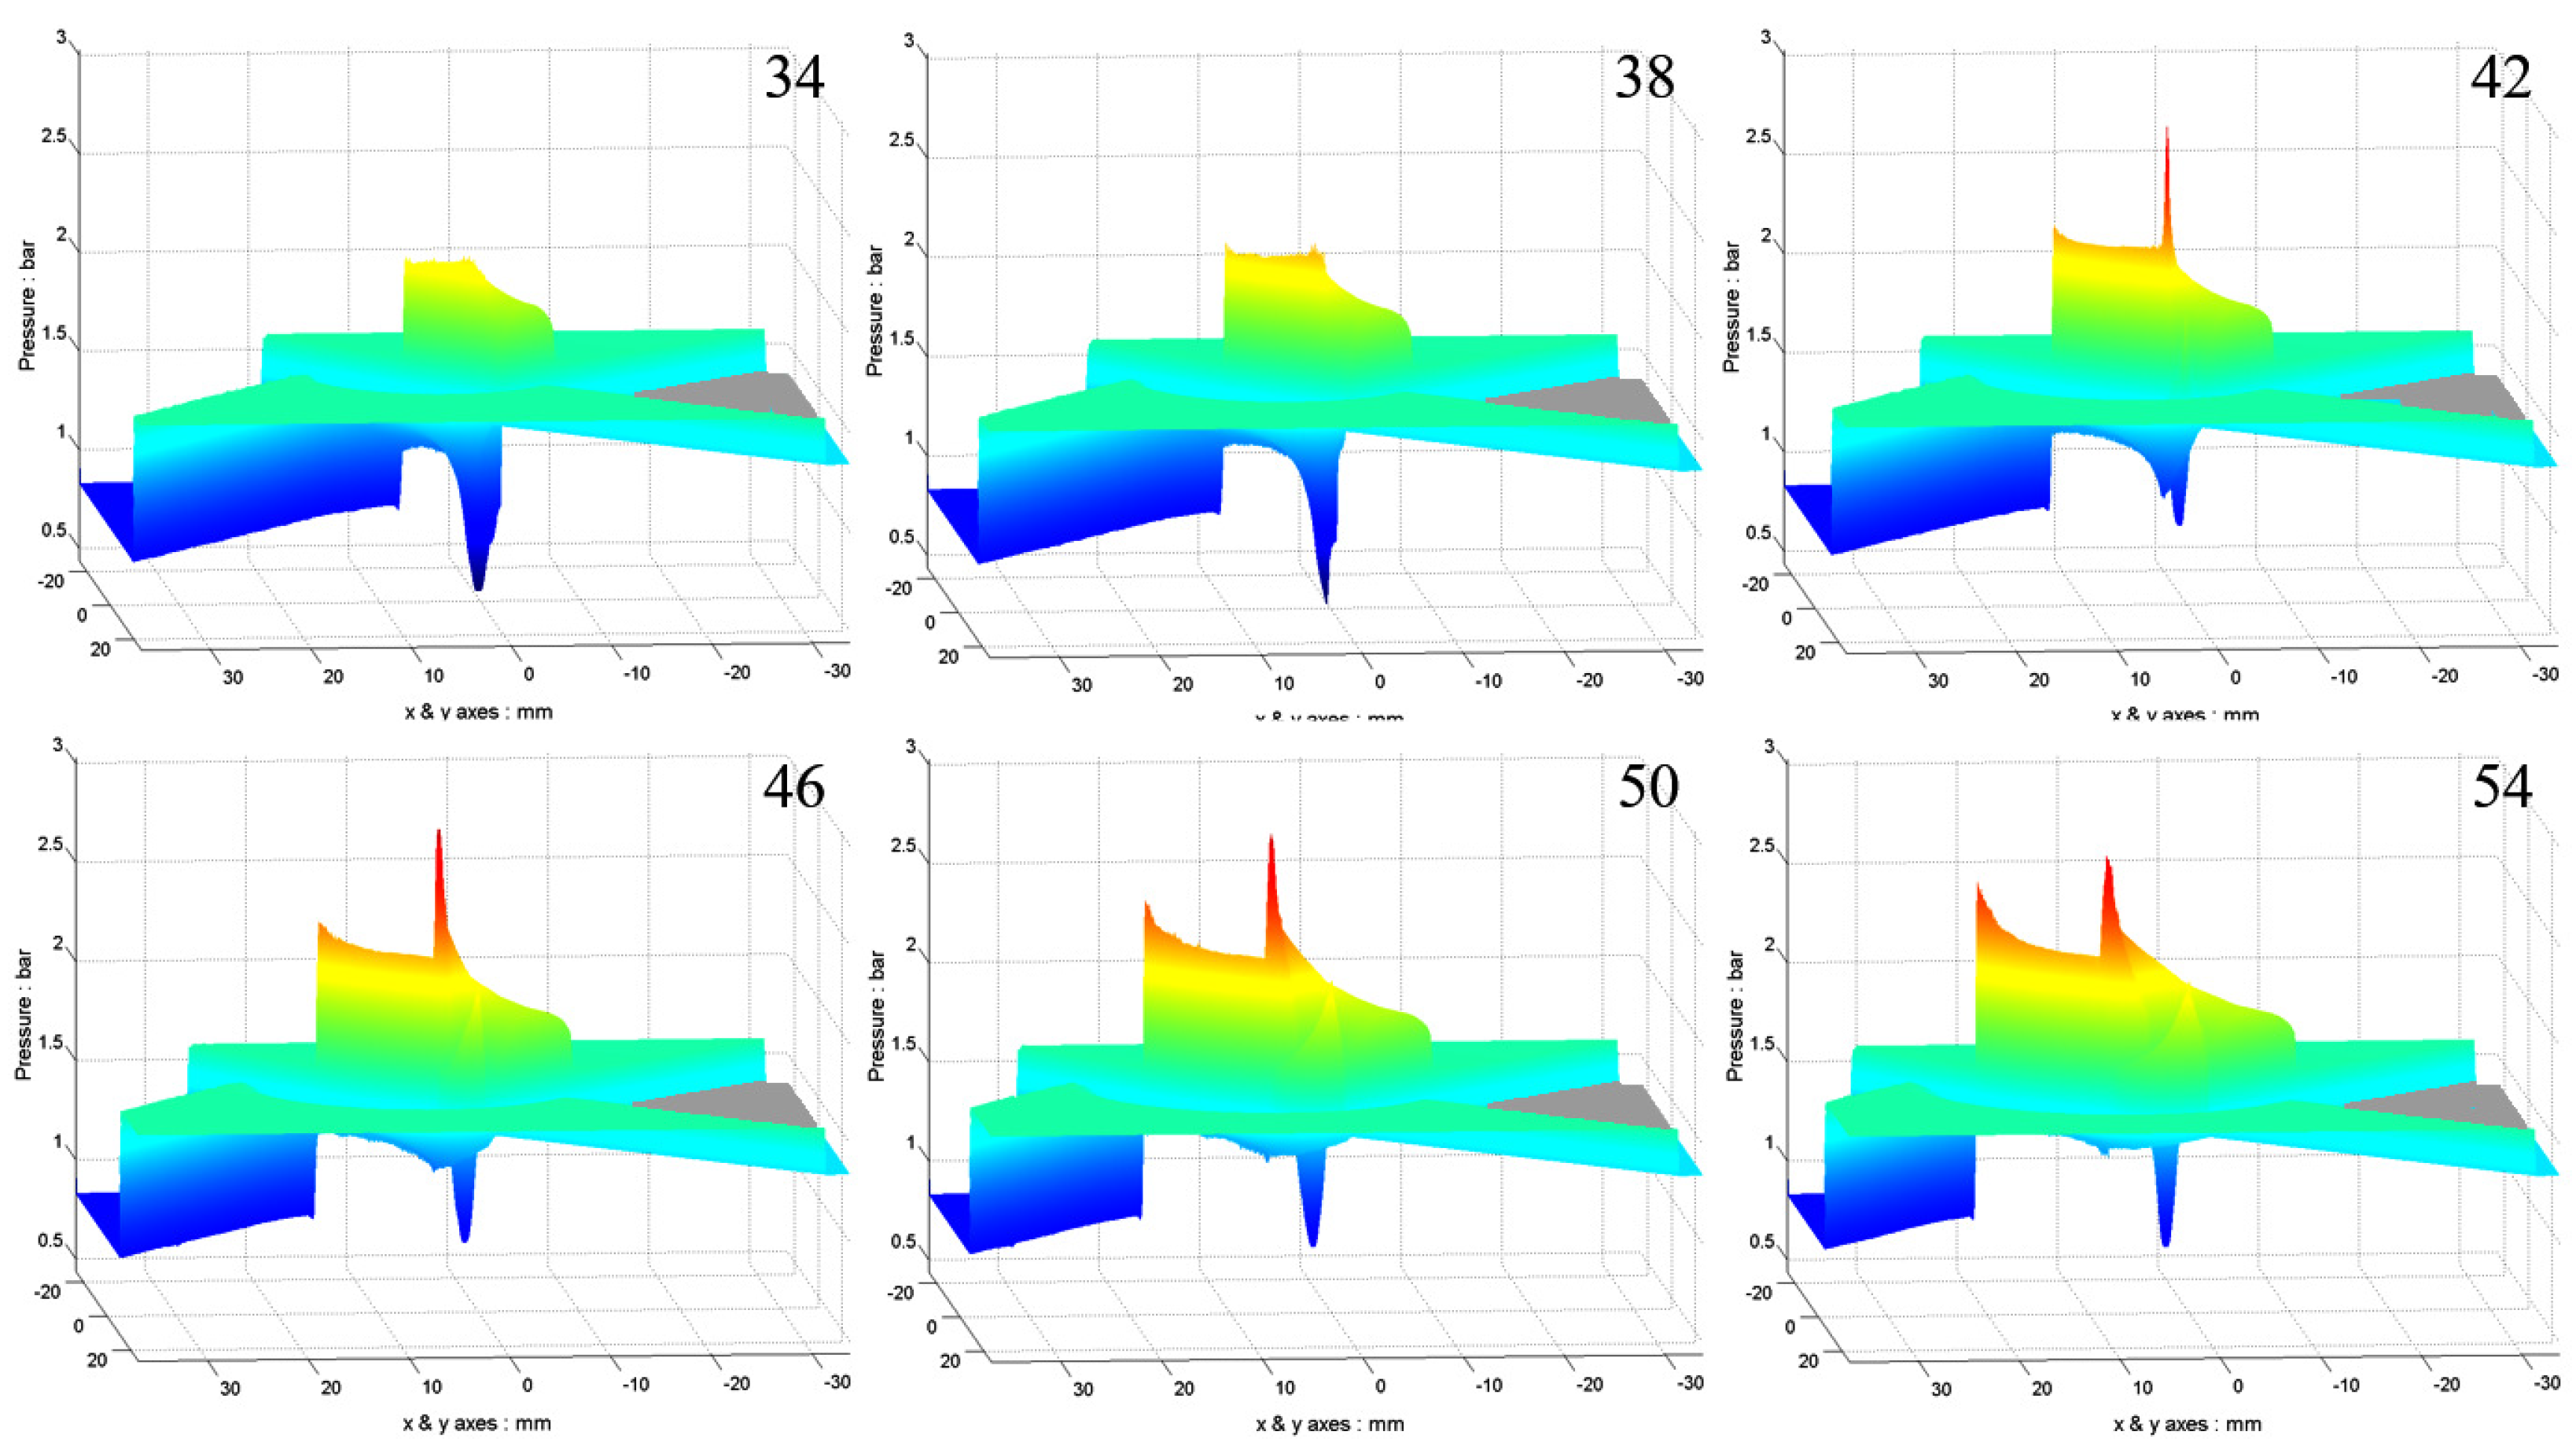
Animations of the pressure distributions have been done with Figure 12 showing the pressure surface at s viewed from different angles and Figure 13 showing evolution in time. The gray wedge surface is set at an arbitrary pressure level. The green area is the uniform pressure behind the plane shock waves. Both pressure spikes are evident.
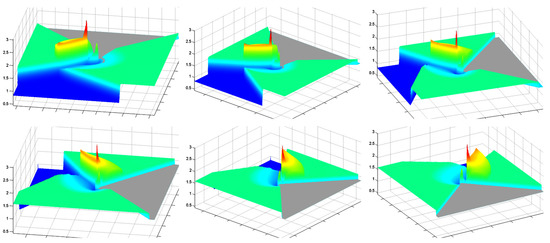
Figure 12.
Rotated images of pressure surface at s, Ambient pressure coloured dark blue and wedge coloured gray.

Figure 13.
Images of pressure surface variation with time, Ambient pressure coloured dark blue and wedge coloured gray.
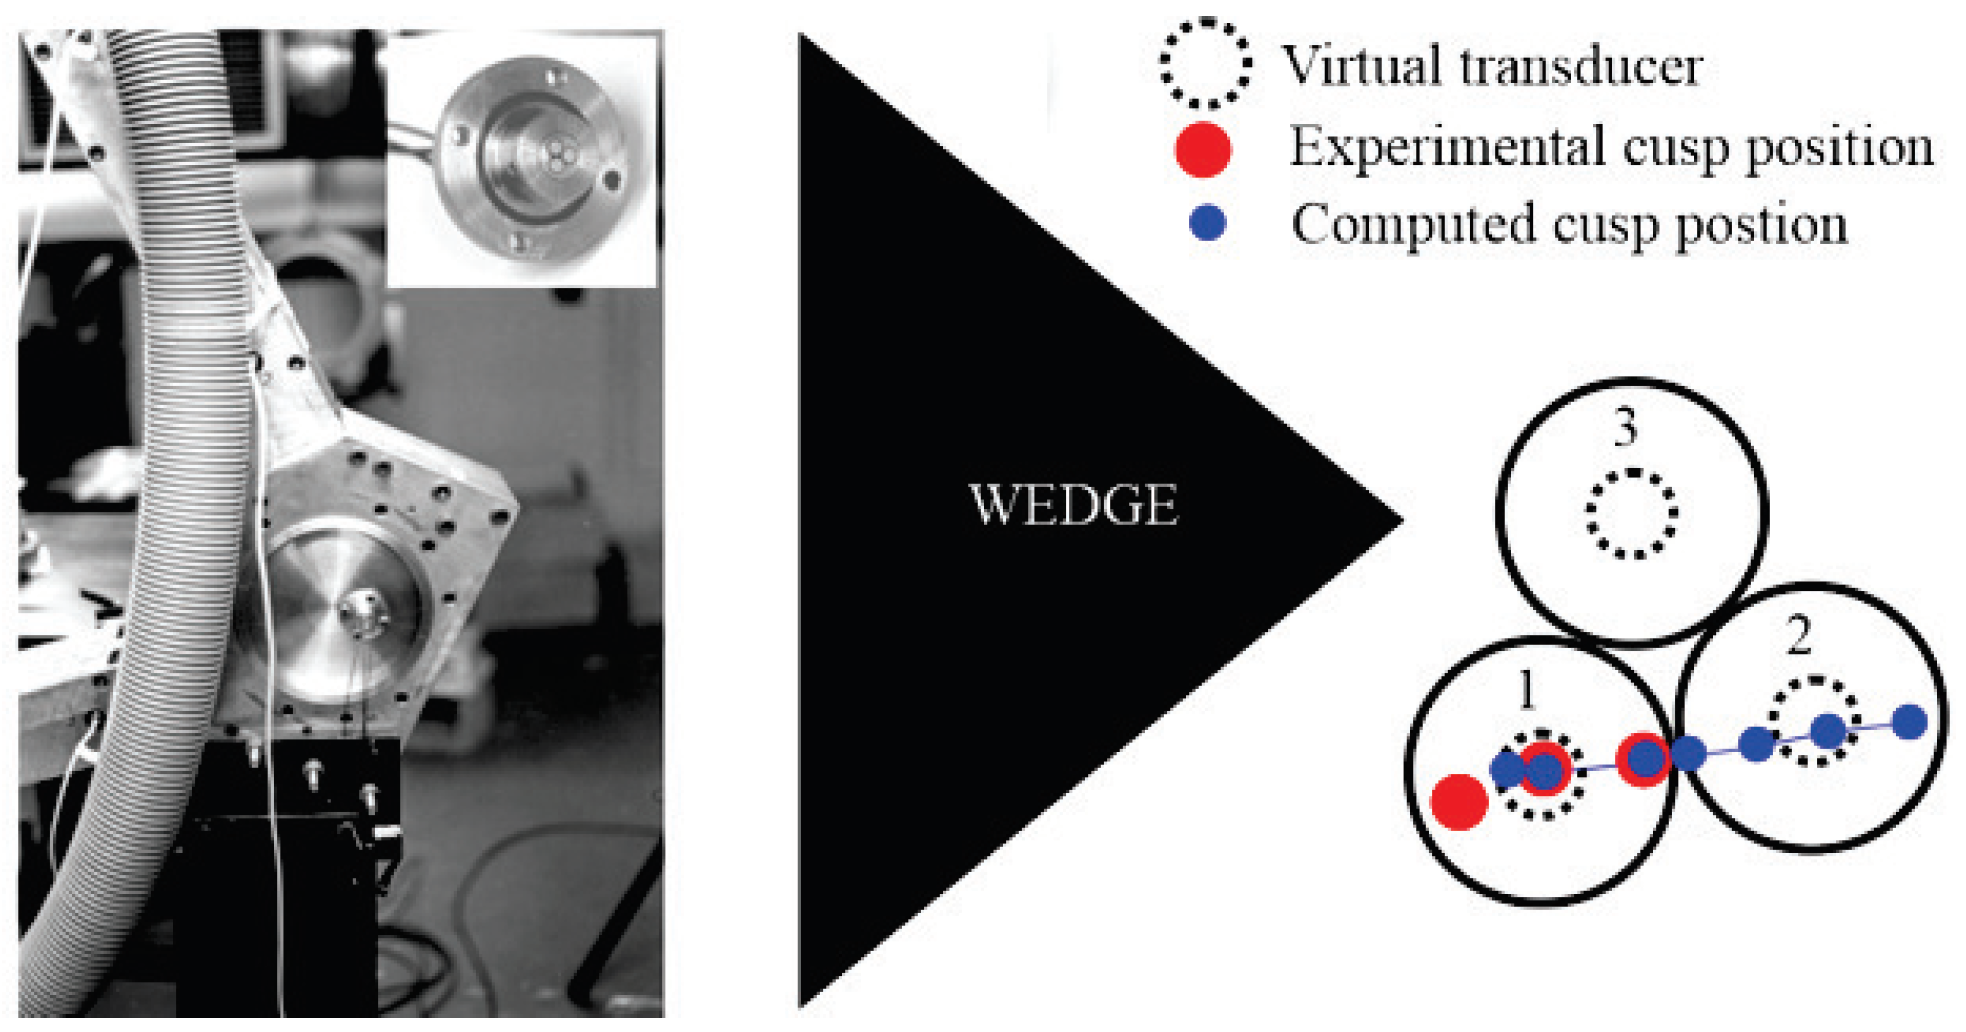
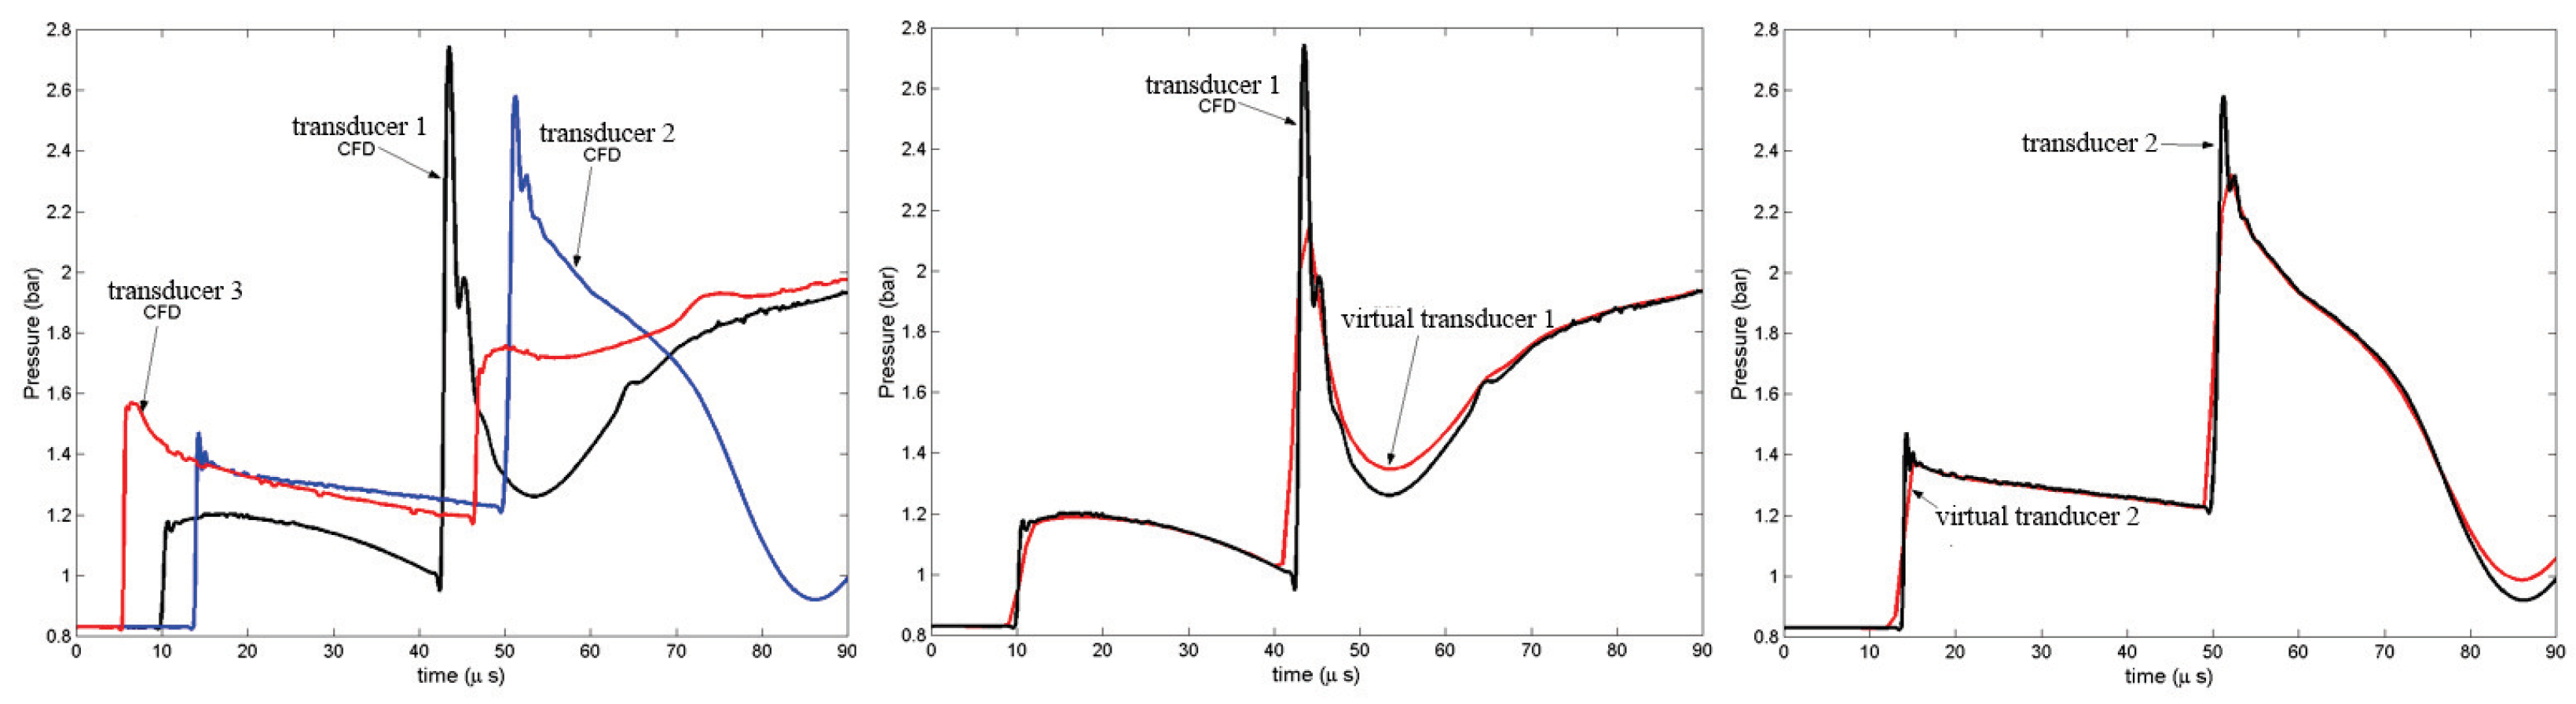
Whilst the numerical results provide a comprehensive description of the flow experiments are needed in order to assess their validity. All the main features found in the experiment, shown in Figure 8, correspond to those in the simulation shown in Figure 9. The pressure spike is extremely narrow, about 0.5 mm in diameter at mid-height and of short duration, thus making it difficult to measure experimentally. The track of the position of the peak pressure is obtained from the numerical data and small transducers are positioned in the region of the track. Three transducers each having an outside diameter of 3.8 mm and a sensor element radius of 0.4 mm are arranged in rosette pattern as shown in the inset of Figure 14, and situated in a plate replacing a window in the rig. The position relative to that of both the numerical and experimental spike positions is indicated in the figure. The virtual transducer is the size of the sensing element. Transducer 1 was placed where the pressure spike is a maximum and transducer 2 in the region of the spike trajectory.
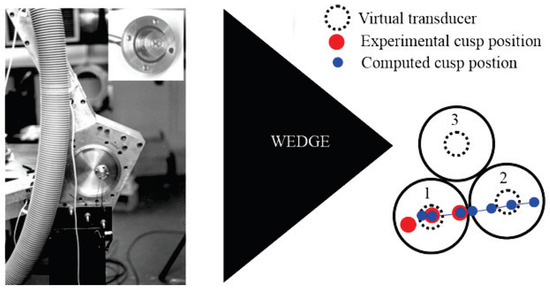
Figure 14.
Positioning of the transducers and spike trajectories. Black circles represent transducer physical diameter.
The CFD essentially gives a point measurement of the peak pressure but the transducer is exposed to pressure across its sensing face. To account for this further simulations were done by averaging the pressure over the sensor face area to represent what would be measured by a virtual transducer of 0.4 mm radius. The effect of this averaging comparing the point pressure to the averaged value for comparison to experiment is given in Figure 15. The point pressure traces from the numerical simulation at the positions of the three transducers is given together with the effect of simulations for a transducer of 0.4 mm radius. The point measurement for transducer 2 shows that the pressure spike is about 230% above that behind the diffracted shock wave, at 2.75 bar. Transducer 2 still records the spike but is lower because it is not directly on the track of the spike.
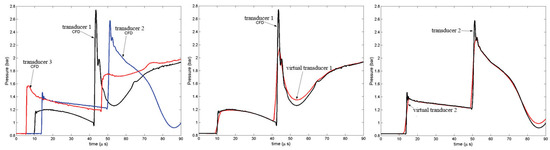
Figure 15.
Transducer pressure traces, M = 1.33 s. (Left) CFD for all transducers, (Right) Computed virtual transducer traces for transducers 1 and 2 compared to CFD point values.
It is evident that although the virtual transducer, having a finite size, reduces the peak pressure it is sufficient to measure and identify the spike reasonably well. Figure 16 compares the virtual transducer output with that obtained experimentally. There is considerable agreement considering the complexity of the experiment. The spike width and arrival time are well predicted, the former within 5% and the latter within s.
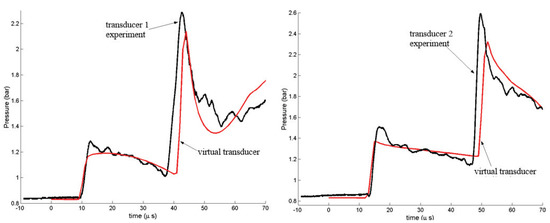
Figure 16.
Comparison between experiment and simulation.
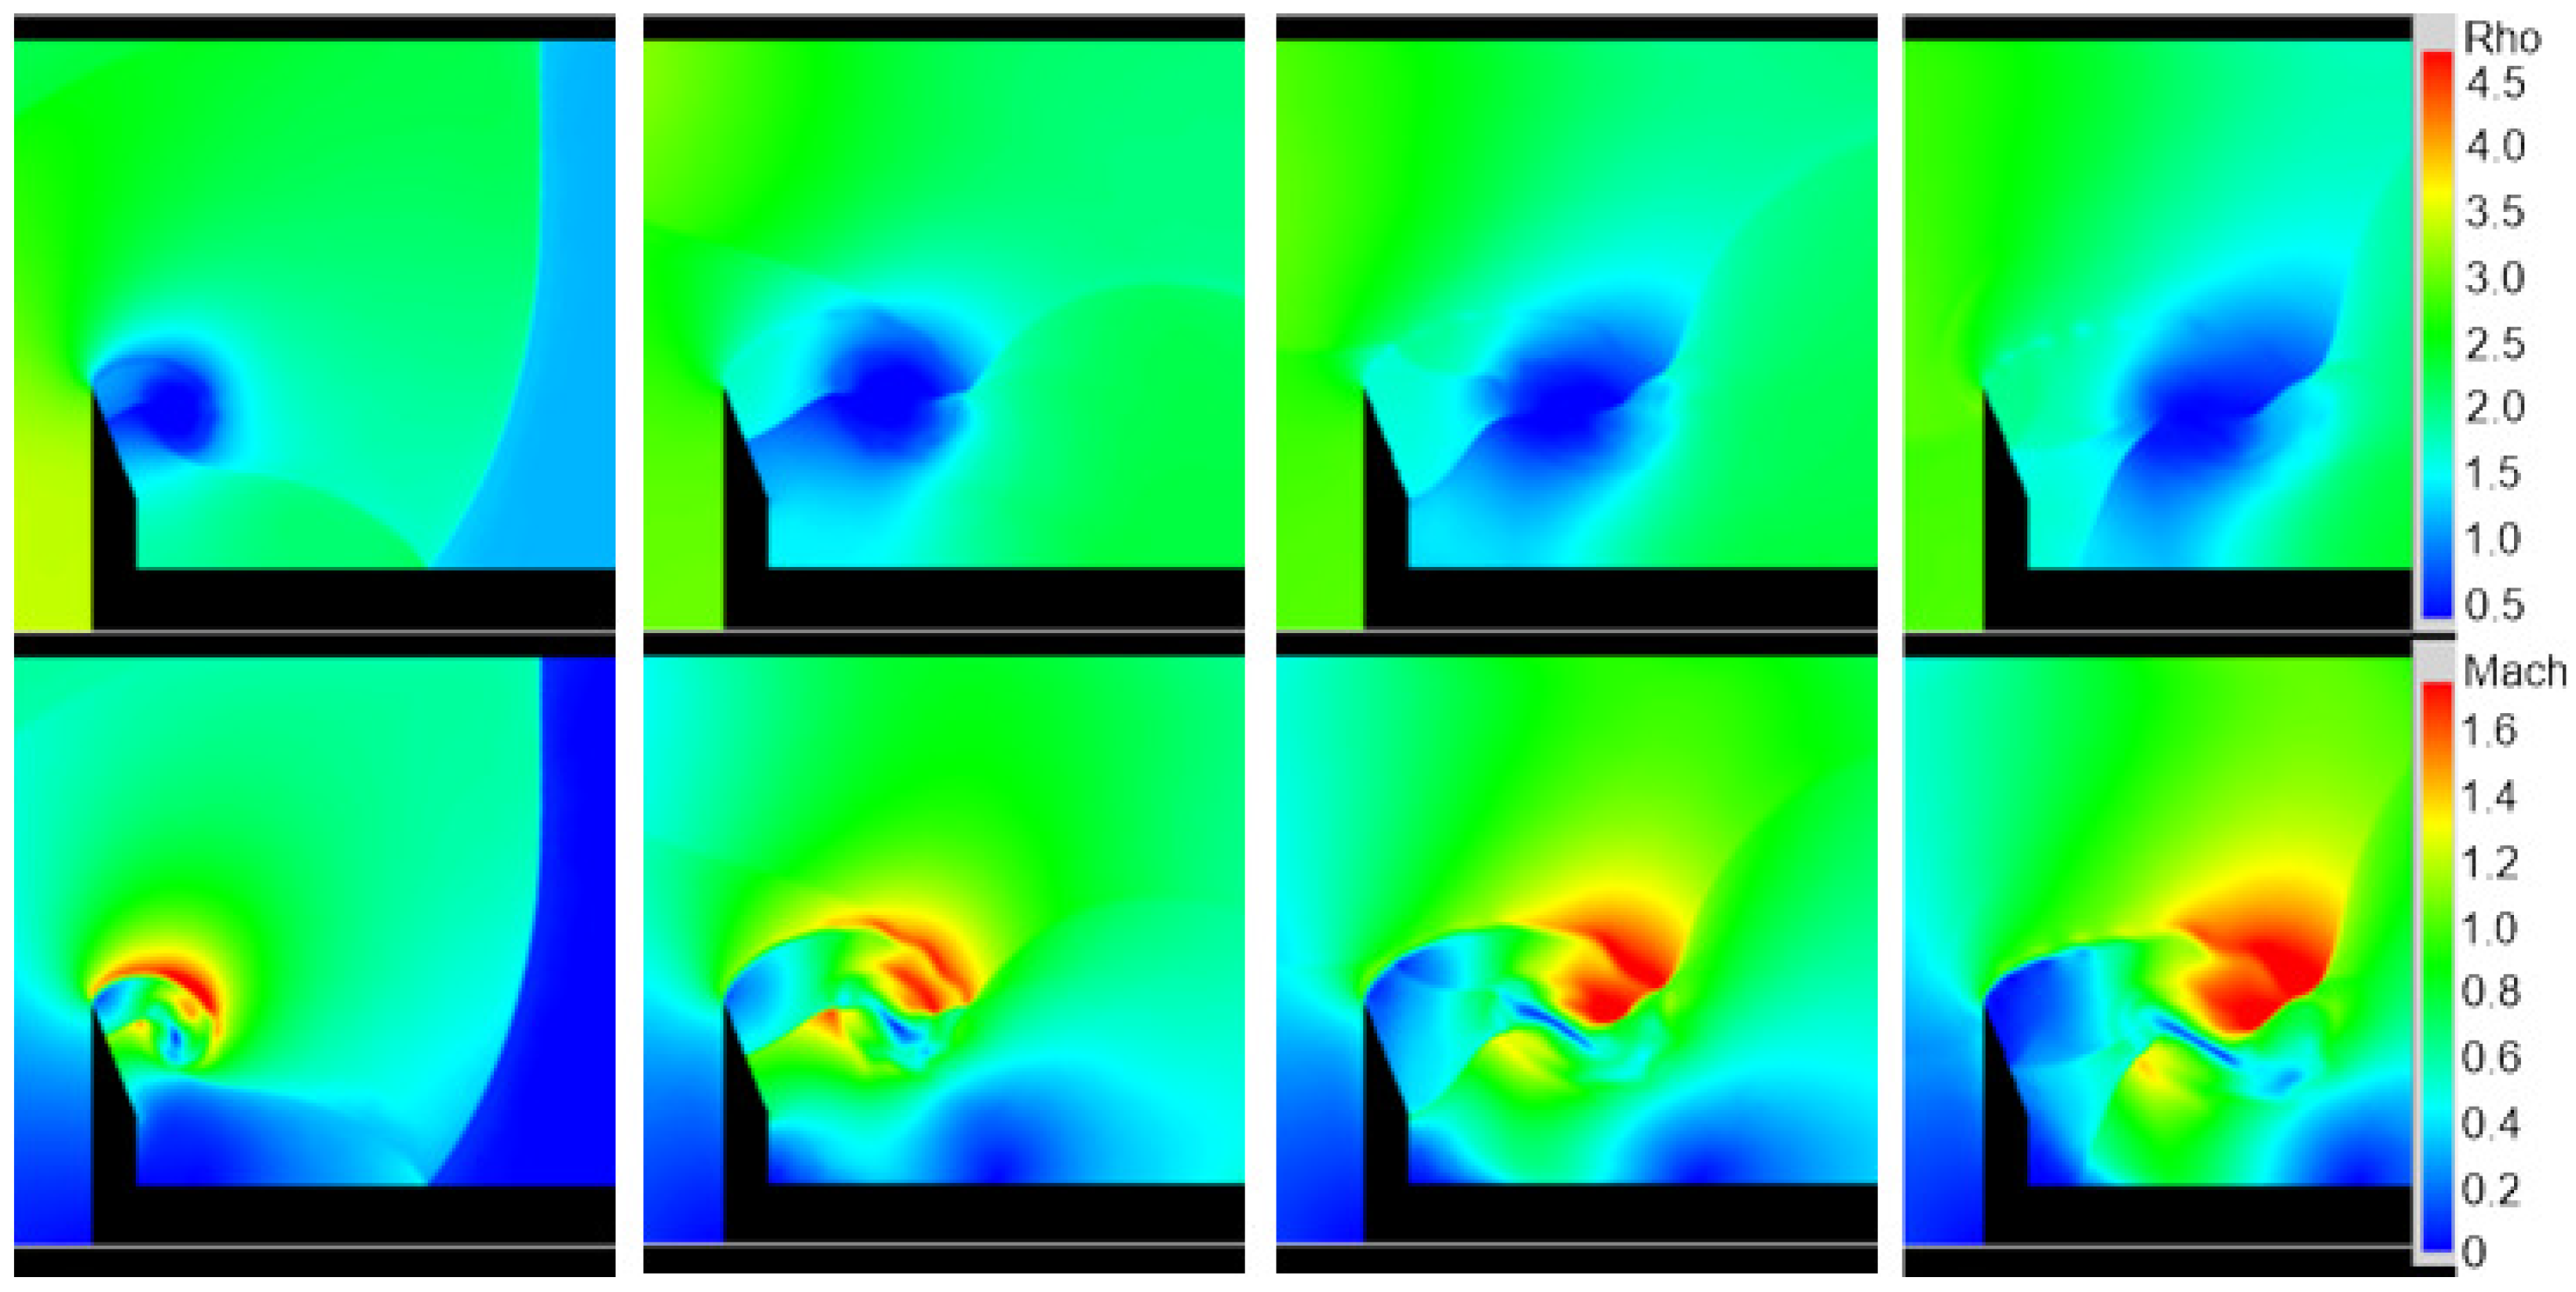
Limited items from the above study using the bifurcated tube at Mach 1.33 and s have been published in [18]. Preliminary work at higher Mach numbers, particularly when the flow behind the incident waves is supersonic, which occurs with a Mach number graeater than 2.07, raises practical issues since the tube needs to be evacuated. A few results in this region have been done [19]. Results for a variety of Mach numbers are given in Figure 17. The much lower test section density results in some loss of definition in the vortex. In the first image in which the flow behind the shocks is subsonic the overall pattern is similar to the Mach 1.33 case discussed above. However, as the Mach number increases the overall pattern becomes extended in the flow direction. The shear layers from the two triple points merge as they get caught up in the vortex flow. For the higher Mach number cases where the post-shock flow is supersonic the diffraction pattern on a corner is different as given in Figure 2.
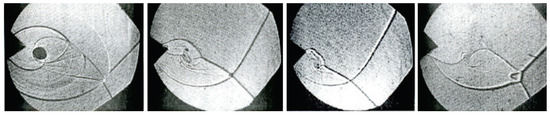
Figure 17.
Shadowgraph images. Shock Mach numbers: 1.48, 2.24, 2.3, and 2.5.
At Mach 2.24 only one triple point is clearly evident although there is a second slipstream emanating from the region where the incident shocks intersect. No second reflected shock is evident. The reflected shock propagating on the upper surface is inclined as an oblique shock in a supersonic stream. At the slightly higher Mach number, which was taken at a lower difference between arrival times at the corner, the reflected wave becomes distorted as it meets the oncoming supersonic flow. At Mach 2.5 the incident shock intersection is a strong Mach reflection with shear layers that terminate into a pair of adjacent vortices which curl up rather than moving downstream. This is characteristic of strong Mach reflection from a surface. Since they are not of equal strength a trailing slipstream emanates from where they meet and is caught up in the vortex. In all the supersonic cases the vortex pattern itself is not well defined. This is a case which has not been explored previously and additional tests are required together with numerical simulation in order to establish the details.
3.2. Multiple Shock Passage
The reason for examining the interaction where a vortex is traversed by a shock wave more than once is that it shows possible vortex disruption and occurs in a number of practical cases.
A very interesting experimental case of a complex shock-vortex interaction with multiple transits and a spiral vortex is partly contained in a video `Waves in Fluids’ [20]. It deals with shock wave propagation over a fence. This case did not deal with the shock/vortex interactions at all but was an illustration of complex flows resulting from shock interaction with a simple boundary. A number of frames have been extracted from the video and annotated in Figure 18. The incident wave diffracts over the fence with the curved portion reflecting off the bottom surface and passing through the vortex in the typical S-shaped format, giving rise to the diffracted wave D, emerging from the opposite side just below the shear layer.There are embedded shocks in the vortex on either side of the vortex core. These indicate acceleration to supersonic velocity due to the vortex action followed by deceleration due to the downstream boundary conditions. In the second frame the diffracted wave then passes trough the shear layer and moves towards the top surface. It is circular in shape and reflects off the bottom surface as well as Dr. The reflected wave R is distorted downwards as it encounters the clockwise flow of the vortex. In the region between the vortex and the fence a shock wave V develops, as discussed earlier, moving down the surface in the opposite direction to the vortex flow and reducing the induced supersonic flow to subsonic. In the third frame the wave F is distorted as it passes though the shear layer and then enters the vortex. It passes through and then reflects off the bottom surface as Fr. There are thus multiple transits, first the reflected wave R, then the reflected wave F, followed by the further reflections of waves D and F. There is insufficient detail in the vortex region itself to track the internal flow.
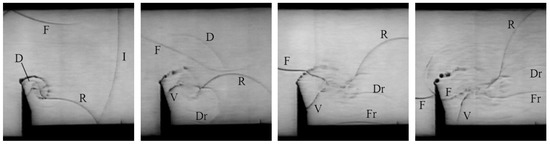
Figure 18.
Annotated frames from video of shock wave propagation over a fence [20].
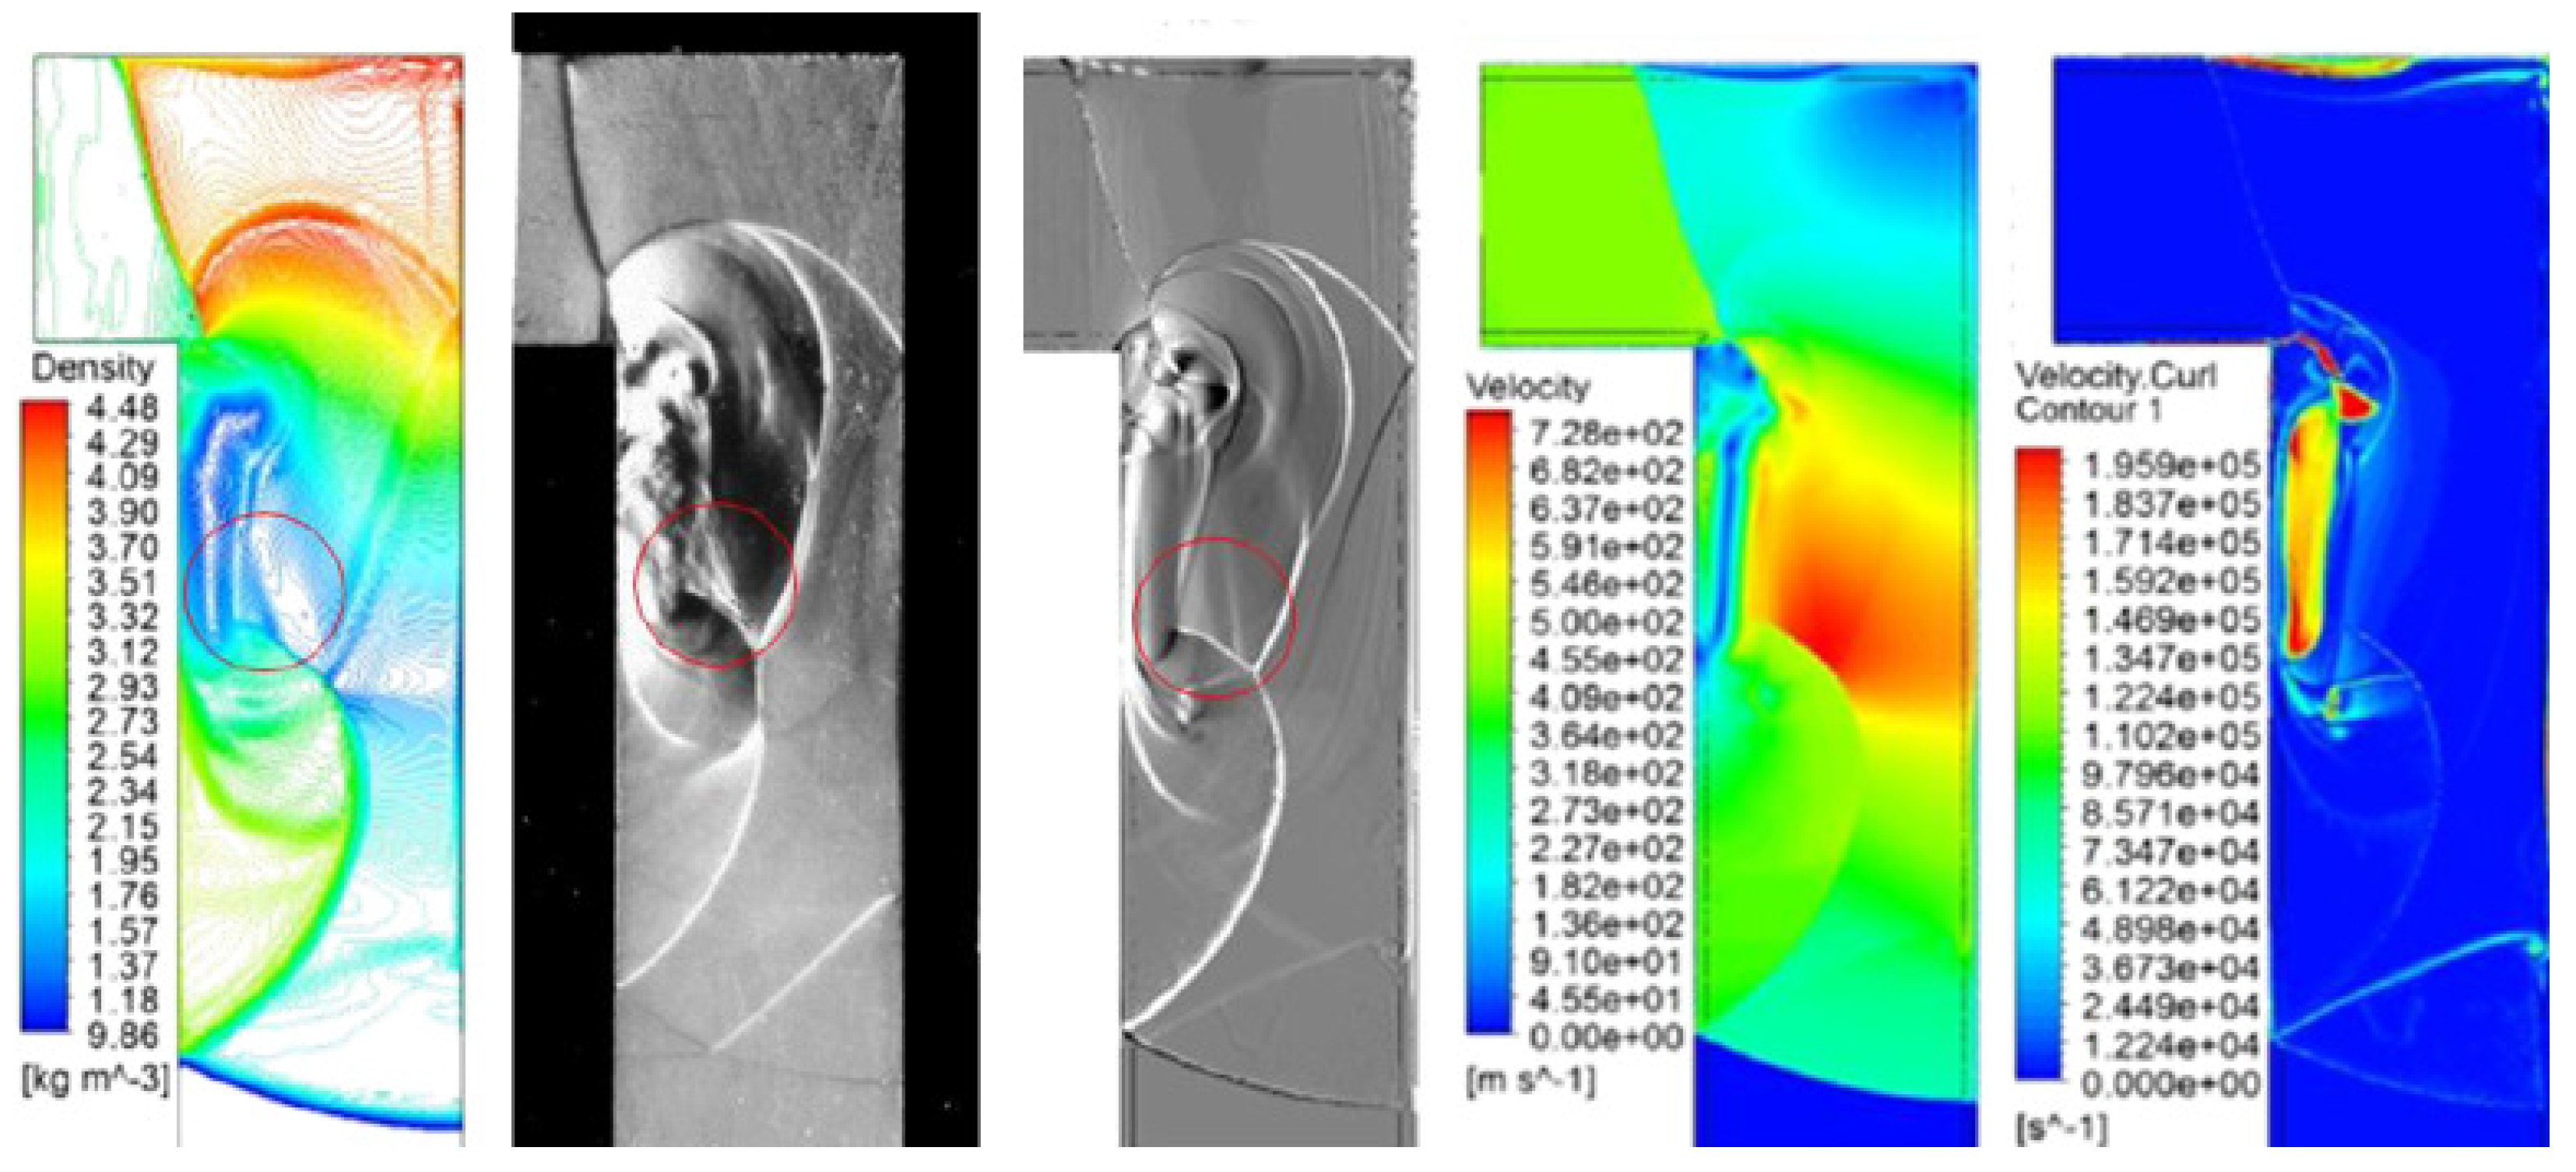
A simulation of this experiment has been done [21]. Figure 19 shows gray-scale images of Mach number and a numerical shadowgraph. These are at a time beyond the end of the video where both waves F and V terminate on the bottom surface. The instability in the shear layer is evident, as it is in the experiment, but most striking is the extreme distortion of the vortex core.
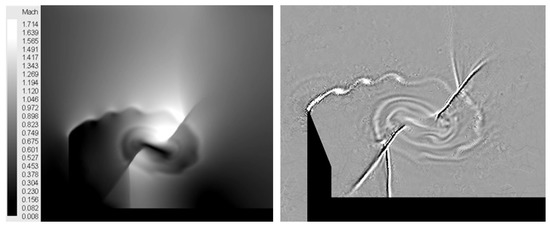
Figure 19.
Numerical late stage Mach number flood plot and shadowgraph image.
A more complete set from the simulation is given in Figure 20 showing both density and Mach number flood plots at the corresponding times to the frames from the video. The density plots clearly show the movement of the stronger shock waves, particularly the wave, F, between the vortex and the fence which moves in an opposite direction to the adjacent vortex flow. The Mach number plot emphasizes the extreme distortion of the vortex core. There are distinct supersonic patches on either side of this narrow elongated core. The flow underneath the shear layer also becomes supersonic as it is accelerated by the vortex motion. There are clearly many components of this complex flow deserving future attention.
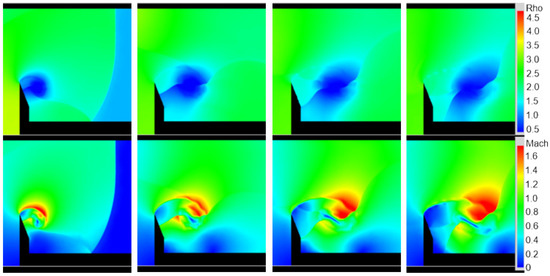
Figure 20.
Density and Mach number flood plots corresponding to the images of Figure 18.
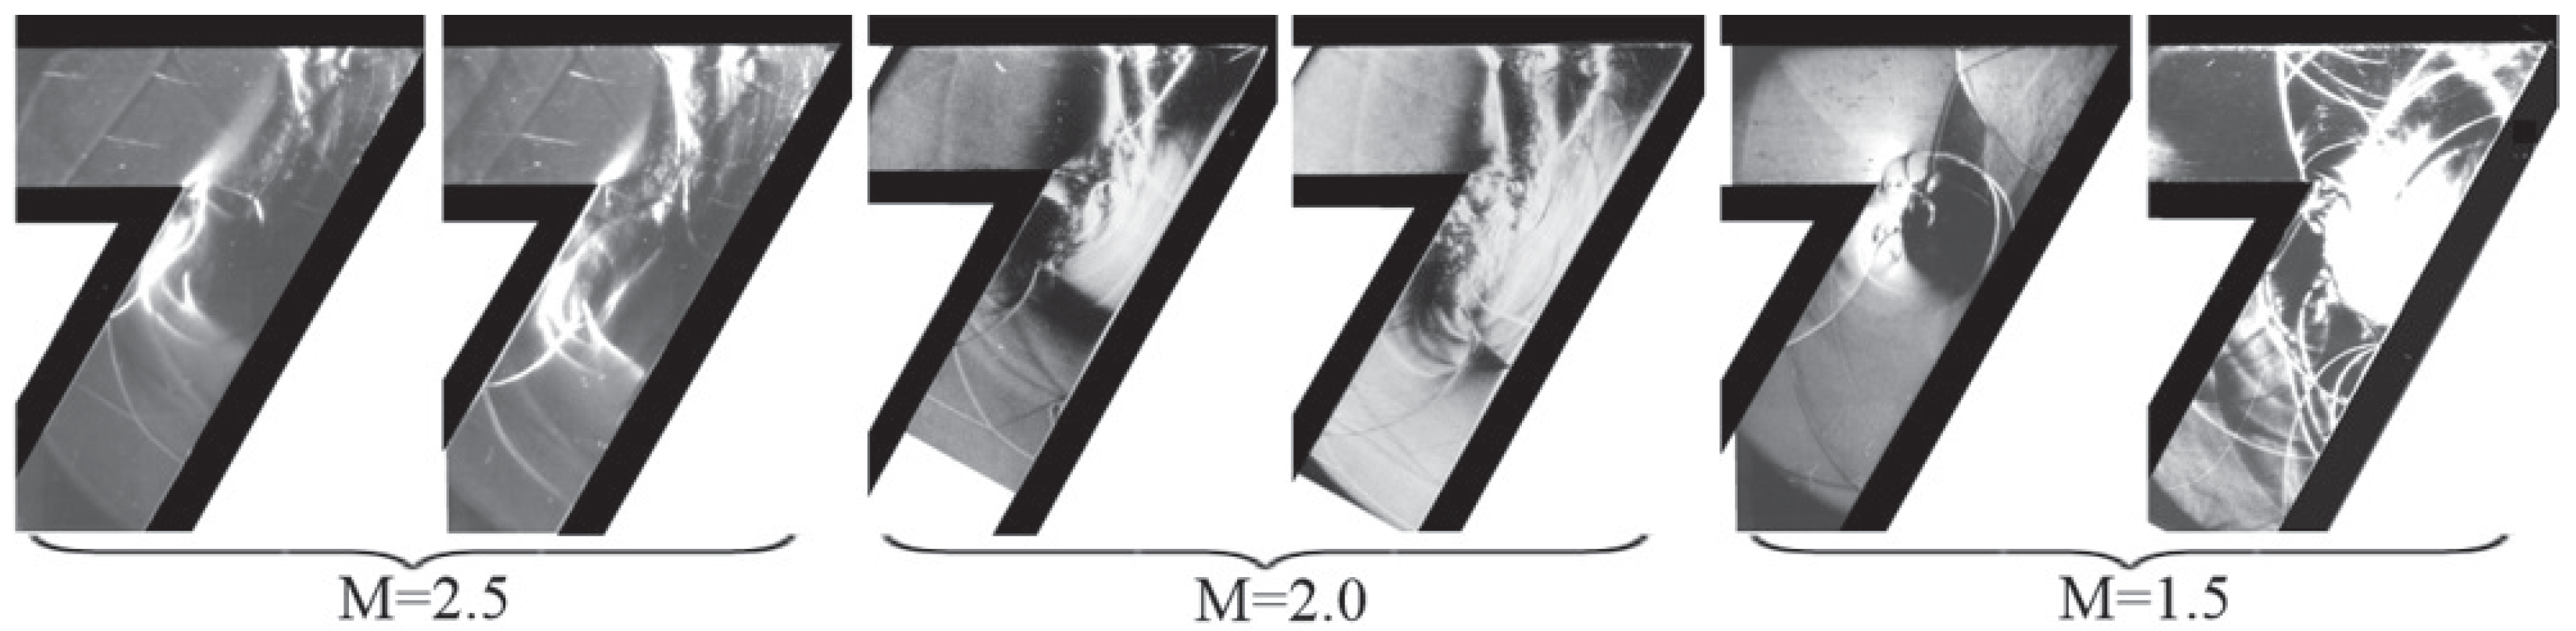
Anther practical study showing multiple shock traverses is that of transient flow around a bend, referred to in the introduction. At the stage when that was done the interest was in the behavior of the transmitted wave rather than the flow in the region of the shed vortex. Figure 21 shows the evolution of the interaction for propagation over a bend for incident shocks of Mach 1.5 and 2.0. The first frame, for Mach 1.5, shows a conventional diffraction over the corner with its associated vortex and with the wave reflecting back off the far wall. This wave then passes through the vortex and in the third frame starts reflecting off the near wall as the start of the second transit through the vortex. A typical shock-vortex interaction then occurs with the upper part of the wave accelerated and the lower part slowed down, producing the wave system external to the vortex as discussed before. Similar results occur for Mach 2 with the first frame showing the flow after the first shock transit and the following three frames as it passes through the vortex field. In the final frame a curious shock structure is noted where a shock arising from the reflected shock pattern discussed earlier appears to fan out in space. The spiral vortex region degenerates into an elongated turbulent patch after the double shock transit and remains adjacent to the near wall.
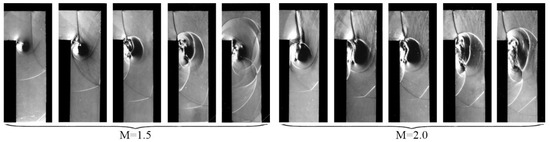
Figure 21.
Evolution of the shock-vortex interaction resulting from shock diffraction over a bend.
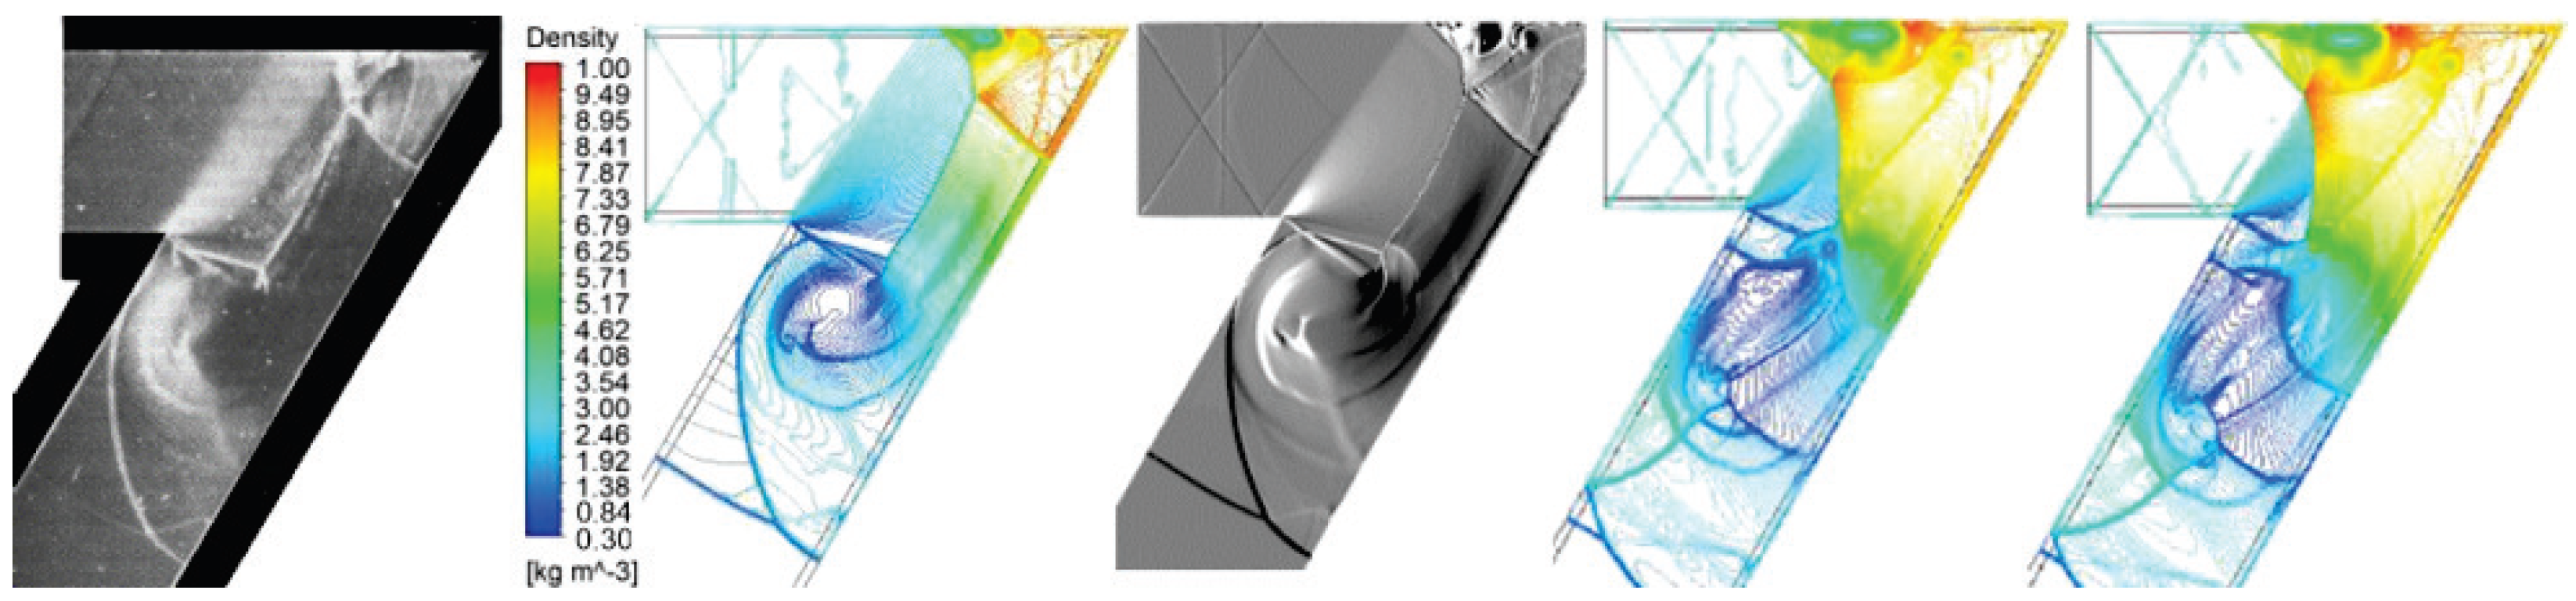
More details of these features are given in Figure 22 [22]. The fan-shaped structure is circled and is most evident in the experimental and shadowgraph images with the latter suggesting it consists of a shock with a series of weak waves above it resulting from its curvature. The simulations were done using the SAS model in conjunction with the SST RANS model. This was found to more closely correspond to the experiment than other models. A vortex center is not well defined and the turbulent patch covers a significant part of the near wall surface below the shear layer emanating from the corner. The turbulent patch elongation does not happen for a Mach 1.5 incident shock wave and is a separated region from the surrounding flow. The fan-shaped flow slows the flow just outside the turbulent patch to allow the flow to follow the highly rotating flow in the turbulent patch. A jetting flow occurs near the wall where the flow is directed upwards towards the corner at supersonic speeds. The shock-fanning was found to be more marked for a Mach 2.5 case. For a Mach 1.5 incident shock, there is no evidence of shock-fanning and the turbulent patch is not elongated along the near wall.

Figure 22.
Mach 2 shock propagating around a 90 degree bend. The images in order are: density contour; experiment; numerical schlieren (2 million nodes); velocity; and vorticity.
Less detailed studies have been executed on the effect of bend angle, although experimental results have been obtained. It is important to note that for an incident Mach number of 2.5 the flow following the incident shock is supersonic, for the Mach 2 case is close to being sonic and for Mach 1.5 it is subsonic. This affects the ability for waves to propagate up into the section of the bend before the corner. Figure 23 is for a Mach 2.5 shock around a bend. There is a Prandtl-Meyer expansion wave at the corner which accelerates the oncoming flow limiting passage of a wave upstream. There is also a complex wave reflection at the acute corner at the upper right. This will eventually interact with the vortex flow. The first frame shows the situation after first passage of the reflected shock from the far wall. It has just reached the near wall and is then forced significantly downstream as it passes through the shear layer into the high-speed flow coming from the upper leg of the bend. It turns almost at a right angle with influence on the upper portion of the vortex as particularly noted in the numerical schlieren image.The flow then becomes more complex as shown in the last two plots as well as the images in Figure 24 with increasing turbulence becoming evident.
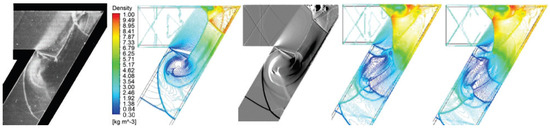
Figure 23.
Mach 2.5 shock propagation around a bend. The images in order are: experiment; density contours; numerical schlieren (1.5 million nodes); later density contour plots.
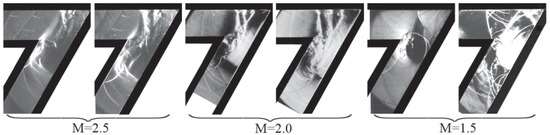
Figure 24.
Shock propagation around a bend.
At Mach 2 the features are similar although the upstream flow is now close to being sonic. For this and the Mach 2.5 case there is an almost normal wave passing down the bend which arises from that in the vortex. During the early stage at Mach 1.5 the reflected wave off the far wall passes through the shear layer and is influenced by the difference in velocity on either side of it as well as that of the vortex flow. The flow then becomes more complex due to multiple reflections from the walls.
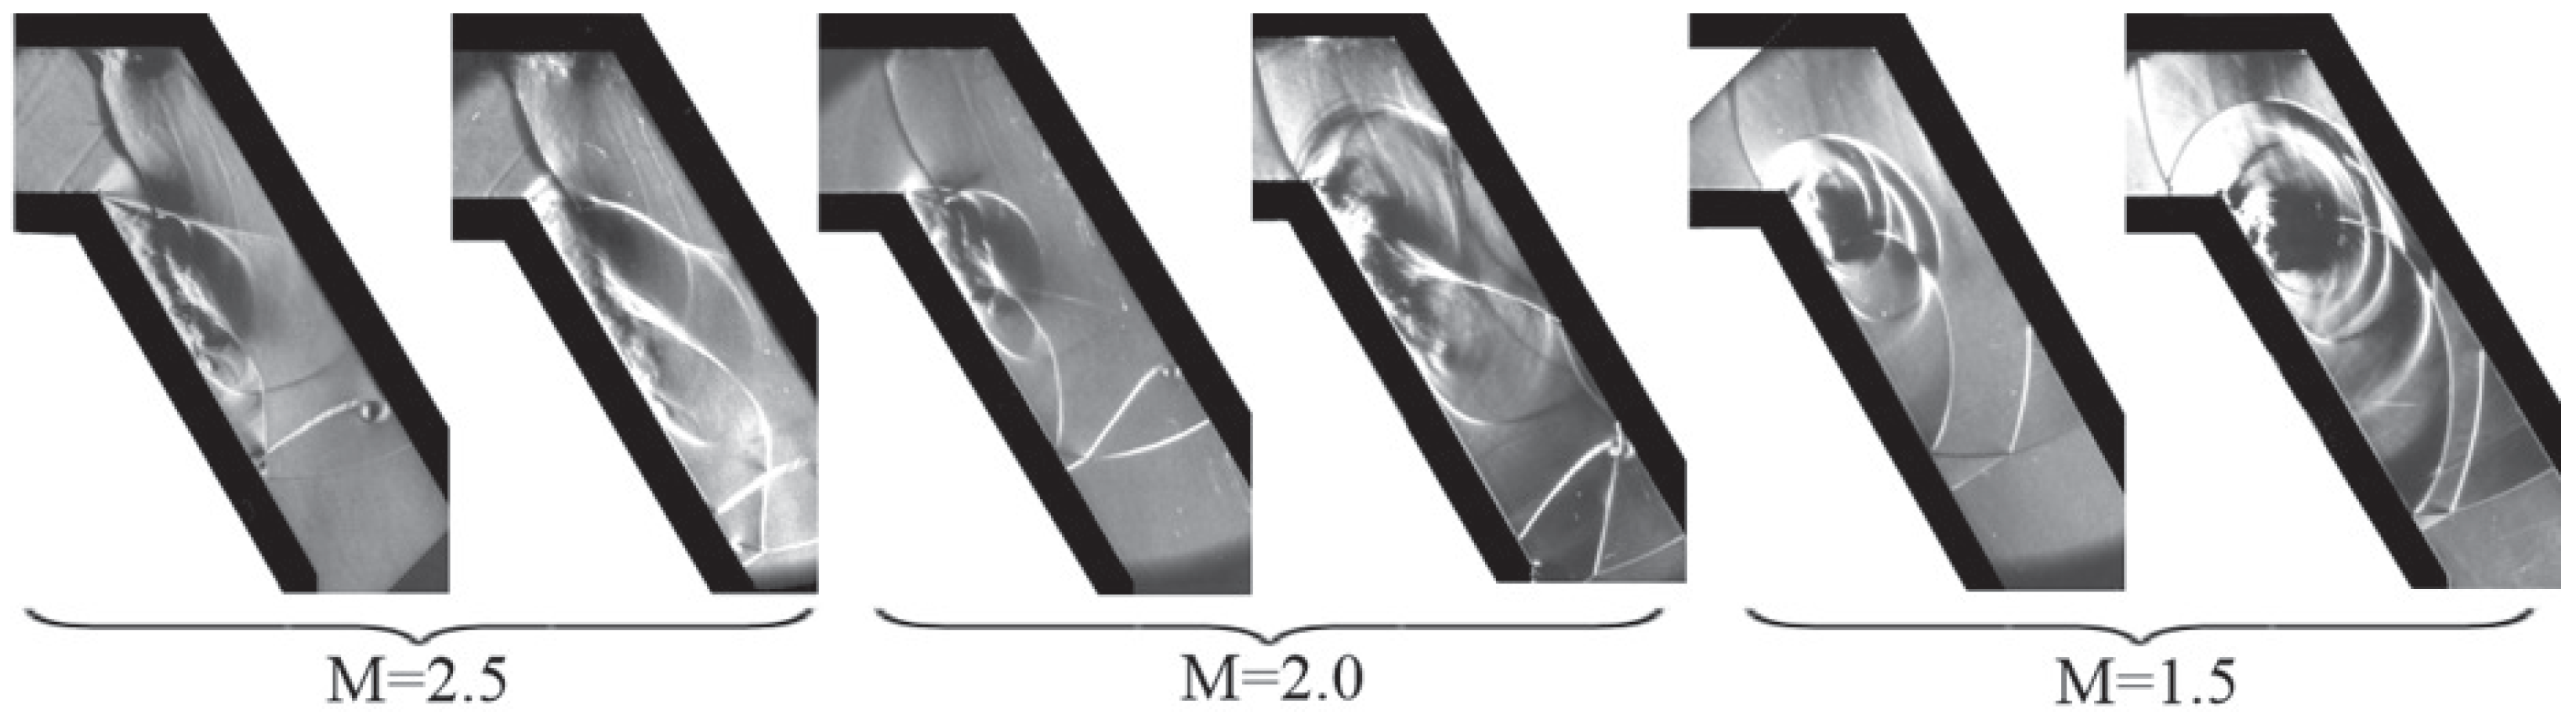
The pattern of behavior for a sixty degree bend is similar to that for a ninety degree bend as shown in Figure 25 for three Mach numbers. The fanning effect, with the second pass of the shock through the vortex, becomes more noticeable at Mach 2.5 and 2.0. It is not evident at Mach 1.5. The turbulent path on the near wall is less elongated for the weaker shocks.
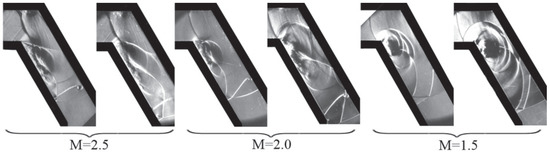
Figure 25.
Shock propagation around a bend.
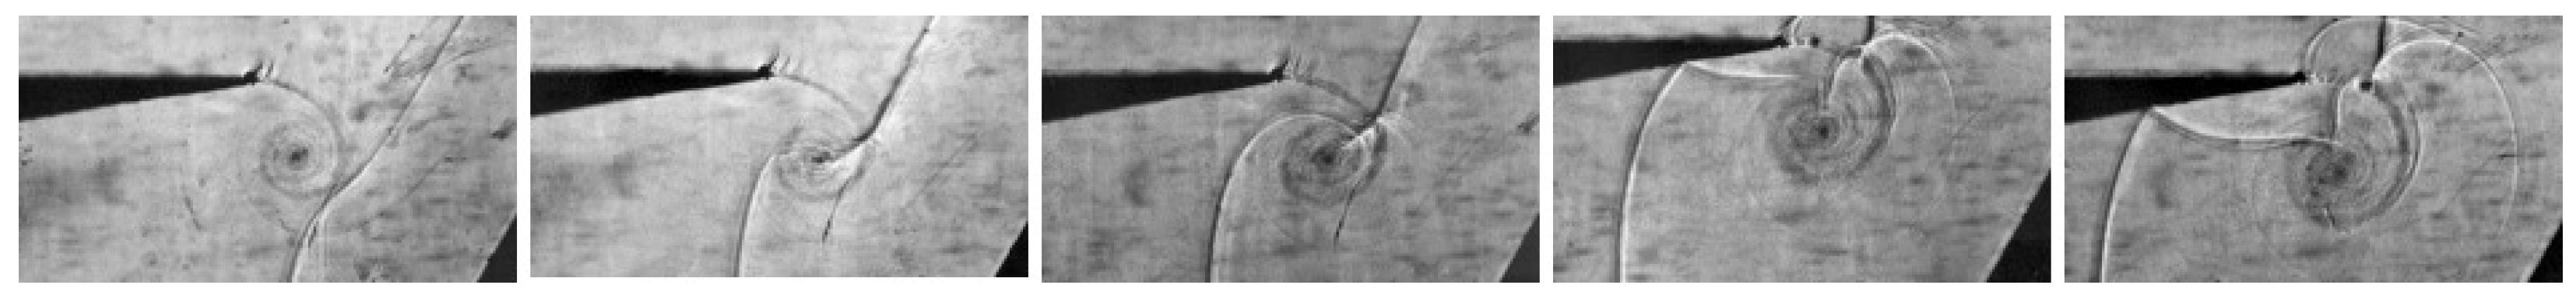
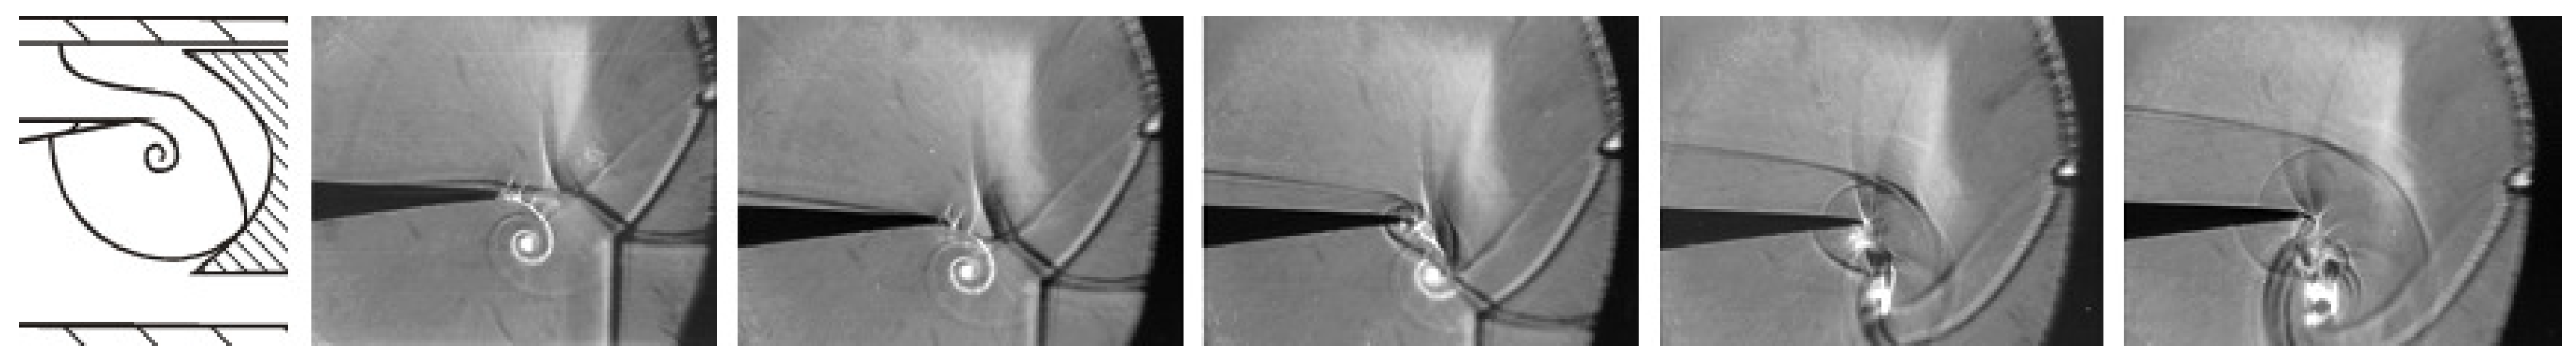
As indicated above the nature of a shock-vortex interaction is influenced by the curvature of the transiting shock wave, the direction from which the shock approaches, and whether there is more than one transit. An experiment, done by some visiting students from Holland, explored some of these issues, particularly that of shock curvature and transit direction. A plane Mach 1.36 shock wave was diffracted over a convex corner, in the rig shown in Figure 4, thereby shedding a spiral vortex. The curved diffracted wave is then reflected off plane reflection surfaces at angles of , and back over the vortex as well as from a curved reflecting surface [23].
Images for the case are given in Figure 26. The reflecting surface is 23 mm from the tip of the wedge and visible to the right in the images. The interaction of the shock with the shear layer results in both undergoing significant bending as well as the formation of a reflected wave. As the shock passes into the vortex it travels against the vortex motion as a slow diffracted shock (SDS) whereas that passing through is accelerated and is pulled around the vortex, as a fast diffracted shock (FDS). These two waves meet in a cusp in the second frame with a reflected wave which would result in a pressure peak as discussed earlier. The FDS then propagates upwards striking the bottom of the slipstream and the wedge surface. It reflects from the bottom surface and diffracts around the tip where it develops into a Mach reflection with its shear layer which is pulled into the vortex. Small vortices develop on the shear layer. The one reflected shock formed at the cusp propagates away and the other, together to the one formed at the cusp, move into the vortex and terminate there. They propagate together downward against the flow direction of the vortex.

Figure 26.
Shock-vortex interaction due to a reflected shock diffraction from a surface.
Results for the and reflecting walls are given in Figure 27 and Figure 28. In the case of all plane reflecting surfaces the vortex becomes more elongated as the surface angle increases, with the major axis tilting in the direction of the wall angle. The case has the same features and development as the case with the development of a cusp and associated reflected waves and refraction at the shear layer. This refraction does not occur for the case since the reflected wave has a similar inclination as the shear layer, as shown in the first frame. A Mach reflection develops on the lower surface of the wedge with a slipstream winding into the vortex.

Figure 27.
Shock-vortex interaction due to a reflected shock diffraction from a surface.

Figure 28.
Shock-vortex interaction due to a reflected shock diffraction from a surface.
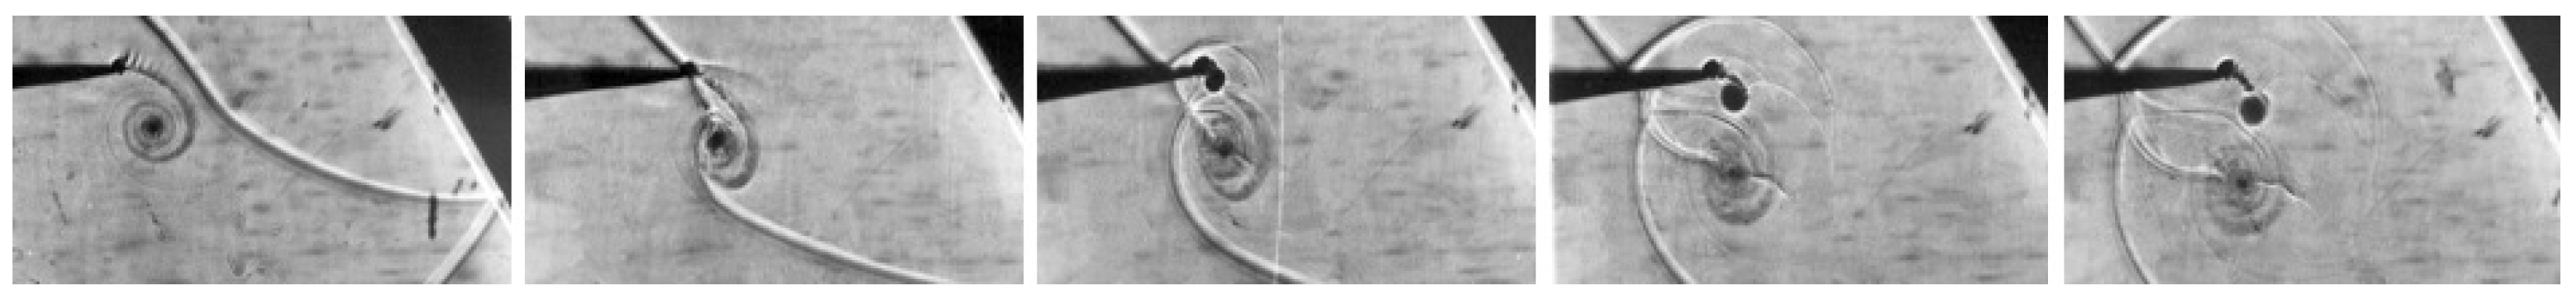
In order to get some insight into the effect of an imploding shock on the vortex the arrangement shown in the first frame of Figure 29 was used. The shape of the converging reflected diffracted wave off the test piece is shown in the first image. It is refracted at the shear layer which is already wrapping around the vortex. On the opposite side the wave from the test piece also engages the vortex with the development of a reflected wave and a cusp which suggests the development of a pressure peak. There are other cusps resulting from the interaction of the fast diffracted shock with the slow diffracted shock as dealt with previously. The reflected wave from the underside of the wedge then enters the vortex where it dissipates.

Figure 29.
Shock-vortex interaction from a curved surface reflected shock diffraction.
Additional tests were conducted with the idea of using a parabolic reflector to generate a stronger and much more complex incoming wave [21]. This was with a Mach 1.42 incident shock. The arrangement is given in the first frame of Figure 30. Due to cutting off part of the incident shock generated in the shock tube the wave generated in the reflection off the curved cavity surface consists of a strong Mach stem between associated reflected waves and shear layers as shown in the second frame. Due to the higher Mach number the shear layer from the corner is also more complex with shocklets and small embedded vortices. The reflected wave from the top triple point curves slightly as it encounters the shocklets and then bends as it passes through the shear layer. As the triple point passes into the vortex some wave distortion occurs with the fast diffracted shock then emerging and joining the slow diffracted shock in a cusp. Thereafter there is clear evidence of vortex disruption and a complex resulting flow.
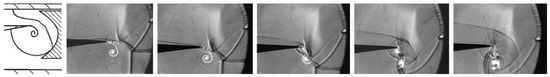
Figure 30.
Shock-vortex interaction from a focusing reflected shock.
4. Discussion
The spiral vortex structure of the experiments reported represents a common and realistic flow pattern as is found in practice. It contrasts to previous studies most commonly treated in the literature using an idealized isolated vortex, mainly handled through numerical simulation. The generation of a spiral vortex arises due to the separation of a flow at a corner and is characterized by a shear layer wrapping around into a spiral. Although there are many similarities with previous studies dealing with an isolated idealized vortex there are many significant differences. The incident shock wave is refracted as it passes through the shear layer, changing in both strength and inclination and resulting in shear layer deflection as well. Vortex proximity to a surface has a significant influence inducing jet type flows and additional shocks between it and the surface with the shock propagating in a direction opposite tot he vortex flow.
A cusp is generated as the diffracted waves emerge from either side of the vortex as the incident wave passes through it due to the development of a regular reflection between the waves. This results in a pressure spike, determined experimentally for the first time, and confirmed numerically. The magnitude of the spike can be nearly three times that of the pressure in its surroundings due to the pressue behind the incident shocks, and occupies a very small spatial area. A physical explanation of the shock wave focusing process that generates the spike is elucidated as well as the existence and development of a second spike.
Experiments show that the vortex is extremely stable even when transited more than once by a shock and in many cases it can become highly distorted, often becoming more and more elliptical and extended depending on the approach direction of the shock. There is an indication of disruption when struck by a very complex shock wave pattern. In some cases significant areas of turbulent motion result.
Experimental cases when the incident shock has a Mach number sufficiently high to cause the flow behind it to be supersonic show the interaction to become increasingly complex. This is an area needing further investigation.
The indications are that transit direction and wave curvature are not primary factors in potential vortex disruption. Nevertheless there are clearly consequences of both of these variables on the nature of the interaction, which could then have an effect at later times, or if the vortex is impacted a second or more times.
Funding
This review covers a number of projects primarily done by students over a period of some 25 years, and was partially funded by the South African National Research Foundation through a series of annual grants for material and equipment averaging about $10,000 per year under a scheme `Competitive Program for Rated Researchers’.
Acknowledgments
This work is a compilation of research over a number of years conducted in the Flow Research Unit of the University of the Witwatersrand. The contributions of the following students are acknowledged: L. Felthun, F Barbosa, G. du Sauytoy, C. Erasmus, U. Kaka and two visiting students from Holland: M Heemskerk and J Kooijmans. The significant input from the School’s workshop staff is gratefully acknowledged for the manufacture of the experimental rigs.
Conflicts of Interest
The author declares no conflict of interest.
References
- Hollingsworth, M.A.; Richards, E.J. A Schlieren Study of the Interaction between a Vortex and a Shock Wave in a Shock Tube; Technical Report FM 2323; Aeronautical Research Council, Fluid Motion Subcommittee 17985: Cranfield, UK, 1955. [Google Scholar]
- Ribner, H.S. The Sound Generated by Interaction of a Single Vortex with a Shock Wave; Technical Report 61, UTIA Reports; UTIA: Springfield, MA, USA, 1959. [Google Scholar]
- Ribner, H.S. Cylindrical sound wave generated by shock-vortex interaction. AIAA J. 1985, 23, 1708–1715. [Google Scholar] [CrossRef]
- Dosanjh, D.S.; Weeks, T.M. Interaction of a starting vortex as well as a vortex street with a traveling shock wave. AIAA J. 1965, 3, 216–223. [Google Scholar] [CrossRef]
- Ellzey, J.L.; Henneke, M.R.; Picone, J.M.; Oran, E.S. The interaction of a shock with a vortex: Shock distortion and the production of acoustic waves. Phys. Fluids 1995, 7, 172–184. [Google Scholar] [CrossRef]
- Ellzey, J.L.; Henneke, M.R. The shock vortex interaction: The origins of the acoustic wave. Fluid Dyn. Res. 1997, 21, 171. [Google Scholar] [CrossRef]
- Inoue, O.; Hattori, Y. Sound generation by shock-vortex interactions. J. Fluid Mech. 1999, 380, 81–116. [Google Scholar] [CrossRef]
- Zhang, S.; Zhang, Y.T.; Shu, C.W. Multistage interaction of a shock wave and a strong vortex. Phys. Fluids 2005, 17, 116101. [Google Scholar] [CrossRef] [Green Version]
- Chatterjee, A.; Vijayaraj, S. Multiple sound generation in interaction of shock wave with strong vortex. AIAA J. 2008, 46, 2558–2567. [Google Scholar] [CrossRef]
- Chang, K.S.; Barik, H.; Chang, S.M. The shock-vortex interaction patterns affected by vortex flow regime and vortex models. Shock Waves 2009, 19, 349–360. [Google Scholar] [CrossRef]
- Skews, B.W. An experimental study of the interaction of shock waves with bends in a duct. In Symposium on Internal Flows; Salford University: Manchester, UK, 1971; pp. D41–D45. [Google Scholar]
- Skews, B.W. Shock/vortex interaction in shock wave propagation around sharp-angled bends. In 2nd International Workshop on Shock/Vortex Interaction; Takayama, K., Jiang, Z., Eds.; Shock Wave Research Center, Tohoku University: Sendai, Japan, 1998; pp. 140–148. [Google Scholar]
- Skews, B.W. The perturbed region behind a diffracting shock wave. J. Fluid Mech. 1967, 29, 705–719. [Google Scholar] [CrossRef]
- Timofeev, E.V.; Voinovich, P.A.; Takayama, K. On shock-vortex interaction in a rectangular channel bend. In 3rd International Workshop on Shock-Vortex Interaction; Higashino, F., Takayama, K., Timofeev, E., Eds.; Shock Wave Research Center, Tohoku University: Kanagawa, Japan, 1999; pp. 87–96. [Google Scholar]
- Felthun, L. Finite Element Analysis of Compressible Flows. Master’s Thesis, Mechanical Engineering, University of the Witwatersrand, Johannesburg, South Africa, 1995. [Google Scholar]
- Barbosa, F.; Skews, B.W.; Felthun, L. Reflection of plane shock waves and vortex-shock wave interaction studies using holographic interferometry and high speed videography. In Proceedings of the 21st International Symposium on Shock Waves; Houwing, A.F.P., Ed.; University of Queensland, Department of Mechanical Engineering: Great Keppel Island, Australia, 1997; Number 5288. [Google Scholar]
- Barbosa, F.; Skews, B.W. Experimental investigations of shock wave-vortex interactions. In 2nd International Workshop on Shock-Vortex Interactions; Takayama, K., Ed.; Shock Wave Research Center, Tohoku University: Mount Zao, Japan, 1998; pp. 161–172. [Google Scholar]
- Barbosa, F.J.; Skews, B.W. Shock wave interaction with a spiral vortex. Phys. Fluids 2001, 13, 3049–3060. [Google Scholar] [CrossRef]
- Skews, B.; du Sautoy, G. Strong shock/vortex interactions in a bifurcated shock tube. In 4th International Workshop on Shock Wave/Vortex Interaction; Jiang, Z.L., Ed.; Institute of Mechanics, Chinese Academy of Sciences, China: HuangShan, China, 2001; pp. 19–26. [Google Scholar]
- Bryson, A.E. Waves in Fluids; National Committee on Fluid Mechanics Films; NSF: Chcago, IL, USA, 1964. [Google Scholar]
- Skews, B.W.; Erasmus, C. Interaction of complex shock geometry with a spiral vortex. In 5th international Workshop on Shock Wave/Vortex Interactions; Liang, S.M., Ed.; National Cheng Kung University: Kaohsiung, Taiwan, 2004; pp. 1–6. [Google Scholar]
- Kaka, U. Shock Wave Propagation around Bends; Final year project report; University of the Witwatersrand: Johannesburg, South Africa, 2019. [Google Scholar]
- Skews, B.W. Curved shock wave interaction with a spiral vortex. In 23rd International Symposium on Shock Waves; Lu, F., Ed.; University of Texas at Arlington: Fort Worth, TX, USA, 2002; pp. 1317–1322. [Google Scholar]


Publisher’s Note: MDPI stays neutral with regard to jurisdictional claims in published maps and institutional affiliations. |
© 2021 by the author. Licensee MDPI, Basel, Switzerland. This article is an open access article distributed under the terms and conditions of the Creative Commons Attribution (CC BY) license (https://creativecommons.org/licenses/by/4.0/).