1. Introduction
Construction of mine shafts in wet soils is usually carried out using special methods. One of the most common of these is artificial freezing [
1,
2]. Within the framework of this method, a contour of freeze wells is drilled around the designated mine shaft, and freeze pipes are installed in them. These freeze pipes are connected to the brine network and the brine (or coolant) circulates in them; as a result, the wet soil around the pipes gradually cools and freezes. The formed area of frozen soils has the shape of a hollow cylinder and is called the frozen wall (FW) (see
Figure 1). The FW is used for waterproofing the shaft under construction and for strengthening its walls before the construction of a permanent concrete lining.
The construction of a shaft begins when the FW thickness reaches a value determined from mechanical calculations for strength and creep [
3,
4,
5]. In this case, the average temperature of the FW should not be higher than the specified temperature value at which the mechanical calculations were performed. The actual FW state is determined according to experimental monitoring data—soil temperature at depth for thermal monitoring (TM) wells (usually 3–4 wells), as well as measurements of the groundwater level in the TM well located inside the freezing contour (see
Figure 1). Experimental monitoring of the FW state is a mandatory procedure prescribed by many countries’ regulations. On the basis of the data from experimentally measured temperatures in TM wells, the mathematical models of heat and mass transfer processes in soils during artificial ground freezing (AGF) are usually adjusted [
6,
7,
8]. These adjusted mathematical models allow for the correct calculation of the temperature distribution over the entire soil volume and the FW thickness at the current time and are necessary to make predictions for FW evolution in the future.
The calculation of the temperature field in frozen soils today is carried out using many different methods and approaches. The simplest approach is to use analytical and semi-analytical solutions of the heat conductivity equation [
9,
10]. In this case, assumptions are often made about the absence of latent heat of the phase transition of moisture in the soil and the stationarity of heat transfer processes. Numerical methods for calculating heat transfer in 2D [
11,
12] and 3D [
13,
14,
15] are also used. They are most common today in the practice of building mine shafts. A number of articles describe the practical application of thermohydrodynamic models that take into account the water filtration in the pores of the soil [
16,
17,
18]. This is most often the case in the construction of subway tunnels. In these cases, the analysis of groundwater filtration is actually carried out on the basis of the asymmetry of temperatures measured in the TM wells. Some researchers [
19,
20] consider even more complex thermohydromechanical models that make it possible to analyze the effect of cryogenic suction and frost heaving in soils on the FW growth. However, the adjustment of such models according to the data of scarce experimental measurements is not always possible.
The experimental measurements in TM wells must be subjected to a comprehensive analysis before being used to adjust the model. As practice shows, situations are possible when the measured temperatures behave in a way that cannot be predicted by the model. Abnormal temperature distributions appear due to the influence of unaccounted technological or natural factors. In this case, the correct analysis of the FW formation requires complementing the model.
This paper describes and discusses a number of anomalous situations that arose during thermal monitoring in TM wells in the process of AGF. A case study of a skip shaft of a potash mine in the Republic of Belarus is considered.
2. Object of Study
The potash mine is located in the Soligorsk region of the Republic of Belarus. According to the design documentation, the mine has two shafts with diameters of 8 m—a skip shaft and a cage shaft. Preliminary hydrogeological studies within the mine shafts showed that the soils are heavily watered in the depth interval 0–139.4 m and can provide water inflow to the shaft at a maximum flow rate of 4000 m3/h. The sediments of the weakly water-bearing Polesie complex lie at depths of 140–180 m and can provide water inflows up to 29.67 m3/h. The expected water inflows in deeper layers of soils (180–265 m) do not exceed a value of 2.5 m3/h. The presence of watered unstable soils in the depth interval 0–180 m and the expected water inflows to the shafts with flow rates higher than the threshold value of 10 m3/h necessitate the use of a special method of shaft sinking—AGF. The decision was made to carry out shaft sinking without AGF in the depth interval 185–265 m; small volumes of water that can flow into the shafts at these depths can be eliminated using a drainage bucket.
The depth of the freeze wells is equal to 185.0 m, including 5–10 m depth in the bottom aquiclude. The diameter of the freezing contour on which the centers of the freeze wells are located is 15.4 m. There are 39 freeze wells, with a distance between adjacent wells of 1.24 m.
A CaCl2 solution is used as a brine in the freeze pipes; the intended temperature of the brine in the freezing system is −30 °C. The brine reaches this temperature 20–30 days after the start of AGF, with a daily temperature decrease of 2–3 °C. The flow rate in the brine network is maintained in the range of 228–342 m3/h. The minimum required cooling capacity of the freezing station for each shaft is 594 kW. Taking into account these parameters of the freezing system, the required FW thicknesses will be reached in all soil layers in the depth interval 0–180 m within 170 days of the start of AGF.
Each shaft is equipped with four TM wells with a depth of 185 m to monitor the formation and state of the FW. Three TM wells are located on the outside of the freezing contour, to control the formation of the outer part of the FW, and one TM well is located inside the freezing contour to control the formation of the inner part of the FW. The wells are on opposite sides of the shaft, at the maximum distance from one another.
Each TM well is equipped with a casing pipe. The pipes are also filled with CaCl
2 brine similar to that circulating in the brine network, with the exception of the TM wells inside the freezing contour which are filled with groundwater. The pipes contain a fiber optic cable with double wire armor and an outer protective sheath made of stainless steel throughout the entire depth. Distributed temperature sensing (DTS) using fiber optic cables is based on the Raman effect [
21]. The temperature measurement accuracy is 0.1 °C, and the spatial resolution of measurements is 0.25 m. Before the start of FW thermal monitoring, the readings of the fiber optic cable are calibrated. An autonomous downhole thermometer is lowered into each TM well and measures the temperature at 2–3 marks; manually measured temperatures using the thermometer are then compared with temperature values measured using the DTS system.
The fiber optic cables are connected to a fiber optic recorder, which processes the raw data and calculates the temperature distribution along the depth profile of the TM wells. These data, together with brine temperature and flow rate data, are sent twice a day to the server of the Mining Institute; thus, the DTS system provides the latest information on the FW state.
3. Theoretical Analysis of Monitoring System Measurements
The temperature distributions along the depth of the TM wells are used to restore the temperature field in the entire soil volume under the action of AGF. This is usually performed by solving the inverse Stefan problem [
8,
22] in the enthalpy formulation [
2,
23].
where
is the specific enthalpy of the soil (J/m
3),
is the nabla operator,
d/dt is the material derivative,
is physical time (s),
are thermal conductivities of the soil in the unfrozen and frozen zones, respectively (W/(m·°C)),
are specific heat capacities of the soil in the unfrozen and frozen zones, respectively (J/(kg·°C)),
are densities of the soil in the unfrozen and frozen zones, respectively (kg/m
3),
is the liquidus temperature (°C),
is the solidus temperature (°C),
is the volume fraction of ice in the pores of the soil (iciness) (m
3/m
3),
r is the empirical power factor,
L is the specific heat of crystallization of water (J/kg),
w is the initial moisture content in the soil (kg/kg),
is the temperature of the brine in the freeze pipes (°C),
is the initial (thermally undisturbed) temperature of soil (°C),
is the heat transfer coefficient at the freeze pipe (W/(m
2·°C)),
are boundaries with all freeze pipes,
is the number of freeze pipes,
is the outer boundary of the modeling area, and
n is the coordinate along the normal to the boundary
(m).
Equation (8) is an over-determining condition; this means that the calculated temperatures in the TM wells should be equal to the experimentally measured ones. This additional condition causes the transition from the direct to the inverse Stefan problem. The inverse problems are considered to be ill-posed, and, for this reason, the solutions to Equations (1)–(8) can be obtained by Tikhonov’s natural regularization method described in [
24] and implemented in our previous works [
8,
25]. Additional unknown parameters appear in Equations (1)–(8), which are to be determined, namely, the thermophysical properties of soils (i.e., thermal conductivities
and initial moisture content
w). In this sense, solving the inverse Stefan problem allows us to adjust the thermophysical parameters of the model so that the calculated temperature distribution matches the measured temperatures in the TM wells as closely as possible.
Within the framework of the enthalpy–porosity approach, all information on the phase transition of pore water is contained in the function of specific enthalpy on temperature—. In this case, there is no need to explicitly track the front of the phase transition, which greatly simplifies the procedure for the numerical implementation of the model in Equations (1)–(8). From the form of the function included in the model, it follows that the front of the phase transition is blurred in a finite temperature range . In this temperature range, the phase transition heat is released as a result of crystallization of the vast majority of the pore water.
Usually, in problems of freezing and thawing of soils, the calculation of the effective thermal conductivity is carried out using the geometric mean [
26,
27,
28,
29]. However, in Equation (2), the effective thermal conductivity is considered on the basis of the algebraic mean. This is appropriate in cases where the temperature range
, in which the phase transition of most of the water in the pores occurs, is considered small or the initial moisture content
w in the soil is small. These conditions are usually satisfied in the case of AGF in shaft construction. The use of the algebraic law, in this case, is preferable to reduce the computation time.
The material derivative in Equation (1) generally contains two terms, one of which describes the intrinsic variation of the temperature field, and the other which describes the convective transport of the field in the flow. Most often, when analyzing AGF in shaft sinking, we assume that the convective term is zero since there is no pronounced flow of pore water in natural conditions. However, in rare practical situations (one of which is discussed below), this value cannot be taken equal to zero. In this case, the model in Equations (1)–(8) should be supplemented with the mass balance equation and Darcy’s law,
with the corresponding boundary conditions (under the assumption that the flow of pore water is in a steady state),
where
is the superficial velocity vector (m/s),
is the superficial velocity vector in undisturbed (natural) conditions (m/s),
is the relative permeability,
K is the absolute permeability of the soil (m
2),
is the dynamic viscosity of water (Pa·s), and
is the hydrostatic pressure in the pore space (Pa).
The relative permeability,
, is usually set equal to unity at
and 0 at
. Due to the lack of empirical data on the permeability of soils at various negative temperatures, in the simplest case, it is assumed that
An important point in Equations (1)–(8) is the condition of heat transfer to the freeze pipe. This condition is set using a convective boundary condition in order to take into account the finite rate of heat transfer through the boundary layer of the brine flowing through the pipe. As our experience shows, the use of first-type boundary conditions leads to a significant overestimation of heat flux through the wall of the freeze pipe. If we estimate the value of the heat transfer coefficient according to the method described in [
30], then we obtain the value
h = 45 W/(m
2·°C) for the considered case of AGF (assuming coolant flow rate
Q = 342 m
3/h and Re = 903).
Hereinafter, we discuss only the skip shaft, since the obtained data of thermal monitoring of the FW state for the skip shaft have several unusual features. In order to explain these features, it was necessary to use a numerical simulation of heat and mass transfer processes in the frozen soils, as well as in the TM well located inside the freezing contour.
4. Abnormal Temperature Behavior in TM Wells at Depths 130–140 m
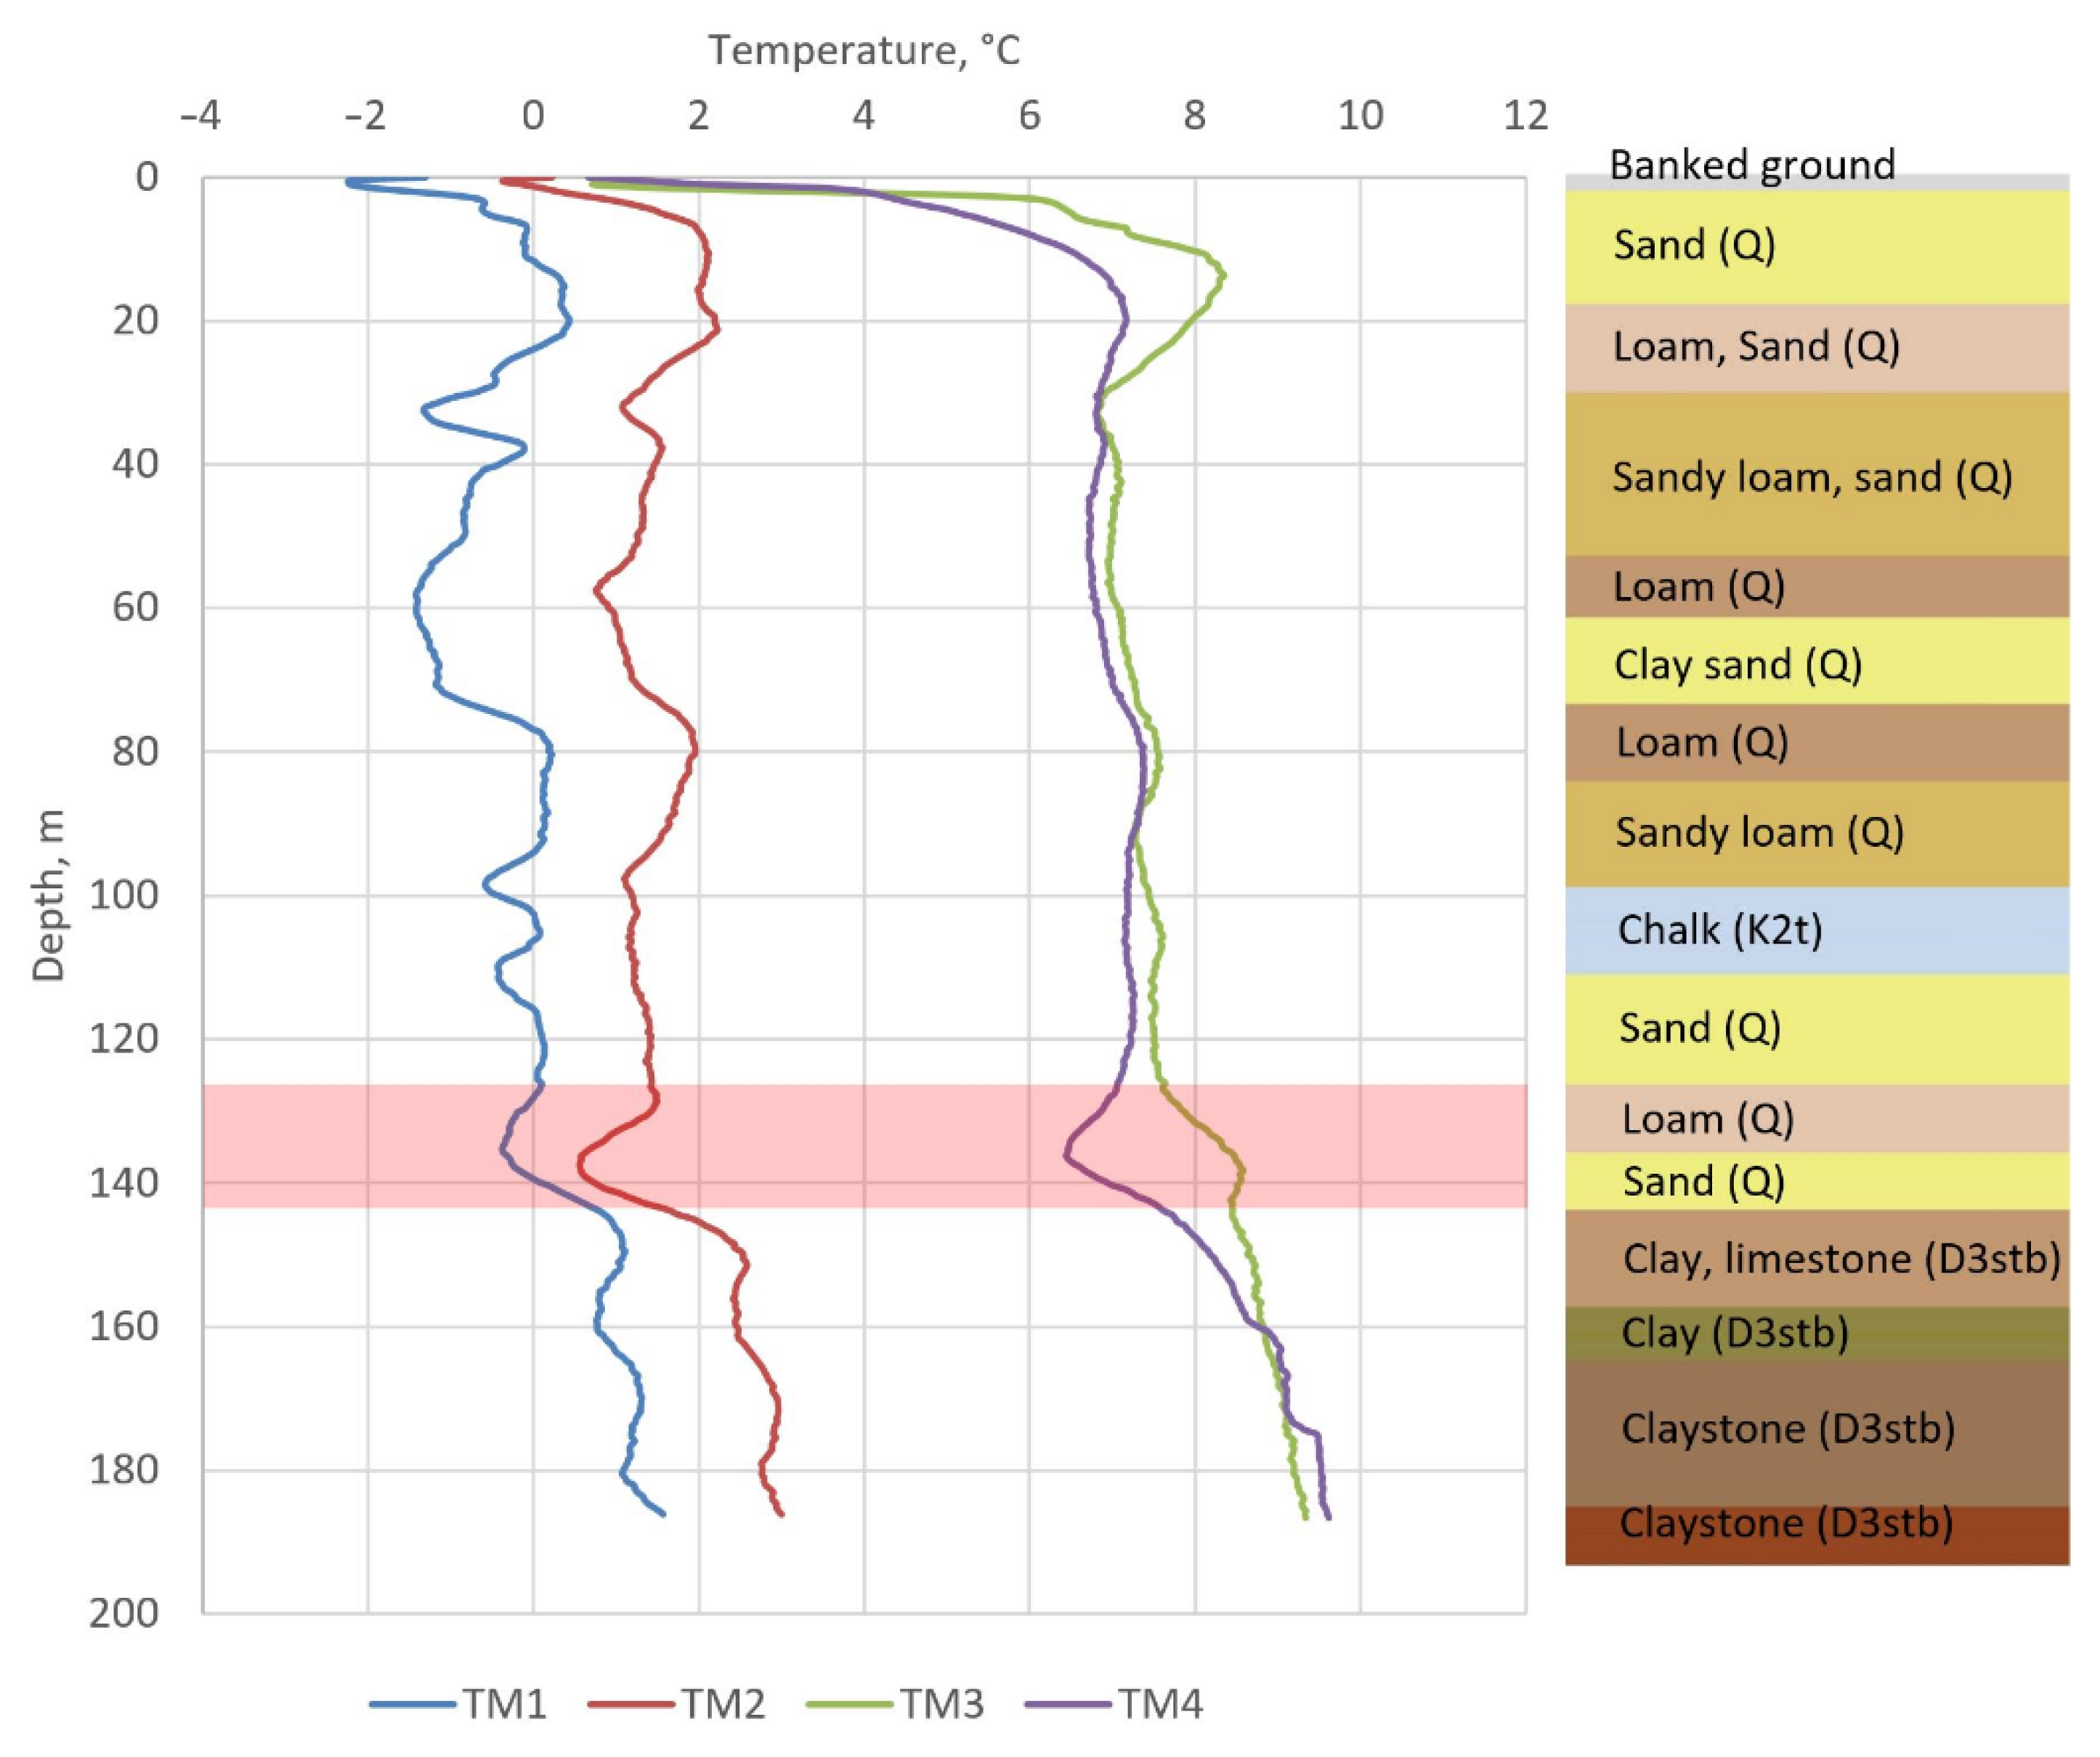
The distributions of temperatures along the depth of the TM wells of the skip shaft, obtained by the thermal monitoring system, are shown in
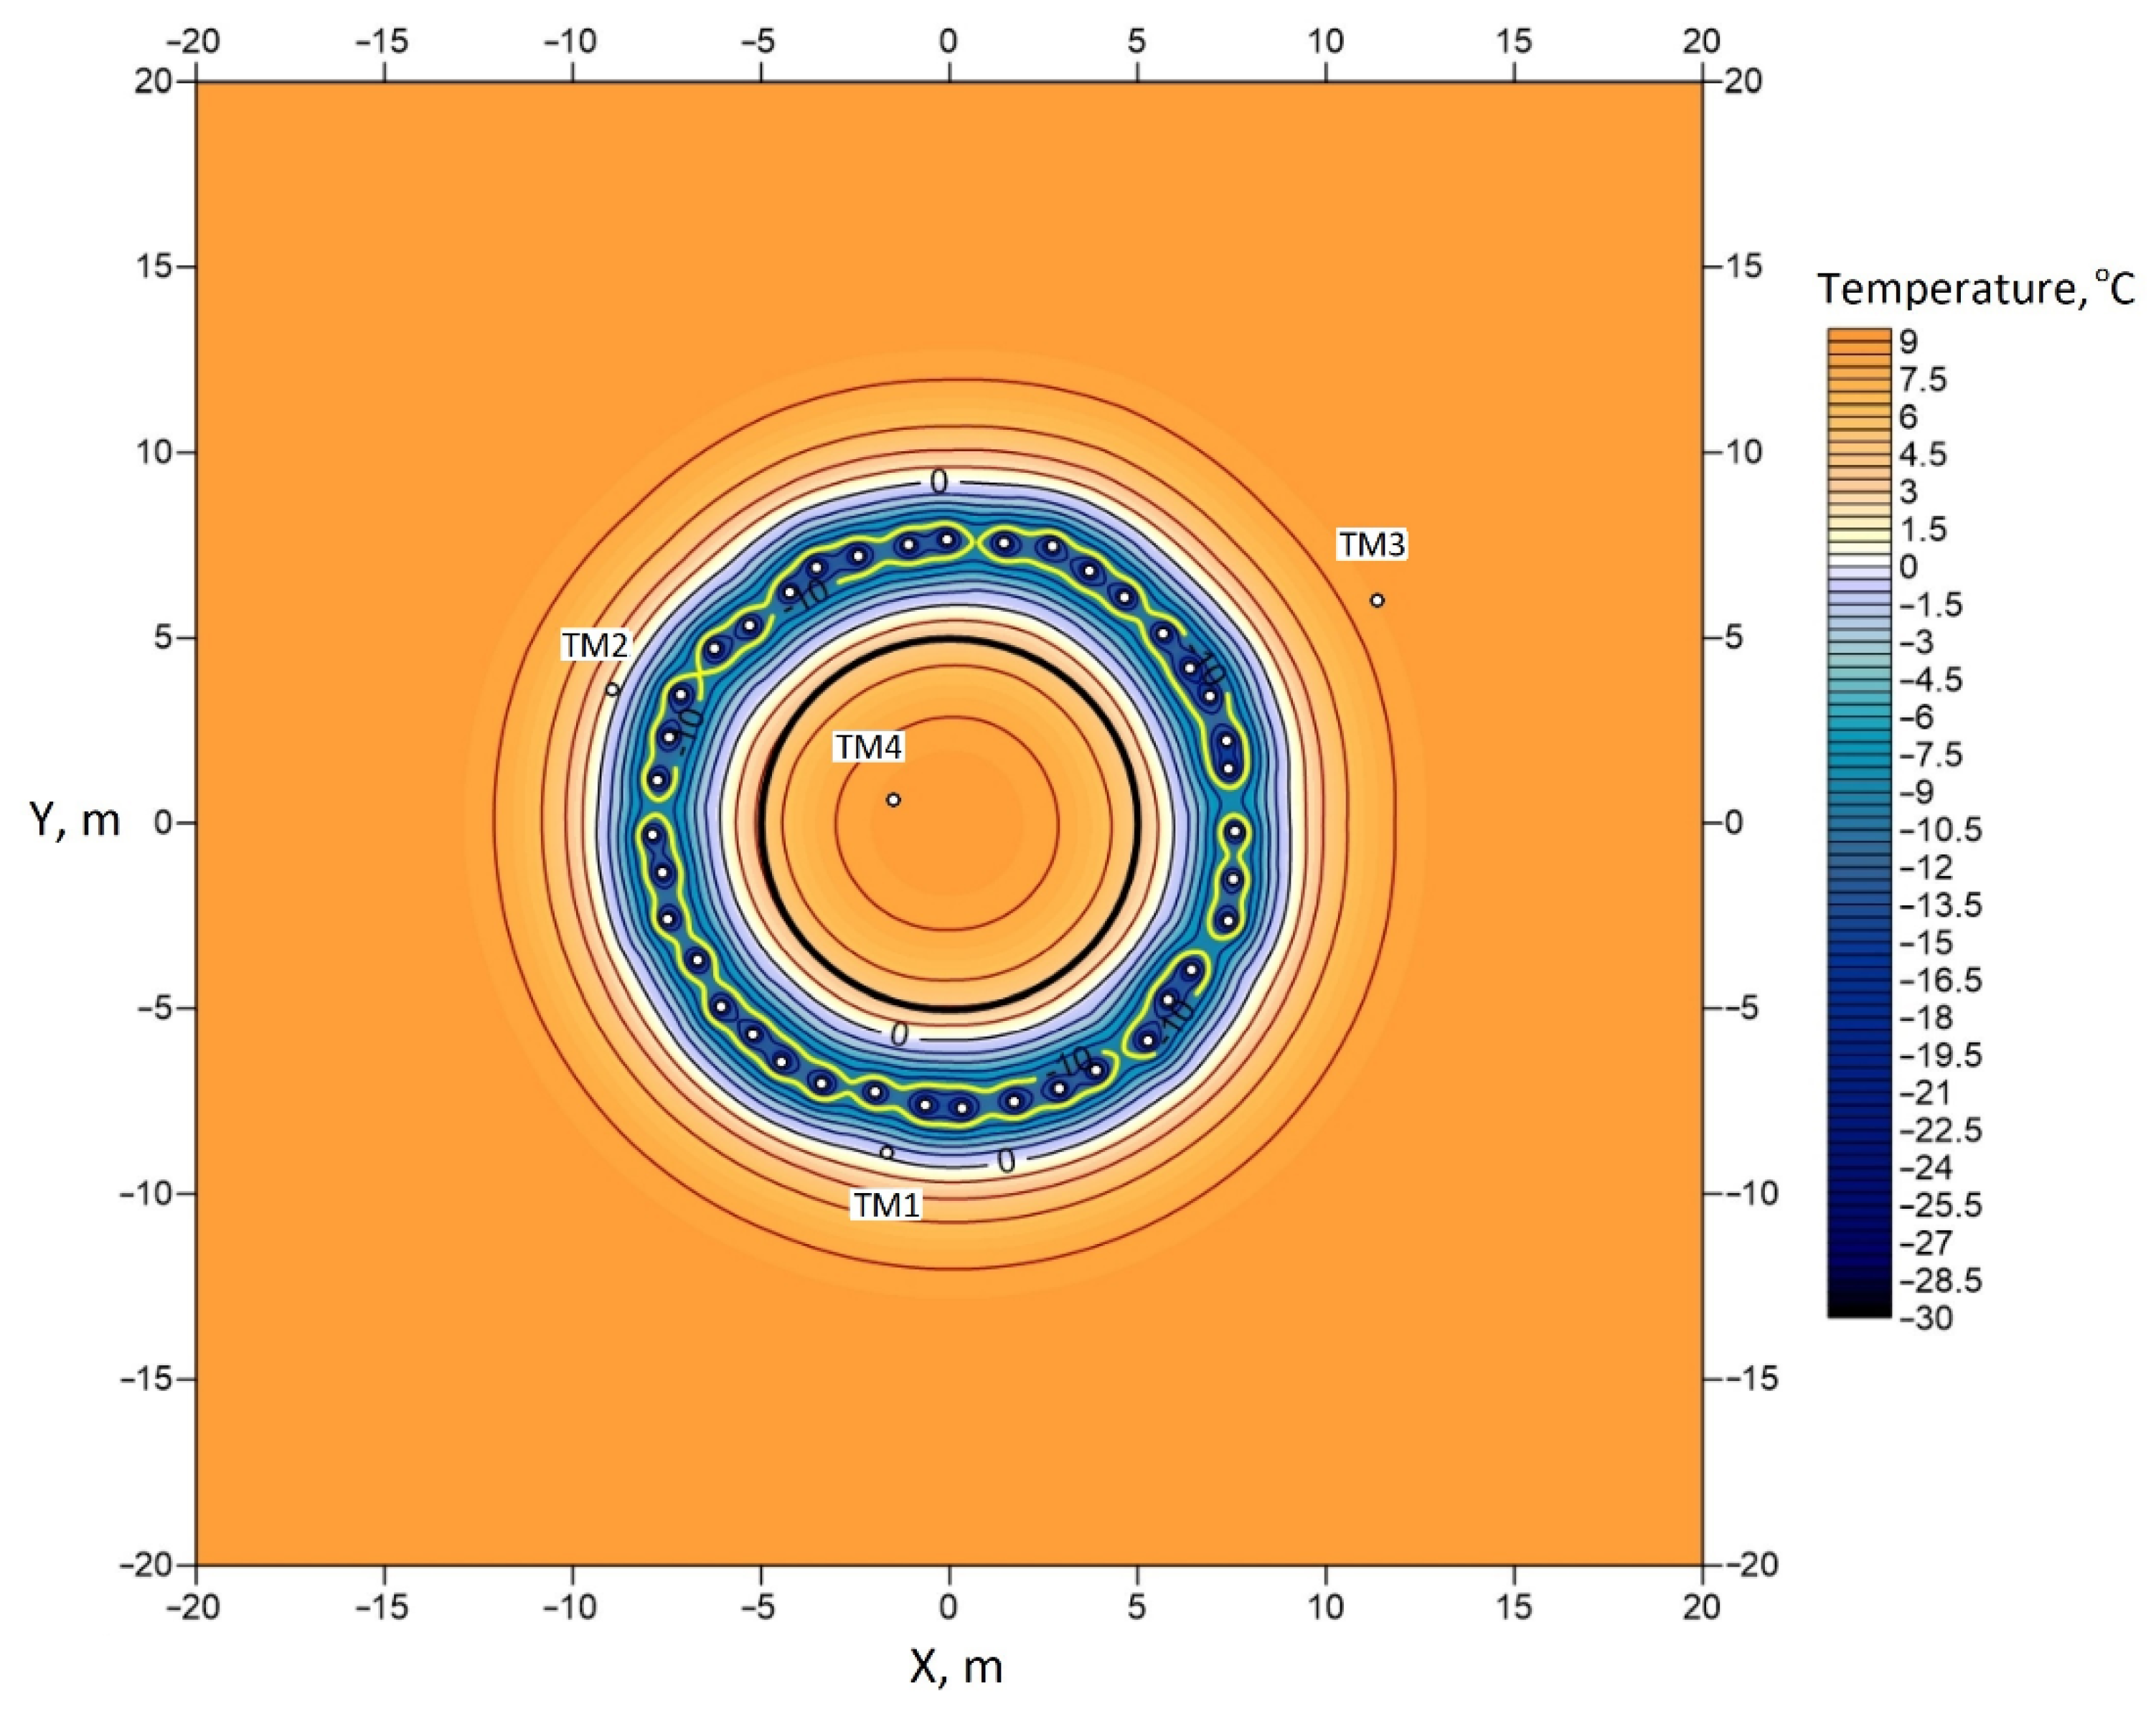
Figure 2. TM1 is located at a distance of 1.4 m from the freezing circuit, TM2 is located at a distance of 2.0 m, TM3 is located at a distance of 5.0 m, and TM4 is located at a distance of 6.2 m. The locations of the TM wells are shown in
Figure 3.
The measured temperature distributions in four TM wells at different times were used to solve the problem (1)–(8). The solution was obtained by the natural regularization method according to the method described in [
8]. The problem was solved separately for each of the 15 horizontal layers of soils (see
Figure 2) in a two-dimensional formulation. This simplification is motivated by a reduction in computational time. It was assumed that the calculated two-dimensional temperature field corresponds to the median horizontal section of each soil layer. In the middle section, the temperature distribution over a certain period will be correctly described by a two-dimensional formulation of the problem, assuming a sufficiently large thickness of each soil layer (>5 m).
The numerical solution was constructed for each horizontal soil layer using the finite difference method on an inhomogeneous polar mesh. The grid refinement was set on the freeze pipes; the characteristic cell size at this boundary was 5 mm. An explicit first-order time scheme and a second-order central space scheme were used. The width of the computational domain (60 m) was chosen so that the boundary condition for temperature, specified on the outer boundary, would not affect the solution in the zone of soil freezing.
As a result, for each of the soil layers, the thermophysical properties were corrected and the nonstationary temperature distribution was calculated (see
Figure 3). The presented temperature distribution was obtained by solving the heat transfer problem in Equations (1)–(8) without taking into account the convection of pore water. Neglecting convection was based on two considerations: the reduction in computation time and lack of explicit references that indicate groundwater currents are present in soil layers.
Figure 2 shows that the closer the TM well is located to the freezing contour, the lower its temperature. In general, all wells have fairly similar curves with common temperature extremes. However, the nature of the temperature dependence over depth for TM3 is slightly different from the other three wells in some depth intervals. For TM1, TM2, and TM4, the temperature has a local minimum at depth z ≈ 135 m, while, for TM3, a local maximum is observed at this depth. This phenomenon is observed during the entire freezing period and intensifies over time; thus, it attracted our attention.
To investigate this phenomenon, it was first necessary to exclude the possibility of incorrect readings of the DTS system. To confirm the reliability of the identified temperature anomaly, additional experimental temperature measurements were made on 15 February in wells TM1 and TM2 at depths of 120 m, 139.5 m, and 160 m using an autonomous LITAN thermometer. The absolute error of temperature measurement by the DTS system in normal conditions is 0.2 °C, and the spatial resolution is 0.35 m. The absolute error of temperature measurement of the LITAN thermometer is 0.25 °C. A comparison of LITAN measurements with the DTS is given in
Table 1. The maximum temperature mismatch was small, i.e., not greater than 0.1 °C; thus, the measurements confirmed the reliability of the measurements of the DTS system, its correct operation, and the objective existence of the detected temperature anomaly.
As previously mentioned, we did not take into account convective heat transfer; therefore, the resulting temperature distribution in the horizontal cross-section of all soil layers was assumed to be symmetrical in the circumferential direction (see
Figure 3). However, the observed asymmetric temperature distribution at a depth interval of 130–140 m (
Figure 2 and
Figure 4) led to the impossibility of solving the inverse problem (1)–(8) at a certain moment of time with a given degree of accuracy at TM wells. In this instance, the minimum achievable mismatch between the model and measured temperatures at the TM wells began to exceed 1 °C. To eliminate this problem, it was necessary to add new physical processes to the model that were not previously taken into account. The simplest hypotheses about the reasons for the asymmetry of the temperature field are as follows: (i) brine leaks from one or more freeze pipes; (ii) filtration flow of groundwater.
The possible anisotropy of thermophysical properties (and, as a special case, the presence of cracks) is a more complex hypothesis that requires information about the nature of the inhomogeneities in the thermal properties of soil, as well as the direction and thickness of the cracks. For this reason, it was not considered in the study. The two abovementioned hypotheses are simpler in that they introduce at least one new parameter (i.e., the minimum flow rate of brine leaks and filtration rate of pore water).
The hypothesis of possible brine (CaCl2 solution) leaks was tested experimentally in two ways: by estimating the decrease in the volume of brine in the brine network and by estimating the chemical composition of water in TM4, which is equipped with a filter column through which subsurface water can penetrate from the ground into the well. Chemical analysis of water from TM4 did not show an increase in Ca2+ cations and Cl– anions compared to the initial composition of water, and a reduction of the total brine volume in the brine network was also not detected; thus, the hypothesis of brine leakage was considered unlikely.
Analysis of geological survey data showed that the strata in the 131–139 m interval are coarse-grained and are, therefore, characterized by an increased value of the filtration coefficient of groundwater. The base of Quaternary deposits, represented by sand with pebble inclusions, lies at a depth of about 141.5 m. This is the base of an aquifer with an estimated water inflow into the shaft of about 4000 m3/h and possibly the lowest point of the paleovalley. The structure of the bottom of the paleovalley and the distribution of heads in geological exploration wells indicate that groundwater flow is possible in an east to west direction, i.e., down the slope of the paleovalley.
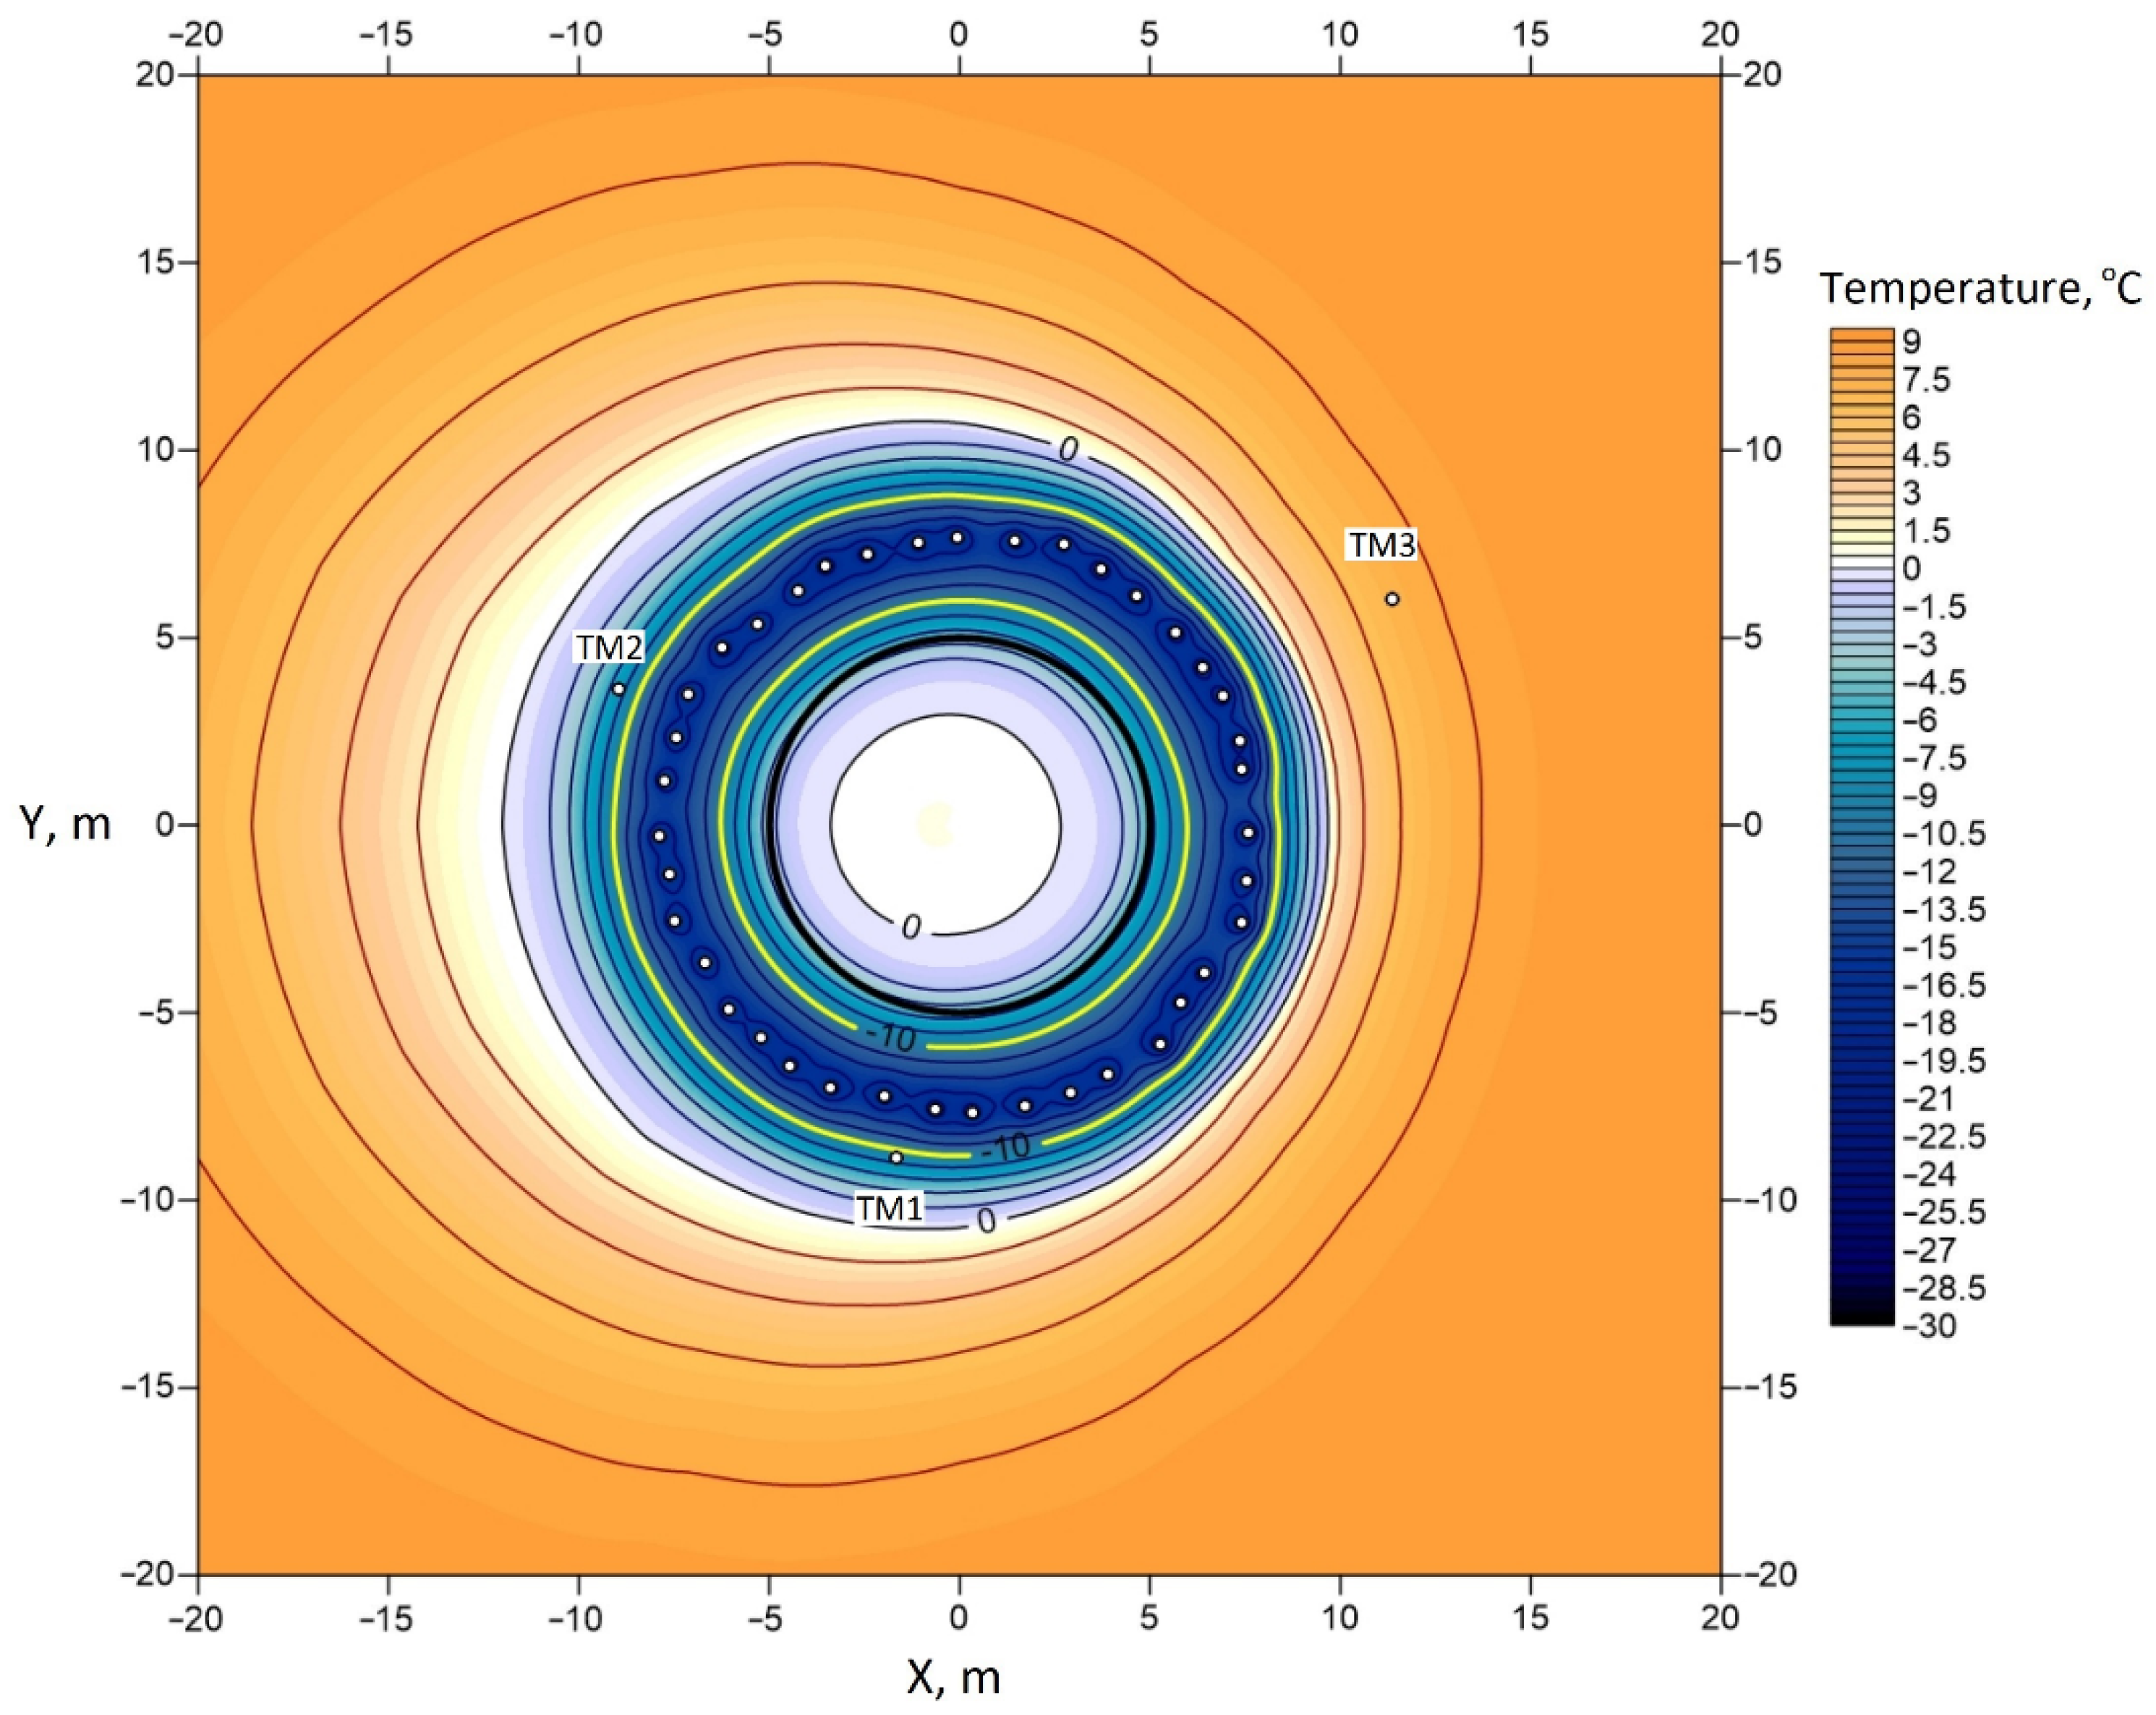
For the theoretical analysis of this hypothesis, a numerical simulation of AGF was carried out taking into account the horizontal flow of groundwater in a direction similar to that suggested by geologists. The horizontal groundwater flow hypothesis was introduced on the basis that all four curves in
Figure 2 have extrema at the same depth—about 135 m. The magnitude of the groundwater flow vector was determined to best satisfy Equation (8). The results of numerical simulations are presented in
Figure 4. The determined filtration rate was 30 mm/day. The temperature mismatch of the TM wells decreased from 1.5 °C to less than 0.1 °C.
Figure 4 shows that the temperature isolines became asymmetric relative to the center of the computational domain when taking into account the convective heat transfer from west to east (right to left). In TM3, located upstream, temperatures became higher, and, in wells TM1 and TM2, located downstream, the temperatures became lower. This is in good agreement with the experimental data (see
Figure 2). Note that, in
Figure 4, there is no well TM4, since, by the time of the calculation (1 July 2021), it was already abandoned due to the beginning of shaft sinking. An asymmetric temperature distribution was also observed inside the freezing contour. This was due to the influence of convective heat transfer at the initial stage of AGF, when the FW was not closed.
5. Abnormal Temperature Behavior in the TM Well inside the Freezing Contour
As noted earlier, TM4 is equipped with a filter column at depths below 160 m. Underground water can penetrate through this filter from the ground into the well. This is a standard procedure that is used to observe the closure of a frozen wall at depths below 160 m. If the FW is closed, the subsequent process of freezing of pore water inside the freezing contour leads to the squeezing out of the unfrozen part of the water from the phase transition front due to the expansion of water during crystallization. Unfrozen water will flow into the TM well, and the water level in the well will rise until the water begins to pour out through the open wellhead at the surface. The rising water level will indicate that the FW is closed at depths below 160 m.
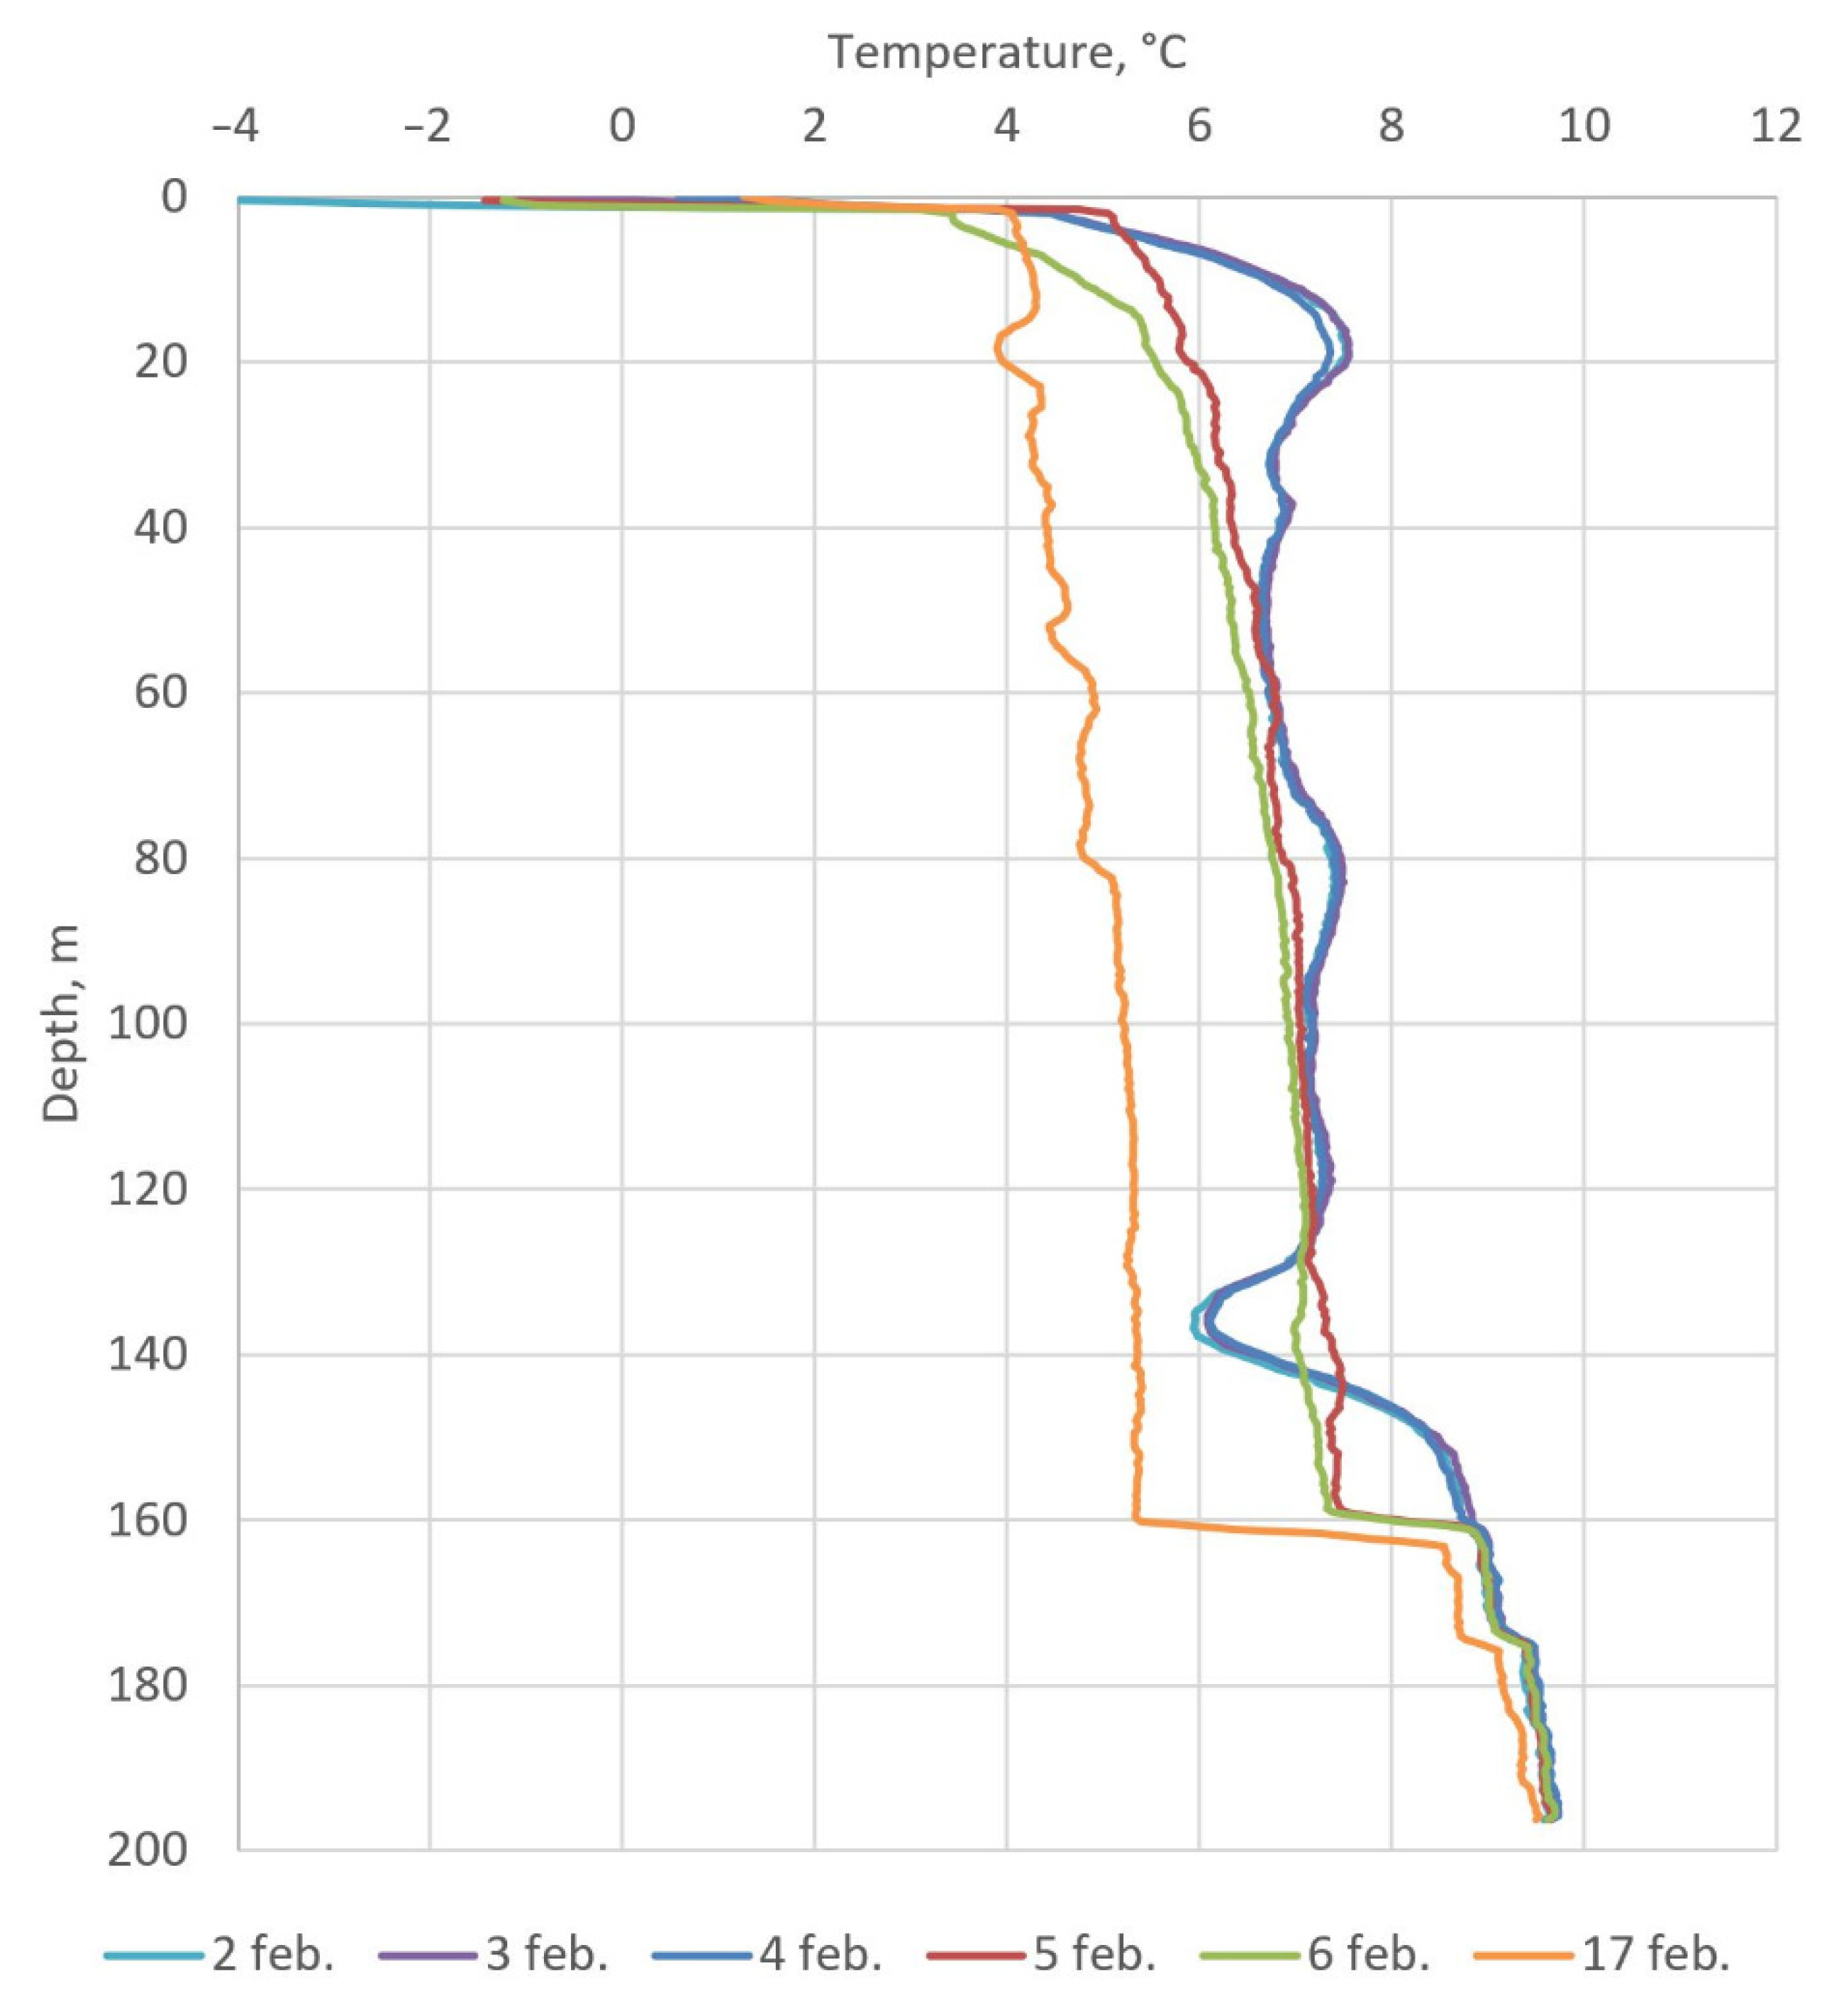
Starting from 5 February, the temperature distribution in TM4 in the depth interval 0–160 m began to change rapidly for an unknown reason (see
Figure 5). The change was pronounced both in depth and in time. The temperature profile over depth became much smoother in the form of a decaying exponential dependence. Small irregularities in the temperature curve were constantly changing over time. The temperature in the TM4 at the depth interval of 0–160 m began to decrease significantly faster than previously. It is noteworthy that, at a depth of 160 m, a temperature jump of 2–3 °C became pronounced. At depths below 160 m, the temperature distribution in TM4 did not change significantly; instead, it continued to smoothly change over time with the same intensity as before.
Several explanations of this anomalous phenomenon have been proposed. One of the first explanations was that the DTS system was defective. However, this explanation was discarded: the verification measurements of temperature using an autonomous thermometer LITAN, performed on 10 February (see
Table 2), showed good agreement with the readings of the DTS system (<0.4 °C discrepancy) within the limits of instrumental error and measurement procedure error.
We distinguished the following four important features of the abnormal temperature distribution in TM4 according to measurement data during the time period from 5 to 17 February:
A temperature jump at a depth of 160 m, where the upper boundary of the pipe filter is located.
A gentle form of the temperature curve above 160 m, which does not reflect the variability of the geological structure in the interval 0–160 m.
A rapid decrease in temperature with time over the entire range of 0–160 m to a value of about 4 °C, but not lower.
A slight slope of the curve T = T(z) (where z is the depth, m) in the first 50–70 m, leading to an increase in temperature with increasing depth.
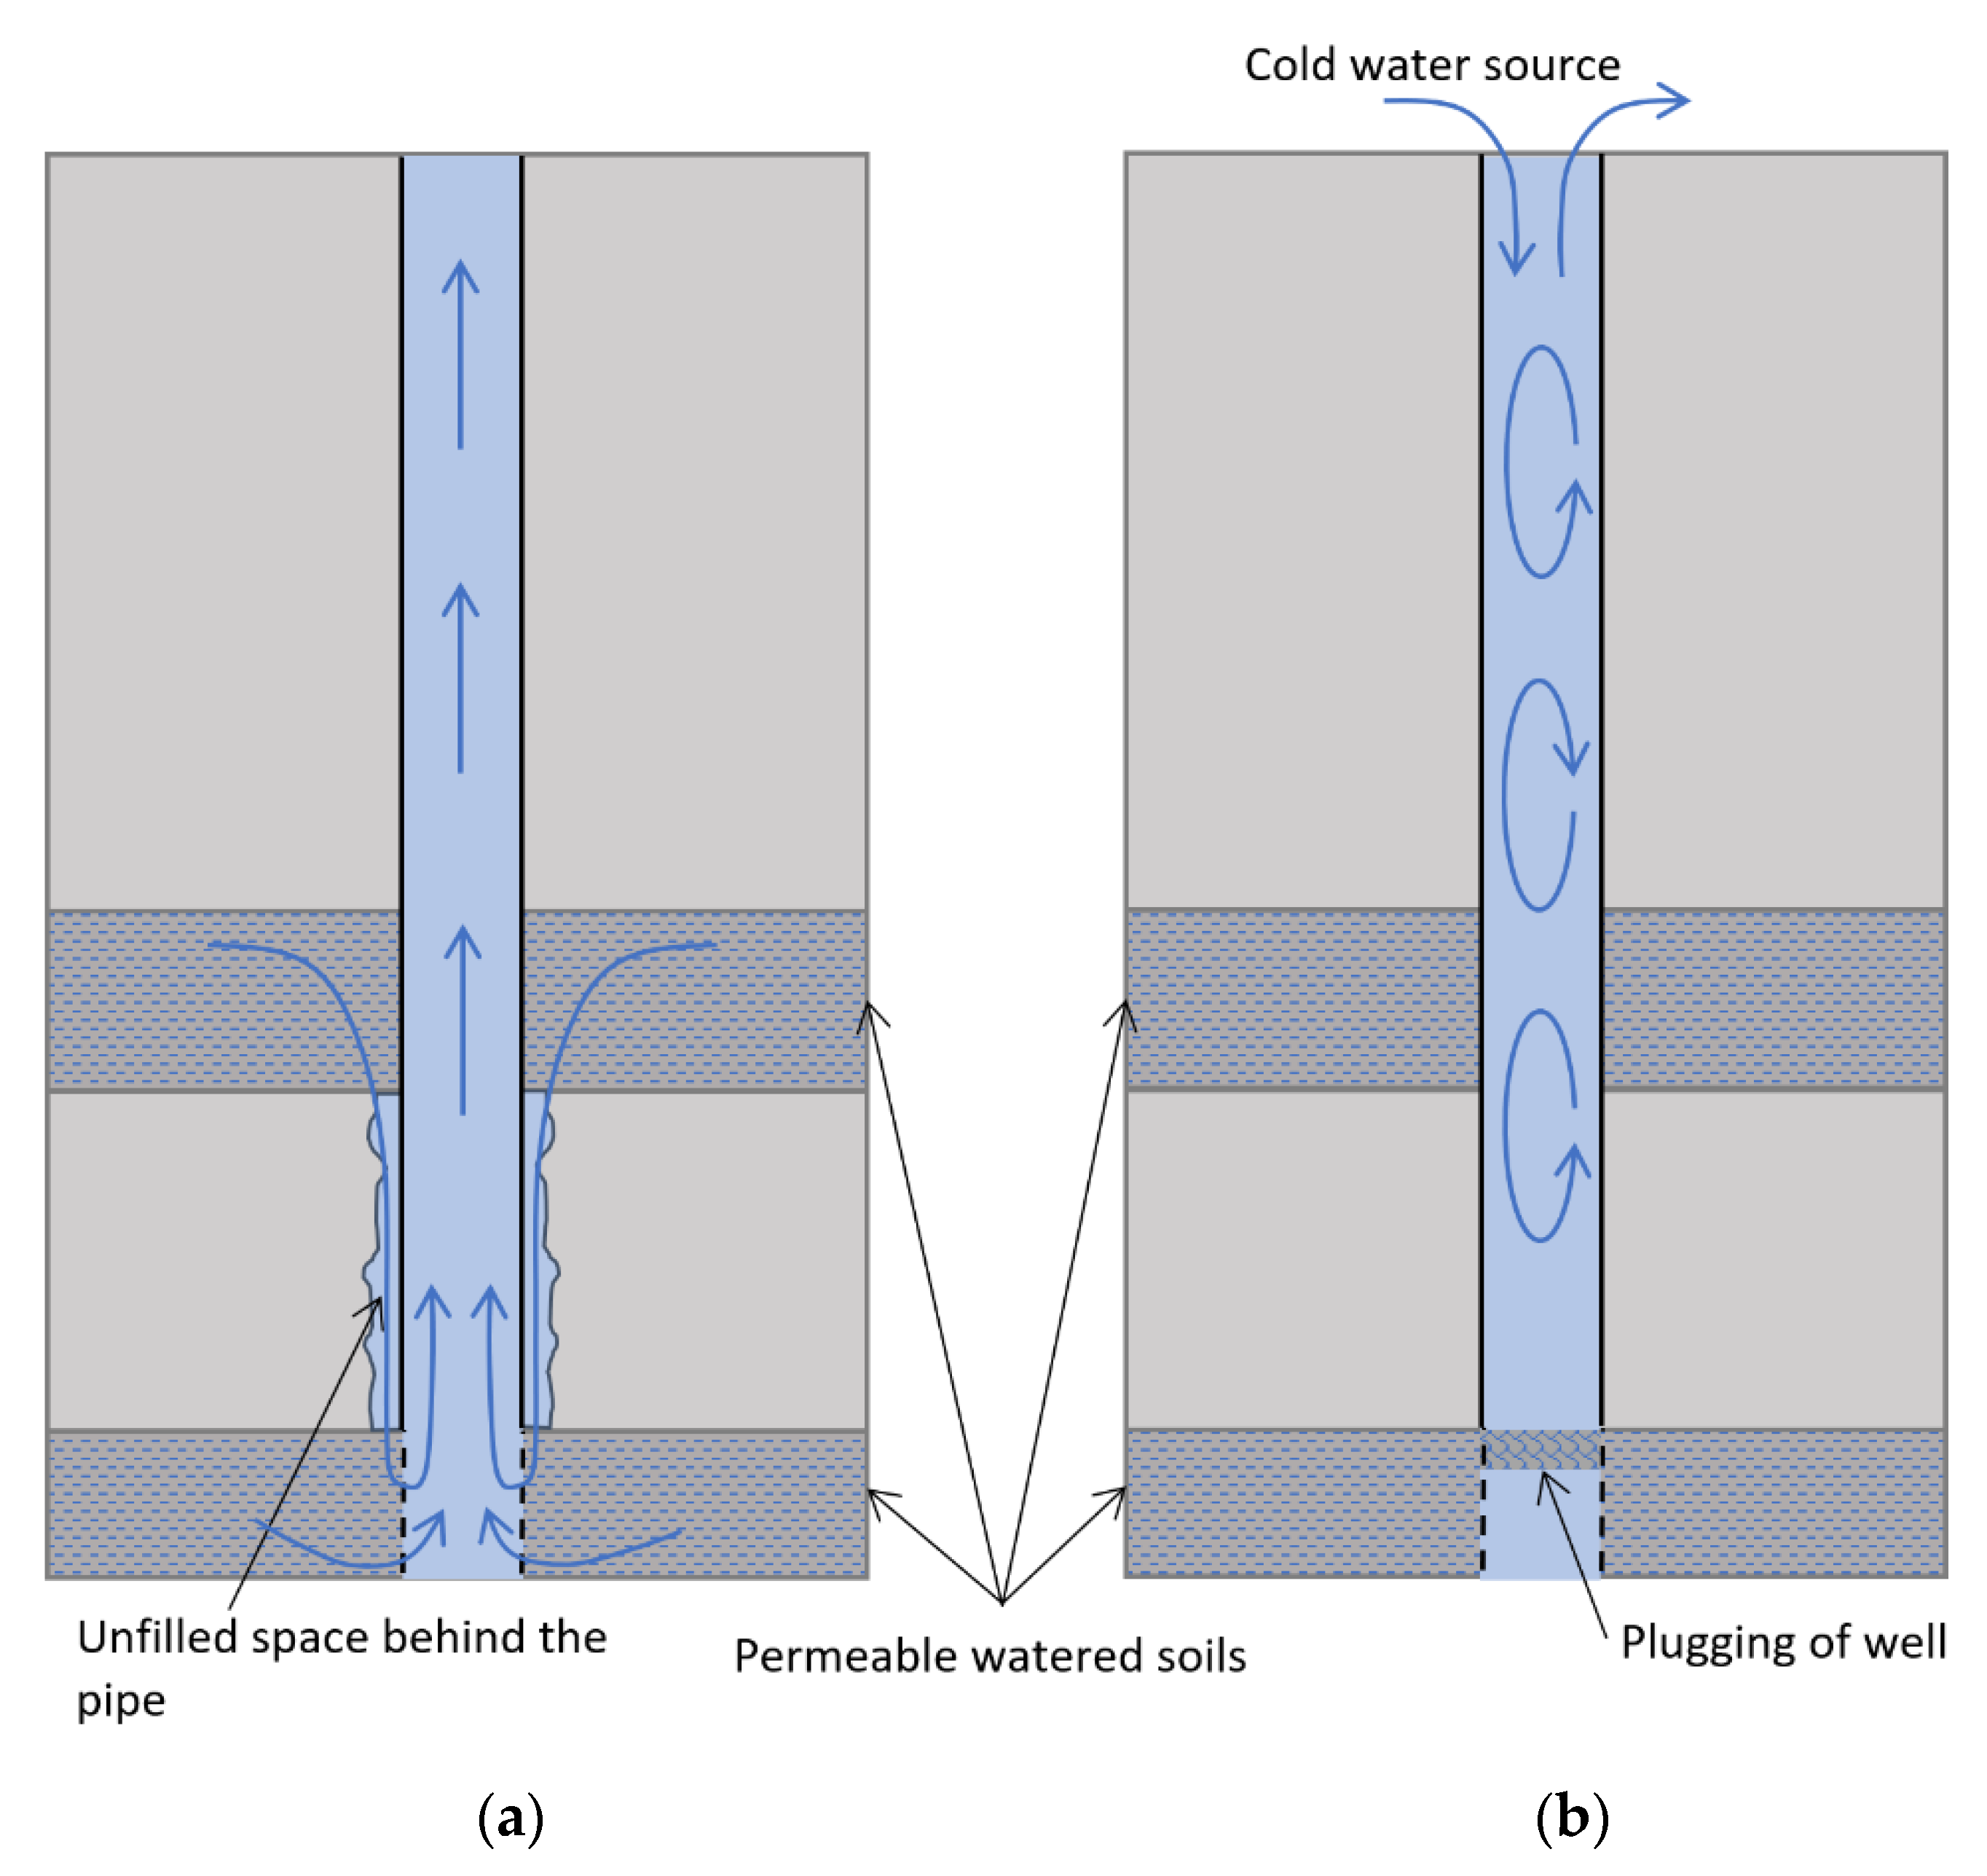
These features of the temperature curve may have been associated with the presence of convection in TM4. The temperature jump at 160 m may be related to the inflow of groundwater into the well filter, its ascent through the well, and outflow into the foreshaft through the open wellhead (see
Figure 6a). The flow of water into the well can be associated with its displacement from the soil by growth of the frozen zone and expansion of the freezing water. Moreover, the well can receive not only water from the soil layer where a filter exists but also colder water from the overlying layers, which can flow through cracks and pores in the subsurface or through the empty space between the pipe and the wall of the TM well.
Another possible scenario is the presence of free (thermal) convection in the well section 0–160 m and plugging of the well at a depth of 160 m by various pieces of soils that penetrated into the well through a filter. Free convection may be intensified due to cold water in the foreshaft, which can penetrate into the well and replace the warmer water in it (see
Figure 6b). The first hypothesis is quite simple, while the second one is more complicated and requires the simultaneous fulfillment of several factors. However, we decided to test the possibility of both hypotheses by performing numerical simulations.
The first hypothesis was tested on a one-dimensional mathematical model of stationary water flow along the entire depth of the well with a given average velocity
where
kg/m
3 is the water density,
J/(m·°C) is the specific heat capacity of water,
V = 0.35 mm/s is the velocity of water flow,
Z is the vertical coordinate directed upward and measured from the bottom of the well,
is the coordinate of the filter,
W/(m
2·°C) is the heat transfer coefficient through the wall,
d = 0.146 m is the diameter of the well, and
= 6 °C is the temperature of water, entering the pipe through the filter. A steady-state temperature distribution
was specified on the wall, corresponding to the temperature profile in
Figure 5 on 4 February.
The Z-coordinate varies in the range from 0 to 190 m. This coordinate is related to the depth z according to the relationship .
The water velocity in the well and the heat transfer coefficient are unknown parameters in this problem. Moreover, the solution depends only on their ratio, as follows from Equation (14). For this reason, an analysis of the numerical solution of Equations (14) and (15) was carried out for different values of the parameter
. The calculated temperature dependences over the column depth are shown in
Figure 7a; the temperature
is also shown.
As shown, this model can describe a temperature jump at a depth of 160 m and does not reflect the features of the geological structure of the subsurface layers in the depth interval 0–160 m. However, the temperature distribution above is steady-state, linear, and monotonic for a wide range of possible values of the heat transfer coefficient. Features 3 and 4 of the temperature distribution in TM4, therefore, still cannot be explained within the framework of this model.
Equations (14)–(16) can be supplemented with the equation of thermal conductivity in the surrounding unfrozen soil with the following corresponding boundary and initial conditions:
where
r is the radial coordinate (m),
is the soil temperature (°C),
m
2/s is the thermal diffusivity of the soil (m
2/s),
W/(m·°C) is the thermal conductivity of the soil,
m is the outer boundary of the computational domain for soil, and
m is the inner boundary of the computational domain for soil (well radius) (m).
In this case, in the right-hand side of Equation (14), instead of
,
should be put. As a result, Equations (14)–(19) representing a model of coupled heat and mass transfer in the well and in the surrounding unfrozen soil is obtained. Numerical calculation of heat and mass transfer
based on this model was implemented using the finite difference method in the Wolfram Mathematica 12.0 package. The numerical simulations show that the temperature of the water rising through the well will decrease over time (see
Figure 7a, dashed curve corresponds to 10 days after the start of the water flow in the well). This is due to the gradual cooling of the soil near the TM well. In this case, if we set the correct law for changing the initial temperature
T(0) of water entering the well, then we can also take into account the effect of changes in temperature jump width, which is also pronounced (see
Figure 5). Thus, the modified model in Equations (14)–(19) qualitatively describes Feature 3, as well as Features 1
and 2. Feature 4 remains unexplained using this model.
Furthermore, a study of the effects of thermal convection on the temperature field in the well was carried out. As is known from [
31,
32], the key criteria for the onset of thermal convection in wells and other vertical channels are the Grashof and Rayleigh numbers. The critical Rayleigh number at which convective instability begins in a laminar flow with vertical temperature gradient is about 100 [
32]. In our case, the Rayleigh number is given by
where
m/s is the acceleration due to gravity,
°C
−1 is the averaged thermal expansion coefficient of water in the temperature range 4–8 °C,
°C/m is the characteristic temperature gradient in the well, d = 0.0146 m is the diameter of the well,
m
2/s is the kinematic viscosity of the water, and
m
2/s is the thermal diffusivity of the water.
Given that the calculated Rayleigh number is well above the critical threshold, our quantitative assessment suggests the possibility of thermal convection in the well. Therefore, a theoretical analysis of the dynamics of the temperature field in TM4 was carried out in the presence of a temperature drop on the walls of TM4 and a source of cold water at the top of the well. We carried out a 3D numerical simulation of thermal convection in a small well section 25 m long near the surface with a diameter of 0.146 m (see
Figure 6a) with an unevenly heated wall. All calculations were performed using the Ansys Fluent 2021 R1 software. The SIMPLE method was used with second-order upwind schemes for balance equations. The flow was assumed to be unsteady and laminar. Thermal convection is taken into account by setting a piecewise linear function of density on temperature by the points (see
Table 3). The molecular viscosity (1.78 × 10
−5 Pa·s), specific heat capacity (4217 J/(m·°C)), and heat conductivity (0.569 W/(m·°C)) of water were set as constant values.
The system of equations for the transfer of mass, momentum, and energy in a laminar water flow is as follows [
33]:
where
is the water velocity vector (m/s),
is the pressure (Pa),
E is the specific energy of water (J/kg), and
is the shear stress tensor (Pa) calculated by the following formula:
where
is molecular viscosity (Pa·s).
The system of Equations (21)–(24) is supplemented with the following boundary conditions on the walls and initial conditions:
where
z is vertical coordinate (depth) (m), and
is the wall boundary.
It was assumed that the wall temperature along the depth of the 25 m section of the well is distributed according to a parabolic law. The parabolic function in Equation (25) is the approximation of measured temperature distribution in TM4 in the depth interval 0–25 m.
A tetrahedral mesh with 370,569 cells was used for simulations. The minimum size of a cell was 1.8 cm. A prismatic boundary layer of seven sublayers was set on the wall. In the considered case of a laminar flow, this was sufficient to ensure the convergence of the solution and the independence of the solution from the mesh size.
Figure 7b shows the calculated temperature distributions along the depth of the TM well.
Figure 7b indicates that there are visible changes in the initial linear temperature distribution in the upper part of the well over time. Temperature oscillations are associated with small convective movements of water caused by a positive temperature gradient (
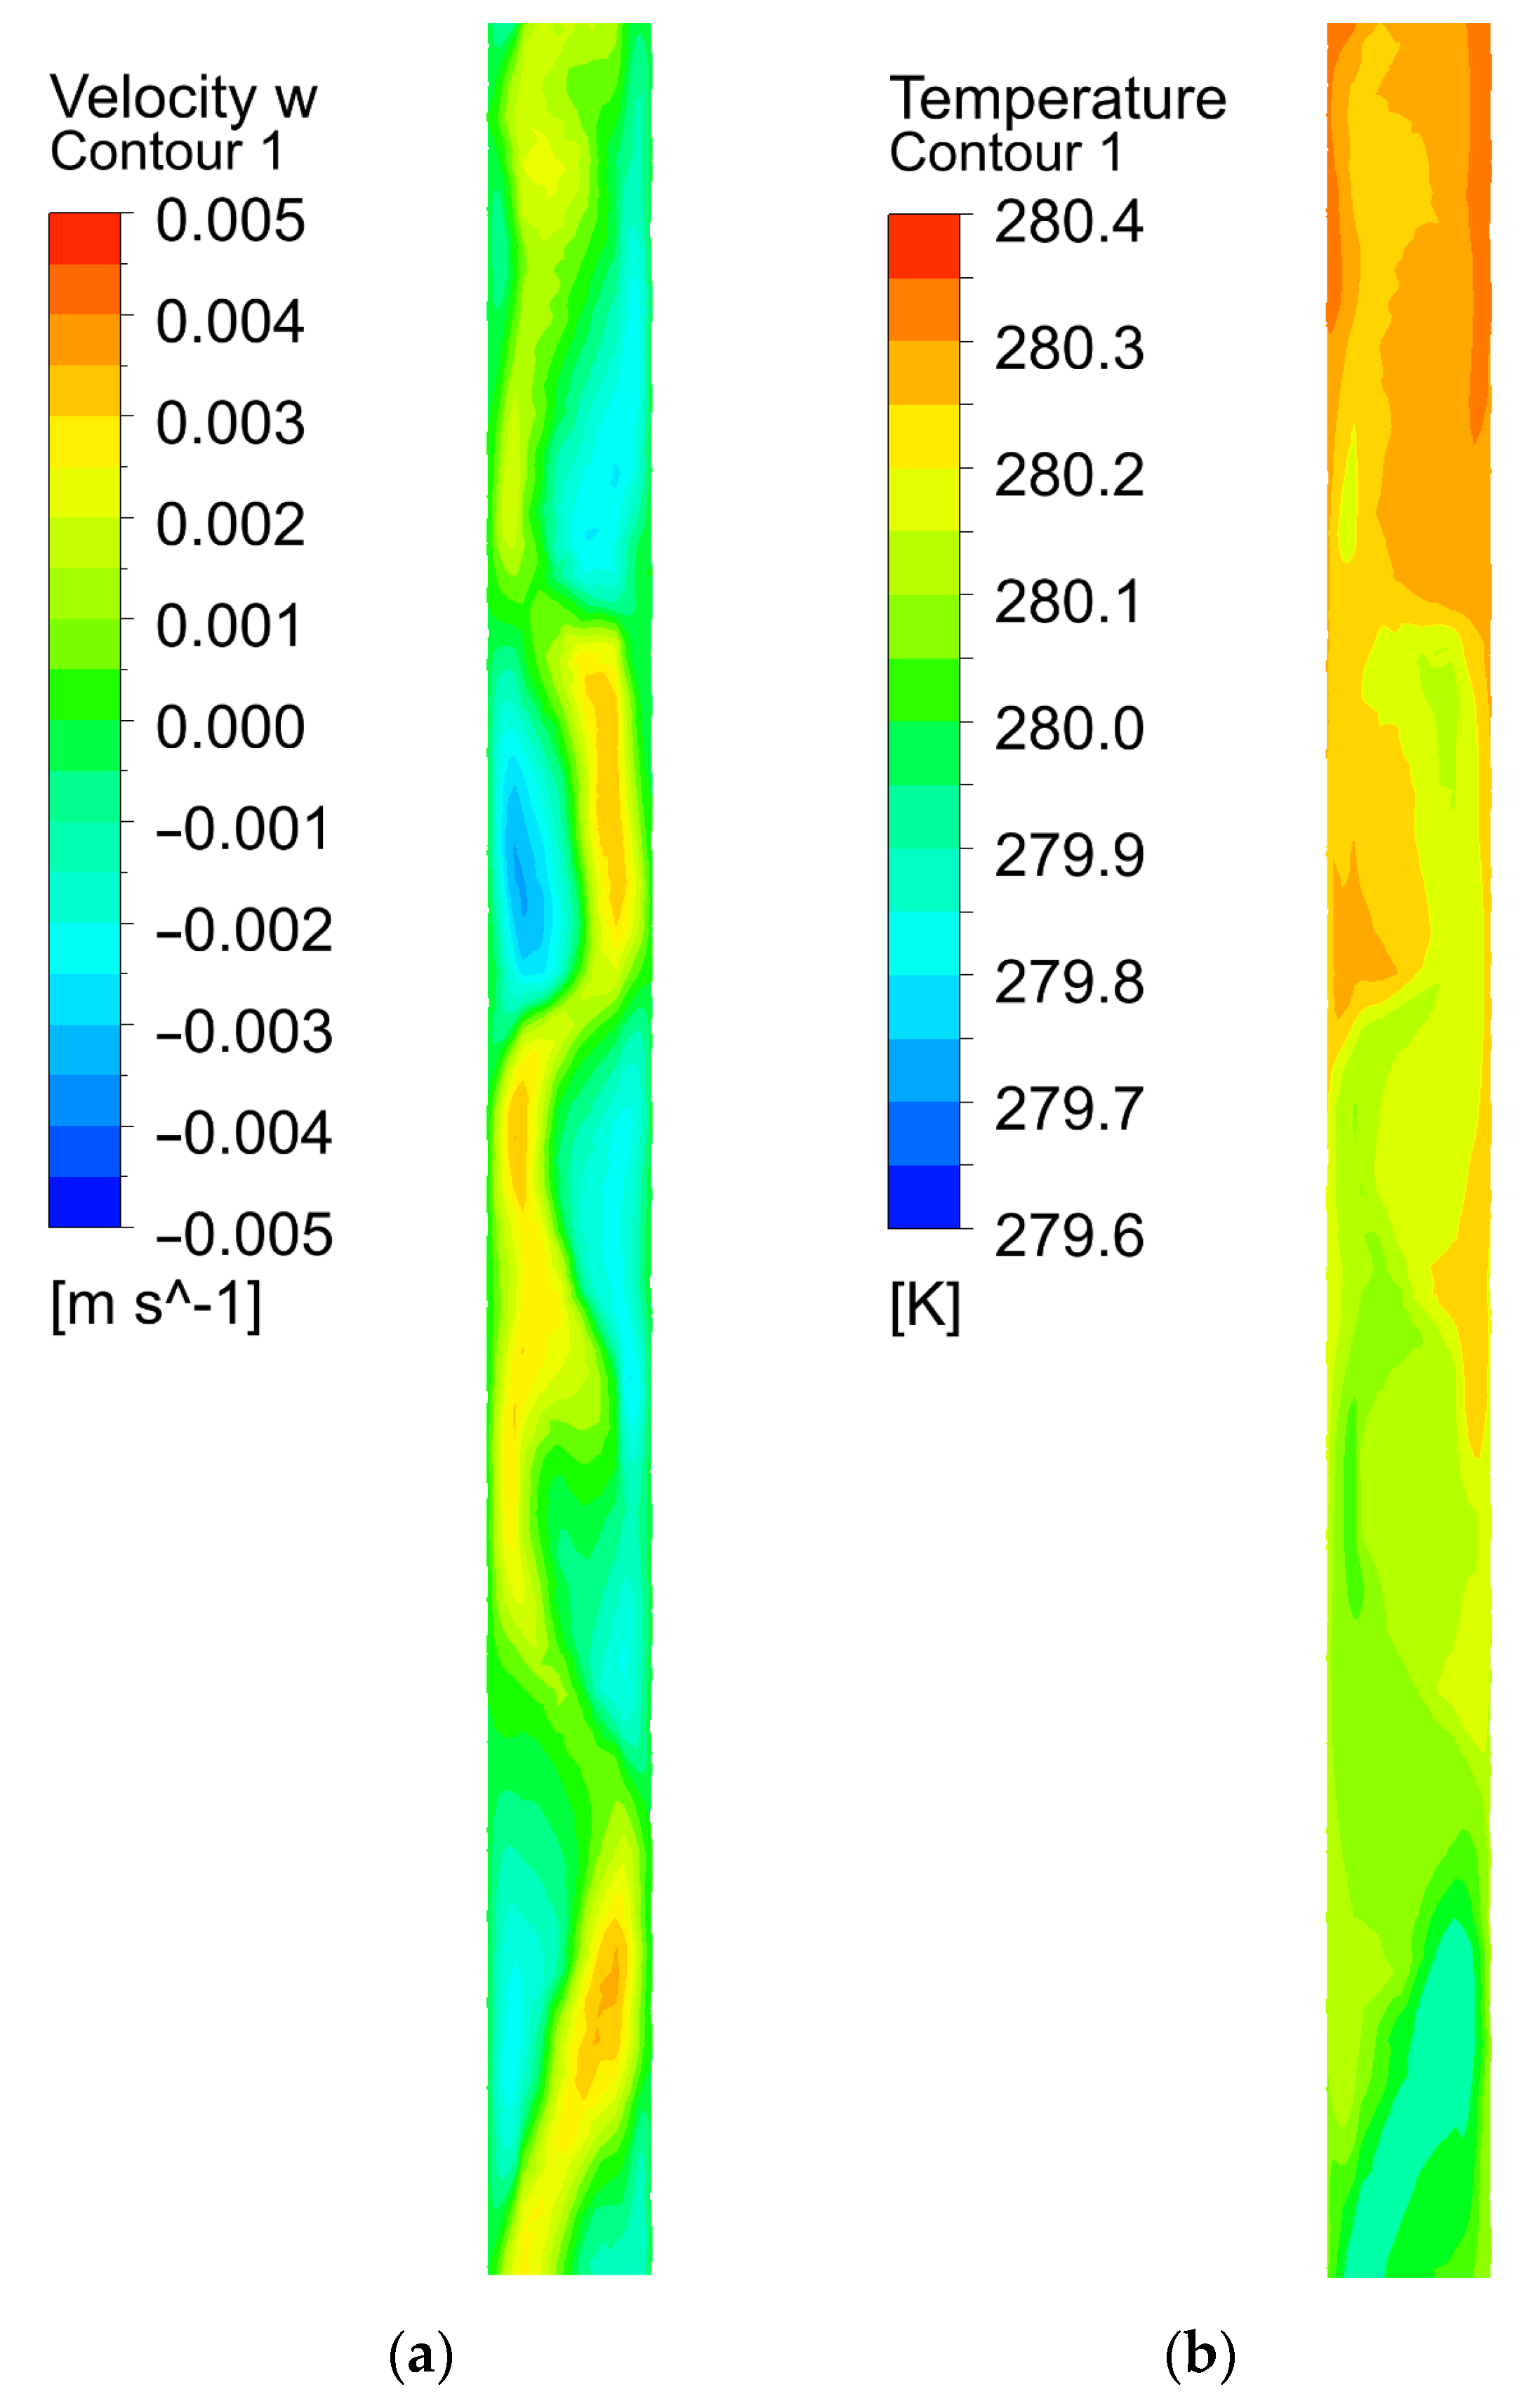
dT/dz > 0). In this case, the convective cells are formed in the well (see
Figure 8a), and the instantaneous temperature distributions at fixed times are rather strongly distorted (see
Figure 8b). However, these oscillations do not lead to a significant rearrangement of the time-averaged temperature distribution with depth which was observed by the DTS system. Therefore, thermal convection accompanied by water inflow from the surface is unable to explain all features of the observed temperature distributions in TM4. For this reason, the hypothesis of forced convection of water in the well is accepted as the main explanation of the TM4 temperature distribution over time.
6. Conclusions
A practical problem of interpreting the temperature field in frozen soils during the construction of a mine shaft was described. Interpretation of temperature field was carried out according to the measured temperatures in the TM wells. In the course of solving the problem, we encountered anomalous temperature distributions in the wells. Detected anomalies were not related to measurement error and could not be eliminated by adjusting the parameters of the heat transfer model. In such a situation, the model could not guarantee correct prediction of the FW parameters. For this reason, we analyzed the features of temperature changes in abnormal areas of TM wells and proposed hypotheses related to the causes of temperature anomalies. It was very important to choose the correct hypothesis about the causes of temperature anomalies in order to further make the necessary complication of the model and continue to use the model to predict the FW parameters.
The first anomaly consisted of an asymmetric temperature distribution for one of the horizontal soil layers according to the data of experimental measurements; the temperature had a local minimum at depth z ≈ 135 m for TM1, TM2, and TM4 wells, while, for the TM3 well, a local maximum was observed at this depth. To explain this anomaly, it was proposed to complicate the initial model of heat transfer in artificially frozen soils by means of considering the unidirectional horizontal flow of groundwater. This made it possible to achieve a match between the experimental measurements and numerical simulation. Subsequently, the possibility of groundwater flow in this layer was also confirmed by the geological service after additional studies.
The second anomaly was that, at a certain moment in time, the temperature distribution in the TM4 well in the depth interval 0–160 m began to change rapidly. This effect could not be explained by the model used for calculations. Theoretical analysis of temperature distributions along the depth of TM wells allowed us to identify the main features of the anomaly. Accordingly, two possible scenarios for the appearance of the anomaly were proposed: (1) the flow of cold water from the pore space of upper soil levels into the well filter, and (2) the natural convection of water in the well due to thermal gradient. To test these hypotheses, a numerical simulation of heat and mass transfer in a TM well was carried out, taking into account heat exchange between the water in the well and the surrounding soil. The simulation results showed that the scenario of cold water inflow into the well from the upper layers better explains this temperature anomaly.
This article will be useful for specialists involved in the simulation of AGF and experimental monitoring of soil freezing. The described methods can be used to analyze the data from experimental measurements and simulations at other objects.

