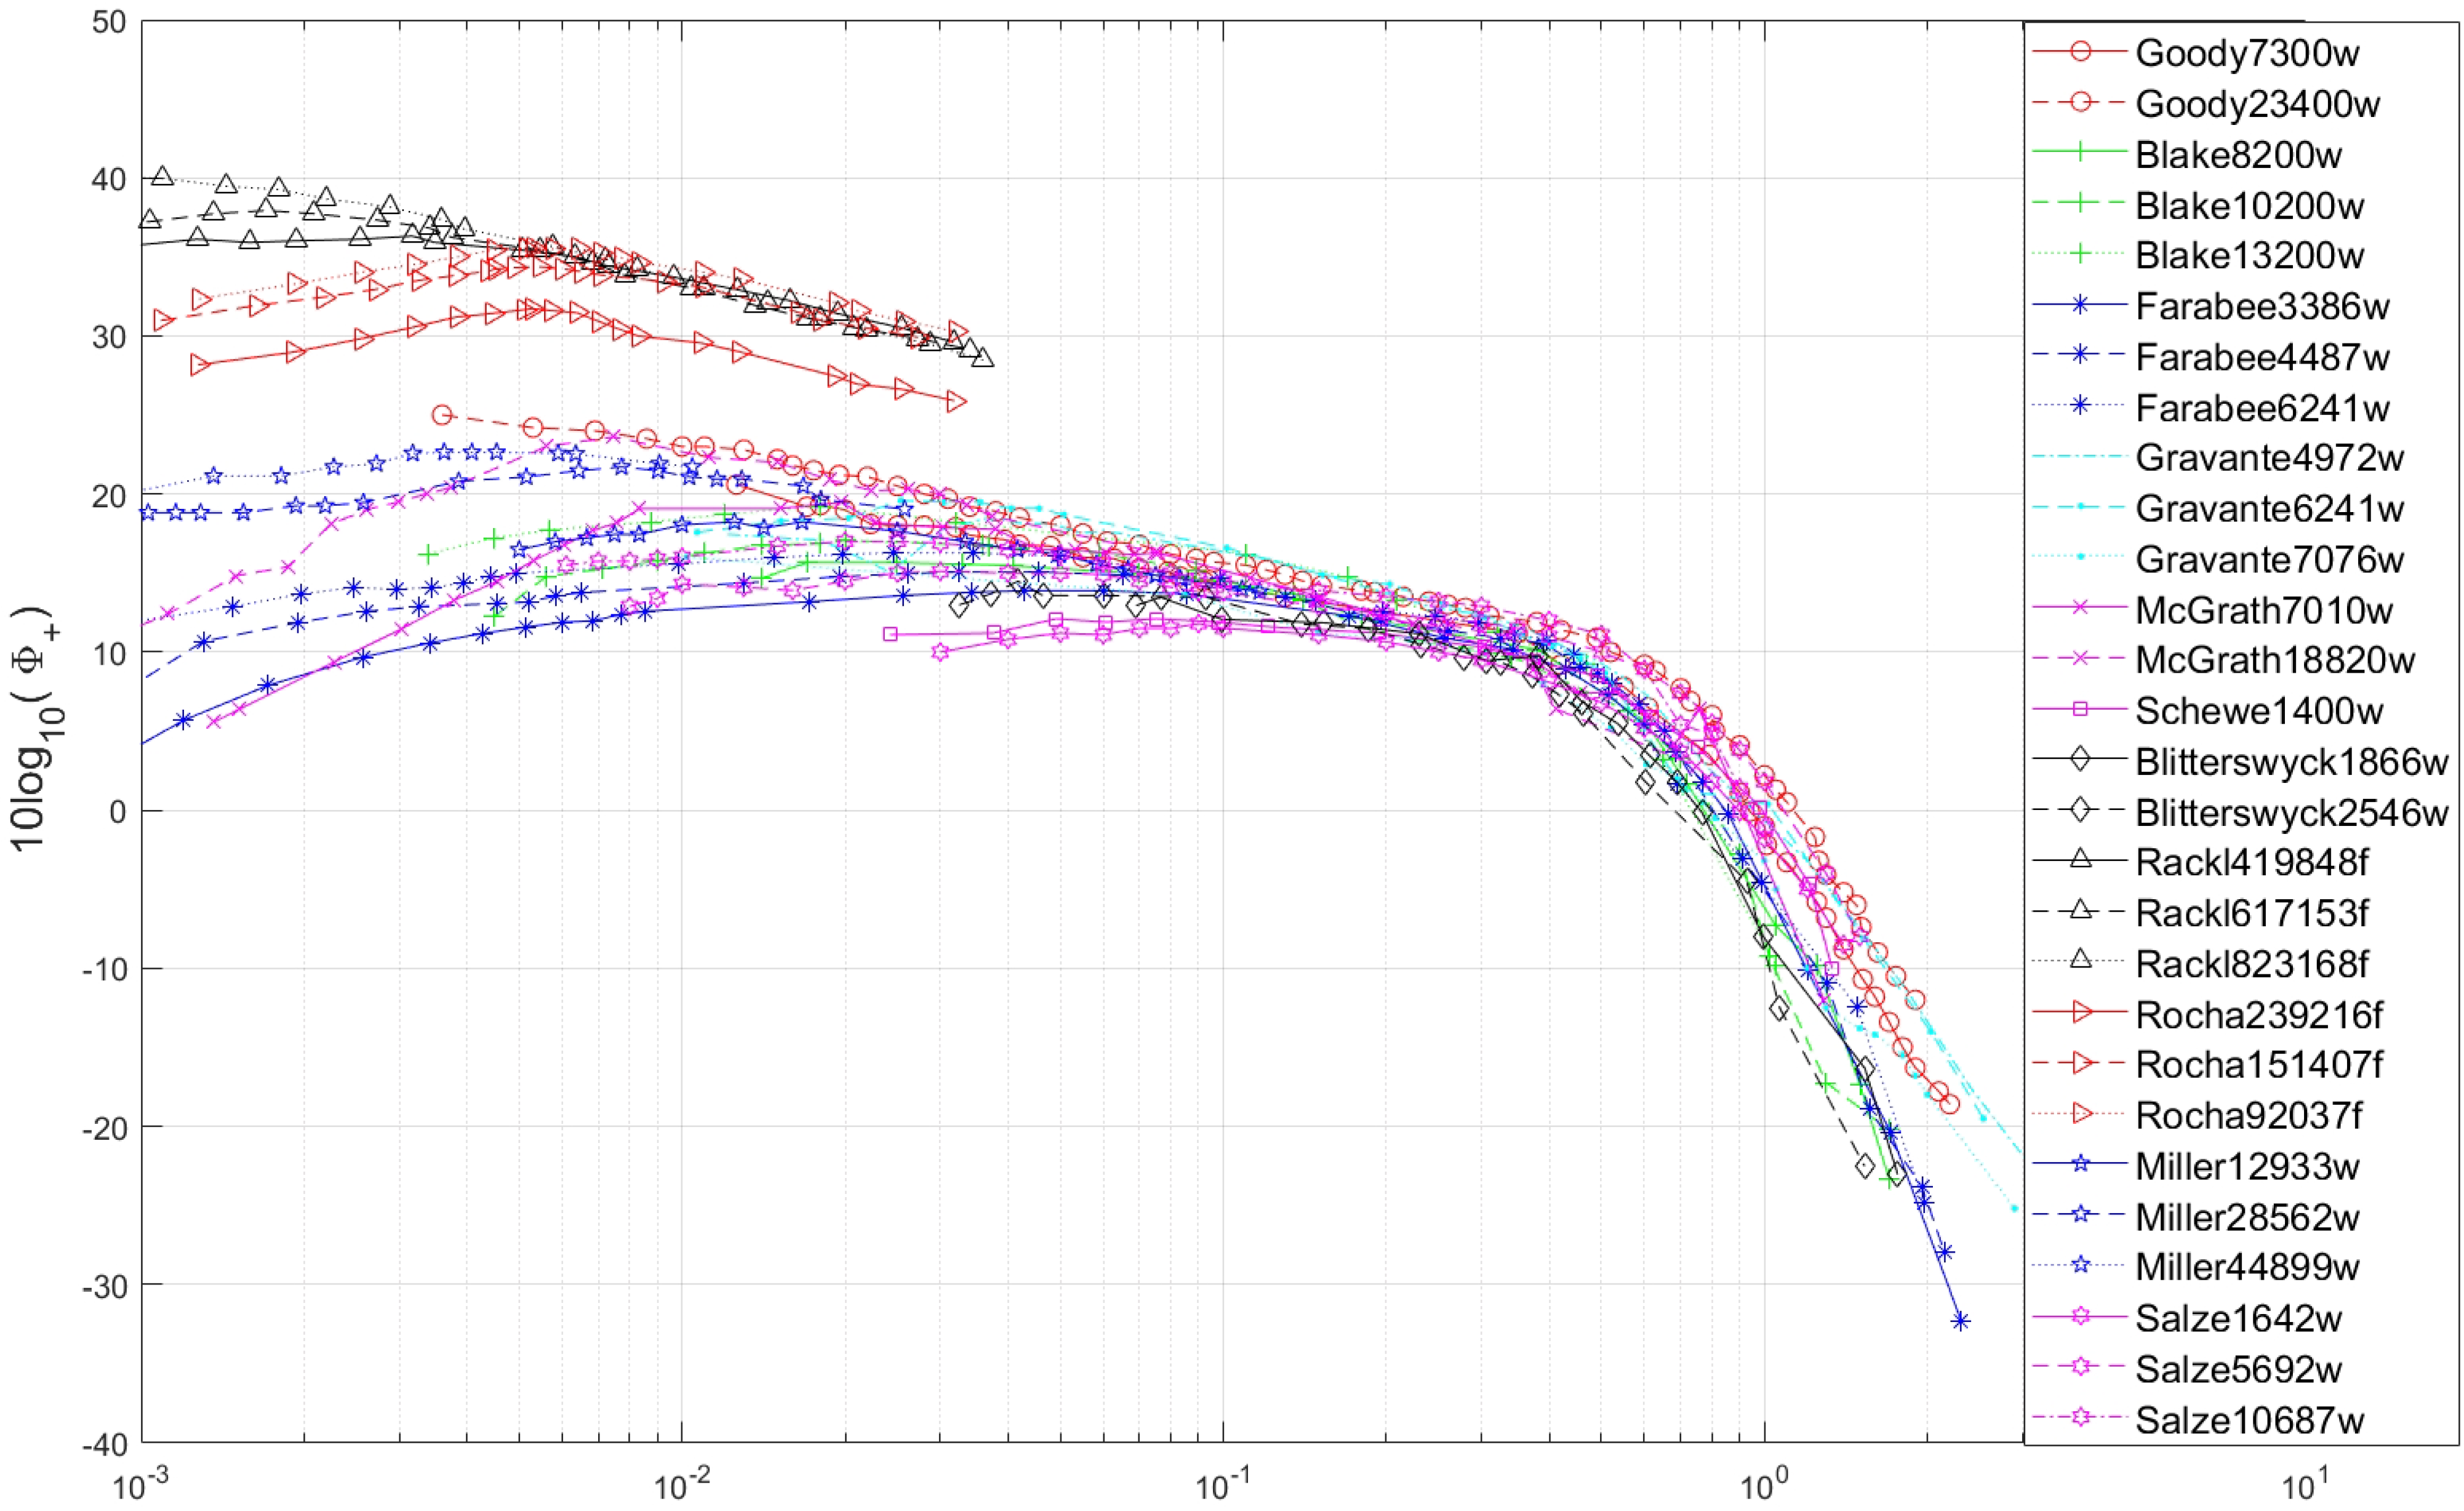
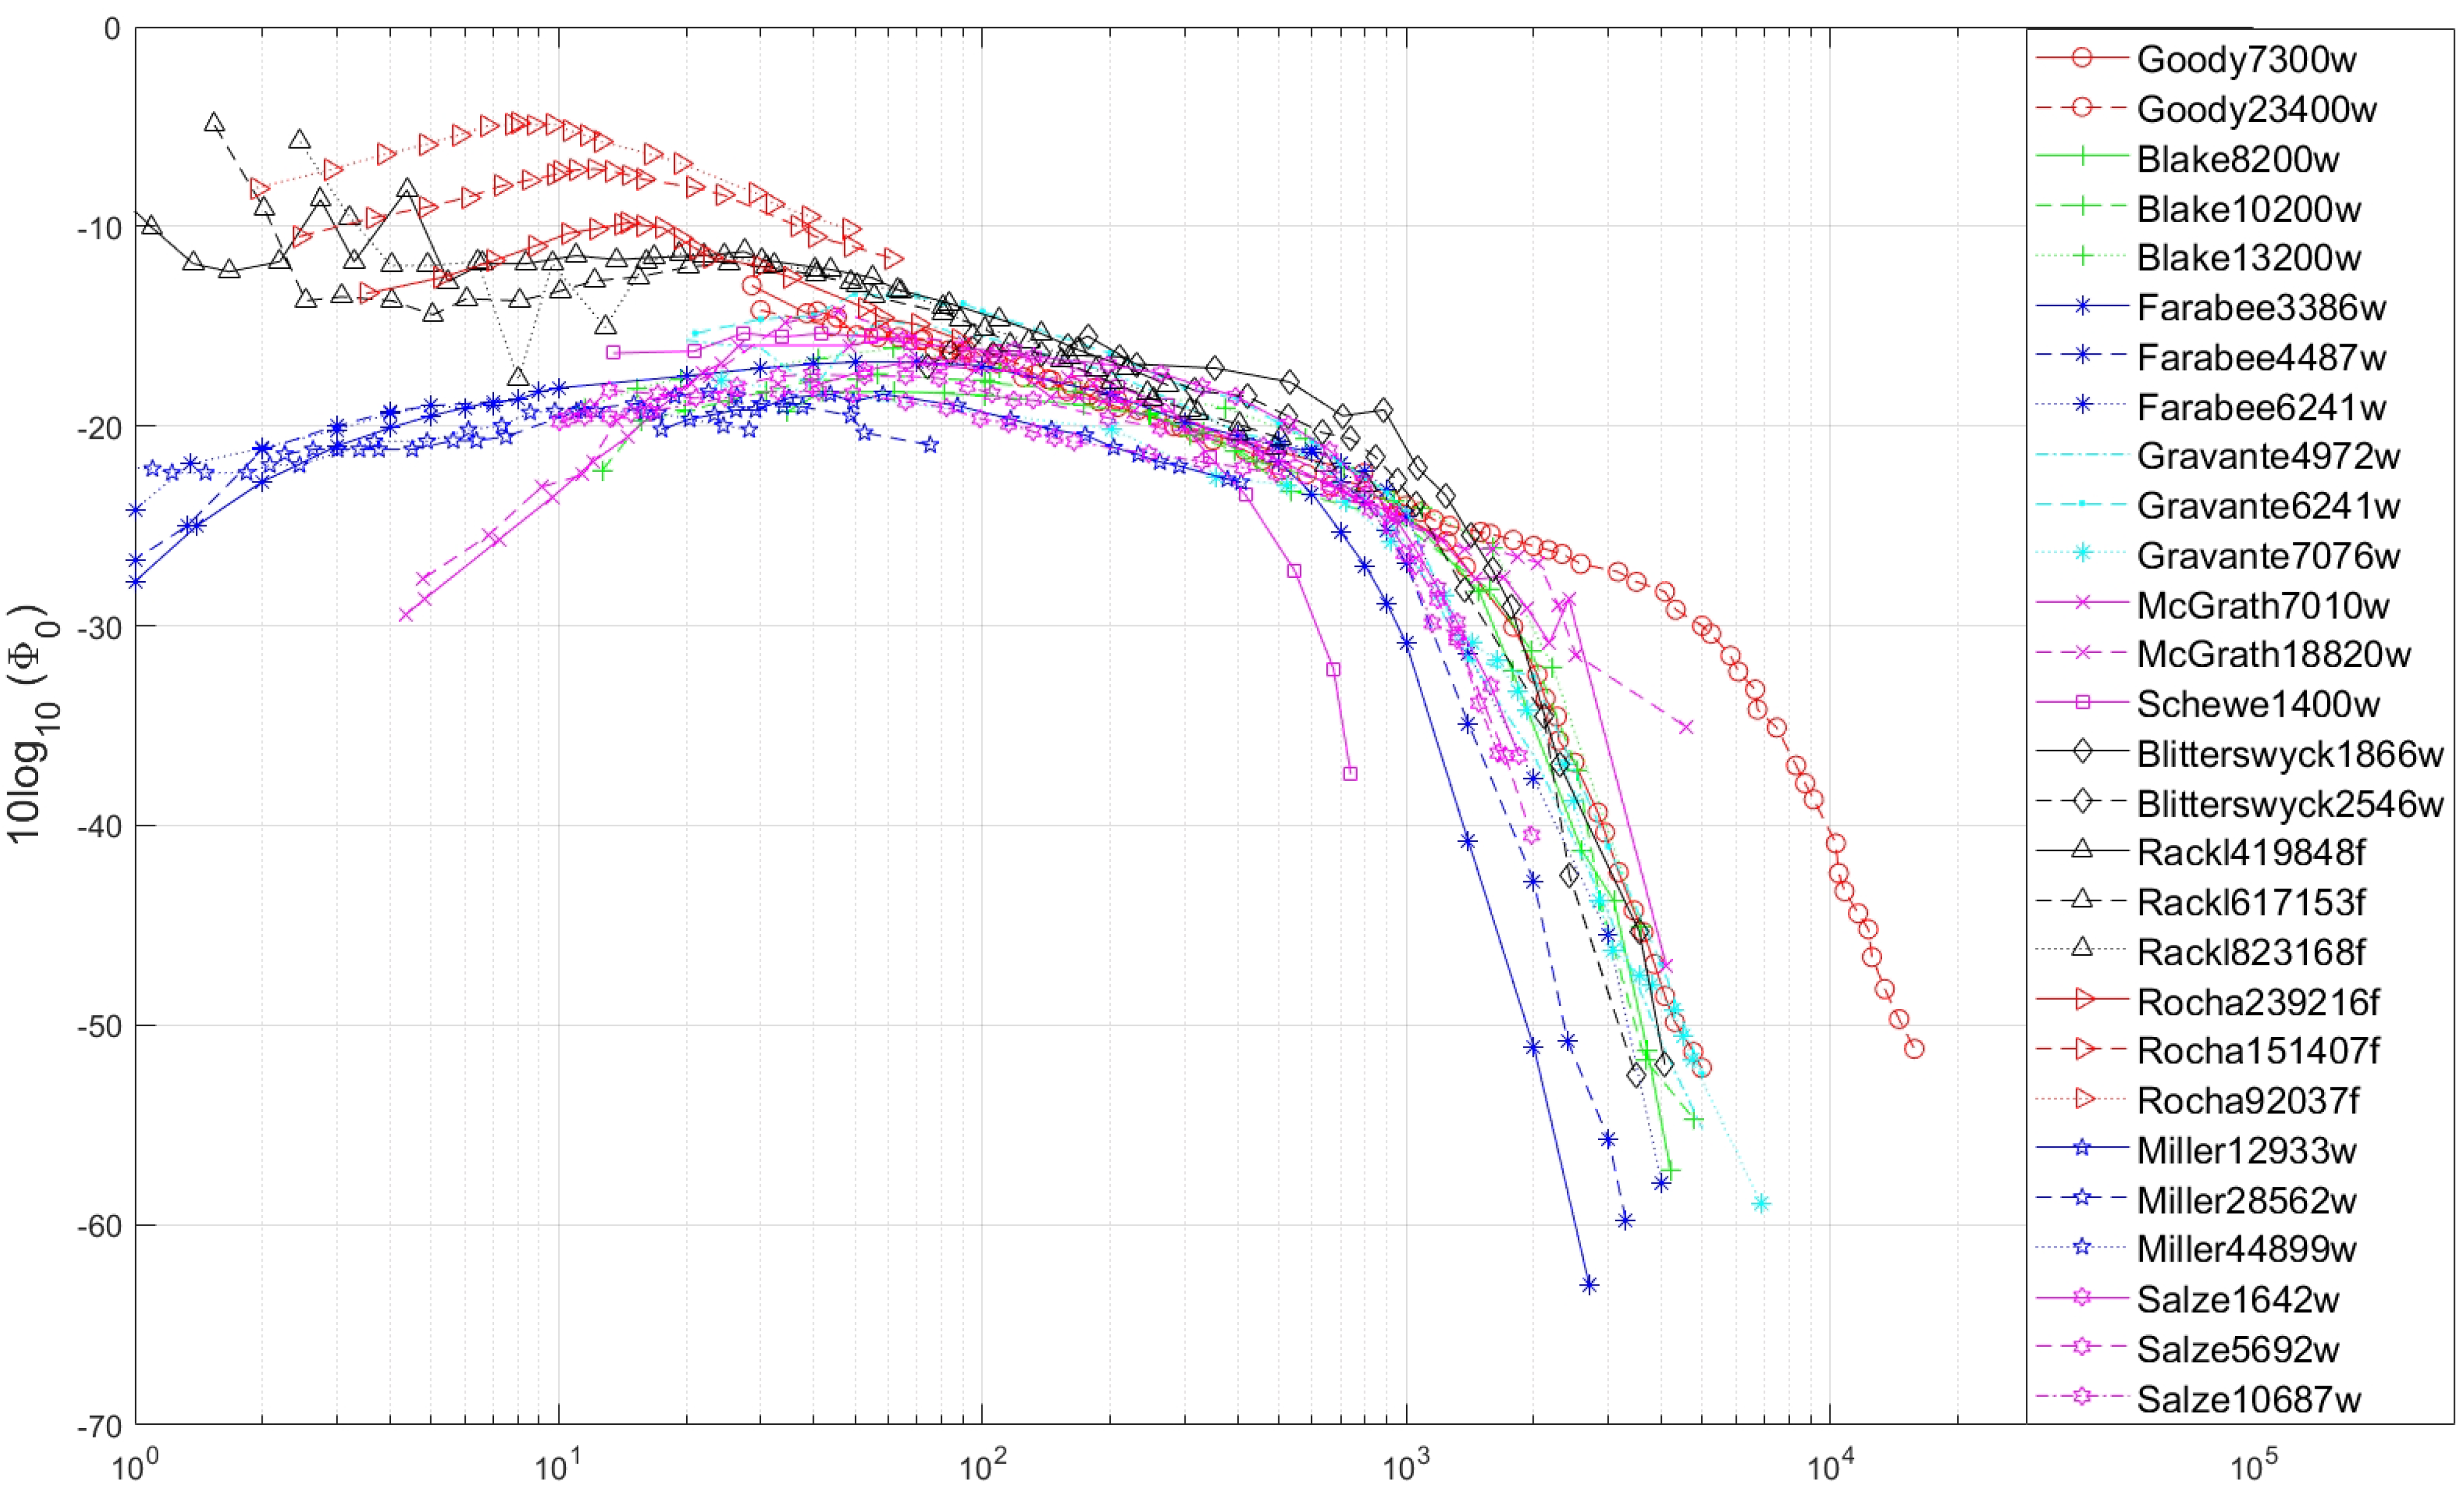
1. Introduction
Pressure fluctuations caused by the turbulent boundary layer (TBL) in fluid flows are a source of noise and vibration. These surface pressure fluctuations may cause problems such as structure fatigue and the generation of acoustic noise radiation [
1]. Controlling TBL pressure fluctuations and limiting radiated noise can reduce excess noise within the cabin of aircraft, acoustic interference in communication, the malfunction of sensitive equipment, and adverse health effects [
2,
3].
There have been many studies over the years on determining and describing the sound generated in the TBL to better understand, predict, and possibly control it. Bull provides a good summary of the different studies on the subject [
1]. In 1962, Willmarth and Wooldridge were the first to comprehensively measure the pressure fluctuations in the turbulent boundary layer of a wind tunnel by placing pressure transducers flush with the flow through the test section [
4]. They were also the first to notice that the power spectral density (PSD) of the wall pressure fluctuations was found to scale with certain flow parameters such as the free stream velocity and the boundary-layer displacement thickness. They found that the energy density of the wall pressure fluctuations was highest at low frequencies and that it decayed with higher frequencies. They also showed that a small increase in surface roughness causes a profound effect on the fluctuating wall pressure in the immediate vicinity. Farabee and Casarella later showed that the PSD is separated into four regions; a low frequency, medium frequency, overlap, and high-frequency range, as confirmed by Bull [
5]. The low frequency range is defined as
, the medium frequency as
, the high region as
, and the overlap region is defined as the region between the medium frequency region and the high frequency region. The distinct frequency regions are often used to describe the PSD since they have distinct power-law features, and the approximate slope of the pressure spectrum in these regions is the common method for comparing experimental data. The slope measured for each region from different studies was tabulated by Blitterswyk [
6].
Since Bull, there have been several new wind tunnel studies performed on wall pressure fluctuations, such as by Goody and Simpson [
7], Blitterswyck and Rocha [
8], Miller [
9] and Salze et al. [
10], as well as flight test experiments from the National Aeronautics and Space Administration (NASA), using a Tuplov 144 [
11] and a Gulfstream G550 [
12], which include PSD data. The flight test data were obtained in both experiments by mounting an array of microphones flush with the fuselage of the aircraft, and then measuring the surface pressure fluctuations at different altitudes and velocities.
TBL PSD models are used by researchers to compare with individual experiments, generally, one at a time, to verify whether the obtained experimental data are in good agreement with experimental work previously done, as found in the literature. The present work compares how several TBL PSD wall pressure fluctuation models predict some of these experiments and investigates which model is the most reliable in its predictions of the PSD, as well as when certain models are preferable. Another key contribution of the current study is the comparison between models designed from wind tunnel experiments and models designed from flight tests. The models compared in this study are Efimtsov [
13,
14,
15], Rackl and Weston [
11,
15], Lowson [
16], Robertson [
17], Lagnelli [
18], Goody [
19] and Smol’yakov [
20].
Studies by Hwang et al. [
21] and Blittersyck and Rocha [
6,
8] have compared existing semi-empirical models used to describe the acoustic response. Blittersyck and Rocha found that models by Efmitsov, and Rackl and Weston best predicted the low to medium frequency; while models by Goody and Smol’yakov best predicted the overlap and high-frequency ranges. The work by Hwang et al. concluded that Goody provided the best overall prediction of the pressure spectra for flows in air and water [
21].
3. Results and Discussion
The comparison between models and the different experiments was done by determining the mean squared error (MSE) between the PSD of the wall pressure fluctuations predicted by the semi-empirical single point models and the PSD of wall pressure fluctuations measured in each of the experiments. The MSE is then defined for this application as follows:
in which
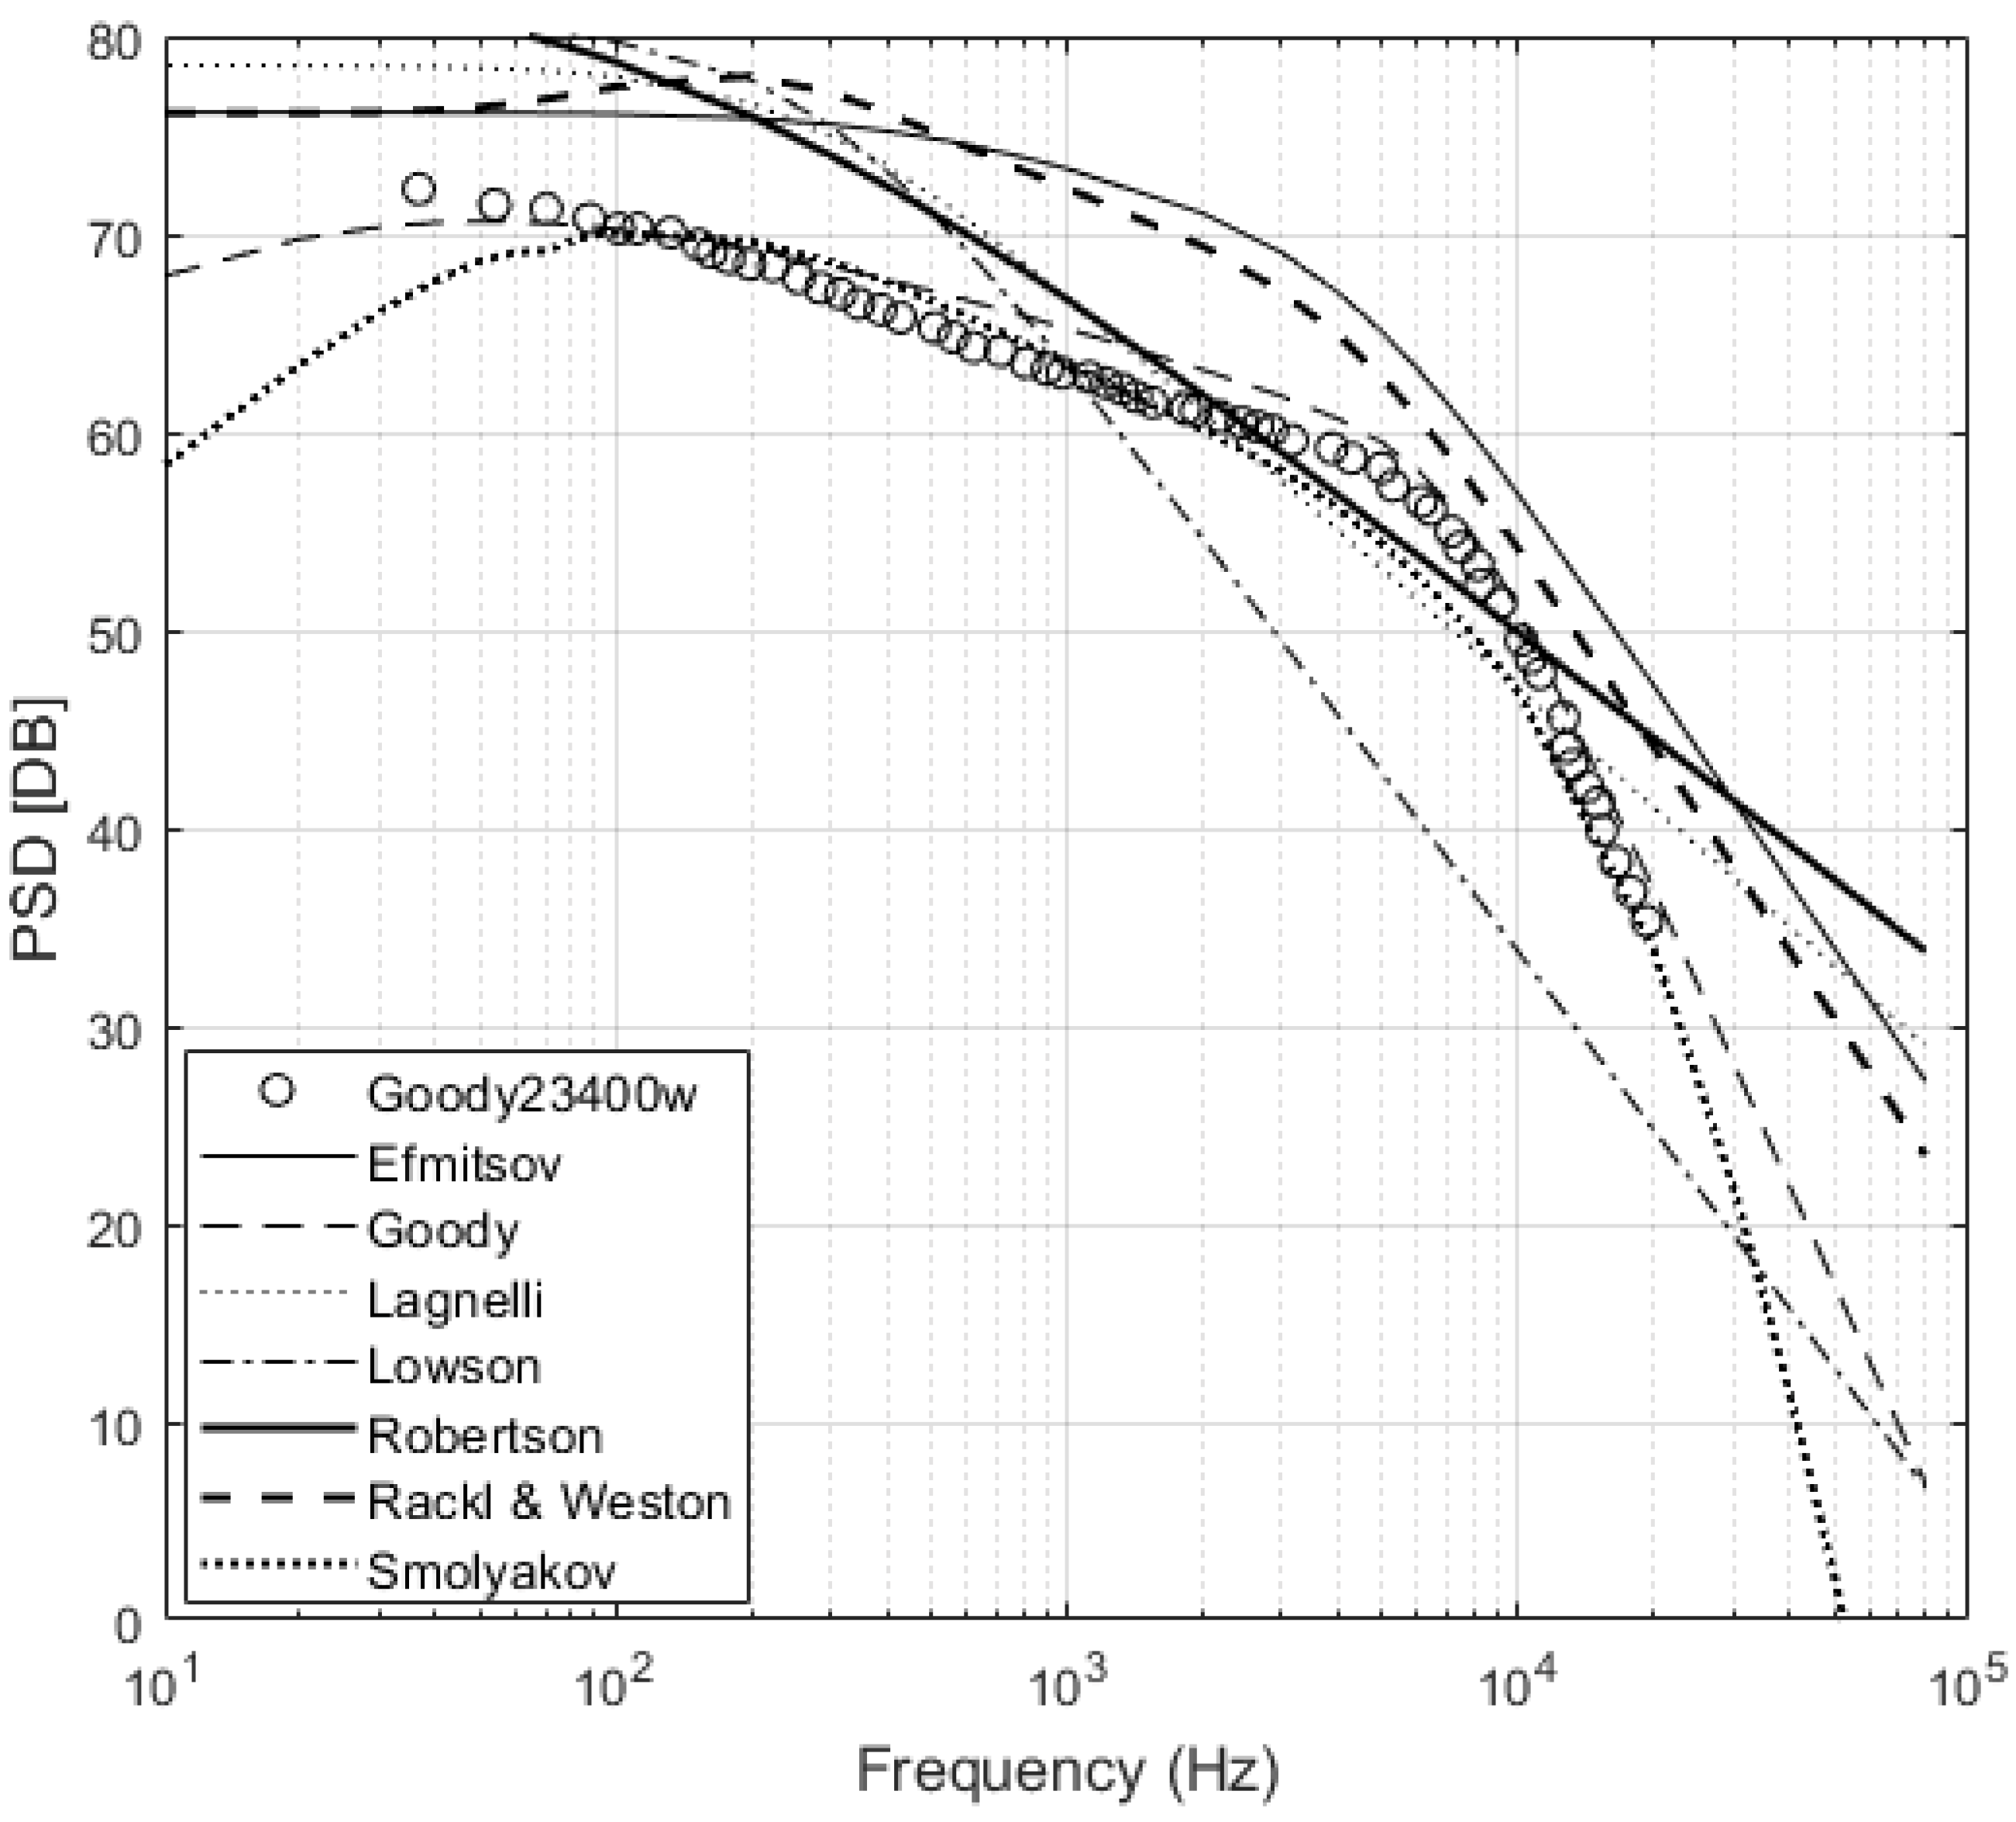
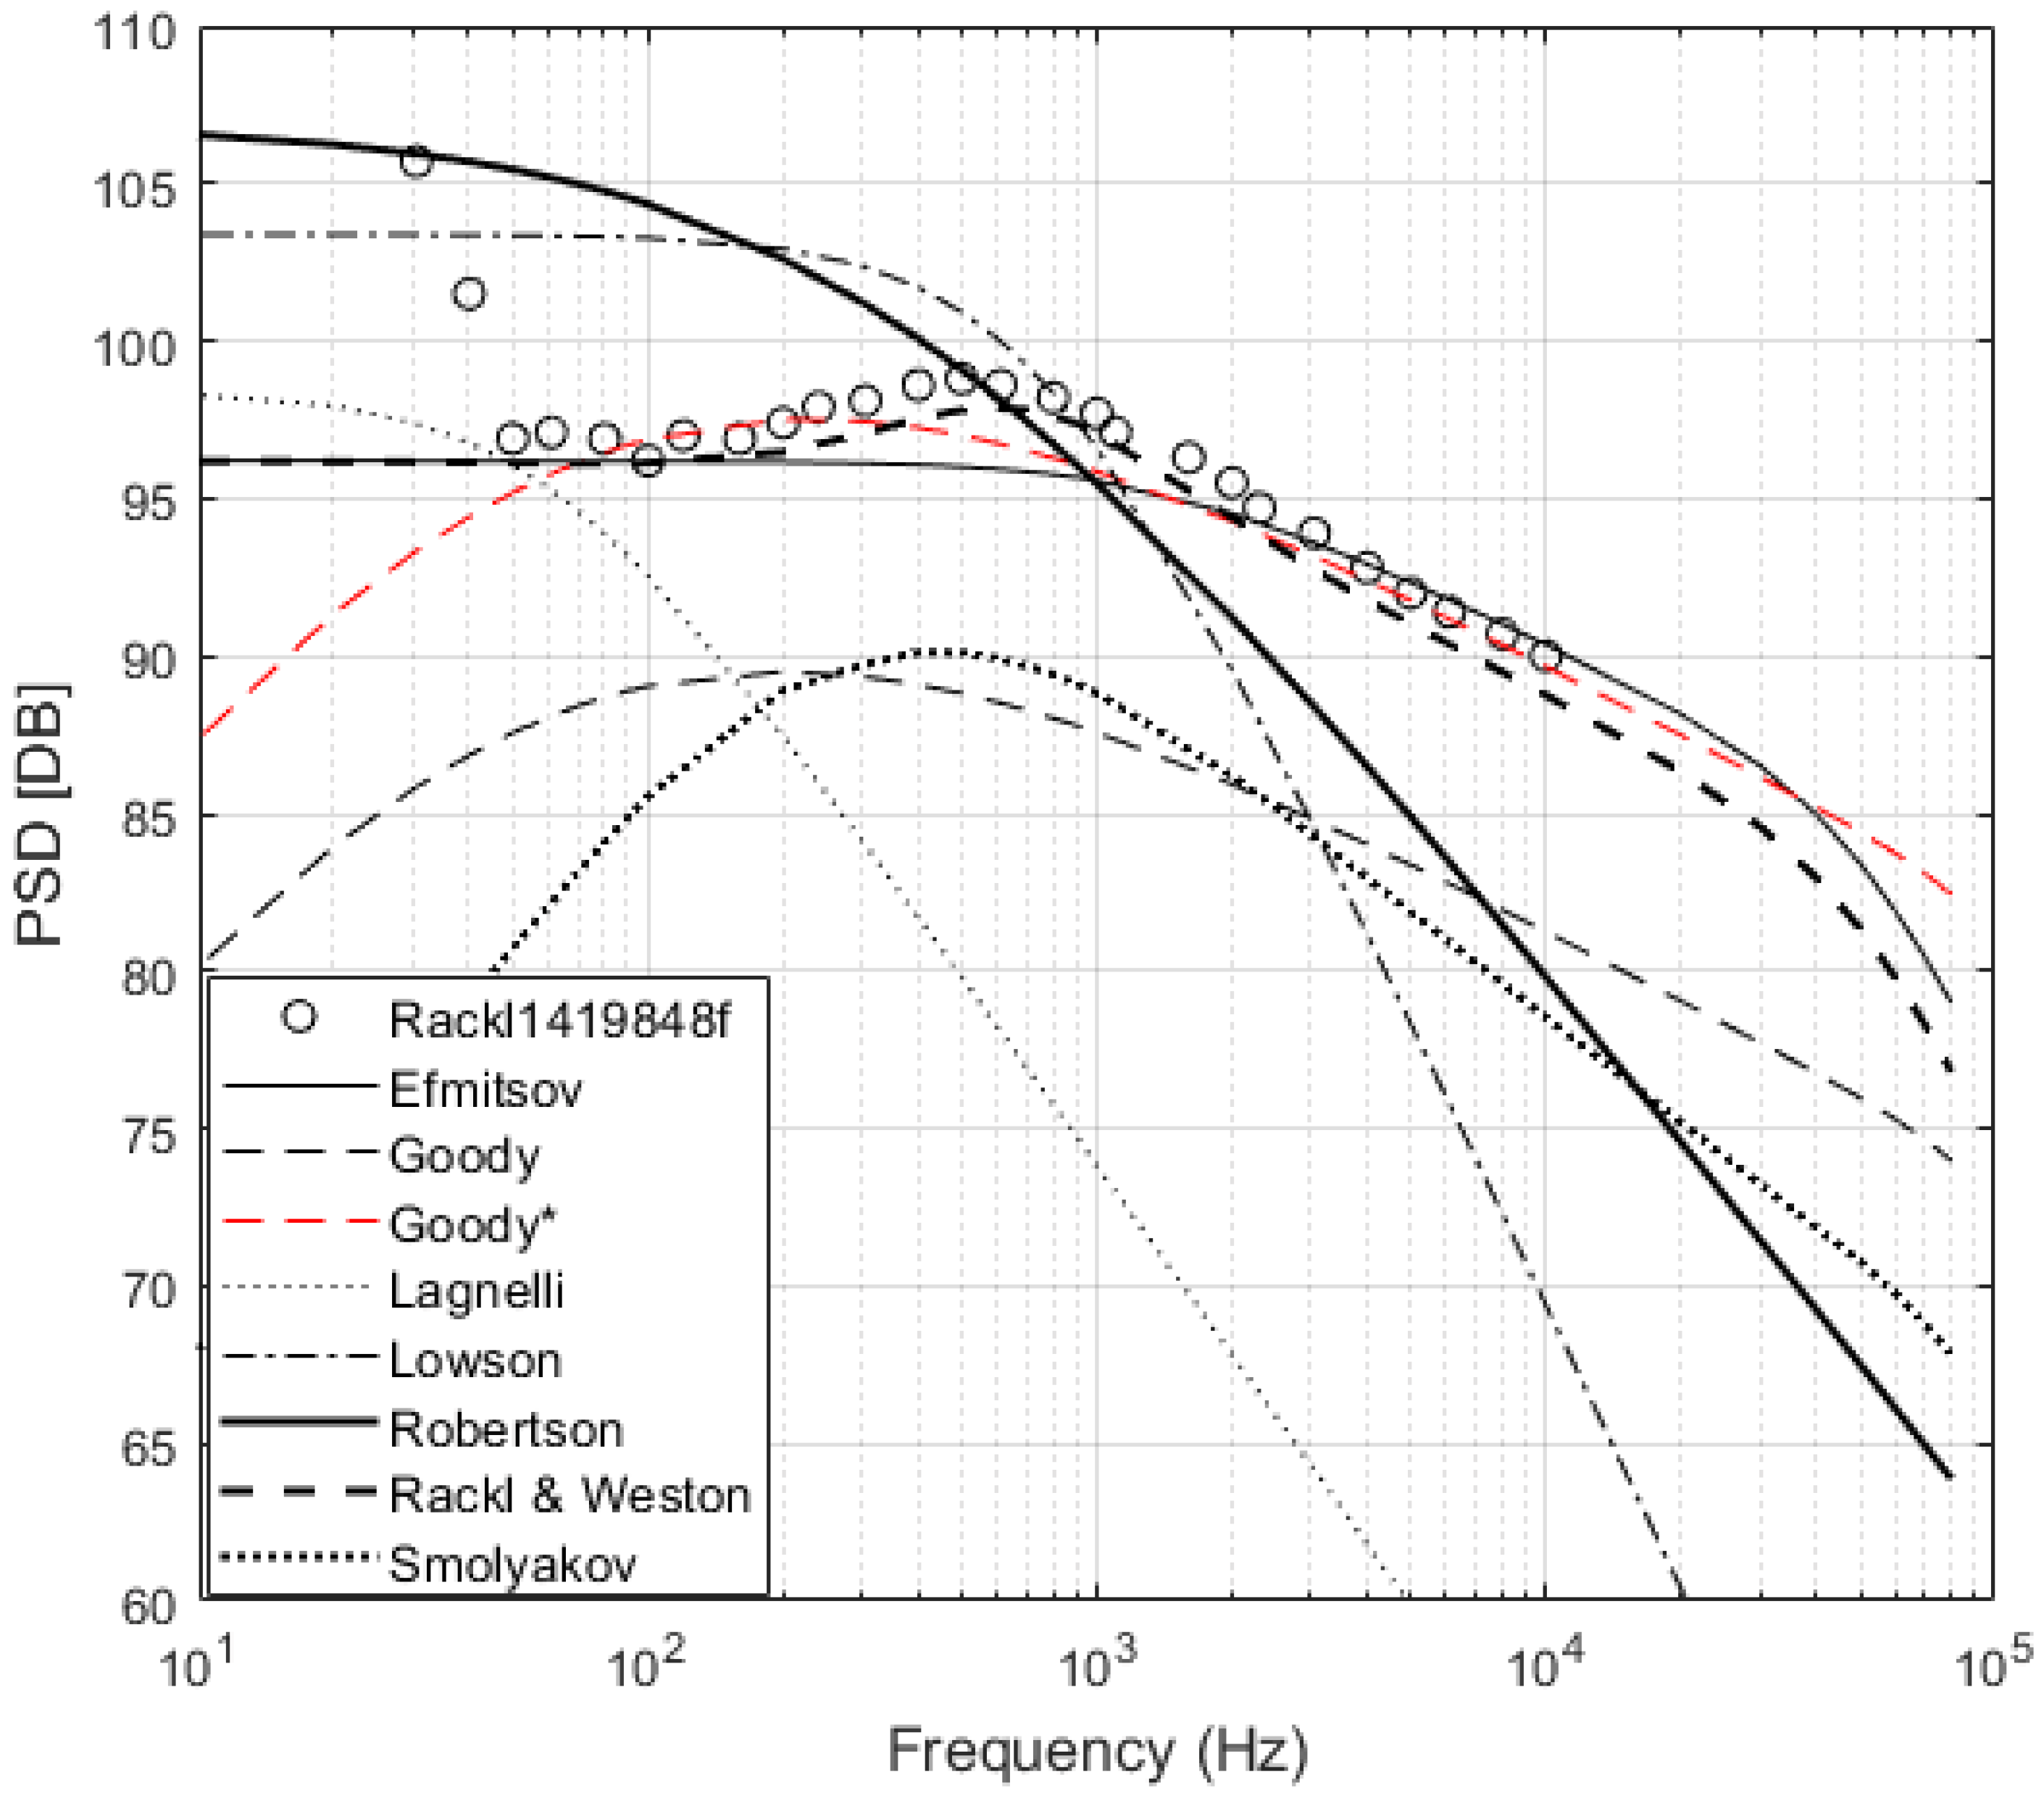
n is the PSD sampled at a specific frequency, and N is the total number of samples taken. In previous studies found in the literature, the evaluation of models and experiments are made either by visual inspection or by comparing the slope of the PSD for the low, medium, overlap and high-frequency ranges. Comparing the models based solely on the slope of PSD at different frequencies fails to account for a difference in magnitude. Ideally, both the shape and magnitude of the PSD should be compared when evaluating a model so that accurate estimations of the sound produced can be determined. The PSD for Goody23400w and Rackl419848f can be seen in
Figure 3 and
Figure 4, respectively, along with the semi-empirical model predictions for the same flow conditions. From visual inspection of
Figure 3, it is not apparent which model best describes Goody23400w. However, it can be seen by looking at the MSE that the Goody model has the lowest MSE with 1.3 closely followed by the Smol’yakov model with 8.9, while the Efimtsov and Rackl and Weston models perform poorly. For the Rackl1419848f, the Rackl and Weston model has the lowest MSE, followed by the Efimtsov model, while the Goody and Smol’yakov models perform poorly, as seen in
Figure 4.
The MSE of the PSD between each model and experiment is shown in
Appendix B in
Table A2. The MSE of the PSD at different frequency ranges is also included in
Appendix A to show how the models performed in certain ranges.
Table A3 is the MSE for the low-frequency range,
Table A4 is the medium frequency range,
Table A5 is the overlap range, and
Table A6 is the high-frequency range.
Except for Goody, the PSD compared in this report does not provide an accurate prediction of the low-frequency range. The low-frequency range is a difficult range for experiments to capture due to noise from the fan and structural vibration leading to a contamination of the data. An increase seen in the pressure spectrum below 10 Hz can also be the result of pressure fluctuations from the irrotational motion of the flow above the boundary layer [
24]. Farabee and Casarella had a significant amount of experimental data in the low-frequency range and were used in the creation of the Goody model [
19].
The mid-frequency range and the overlap frequency range are well predicted and have a low MSE between the models and the experiments. This can be attributed to this being the range where the majority of data points were taken during experiments and therefore used in the creation of the models.
The high-frequency range is a function of the inner variables of the boundary layer and should be scaled based on the viscosity as the inner region is dominated by viscous forces. The difficulty in this region is that frequency attenuation is problematic for obtaining reliable data. Focusing on Gravante, Schewe, Blitterswyck and Salze1642w as the studies with the smallest
, the MSE is much smaller when compared to each model, and the Goody and Smol’yakov models have the lowest MSE. This is expected as Schewe demonstrated how a larger
causes a steeper roll-off of the high-frequency response [
22].
The results show that the models proposed by Efimtsov [
14] and Rackl and Weston [
15] both performed well when compared to the flight test PSD measurements, but poorly when compared to the PSD measured in wind tunnel experiments. Furthermore, when comparing against all the different data sets, the model proposed by Rackl and Weston consistently outperforms the model by Efimtsov, which indicates that the changes added to the Efimtsov model by Rackl and Weston better represent the PSD.
The models proposed by Goody [
19] and Smol’ yakov [
20] have the lowest MSE when predicting the PSD. However, when compared to the flight test data they did not perform as well. It is worth noting that when Goody and Smol’yakov proposed their respective models they postulated these would be effective even at high Reynolds numbers. This is confirmed from the comparison of their models to the experiments by Miller. Goody and Smol’yakov both predict the shape of the PSD from the flight tests well, with a decay of the overlap region being approximately
, meaning that an adjustment only needs to be made to the magnitude.
The initial functional form of the Goody model is [
19]:
with parameters
,
, and/or
varying with the Reynolds number.
and
determine the slope of the low and high frequency ranges, respectively, and also determine the size of the overlap region.
acts as a multiplicative constant that increases the spectral levels at all frequencies so that the model better agrees with experimental data. Goody used the values
,
and
to agree with a selection of wind tunnel experiments.
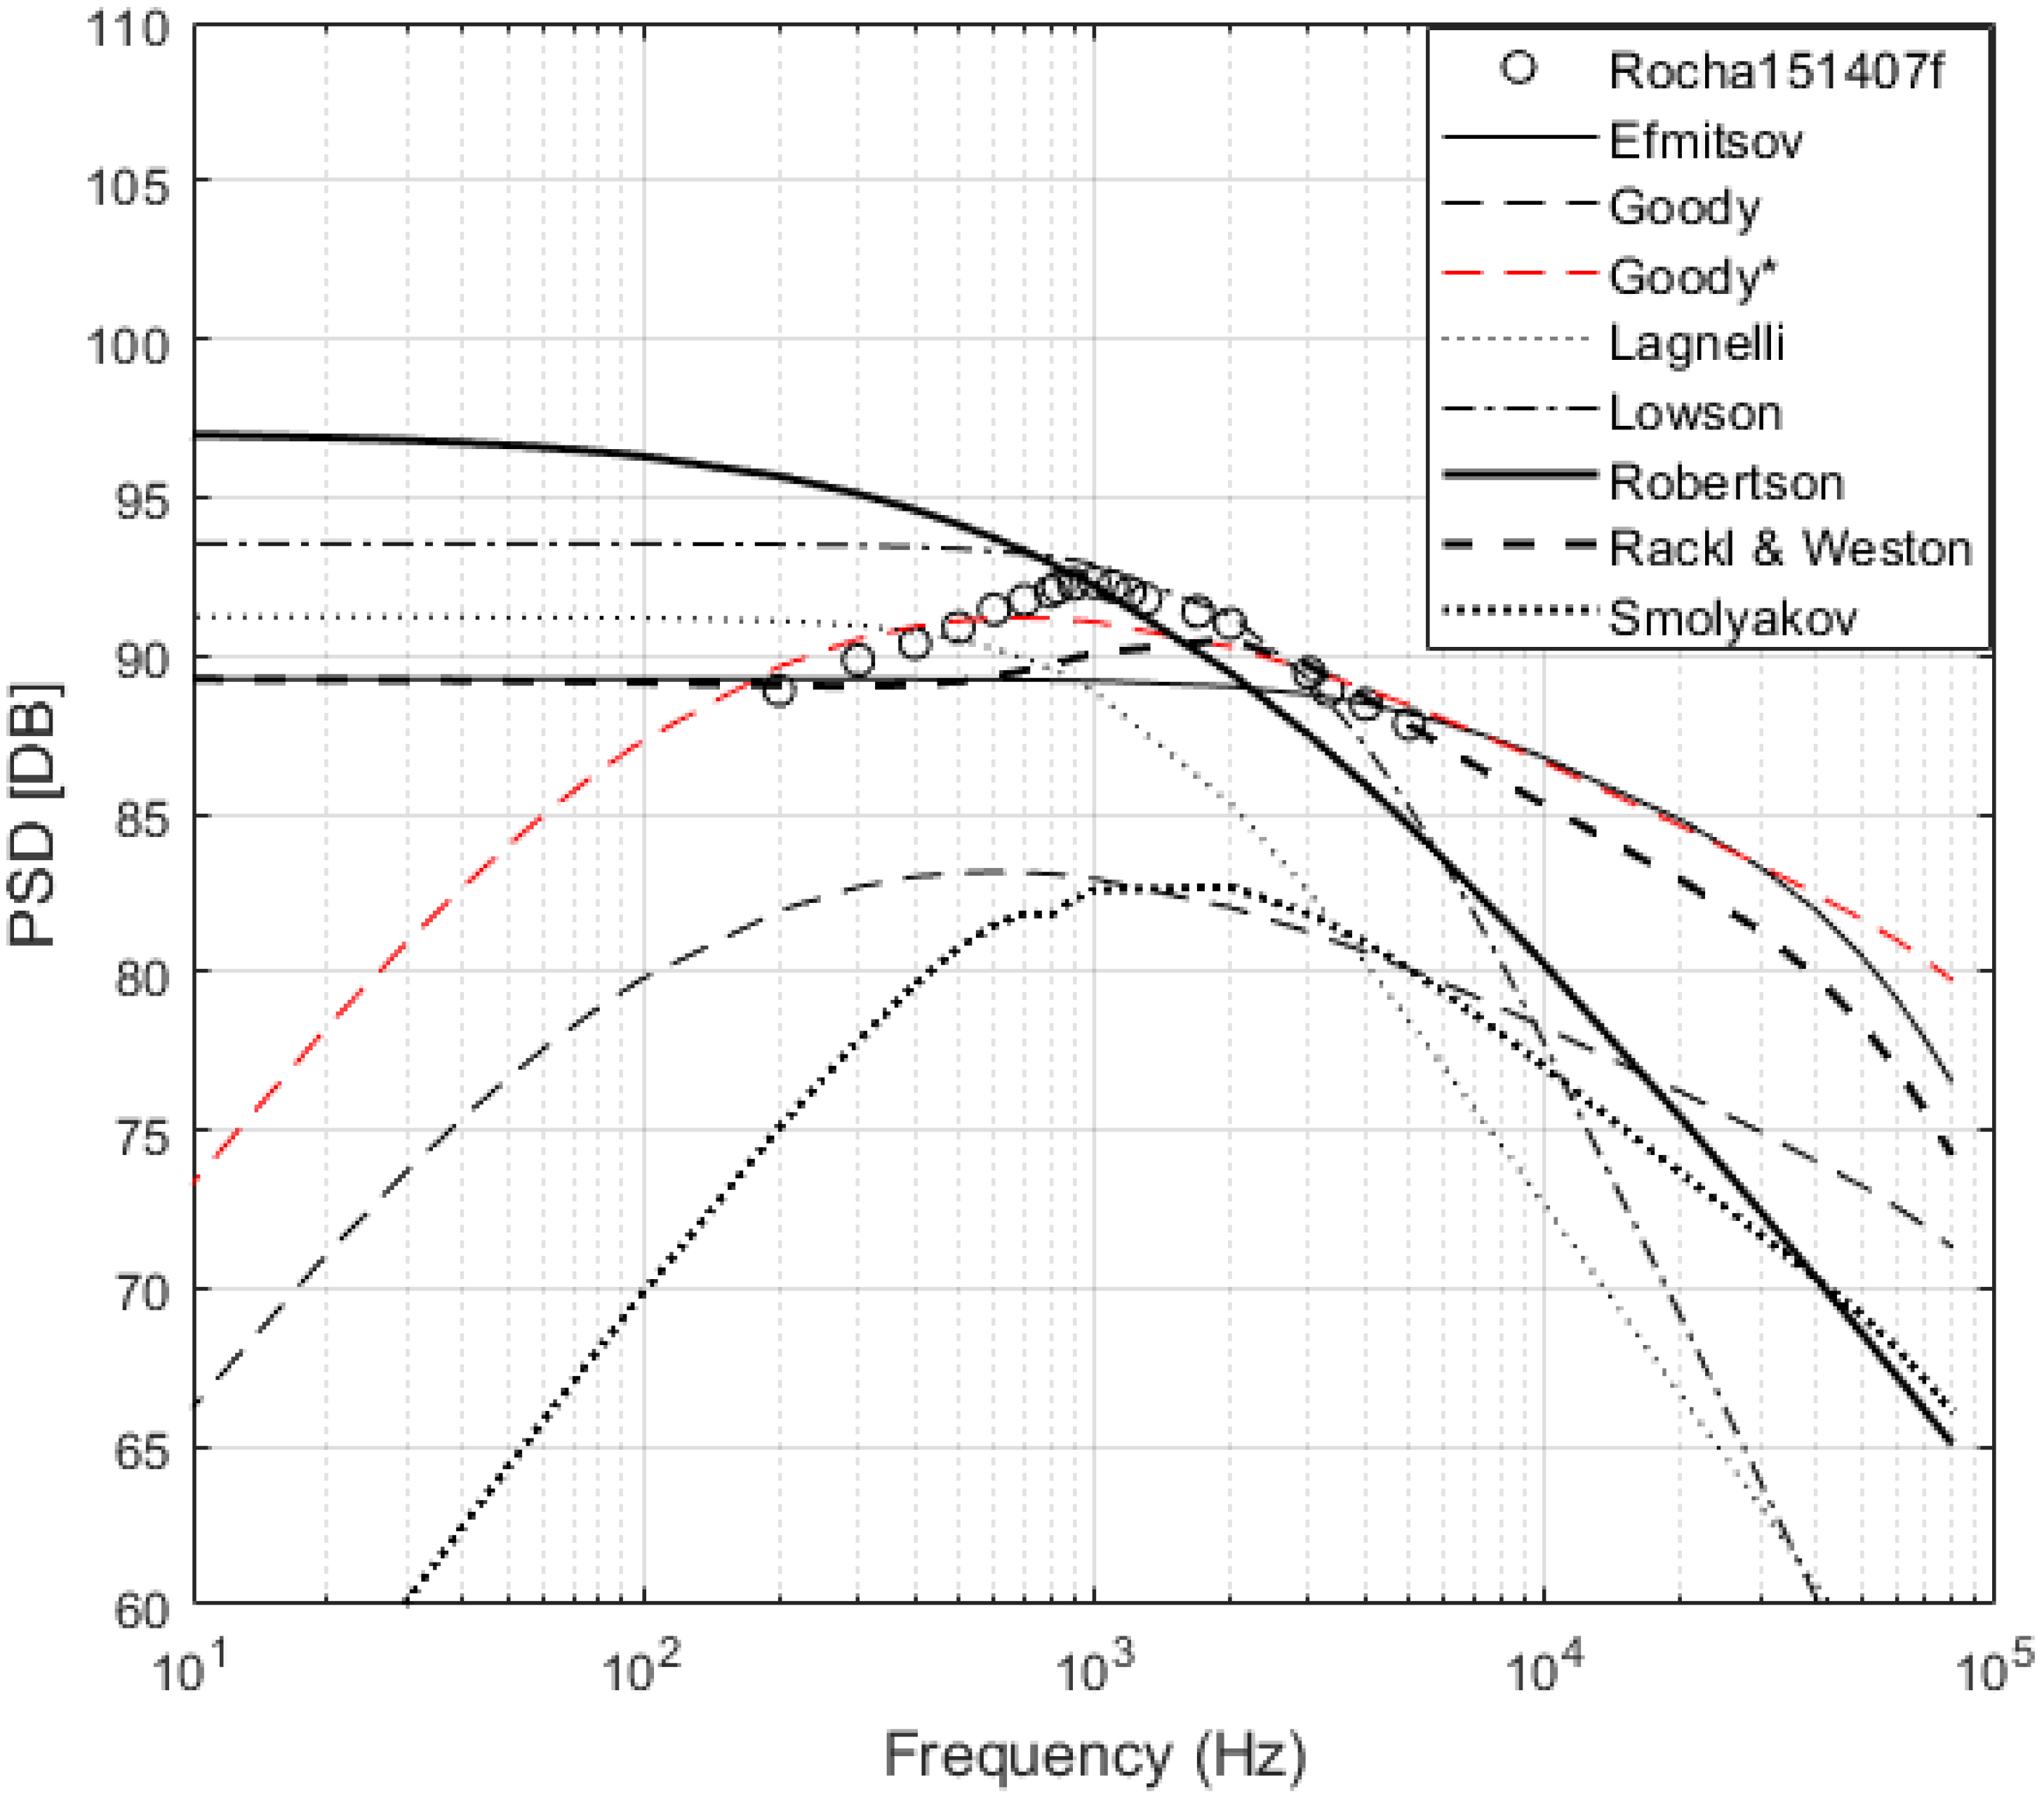
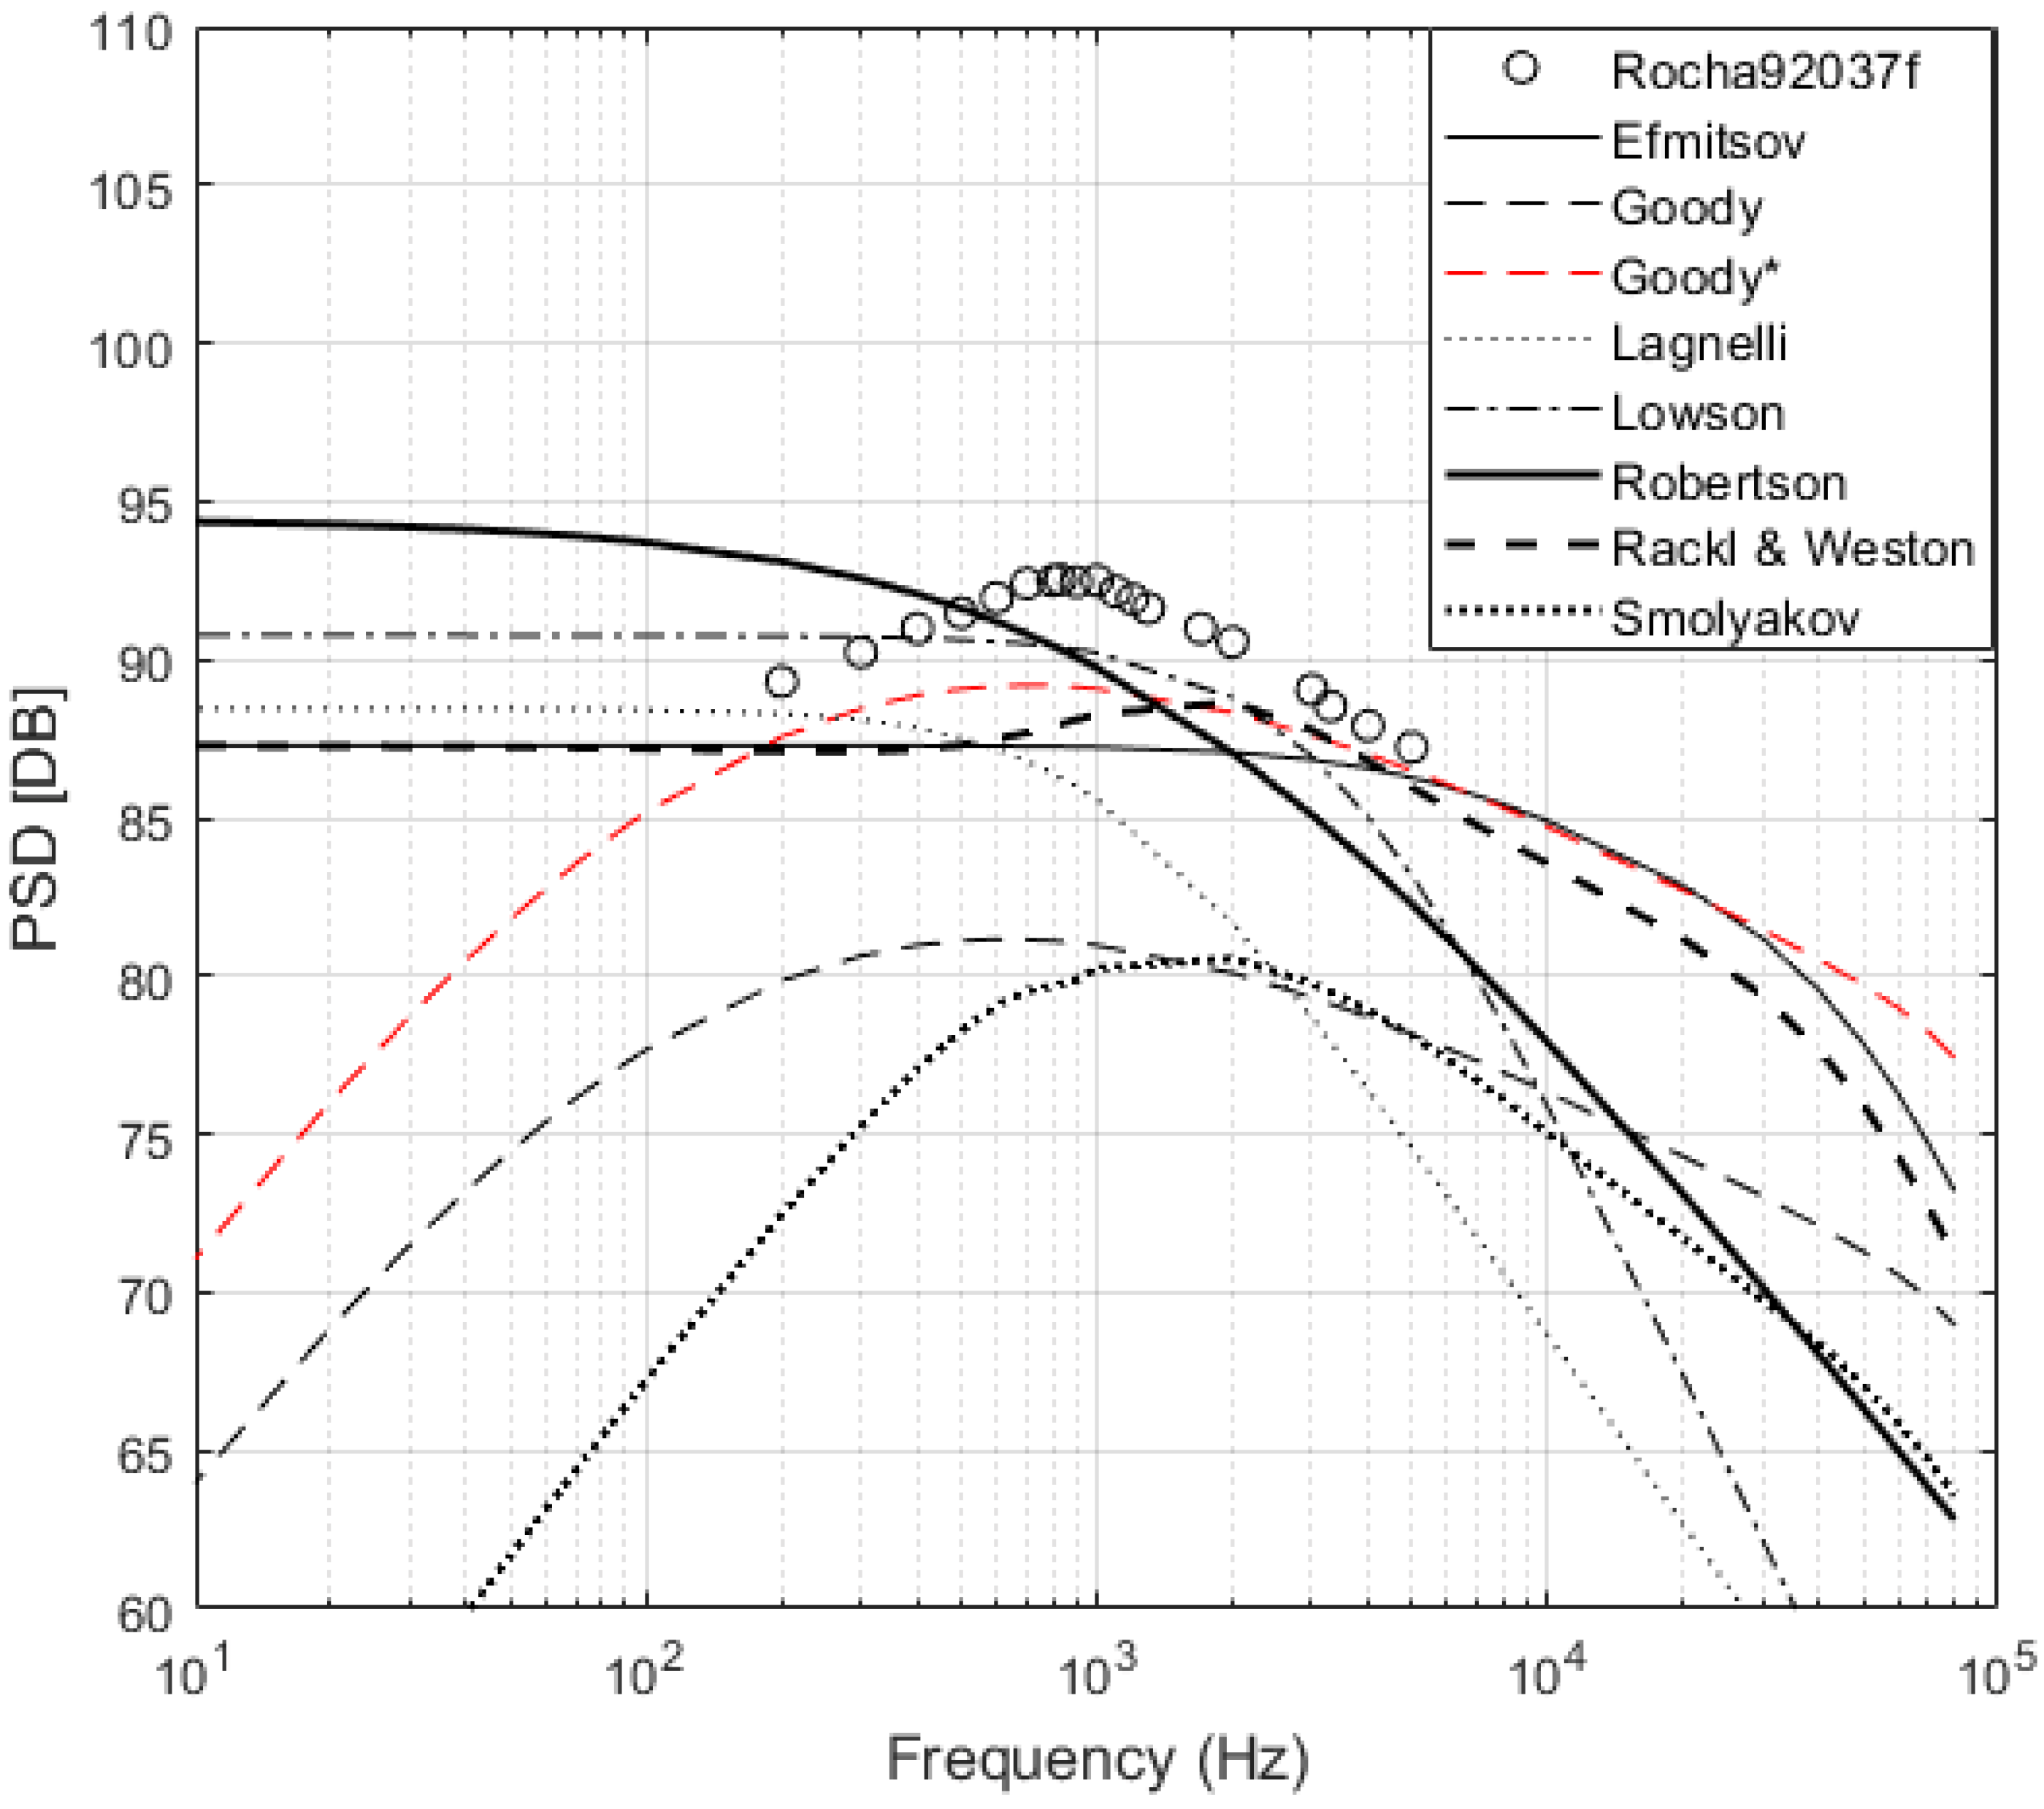
To update the Goody model to fit the flight test pressure spectra data in this study, the parameters were modified to
and
, as displayed in red in
Figure 4,
Figure 5 and
Figure 6. These values provide a local minimum for the MSE between the Goody model and the flight test experiments, the results of which are comparable to Efimtsov and Rackl and Weston. To create a universal model for flight test PSD, a
parameter that scales effectively would be desirable. Goody suggested that
should scale on the Reynolds number; however, Goody predicted Miller44899w well but not Rocha239216f, which has a similar Reynolds number. The adjusted Goody model does well predicting the magnitude and the shape of the pressure spectra for the four flight test experiments that are near Mach 0.7, as can be seen in
Figure 4 and
Figure 5. However, the adjusted Goody model overpredicts Rocha239216f, which is at a lower Mach number, and underpredicts Rocha92037f, which is at a higher Mach number, as shown in
Figure 6. This suggests that a
scaling parameter should include a velocity component as well. Other possible scaling parameters are the shear velocity and momentum thickness, given that the flight test data display much higher values for these parameters than the wind tunnel PSD data. However, currently there are not enough variety in high-speed and flight test PSD experiments to define a clear trend.
The findings from this study support that future work needs to be undertaken to improve current wall pressure fluctuation PSD prediction. Further high-speed wind tunnel and flight test experiments should be undertaken to better determine what factors cause the appearance of a broadband peak, and also to improve the understanding of the differences between wind tunnel and flight test experiments.
