
Flow Past Mound-Bearing Impact Craters: An Experimental Study


1
Department of Aerospace and Mechanical Engineering, University of Notre Dame, Notre Dame, IN 46556, USA
2
Department of Civil and Environmental Engineering and Earth Sciences, University of Notre Dame, Notre Dame, IN 46556, USA
3
CO2 Storage Division, International Institute for Carbon-Neutral Energy Research (I2CNER), Kyushu University, Fukuoka 819-0385, Japan
*
Author to whom correspondence should be addressed.
†
Current Affiliation: Department of Mechanical, Materials, and Aerospace Engineering, Illinois Institute of Technology, Chicago, IL 60616, USA.
Fluids 2021, 6(6), 216; https://doi.org/10.3390/fluids6060216
Submission received: 28 April 2021
/
Revised: 26 May 2021
/
Accepted: 3 June 2021
/
Published: 9 June 2021
(This article belongs to the Special Issue Boundary Layer Processes in Geophysical/Environmental Flows)
Abstract
:An experimental investigation into the flow produced by mound-bearing impact craters is reported herein. Both an idealized crater and a scaled model of a real martian crater are examined. Measurements were performed using high-resolution planar particle image velocimetry (PIV) in a refractive-index matching (RIM) flow environment. Rendering the crater models optically invisible with this RIM approach provided unimpeded access to the flow around and within each crater model. Results showed that the mean flow within the idealized crater exhibits more structural complexity compared to its moundless counterpart. Second-order statistics highlighted regions of minimal and elevated turbulent stresses, the latter of which revealed a complex interaction between shear layers that are present at the upstream and downstream parts of the rim and the central mound. Periodic vortex shedding of quasi-spanwise vortices from the upstream rim was revealed by POD-filtered instantaneous flow fields. Vertical flapping of this shear layer resulted in vortices occasionally impinging on the inner wall of the downstream rim. Further, conditional averaging analysis suggested periodic lateral oscillations of wall-normal vortices within the crater rim region reminiscent of those observed for flow inside spherical dimples. These results have implications for intra- to extra-crater mass and momentum exchange, and for sediment transport processes. Lastly, experiments with the Gale Crater model showed both similarities with and differences from the primary flow features found for the idealized model.
1. Introduction
Some of the richest records of Mars’s evolution are preserved in the sedimentary strata deposited within depressed topographic features, mostly represented by impact craters [1,2,3]. A number of early studies focused on simple martian impact craters indicated that wind-driven erosional and depositional processes may have played major roles in their post-impact evolution [4,5]. More recently, attention has shifted towards craters that have central sedimentary mounds [6]. Although less common, these craters are considered key to paleo-environmental reconstruction studies, as a valuable rock record is thought to be preserved not only within the crater floors but also within the strata forming these unique sedimentary features. Conveniently, when mounds are eroded, ancient signatures of past environmental conditions are exposed and accessible to robotic imaging and sampling. One of the best documented and most well-known examples of these outcrops can be found within Gale Crater, a ∼150 km impact crater hosting a large sedimentary deposit, a ∼5 km tall sedimentary mound, Aeolis Mons, emerging at the center of the crater. Gale is believed to hold evidence of past and potentially current subsurface water presence on Mars, and as such, it is the target of an ongoing exploration by the NASA rover Curiosity [7,8].
The processes controlling crater mound formation and subsequent erosion are the subjects of ongoing research [6,9,10]. These efforts are key to developing robust paleo-environmental reconstruction theories and predicting future environmental conditions, and are thus central to exploration missions. Several theories exist as to the formation of a central mound, those pointing to wind processes as the predominant driving mechanisms being among the most compelling [6,9,10]. Kite et al. [9] suggested that radially-directed slope winds, arising from strong intracrater temperature and density gradients, are responsible for both the formation of the mound and for its partial erosion. A complementary theory proposed by Day et al. [10] suggested that stages of mound formation progress from a sediment-filled crater, to the development of an initial moat, to a retreating central mound, to an isolated hill. This hypothesis, based upon the dominance of unidirectional regional winds, has been numerically tested by Anderson and Day [11], who linked the exhumation of the moat to the erosive action induced by an arch-shaped three-dimensional flow structure wrapping around the central mound. Geologic surface features, such as wind streaks, yardangs (sharp irregular ridges lying parallel to the prevailing winds), and dune fields provide additional inference to the prevailing wind directions over a given period of time. The distribution and orientations of these features, both within and around Gale, support the flow reconstruction proposed by Anderson and Day [11], and indicate that northerly regional winds, as opposed to katabatic (slope) winds, may have played a dominant role in the transport of sediments inside Gale Crater [6,12]. The pressure-driven regional winds impinging upon Gale Crater are dominant in the meridional direction, having estimated velocity magnitudes in the range of 1–20 m/s, though most commonly in the range of 5–7 m/s producing a mature planetary boundary layer thickness of 7–10 km [13,14,15]. It is reasonable to assume that a combination of density-driven slope winds and synoptic winds contribute to the formation and erosion of mounded craters, with the former mechanism being negligible for smaller craters.
As mentioned earlier, the notion that craters may be sculpted by winds is not new. Greeley et al. [4,5] studied the morphological evolution of simple craters driven by unidirectional winds and provided evidence of a link between erosional/depositional patterns and flow. Greeley et al. [5] performed sediment transport experiments in a wind tunnel using idealized crater geometries (both erodible craters and solid craters with loose sand) and compared the resulting morphological patterns to those observed in martian craters. Outside of the crater, they observed a region of deposition on the upwind side of the windward crater rim and erosion on the flanks of the crater. When wind velocity was above a certain threshold (dependent on grain size), erosional depressions originated in the lee of the crater rim in the form of a “bilobate” pattern. For each grain size, they also noted that as free-stream velocity was increased, the bilobate depressions became longer and wider, and moved toward the centerline, eventually merging in a single larger erosional region. A small triangular-shaped region in which erosion was relatively less present was observed near the lee of the crater. At the highest free-stream velocities considered, a trilobate depositional pattern was found downwind of the crater, suggesting a regime transition. Greeley et al. [5] proposed that the bilobate depressions were produced by the action of a horseshoe vortex wrapped around the leading edge of the crater rim, and counter-rotating, quasi-streamwise trailing vortices originating from the crater sides and emanating downstream. Within the crater, sand was first deposited in the downwind portion of the crater floor. However, as the experiment reached steady state conditions, sand tended to be transported upstream and accumulated in the lee of the windward crater rim. The downwind portion of the crater’s inner surface, including the floor and wall, was consistently eroded, regardless of the initial configuration of the experiment.
Some of the experiments performed by Greeley et al. [5] allowed inference as to the primary sediment pathways. In particular, a reverse flow along the centerline of the intracrater region was consistently seen to move sediment upwind, explaining the erosion in the downwind portion of the crater’s inner surface. Moreover, sediment accumulated inside the crater in a horseshoe pattern wrapped around the upwind inner wall and trailing downwind. Sand was eventually carried upward over the crater rim along the lateral sides and the leeward rim. Greeley et al. [5] interpreted these observations as the action of a large recirculating region extending across the entire intracrater and sustaining both the reverse flow along the floor and the uplift along the lateral walls.
Martian craters are immersed in a very thin atmosphere, which makes physical modeling highly challenging, especially if sediment transport is involved. Nonetheless, Greeley et al. [5], who used a standard atmospheric wind tunnel, demonstrated that experimental approaches are extremely valuable for understanding first-order flow physics. As mentioned earlier, in order to assess the applicability of their results to large scale craters, Greeley et al. [5] provided a qualitative comparison between the erosional patterns produced in their experiments and field observations of martian and terrestrial craters. They used photographs of small martian craters in which erosional/depositional patterns were indicated by the exposure/burial of more cohesive substrates. As additional corroboration, Greeley et al. [5] found that the patterns obtained experimentally were also consistent with those observed in terrestrial field studies. By inferential analogy, the similarity between experimental and field patterns provides compelling evidence supporting the notion that martian crater evolution may be primarily driven by aeolian processes.
Besides the work of Greeley et al. [5] and Anderson and Day [11], there have been few other studies focused on elucidating the flow dynamics associated with geometries similar to impact craters. A number of studies were dedicated to dimples, which are more closely related to rimless bowl-shaped craters [16,17,18,19,20]. In industrial applications, dimples are used to enhance heat transfer exchange, as they offer the advantage of minimizing pressure loss compared to ribs and fins [20,21,22]. These studies have highlighted the complexity of the flow structure associated with such depressions. The mean flow structure within a dimple is characterized by a flow separation at the leading edge producing a three-dimensional monocore recirculation, symmetric about the centerline, occupying ∼90% of the cavity and generating low and high surface pressures at the upstream and downstream halves of the dimple cavity, respectively [19,22]. While the mean flow does not seem to be strongly dependent on Reynolds number (), the flow complexity does increase with the depth-to-diameter ratio, causing the flow to be highly unsteady and multi-modal [17,18,19]. A combination of high-frequency and low-frequency modes were observed. Low-frequency, periodic, self-sustained lateral oscillations of the large-scale vortex structure were found to position the axis of the large vortex structure in the range . More interestingly, periodical outbursts of vortex pairs producing turbulent ejections of mass from the downstream rim were observed at higher frequencies, first in qualitative flow visualization experiments [17,20], and then this was confirmed through POD (proper orthogonal decomposition) analysis of LES (large eddy simulation) data by Turnow et al. [19]. Recent particle image velocimetry (PIV) experiments performed by Zhou et al. [22] over a spherical dimple quantitatively investigated the shear layer produced by the separation at the upstream edge. They concluded that the Kelvin–Helmholtz vortices populating the shear layer are responsible for the exchange of momentum between the free-stream and the dimple cavity. While studies on dimples may be directly applicable to ancient simple craters sculpted into rimless depressions by extremely long erosion processes, they cannot be applied to raised rim craters, particularly such craters with central mounds.
While much work has been done to understand flow around and within simple craters and dimples, our understanding of the flow around mound-bearing martian craters remains poor. To the best of our knowledge, no experimental study has probed the flow within complex craters with raised rims and central mounds, and no study has reported on the flow over a model of a real martian crater. The objective of this study was to start addressing these gaps by investigating the intracrater and extracrater flow structure induced by a unidirectional turbulent boundary layer on mounded craters via laboratory measurements. Herein, the craters were assumed to be subjected to external unidirectional winds. High spatial resolution particle image velocimetry (PIV) measurements were performed on two mounded craters: an idealized crater shape based upon a mathematical model that was previously employed by Anderson and Day [11], and a model of a real crater sourced from a digital elevation map (DEM) of Gale Crater. The initial results presented in Section 3, Section 4 and Section 5 provide a detailed description of flow responding to the idealized crater model. The results presented in Section 6 characterize flow around the Gale Crater model as a means of determining how well idealized models can inform our understanding of more realistic topographies.
2. Materials and Methods
2.1. Facility
Laboratory experiments were performed on physical models in the refractive-index-matched (RIM) flow facility at Notre Dame [23] wherein idealized and realistic crater models were fabricated and exposed to a turbulent unidirectional flow. The PIV method [24] was used to resolve the flow both within and outside of each crater model. Figure 1 presents perspective views of the experimental setup illustrating the relative orientation of the camera and laser sheet (which defines the measurement plane and the field of view, FOV) used to image flow in wall-normal and wall-parallel planes. A high-resolution digital camera captured the positions of tracer particles dispersed in the flow at two sequential times to infer the instantaneous fluid velocity field within the FOV. The tracer particles were illuminated over a targeted flow region with pulsed laser light formed into a thin sheet that defines the measurement plane. The laser pulses were synchronized to the capture rate of the imaging camera. Optical access to the flow around complex topography such as that of a crater is difficult to attain in the measurement planes, as illustrated in Figure 1, owing to protruding geometric features (e.g., the crater ridge) which obstruct views of the interior. This fundamental limitation can be overcome by fabricating transparent crater models from a material (acrylic) whose optical refractive index (RI) matches that of the working fluid in the RIM flow facility [23]. This RIM approach overcomes issues of optical access and in the current work allowed full-field imaging of the flow in and around the topographically complex crater models. By fine-tuning the fluid temperature to optimize the match between the solid and fluid RIs, each crater model immersed in the working fluid optically “disappeared” and light was able to pass through the model with minimal reflection or refraction. This experimental protocol therefore enabled unobstructed and unaberrated optical access to all regions of the flow produced by the crater, allowing its full quantification via PIV measurements.
The flow facility used for this study employs an aqueous solution of sodium iodide (∼63% NaI by weight) as the working fluid for which a number of transparent resins can be used for the fabrication of the models [23]. This solid/fluid combination is ideal in a broad range of flow applications because of the relatively minor safety concerns associated with this liquid, and its physical properties, including a relatively high specific weight (∼1.9) and low kinematic viscosity (only 10% higher than that of water). The latter characteristic enables high-Reynolds-number flows to be studied. Figure 2 illustrates the efficacy of this RIM approach. Here, a model of Gale Crater was molded from an acrylic resin (Uoptic2) whose RI can be matched to that of the NaI solution. In Figure 2a, the model is simply immersed in air and therefore fully visible. In Figure 2b, the same crater model is partially immersed in the NaI solution. As their RIs under the fluid interface are nearly the same, light passed through the model without reflection or refraction and thus it appeared as if it had disappeared. In the figure, the grid pattern positioned behind the model is visible and undistorted through the portion of the model that was immersed in the NaI solution. The optical transparency of this immersed portion of the model illustrates the measurement principle which is based upon rendering the fluid–solid system a continuum from an optical standpoint. By eliminating all sources of reflection and refraction, the flow within and around the intracrater region can be optically accessed and quantitatively resolved.
2.2. Crater Models
Transparent models of craters like that shown in Figure 2 were fabricated using the protocol detailed in Blois et al. [23]. First, a positive topography was 3D printed with the same geometry of the final model. A two-part silicone solution was poured around the 3D printed positive and cured to create the mold. Finally, a clear acrylic resin whose RI matches that of the NaI working fluid () was poured into the silicone mold and appropriately degassed and cured.
Two models were fabricated: a synthetic crater shape based upon mathematical models [11] that served as a proxy of a real crater and a digital elevation model (DEM) of Gale Crater. Anderson and Day [11] performed numerical simulations of flow over idealized crater morphologies with stages ranging from a fully-filled to an empty crater. The model used in the present study corresponds to the middle of that morphological range, with the crater surface having been defined by a combination of Gaussian curves with standard deviations of 0.4 (outer rim surface), 0.05 (inner rim surface), and 0.03 (mound). The physical model fabricated for this study had a crater rim height of 10 mm and a diameter of 50 mm, and the mound height was 90% of the rim height, as shown in Figure 3a,c.
The DEM used for the Gale Crater model was sourced from the High-Resolution Stereoscopic Camera (HRSC) experiment on Mars Express [25]. The geometry of the model ensured that the resulting experimental datasets contained realistic information on intracrater flows relevant to aeolian abrasion of actual intracrater mounds. As such, a low-pass filter was applied to the DEM. In addition, the vertical scale was exaggerated by a factor of three in order to satisfy the constraints of the facility. The morphology of this Gale Crater model is shown in Figure 3b,d. This model had a crater rim height of 10 mm, a diameter of 87 mm, and a mound height of 7.9 mm.
In both models, the rim was the most protruding feature, and its height, denoted by H, indicates the model elevation. Once fabricated, each model was mounted flush along the bottom wall of the RIM facility test section for testing. In the case of the Gale model, the upstream portion of the topography included in the DEM was modified to eliminate any abrupt transition that would contaminate the flow. Each model was mounted approximately 1.7 m downstream of the inlet and the flow was tripped at the inlet of the test section with a 3.5 mm-diameter cylinder secured to the channel floor to ensure a mature turbulent boundary at the measurement location. In this regard, each model was fully immersed within a turbulent boundary layer, with a > 5, where is the boundary layer thickness obtained from independent measurements with no crater model present (see Table 1).
Given the three-dimensionality of the crater’s geometry, flow was measured in five different planes to capture key elements of its three-dimensional structure. The locations of these PIV measurement planes are illustrated in Figure 3. Here, x, y, and z represent the streamwise, wall-normal, and spanwise directions, respectively; and blue and red lines denote the intersections between the streamwise–wall-normal (; wall-normal) and streamwise–spanwise (; wall-parallel) PIV measurement planes and each model’s surface, respectively. Data were collected at two wall-normal measurement planes—one positioned at the centerline () and the other offset in the spanwise direction by about half of the crater rim radius (). Measurements were also made in three wall-parallel planes positioned near the model base (), just above the crater half-height () and just above its rim (). For each model, data were collected at four free-stream velocities (, 0.49, 0.73, and 0.97 m/s), corresponding to four crater Reynolds numbers, (, 4500, 6700. and 8900, where ) in each measurement plane. The primary flow parameters of the incoming turbulent boundary layer for each free-stream velocity are reported in Table 1, with the friction being defined as , where is the friction velocity, and . As the discussion of the results focuses primarily on the highest-speed case, a more detailed list of the experimental parameters for this flow condition is presented in Table 2. As described in Section 3, all of these flow parameters were obtained from mean velocity profiles measured with the model (i.e., smooth-wall data).
2.3. Particle Image Velocimetry
To enable PIV measurements, the flow was seeded with 11 μm silver-coated hollow-glass spheres (see Blois et al. [23] for details). The tracer particles were illuminated with a dual-cavity, Quantel Evergreen Nd:YAG laser (Lumibird, formerly Quantel-Keopsys group, Bozeman, MT, USA) at an energy of 200 mJ/pulse formed into a thin light sheet (∼1 mm thickness) and oriented in the various and measurement planes mentioned previously (see Figure 3). A 29-megapixel, frame-straddle CCD camera (TSI, Inc., Shoreview, MN, USA) with an array size of pixels was used to image the mm and mm wall-parallel and wall-normal fields of view, respectively. The camera was positioned such that the model was centered at roughly a third of the total streamwise field of view in order to best capture the full extent of the shear-layer dynamics. At each measurement location, 4000 time-delayed pairs of PIV images were collected at a sample frequency of 0.5 Hz to ensure statistical independence of the samples.
The vector fields were processed using commercial software DaVis 8.4.0 (LaVision GmbH, Göttingen, Germany) with a normalized multi-pass iterative cross-correlation scheme with decreasing interrogation window size, starting with two passes with a pixel spot size, followed by three passes with a pixel spot size. The final spatial resolution of the vector fields was ∼0.6 mm (). Direct correlation was used in evaluating interrogation windows that intersected with the surface of the model to avoid spurious results owing to the solid–fluid interface. Finally, spurious vectors were identified and removed using a universal outlier detection scheme [26]. Holes were filled via linear interpolation. Less than 5% of vectors within the shear layer were a result of interpolation, indicating the high-quality nature of the PIV velocity fields.
3. Effect of Reynolds Number
Before discussing the complex 3D structure of the flow field, we explore the possibility of dependence for the idealized crater model across the range of achievable in the flow facility. To this end, the incoming turbulent boundary layers are first characterized at various , and their structural differences are discussed. Any effects on the flow perturbed by the presence of the crater are then explored by comparing profiles of mean velocity and turbulence statistics obtained at fixed streamwise positions around the crater at different .
Characteristics of the incoming turbulent boundary layers at the four measured were assessed by acquiring data in the absence of the crater models, hereafter referred to as smooth-wall flow. These measurements were conducted at free-stream velocities in the range m/s (corresponding to ), as reported in Table 1. Figure 4 presents profiles of the smooth-wall mean streamwise velocity, scaled in inner units (i.e., and ); the primary boundary layer parameters are reported in Table 1 and Table 2. Here, the friction velocity was obtained using the fitting method proposed by Chauhan et al. [27], who established a composite boundary layer mean velocity profile defined by the sum of an inner profile and a wake function. The profiles were parameterized by , , and a wake parameter that were determined via linear regression. Leveraging 95% confidence intervals [28], these estimates of and have associated uncertainties of approximately % and %, respectively. This former variability, along with the free-stream turbulence levels, slightly favorable pressure gradient in the RIM facility, and trip used to regularize the boundary-layer transition to turbulence, together account for the slight irregularities noted in over the measured.
For reference, the red dashed line in Figure 4 represents the logarithmic law given by , which typically resides in the range (where and as in [27]). While the three higher cases display a clear log region of increasing extent with (indicative of the growing range of scales from small to large with increasing ), the case is devoid of a log layer, as the upper limit for this case is , which aligns with the lower of the log layer (). As such, there is limited separation of turbulent spatial scales between the smaller and larger scales for this case. In contrast, for the three higher cases, each reflects a well-defined log region of increasing extent with , consistent with an increasing separation between the smaller and larger flow scales with . These results therefore suggest that, while all four boundary layers are turbulent, the lowest tested is nearly devoid of a log layer, which implies a minimal inertial subrange in the velocity spectra, and therefore weak separation at best between the smaller and larger flow scales.
Differences are also noted in the near-wall region, where these profiles should display universality. These differences are artifacts related to the limited spatial resolution of the measurements. PIV interrogation windows are fixed in physical units and the interrogation window size is limited by particle seeding density, which was kept constant for all experiments. Near-wall scales become smaller with , as reflected in a reduced with . As such, a growing mean velocity gradient exists within a fixed interrogation window size for increasing . For that reason, the near-wall velocity gradient cannot be accurately captured within the PIV interrogation windows, resulting in an overestimation of the mean velocity with increasing , as noted in Figure 4. While these measurement limitations impeded full characterization of the very near-wall behavior of the incoming boundary layer (i.e., within 1 mm of the wall), they did not impede documentation of flow around the crater, as this was dominated by motions that scaled with the crater dimensions (i.e., over ten times larger than this very near-wall flow).
The dependence of the mean flow field around the idealized crater on was studied at the four aforementioned conditions by comparing velocity profiles at fixed streamwise locations. For brevity, comparisons of wall-normal profiles at the crater centerline () are presented at four streamwise locations (see Figure 5a). These streamwise positions were chosen to capture a representative range of intracrater and extracrater flow patterns, and for consistency, will be used for all of the wall-normal profiles shown herein. Figure 5b,c illustrates wall-normal profiles of the mean streamwise and wall-normal velocity components normalized by . The horizontal dashed lines demarcate the elevations of the crater surface at the corresponding measurement locations. Here we focus the discussion on the similarities between the profiles at different , and a more detailed discussion of the physics suggested by these data is forthcoming.
Overall, the profiles at different compare well, particularly for the three highest in both the streamwise (Figure 5b) and wall-normal (Figure 5c) mean velocity components. However, the lowest deviates from these trends in both components, indicating perhaps that the lower level of turbulence maturity of the incoming turbulent boundary layer for this , as previously discussed, may have been responsible for the observed disparities.
Normalized wall-normal profiles of turbulent stresses for the same cases and locations are shown in Figure 6. Again, normalization with seems to produce a reasonable collapse with the exception of the low- case, which shows a slightly larger departure than that observed in the mean velocities. Qualitatively, all profiles show the existence of a shear layer due to flow separation at the upstream rim. Profiles at (i) show a peak of all turbulent fluctuations just above the rim. At this location, intracrater stresses increase with . This is particularly evident for the wall-normal Reynolds normal stress, showing a very mild peak at (Figure 6c). All peaks increase downstream of the mound at (ii) , suggesting that the fluctuations in the original shear layer are amplified by the interaction with the mound. Some effects are also noted at this location, with the lowest exhibiting the largest normalized fluctuations. The profiles at (iii) are positioned in the near-wake region. Two peaks emerge in all profiles at this location, suggesting an additional flow separation and an interaction between two distinct shear layers, with an increase in magnitude with . Finally, in the far wake, (iv) , the double peak disappears and the profiles exhibit a less pronounced peak whose magnitude increases and at a higher elevation with increasing .
Dependence on was also examined in the wall-parallel measurement planes, with a particular interest in any impact on flow three-dimensionality. Here we focus on the measurement plane positioned just above the crater rim (top-plane, ), which is the most influenced by the boundary layer thickness and thus shows the largest disparities. Figure 7 presents spanwise profiles of normalized mean streamwise and spanwise velocities at the same selected streamwise locations considered above (Figure 7a). While the profiles show qualitative similarities, the comparison shows clear trends, particularly accentuated at the most upstream location, (i) . At this streamwise location, increasing results in increased momentum along the crater centerline (Figure 7b) accompanied by a stronger lateral flow deflection (Figure 7c). The profiles of at all locations embody three local minima, located at the centerline and at and (Figure 7b). With increasing , these peaks become more pronounced, suggesting that the flow perturbation induced by the crater increases slightly with . The profiles of the mean spanwise velocity, , also suggest the existence of a trend, with higher inducing increased lateral flow deflections above the crater (Figure 7c).
In summary, these comparisons across the cases considered suggest some differences among —most notably, deviations between the lowest case and the three higher cases (which match well). The lack of consistency in this regard aligns well with differences noted between the incoming flow at the lowest and those of the three higher cases, given the former has virtually no logarithmic layer. This suggests that the weak turbulent scale separation in the incoming boundary layer, found in the lowest case, may have been responsible for the trends observed. However, our results suggest that this dependence decays with increasing as the log layer of the incoming turbulent boundary layer matures and scale separation grows. As such, the remaining results and analysis delving into the flow around mounded craters focus on the highest results, in an effort to minimize the dissonance between observations in our physical models and the actual flow in full-scale impact craters.
4. Mean Flow Structure
4.1. Flow Topology
Given the 3D structural complexity of the flow under study, a description of the mean flow topology is first explored via critical point analysis. Critical points in a 2D velocity field are defined as locations where both components of the velocity are zero; are classified based on the signs of the real and imaginary components of the eigenvalues of the local velocity gradient tensor, [29]; and include foci, nodes, and saddle points. In a two-dimensional flow plane, there are two eigenvalues of the local velocity gradient tensor, yielding two real components, , and two imaginary components, , along with the property that . Foci and nodes are further denoted as either attracting or repelling based upon the signs of the real components. A focus is defined as a critical point where and have the same sign and is repelling or attracting if or , respectively. A critical point is a node if and have the same sign and is repelling or attracting if or , respectively. Lastly, a saddle point is defined as a critical point where and have opposite signs. For additional details on critical point analysis, the reader is referred to Chong et al. [29].
Figure 8 presents the mean flow topology, both identified critical points, and mean streamlines, for the highest case in both the wall-normal and wall-parallel measurement planes. These results reveal significant complexity in the mean flow structure and indicate a strong three-dimensionality of the flow. This is true particularly within the intracrater space, where several flow features appear and each measurement plane reveals a unique flow pattern.
Let us focus first on the mean flow topology in the wall-normal measurement planes (Figure 8a,b): No reverse flow is observed in the stoss (upstream side) of the crater. This is inconsistent with observations by Greeley et al. [5] who examined the stagnation region of a simple crater and found that reverse flow was tied to sediment deposition. This difference may or may not be associated with the presence of a mound in the current work, as the shape of the leading edge of the crater could also alter this behavior. In this regard, the crater studied herein is more streamlined than that employed by Greeley et al. [5] and thus produced a lower adverse pressure gradient. Further downstream, flow separates both at the upstream and downstream rims along the crater centerline (Figure 8a). The leeside presents no clear signs of a flow reattachment point nor of recirculating flow at the centerline. Instead, a near-wall critical point (found to be a repelling node) is visible at on the lee side, from which streamlines emit outwardly (Figure 8a). Within the crater, topological analysis suggests the presence of an unstable focus and a node upstream of the mound, whereas streamlines downstream of the mound reveal an outwardly-directed flow departing from a node located near the surface of the downstream rim (Figure 8a). The centerline topology of the mounded crater is dramatically different from that of simple craters, due to its having dimple-like cavities with either with raised or flat rims [4,22]; simple craters are characterized by a single recirculation cell and a stagnation point on the internal surface of the downstream rim at approximately the same location occupied by the repelling node of the case studied herein.
The offset wall-normal plane (Figure 8b) exhibits a large region of coherent swirling flow occupying the entire crater interior. This mean-flow vortex is oblate and titled downward, with a focus located at roughly , . Interestingly, the streamlines neither converge nor diverge downstream of this point, classifying it by topological analysis as a “center”, which is mathematically defined as a critical point where and .
The wall-parallel measurement planes reveal rich flow patterns. While no critical points were detected in the plane above the crater (Figure 8c), the streamlines suggest that the topographic perturbation imparted by the crater on the mean flow extends above its rim. The flow past the upstream rim converges toward the mound, and after passing it, the flow diverges, suggesting a decelerated/accelerated flow sequence devoid of abrupt transitions. Below the rim (Figure 8d,e), the intracrater and extracrater flows are physically separated by the crater wall, and the patterns are dramatically different from the plane above the crater. Outboard of the crater, the mean flow is quite similar. Figure 8d,e reveals a stagnation point upstream of the crater located at the crater centerline, as expected, due to symmetry of the flow. The mean flow then detaches along the lateral sides of the crater at , which creates a triangular zone of reverse flow in the lee of the crater culminating in a saddle point. This configuration is reminiscent of the leeward shadow zone identified by Greeley et al. [5] as a deposition region for a simple raised-rim crater.
Unlike the extracrater region, mean flow in the crater’s interior varies significantly between the two planes examined. In the wall-parallel mid-plane (Figure 8d), four swirling motions with identified foci are noted in the mean flow. Streamlines show that these vortices are symmetric and counter-rotating about the centerline, with the vortices in the first and third quadrants rotating in a clockwise manner, and the vortices in the second and fourth quadrants have counterclockwise rotation. The upstream pair of vortex cells converges along the centerline and forms a saddle point just upstream of the mound at . The downstream pair rotates in the opposite direction and instead the flow collides with the lateral sides of the rim interior, resulting in near-surface saddle points. The mean flow in the lower measurement plane at (Figure 8e) shows that the upstream pair of vortices penetrates deeper into the crater’s interior, whereas the downstream vortex pair leaves an imprint in the form of diverging streamlines.
4.2. Mean Flow
Contours of mean streamwise and wall-normal velocity in the two streamwise–wall-normal planes are shown in Figure 9, with mean streamlines overlaid. Results suggest the typical behavior of a topographically forced flow whereby shows decelerated flow upstream [30,31], accelerated flow above the crater, and a momentum deficit in the wake (Figure 9a,b). Likewise, features an upward push followed by downward recovery (Figure 9c,d). While the crater depression does not alter this overall pattern significantly, it introduces distinct features that are worth noting. First, a complex afterbody region (i.e., low momentum region bounded by the shear layer) forms, involving both the intracrater region and the lee of the crater. This feature sets a raised rim crater apart from simple topographies such as hills and bedforms in which the afterbody develops only on the lee side. Moreover, unlike rimless craters and dimples, in which wall-normal momentum is induced by shear layer instabilities, here vertical flow is instead topographically induced by the rim and mound.
Flow is significantly different at the two spanwise measurement locations. While the upwelling flow () is slightly stronger at the centerline, the downwelling flow () is significantly stronger at the sides (Figure 9c,d). These results highlight alternating regions of upwelling and downwelling flow within the crater which are key to understanding the interactions between the outer- and intra-crater flow occurring across the shear layer. Finally, a region of upwelling flow appears downstream of the reattachment point in the lee of the crater (Figure 9c). This region of positive is contrasted by a region of negative of larger magnitude in the wall-normal offset plane (Figure 9d). This shift in sign is indicative of a secondary motion in the wake, consistent with the action of quasi-streamwise vortices emanating downstream from the crater sides as proposed by Greeley et al. [5].
Figure 10 presents the distribution of mean streamwise, , and spanwise, , velocity components in the three different wall-parallel planes with mean streamlines overlaid. The mean velocity distribution is symmetric about the centerline for and asymmetric in . Therefore, only the top half (i.e., ) of the measurement domain is shown. Results are described starting from the plane located just above the crater rim (), as shown in Figure 10e,f.
The mean streamwise velocity (Figure 10e) around the crater rim shows a slight deceleration of the flow approaching the crater, an acceleration along the crater’s sides, and a slight momentum deficit in the crater’s wake displaying an elongated pattern concentrated at the spanwise centerline and ranging from about to . The flow just above the intracrater region shows a crescentic region of momentum deficit along the flanks of the crater rim. The values of in Figure 10f quantify the lateral deflection induced by the crater, which is entirely beneath this measurement plane. Results show that the extracrater flow is first deflected laterally outward and then laterally inward, as expected. The distribution just above the intracrater region, though less obvious, shows a more complex behavior. There exist three distinct pockets of elevated magnitude of within the bounds of the crater rim. First, the flow converges laterally inwards (i.e., ), toward the mound peak at . Downstream of the mound, , the flow is directed laterally outwards (). Finally, this lateral outward motion is enhanced above the downstream rim.
For the mid-plane at (Figure 10c,d), the flow outside and inside the crater are physically separated. The flow outside the crater displays essentially the same patterns as noted in the higher elevation plane, but with increased magnitude in . In contrast, the flow within the crater is more complex and characterized by the recirculation regions previously identified in the topological analysis. These results quantify the magnitude of the motion indicated by the streamlines and reveal that the reverse flow inside the crater is elevated, particularly near the crater floor (Figure 10a). The mound seems to induce a lateral deflection of this reverse flow that prevents the formation of the two large recirculation regions often seen in dimples [22]. Instead, these cells split and form two counter-rotating cells near the upstream rim that persist near the crater floor.
4.3. Turbulent Stresses
Contours of the in-plane Reynolds normal ( and ) and shear () stresses in the wall-normal centerline and spanwise offset planes are shown in Figure 11. The shear layer, identified by regions with elevated , is clearly three-dimensional as indicated by the distinct patterns noted at the different spanwise measurement planes [32]. Along the crater centerline, the shear layer, which first forms due to flow separation from the upstream rim, grows in strength and thickness with downstream distance. The presence of the mound appears to alter the evolution of the shear layer at the centerline, principally by amplifying the turbulent fluctuations and its growth rate. The shear layer eventually reaches the downstream rim at . The lower portion of the shear layer impinges into the inner crater wall, and the upper portion interacts with another shear layer formed from the crest of the downstream rim. The crater’s turbulent wake thus results from the interaction between multiple shear layers. The main orientation of the wake at the centerline is horizontal, which results in a sheltered region in the crater lee side along the centerline with near-zero turbulent fluctuations. In the laterally offset plane, the shear layer does not appear to be significantly influenced by the mound, and on the rim interior wall and in the near-wake of the crater is reduced (Figure 11b).
The wall-normal Reynolds normal stresses, , in the centerline plane (Figure 11c) exhibit a notable peak that occurs near the downstream crater rim and seems to mostly affect the inner area of the wall (, ). Qualitative comparison of in the two measurement planes (Figure 11c,d) suggests that the intensity of the vertical velocity fluctuations is maximal at the centerline. This observation also holds for the Reynolds shear stresses reported in Figure 11e,f, suggesting overall increased turbulent activity at the centerline. Taken together, these results indicate that the peak of wall-normal velocity fluctuations may create a preferential momentum exchange path linking the intracrater flow to the overlying flow. It is reasonable to conjecture that this area is not only associated with intense erosion activity of the inner wall, as previously suggested by Greeley et al. [5], but may also create an escape path for the sediments exhumed from the crater moat, similarly to the upwash mass exchange mechanism described by Zhou et al. [22] for dimple cavities.
A quantitative comparison between the two wall-normal planes is reported in Figure 12, wherein profiles of the in-plane Reynolds stresses at selected streamwise locations are presented. The centerline plane displays larger stress magnitudes at streamwise positions downstream of the mound compared to the laterally offset plane, though this pattern is reversed upstream of the mound. These results also show that the maxima in the turbulent stresses in the laterally offset plane are located closer to the wall, which is particularly pronounced in the near-wake region. These observations indicate that the turbulent processes flanking the central mound, likely responsible for the erosion of the lateral moat, act more effectively in the erosion of the bottom wall, and that the enhanced turbulent shear layer aligned with the mound may be more responsible for the transport of sediments in suspension being exhumed away from the crater. This interpretation of these results is consistent with previously proposed theories [4,11].
The interaction between shear layers in the same plane is highlighted by the presence of double maxima in the profiles of turbulent stresses in the near wake () of the centerline plane in Figure 12b(iii). These two peaks are located and above the surface and are most likely the signature of the interaction between the shear layers originating at the upstream and at the downstream rims. The presence of two peaks begins at the downstream crater rim edge () and persists up to . A similar behavior was also observed by Buckles et al. [32] in their study of flow over a surface with sinusoidally varying elevation. In the laterally offset plane at the same streamwise location, there is one clear peak in the Reynolds stresses at and an inflection point at . The inflection point appears to be a signature of the peak in the centerline plane at (Figure 12b(iii)).
The sheltered area in the upstream intracrater region is apparent in the attenuated stresses at (ii) in the elevations below the rim height (). This sheltered region is mostly absent in the offset plane at the same streamwise location and elevation, which may indicate that the 3D volume of elevated turbulent stresses wraps around the mound in a horseshoe-like pattern. This is further substantiated by the distributions of wall-parallel Reynolds stresses shown in the following section.
Finally, the turbulent stresses persist far downstream of the crater. The maxima of and at downstream of the rim (not shown herein) are about of the peak value of that at the downstream rim, and for . The wall-normal position of maximum Reynolds stress in the centerline plane shifts upwards for increasing downstream distance and is particularly pronounced in the profiles. This upwards shift of peak stress magnitude following a local maximum in elevation is reminiscent of that observed by Jackson and Hunt [33] in flow over a hill.
The in-plane Reynolds normal stresses in the wall-parallel planes (i.e., and ) are symmetric about the crater centerline (), and the in-plane Reynolds shear stress () is anti-symmetric about the centerline. For this reason, only the top half () of the contours are presented in this section for the mid-plane () and the plane sitting just above the crater ( in Figure 13.
Focusing first on inside the crater: Elevated values are noted on the lateral sides of the central mound (Figure 13a). These regions are characterized by intense near the inner downstream crater wall and are interpreted as the signature of horseshoe vortices flanking the crater interior and exterior, as previously suggested by Anderson and Day [11]. Likewise, on the exterior of the crater, streaks of enhanced emanate from near the point of flow separation. These regions are quite consistent with the bilobate erosional patterns reported by Greeley et al. [4]. The extracrater streaks surround two additional streamwise elongated regions of relatively high magnitude that are aligned with the previously mentioned high stresses within the crater. As such, they may be a residual of the downwashing flow emanating from the central mound.
The spanwise Reynolds normal stress, , in the mid-plane (Figure 13c), shows three distinct regions of increased magnitude within the crater, all located near the downstream wall. These stresses at the centerline are particularly elevated, confirming that this region is likely exposed to increased erosion and transport of sediments induced by turbulent processes. The spanwise extent of this region is most likely due to flow impinging into the wall surface with a mound-induced spanwise flapping. The elongated shape of this region also suggests that the spanwise fluctuations at the centerline may effectively mobilize sediments supplied by the moat erosion processes towards the centerline, where the vertical velocity fluctuations would provide a lifting mechanism.
Finally, the in-plane Reynolds shear stress, (Figure 13e) reveals the presence of four streaks of elevated magnitude in the wake of the crater, which is consistent with the spatial distribution of . Adjacent streaks possess the same sign, suggesting that they originate from distinct flow separations. It is conjectured that, while the external layers are produced by separation around the crater rim, the ones closer to the centerline may be produced by a distinct set of secondary flow structures originating from within the crater moat, conceptually consistent with that reported by Anderson and Day [11].
Contours of the in-plane turbulent stresses in the wall-parallel plane just above the crater rim (; Figure 13b,d,f) reveal that the interior of the crater rim is flanked by areas of elevated magnitudes of in a crescent-shaped pattern (Figure 13b) near the rim. Additional streamwise fluctuations are concentrated at the centerline and seem to originate from the mound. These two independent sources of turbulence produce a complex pattern downstream. In contrast, and (Figure 13d,f) reveal regions of elevated stresses are present on either side of the mound and slightly downstream of it. The propagation of these stresses downstream is very limited as they seem to dissipate quickly. Secondary regions of are visible at the centerline, near the upstream rim at , and in the wake of the crater. The latter, in particular, presumably produced by the mound, seem to produce very elongated streaks.
4.4. Turbulence Production
While the results in the previous section reveal complex spatial distributions of turbulent activity, it is of interest to determine the mechanisms of turbulence production. The incompressible, steady-state turbulent kinetic energy equation can be written as [34,35]
where k is the turbulence kinetic energy, . The present analysis focuses on the turbulence production term, P. The sign convention used here is such that the production is defined as , for , and therefore represents the summative contributions of six independent terms accounting for different combinations of Reynolds stresses and mean velocity gradients. In this context, the production term represents energy transfer to and from the mean flow from and to the turbulence. In particular, denotes energy transfer from the mean flow to the turbulence and represents energy lost by the turbulence and gained by the mean flow.
Contours of turbulence production are shown in Figure 14 for the various measurement planes. Since the measurements were conducted with planar, two-component PIV, the out-of-plane components are not included in the summation. As such, the values of P measured herein are surrogates of the total production. This is especially true for the wall-parallel plots in Figure 14c,d, which neglect the wall-normal term that is the dominant contribution to the total production. For this reason, the surrogate turbulence production values in the wall-normal planes, , and in the wall-parallel planes, , were computed from the resolved velocities and velocity gradients in the two measurement plane orientations and are defined as
However, a general picture of the three-dimensional distribution can be inferred by combining the two orthogonal orientations.
The contribution to the wall-normal production, , dominates throughout most of the domain, while the and terms make negligible contributions. The effect of the mound on the flow is more prominent than in the contours of the Reynolds stresses, in that the turbulence production sharply increases at in the centerline plane (Figure 14a). The highest values of production are found in the offset wall-normal plane (Figure 14b), in which the peak in production is located just downstream of the rim. The impingement of the shear layer into the interior surface of the rim is also clearly visible in this metric. One region of particular interest is the region of negative turbulence production (i.e., energy transfer from the turbulence to the mean flow) in the centerline plane at the inner wall (at ), near the downstream rim. As seen in Figure 11e, the Reynolds shear stress is near zero in this region. The negative values of P therefore arise from the and terms, and are found at elevations above and below the rim, respectively. Examination of the wall-parallel planes confirms that turbulence production is negative near the rim at (Figure 14d); however, the positive turbulence production, , in the mid-plane (Figure 14c) at the interior side of the rim offsets the negative noted in the centerline plane.
The upstream and downstream regions of positive and negative , respectively, near the rim in the plane (Figure 14d) are primarily due to the term. The region of positive turbulence production is a combination of high values of in the shear layer emanating from the upstream rim and the flow decelerating as it encounters the high-pressure crater interior and thus causing to be negative. The region of negative turbulence production is likely due to flow accelerating over the downstream interior surface that results in being positive. Finally, the term accounts for the positive turbulence production noted on the lateral flanks of the rim.
4.5. Flow Rotation
The flow in this study is characterized by multiple recirculation regions and complex flow separations. In order to better understand the nature and origins of these features, the spatial distribution of the rotational component of the flow is examined using a Galilean invariant metric. We computed swirling strength, , which is derived from the local velocity gradient tensor, . In general, this tensor has one real eigenvalue, , and a pair of complex eigenvalues of the form , where , the imaginary part of the complex eigenvalue of the velocity gradient tensor, is a scalar quantity. In this context, it only measures the magnitude of the local flow rotation. As the complex eigenvalues only occur as conjugate pairs, the sign of the rotation cannot be discerned directly from . However, as suggested by Wu and Christensen [36], the sign of the local instantaneous fluctuating vorticity can be assigned to to provide the rotational sense. For example, the swirling strength in the streamwise–wall-normal plane, wherein rotation is around the z axis, can be defined as
Figure 15 presents contours of the ensemble-averaged swirling strength in the three wall-parallel measurement planes, . Four distinct longitudinal streaks of pronounced magnitude can be observed in the wake of the crater in all of the planes. The two upper planes offer a clearer picture of the wake structure and insight into its formation (Figure 15b,c). The streaks in the region rotate primarily in a clockwise fashion and the streaks in the region have counterclockwise rotation. Despite having the same rotational sign, streaks on the same side of the crater centerline appear to originate from distinct mechanisms. While the external streak seems to emanate from the rim outer wall, the internal one appears to originate from within the crater, presumably generated by rotational flow induced by separation from the mound.
Figure 15b quantifies the swirling strength of the four counter-rotating intracrater vortices, previously revealed in the mid-plane by mean flow streamlines (see Figure 8d). In the region above the crater, the upstream recirculation regions stretch into elongated streaks of elevated magnitude of (Figure 15c). Closer to the crater floor, in the plane, only the two upstream intracrater vortices are visible (Figure 15a). Taken together, these results suggest that quasi-wall-normal vortices, originating in the upstream portion of the intracrater, are bent into quasi-streamwise structures wrapping around the mound. This 3D arch-shaped structure remains confined within the boundaries of the crater rim. A second 3D arched vortex, with opposite rotational sign, also originates in the downstream portion of the crater due to the presence of the mound. This structure, which also emerges as quasi-vertical and then bends into a quasi-streamwise direction, originates at higher elevation and propagates beyond the crater rim and into the far wake.
Finally, these results offer insights into the link between the near-floor plane (Figure 15a) and the mid-plane (Figure 15b). The positive rotation in the upstream region of the intracrater above the centerline (second quadrant) near the floor wraps around the mound. Some residual positive rotation remains visible in the fourth quadrant (Figure 15a). This pattern suggests that the mound allows the passage of rotational fluid near the crater floor. The rotation reaches the diametrically opposed quadrant and is then amplified, at higher elevations, by the shear separating from the mound which has the same rotational sense.
5. Visualization of Coherent Flow Structures
The turbulent stresses and swirling strength fields presented so far provide a statistical imprint of the distribution of the turbulent vortices that populate the flow. We now consider instantaneous flow fields to identify the nature, scales, and relative locations of individual turbulent vortices. We again turn to swirling strength as a way of identifying instantaneous vortices in the measured flow fields, given its ability to isolate pure rotation in regions of high shear [37]. To aid in identifying larger-scale instantaneous turbulent structures, the instantaneous velocity fields were low-pass filtered using proper orthogonal decomposition (POD). In POD, an optimal set of basis functions are determined that maximize the energy content in the fewest number of modes, with the lowest-order modes being the most energetic and largest in spatial scale, and increasing mode number representing less-energetic and smaller-scale motions. A low-pass filter can be achieved by truncating these modes at a fixed mode number and discarding all remaining modes. As such, reconstruction of velocity fields with the first few POD modes can thus be used to extract and visualize the large-scale motions in the flow [38,39].
Figure 16 presents examples of reconstructed instantaneous flow fields in the wall-normal centerline and laterally offset planes. These results were obtained from POD-filtered velocity fields that embody 50% (left column) and 80% (right column) of the turbulent kinetic energy (TKE). Here, velocity vectors represent the in-plane instantaneous filtered velocity field (only every other vector is plotted to aid visualization) and contours represent the in-plane instantaneous swirling strength, , to aid in vortex identification. The reconstruction of the velocity field with a higher number of modes (higher TKE cutoff) identifies smaller-scale features with larger magnitudes of that are concentrated over smaller regions. It is important to note that, while the identification of smaller-scale features may help with understanding some of the most intricate flow dynamics, these structures likely have second-order effects relative to the larger-scale motions.
In the centerline plane (Figure 16a,b), a trail of vortices, clearly noted as regions of elevated swirling strength magnitude, emanates from the upstream rim. The spacing between the vortices indicates that shedding of these structures occurs in a somewhat periodic fashion. As they move downstream, the vortices become larger and therefore have reduced rotational intensity. The wall-normal position of the vortices varies across the instantaneous velocity fields, indicating that this shear layer may undergo vertical flapping. This mechanism is enhanced downstream of the mound, and in the lee side, presumably due to the interaction between different shear layers. For example, the 80% TKE reconstruction suggests the entrainment of small turbulent vortices into the downstream intracrater region, impinging into the rim wall. In the offset planes, results show that diffusion and flapping are highly increased right after the shedding from the upstream rim, suggesting enhanced momentum exchange around the mound (Figure 16a,b).
Figure 16 and Figure 17 present low-pass filtered instantaneous velocity fields and associated swirling strength in the wall-parallel mid-plane and the plane aloft the rim. These results were obtained from POD-filtered velocity fields that embodied 30% (left column) and 50% (right column) of the TKE, respectively. Vortices with opposite rotational sense (pairs) appear on either side of the crater centerline, (Figure 17a,b). While within the crater vortical pairs have similar streamwise positions, they seem to be offset in the wake, suggesting an alternating shedding mechanism. In the intracrater region, while well-defined recirculation regions appear in the mean flow, the instantaneous flow is marked by multiple vortices (Figure 17a,b). In the upstream portion of the crater, these vortices are concentrated near the inner wall. In the downstream portion of the crater, they are located near the centerline. In the plane (Figure 17c,d), vortices can be seen emanating from the lateral sides of the crater surface and from the mound. The latter seem to form a trail of diffusing vortex pairs in the wake near the centerline. In the example reported in Figure 17c,d, pairs of adjacent vortices of opposite signs appear at , and in a lower swirl magnitude at .
The patches of swirling motion in Figure 16 and Figure 17 are reminiscent of the “vortex-loops” that are found in the wake of a wall-mounted hemisphere [40,41,42]. These structures are occasionally referred to as recirculation arch vortices. The regions of pronounced in the offset wall-normal plane (Figure 16c,d) tend to be closer to the wall and be of lesser magnitude compared to those on the centerline plane. Savory and Toy [41] proposed the location of the lateral free shear layer to be centered at the local maxima of . Contours of (not shown) display four streaks of pronounced magnitude near the same locations as the streaks in Figure 13e.
Now that instantaneous vortices can be identified in this manner, their occurrence and spatial distributions can be assessed in order to gain insight on their dynamics. We limit our focus to the intracrater region within the wall-parallel measurement planes below the crater rim in an attempt to understand the dynamics of the four-cell recirculation pattern identified previously. To this end, a vortex detection algorithm similar to those used by [43,44] was utilized to isolate in-plane vortices and then pinpoint the locations of the associated vortex cores within each low-pass filtered instantaneous velocity field. The fields were calculated using the POD-filtered velocity with a number of modes corresponding to 50% of the TKE. Vortices were defined as regions where , where the root-mean-square velocity is , where the brackets denote ensemble averaging. The threshold value of was chosen based on the value used by Wu and Christensen [36] in their study of prograde and retrograde spanwise vortices in turbulent channel flow. Regions composed of fewer than nine pixels were removed in order to filter out noise in the data. The vortex cores are classified as the locations of the maximum within each region. Once the vortex locations were cataloged, a probability density was calculated based on their spatial distribution.
Figure 18 presents the probability densities of the instantaneous locations of wall-normal vortex cores with positive rotation in the wall-parallel planes at and . These results show that at , counter-clockwise vortices form almost exclusively in the 2nd and 4th quadrants. Most vortex cores are detected in the proximity of the inner wall with a smaller number forming near the mound. Vortices form in a broad range of angular locations, between roughly −45 and 0 in the fourth quadrant and between 90 and 180 in the second quadrant. This result suggests that the locations of the vortices in these quadrants undergo lateral oscillations reminiscent of that reported by Turnow et al. [19] for a dimple. At the plane near the crater floor, , the results show a more intricate scenario. In addition to the second and fourth quadrants, positive vortices also form in the first quadrant. In this latter quadrant, vortex cores appear closer to the mound. These results are consistent with the previous observation in Figure 15a, indicating that the passage of these structures, which leaves an imprint in the mean swirling strength, may represent the bridge between the second and fourth quadrants. This area is associated with reverse flow, which suggests that the wall-normal rotation originates in the fourth quadrant due to flow separation at the mound and is then transferred to the second quadrant through this near-floor passage.
6. Comparison with Realistic Crater Geometry
While the focus of this study is on a specific idealized crater morphology, we conclude by attempting to provide a comparison with a realistic crater geometry. Doing so, especially in a quantitative manner, is difficult because of obvious geometrical differences. It must also be noted that the boundary conditions chosen for the Gale Crater model are arbitrary. In fact, several assumptions must be made when modeling a real crater. For example, the boundary layer thickness must be estimated based on available data. More importantly, the uncertainty on the incoming flow direction is problematic, which is further complicated by the lack of any topographic symmetry. Moreover, the topography upstream of the crater should be faithfully included in the model to produce the most accurate incoming boundary layer. As such, while the crater orientation was chosen following the literature on dominant synoptic winds, the results presented herein are not expected to faithfully reflect the real scenario. Our study was instead meant to be idealized study of a realistic topography.
The geometries of the idealized and Gale Crater models differed in a few key aspects. First, the aspect ratio of the Gale model, defined here as the ratio between its diameter and rim height, was , as opposed to of the idealized crater. Additionally, the location of Gale’s mound was upstream compared to the symmetric geometry of the idealized crater. Finally, the flat surfaces located far upstream and downstream, corresponding respectively to the northern and southern sides, had a difference in elevation. The primary geometric properties of both models are summarized in Table 3.
Figure 19 presents a side-by-side comparison of the mean flow produced by the idealized crater model at the centerline and that of Gale Crater model at a plane roughly cutting through the crater’s center. Despite the obvious topographical differences and the aforementioned lack of symmetry, the two flows in Figure 19 display some common flow features that are worth highlighting. The streamlines indicate that the flow induced by Gale Crater is qualitatively similar to that of the ideal model, as the models exhibit similar topology and share some critical points, though with different spatial locations. For example, Gale’s flow displays three separation points (upstream rim, mound, and downstream rim). However, the strong asymmetry in elevation produces a significantly different flow separation in the upstream crater depression, where a reattachment point and a recirculation region appear. A repelling node resides near the downstream interior surface of Gale Crater, topologically resembling the one discussed for the idealized case. As previously noted, we interpreted this node as the point at which fluid flows from the crater interior to the overlying flow. As such, this point may be the key to understanding the escaping flow paths and the boundary of the erosion region, both of which are important to crater exhumation processes. Finally, both craters exhibit regions of recirculating flow in the crater wake, with Gale’s being smaller but more apparent.
A comparison of the Reynolds stress component distributions between the idealized crater model and the Gale Crater model is shown in Figure 20. Three distinct shear layers are noted in both cases and formed due to the presence of the two rims and the mound. Of particular interest is the impingement of the shear layer into the downstream internal wall of each crater. First, the distance between the mound and the downstream rim is significantly larger for Gale’s model () than for the ideal model (). This contributes to decreased the stresses on the internal wall, which are located downstream of the peak in stress. Additionally, unlike the idealized case which features rather horizontal shear layers, in the case of Gale, the adverse pressure gradient induced by the downstream interior surface causes the shear layers from the mound to veer upwards, further reducing the potentially erosive impact of this shear layer impingement.
In addition, the lower aspect ratio of the Gale Crater model leads to overall lower Reynolds stress magnitudes compared to the idealized case, as the realistic model obstructs the flow to a lesser degree. As such, the color bar limits in Figure 20 have been adjusted accordingly in order to make clearer comparisons. Finally, Gale’s mound protrudes to roughly the same elevation as the downstream rim, similarly to the idealized model where the mound protrudes to an elevation equal to 90% of the rim height. However, due to the low protruding upstream rim, Reynolds stresses in the upstream intracrater region are reduced and the upstream shear layer impinges into the mound at a lower point (Figure 20b) compared to the idealized case. The implication of this behavior on the flow emanating from the mound is that the two shear layers do not have the same degree of interaction, as observed in the idealized case, where results showed an enhancement of the combined turbulence levels. The lower turbulent stresses’ intensity observed for Gale’s model may have been, at least in part, due to this lack of interaction.
7. Discussion
The multi-plane measurement approach used herein has allowed inference as to some of the mechanics and implications of this flow. In particular, the identification of certain flow patterns can help to explain mass and momentum exchange processes across the shear layer, which has implications for heat transfer applications and sediment transport phenomena. Additionally, identification of vortex locations and statistical analysis of the spatial range of occurrence can provide insights into the dynamics of the flow.
7.1. Implications for Mass and Momentum Exchange
Our results suggest that turbulence drives the exchange of fluid across the shear layer by creating preferential mass and momentum exchange paths connecting the intracrater and extracrater flows. We conjecture that the two large spanwise recirculation regions on the sides of the mound entrain fluid from the overlying flow into the crater interior. Fluid enters the crater presumably near the downstream rim, where relatively high levels of vertical mixing are coupled with downward mean flow. The flow acceleration in this region is also likely associated with a pressure unbalance that favors downward flow, similarly to the flow inside a dimple [22]. Entrainment likely occurs periodically following the flapping of the shear layer and the passage of the structures shown in Figure 16d,f. To maintain continuity, the same mass of fluid must be periodically ejected into the overlying flow. Ejection presumably occurs at the crater centerline downstream of the mound, where there exist localized regions of elevated (Figure 11c) and upwardly directed mean flow (Figure 9c).
Figure 9c,d indicates that in the region spanning roughly from to and near , is positive in the centerline plane (Figure 9c) and negative in the offset plane (Figure 9c). This suggests that fluid tends to be entrained from the overlying flow in a spanwise-inward fashion and ejected near the symmetry plane. This explanation is corroborated by the mean spanwise velocity and streamlines in the wall-parallel mid-plane (Figure 10d), which show that the flow tends inwards towards the centerline near the downstream inner rim at . This inwardly concentration of flow (i.e., ) towards the centerline is also found within the recirculation region in the wake of the crater as noted in Figure 10d.
7.2. Implications for Erosion Deposition Patterns
As the present study was performed on fixed crater models with no mobile sediments, no direct conclusions can be drawn as to the morphodynamics implications of these measurements. However, a number of hypotheses can be made based upon similar studies involving deformable craters. Greeley et al. [4,5] performed a number of experimental and numerical studies to understand the morphodynamics of simple craters subjected to unidirectional turbulent winds. Schematics summarizing their primary observations are shown in Figure 21. The arrows in and around the crater in Figure 21a represent the inferred sediment pathways overlaid on the erosion and deposition patterns observed in their work, and Figure 21b presents a conceptual three-dimensional flow model. Some of these qualitative flow patterns are consistent with the mean velocity streamlines in the present results, particularly for the extracrater flow. Large differences are to be expected for the intracrater flow due to the presence of a mound. It should be noted that the of Greeley et al. [4,5] () are an order of magnitude smaller than those studied herein. However, their approach linking flow features to erosion/deposition patterns provides a valuable framework with which to interpret the present results and generate hypotheses on sediment dynamics in the mounded craters considered herein.
In Zone 1 (as it is demarcated in Figure 21a), a small region of deposition is visible at the toe of the crater. Zone 3 is identified as area of high deposition, and Zone 4 is an area of high erosion. The elevated erosion was conjectured by Greeley et al. [4,5] to be caused by a horseshoe vortex that flanks the crater and converges in Zone 4 (as conceptualized in Figure 21b). Lastly, Zone 5 is located in the intracrater region, with elevated levels of deposition on the upstream surface and erosion on the downstream surface. Overall, we expected Zones 1, 3, and 4 as proposed by Greeley et al. [4,5] to be quite similar for the mounded crater considered herein.
Zone 1 was observed by Greeley et al. [5] to be a low-momentum region characterized by the incoming flow separating and reattaching on the upstream surface of the crater ("attachment point" in Figure 21a) and forming a small spanwise flow recirculation. They proposed that deposition was due to reverse flow produced by the recirculation. The present measurements did not identify a similar complex flow topology upstream of the crater. However, the present results suggest that this region remains favorable to deposition since it is associated with low momentum and low Reynolds stresses. Differences in flow patterns, more likely due to the slope of the crater rim employed than to the presence of the mound, have limited sediment transport implications. Likewise, in the lee side of the crater, upstream of the saddle point, increased deposition can be inferred by the triangular sheltered zone characterized by low Reynolds stresses (Figure 11). In this region, corresponding to Zone 3 as defined by Greeley et al. [5], mean reverse inwardly directly flow is indicated by the streamlines and values of the mean velocity components (Figure 10b,d,f).
The far wake of a mounded crater may be quite different from that reported by Greeley et al. [5] and the behavior observed in Zone 4, owing to the interaction arising in the mounded case between the shear layer produced by the mound and that produced by the rim. Multiple streaks of elevated and in-plane Reynolds stresses can be identified in the wall-parallel distributions shown in Figure 13 and Figure 15, respectively. While the lateral streaks, produced by flow separation at the lateral sides of the crater, are common to craters with a devoid of mounds, the central streaks are not. These latter streaks are likely imprints of the shear layers spawned by the mound, as suggested by observation of instantaneous vortices with elevated wall-normal swirling strength emanating from the mound (Figure 17). While the exact morphodynamic implications of these features are unknown at this point, it is reasonable to conjecture that all streaks characterized by elevated Reynolds stresses may be associated with erosional patterns.
Finally, Zone 5 is also likely different due to the mound, which modifies turbulent patterns, and therefore sediment paths. However, many similarities may remain. For example, one of the most compelling conclusions drawn from the present results is that the interior face of the downstream rim of the crater is likely to be a region of erosion, similarly to the simple crater case of Greeley et al. [5]. This conjecture is supported by the elevated Reynolds stresses and turbulence production found in this surface region, likely due to the impingement of the shear layer. First, a localized region of elevated is visible in the wall-normal centerline plane (Figure 11c). In addition, a small localized region of high spanwise Reynolds normal stress, , appears near the downstream rim. The elevated normal stresses in the vertical and lateral directions may be products of the “splatting” effect of flow impinging on the interior rim, in which the flow impinges on the surface and is diverted in opposite directions. In addition to elevated stress levels, there exist elevated values of turbulence production in this region (Figure 14c) as a result of the term, which indicates that the flow impinging into the rim causes large spatial gradients in the spanwise direction in addition to introducing increased levels of turbulence. It is reasonable to expect that, unlike the simple crater case, erosional patterns are extended to the sides of the mound, as suggested by increased Reynolds normal stresses in these areas.
Finally, the upstream interior face of the rim is also believed to be a depositional site, similar to a simple crater. Greeley et al. [5] explained the deposition observed in this area by pointing out the reverse flow induced by the recirculation region illustrated in Figure 21a. In the present case, the formation of similar flow feature is inhibited by the presence of the mound. However, an alternative upward path wrapping around the mound is still formed (see Figure 10a–d). More importantly, this region is characterized by very low turbulent stresses, suggesting that once deposited in this region, sediment is unlikely to be re-mobilized.
7.3. Lateral Oscillation of Intracrater Flow
The offset wall-normal measurement plane presented herein provides insights into the three-dimensional nature of the flow. The mean streamlines within the crater in the plane illustrate a large-scale recirculation region within the crater with clockwise rotation. This feature is reminiscent of the flow reported by Isaev et al. [16] in their study of flow around a spherical dimple. These numerical results identified two large-scale vortex cells that are symmetric about the centerline in the detached zone within the crater. This large region of swirling flow has also been suggested in past studies of sediment transport within and around raised-rim craters [4,5]. Greeley et al. [4,5] suggested that within the crater, sediment on the interior side of the downstream surface is carried by reversed flow and deposited on the interior side of the upstream surface, thereby contributing to erosion and deposition on the downstream and upstream rims, respectively.
Liu and Li [45] and Isaev et al. [16] found multiple characteristic flow structures in numerical simulations of flow over a spherical dimple. Among others, they identified counter-rotating vortices in the offset and centerline wall-normal planes, and symmetric and asymmetric “tornado-like” vortices. These findings indicate there are insights to be gained by examining instantaneous swirling strength in addition to the mean flow statistics, as done herein in Figure 17. Using a vortex tracking algorithm, the spatial distribution of vortices within the intracrater wall-parallel planes was assessed and quantified in probability densities of vortex position in Figure 18. The results show that the intracrater vortices vary considerably in their distribution around the intracrater circumference. In particular, the vortices primarily reside within their respective quadrants in the wall-parallel mid-plane (Figure 18b). In the near-wall plane (Figure 18a), the vortices have more spatial coverage and are often located in quadrants outside of their mean locations.
8. Conclusions
An experimental study of flow responding to mounded craters is presented in this paper. Measurements were performed for an idealized crater geometry and for a scaled model of Gale Crater. High-resolution 2D-PIV measurements of flow within and outside each crater model were conducted by rendering the crater models optically invisible in a refractive-index matched flow environment. Data were acquired in multiple planes to assess the three-dimensionality of the flow and at four based on the crater rim height in the range of .
The mean flow and associated flow topology for an idealized, mounded crater illustrate the complexity and three-dimensionality of the flow structure, revealing significant structural differences from a simple crater without a mound, particularly within the intracrater space. First, the formation of the spanwise monocore recirculation region observed by Greeley et al. [4] in simple craters is partially prevented in mounded craters by the presence of the mound. Measurements show, instead, a more complex structure where flow in the regions upstream and downstream of the mound presents unique topological features. The offset planes indicate that a portion of the monocore cell exists on the side of the mound. Finally, wall-parallel measurements showed that the two large recirculating cells with quasi-vertical axes are replaced by a more complex structure in which the flow varies dramatically in the vertical direction. Perhaps the most interesting feature was found at the mid-plane and was represented by four counter-rotating recirculating regions that were offset from the centerline in the spanwise direction. Taken together, these results suggest that the mound obstructs the near-floor reverse flow typical of spherical depressions and induces a lateral deflection that results in a distinctive four-cell structure.
Unlike dimples and rimless craters, where vertical mass exchange is mostly induced by turbulent mixing along the shear layer, topographic effects of the protruding rim and mound for the cases examined herein resulted in enhanced and more complex vertical mass fluxes. Turbulence statistics indicated that flow separation processes play a key role in the exchange of momentum and kinetic energy. Separation occurs at multiple locations, resulting in a turbulent mixing layer that is the result of a series of interactions and merging processes between independent shear layers. This is particularly true at the crater, centerline where the shear layer, originally separating at the upstream rim, undergoes a series of interactions: it first interacts with the flow separated at the mound; subsequently, the merged shear layer impinges on the interior of the downstream crater wall and eventually interacts with the flow emanating from the downstream rim. Consistently with the case of a simple crater, localized regions of elevated turbulent stresses were found on the interior face of the downstream crater wall, both at the centerline and at lateral locations. These observations suggest an extended area of potential erosional activity caused by the shear layer impinging onto this wall. Finally, distributions of Reynolds stresses in the wake of the crater showed longitudinal streaks of elevated magnitude that suggested independent trains of vortices emanating from the side of crater and from the mound. The former is consistent with the horseshoe structure suggested by Greeley et al. [4] for simple raised-rim craters and was presumably responsible for the bilobate erosion patterns observed in their experiments. The implications of the streaks near the centerline, which extended further downstream, are unknown and will require additional investigation.
Analysis of the instantaneous flow fields via POD filtering allowed examination of the the shear layer and allowed us to identify the most energetic turbulent structures. These structures were responsible for most of the transport of momentum, which has implications for relevant phenomena such as transport of sediments and heat. Examples of instantaneous swirling strength fields showcased the spanwise vortices that populate the shear layers. Instantaneous swirling strength fields displayed a periodic trail of vortices, suggesting a consistent shedding mechanism from the upstream crater rim. The results indicated intense vertical flapping of the shear layer associated with vortices emanating from the mound. These vortices traveled along slightly different trajectories. While some vortices convected above the rim, others advected downward towards the interior wall of the crater, transferring their energy into the solid surface and thus presumably driving erosion in this area. Additionally, within the crater rim, probability densities of wall-normal vortex core locations at the mid-plane, identified via conditional averaging analysis, showed that the two pairs of intracrater vortices exhibited lateral oscillations within their respective quadrants, suggesting the occurrence of a low-frequency oscillating mechanism reminiscent of that observed in dimple depressions. The same analysis near the crater floor provided insights into the link between the circulation patterns at different elevations. The results suggested the existence of a path along which rotational fluids from opposite quadrants were transferred. This path, visible at the lower plane, wrapped around the mound, and was associated with a region of reverse flow suggesting that, for example, for , the wall-normal rotation originated in the fourth quadrant due to flow separation at the mound and was then transferred to the second quadrant through this near-floor passage.
Finally, experiments were performed on a Gale Crater model to clarify how well the observations from the idealized crater measurements reflect the flow around a realistic crater geometry. The primary flow features in the Gale Crater model closely resembled those of the idealized crater model, including the presence of two critical points within the crater in the form of a focus and a node. Additionally, turbulence statistics revealed that the flow over the Gale model exhibits a similar dynamic of three distinct co-interacting shear layers that are formed due to the presence of the mound, the upstream rim, and the downstream rim. As such, the idealized geometry is a useful analogue to geometries based on real impact craters and can be effectively used to understand the basic mechanics of the flow.
As highlighted in previous studies [46], the crater rim protrusion, the depth of the crater floor, and the height and diameter of the mound are key geometrical parameters that can significantly modify the flow around and within a crater. As such, the results reported herein are directly tied to the specific topographies considered and cannot be extended to craters with different geometries. However, crater idealizations facilitate parametric studies in which the effects of each parameter can be isolated and observed within a representative range of variability. Such an approach would provide insights into the mechanistic behavior of these flows and their dependence on geometry and classification criteria based on topographic metrics.
Author Contributions
D.G., G.B. and K.T.C. have equally contributed to the development of the present paper, including the conceptualization, methodology, data acquisition and analysis, interpretation of the results, and manuscript preparation. All authors have read and agreed to the published version of the manuscript.
Funding
This research received no external funding.
Conflicts of Interest
The authors declare no conflict of interest.
References
- Malin, M.C.; Edgett, K.S. Sedimentary rocks of early Mars. Science 2000, 290, 1927–1937. [Google Scholar] [CrossRef] [PubMed]
- Squyres, S.W.; Arvidson, R.E.; Bell, J.; Calef, F.; Clark, B.; Cohen, B.; Crumpler, L.; De Souza, P.; Farrand, W.; Gellert, R.; et al. Ancient impact and aqueous processes at Endeavour Crater, Mars. Science 2012, 336, 570–576. [Google Scholar] [CrossRef] [PubMed] [Green Version]
- Wray, J.J. Gale crater: The Mars Science Laboratory/Curiosity rover landing site. Int. J. Astrobiol. 2013, 12, 25–38. [Google Scholar] [CrossRef] [Green Version]
- Greeley, R.; Iversen, J.D.; Pollack, J.B.; Udovich, N.; White, B. Wind Tunnel Simulations of Light and Dark Streaks on Mars. Science 1974, 183, 847–849. [Google Scholar] [CrossRef]
- Greeley, R.; Iversen, J.; Pollack, J.; Udovich, N.; White, B. Wind tunnel studies of Martian aeolian processes. Proc. R. Soc. Lond. A Math. Phys. Sci. 1974, 341, 331–360. [Google Scholar]
- Bennett, K.A.; Bell, J.F., III. A global survey of Martian central mounds: Central mounds as remnants of previously more extensive large-scale sedimentary deposits. Icarus 2016, 264, 331–341. [Google Scholar] [CrossRef]
- Grotzinger, J.; Gupta, S.; Malin, M.; Rubin, D.; Schieber, J.; Siebach, K.; Sumner, D.; Stack, K.; Vasavada, A.; Arvidson, R.; et al. Deposition, exhumation, and paleoclimate of an ancient lake deposit, Gale crater, Mars. Science 2015, 350. [Google Scholar] [CrossRef]
- Williams, R.M.; Grotzinger, J.P.; Dietrich, W.; Gupta, S.; Sumner, D.; Wiens, R.; Mangold, N.; Malin, M.; Edgett, K.; Maurice, S.; et al. Martian fluvial conglomerates at Gale crater. Science 2013, 340, 1068–1072. [Google Scholar] [CrossRef]
- Kite, E.S.; Lewis, K.W.; Lamb, M.P.; Newman, C.E.; Richardson, M.I. Growth and form of the mound in Gale Crater, Mars: Slope wind enhanced erosion and transport. Geology 2013, 41, 543–546. [Google Scholar] [CrossRef]
- Day, M.; Anderson, W.; Kocurek, G.; Mohrig, D. Carving intracrater layered deposits with wind on Mars. Geophys. Res. Lett. 2016, 43, 2473–2479. [Google Scholar] [CrossRef]
- Anderson, W.; Day, M. Turbulent flow over craters on Mars: Vorticity dynamics reveal aeolian excavation mechanism. Phys. Rev. E 2017, 96, 043110. [Google Scholar] [CrossRef]
- Day, M.; Kocurek, G. Observations of an aeolian landscape: From surface to orbit in Gale Crater. Icarus 2016, 280, 37–71. [Google Scholar] [CrossRef] [Green Version]
- Fonseca, R.M.; Zorzano-Mier, M.P.; Martín-Torres, J. Planetary boundary layer and circulation dynamics at Gale Crater, Mars. Icarus 2018, 302, 537–559. [Google Scholar] [CrossRef]
- Rafkin, S.C.; Pla-Garcia, J.; Kahre, M.; Gomez-Elvira, J.; Hamilton, V.E.; Marín, M.; Navarro, S.; Torres, J.; Vasavada, A. The meteorology of Gale Crater as determined from Rover Environmental Monitoring Station observations and numerical modeling. Part II: Interpretation. Icarus 2016, 280, 114–138. [Google Scholar] [CrossRef]
- Tyler, D., Jr.; Barnes, J. Mesoscale modeling of the circulation in the Gale Crater region: An investigation into the complex forcing of convective boundary layer depths. Int. J. Mars Sci. Explor. 2013, 8, 58–77. [Google Scholar]
- Isaev, S.; Leont’ev, A.; Frolov, D.; Kharchenko, V. Identification of self-organizing structures by the numerical simulation of laminar three-dimensional flow around a crater on a plane by a flow of viscous incompressible fluid. Tech. Phys. Lett. 1998, 24, 209–211. [Google Scholar] [CrossRef]
- Terekhov, V.I.; Kalinina, S.; Mshvidobadze, Y.M. Heat transfer coefficient and aerodynamic resistance on a surface with a single dimple. J. Enhanc. Heat Transf. 1997, 4, 131–145. [Google Scholar] [CrossRef]
- Ligrani, P.; Harrison, J.; Mahmmod, G.; Hill, M. Flow structure due to dimple depressions on a channel surface. Phys. Fluids 2001, 13, 3442–3451. [Google Scholar] [CrossRef]
- Turnow, J.; Kornev, N.; Isaev, S.; Hassel, E. Vortex mechanism of heat transfer enhancement in a channel with spherical and oval dimples. Heat Mass Transf. 2011, 47, 301–313. [Google Scholar] [CrossRef]
- Won, S.Y.; Zhang, Q.; Ligrani, P.M. Comparisons of flow structure above dimpled surfaces with different dimple depths in a channel. Phys. Fluids 2005, 17, 045105. [Google Scholar] [CrossRef]
- Van Nesselrooij, M.; Veldhuis, L.; Van Oudheusden, B.; Schrijer, F. Drag reduction by means of dimpled surfaces in turbulent boundary layers. Exp. Fluids 2016, 57, 1–14. [Google Scholar] [CrossRef]
- Zhou, W.; Rao, Y.; Hu, H. An experimental investigation on the characteristics of turbulent boundary layer flows over a dimpled surface. J. Fluids Eng. 2016, 138. [Google Scholar] [CrossRef]
- Blois, G.; Bristow, N.; Kim, T.; Best, J.; Christensen, K. Novel Environment Enables PIV Measurements of Turbulent Flow around and within Complex Topographies. J. Hydraul. Eng. 2020, 146, 04020033. [Google Scholar] [CrossRef]
- Adrian, R.J.; Westerweel, J. Particle Image Velocimetry; Number 30; Cambridge University Press: Cambridge, UK, 2011. [Google Scholar]
- Jaumann, R.; Neukum, G.; Behnke, T.; Duxbury, T.C.; Eichentopf, K.; Flohrer, J.; Gasselt, S.; Giese, B.; Gwinner, K.; Hauber, E.; et al. The high-resolution stereo camera (HRSC) experiment on Mars Express: Instrument aspects and experiment conduct from interplanetary cruise through the nominal mission. Planet. Space Sci. 2007, 55, 928–952. [Google Scholar] [CrossRef]
- Westerweel, J.; Scarano, F. Universal outlier detection for PIV data. Exp. Fluids 2005, 39, 1096–1100. [Google Scholar] [CrossRef]
- Chauhan, K.A.; Monkewitz, P.A.; Nagib, H.M. Criteria for assessing experiments in zero pressure gradient boundary layers. Fluid Dyn. Res. 2009, 41, 021404. [Google Scholar] [CrossRef]
- Marusic, I.; Monty, J.P.; Hultmark, M.; Smits, A.J. On the logarithmic region in wall turbulence. J. Fluid Mech. 2013, 716, R3. [Google Scholar] [CrossRef] [Green Version]
- Chong, M.S.; Perry, A.E.; Cantwell, B.J. A general classification of three-dimensional flow fields. Phys. Fluids A Fluid Dyn. 1990, 2, 765–777. [Google Scholar] [CrossRef]
- Blois, G.; Best, J.L.; Sambrook Smith, G.H.; Hardy, R.J. Effect of bed permeability and hyporheic flow on turbulent flow over bed forms. Geophys. Res. Lett. 2014, 41, 6435–6442. [Google Scholar] [CrossRef] [Green Version]
- Bristow, N.; Blois, G.; Best, J.; Christensen, K. Cross-plane Stereo-PIV measurements in a refractive index matched flume of to elucidate the turbulent flow structure over 3D bedforms. In Proceedings of the APS Meeting Abstracts, Denver, CO, USA, 19–21 November 2017. [Google Scholar]
- Buckles, J.; Hanratty, T.J.; Adrian, R.J. Turbulent flow over large-amplitude wavy surfaces. J. Fluid Mech. 1984, 140, 27–44. [Google Scholar] [CrossRef]
- Jackson, P.; Hunt, J. Turbulent wind flow over a low hill. Q. J. R. Meteorol. Soc. 1975, 101, 929–955. [Google Scholar] [CrossRef]
- Pope, S.B. Turbulent Flows; Cambridge University Press: Cambridge, UK, 2000. [Google Scholar]
- Tennekes, H.; Lumley, J.L. A First Course in Turbulence; MIT Press: Cambridge, MA, USA, 2018. [Google Scholar]
- Wu, Y.; Christensen, K. Population trends of spanwise vortices in wall turbulence. J. Fluid Mech. 2006, 568, 55–76. [Google Scholar] [CrossRef] [Green Version]
- Zhou, J.; Adrian, R.J.; Balachandar, S.; Kendall, T. Mechanisms for generating coherent packets of hairpin vortices in channel flow. J. Fluid Mech. 1999, 387, 353–396. [Google Scholar] [CrossRef]
- Berkooz, G.; Holmes, P.; Lumley, J.L. The proper orthogonal decomposition in the analysis of turbulent flows. Annu. Rev. Fluid Mech. 1993, 25, 539–575. [Google Scholar] [CrossRef]
- Sirovich, L. Turbulence and the dynamics of coherent structures. I. Coherent structures. Q. Appl. Math. 1987, 45, 561–571. [Google Scholar] [CrossRef] [Green Version]
- Savory, E.; Toy, N. Hemisphere and hemisphere-cylinders in turbulent boundary layers. J. Wind Eng. Ind. Aerodyn. 1986, 23, 345–364. [Google Scholar] [CrossRef]
- Savory, E.; Toy, N. The separated shear layers associated with hemispherical bodies in turbulent boundary layers. J. Wind Eng. Ind. Aerodyn. 1988, 28, 291–300. [Google Scholar] [CrossRef]
- Acarlar, M.; Smith, C. A study of hairpin vortices in a laminar boundary layer. Part 1. Hairpin vortices generated by a hemisphere protuberance. J. Fluid Mech. 1987, 175, 1–41. [Google Scholar] [CrossRef]
- Ganapathisubramani, B.; Longmire, E.K.; Marusic, I. Experimental investigation of vortex properties in a turbulent boundary layer. Phys. Fluids 2006, 18, 055105. [Google Scholar] [CrossRef] [Green Version]
- Gao, Q.; Ortiz-Duenas, C.; Longmire, E. Analysis of vortex populations in turbulent wall-bounded flows. J. Fluid Mech. 2011, 678, 87. [Google Scholar] [CrossRef]
- Liu, J.; Li, J. Numerical prediction of flow structure and heat enhancement with different dimple depth. Appl. Mech. Mater. 2014, 574, 147. [Google Scholar] [CrossRef]
- Steele, L.J.; Kite, E.S.; Michaels, T.I. Crater mound formation by wind erosion on Mars. J. Geophys. Res. Planets 2018, 123, 113–130. [Google Scholar] [CrossRef] [Green Version]
Figure 1.
Perspective views of the imaging setup used for the (a) wall-normal and (b) wall-parallel PIV measurements.
Figure 1.
Perspective views of the imaging setup used for the (a) wall-normal and (b) wall-parallel PIV measurements.

Figure 2.
Photos of the realistic crater model (a) immersed in air and (b) partially immersed in an NaI solution. The dashed line in (b) demarcates the air–fluid interface.
Figure 2.
Photos of the realistic crater model (a) immersed in air and (b) partially immersed in an NaI solution. The dashed line in (b) demarcates the air–fluid interface.

Figure 3.
Elevation maps of (a) the idealized crater model and (b) the Gale Crater model. (c,d) Isometric views of the idealized and Gale Crater models, respectively. Solid red lines demarcate the intersections of the wall-parallel PIV measurement planes with the surface, and the blue lines identify the spanwise positions of the wall-normal PIV measurement plane locations. H is the model elevation, corresponding to the rim height.

Figure 4.
Profiles of the incoming mean streamwise velocity scaled in inner units, , for four different . The red dashed line is the log law curve, , with and [27]. The vertical arrows demarcate the outer edges of the log layers for the correspondingly colored profiles, whereas the green vertical line demarcates the inner boundary of the log layer at .

Figure 5.
Profiles of normalized mean velocity components along the crater centerline for four different . Data are normalized by the free-stream velocity, . (a) A reference of the streamwise locations of the profiles. The four streamwise locations from which data were extracted: (i) −1, (ii) 1, (iii) 3.3, and (iv) 6; (b) streamwise component, ; (c) wall-normal component, . The horizontal dashed lines in (b,c) demarcate the elevations of the model’s surface at the corresponding profile locations.

Figure 6.
Normalized profiles of Reynolds stresses along the crater centerline for four different . (a) A reference for the streamwise locations of the profiles; (b) streamwise stresses, ; (c) wall-normal stresses, ; (d) shear stresses, . The horizontal dashed lines in (b,c) demarcate the elevations of the model’s surface at the corresponding profile locations.

Figure 7.
Spanwise profiles of normalized mean velocity components at the top plane () for four different . Data are normalized by the free-stream velocity, . (a) A reference for the streamwise locations of the profiles showing the four streamwise locations from which data were extracted: (b) streamwise component, ; (c) spanwise component, .
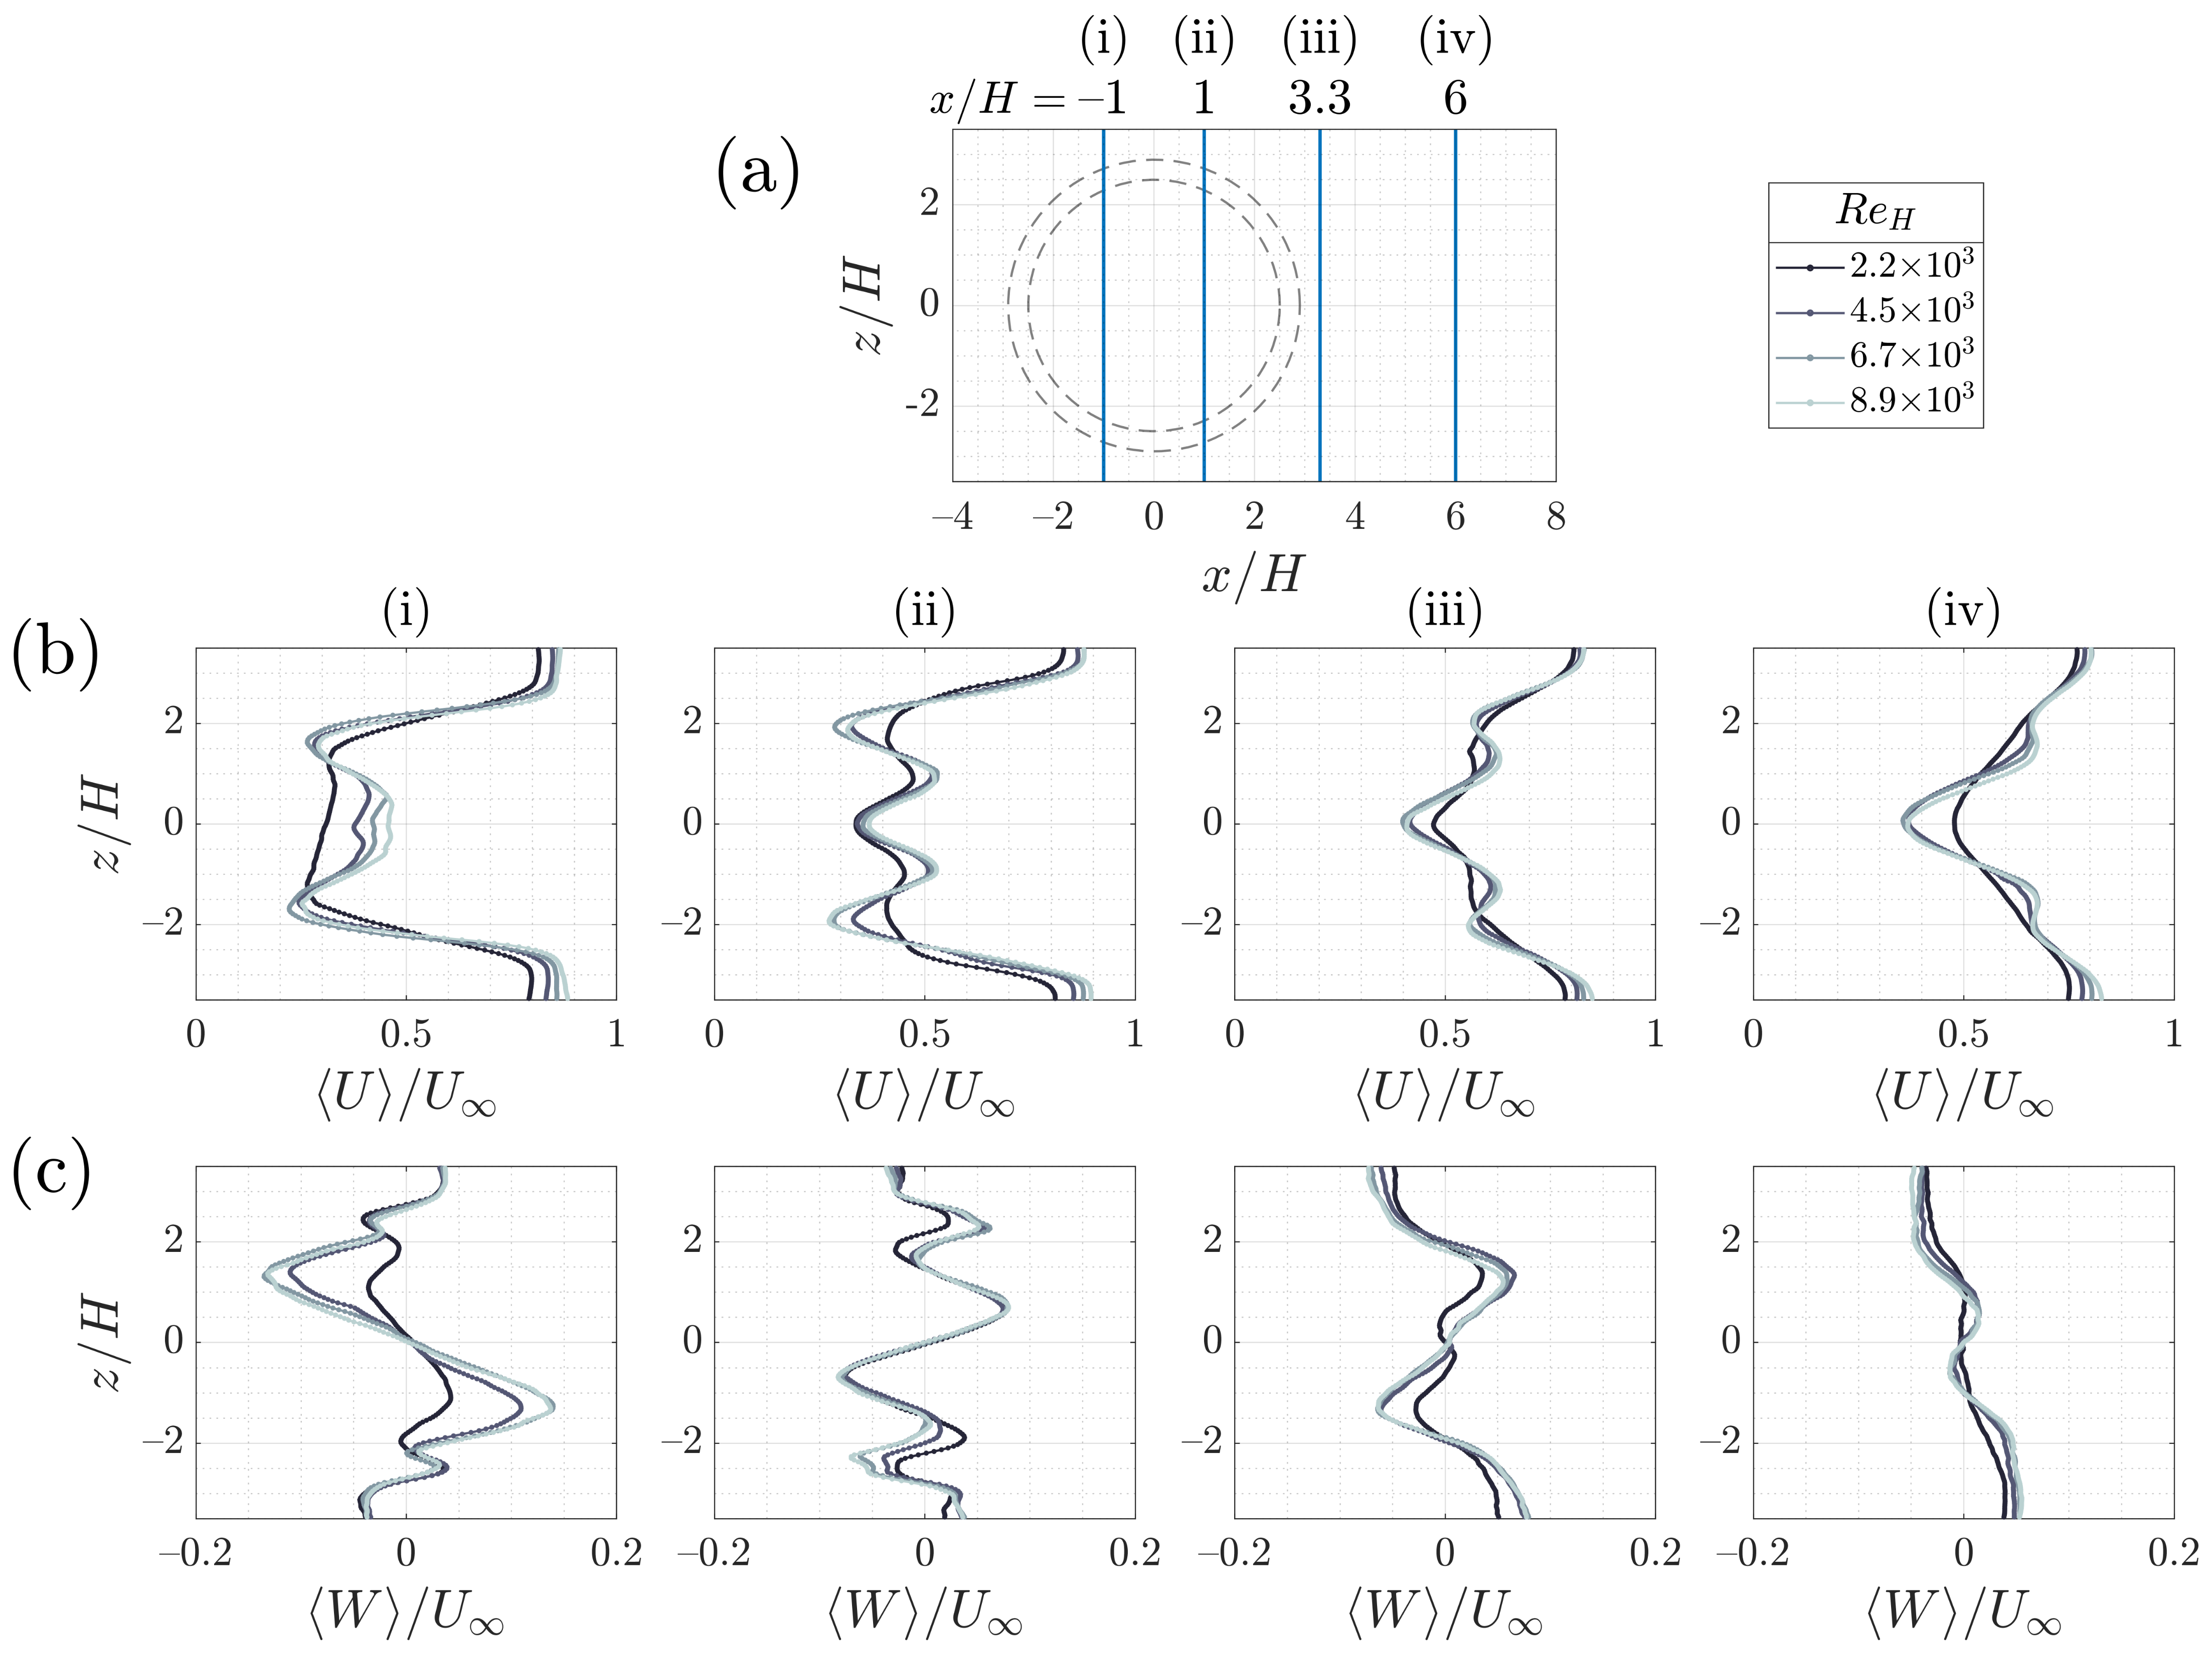
Figure 8.
Mean streamlines and distribution of critical points (i.e., ) in different measurement planes calculated using the Chong et al. [29] formulation. (a,b) Streamwise wall-normal planes; (c,d) streamwise wall-parallel planes; (a) centerline plane, ; (b) offset plane, ; (c) top-plane, (the location of the crater rim is indicated by the dashed lines for reference); (d) mid-plane, ; and (e) bottom-plane plane, . .

Figure 9.
Contours of in-plane mean: (a,b) streamwise, , and (c,d) wall-normal, , velocity normalized by free-stream velocity in the (a,c) centerline, , and (b,d) offset, , planes. Mean streamlines are overlaid. .
Figure 9.
Contours of in-plane mean: (a,b) streamwise, , and (c,d) wall-normal, , velocity normalized by free-stream velocity in the (a,c) centerline, , and (b,d) offset, , planes. Mean streamlines are overlaid. .
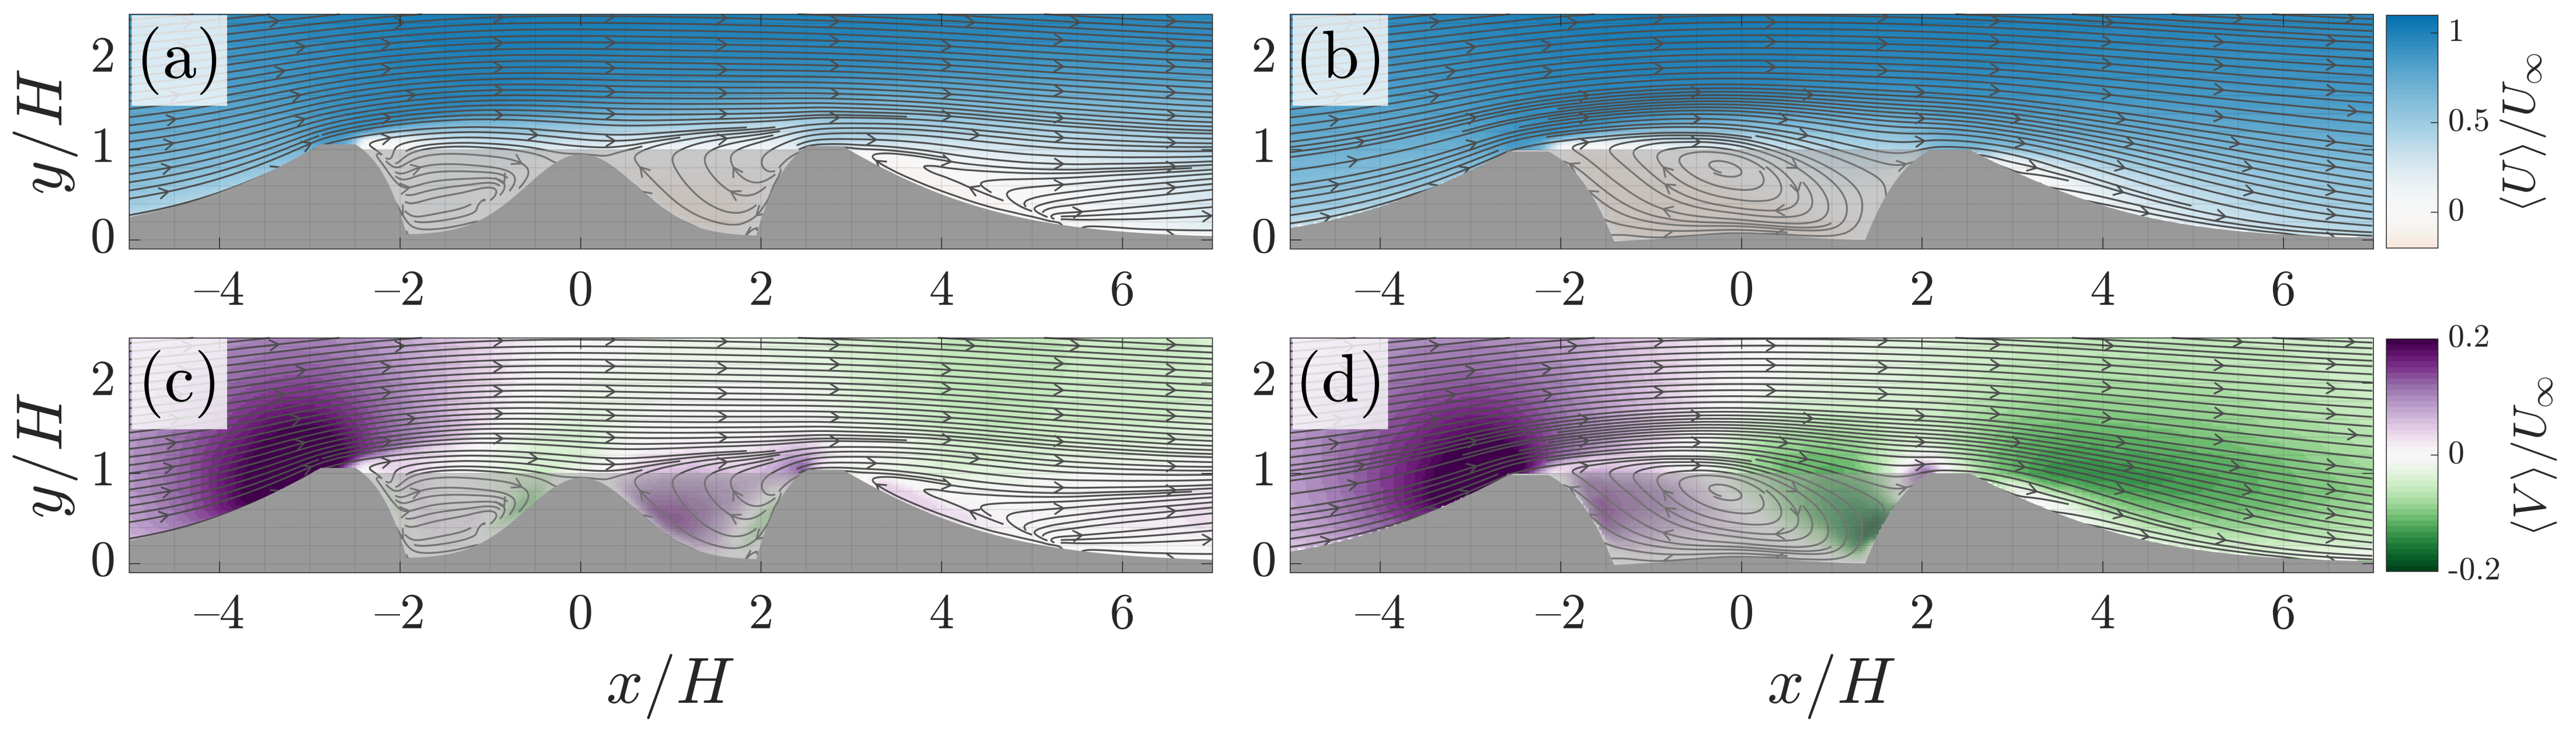
Figure 10.
Contours of normalized (left) and (right) on the wall-parallel measurement planes located at (a,b) , (c,d) , and (e,f) . The location of the crater rim is indicated by the dashed lines for reference. .
Figure 10.
Contours of normalized (left) and (right) on the wall-parallel measurement planes located at (a,b) , (c,d) , and (e,f) . The location of the crater rim is indicated by the dashed lines for reference. .

Figure 11.
Contours of Reynolds stresses normalized by at the centerline plane (left column) and offset plane (right column). (a,b) , (c,d) , and (e,f) . .
Figure 11.
Contours of Reynolds stresses normalized by at the centerline plane (left column) and offset plane (right column). (a,b) , (c,d) , and (e,f) . .

Figure 12.
(a) A schematic of the crater rim profile at the two spanwise locations showing the reference of the streamwise positions of the profiles. (blue) Centerline plane, ; (red) offset plane, . (b–d) Vertical profiles of Reynolds stresses normalized by at the streamwise locations at (i) −1, (ii) 1, (iii) 3.3, and (iv) 6. (b) , (c) , and (d) . The dashed lines in (b–d) demarcate the locations of the model’s surface. .

Figure 13.
Contours of normalized (a,b) , (c,d) , and (e,f) in the wall-parallel measurement planes at (a,c,e) and (b,d,f) . The dashed circles demarcate the location of the crater rim. .
Figure 13.
Contours of normalized (a,b) , (c,d) , and (e,f) in the wall-parallel measurement planes at (a,c,e) and (b,d,f) . The dashed circles demarcate the location of the crater rim. .
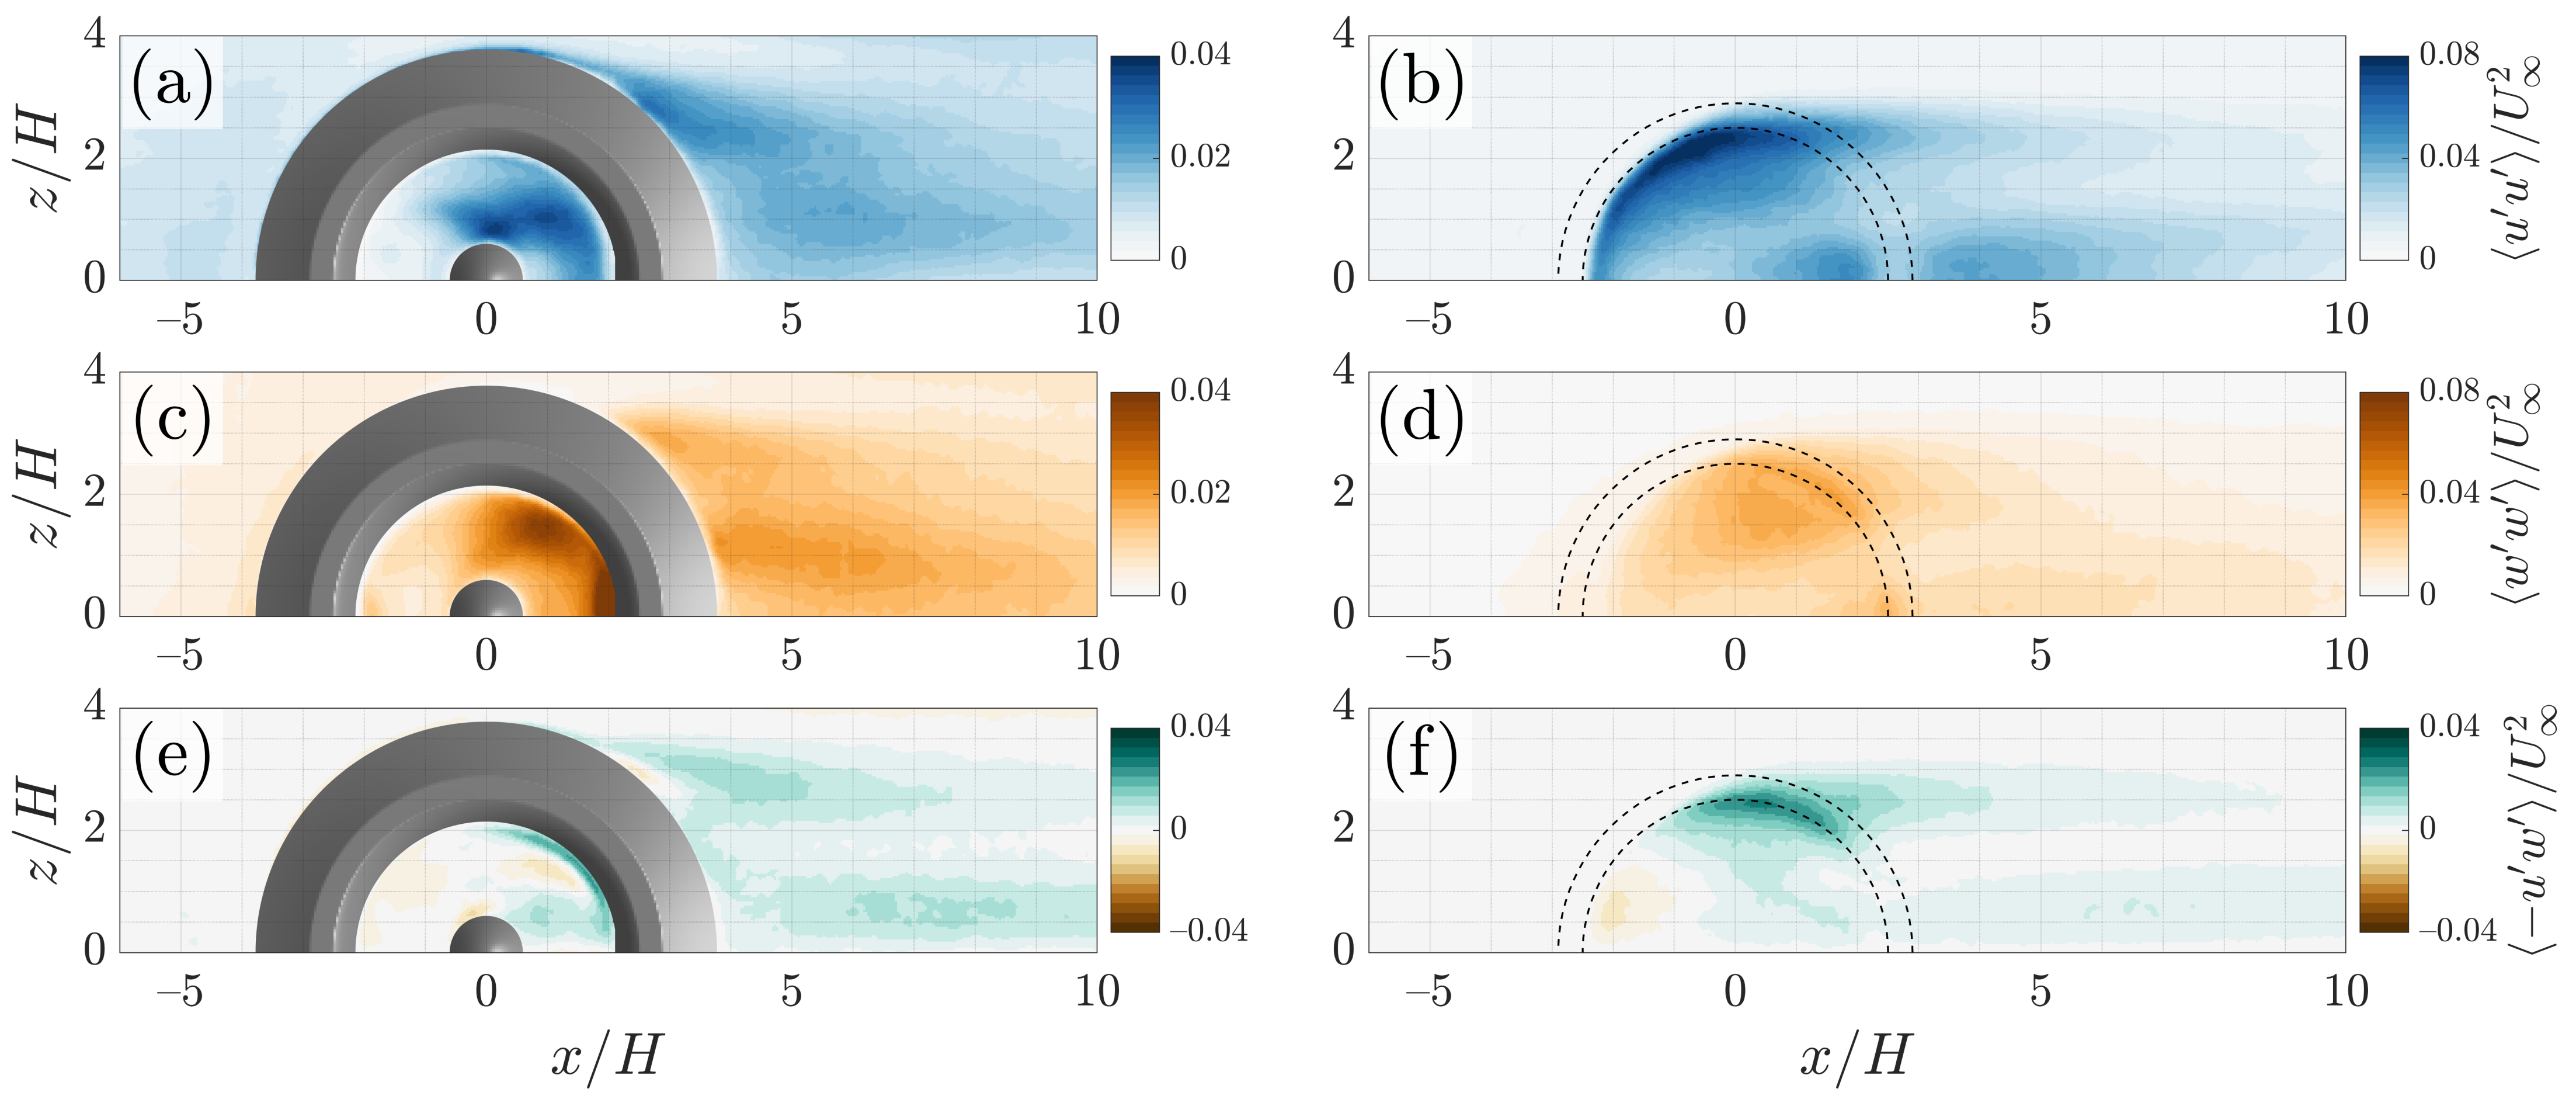
Figure 14.
Turbulence production P in the wall-normal measurement planes at (a) and (b) , and the wall-parallel planes at (c) and (d) . Values of P are normalized by . .
Figure 14.
Turbulence production P in the wall-normal measurement planes at (a) and (b) , and the wall-parallel planes at (c) and (d) . Values of P are normalized by . .

Figure 15.
Mean swirling strength in the wall-parallel measurement planes located at (a) , (b) , and (c) . .
Figure 15.
Mean swirling strength in the wall-parallel measurement planes located at (a) , (b) , and (c) . .

Figure 16.
Contours of representative instantaneous spanwise swirling strength, , for the high-speed case in the (a,b) centerline wall-normal measurement plane and (c,d) spanwise offset wall-normal measurement plane. The fields were reconstructed with numbers of modes corresponding to 50% (left column) and 80% (right column) of the total kinetic energy. Vectors show the corresponding fluctuating velocity components and at every other grid point. .

Figure 17.
Contours of representative instantaneous wall-normal swirling strength, , in the wall-parallel measurement planes located at (a,b) and (c,d) . The fields were reconstructed with numbers of modes corresponding to 30% (left column) and 50% (right column) of the TKE. Vectors show the corresponding fluctuating velocity components and at every other grid point. .

Figure 18.
Probability density functions of wall-normal vortex core locations in the wall-parallel measurement planes located at (a) and (b) . Only wall-normal vortices with positive rotation are counted. .
Figure 18.
Probability density functions of wall-normal vortex core locations in the wall-parallel measurement planes located at (a) and (b) . Only wall-normal vortices with positive rotation are counted. .

Figure 19.
Contours of the in-plane mean streamwise velocity normalized by free-stream velocity for the (a) idealized crater model () and (b) Gale Crater model (). Critical points are also shown in a similar manner as Figure 8.
Figure 19.
Contours of the in-plane mean streamwise velocity normalized by free-stream velocity for the (a) idealized crater model () and (b) Gale Crater model (). Critical points are also shown in a similar manner as Figure 8.

Figure 20.
Contours of normalized Reynolds stress components in the idealized (left) and Gale Crater models (right). (a,b) , (c,d) , and (e,f) .
Figure 20.
Contours of normalized Reynolds stress components in the idealized (left) and Gale Crater models (right). (a,b) , (c,d) , and (e,f) .
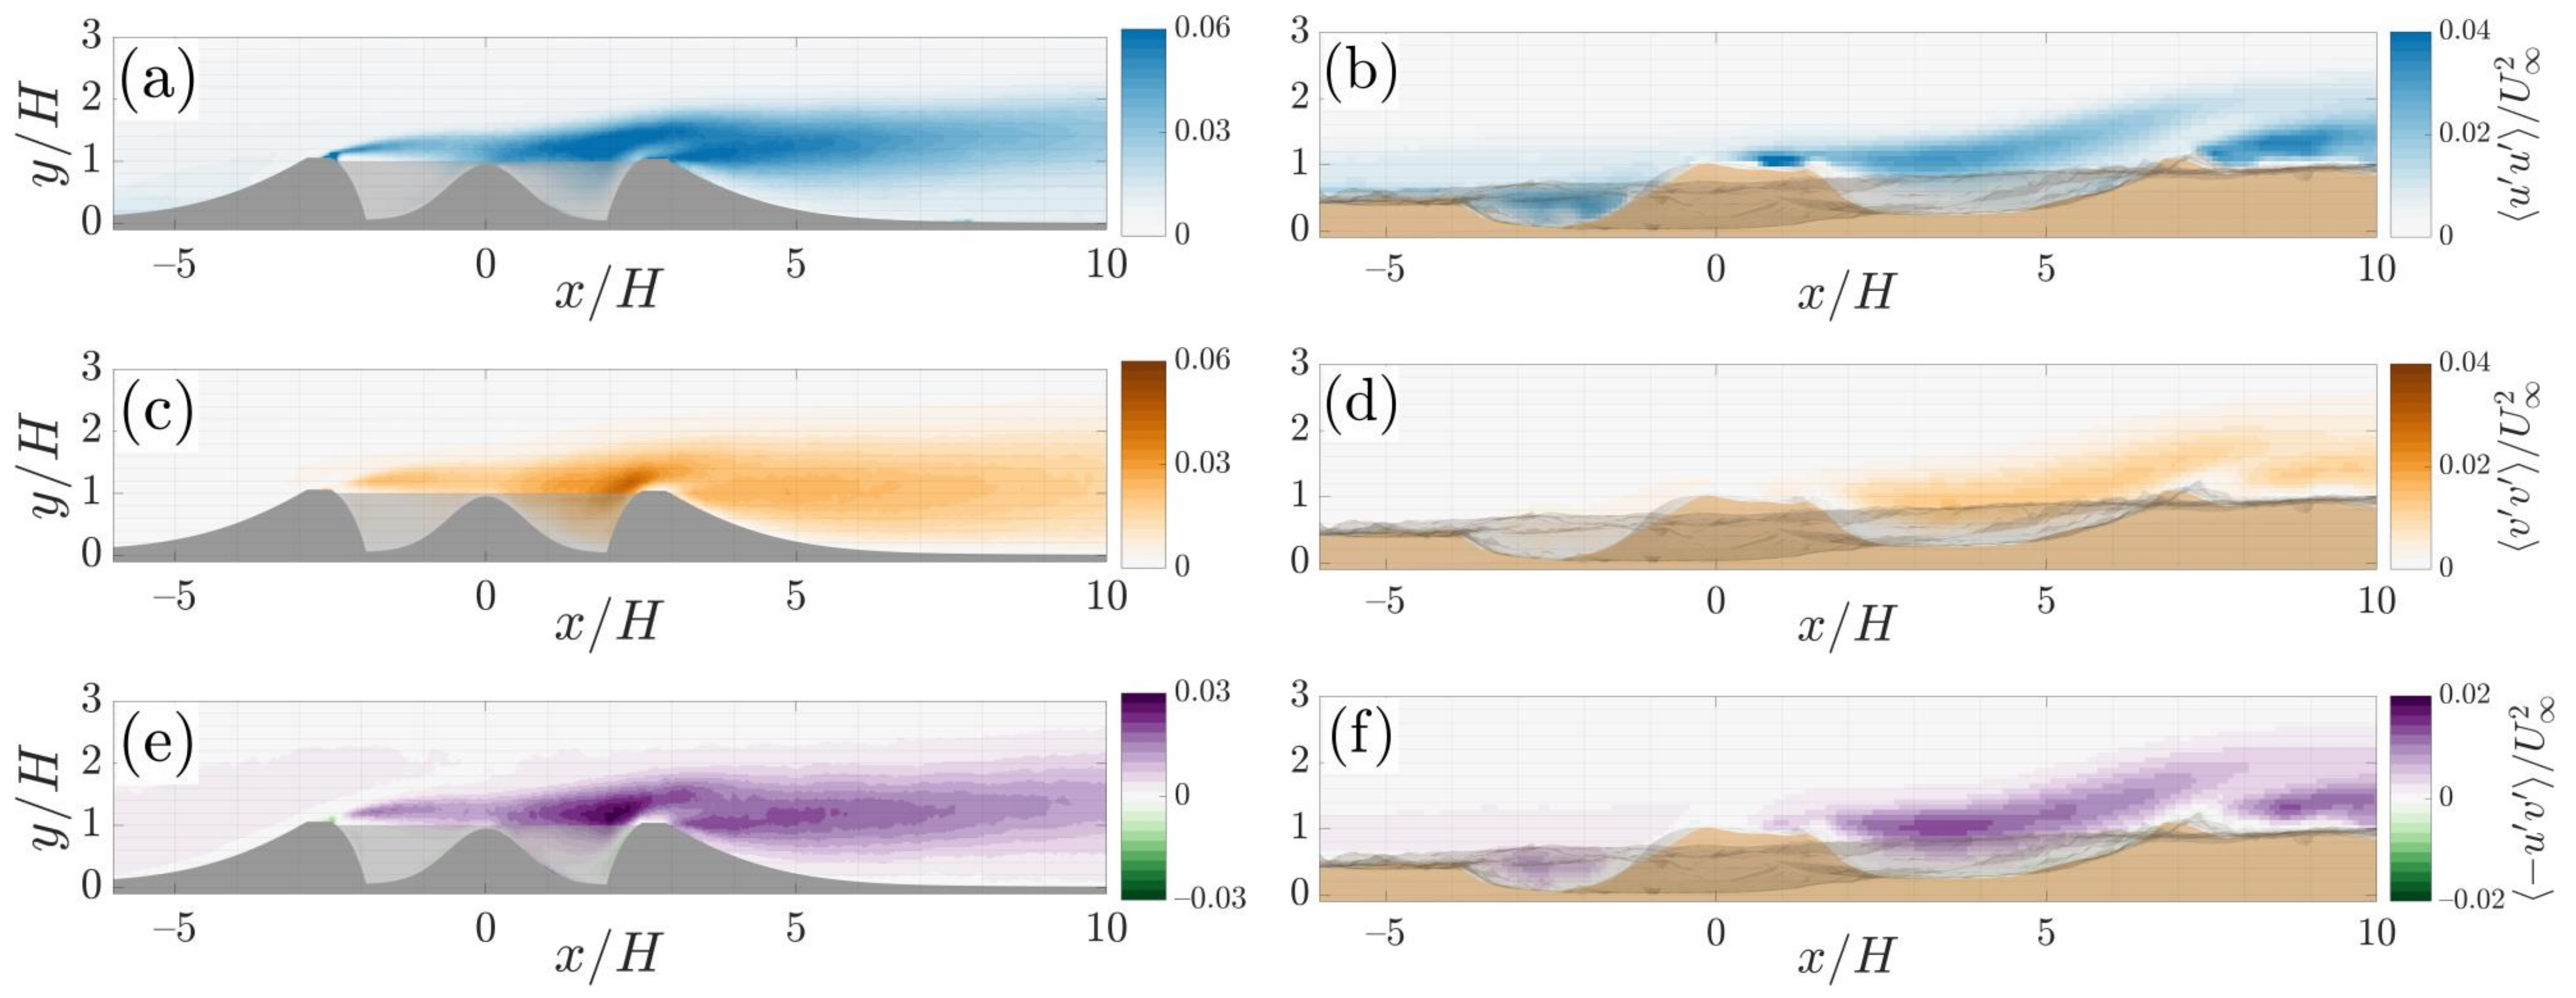
Figure 21.
(a) Schematic of the direction of sediment movement in and around a raised rim crater [5] (Reproduced with permission from Proceedings of the Royal Society of London. Series A, Mathematical and Physical Sciences, 1974); and (b) the proposed flow field over a raised-rim crater, showing the horseshoe vortex and zones of relative erosion and deposition [4] (Reproduced with permission from Proceedings of Science, 1974).


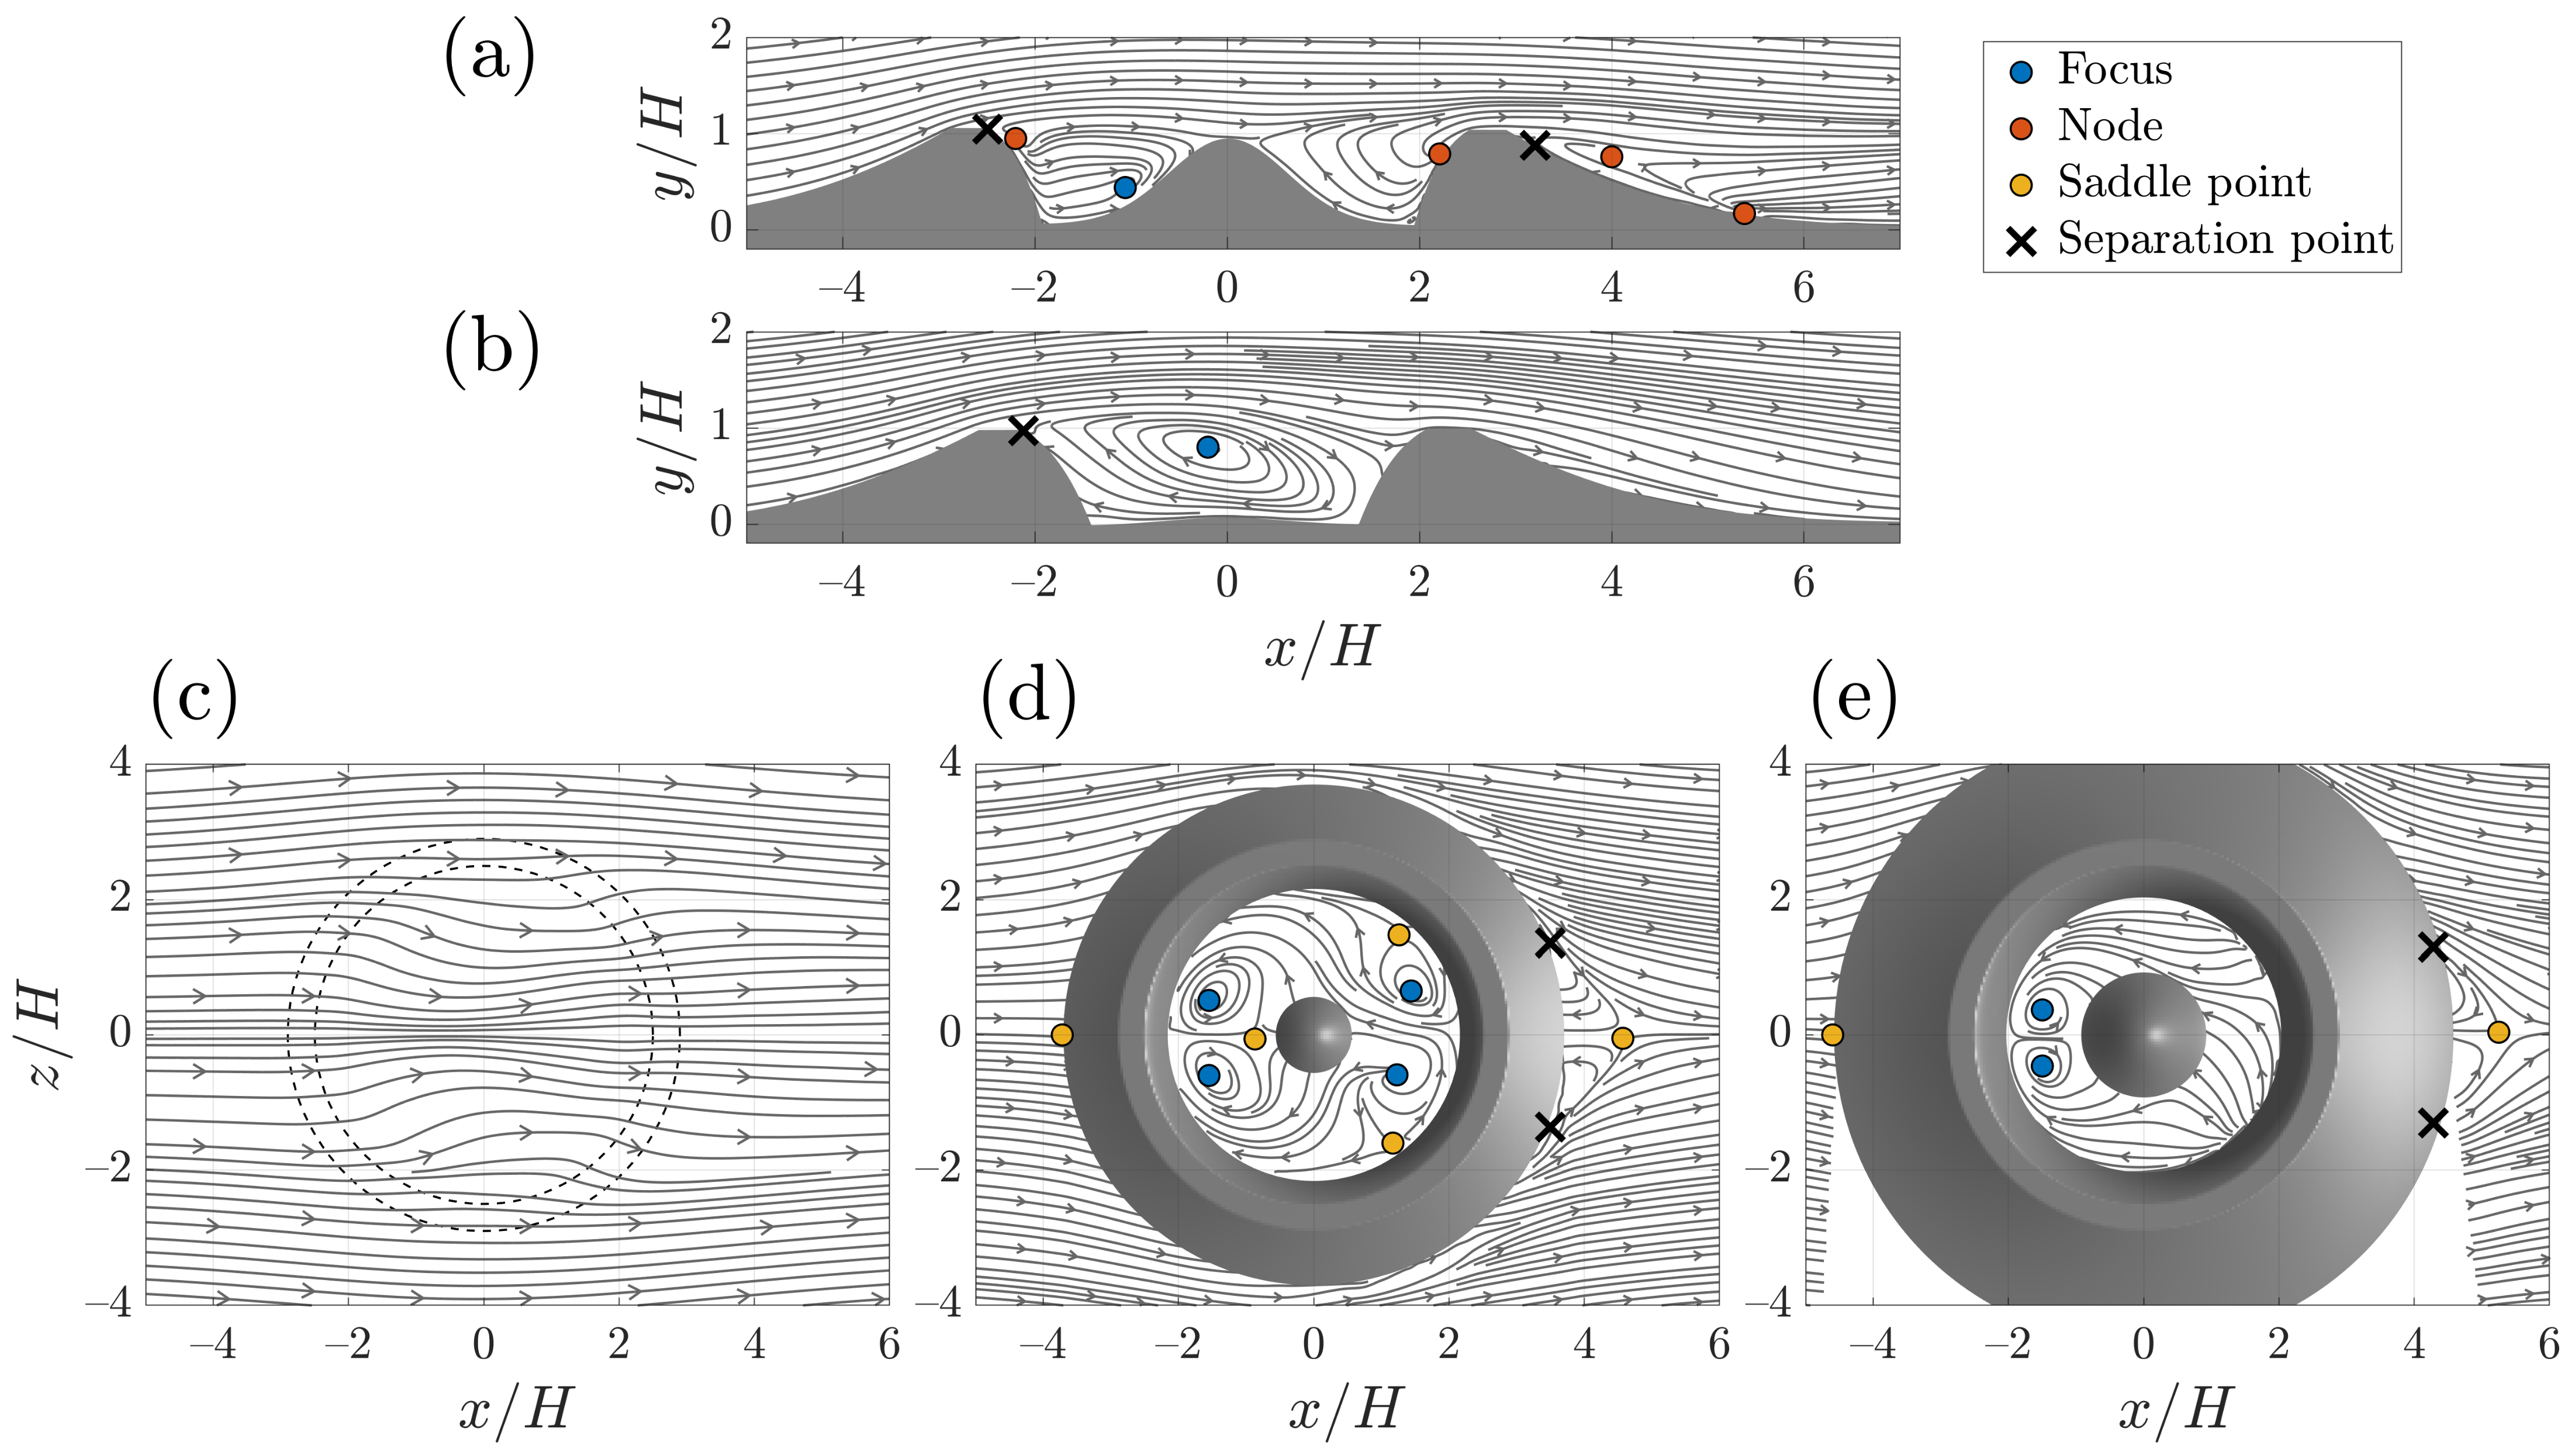
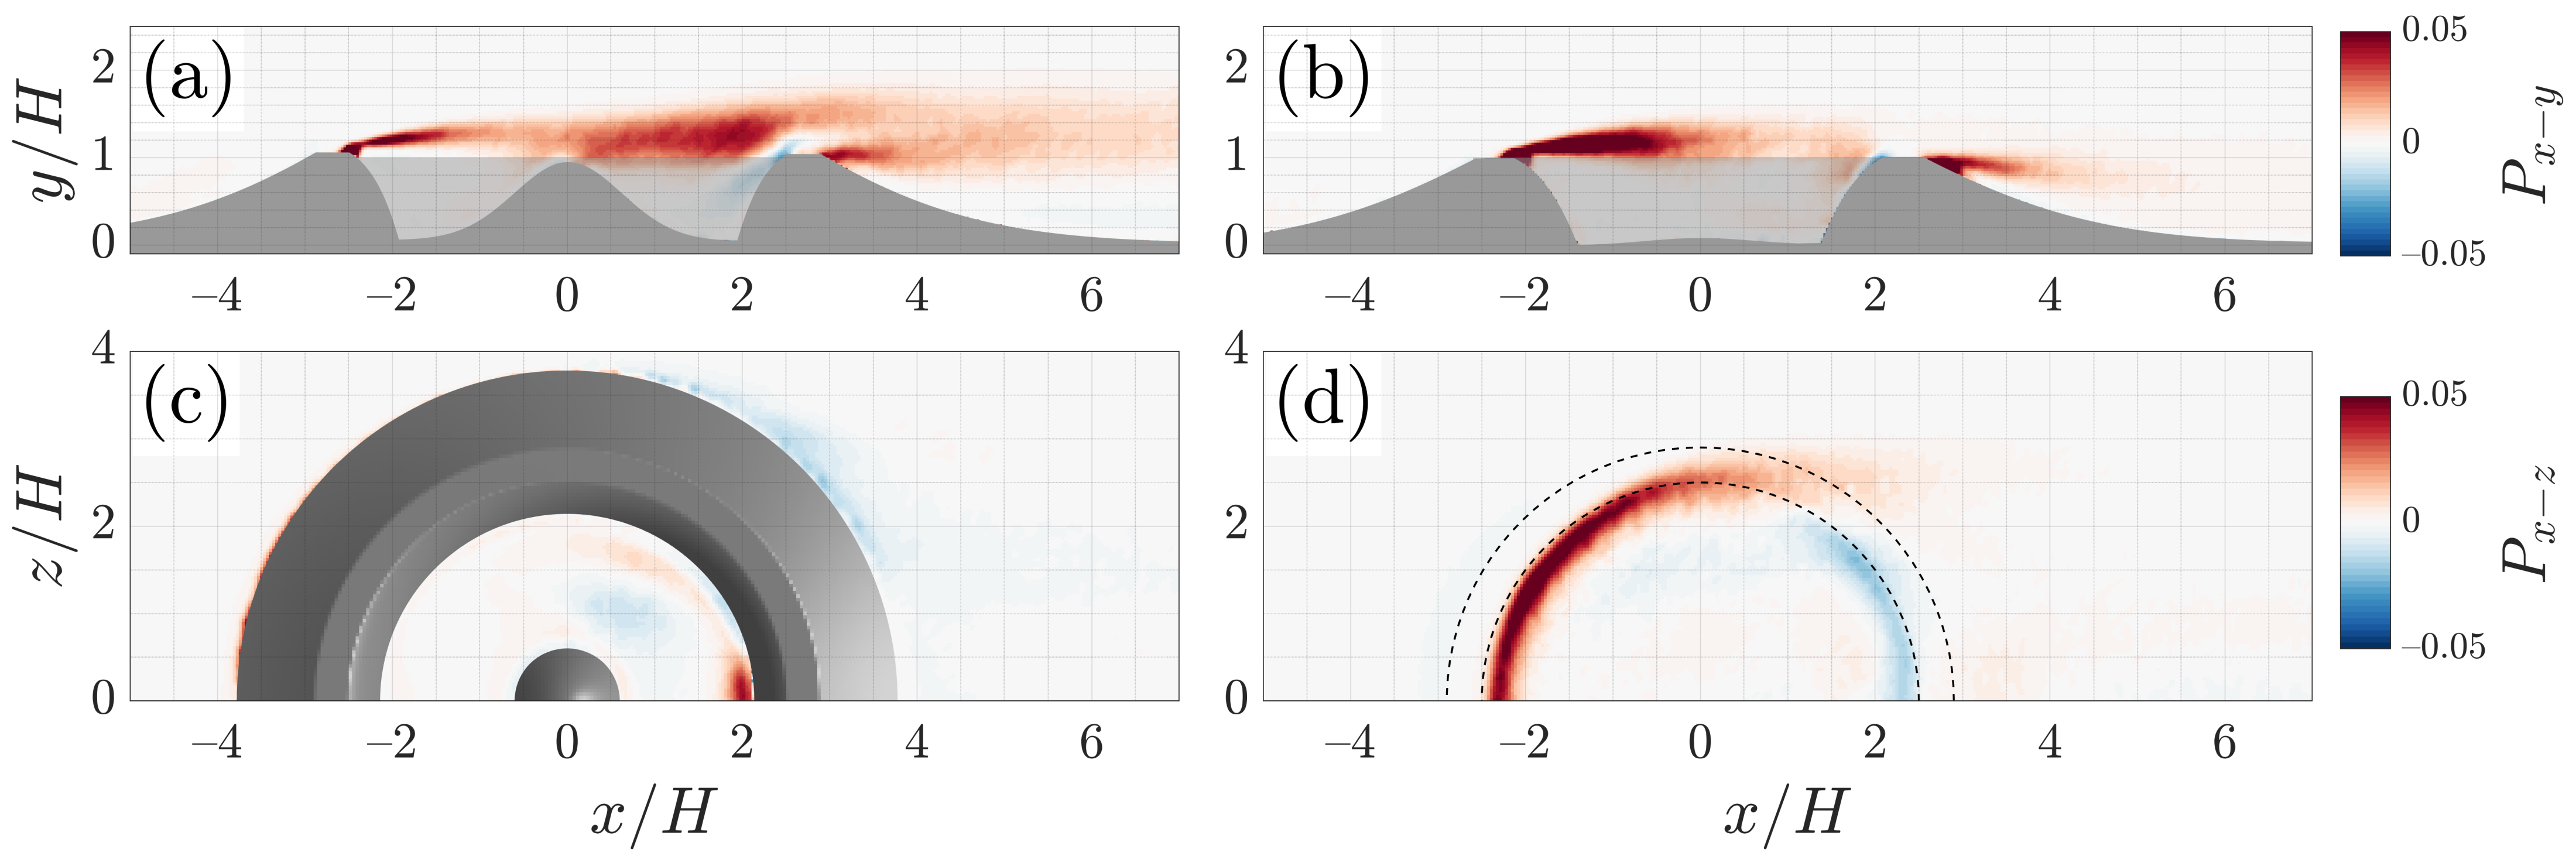
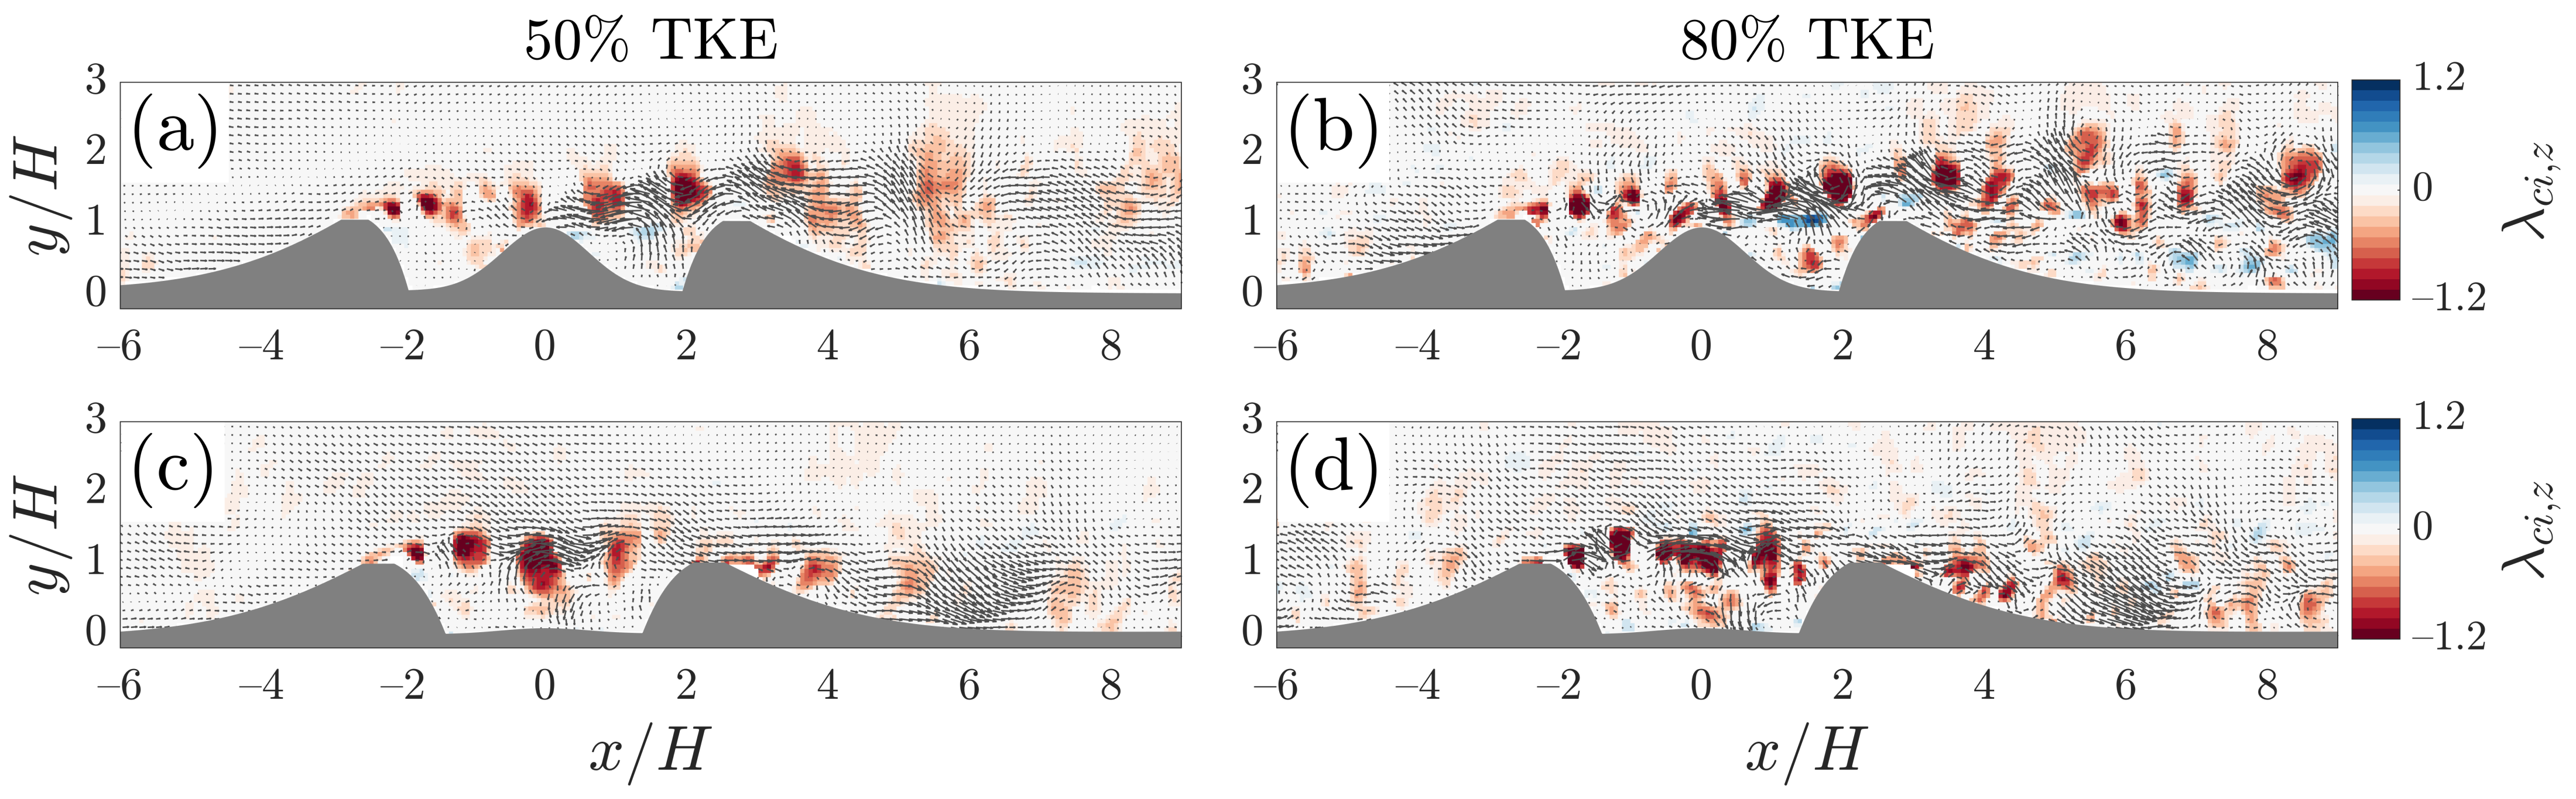
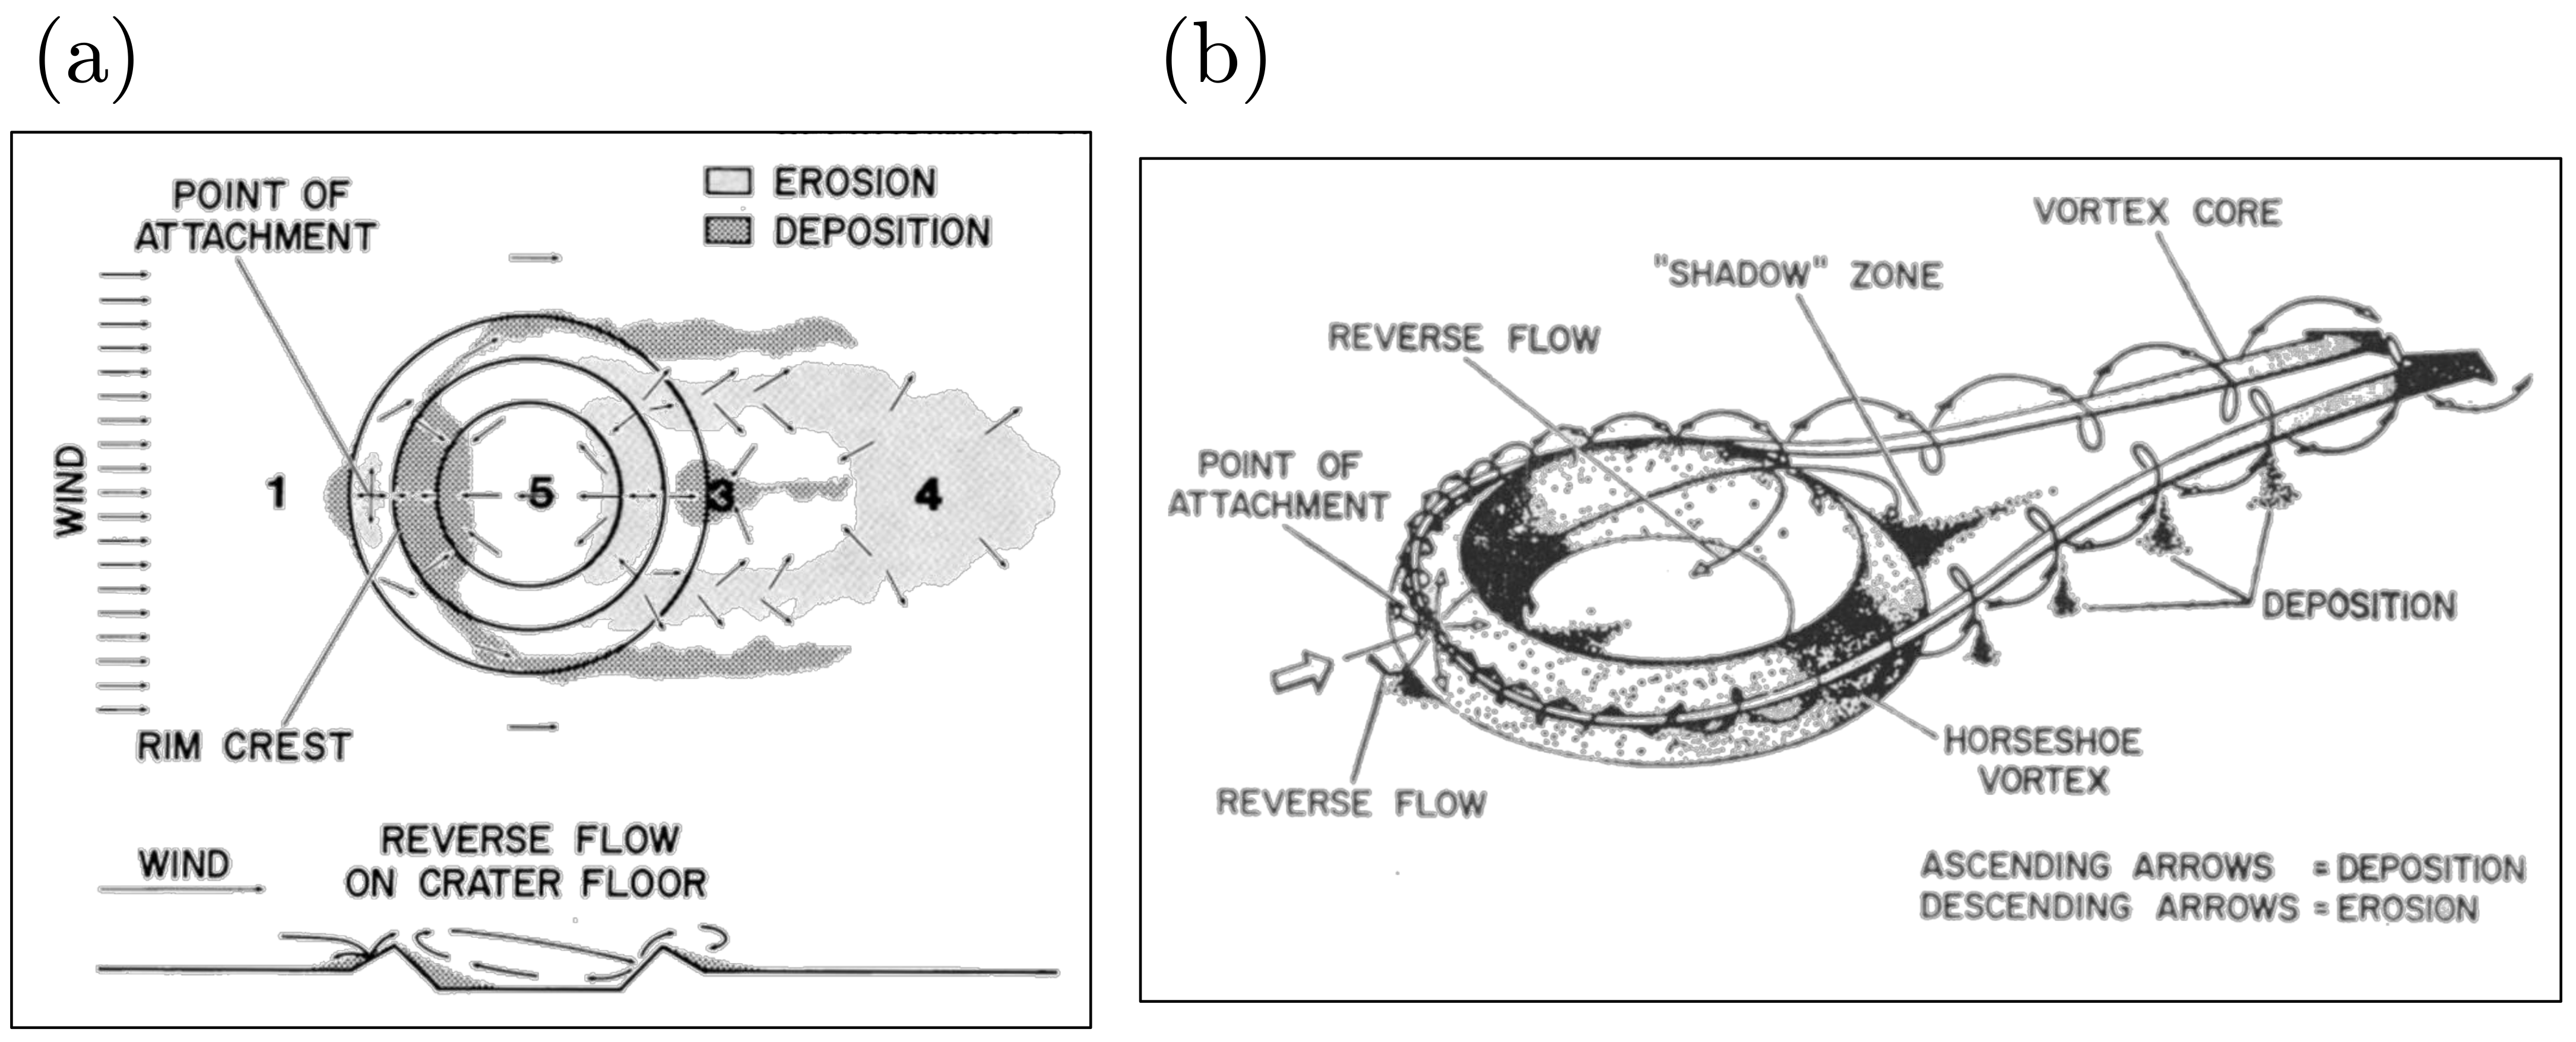
Table 1.
Characteristics of the incoming flow for each free-stream condition.
| (m/s) | (mm) | (m/s) | |||
|---|---|---|---|---|---|
| 0.25 | 54.1 | 0.011 | 2200 | 540 | 12,000 |
| 0.49 | 56.7 | 0.020 | 4500 | 1040 | 25,000 |
| 0.73 | 52.2 | 0.029 | 6700 | 1380 | 35,000 |
| 0.97 | 56.5 | 0.038 | 8900 | 1920 | 50,000 |
Table 2.
Characteristics of the incoming flow for the highest case ().
| Channel cross Section | 112 × 112 mm |
| Flow development length | 1.7 m |
| Working fluid kinematic viscosity | 1.1 m/s |
| Free-stream velocity | 0.97 m/s |
| 8900 | |
| Free-stream turbulence intensity | 2.4% |
| 56.5 mm | |
| 50,000 | |
| 0.038 m/s | |
| 1920 |
Table 3.
Geometric properties of the idealized crater model and of Gale Crater model. The abbreviations US and DS refer to the upstream and downstream sides, respectively. All physical units are in mm.
Table 3.
Geometric properties of the idealized crater model and of Gale Crater model. The abbreviations US and DS refer to the upstream and downstream sides, respectively. All physical units are in mm.
| Geometric Parameters | Idealized Crater Model | Gale Crater Model |
|---|---|---|
| Diameter | 55 | 87 |
| Rim height | 10 | 4.2 (US), 8.5 (DS) |
| Mound height | 9 | 7.9 |
| US - DS elevation difference | 0 | 3.0 |
| Aspect ratio () | 5.5 | 10.2 |
Publisher’s Note: MDPI stays neutral with regard to jurisdictional claims in published maps and institutional affiliations. |
© 2021 by the authors. Licensee MDPI, Basel, Switzerland. This article is an open access article distributed under the terms and conditions of the Creative Commons Attribution (CC BY) license (https://creativecommons.org/licenses/by/4.0/).
Share and Cite
MDPI and ACS Style
Gundersen, D.; Blois, G.; Christensen, K.T. Flow Past Mound-Bearing Impact Craters: An Experimental Study. Fluids 2021, 6, 216. https://doi.org/10.3390/fluids6060216
AMA Style
Gundersen D, Blois G, Christensen KT. Flow Past Mound-Bearing Impact Craters: An Experimental Study. Fluids. 2021; 6(6):216. https://doi.org/10.3390/fluids6060216
Chicago/Turabian StyleGundersen, Diego, Gianluca Blois, and Kenneth T. Christensen. 2021. "Flow Past Mound-Bearing Impact Craters: An Experimental Study" Fluids 6, no. 6: 216. https://doi.org/10.3390/fluids6060216