
A Computational Analysis of the Influence of a Pressure Wire in Evaluating Coronary Stenosis


Abstract
1. Introduction
2. Methods
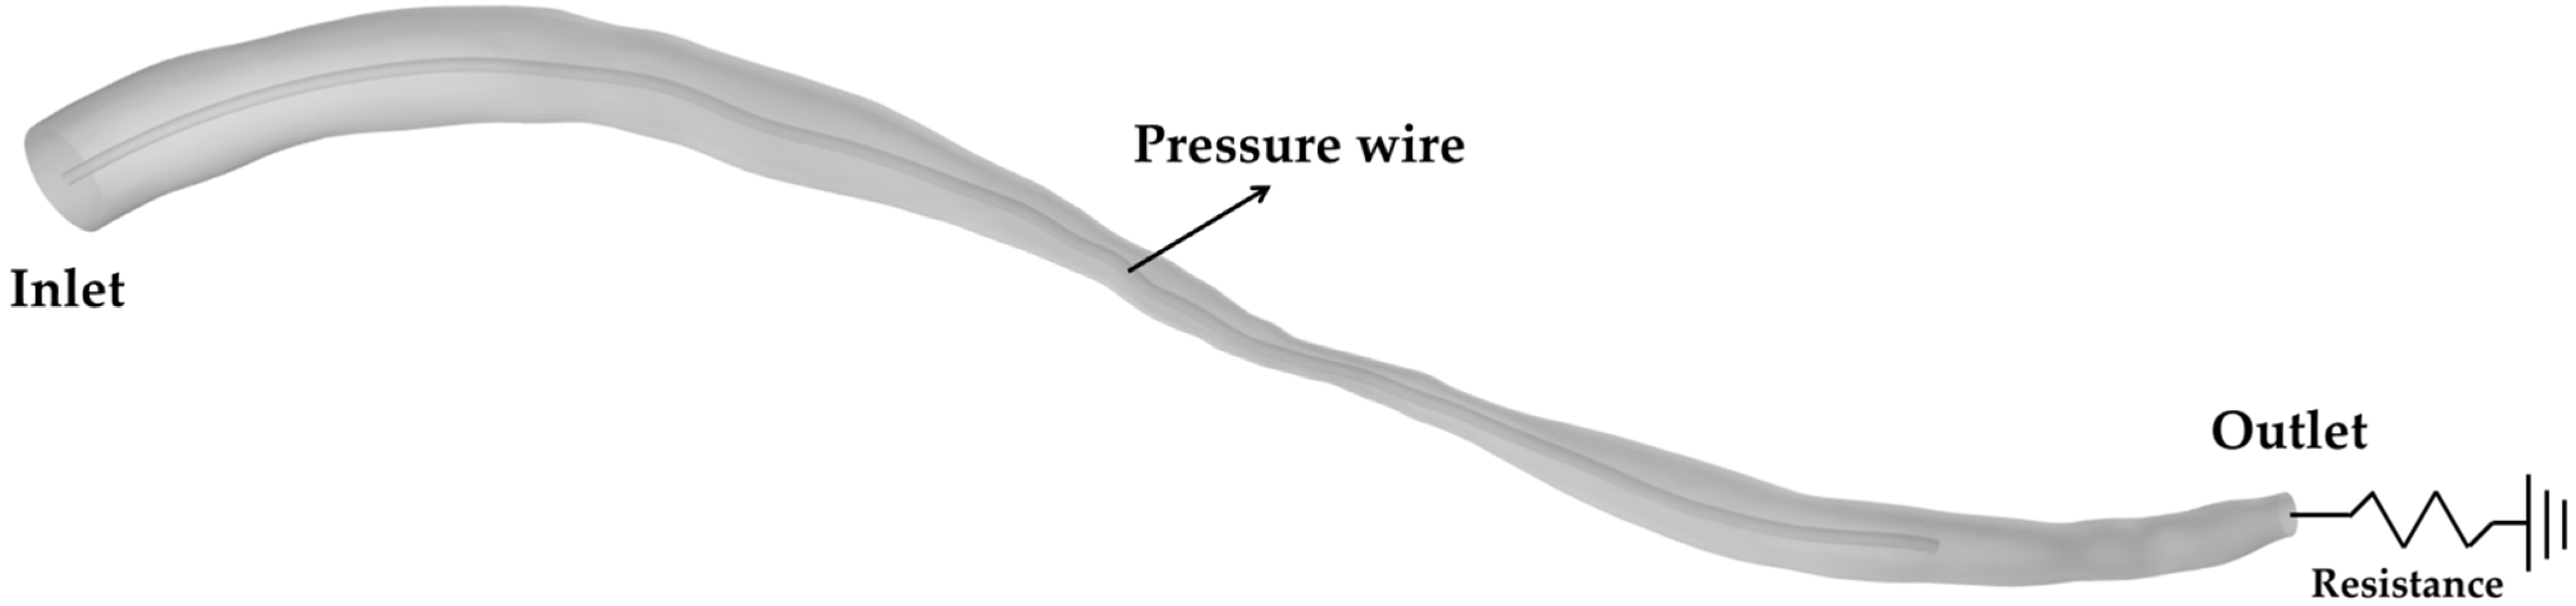
2.1. Modeling Geometry
2.2. Numerical Assumptions and Boundary Condition
2.3. Navier–Stokes Equation
2.4. Grid Independence Study
3. Results and Discussion
3.1. Blockage Ratio and Flow Obstructive Effect
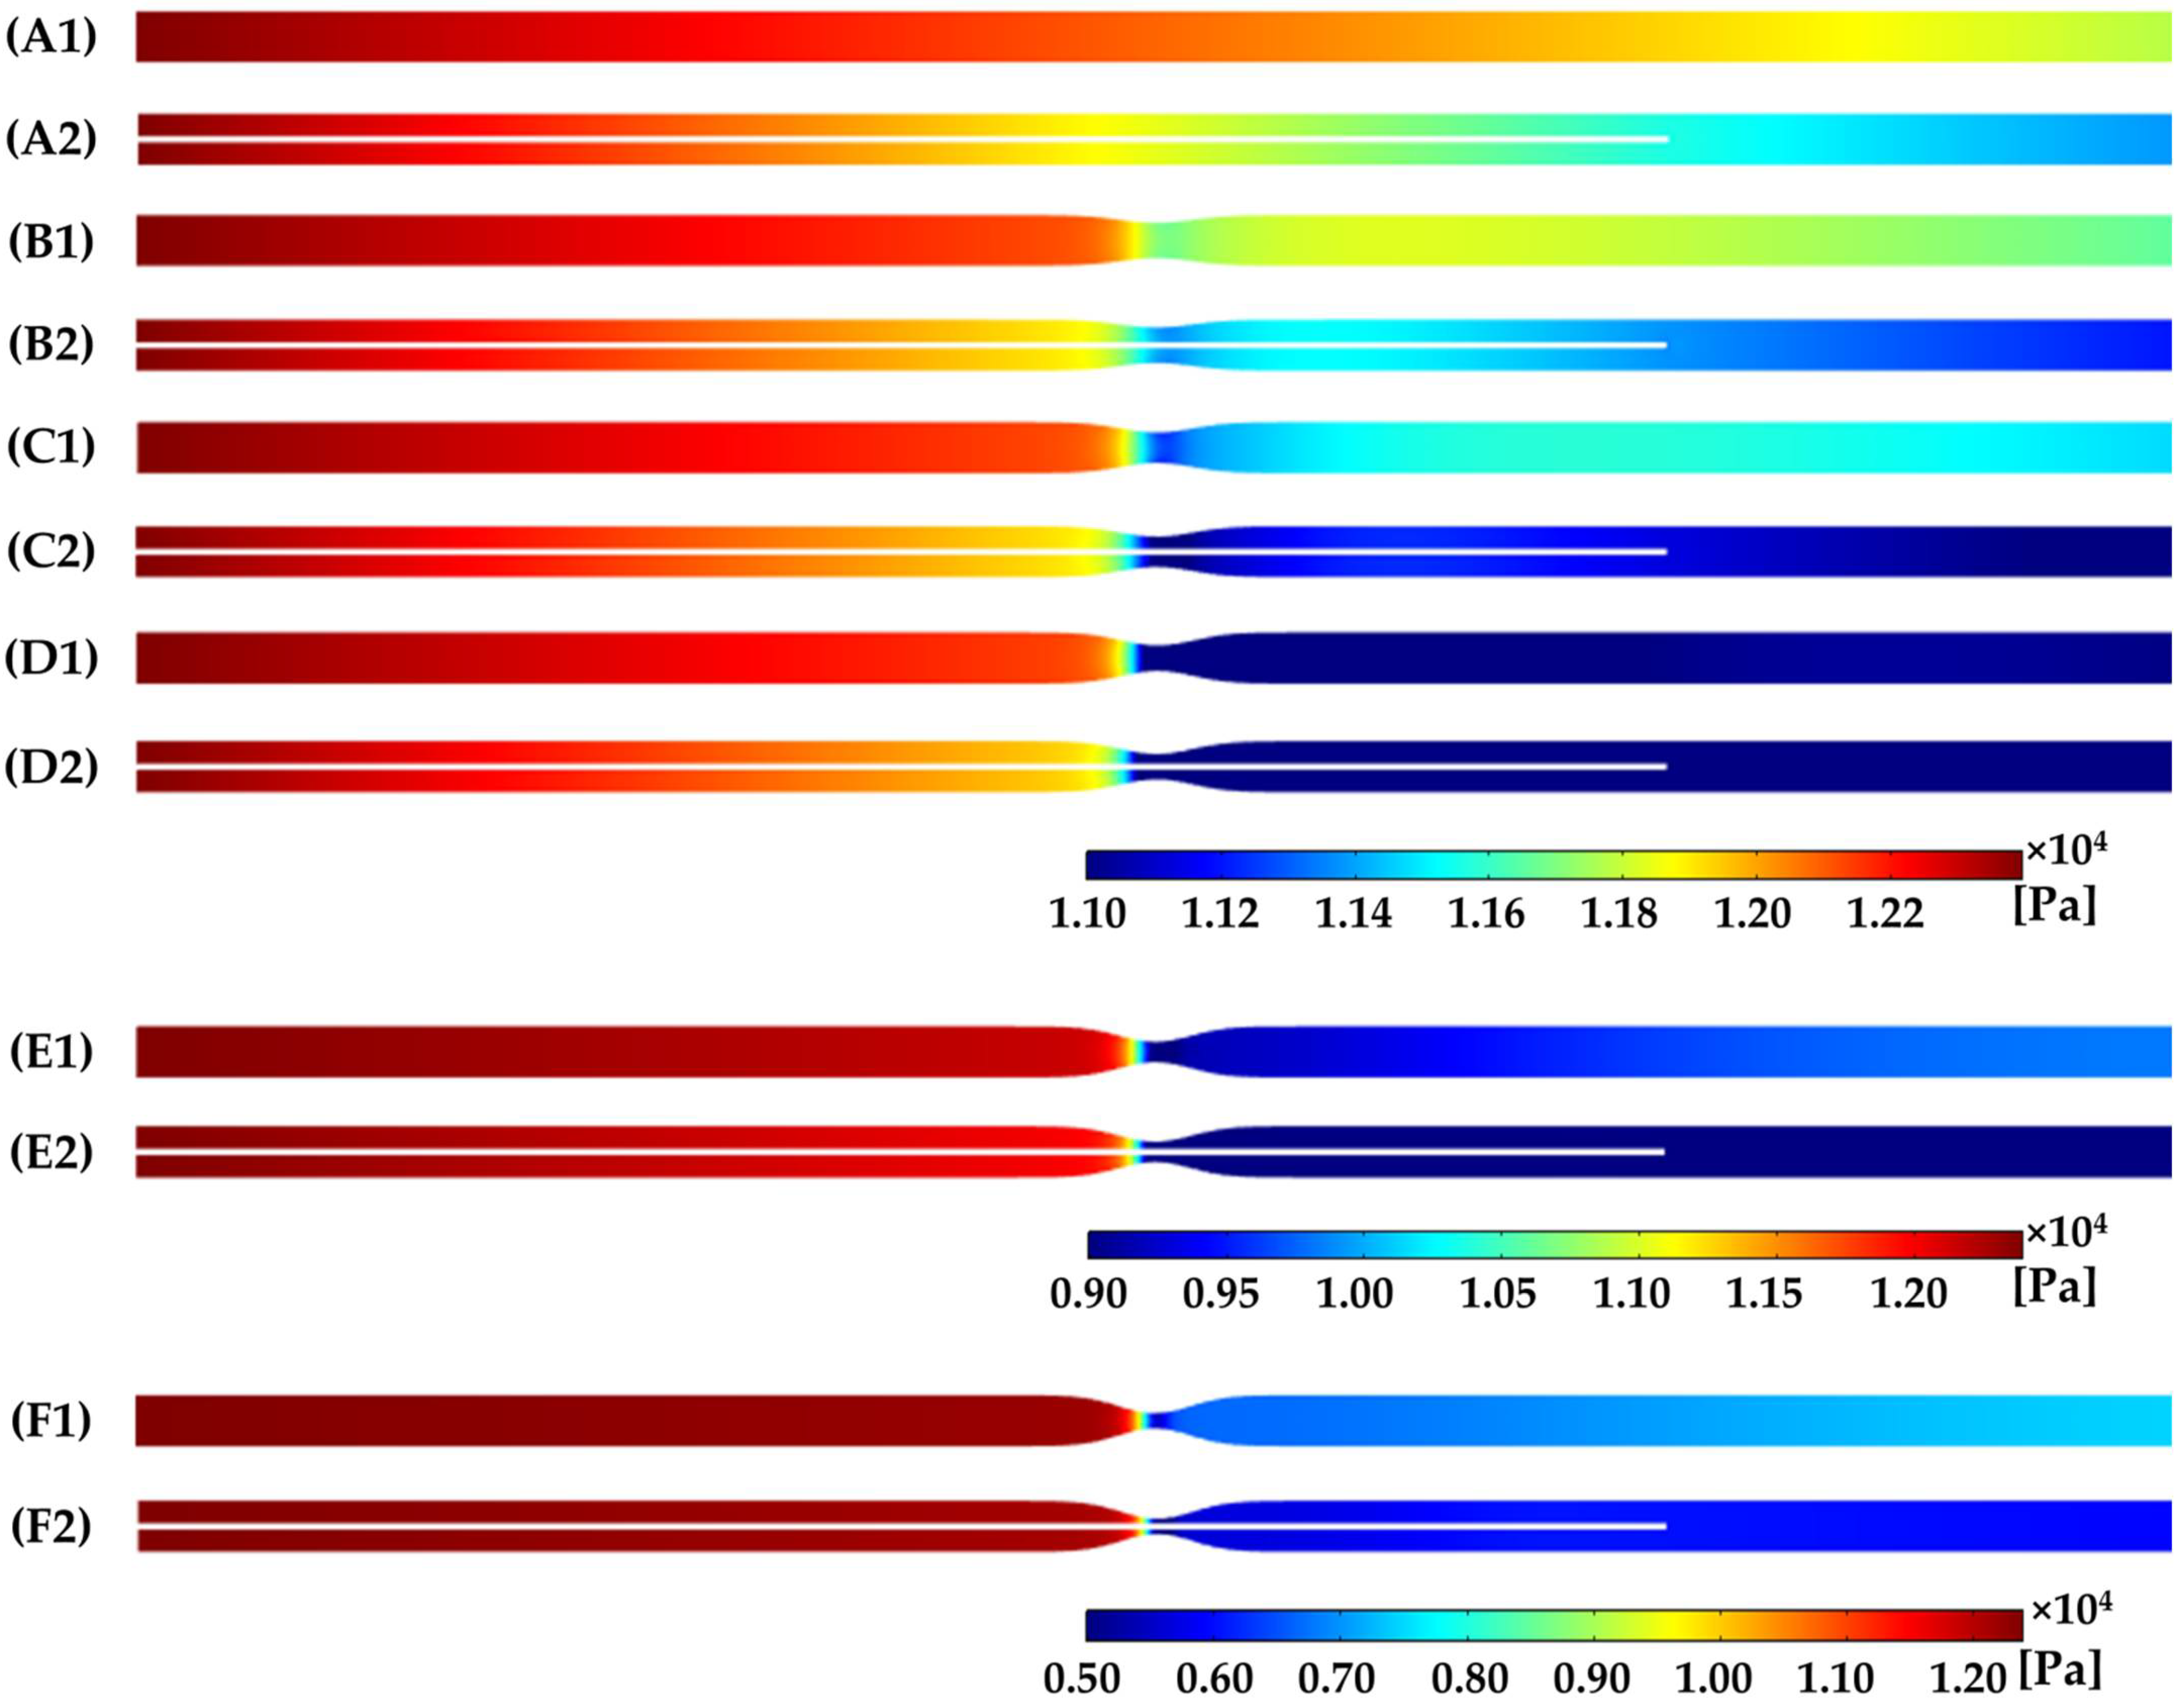
3.2. Pressure
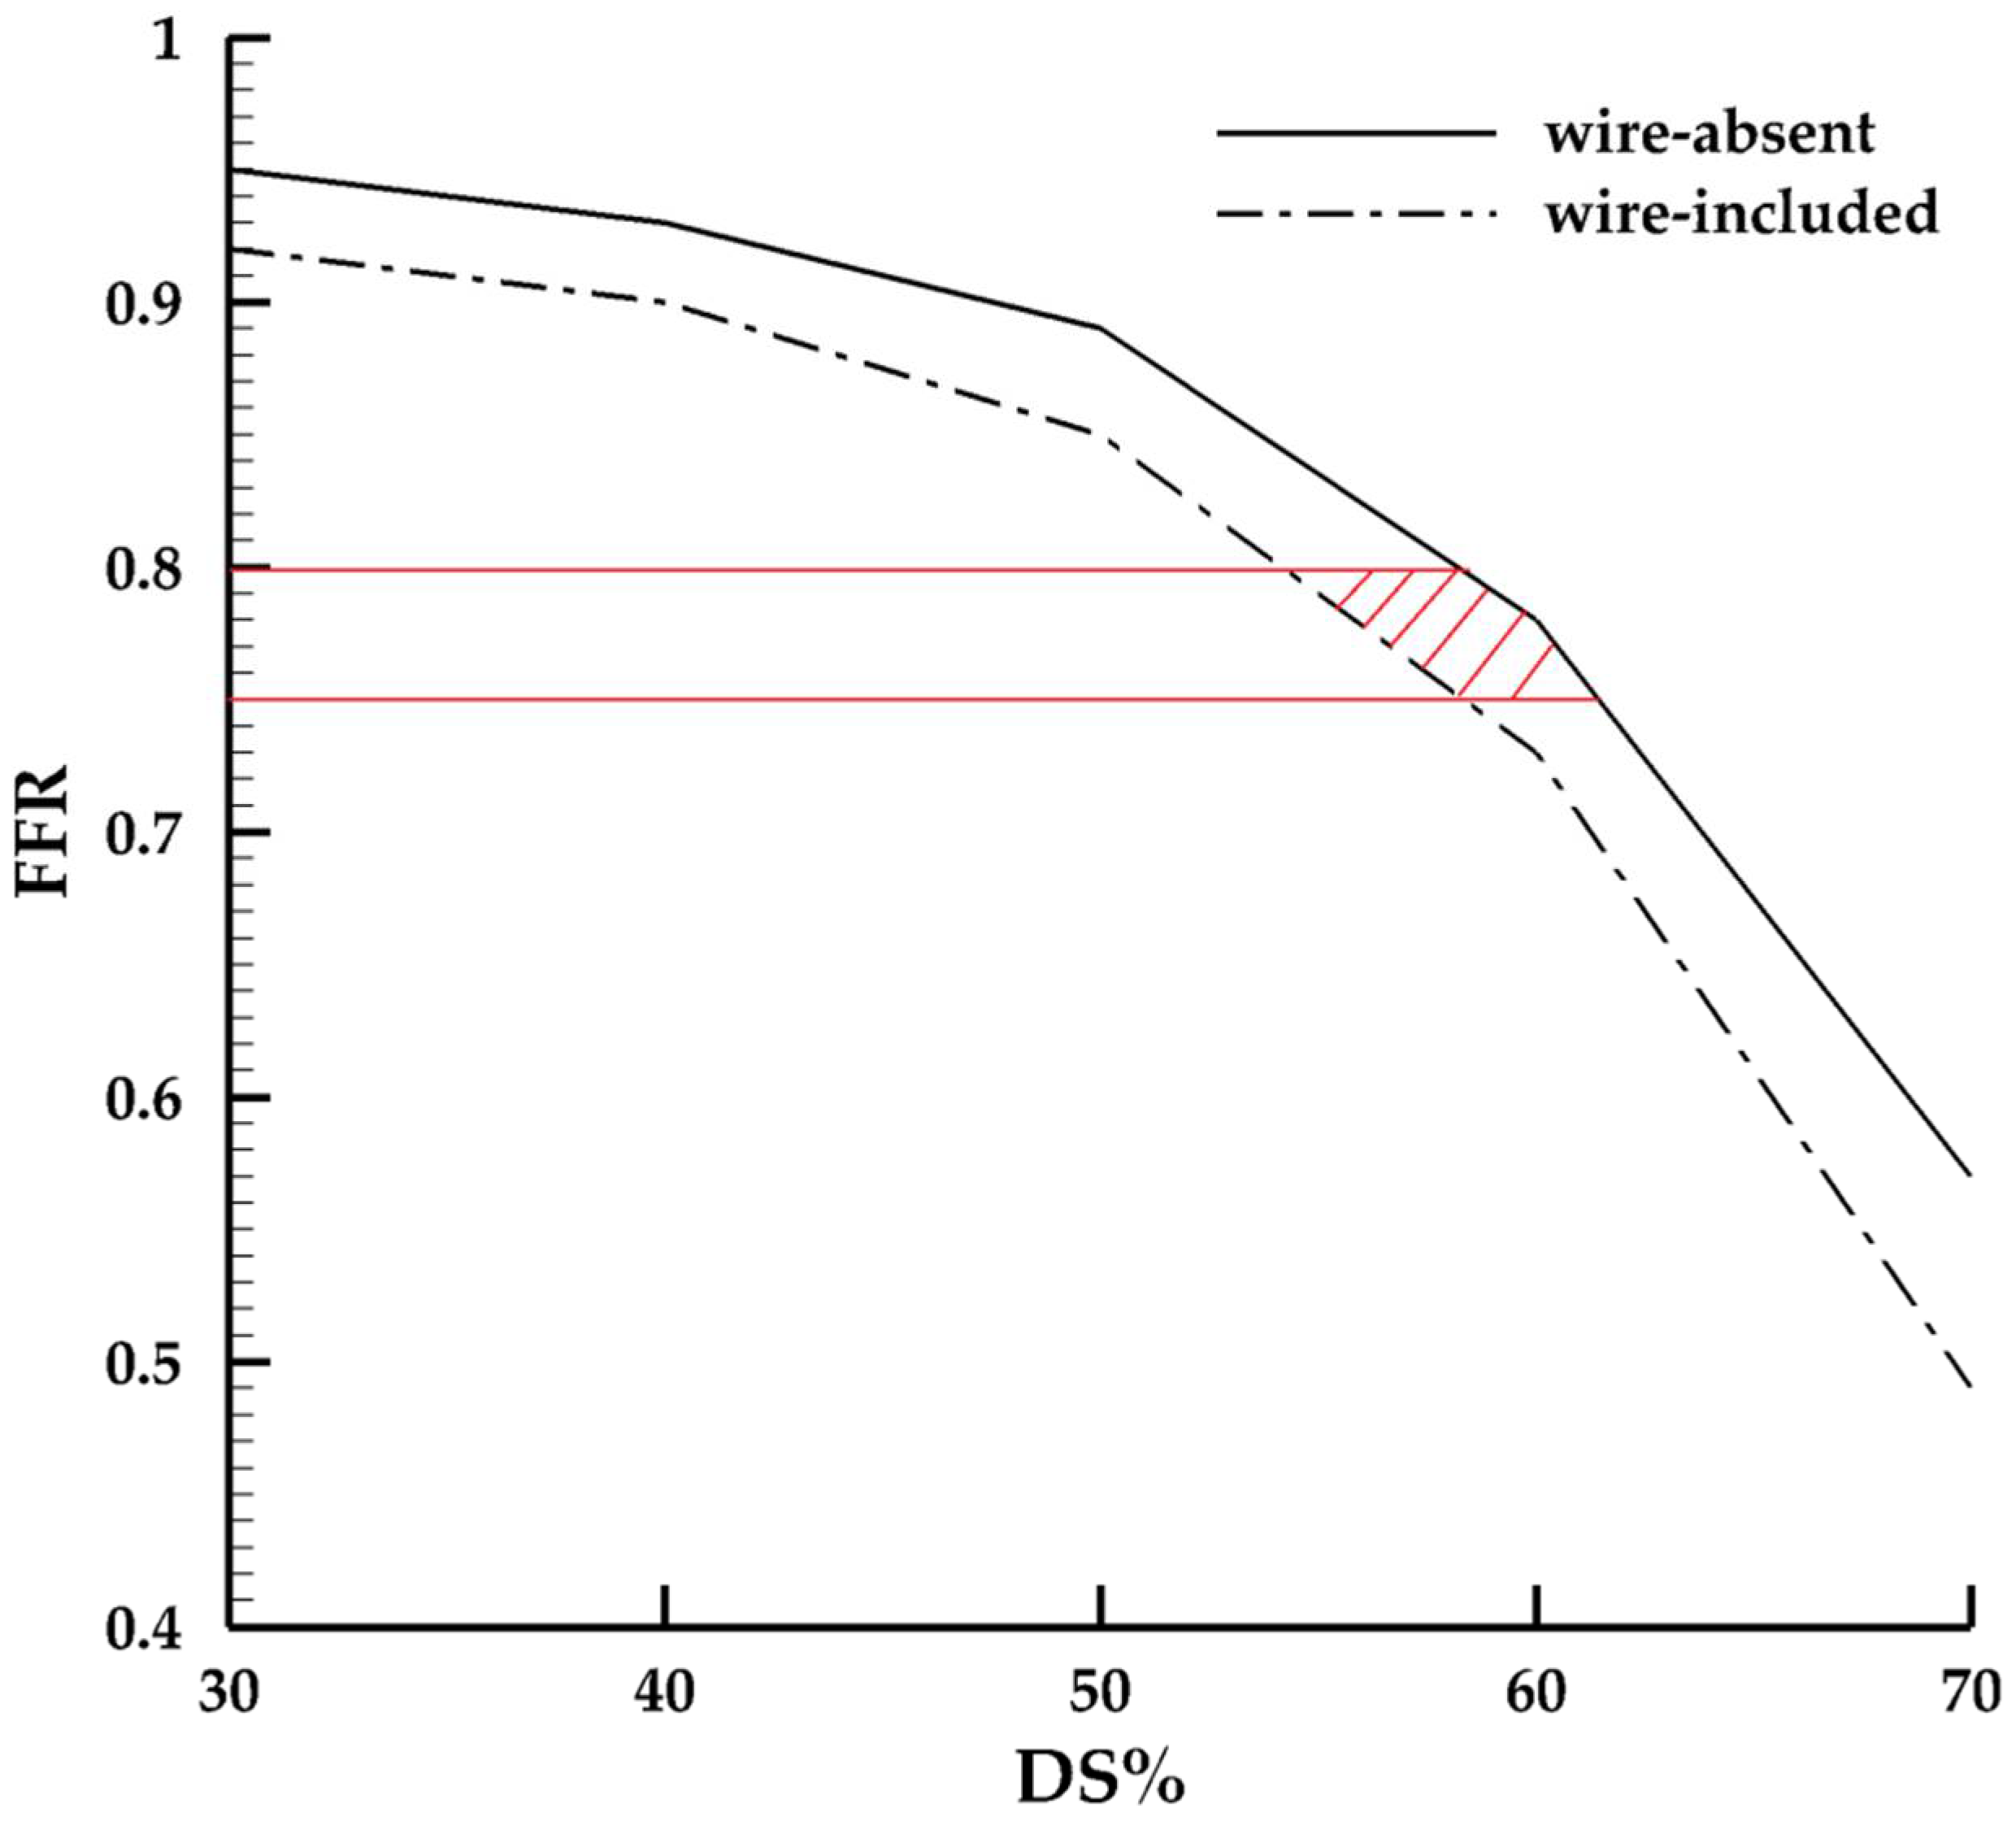
3.3. FFR
4. Limitations
5. Conclusions
Author Contributions
Funding
Institutional Review Board Statement
Informed Consent Statement
Data Availability Statement
Conflicts of Interest
References
- Ohman, E.M.; Bhatt, D.L.; Steg, P.G.; Goto, S.; Hirsch, A.T.; Liau, C.-S.; Mas, J.-L.; Richard, A.-J.; Röther, J.; Wilson, P.W. The REduction of Atherothrombosis for Continued Health (REACH) Registry: An international, prospective, observational investigation in subjects at risk for atherothrombotic events-study design. Am. Heart J. 2006, 151, 786.e1–786.e10. [Google Scholar] [CrossRef] [PubMed]
- Pijls, N.H.; Van Son, J.A.; Kirkeeide, R.L.; De Bruyne, B.; Gould, K.L. Experimental basis of determining maximum coronary, myocardial, and collateral blood flow by pressure measurements for assessing functional stenosis severity before and after percutaneous transluminal coronary angioplasty. Circulation 1993, 87, 1354–1367. [Google Scholar] [CrossRef] [PubMed]
- Tonino, P.A.L.; Fearon, W.F.; De Bruyne, B.; Oldroyd, K.G.; Leesar, M.A.; Ver Lee, P.N.; MacCarthy, P.A.; van’t Veer, M.; Pijls, N.H.J. Angiographic versus functional severity of coronary artery stenoses in the FAME study: Fractional flow reserve versus Angiography in Multivessel Evaluation. J. Am. Coll. Cardiol. 2010, 55, 2816–2821. [Google Scholar] [CrossRef] [PubMed]
- De Bruyne, B.; Pijls, N.H.; Kalesan, B.; Barbato, E.; Tonino, P.A.; Piroth, Z.; Jagic, N.; Möbius-Winkler, S.; Rioufol, G.; Witt, N. Fractional flow reserve–guided PCI versus medical therapy in stable coronary disease. N. Engl. J. Med. 2012, 367, 991–1001. [Google Scholar] [CrossRef] [PubMed]
- De Bruyne, B.; Sarma, J. Fractional flow reserve: A review. Heart 2008, 94, 949–959. [Google Scholar] [CrossRef] [PubMed]
- Toth, G.G.; Johnson, N.P.; Jeremias, A.; Pellicano, M.; Vranckx, P.; Fearon, W.F.; Barbato, E.; Kern, M.J.; Pijls, N.H.; De Bruyne, B. Standardization of fractional flow reserve measurements. J. Am. Coll. Cardiol. 2016, 68, 742–753. [Google Scholar] [CrossRef]
- Taylor, C.A.; Fonte, T.A.; Min, J.K. Computational fluid dynamics applied to cardiac computed tomography for noninvasive quantification of fractional flow reserve: Scientific basis. J. Am. Coll. Cardiol. 2013, 61, 2233–2241. [Google Scholar] [CrossRef]
- Itu, L.; Rapaka, S.; Passerini, T.; Georgescu, B.; Schwemmer, C.; Schoebinger, M.; Flohr, T.; Sharma, P.; Comaniciu, D. A machine-learning approach for computation of fractional flow reserve from coronary computed tomography. J. Appl. Physiol. 2016, 121, 42–52. [Google Scholar] [CrossRef]
- Lee, K.E.; Lee, S.H.; Shin, E.-S.; Shim, E.B. A vessel length-based method to compute coronary fractional flow reserve from optical coherence tomography images. Biomed. Eng. Online 2017, 16, 83. [Google Scholar] [CrossRef]
- Pellicano, M.; Lavi, I.; De Bruyne, B.; Vaknin-Assa, H.; Assali, A.; Valtzer, O.; Lotringer, Y.; Weisz, G.; Almagor, Y.; Xaplanteris, P.; et al. Validation study of image-based fractional flow reserve during coronary angiography. Circ. Cardiovasc. Interv. 2017, 10. [Google Scholar] [CrossRef]
- Zhang, J.-M.; Zhong, L.; Luo, T.; Lomarda, A.M.; Huo, Y.; Yap, J.; Lim, S.T.; Tan, R.S.; Wong, A.S.L.; Tan, J.W.C. Simplified models of non-invasive fractional flow reserve based on CT images. PLoS ONE 2016, 11, e0153070. [Google Scholar] [CrossRef]
- Rizvi, A.; Hyun Lee, J.; Han, D.; Park, M.W.; Roudsari, H.M.; Lu, B.; Lin, F.Y.; Min, J.K. Fractional flow reserve measurement by coronary computed tomography angiography: A review with future directions. Cardiovasc. Innov. Appl. 2016, 2, 125–135. [Google Scholar] [CrossRef]
- De Bruyne, B.; Paulus, W.J.; Vantrimpont, P.J.; Sys, S.U.; Heyndrickx, G.R.; Pijls, N.H. Transstenotic coronary pressure gradient measurement in humans: In vitro and in vivo evaluation of a new pressure monitoring angioplasty guide wire. J. Am. Coll. Cardiol. 1993, 22, 119–126. [Google Scholar] [CrossRef]
- Ashtekar, K.D.; Back, L.H.; Khoury, S.F.; Banerjee, R.K. In vitro quantification of guidewire flow-obstruction effect in model coronary stenoses for interventional diagnostic procedure. J. Med. Devices 2007, 1, 185–196. [Google Scholar] [CrossRef]
- Peelukhana, S.V.; Effat, M.; Kolli, K.K.; Arif, I.; Helmy, T.; Leesar, M.; Kerr, H.; Back, L.H.; Banerjee, R. Lesion flow coefficient: A combined anatomical and functional parameter for detection of coronary artery disease—A clinical study. J. Invasive Cardiol. 2015, 27, 54–64. [Google Scholar]
- Siouffi, M.; Deplano, V.; Pélissier, R. Experimental analysis of unsteady flows through a stenosis. J. Biomech. 1997, 31, 11–19. [Google Scholar] [CrossRef]
- Douglas, P.S.; Fiolkoski, J.; Berko, B.; Reichek, N. Echocardiographic visualization of coronary artery anatomy in the adult. J. Am. Coll. Cardiol. 1988, 11, 565–571. [Google Scholar] [CrossRef]
- Solecki, M.; Kruk, M.; Demkow, M.; Schoepf, U.J.; Reynolds, M.A.; Wardziak, Ł.; Dzielińska, Z.; Śpiewak, M.; Miłosz-Wieczorek, B.; Małek, Ł. What is the optimal anatomic location for coronary artery pressure measurement at CT-derived FFR? J. Cardiovasc. Comput. Tomogr. 2017, 11, 397–403. [Google Scholar] [CrossRef]
- Kenner, T. The measurement of blood density and its meaning. Basic Res. Cardiol. 1989, 84, 111–124. [Google Scholar] [CrossRef] [PubMed]
- Mayer, G.A. Blood viscosity in healthy subjects and patients with coronary heart disease. Can. Med. Assoc. J. 1964, 91, 951. [Google Scholar] [PubMed]
- Pijls, N.H.; Van Gelder, B.; Van der Voort, P.; Peels, K.; Bracke, F.A.; Bonnier, H.J.; El Gamal, M.I. Fractional flow reserve: A useful index to evaluate the influence of an epicardial coronary stenosis on myocardial blood flow. Circulation 1995, 92, 3183–3193. [Google Scholar] [CrossRef]
- Bulant, C.; Blanco, P.; Talou, G.M.; Bezerra, C.G.; Lemos, P.; Feijóo, R. A head-to-head comparison between CT-and IVUS-derived coronary blood flow models. J. Biomech. 2017, 51, 65–76. [Google Scholar] [CrossRef] [PubMed]
- Wilson, R.F.; Wyche, K.; Christensen, B.V.; Zimmer, S.; Laxson, D.D. Effects of adenosine on human coronary arterial circulation. Circulation 1990, 82, 1595–1606. [Google Scholar] [CrossRef]
- Park, S.-J.; Kang, S.-J.; Ahn, J.-M.; Shim, E.B.; Kim, Y.-T.; Yun, S.-C.; Song, H.; Lee, J.-Y.; Kim, W.-J.; Park, D.-W. Visual-functional mismatch between coronary angiography and fractional flow reserve. JACC Cardiovasc. Interv. 2012, 5, 1029–1036. [Google Scholar] [CrossRef]
- Pijls, N.H.; De Bruyne, B. Coronary Pressure; Springer: Berlin/Heidelberg, Germany, 2000; Volume 195. [Google Scholar]
- Pijls, N.H.; De Bruyne, B.; Peels, K.; Van Der Voort, P.H.; Bonnier, H.J.; Bartunek, J.; Koolen, J.J. Measurement of fractional flow reserve to assess the functional severity of coronary-artery stenoses. N. Engl. J. Med. 1996, 334, 1703–1708. [Google Scholar] [CrossRef] [PubMed]
- Fearon, W.F.; Tonino, P.A.; De Bruyne, B.; Siebert, U.; Pijls, N.H.; Investigators, F.S. Rationale and design of the fractional flow reserve versus angiography for multivessel evaluation (FAME) study. Am. Heart J. 2007, 154, 632–636. [Google Scholar] [CrossRef] [PubMed]
- Morris, P.D.; van de Vosse, F.N.; Lawford, P.V.; Hose, D.R.; Gunn, J.P. “Virtual” (computed) fractional flow reserve: Current challenges and limitations. JACC Cardiovasc. Interv. 2015, 8, 1009–1017. [Google Scholar] [CrossRef] [PubMed]


| Model | DS% | Blockage Ratio | Flow Obstructive Rate |
|---|---|---|---|
| Ideal | 0% | 1.4% | 3.4% |
| 30% | 3.0% | 3.8% | |
| 40% | 4.0% | 4.5% | |
| 50% | 5.8% | 5.8% | |
| 60% | 9.0% | 9.8% | |
| 70% | 16.0% | 20.3% | |
| Patient-specific | 54% | 17.8% | 18.7% |
Publisher’s Note: MDPI stays neutral with regard to jurisdictional claims in published maps and institutional affiliations. |
© 2021 by the authors. Licensee MDPI, Basel, Switzerland. This article is an open access article distributed under the terms and conditions of the Creative Commons Attribution (CC BY) license (https://creativecommons.org/licenses/by/4.0/).
Share and Cite
Yi, J.; Tian, F.-B.; Simmons, A.; Barber, T. A Computational Analysis of the Influence of a Pressure Wire in Evaluating Coronary Stenosis. Fluids 2021, 6, 165. https://doi.org/10.3390/fluids6040165
Yi J, Tian F-B, Simmons A, Barber T. A Computational Analysis of the Influence of a Pressure Wire in Evaluating Coronary Stenosis. Fluids. 2021; 6(4):165. https://doi.org/10.3390/fluids6040165
Chicago/Turabian StyleYi, Jie, Fang-Bao Tian, Anne Simmons, and Tracie Barber. 2021. "A Computational Analysis of the Influence of a Pressure Wire in Evaluating Coronary Stenosis" Fluids 6, no. 4: 165. https://doi.org/10.3390/fluids6040165
APA StyleYi, J., Tian, F.-B., Simmons, A., & Barber, T. (2021). A Computational Analysis of the Influence of a Pressure Wire in Evaluating Coronary Stenosis. Fluids, 6(4), 165. https://doi.org/10.3390/fluids6040165