
Sediment Deposition within Rainwater: Case Study Comparison of Four Different Sites in Ikorodu, Nigeria


Abstract
1. Introduction
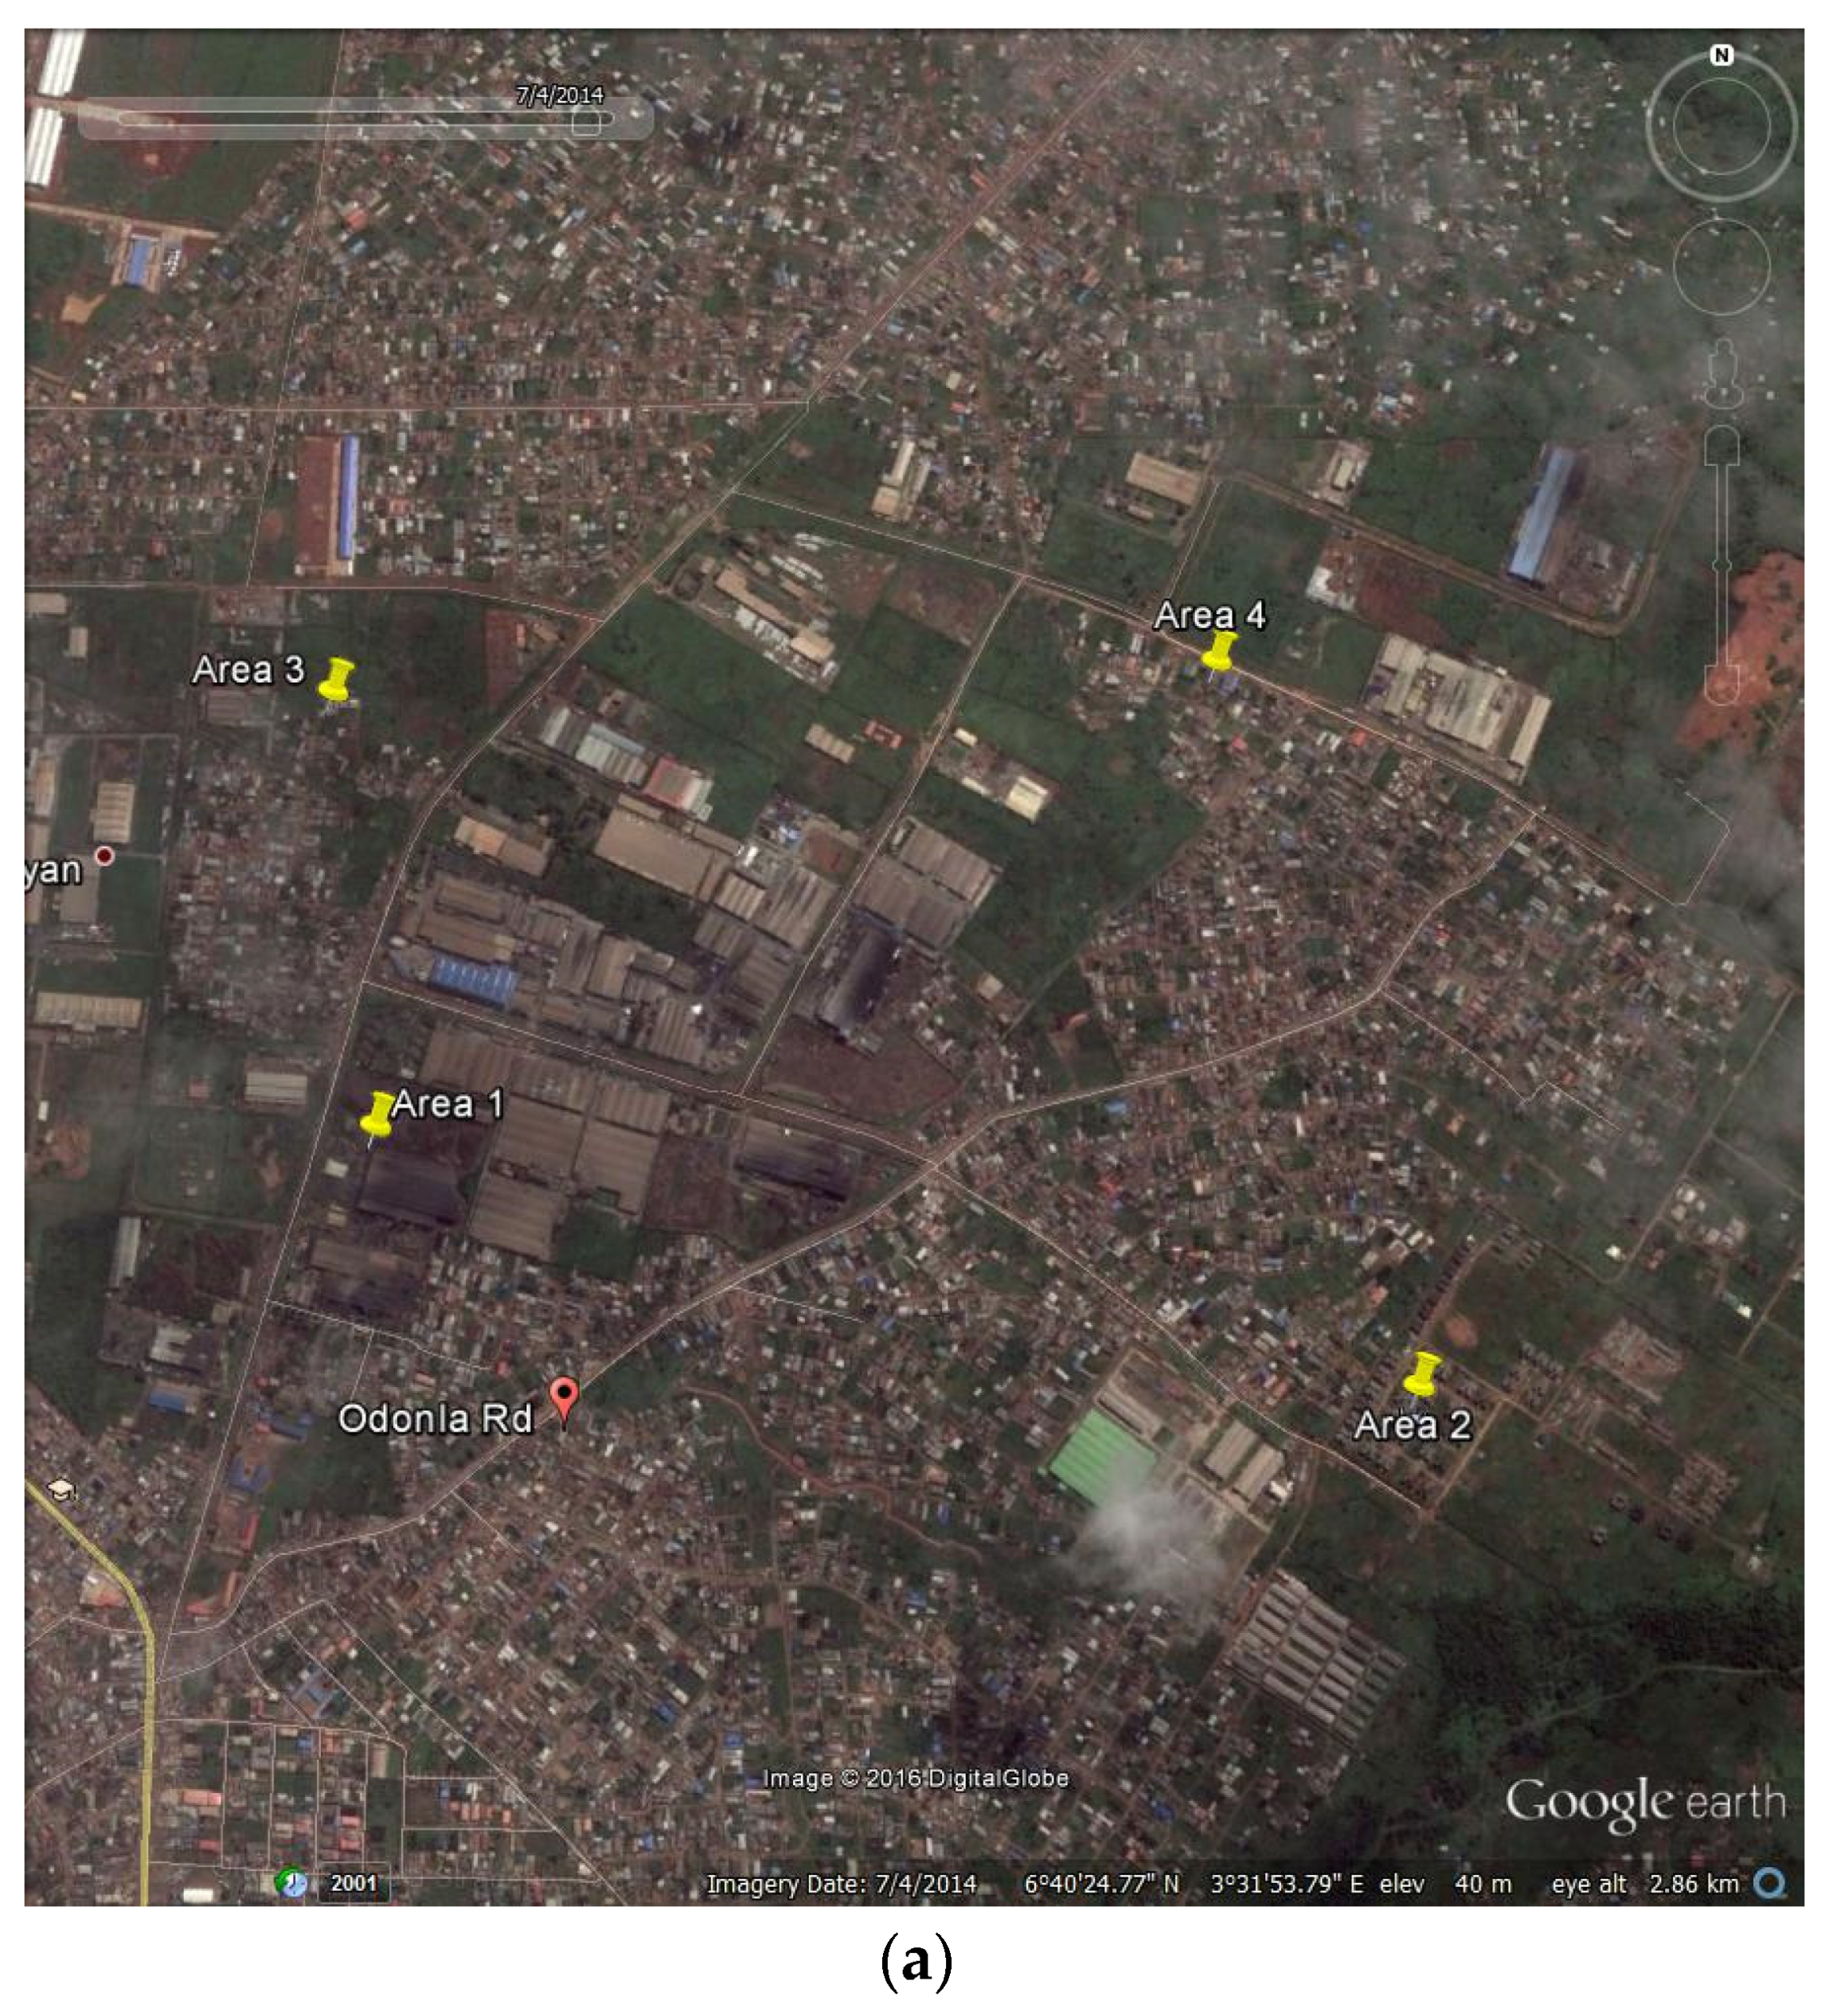
2. Study Area
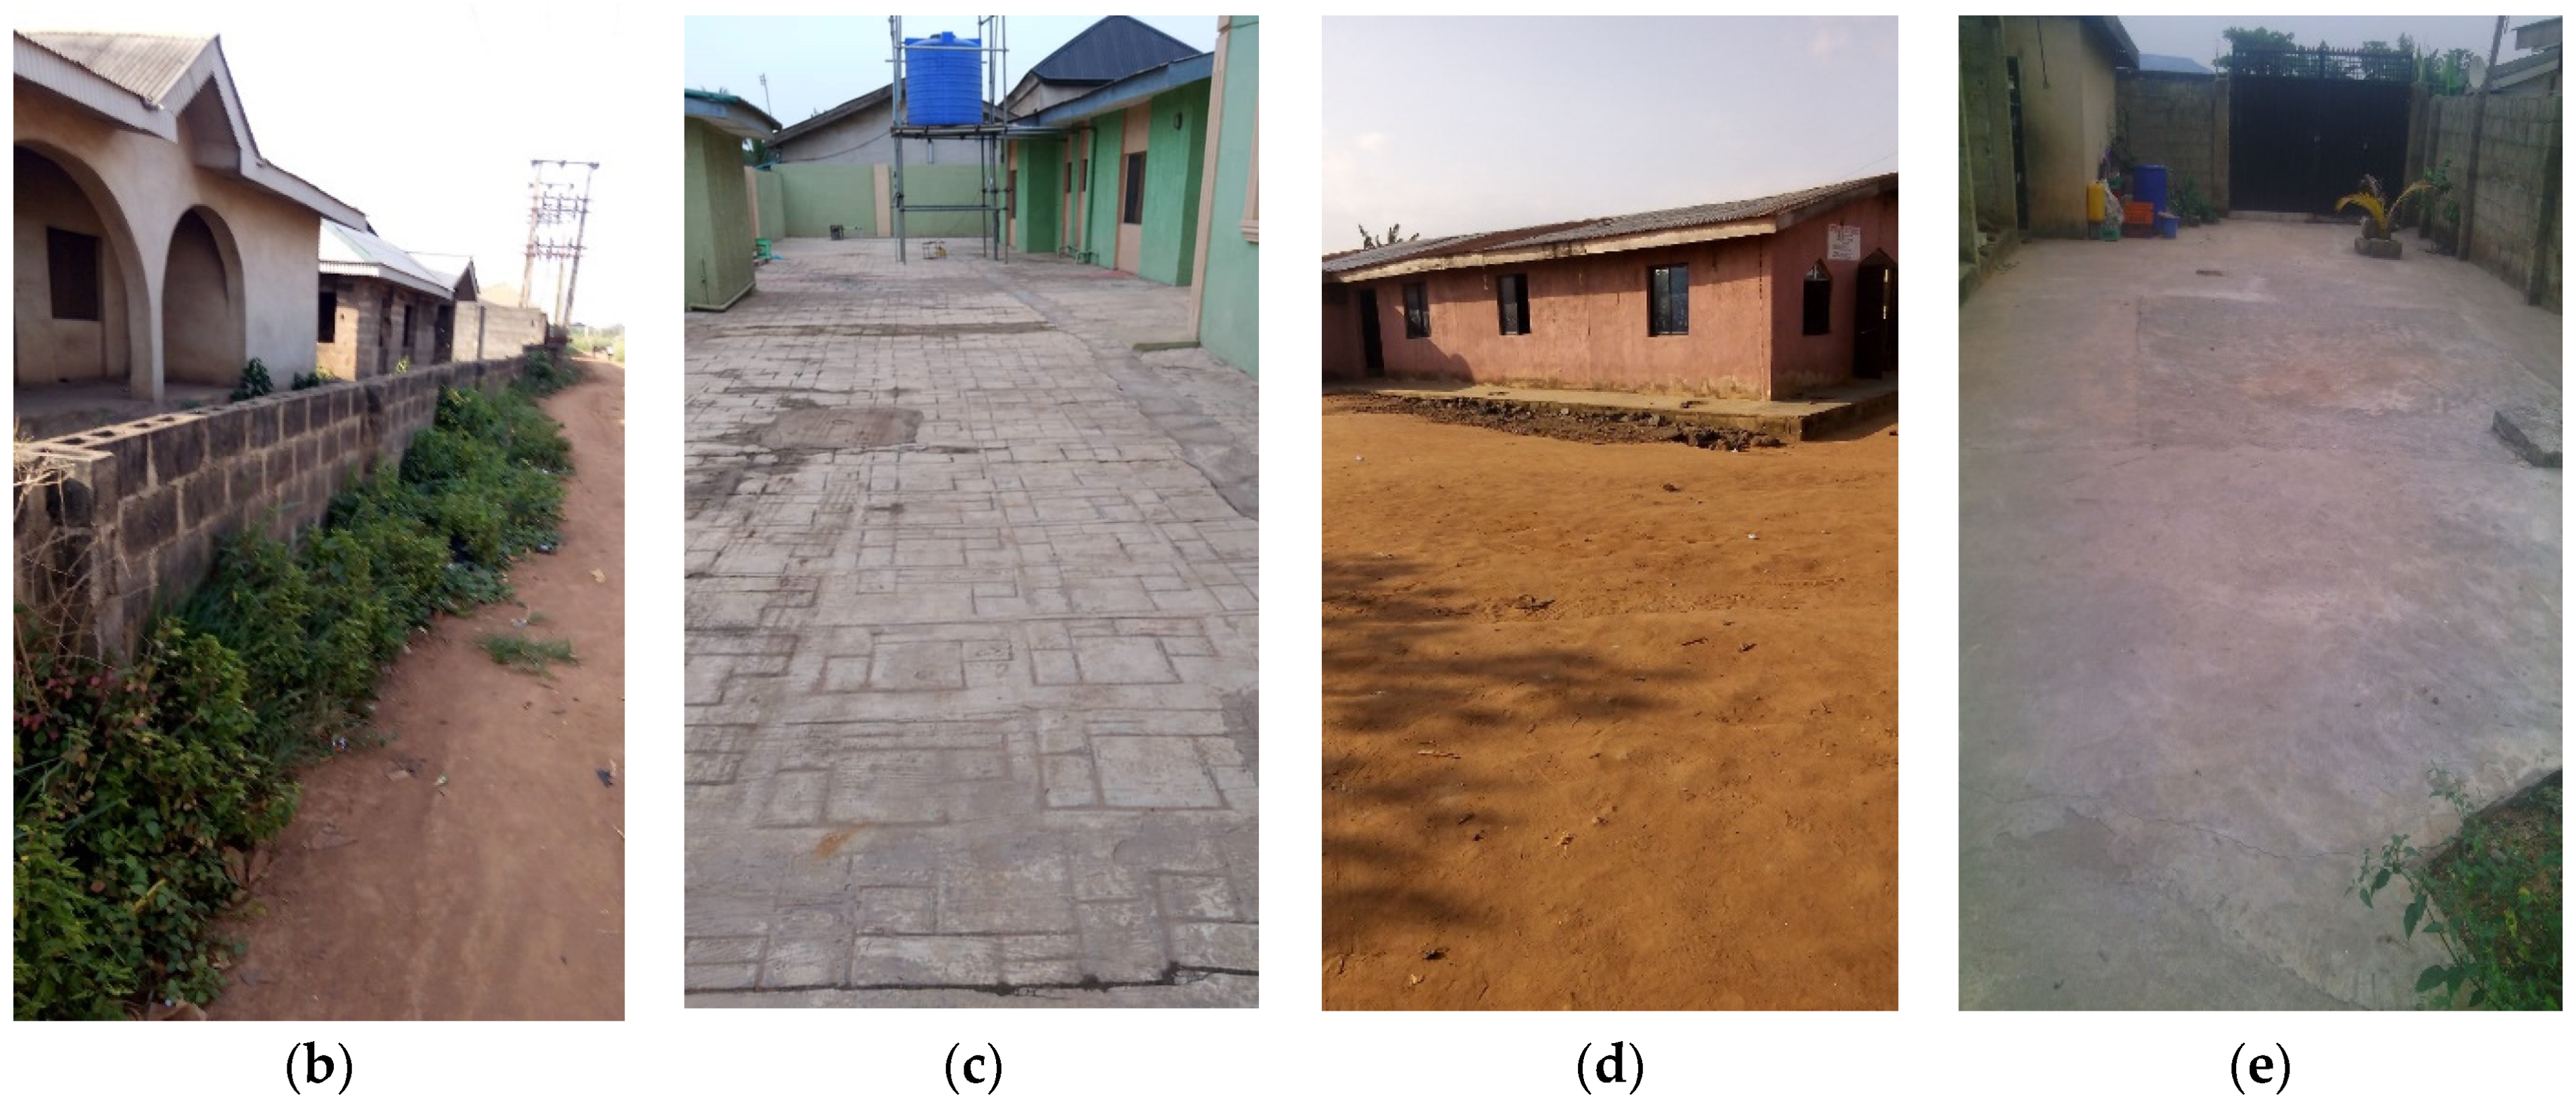
- Area 1: Good sanitation with a high potential for sediment deposition (unpaved, with small amounts of vegetation);
- Area 2: Good sanitation with a low potential for sediment deposition (paved, with large amounts of vegetation);
- Area 3: Poor sanitation with a high potential for sediment deposition (unpaved, with small amounts of vegetation);
- Area 4: Poor sanitation with a low potential for sediment deposition (paved, with large amounts of vegetation).
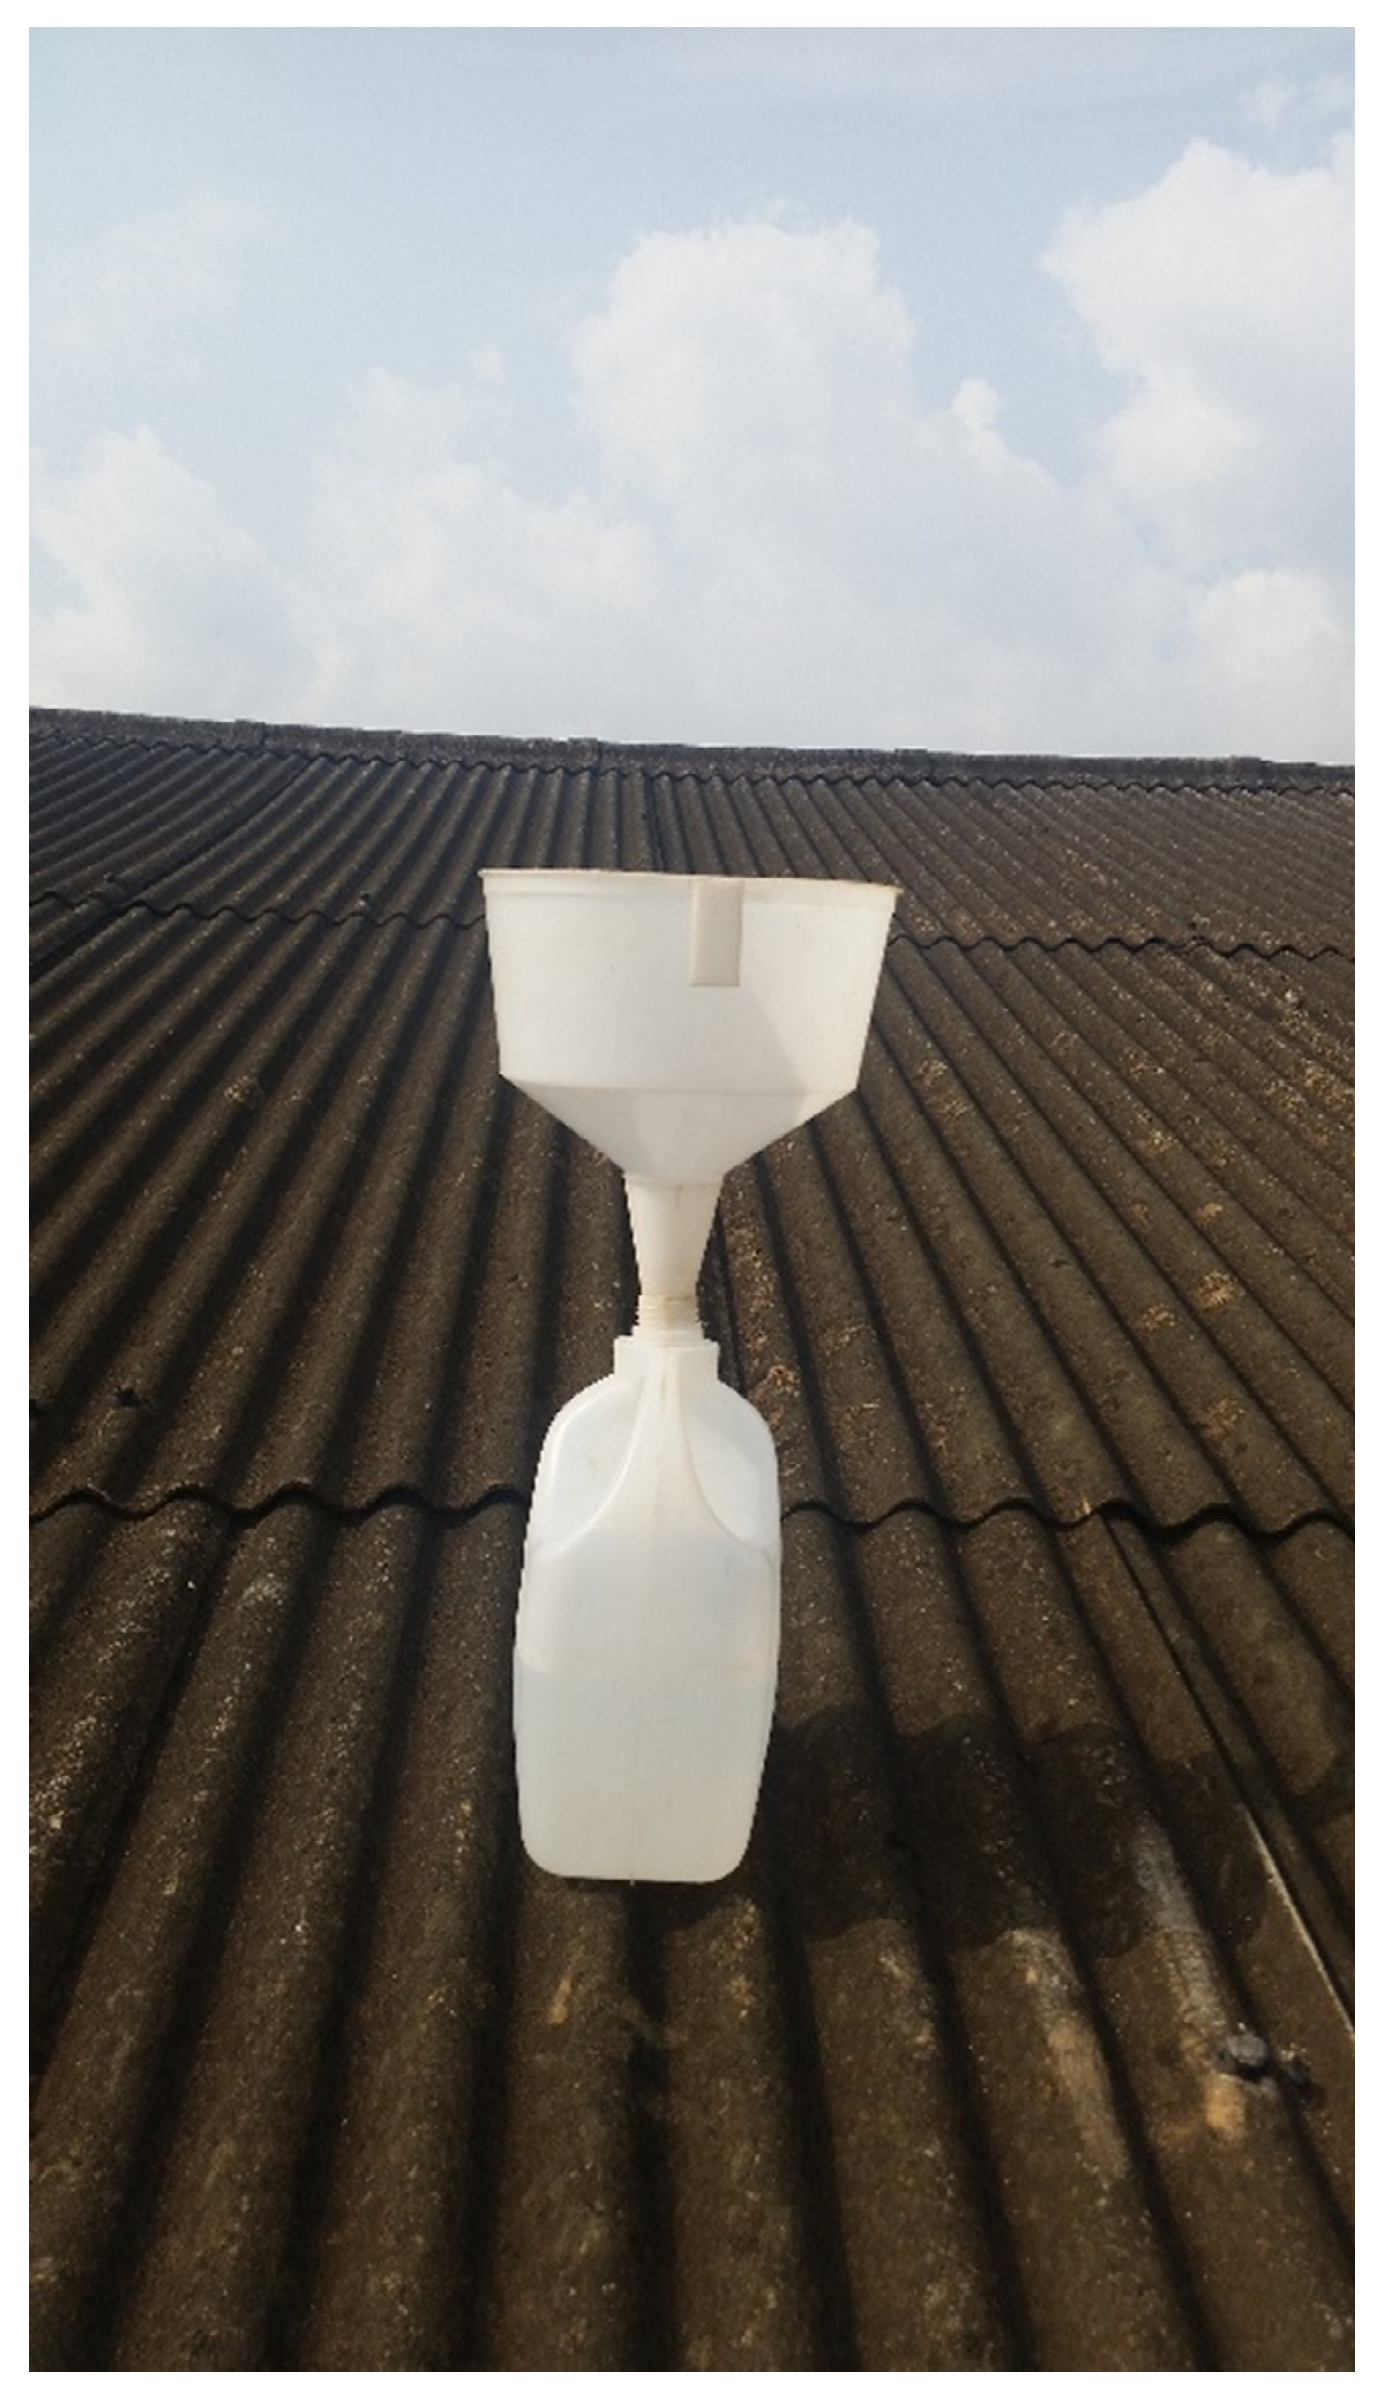
3. Materials and Methods
3.1. Total Deposition
3.2. Total Suspended Solids (TSS)
3.3. Net Deposition Rate
4. Results and Discussion
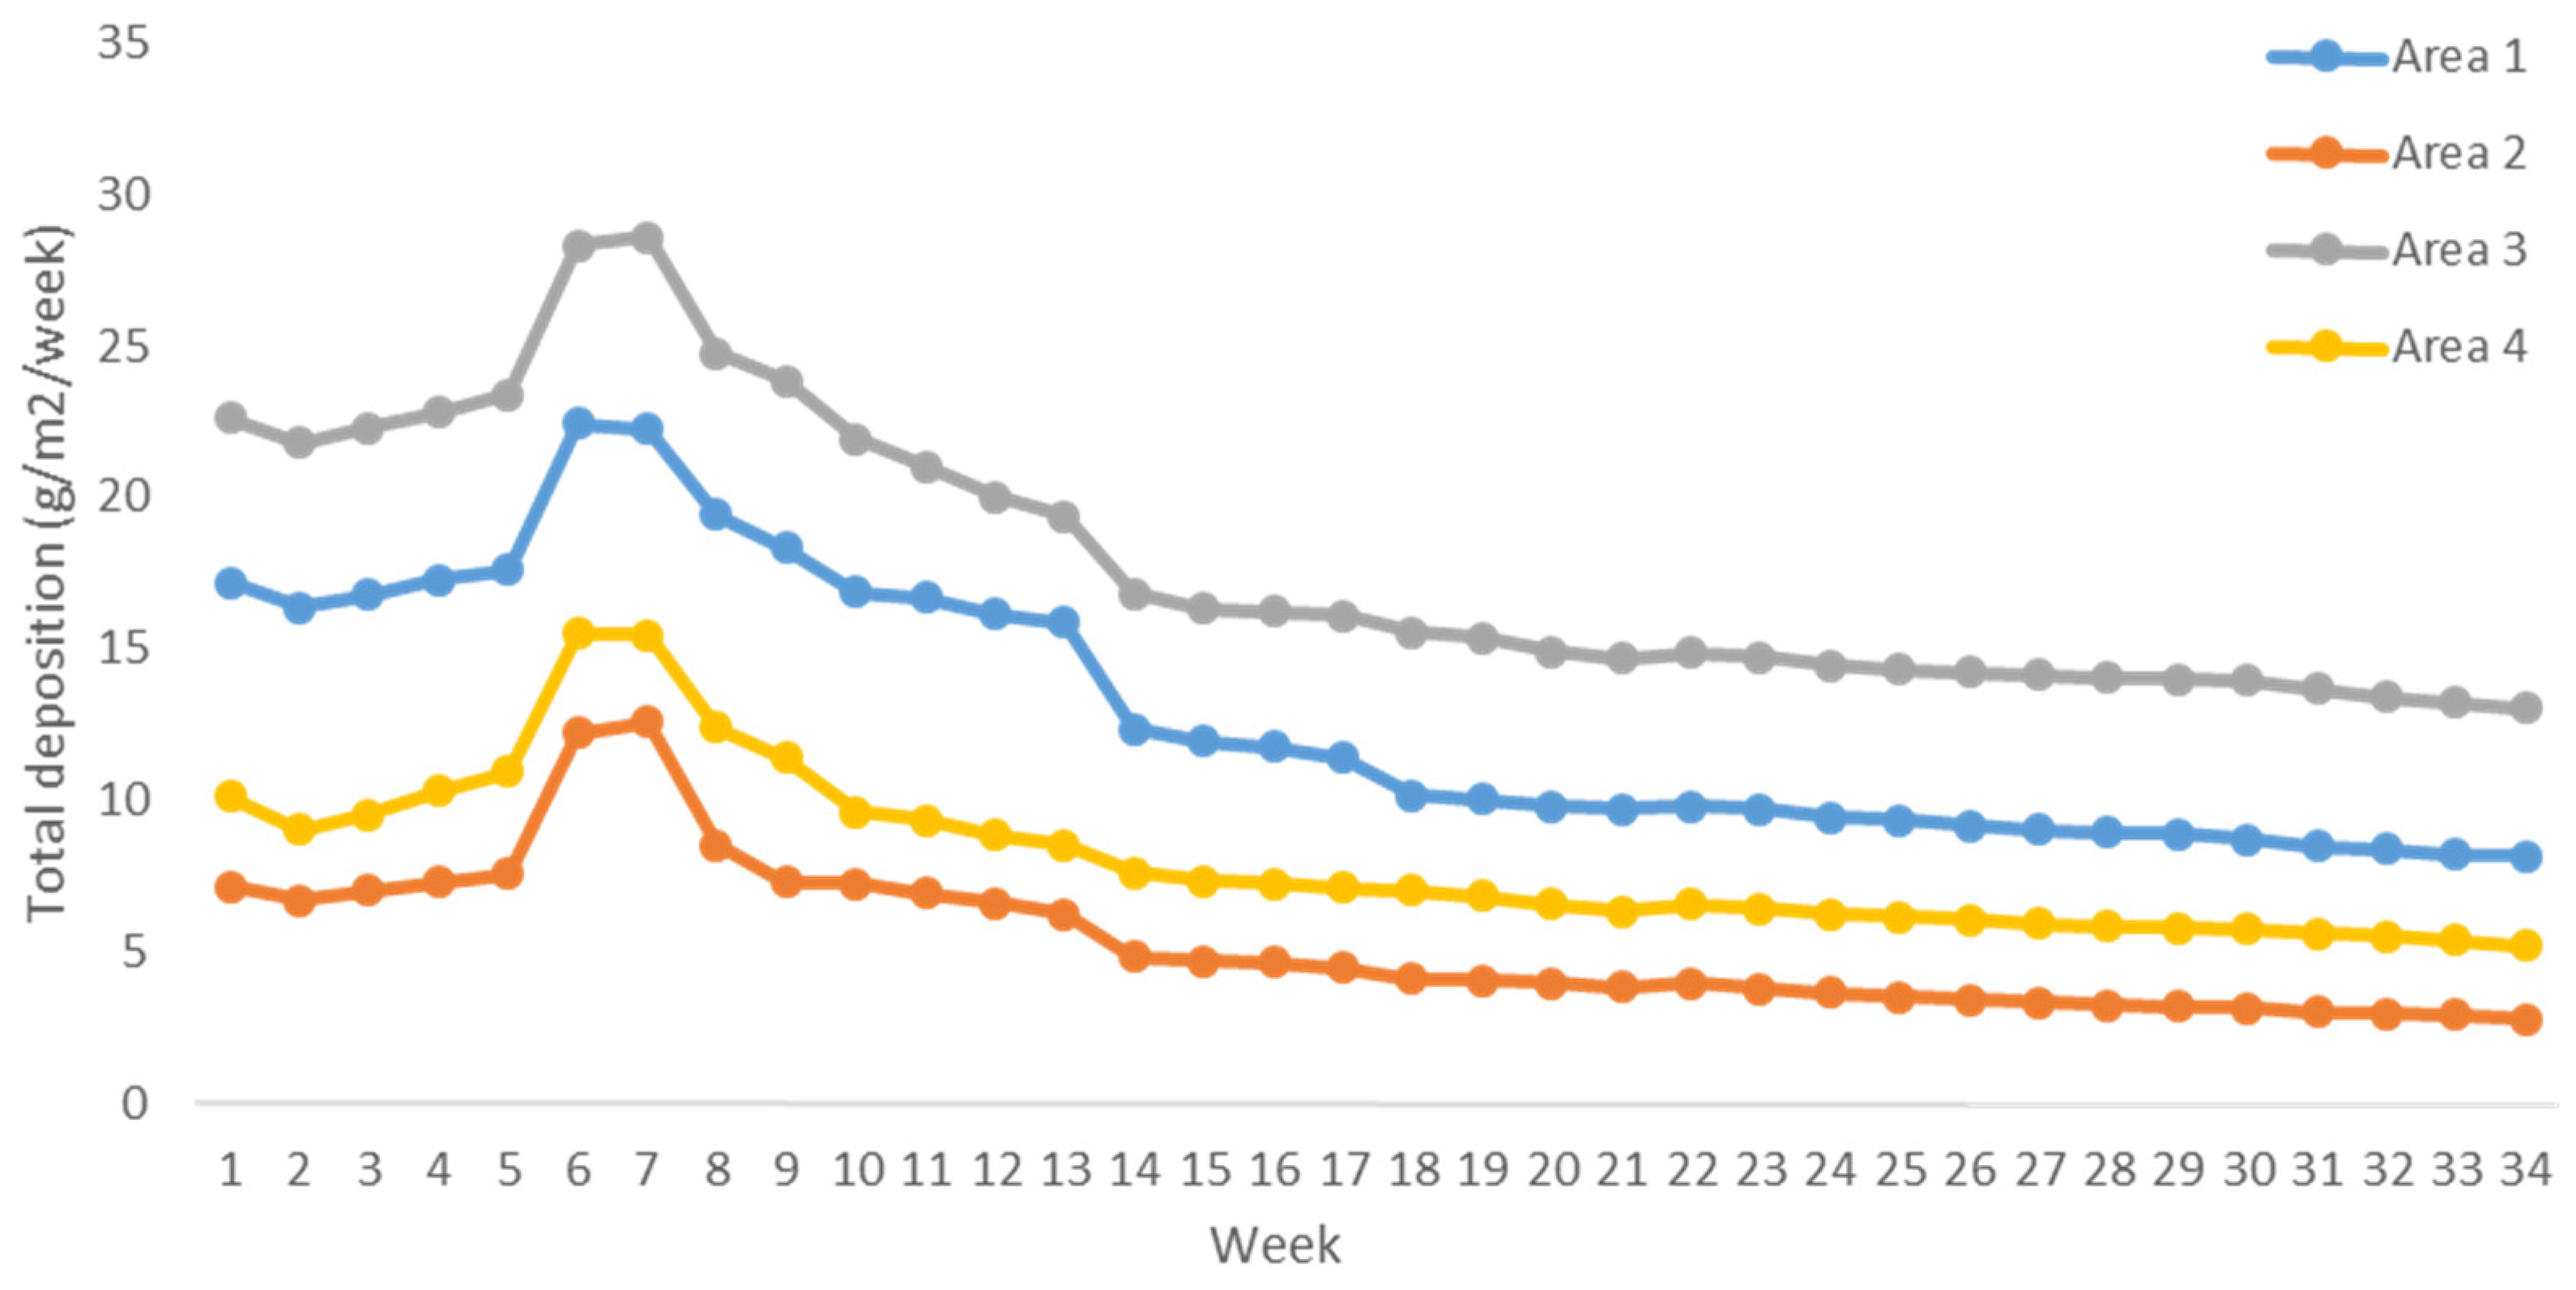
4.1. Total Depositions in the Four Areas
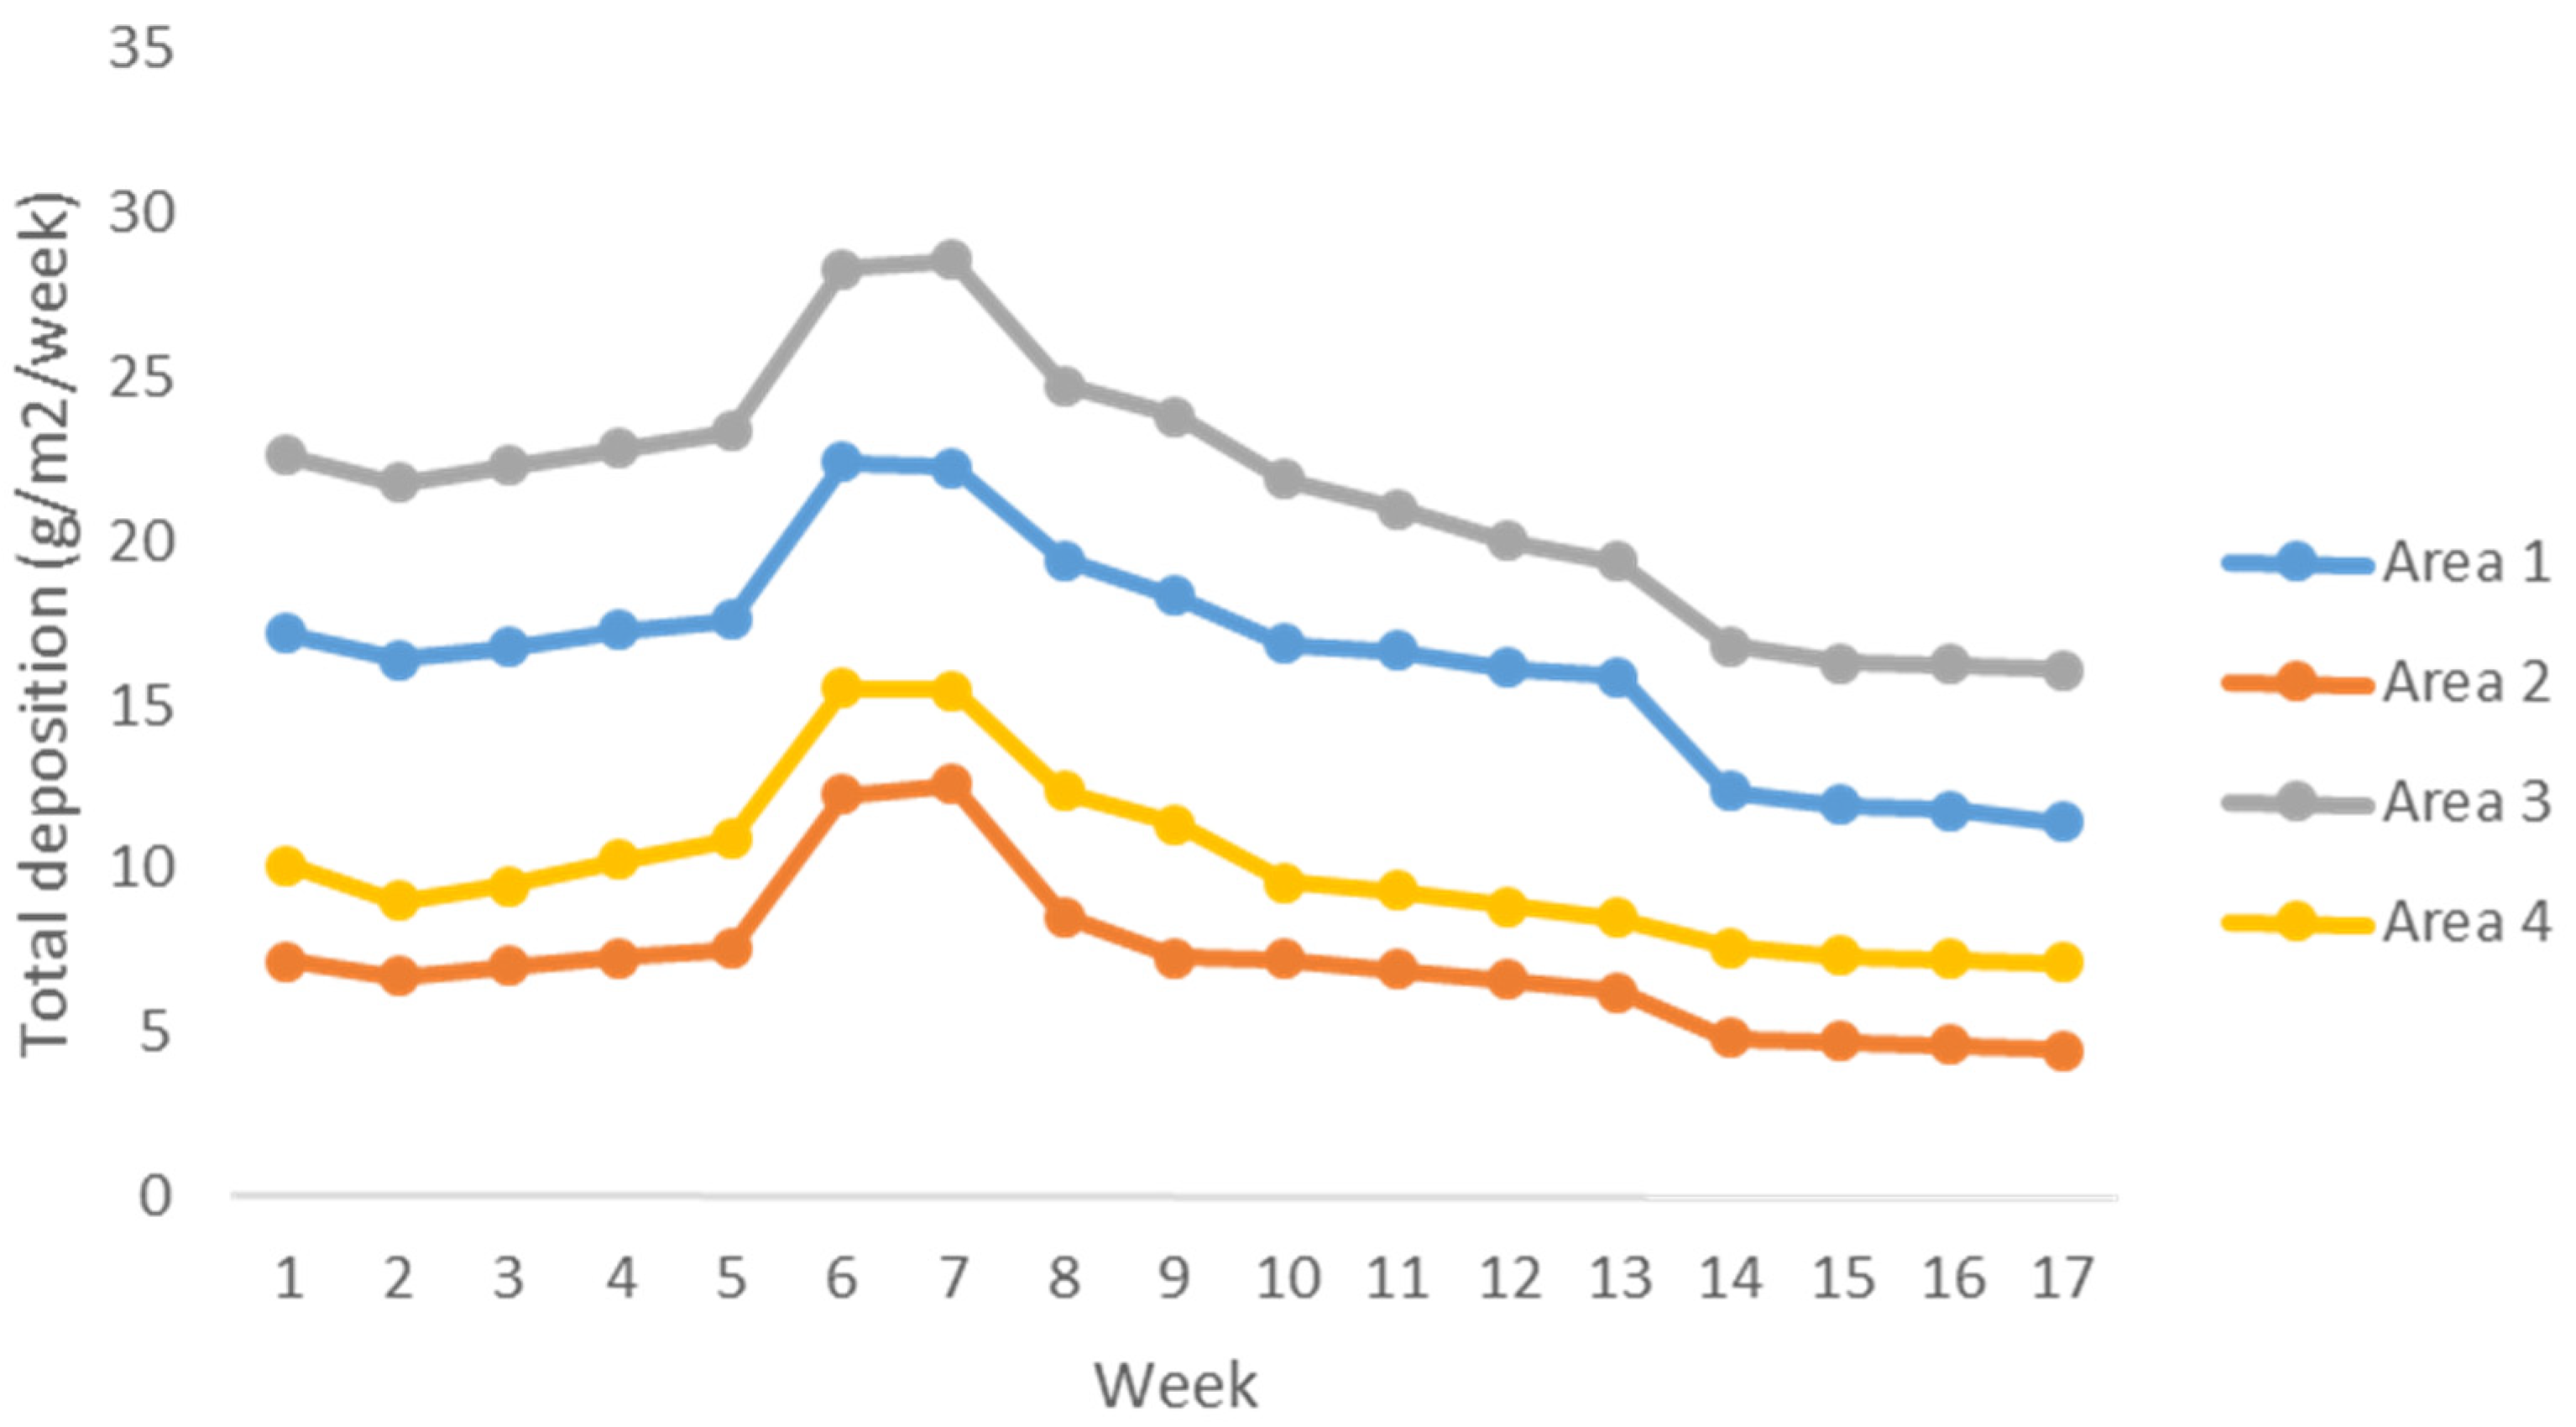
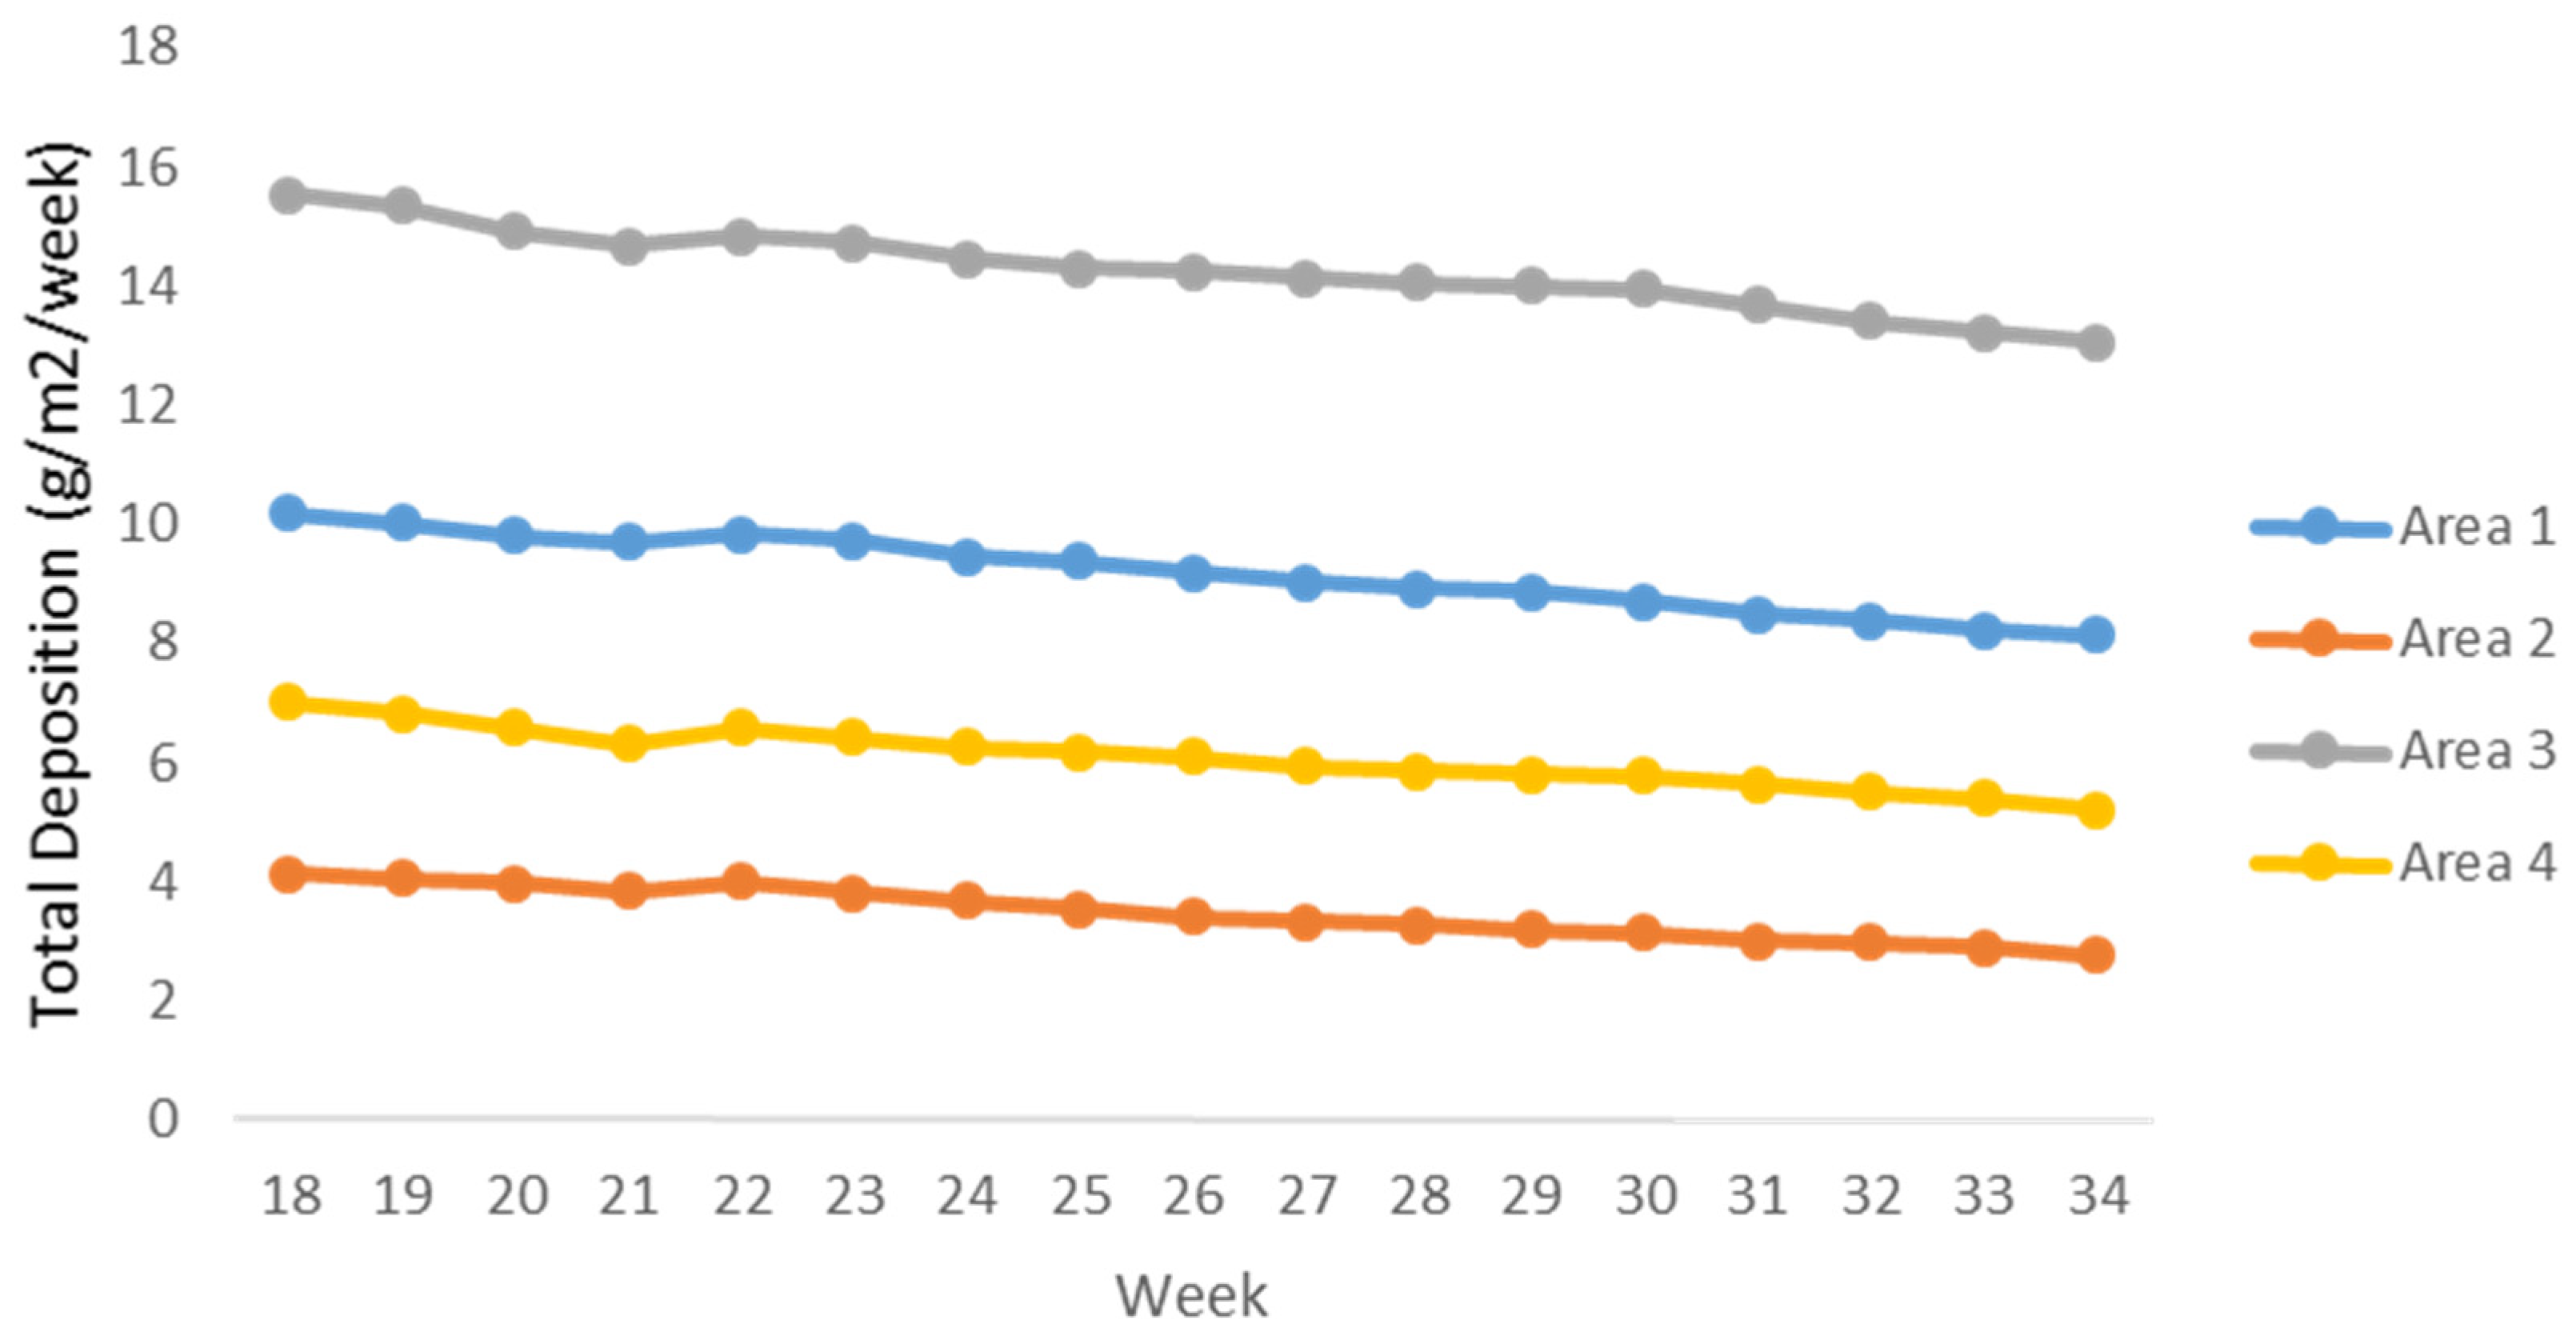
4.1.1. Total Depositions in the Dry Season
4.1.2. Depositions in the Rainy Season
4.1.3. Discussions and Analyses
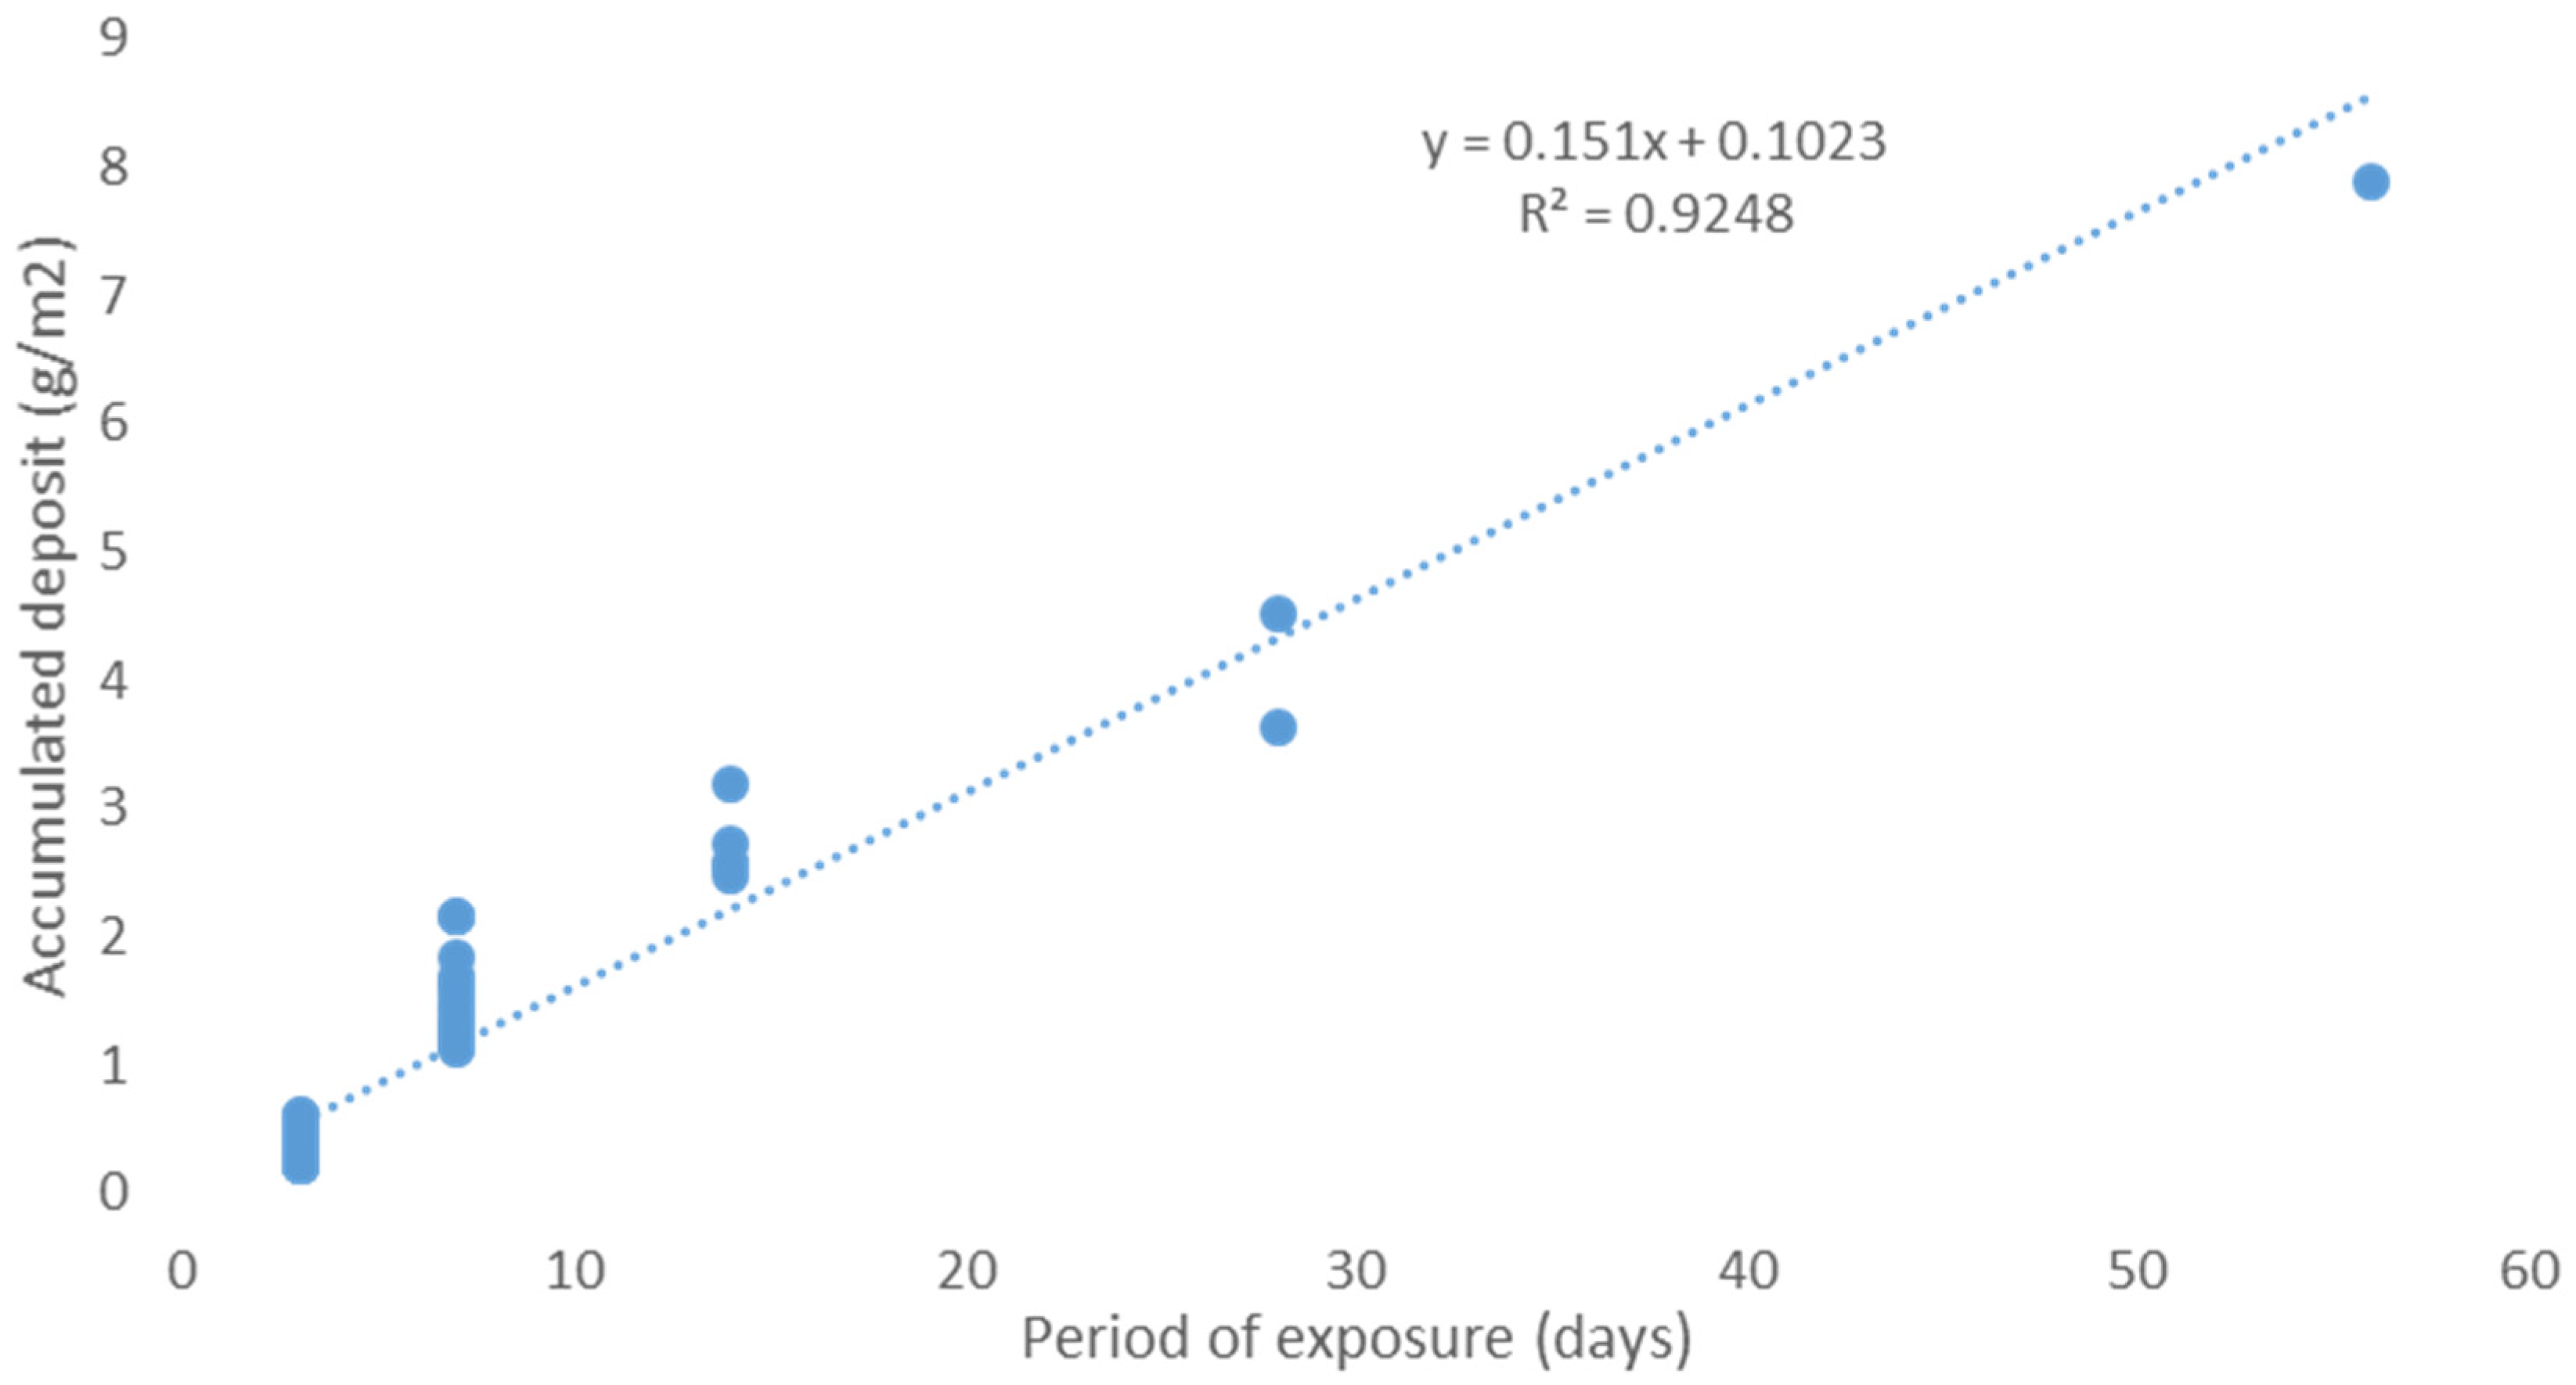
4.2. Accumulation of Sediment Matter over Time
5. Conclusions
Author Contributions
Funding
Institutional Review Board Statement
Informed Consent Statement
Data Availability Statement
Conflicts of Interest
References
- Swap, R.; Garstang, M.; Greco, S.; Talbot, R.; Kallberg, P. Sahara dust in Amazon basin. Tellus 1992, 44B, 133–149. [Google Scholar] [CrossRef]
- Pu, J.H. Velocity Profile and Turbulence Structure Measurement Corrections for Sediment Transport-Induced Water-Worked Bed. Fluids 2021, 6, 86. [Google Scholar] [CrossRef]
- Prospero, J.M. Long-term measurements of the transport of African mineral dust to the southern United States: Implications for regional air quality. J.Geophys. Res. 1999, 104, 15917–15927. [Google Scholar] [CrossRef]
- Prospero, J.M.; Lamb, P.J. African droughts and dust transport to the Caribbean: Climate change implications. Science 2003, 302, 1024–1027. [Google Scholar] [CrossRef]
- Pu, J.H. Efficient Finite Volume Numerical Modelling and Experimental Study of 2D Shallow Water Free Surface Turbulent Flows. Ph.D. Thesis, University of Bradford, Bradford, UK, 2008. [Google Scholar]
- Pu, J.H.; Pandey, M.; Hanmaiahgari, P.R. Analytical modelling of sidewall turbulence effect on streamwise velocity profile using 2D approach: A comparison of rectangular and trapezoidal open channel flows. J. Hydro Environ. Res. 2020, 32, 17–25. [Google Scholar] [CrossRef]
- Pu, J.H. Turbulent rectangular compound open channel flow study using multi-zonal approach. Environ. Fluid Mech. 2018, 19, 785–800. [Google Scholar] [CrossRef]
- Pu, J.H.; Hussain, K.; Shao, S.; Huang, Y. Shallow Sediment Transport Flow Computation Using Time-Varying Sediment Adaptation Length. Int. J. Sed. Res. 2014, 29, 171–183. [Google Scholar] [CrossRef][Green Version]
- Pinker, R.T.; Pandithurai, G.; Holben, B.N.; Dubovik, O.; Aro, T.O. A dust outbreak episode in sub-Sahel West Africa. J. Geophys. Res. 2001, 106, 22923–22930. [Google Scholar] [CrossRef]
- Sunnu, A.; Afeti, G.; Resch, F. A long-term experimental study of the Saharan dust presence in West Africa. Atmos. Res. 2013, 87, 13–26. [Google Scholar] [CrossRef]
- Sunnu, A.K. An experimental Study of the Saharan Dust Physical Characteristics and Fluxes near the Gulf of Guinea. Ph.D. Thesis, Université du Sud Toulon-Var, Toulon, France, 2006. [Google Scholar]
- WHO/UNICEF JMP. Progress on Sanitation and Drinking Water. 2015 Update and MDG Assessment. World Health Organisation/United Nations Children Fund Joint Monitoring Programme for Water Supply and Sanitation. 2020. Available online: http://www.who.int/water_sanitation_health/publications/jmp_2015_update_compressed.pdf (accessed on 28 September 2020).
- DFID. 2010 to 2015 Government Policy: Water and Sanitation in Developing Countries. Department for International Development. 2020. Available online: https://www.gov.uk/government/publications/2010-to-2015-government-policy-water-and-sanitation-in-developing-countries/2010-to-2015-government-policy-water-and-sanitation-in-developing-countries (accessed on 30 January 2020).
- WaterAid. Everyone, Everywhere: A Vision for Water, Sanitation and Hygiene Post-2015. 2020. Available online: http://www.wateraid.org/what-we-do/our-approach/research-and-publications/view-publication?id=b5203641-de28-4c9e-acf1-a511562ead45 (accessed on 25 November 2020).
- Dailyslave. India: 600,000 Die Annually from 50% Open Defecation Rate. 2020. Available online: http://www.infostormer.com/india-600000-die-annually-from-50-open-defecation-rate/ (accessed on 20 October 2020).
- Latif, A. North Gonja Districct Must End Open Defecation in Ghana. 2020. Available online: https://www.modernghana.com/news/528577/1/north-gonja-district-must-end-open-defecation.html (accessed on 20 October 2020).
- Payment, P.; Siemiatycki, J.; Richardson, L.; Renaud, G.; Franco, E.; Prevost, M. A prospective epidemiological study of gastrointestinal health effects due to the consumption of drinking water. Int. J. Environ. Health Res. 1999, 7, 5–31. [Google Scholar] [CrossRef]
- UNICEF. Common Water and Sanitation Related Diseases. 2020. Available online: http://www.unicef.org/wash/index_wes_related.html (accessed on 20 October 2020).
- Ashbolt, N.J. Microbial contamination of drinking water and disease outcomes in developing regions. J. Toxicol. 2004, 198, 229–238. [Google Scholar] [CrossRef] [PubMed]
- Malhotra, S.; Sidhu, S.K.; Devi, P. Assessment of bacteriological quality of drinking water from various sources in Amritsar district of northern India. J. Infect. Dev. Ctries 2015, 9, 844–848. [Google Scholar] [CrossRef]
- Sanitation Drive. What Diseases Are Associated with Poor Sanitation? 2015. Available online: http://sanitationdrive2015.org/faqs/what-diseases-are-associated-with-poor-sanitation/ (accessed on 20 October 2020).
- Maplandia. Google Maps World Gazetteer. 2020. Available online: Malandia.com/Nigeria/lagos/ikorodu/ikorodu (accessed on 2 October 2020).
- Characklis, G.W.; Dilts, M.J.; Simmons, O.D.; Likirdopulus, C.A.; Krometis, L.H.; Sobsey, M.D. Microbial partitioning to settle-able particles in stormwater. Water Res. 2005, 39, 1773–1782. [Google Scholar] [CrossRef] [PubMed]
- Krometis, L.A.; Noble, R.T.; Characklis, G.W.; Blackwood, D.; Sobsey, M.D. Assessment of E. coli partitioning behaviour via both culture-based and qPCR methods. Water Sci. Technol. 2013, 68, 1359–1369. [Google Scholar] [CrossRef]
- Mulitza, S.; Heslop, D.; Pittauerova, D.; Fischer, H.W.; Meyer, I.; Stuut, J.B.; Zabel, M.; Mollenhauer, G.; Collins, J.A.; Kuhnert, H.; et al. Increase in African dust flux at the onset of commercial agriculture in the Sahel region. Nature 2010, 466, 226–228. [Google Scholar] [CrossRef]
- Longe, E.O.; Omole, D.O.; Adewumi, I.K.; Ogbiye, A.S. Water resources use, abuse and regulations in Nigeria. J. Sustain. Dev. Afr. 2010, 12, 1–10. [Google Scholar]
- Ukabiala, C.O.; Nwinyi Obinna Abayomi, A.; Alo, B.I. Assessment of heavy metals in urban highway runoff from Ikorodu expressway Lagos, Nigeria. J. Environ. Chem. Ecotoxicol. 2010, 2, 34–37, ISSN 2141-226X. [Google Scholar]
- Lovett, G.M. Atmospheric Deposition of Nutrients and Pollutants in North America: An Ecological Perspective. Ecol. Appl. 1994, 4, 629–650. [Google Scholar] [CrossRef]
- EPA. Frequently Asked Questions about Atmospheric Deposition: A Handbook for Watershed Managers; Office of Wetlands, Oceans, and Watersheds, U.S. Environmental Protection Agency: Washington, DC, USA, 2001; p. 20460.
- Izquierdo, R.; Avila, A. Comparison of collection methods to determine atmospheric deposition in a rural Mediterranean site (NE Spain). J. Atmos. Chem. 2012, 69, 351–368. [Google Scholar] [CrossRef]
- Mendez, C.B.; Klenzendorf, J.B.; Afshar, B.R.; Simmons, M.T.; Barrett, M.E.; Kinney, K.A.; Jo Kirisits, M. The effect of roofing material on the quality of harvested rainwater. Water Res. 2011, 45, 2049–2059. [Google Scholar] [CrossRef] [PubMed]
- Olowoyo, D.N. Physicochemical characteristics of rainwater quality of Warri axis of Delta state in western Niger Delta region of Nigeria. J. Environ. Chem. Ecotoxicol. 2011, 3, 320–322. [Google Scholar] [CrossRef]


| Area 1 | Area 2 | Area 3 | Area 4 | |
|---|---|---|---|---|
| Minimum | 8.15 | 2.77 | 13.05 | 5.21 |
| Maximum | 22.42 | 12.58 | 28.6 | 15.51 |
| Average | 12.84 | 5.33 | 17.9 | 8.05 |
| Area 1 | Area 2 | Area 3 | Area 4 | |
|---|---|---|---|---|
| Minimum | 11.41 | 4.48 | 16.08 | 7.12 |
| Maximum | 22.42 | 12.58 | 28.6 | 15.51 |
| Average | 16.51 | 7.19 | 21.54 | 10.02 |
| Area 1 | Area 2 | Area 3 | Area 4 | |
|---|---|---|---|---|
| Min | 8.15 | 2.77 | 13.05 | 5.21 |
| Max | 10.18 | 4.12 | 15.53 | 7.01 |
| Average | 9.18 | 3.46 | 14.27 | 6.08 |
Publisher’s Note: MDPI stays neutral with regard to jurisdictional claims in published maps and institutional affiliations. |
© 2021 by the authors. Licensee MDPI, Basel, Switzerland. This article is an open access article distributed under the terms and conditions of the Creative Commons Attribution (CC BY) license (http://creativecommons.org/licenses/by/4.0/).
Share and Cite
John, C.K.; Pu, J.H.; Pandey, M.; Hanmaiahgari, P.R. Sediment Deposition within Rainwater: Case Study Comparison of Four Different Sites in Ikorodu, Nigeria. Fluids 2021, 6, 124. https://doi.org/10.3390/fluids6030124
John CK, Pu JH, Pandey M, Hanmaiahgari PR. Sediment Deposition within Rainwater: Case Study Comparison of Four Different Sites in Ikorodu, Nigeria. Fluids. 2021; 6(3):124. https://doi.org/10.3390/fluids6030124
Chicago/Turabian StyleJohn, Chukwuemeka K., Jaan H. Pu, Manish Pandey, and Prashanth R. Hanmaiahgari. 2021. "Sediment Deposition within Rainwater: Case Study Comparison of Four Different Sites in Ikorodu, Nigeria" Fluids 6, no. 3: 124. https://doi.org/10.3390/fluids6030124
APA StyleJohn, C. K., Pu, J. H., Pandey, M., & Hanmaiahgari, P. R. (2021). Sediment Deposition within Rainwater: Case Study Comparison of Four Different Sites in Ikorodu, Nigeria. Fluids, 6(3), 124. https://doi.org/10.3390/fluids6030124