Abstract
The precautionary measures recommended during the current COVID-19 pandemic do not consider the effect of turbulent airflow. We found the propagation of droplets and aerosols highly affected by this condition. The spread of respiratory droplets by the action of sneezing is characterized by the dynamics of two groups of droplets of different sizes: Larger droplets (300–900 μm) have a ballistic trajectory and can be spread up to 5 m, while a cloud of smaller droplets (100–200 μm) can be transported and dispersed at longer distances up to 18 m by the action of the turbulent airflow. In relation to the spread of exhaled aerosols during respiration, these remain in the air for long periods of time. In the presence of intense or moderate airflow, this set of particles follow airflow streamlines, and thus their propagation is directly determined by the air velocity field. Given the scientific evidence, these results should be considered in public debate about the aerodynamic dispersion characteristics of scenarios where social interactions occur and about the measures to mitigate the spread of the virus.
1. Introduction
David Heymann, from the London School of Hygiene and Tropical Medicine, who was one of the leaders during the SARS outbreak and is a public health expert, claimed on 20 February 2020 that the propagation of COVID-19 in open spaces was one of the important unknowns yet to be defined [1]. Currently, the general recommendations by the World Health Organization (WHO), followed by several governments and health agencies, are based on keeping a distance of at least 1 m from persons who are coughing or sneezing [2]. These measures are based on models and estimates that are several decades out of date [3], and recent work has demonstrated that this recommendation may underestimate the distance travel by droplets during coughing and sneezing [4]. The discussion about precautionary measures is indeed important, since it may affect the steps taken to organize the free or restricted circulation of people in urban places and to minimize contagion, including the use of masks and other measures. Likewise, examining these urban scenarios is important. In the last two decades, cities have become the world’s economic hubs for production, innovation, and trade (accounting for 80% of global GDP) [5]. It is therefore not a surprise that the current restrictions to urban mobility observed worldwide, including the movement of people in markets and other crowded public spaces, have created enormous economic pressures to people and to local and national governments. Subsequently, we offer some reflections on the relevance of these findings in the context of a pandemic governance at an urban scale.
Regarding the airborne character of COVID-19, there is a lack of consensus within the scientific community, and some opinions are controverted [6,7]. Several important aspects related to the spread and infectiousness of the virus are still not well understood. For example, the RNA material of the virus has been found far from its sources; it is unknown whether the amount of material found might account for an effective infectious potential [8,9]. These and other issues have expanded the discussion further, meaning not only within the scientific community but to the policy and economic spheres, where accurate precautionary measures are essential to reduce risks and economic impacts.
The velocity of the exhaled airflow during a sneeze is much higher than in breathing or even coughing [10,11]. A sneeze exhales more than a million droplets up to a distance of 3 m (in the absence of wind or another source of airflow). However, the concentration of droplets at 1 m of distance from its source is reduced down to 0.001% [10], which coincides with the mentioned distancing recommendations of the WHO [8]. Nevertheless, due to Stokes’ drag, the smaller droplets (<5–10 μm) stay suspended in the air for prolonged periods of time—a situation that is conducive to airborne transmission [10,12].
The WHO has not yet subscribed to the fact of COVID-19 spreading via airborne aerosols. This decision is based on a publication from March 2020 that considered 75,465 cases of COVID-19 analyzed in China with none attributed directly to this mechanism [8,12].
Several publications support the existence of airborne contagion of COVID-19, with accumulated evidence shown [13,14]. In fact, 239 scientists from 32 countries sent a letter to the WHO stating that COVID-19 can be transmitted through the air [15]. The WHO’s reaction to the inquiry from the scientific community has been to accept emerging evidence for the airborne contagion of COVID-19 [16], which has once again brought into question the airborne nature of its contagion. The controversy on this issue is evident. However, the idea of probable airborne contagion is not instilled in the public or in public debate. This situation is extremely serious given that, in the case of airborne contagion, the precautionary measures are very different from those adopted up to now based on physical distancing, hand washing, and use of masks.
Although there are available studies aimed at analyzing the spread of respiratory droplets [17,18,19,20,21,22] and aerosols [23,24], up to our reach there is only one study that has attempted to estimate the effect of an airflow over the spread of respiratory droplets exhaled during a respiratory symptom [25]. This situation would be applicable both to outdoor urban settings exposed to small-scale microclimatological wind and to indoor situations exposed to airflow caused by the natural or artificial ventilation of the space. In both cases, the air speed could reach magnitudes that affect the range of propagation and residence times commonly considered and, therefore, affect the recommended precautionary measures. The problem with [25] is that it considers an unrealistic scenario, with domain dimensions smaller than the total propagation range for which it is not possible to quantify the maximum propagation, but an even more important situation is that the airflow which propagates the particles is considered uniform since the domain does not consider the interaction between the airflow and the body; therefore, it could underestimate the importance of turbulence on the aerodynamic dispersion of droplets.
The objective of this manuscript is to obtain realistic aerodynamic dispersion characteristics of settings where social interactions take place using computational fluid dynamics tools, through studying the effects of turbulent airflow over the aerodynamic dispersion of respiratory droplets and exhaled aerosols during sneezing and breathing, respectively.
2. Governing Equations
2.1. Aerodynamics
We adopted a wall-modelled large eddy simulation (WMLES) approach to predict a fully 3D turbulent flow [26]. We first solved the filtered Navier–Stokes equations:
and the following energy conservation equation,
In order to handled buoyancy in the simulations we considered a temperature dependent density for the homogeneous phase and adopted a Boussinesq approximation for density variation in the momentum conservation equation (Equation (2)). Here, is the tensor of forces associated with the molecular viscosity,
and is the subgrid stress tensor that results from the filtering process. Based on Boussinesq’s hypothesis, subgrid stresses are calculated from
where is the strain rate of the subgrid scales, given as
and is the subgrid eddy viscosity described using the Smagorinsky model [27]:
where Ls is the mixing length for subgrid scales,
and the strain rate magnitude calculated from
Here, k is the Von Kármán constant, d the nearest wall distance, the Smagorinsky constant, and is the local grid scale, which is estimated from
where V is the cell volume.
In wall-bounded turbulent flows, computational grids must consider a sufficiently fine resolution to capture the smallest structures generated within boundary layers, which implies high computational cost. The WMLES is a variant of the LES approach, which allows the flows bounded by walls to be described without the need of very fine grids within boundary layers. In the near wall region, the subgrid viscosity is calculated with the use of a hybrid length scale [26],
where is the distance to the wall and = 0.2.
2.2. Respiratory Droplets and Aerosols Propagation
Coupled with the fluid flow equation, we use Lagrangian particle tracking to describe respiratory droplets and aerosol propagation. Lagrangian tracking solves the following equation to describe particle trajectories:
with as the drag force per unit of particle mass:
where is the air velocity, the particle velocity, the air viscosity, the air density, the density of the particle, and the particle diameter. Re is the relative Reynolds number:
In the case of submicron particles like aerosols, we adopted a Stoke’s form for the drag force including Cunningham’s correction [28]:
where is the Cunningham’s factor
with as the molecular mean free path.
3. Computational Model
In order to describe the aerodynamic dispersion of polydisperse respiratory droplets and aerosols exhaled during a sneeze and during simple breathing by a turbulent airflow, we implement a computational model using the framework of the commercial computational fluid dynamics (CFD) code ANSYS-FLUENT 18.2. Anthropometric variables (person height, mouth and nose open areas) and the variables that define the actions of sneezing and breathing (exhaled airflow, duration time, volume fraction and diameter distribution of exhaled droplets and aerosols) were taken from the literature [10,11,20]. The microclimatologic wind condition was defined according to [29,30] and represents a medium and high intensity wind, including its attenuation with respect to the difference between the average velocity magnitude measured in the periphery and the urban city centers. These wind intensities represent a probable condition in an exposed outdoor area, however, according to [29] air velocity magnitudes of the same order could be present in closed spaces due to the ventilation, as well as in situations subjected to less standard conditions in which more intense ventilation could have associated air masses moving at speeds equal to or greater than those considered [29,30]. All variables defining the exhaled flow condition and the airflow scenarios under evaluation are summarized in Table 1. Droplet diameter distribution of unimodal sneeze is shown in Figure 1 from [11].

Figure 1.
Unimodal sneeze droplet diameter distribution from [11]: experimental data collected (left panel); Gaussian fitting curve (right panel).

Table 1.
Sneeze, breathing, and site condition parameters.
Table 1.
Sneeze, breathing, and site condition parameters.
| Variable | Value | References |
|---|---|---|
| Freestream velocity magnitude of airflow | 2 and 4 m/s | [29,30] |
| Environment temperature | 26 °C | [31] |
| Freestream turbulence intensity | 2% | [32] |
| Nasal and oral area | 1.5 and 2.5 cm2 | [10] |
| Body temperature | 31 °C | [31] |
| Sneeze total time 1 s | 1 s | [10,33] |
| Airflow during sneeze | 250 L/min | [10,33] |
| Volume fraction of droplets during sneeze | 1 × 10⁻⁵ | [20] |
| Diameter distribution of droplets during sneeze | 100–900 μm | [11] |
| Diameter distribution of aerosols | 0.5–2.25 μm | [34] |
| Breathing frequency | 15.5 times/min | [33,35] |
| Airflow temperature during breathing | 34 °C | [33,35] |
| Pulmonary ventilation rate during breathing | 10 L/min | [33,35] |
| Volume fraction of aerosols during breathing | 2.13 × 10⁻¹⁴ | [34] |
| Diameter distribution of aerosols during breathing | 0.5–2.25 μm | [33] |
Figure 2 shows views of the model domain. In order to describe an urban scenario exposed to some turbulent airflow, we include a standard anthropometric person surrounded by several buildings of different heights. With this consideration, we seek to describe the person–infrastructure–airflow interaction and in this way generate a turbulent airflow environment that interacts with droplets and aerosols exhaled by a person sneezing or breathing. Although this model represents an outdoor condition, the results predicted by these simulations would also describe indoor situations where natural ventilation or the forced convection induced by ventilation equipment may produce high air velocities and therefore influence droplet or aerosol aerodynamic dispersion. The control volume was discretized using the computational grid shown in Figure 3. This computational grid consists of 3 million cells distributed properly in order to generate a high-resolution area around the person and through the zone where it is desirable to more accurately describe the flow field. The time step considered was 0.01 s.
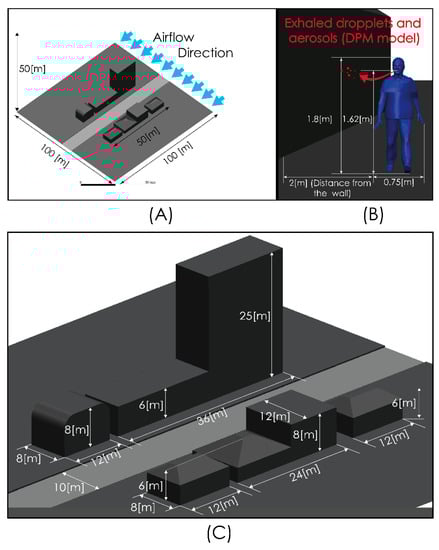
Figure 2.
Computational model dimensions. Global views (A,C) and near person zone (B).
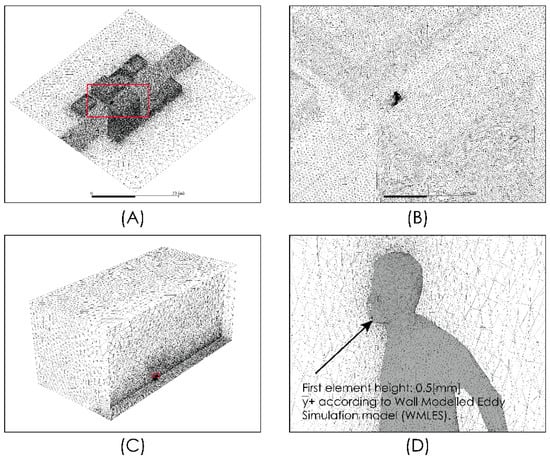
Figure 3.
Domain discretization. Global views (A–C) and near person zone (D).
4. Simulations
We simulated the droplet and aerosol dispersion exhaled during sneezing and breathing under conditions representing moderate and high airflow intensities. The simulated conditions are summarized in Table 2.
Table 2.
Simulated conditions.
The predictions obtained with the computational model are shown in this section. We analyzed the aerodynamics dispersion given the turbulent flow in the vicinity of a person who is breathing normally or experiencing respiratory symptoms like a sneeze.
With the objective of verifying the grid convergence, we compared the prediction regarding the aerodynamic dispersion characteristics of the respiratory drops exhaled in a scenario considering an airflow of 2 m/s for two computational grids of 3 and 5 million elements, within a time interval of 5 s. The results of this analysis are summarized in Table 3. We show that an increase in the number of cells of the computational grid from 3 to 5 million does not have a significant impact over model predictions, maintaining a low relative difference. Figure 4 shows the comparison between the aerodynamic dispersion range and the dimensions of cloud drops for a time interval of 5 s after sneezing.
Table 3.
Grid convergence analysis.
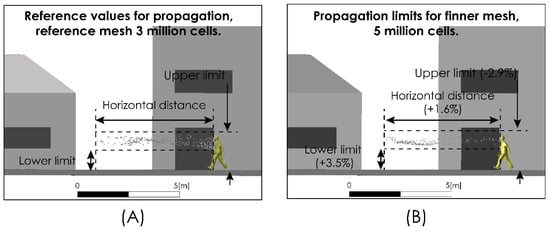
Figure 4.
Grid convergence analysis. Droplet aerodynamic dispersion: 3 million cells grid (A) and 6 million cells grid (B).
4.1. Comparison with Existing Experimental Data
We compared the level of our predictions with the results reported by [25]. Up to our reach, the study in [25] is the only one available in the literature that, while aimed at predicting the spread range of respiratory droplets, has included the effect of airflow. This comparison must be carried out on the merit of some important differences in terms of the realism of model characteristics adopted for both approaches in order to determine the effect of an airflow on the dispersion of drops. In particular, it is necessary to consider that the flow field simulated in [25] does not include the effect that the obstacle represented by the body and head of the person has on the velocity field and the turbulence intensity, which generates a zone of high shear flow, low velocity magnitude, and high turbulence (Figure 5) in the zone where the drops are discharged, which is an important difference with respect to the uniform velocity profile considered in [25] for the freestream airflow. Figure 6 shows the comparison for the aerodynamic dispersion of respiratory droplets for moderate and intense airflow conditions. The next section will show how larger drops develop ballistic trajectories and fall rapidly to the ground while the smaller drops (marked in red in Figure 6) generate a cloud of drops (Figure 6C,D) that is dispersed and transported by the effect of turbulent airflow. Although the propagation distances predicted by [25] and by this work were found similar (Figure 6), the zone of low speed and high turbulence predicted by our simulation (Figure 5) generates a delay in the propagation with respect to [25] and a cloud of greater dispersion, unlike the nucleus more bounded described by [25]. In addition to this difference in propagation velocity of cloud drops, the following sections will show that the total propagation distances and residence times are greater than those reported in [25] because of the important role of turbulence over the aerodynamic dispersion of drops.

Figure 5.
Vector velocity field near person. Moderate intensity airflow of 2 m/s (A) and intense airflow of 4 m/s (B).
Figure 6.
Comparison of droplet propagation range. 4 km/h (1.1 m/s) from [25] (A); 15 km/h (4.1 m/s) from [25] (B); current predictions 2 m/s (C); current predictions 4 m/s (D).
4.2. Results
Figure 7 shows the velocity magnitude distribution for the conditions under evaluation considering an airflow from left to right of intensities 2 and 4 m/s. Figure 7A,C show localized zones whose velocity magnitude is higher than the freestream velocity magnitude. These spots of high velocity magnitude arise from the interaction between the freestream airflow and the infrastructure because of the detachment of the boundary layers and the recirculation produced with the turbulent shear flow. In both cases, i.e., the downstream of the person, a zone of low velocity magnitude is generated which extends approximately 5 m. In the views shown in Figure 7B,D, a localized zone of even lower velocity extends 2 m downstream of the person around the torso and head with a potential effect on the spread of respiratory droplets and aerosols.
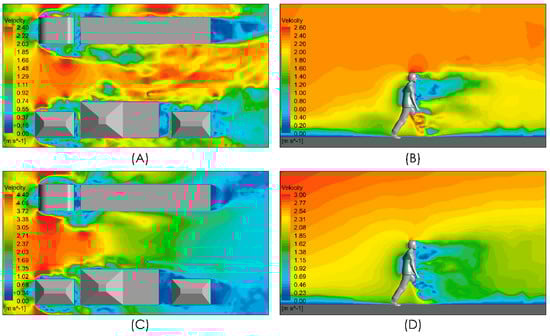
Figure 7.
Distribution of air velocity magnitude. Top panels show the distribution in a horizontal plane at a 1m height and in a vertical plane close to the person. Moderate intensity airflow of 2 m/s (A,B) and intense airflow of 4 m/s (C,D).
Figure 8 shows the subgrid viscosity distribution in the vicinity of the person. This variable is associated with the turbulence model used and is related to turbulent diffusion [36]. Zones of high subgrid viscosity will have associated high values of turbulent diffusion, where “high” means higher than the background value. For both airflow intensities, Figure 8A,B, show a zone of high turbulent diffusion downstream of the person caused by the shear flow. This area is larger in the case considering a higher airflow intensity condition, i.e., Figure 8B. In both cases, the zone of high turbulent diffusion is located downstream of the torso and head zone, which would enhance the aerodynamic dispersion and therefore the cloud drops dimensions. In relation to the propagation of the respiratory droplets exhaled during the respiratory symptom of a sneeze, Figure 9 shows two snapshots of droplet propagation in the presence of different airflow conditions. In Figure 9A,C, the results show that the largest droplets exhaled during that respiratory symptom in the range of 300–900 μm follow ballistic trajectories and fall rapidly to the ground in the sneeze. In scenarios under the effect of some airflow, this range reach 5.34 m for 2 m/s and 4.47 m for 4 m/s. These results are shown in Figure 9B,D respectively. In this same respiratory symptom, the fate of the smallest drops, in the range 100–200 μm, is different. Drops of this size are dragged to a considerably greater range: The results show that a turbulent airflow field (Figure 5) has a much more dominant effect on this set of particles. For the case considering a wind of 2 m/s, the range that this set of particles reaches is 11 m, while for a wind of higher intensity of 4 m/s, the range increases to 18 m (Figure 10).
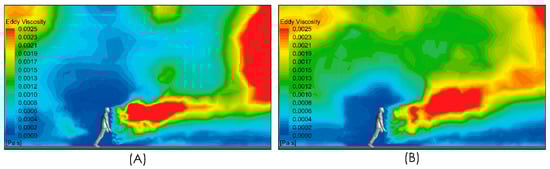
Figure 8.
Side view of subgrid viscosity distribution in the near person zone. Moderate intensity airflow of 2 m/s (A) and intense airflow of 4 m/s (B).
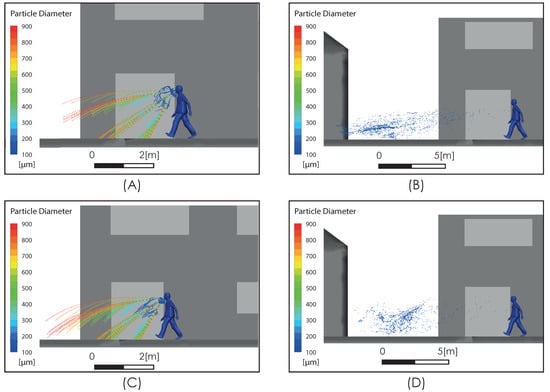
Figure 9.
Respiratory droplet propagation during sneeze at t = 0.6 s (A,C) and after sneeze at t = 5 s (B,D). Moderate intensity airflow of 2 m/s (A,B) and intense airflow of 4 m/s (C,D).
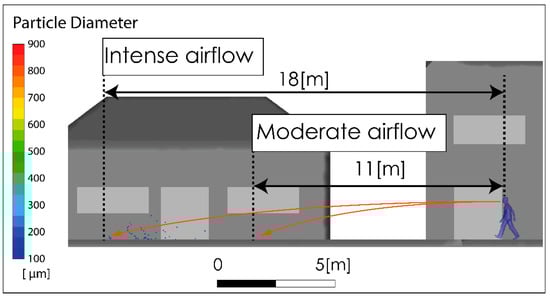
Figure 10.
Visualization of the maximum range of small drops produced by a sneeze, with moderate and high intensity airflow.
The spread of exhaled aerosols during respiration and speech and the effect of airflow on their spread are shown in Figure 11. The trajectories of the particles show that the aerosols remain in the air for long periods of time. When this situation is exposed to a moderate or high intensity wind field, this set of particles is propagated long distances, as shown in Figure 11B,D.
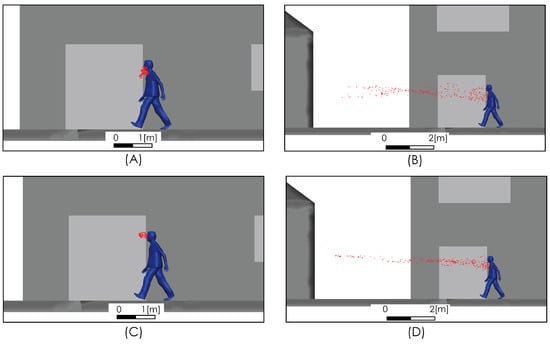
Figure 11.
Aerosol propagation at t = 1 s (A,C) and t = 5 s (B,D). Moderate airflow of 2 m/s (A,B), and intense airflow of 4 m/s (C,D).
5. Discussion
Our results indicate that the propagation of droplets and aerosols is highly affected by the turbulent air mass movement. The respiratory droplet aerodynamic dispersion range of our predictions considering the effect of turbulent airflow was found to be several times over the typical precautionary recommendations considered by public health systems [3,37]. This situation is worrying because, given the evidence shown in the literature [17,18,19,20,21,23,24,25], adopting the recommended distancing measures in scenarios in which moving air masses occur (such as bus stops, shopping boulevards, outdoor queues for COVID-19 testing or ventilated indoor spaces) could give a false sense of security and produce an adverse situation in terms of mitigating contagion. Moreover, in all cities there are certain public spaces where a dense circulation of people is difficult to avoid, such as those mentioned above, even during lockdowns (for example, in outdoor queues for COVID-19 testing). These spaces tend to be crowded by visitors from different parts of the city, increasing the risk of multiple outbreaks at urban scale.
Our results confirm the strict use of masks in certain urban (outdoor) spaces where social distancing is not possible, and this could inform future public policies related to urban mobility, i.e., regulation on behavior when queuing (shopping and testing), outdoor sport, and cultural activities, special measures during different weather conditions (e.g., rainy seasons), among others.
Likewise, the results may support certain approaches on mass vaccination. As the world is working hard toward COVID-19 vaccines, calls for preparedness and planning for mass vaccination by public health agencies is undergoing [38]. One of the mass vaccination setups successfully used in the past for mass testing and vaccination is the drive-through method [39,40]. Although the use of cars for mass testing and vaccination may produce effective results and reduce co-infection impacts for both patients and health workers, the drive-through approach implies important logistics challenges for health and urban authorities. For instance, in some places like in the Latin America and the Caribbean region, informal settlements represent an important part of urban population (i.e., 21% or 105 million people) that generally lack access to private car and have poor access to public transportation [41].
In relation to the spread of aerosols, given that they remain in the air for long periods of time, they can be spread long distances by moving air masses. The propagation distance and the areas of high concentration are determined by multiple variables, including the architecture and the size of the spaces; the speed of the moving air masses, which are influenced by the intensity of airflow; the location and power of the ventilation equipment; and the distribution of flows that enter or are discharged through windows, doors, or accesses.
Our description of the transport of aerosols by means of moving air masses along with the recent evidence demonstrating the effectiveness of contagion via airborne aerosols compounds the importance of adopting stricter precautionary measures. These results should contribute to the public debate and the adoption of such measures as preferring social gatherings in open spaces and planning ventilation systems and filter usage in closed spaces [13], including work places, shopping centers, cinemas, art galleries, aircraft cabins, trains, buses, etc.
6. Summary and Conclusions
We described the aerodynamic dispersion of droplets and aerosols exhaled by a person of standard anthropometric characteristics (1.62 m height), including the role of the turbulent movement of air masses caused by the wind in open spaces and by natural or artificial ventilation in closed spaces. This consideration has allowed for a more realistic characterization of the contagious aspects of scenarios where social interactions occur, and they could be considered for further studies and used to inform specific urban policies related to controlling the COVID-19 pandemic.
Regarding the largest respiratory droplets exhaled during a sneeze in the range of 300–900 μm, our predictions indicate that these group of drops follow ballistic trajectories and fall rapidly to the ground reaching a range of 5.34 m and 4.47 m for air velocity magnitudes of 2 m/s and 4 m/s respectively. Given the important role of the turbulent airflow over the aerodynamic dispersion, the smallest respiratory droplets between 100–200 μm are carried to a considerably greater range reaching 11 m for air velocity magnitude of 2 m/s, while for a higher velocity magnitude of moving air of 4 m/s, the range increases to 18 m.
In the case of the aerosols exhaled during respiration and speech, the trajectories of the particles show that they remain in the air for long periods of time. In the case of this situation being exposure to movements of the air mass, this set of particles is propagated long distances limited only by the confinement of the space in which they are discharged. Furthermore, the location of accumulation zones and, therefore, high concentration areas will be determined by the characteristics of the flow field that transports them and the architecture that confines them.
Author Contributions
Conceptualization, P.C.; methodology, P.C., N.G; investigation, P.C., N.G, V.S.; writing—original draft preparation, P.C.; writing—review and editing, P.C., N.G., V.S.; visualization, N.G.; supervision, P.C. All authors have read and agreed to the published version of the manuscript.
Funding
This research was funded by the Interdisciplinary Center for Aquaculture Research (INCAR; FONDAP Project N°15110027; CONICYT).
Data Availability Statement
The data files can be found at https://msetbiobio-my.sharepoint.com/:f:/g/personal/pcornejo_mset_cl/EnAc8TtGsClOjXOcFb-gLKcBIxgNBNfm5o67C9XXlJzHng?e=TMsdwc.
Acknowledgments
Authors acknowledge Rodrigo Montes, Renato Quiñones from INCAR for sharing relevant references and encouraging the publication of these results, and José Brito for his valuable collaboration during the early stages of this research.
Conflicts of Interest
The authors declare no conflict of interest.
References
- Heymann, D. What We Do (and Don’t) Know about the Coronavirus. February 2020. Available online: https://www.ted.com/talks/david_heymann_what_we_do_and_don_t_know_about_the_coronavirus (accessed on 1 November 2020).
- World Health Organization (WHO). Advice for the Public on COVID-19. Available online: https://www.who.int/emergencies/diseases/novel-coronavirus-2019/advice-for-public (accessed on 1 November 2020).
- Wells, W.F. On air-borne infection. Study II. Droplets and droplet nuclei. Am. J. Hyg. 1934, 20, 611–618. [Google Scholar]
- Setti, L.; Passarini, F.; De Gennaro, G.; Barbieri, P.; Perrone, M.G.; Borelli, M.; Palmisani, J.; Di Gilio, A.; Piscitelli, P.; Miani, A. Airborne Transmission Route of COVID-19: Why 2 Meters/6 Feet of Inter-Personal Distance Could Not Be Enough. Int. J. Environ. Res. Public Health 2020, 17, 2932. [Google Scholar] [CrossRef]
- UN-Habitat. World Cities Report 2016: Urbanization and Development–Emerging Futures; UN-Habitat: Nairobi, Kenya, 2016. [Google Scholar]
- Lewis, D. Mounting evidence suggests coronavirus is airborne—But health advice has not caught up. Nature 2020, 583, 510–513. [Google Scholar] [CrossRef] [PubMed]
- Lewis, D. Is the coronavirus airborne? Experts can’t agree. Nat. Cell Biol. 2020, 580, 175. [Google Scholar] [CrossRef] [PubMed]
- World Health Organization. Modes of Transmission of Virus Causing COVID-19: Implications for IPC Precaution Recommendations: Scientific Brief, 29 March 2020. World Health Organization. Licencia: CC BY-NC-SA 3.0 IGO. Available online: https://apps.who.int/iris/handle/10665/331616 (accessed on 21 November 2020).
- Gao, N.; Niu, J. Transient CFD simulation of the respiration process and inter-person exposure assessment. Build. Environ. 2006, 41, 1214–1222. [Google Scholar] [CrossRef] [PubMed]
- Han, Z.Y.; Weng, W.G.; Huang, Q.Y. Characterizations of particle size distribution of the droplets exhaled by sneeze. J. R. Soc. Interface 2013, 10, 20130560. [Google Scholar] [CrossRef]
- Ong, S.W.X.; Tan, Y.K.; Chia, P.Y.; Lee, T.H.; Ng, O.T.; Wong, M.S.Y.; Marimuthu, K. Air, surface environmental, and personal protective equipment contamination by severe acute respiratory syndrome coronavirus 2 (SARS-CoV-2) from a symptomatic patient. JAMA 2020, 323, 1610–1612. [Google Scholar] [CrossRef]
- Prather, K.A.; Marr, L.C.; Schooley, R.T.; McDiarmid, M.A.; Wilson, M.E.; Milton, D.K. Airborne transmission of SARS-CoV-2. Science 2020, 370, 303. [Google Scholar]
- Morawska, L.; Cao, J. Airborne transmission of SARS-CoV-2: The world should face the reality. Environ. Int. 2020, 139, 105730. [Google Scholar] [CrossRef]
- Mandavilli, A. 239 Experts with One Big Claim: The Coronavirus Is Airborne; The New York Times: New York, NY, USA, 2020; p. 7. [Google Scholar]
- World Health Organization. Transmission of SARS-CoV-2: Implications for Infection Prevention Precautions: Scientific Brief, 09 July 2020 (No. WHO/2019-nCoV/Sci_Brief/Transmission_modes/2020.3); World Health Organization: Geneva, Switzerland, 2020. [Google Scholar]
- Zhang, H.; Li, D.; Xie, L.; Xiao, Y. Documentary Research of Human Respiratory Droplet Characteristics. Procedia Eng. 2015, 121, 1365–1374. [Google Scholar] [CrossRef]
- Zhu, S.; Kato, S.; Yang, J.-H. Study on transport characteristics of saliva droplets produced by coughing in a calm indoor environment. Build. Environ. 2006, 41, 1691–1702. [Google Scholar] [CrossRef]
- Xie, X.; Li, Y.; Chwang, A.T.Y.; Ho, P.L.; Seto, W.H. How far droplets can move in indoor environments? revisiting the Wells evaporation? falling curve. Indoor Air 2007, 17, 211–225. [Google Scholar] [CrossRef]
- Bourouiba, L.; Dehandschoewercker, E.; Bush, J.W.M. Violent expiratory events: On coughing and sneezing. J. Fluid Mech. 2014, 745, 537–563. [Google Scholar] [CrossRef]
- Das, S.K.; Alam, J.-E.; Plumari, S.; Greco, V. Transmission of airborne virus through sneezed and coughed droplets. Phys. Fluids 2020, 32, 097102. [Google Scholar] [CrossRef] [PubMed]
- Tang, J.W.; Nicolle, A.D.; Klettner, C.A.; Pantelic, J.; Wang, L.; Bin Suhaimi, A.; Tan, A.Y.L.; Ong, G.W.X.; Su, R.; Sekhar, C.; et al. Airflow Dynamics of Human Jets: Sneezing and Breathing—Potential Sources of Infectious Aerosols. PLoS ONE 2013, 8, e59970. [Google Scholar] [CrossRef] [PubMed]
- Bourouiba, L. Turbulent Gas Clouds and Respiratory Pathogen Emissions Potential Implications for Reducing Transmission of COVID-19. JAMA 2020, 323, 1837–1838. [Google Scholar]
- Pendar, M.-R.; Páscoa, J.C. Numerical modeling of the distribution of virus carrying saliva droplets during sneeze and cough. Phys. Fluids 2020, 32, 083305. [Google Scholar] [CrossRef]
- Dbouk, T.; Drikakis, D. On coughing and airborne droplet transmission to humans. Phys. Fluids 2020, 32, 053310. [Google Scholar] [CrossRef] [PubMed]
- Fortuniak, K.; Kłysik, K.; Wibig, J. Urban–rural contrasts of meteorological parameters in Łódź. Theor. Appl. Climatol. 2006, 84, 91–101. [Google Scholar] [CrossRef]
- Asgary, A.; Najafabadi, M.M.; Karsseboom, R.; Wu, J. A Drive-through Simulation Tool for Mass Vaccination during COVID-19 Pandemic. Health 2020, 8, 469. [Google Scholar] [CrossRef]
- Ounis, H.; Ahmadi, G.; McLaughlin, J.B. Brownian diffusion of submicrometer particles in the viscous sublayer. J. Colloid Interface Sci. 1991, 143, 266–277. [Google Scholar] [CrossRef]
- Higgins, C.; Parlange, M.; Meneveau, C. Energy dissipation in large-eddy simulation: Dependence on flow structure and effects of eigenvector alignments. Atmos. Turbul. Mesoscale Meteorol. 2004, 51–70. [Google Scholar] [CrossRef]
- Grassi, S.; Veronesi, F.; Schenkel, R.; Peier, C.; Neukom, J.; Volkwein, S.; Raubal, M.; Hurni, L. Mapping of the global wind energy potential using opensource GIS data. In Proceedings of the 2nd International Conference on Energy and Environment (ICEE 2015): Bringing Together Engineering and Economics, Guimarães, Portugal, 18–19 June 2015; pp. 647–653. [Google Scholar]
- Badeau, A.; Afshari, A.; Goldsmith, T.; Frazer, D. Preliminary prediction of flow and particulate concentration produced from normal human cough dispersion. In Proceedings of the Second Joint 24th Annual Conference and the Annual Fall Meeting of the Biomedical Engineering Society, Engineering in Medicine and Biology, Houston, TX, USA, 23–26 October 2002; Volume 1, pp. 246–247. [Google Scholar]
- Piomelli, U. Wall-layer models for large-eddy simulations. Prog. Aerosp. Sci. 2008, 44, 437–446. [Google Scholar] [CrossRef]
- Ai, Z.T.; Melikov, A.K. Airborne spread of expiratory droplet nuclei between the occupants of indoor environments: A review. Indoor Air 2018, 28, 500–524. [Google Scholar] [CrossRef]
- Papineni, R.S.; Rosenthal, F.S. The Size Distribution of Droplets in the Exhaled Breath of Healthy Human Subjects. J. Aerosol Med. 1997, 10, 105–116. [Google Scholar] [CrossRef] [PubMed]
- Kim, J.-J.; Baik, J.-J. Effects of inflow turbulence intensity on flow and pollutant dispersion in an urban street canyon. J. Wind Eng. Ind. Aerodyn. 2003, 91, 309–329. [Google Scholar] [CrossRef]
- Sun, C.; Zhai, Z. The efficacy of social distance and ventilation effectiveness in preventing COVID-19 transmission. Sustain. Cities Soc. 2020, 62, 102390. [Google Scholar] [CrossRef] [PubMed]
- Shafaghi, A.H.; Talabazar, F.R.; Koşar, A.; Ghorbani, M. On the Effect of the Respiratory Droplet Generation Condition on COVID-19 Transmission. Fluids 2020, 5, 113. [Google Scholar] [CrossRef]
- Smagorinsky, J. General Circulation Experiments with the Primitive Equations. I. The Basic Experiment. Mon. Weather Rev. 1963, 91, 99–164. [Google Scholar] [CrossRef]
- Shah, A.; Challener, D.; Tande, A.J.; Mahmood, M.; O’Horo, J.C.; Berbari, E.; Crane, S.J. Drive-Through Testing: A Unique, Efficient Method of Collecting Large Volume of Specimens During the SARS-CoV-2 (COVID-19) Pandemic. In Mayo Clinic Proceedings; Elsevier: Amsterdam, The Netherlands, 2020. [Google Scholar]
- Gupta, A.; Evans, G.W.; Heragu, S.S. Simulation and optimization modeling for drive-through mass vaccination—A generalized approach. Simul. Model. Pract. Theory 2013, 37, 99–106. [Google Scholar] [CrossRef]
- Sandoval, V.; Sarmiento, J.P. A neglected issue: Informal settlements, urban development, and disaster risk reduction in Latin America and the Caribbean. Disaster Prev. Manag. Int. J. 2020, 29, 731–745. [Google Scholar] [CrossRef]
- Nielsen, P.V.; Olmedo, I.; Ruiz de Adana, M. Airborne cross-infection risk between two people standing in surroundings with a vertical temperature gradient. HVAC&R Res. 2012, 18, 552–561. [Google Scholar]


Publisher’s Note: MDPI stays neutral with regard to jurisdictional claims in published maps and institutional affiliations. |
© 2021 by the authors. Licensee MDPI, Basel, Switzerland. This article is an open access article distributed under the terms and conditions of the Creative Commons Attribution (CC BY) license (http://creativecommons.org/licenses/by/4.0/).