Abstract
The present work aims at developing a numerical study on the drug diffusion in the bloodstream in a coronary artery with drug-eluting stent implanted. The blood was modeled as a single-phase, incompressible and Newtonian fluid and the Navier–Stokes equation was approximated according to the Finite Element Method (FEM). The dynamics of drug-eluting concentration in bloodstream was investigated using four drug-eluting stents with different mass diffusivities in microchannels with variable cross sections, including a real coronary artery geometry with atherosclerosis. The results reveal complex drug concentration patterns and accumulation in the vicinity of the fat buildup.
1. Introduction
According to the World Health Organization (WHO) [1], cardiovascular diseases have remained the leading death causes globally in the last 15 years. It is estimated that 15.2 million people died from CVD in 2016, representing 26.7% of all deaths in the world. In Brazil, about 38% of deaths due to CVD is in the procutive age range (18 to 65 years) and the estimated costs of CVD were R$ 37.1 billion in 2015, that is, 0.7% GDP [2]. About 60% of CVD deaths occurred due to coronary artery disease (CAD). The main cause of CAD is the atherosclerosis which consists of the accumulation of fat plaques inside the artery wall causing a decrease in lumen diameter. The Atherosclerosis can be prevented with a change in harmful habits such as: cigarette smoking, physical inactivity/low fitness and poor dietary habits [3]. For a corrective approach, however, two treatments can be performed: the Coronary Artery Bypass Graft (CABG) or a procedure minimally invasive called Percutaneous Transluminal Coronary Angioplasty (PTCA) [4], where a wire tube (stent) is placed.
In 2001, Hwang, Wu and Edelman [5] presented a simulation of stent implantation coated with a drug in a coronary artery. The simulation presented the close relationship between drug distribution and Peclet number in addition to the importance of developing geometries for stents that enhance the diffusion of the chemical substance. Such procedure proved to be a promising option for the treatment of atherosclerosis and reestonosis. This new type of stent would be known as drug-eluting stent. In the following years, Zunino et al. [6] presented in 2009 a complete overview of mathematical models and finite element numerical simulation applied to the modeling of drug eluting stens and of their interaction with the coronary arteries, take into account the stent expansion, fluid dynamics around the stent and drug release. The numerical simulation showing recirculation zones downstream has important consequences on the drug release process. The smooth and concave shape of stent contours shows that part of the drug released and accumulated in the neighborhood of the links is transported away and may affect the arterial walls located downstream. However, for the case analyzed, the authors concluded that the drug released into the lumem does not significantly contribute to the permanent drug deposition into the arterial wall and only an small fraction of the total amount drug stored into the stent was effectively delivered to the artery. In 2014, Bozsak, Chomaz and Barakat [7] propose a computational model of transport of the drugs paclitaxel and sirolimus on the artery wall. Such drugs are frequently used in drug-eluting stents. The simulation showed that the choice of the type of drug used is a crucial parameter in the creation of the drug-eluting stent due to transport in the artery wall. In 2018, Lucena et al. [8] present the simulation of the transport of the drug sirolimus on the wall of an artery modeled as a porous and anisotropic medium. Dissolution in the polymeric stent lining in addition to transport in the artery wall in an axisymmetric domain was considered. The government equations were approximated according to the Finite Element Method. The work showed that the temporal evolution of the transport process can be efficiently controlled by the mass diffusivity of the polymer. It is estimated that about 47% of the drug is diffused in the lumen and it is lost in the bloodstream. The spatial distribution of the drug, however, is greatly influenced by blood flow and the properties of the artery wall. Thus, such results are susceptible to the patient health conditions. Therefore, we propose the development of a numerical study on behavior of the drug diffusion in the bloodstream in a coronary artery with atherosclerosis and drug-eluting stent implanted.
The dynamics of concentration diffusion in coronary arteries requires a robust numerical method to compute the solution of the differential equations in a relevant model especially due to the thin concentration boundary layer in the vicinity of the implanted stents that must be accurately capture. The equations that govern the dynamics of blood flow in a coronary artery were developed according to continuum media assumption. Thus, the universal conservation laws such as mass, momentum and species transport were used in an Eulerian context. The blood was modeled as single-phase, incompressible, Newtonian and four diffusion coefficients were taken under consideration to evaluate different drug transport alongside the blood flow. Thus, the Navier–Stokes equation is presented according to the streamfunction-vorticity formulation with drug-eluting transport equation using the Finite Element method. The domain was discretized on an unstructured mesh using the GMSH open source software, where the triangular element with quadratic interpolation was used. The equations were discretized in spatial domain using the Galerkin formulation and in temporal domain the semi-Lagrangian scheme was used to discretized the material derivative using first order backward difference scheme. The computational code was developed in Python Language using the Object-Oriented Paradigm (OPP) and the linear system of equations that comes from implementing the FEM is solved through iterative method Conjugate Gradient Solver available in the public library for scientific tools SciPy.
The accuracy of the numerical code was presented according to the 2-norm relative error between the numerical solution of Poiseuille Symetric Plannar Flow and its analytical solution. In addition, the mesh convergence test was also presented, in order to show a relation of the relative error of the numerical code with the number of triangular elements of the computational mesh and its order of convergence. Then, the dynamics of concentration diffusion in a coronary artery with drug-eluting stent was investigated in three complex geometries using a two-dimensional approach. That is, the coronary artery was approximated as a plannar domain. Due to symmetry of problem, only half domain was simulated. The first case is called the Straight Channel with Stent and this geometry is a simplified straight model of a coronary artery. with drug-eluting stent implanted. The second case is called the Curved Channel with Stent, where this geometry is also a model as the previous geometry; however, an atherosclerosis was considered using a sinusoidal equation to model 40% of channel obstruction. Finally, the third case is called the Real Channel with Stent and this geometry was obtained through an image processing in an obstructed coronary artery due to the atherosclerosis. This geometry is particular to each patient due to the patient health conditions. The all geometries, the concentration diffusion was investigated using four drug concentration diffusities, whose Schmidt numbers were: {1, 10, 100, 1000}, which are equivalent to drug-lumen mass diffusion rates of × 10 m/s respectively.
2. Mathematical Modeling
The dynamics of concentration diffusion in coronary arteries require a robust numerical method to compute the solution of the differential equations in a relevant model. The equations that govern the dynamics of blood flow in a coronary artery were developed according to continuum media assumption. Thus, the universal conservation laws such as mass, momentum and species transport were used in an Eulerian context. The blood was modeled as single-phase, incompressible, Newtonian and four drug diffusion coefficients were taken under consideration to evaluate different drug transport alongside the blood flow. Thus, the Navier–Stokes equation is presented according to the stream-vorticity formulation with species transport equation:
where, is the vorticity field, is the stream function field, e is the concentration field, D/Dt is the material derivative, Re R/ is the Reynolds number, where is the blood density (kg/m), u is the blood velocity in the coronary artery (m/s), R is the lumen radius of the coronary artery (m) and is the blood viscosity (N·s/m), Sc is the Schmidt number, where D is the mass diffusion rate of the drug (m/s) and x and y are the spatial variables. In addition to the velocity field v is calculated by: and .
The boundary conditions used were:
- inflow condition: this condition was specified in the left line of the geometries in this work, where an mass inflow is desired. For such a condition, and , where and
- wall condition: this condition is specified at wall boundary, that is, the top line of the geometries in this work, where the no-slip condition is set. All the velocity components are specified with null values.
- outflow condition: this condition represents a state where is close to a fully developed profile, that is, the right line of the geometries in this work. No prescribed value is specified for the unknowns and a homogeneous Neumann condition is set.
- free-slip condition (symmetry): this condition is specified at the symmetric axis, that is, the bottom line of the geometries in this work. The vertical velocity component is null and the derivative of the horizontal component is also null value.
- strut condition (semi-circles): this condition is used on the semi-circles of drug-eluting stent. The vertical and horizontal velocity components are specified with null value. The concentration field is specified as , where .
As mentioned in Batchelor (1967) [9], the is constant along a streamline, then the streamfunction boundary condition can be calculated by , where can be used u and v velocity inflow component. In this work, was set null value for bottom streamline . For top streamline , it was calculated using and inflow velocity components, that is, . In addition, the vorticity boundary condition was calculated by at each time step. In the symmetric axis, the vorticity field assume null value.
Finite Element Method
To solve these governing equations, a numerical method is necessary. In this work, the Finite Element Method was used to approximate the differential equations. The domain was discretized on an unstructured triangular mesh using the GMSH open source software. Due to decoupling between velocity and pressure fields achieved by the stream-vorticity formulation, no artificial treatments in the formulation are required to solve the equations, not even a choice of special elements that satisfy the Babuska–Brezzi condition [10,11], thus any possible finite element may be used in the discretisation of the equations such as the linear triangle and the quadratic triangle elements. Thus, we present the semi-discrete matricial form of the stream function-vorticity formulation using the Galerkin method as follows:
where, M is mass matrix, and are stiffness matrix. In this moment, the vorticity , the streamfunction and the drug concentration field e field are discretized in the spatial domain but continuos in the temporal domain. Then, for time discretization, the semi-Lagrangian Method was used. This method was proposed by Sawyer in 1963 [12] for atmospheric flow numerical simulation using vorticity-advection equation, allowing to use large time steps without numerical instability. However, because of a limited computer capability, the use of such methodology to model several fluid flow problems, with high order differences and fine mesh, came later in the 1980s through the work of Robert [13] and Pironneu [14], where the semi-lagrangian scheme would be able to run models faster than the Eulerian scheme, besides being unconditionally stable and only symmetric linear systems to solve. Therefore the semi-lagrangian method discretized and computed the material derivative along the trajectory characteristic:
where, is material derivative of and the right-hand side equation is material derivative discretized using first order backward difference scheme. The variable t is time, is the vorticity field calculated in current time step at the current node position and is the vorticity field calculated in previous time step at the departure node position. The departure node is found by solving equation , using the initial condition , where are the coordinates of the mesh nodes. A search algorithm must be used to find the departure node followed by an interpolation procedure to compute the vorticity .
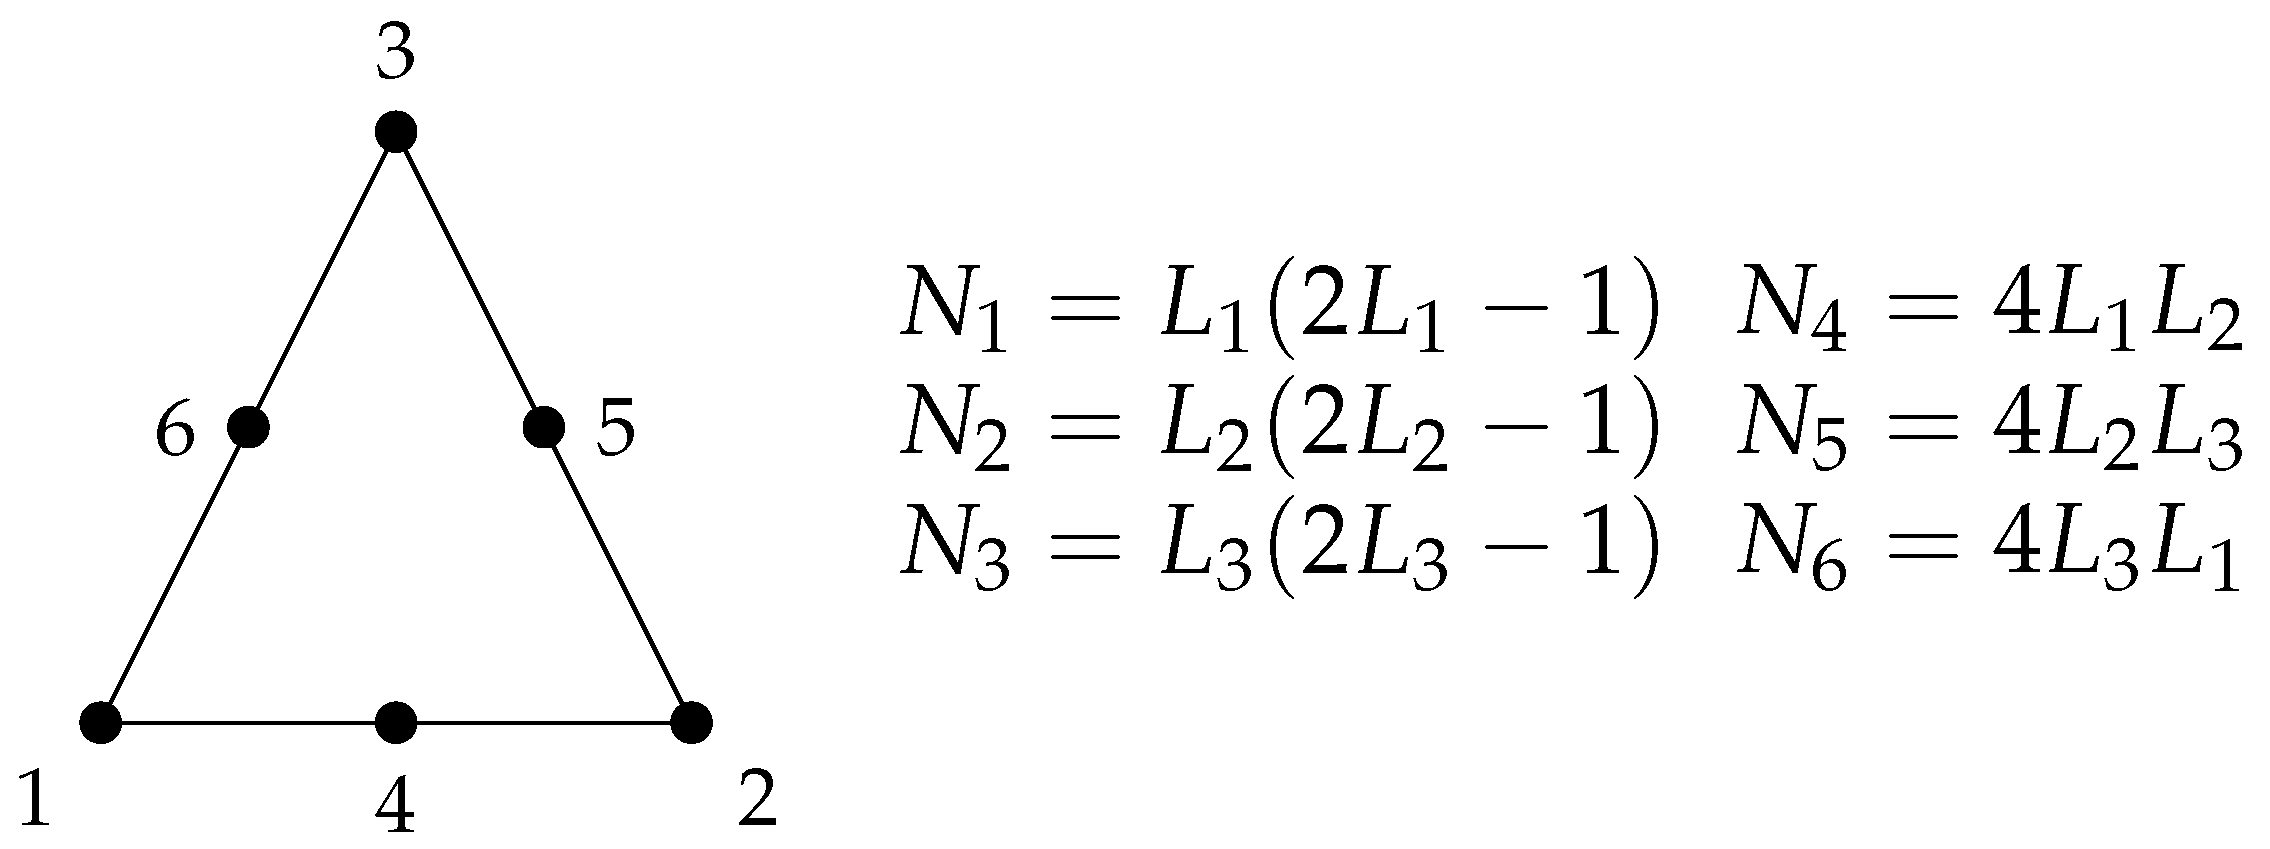
The triangular element with quadratic interpolation was used, in order to obtain a quadratic convergence in the results. This element consists of three nodes at the triangle corners and one mid-side node at each triangle edge. In this way, the interpolation polynomial is second order and its interpolation functions are quadratic. The elementary matrices of this element are calculated using the Gaussian Quadrature, whose parameters can be found in the literature [15]. This element is represented by the Figure 1, where a linear combination of the area coordinates , and generates the quadratic shape functions to . The streamfunction , vorticity , horizontal u and vertical v velocities and concentration e fields are evaluated and computed at all nodes; therefore, the quadratic convergence is expected at all quantities.
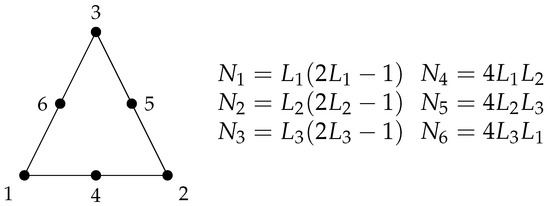
Figure 1.
6-noded triangle finite element with quadratic interpolation , and are the linear combination of the triangle area coordinates and , , , , and are the resulting shape functions.
Thus, we present the final version of the discrete matrix form of the dimensionless governing equations used in this work:
The iterative solution of these equations results in the computation of the vorticity , streamfunction and the drug concentration e at all mesh nodes. The velocity field is thus calculated using the streamfunction-velocity relation and , where and are the gradient matrix in the horizontal x and vertical y directions.
3. Results and Discussion
The dynamics of drug concentration diffusion in a coronary artery with drug-eluting stent was investigated in three complex geometries using a two-dimensional approach. That is, the coronary artery was approximated as a plannar domain. Due to symmetry of problem, only half domain was simulated. The blood was modeled as single-phase, incompressible and Newtonian fluid, the diffusion coefficient was considered as constant. The lumen radius of the coronary artery used was R = 0.0015 m, the viscosity used was N·s/m and the density used was kg/m as suggested by Bozsak, Chomaz and Barakat (2014) [7]. According to Kessler et al., (1998) [16], the blood velocity in the coronary artery is u = 0.12 m/s, thus resulting in the Reynolds number based on the channel’s radius of .
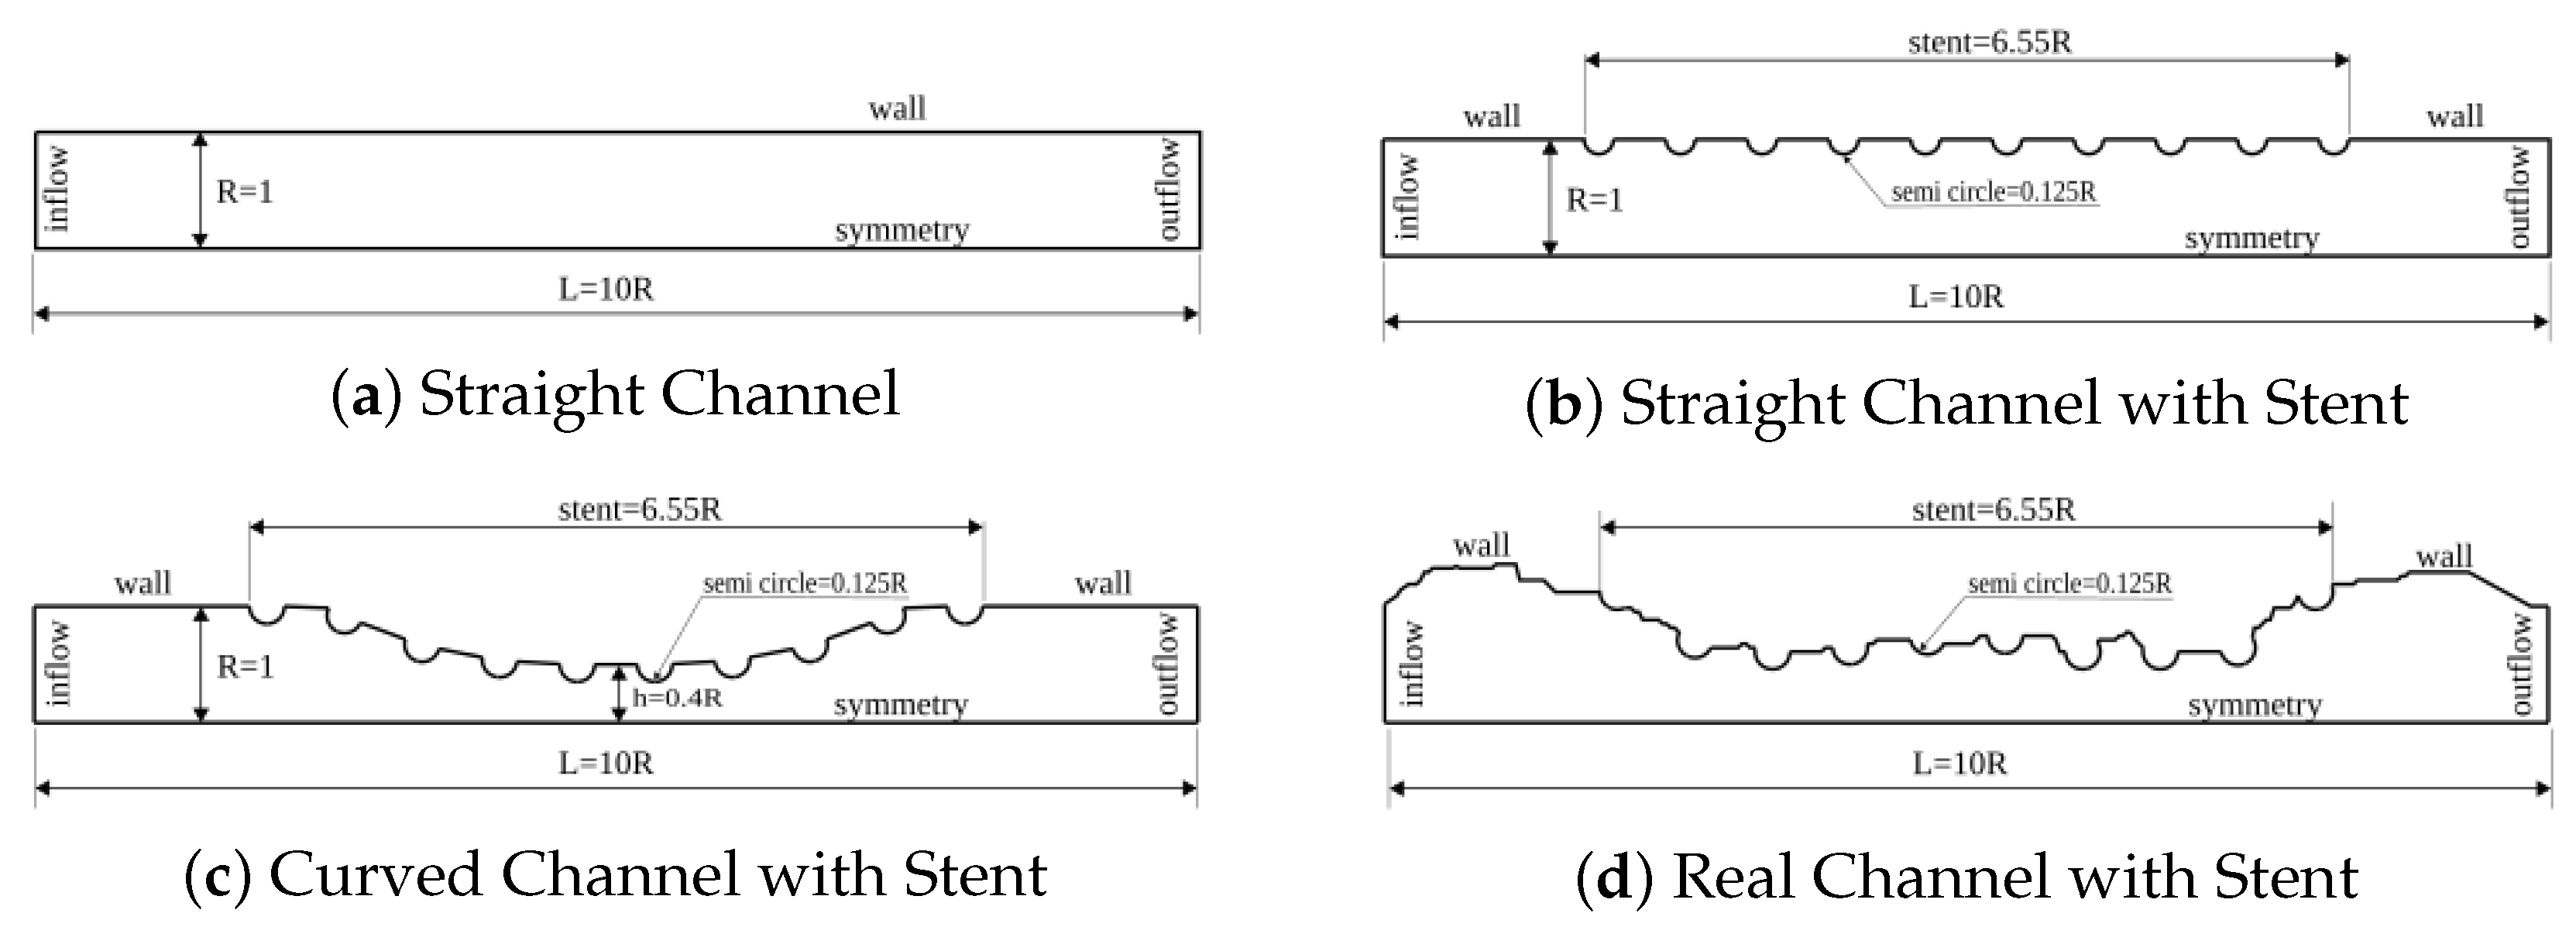
Initially, the solution of a flow between an fixed wall and the symmetry axis is shown. Such problem is known as Poiseuille Symmetric Plannar Flow and we refer as Straigh Channel as represented in Figure 2a. The lumen radius was used as characteristic length; therefore, all geometry parameters will be presented as a lumen radius function. Thus, the width between the symmetric axis (bottom line) and the wall (top line) was equal to R = 1 (nondimensional value). The length of channel, that is, the difference between the inflow (left line) and the outflow (right line) was equal to L = 10 R. The results presented in this section aim to present the accuracy of the numerical code, where the numerical solution of the vorticity , streamfunction , horizontal and vertical velocities (u and v respectively) will be compared with its analytical solutions. In addition, the mesh convergence test will also be presented, in order to present a relation of the relative error of the numerical code with the number of triangular elements of the computational mesh and its order of convergence.
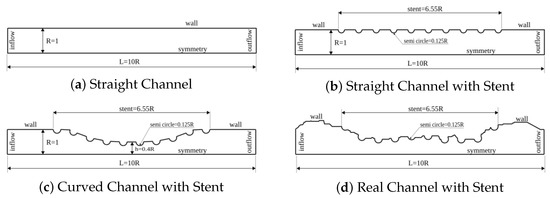
Figure 2.
Nondimensional domains for the dynamics analysis of concentration diffusion in coronary artery with drug-eluting stent. The lumen dimensionless width used was R = 1 and the lumen length was L = 10 R for the (a–c) cases. The drug-eluting stent of length equal to 6.55 R was modeled for (b–d) geometries by 10 uniform spaced semi-circles with radius equal to 0.125 R. An atherosclerosis was considered for (c) geometry, where a sinusoidal equation was used to model 40% of channel obstruction. For (d) case, the geometry was obtained through an image processing in an obstructed coronary artery due to the atherosclerosis.
The dynamics of concentration diffusion in a coronary artery with drug-eluting stent was carried out in three complex geometries. The first geometry is called the Straight Channel with Stent and it is represented by Figure 2b. This geometry is a straight model of coronary artery. This simplified model does not require a image processing; therefore, the mathematical equation use to describe the curve is sufficient. The width and length of this geometry is similar to Straight Channel. However, the drug-eluting stent of length equal to 6.55 R was modeled in this geometry by 10 uniform spaced semi-circles with radius equal to 0.125 R. The second geometry is called the Curved Channel with Stent and it is represented by Figure 2c. This geometry is also a model as the previous geometry and it also does not require a image processing. The width and length of this geometry is similar to previous channel and the drug-eluting stent distribution is the same as Straight Channel with Stent. However, an atherosclerosis was considered for this case, where a sinusoidal equation was used to model 40% of channel obstruction. Finally, the third geometry is called the Real Channel with Stent and it is represented by Figure 2d. This geometry was obtained through an image processing in an obstructed coronary artery due to the atherosclerosis. This geometry is particular to each patient due to the patient health conditions. The all geometries, the concentration diffusion was investigated using four drug types, whose Schmidt numbers were: {1, 10, 100, 1000}, which are equivalent to drug-lumen mass diffusion rates of × 10 m/s respectively. The simulation was visualized using the Paraview open-source software proposed by Henderson (2007) [17].
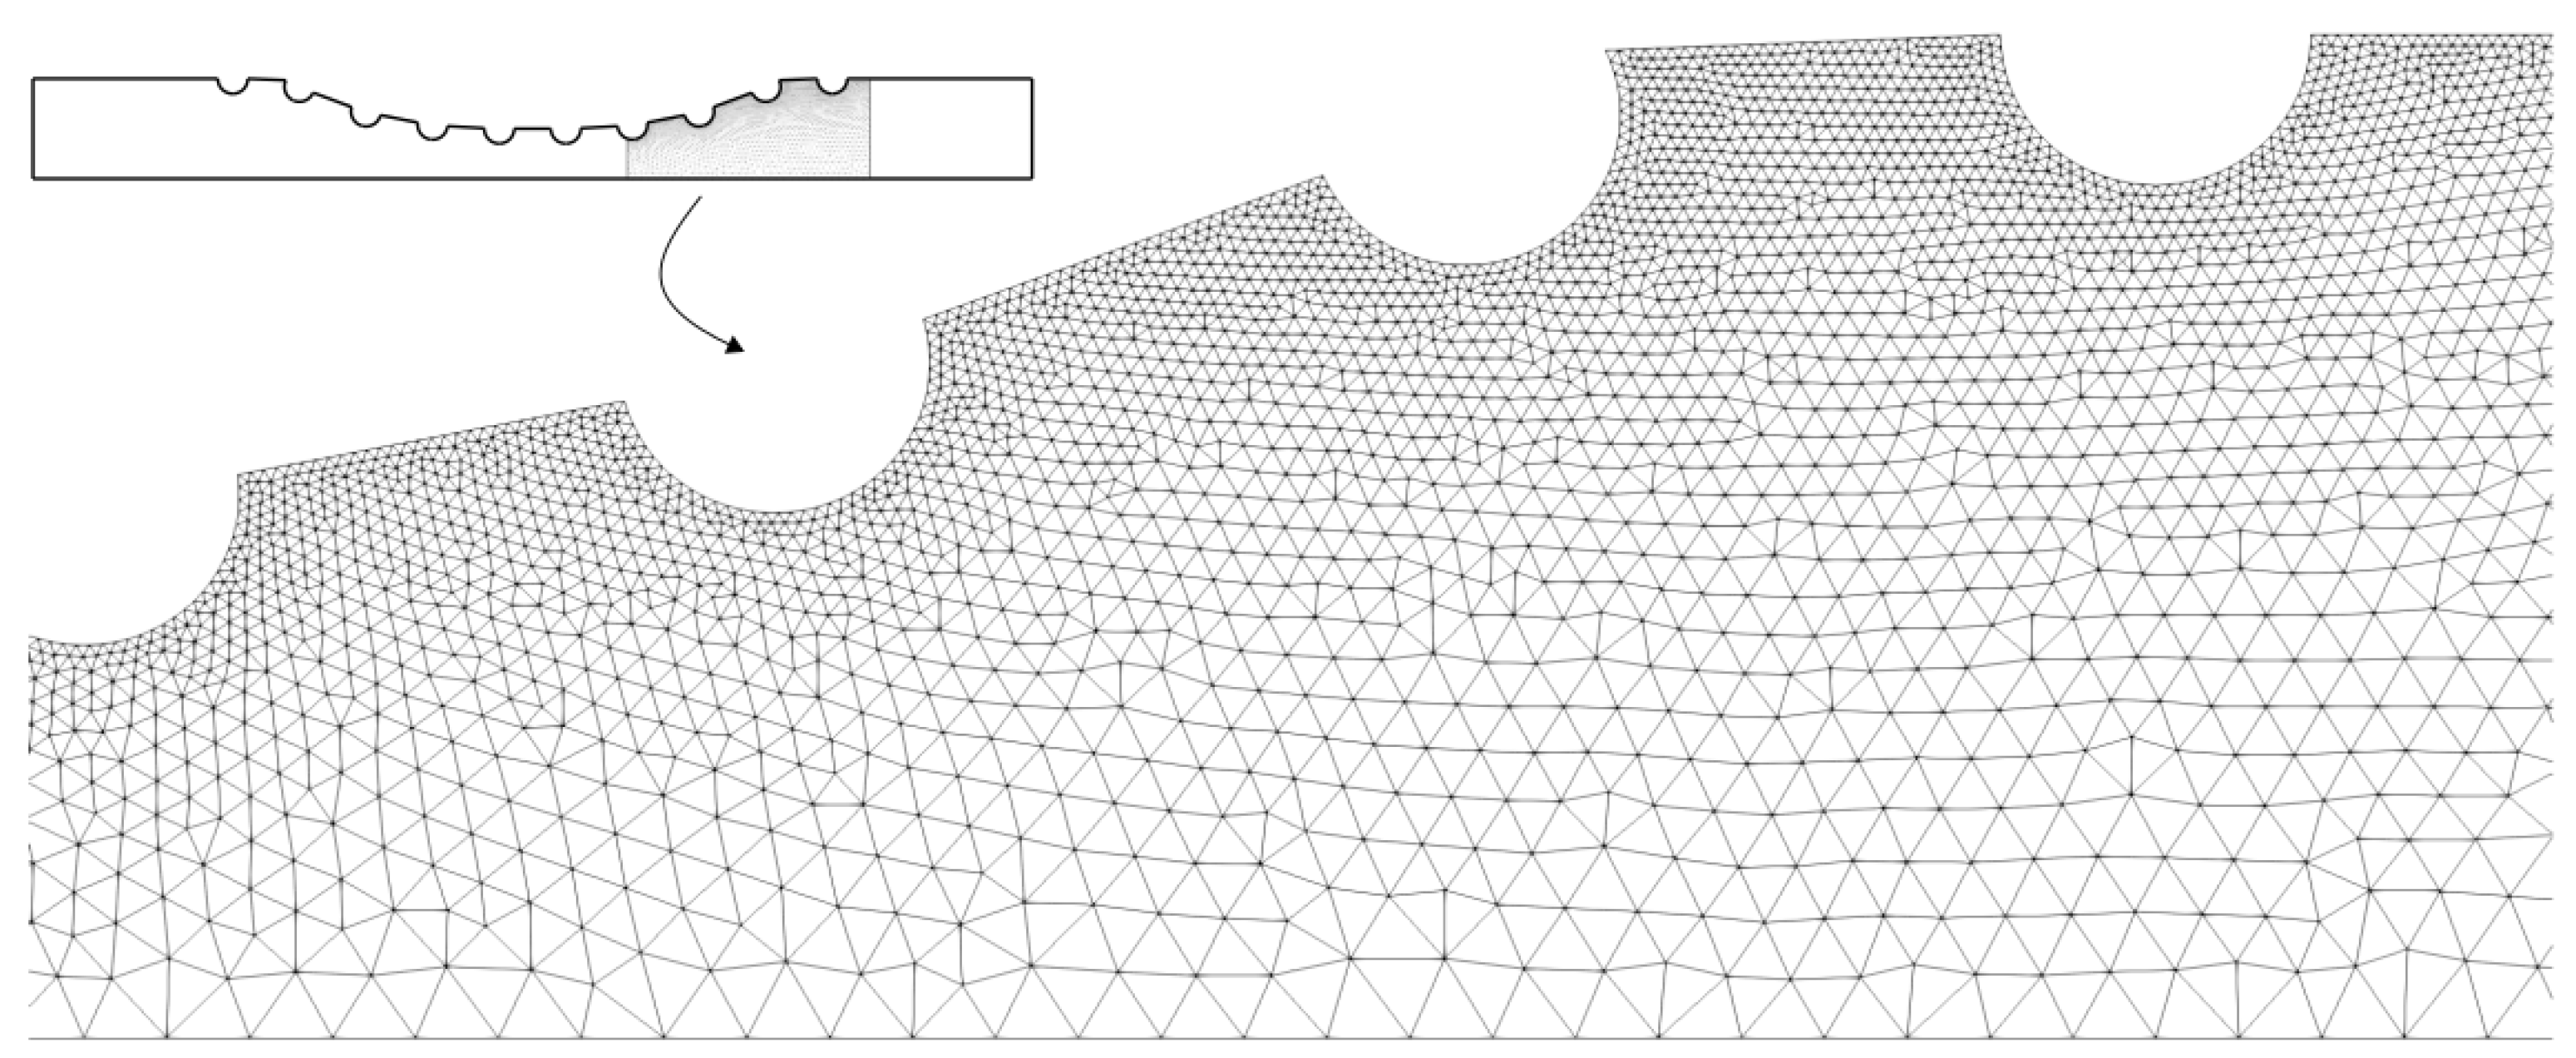
The Figure 3 shows a part of the quadratic triangular mesh for the Curved Channel with stent geometry. This mesh was generated by the GSMH open source software and the same type of mesh was used for all the geometries shown in Figure 2. As can be seen, it was used a unstructured triangular mesh, where it has a greater refinement close to the drug-eluting stent semi-circles. Thus, it is expected to observe the dynamics of drug diffusion with greater accuracy close to the region of the boundary layer.
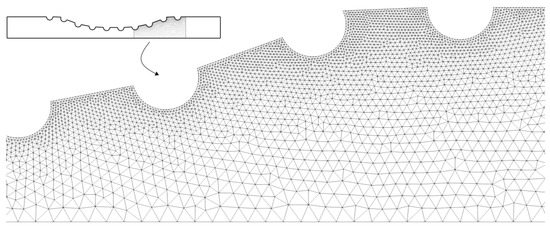
Figure 3.
The unstructured quadratic triangular mesh for the Curved Channel with stent geometry. As can be seen, the mesh is more refinement close to the drug-eluting stent.
3.1. Poiseuille Symmetric Plannar Flow
This section presents the simulation of the Poiseuille flow in a symmetric domain. The geometry used called the Straight Channel and it is represented by Figure 2a. The width between the symmetric axis (bottom line) and the wall (top line) was equal to R = 1 (nondimensional value). The length of channel, that is, the difference between the inflow (left line) and the outflow (right line) was equal to L = 10 R. The results presented in this section aim to present the accuracy of the numerical code, where the numerical solution of the vorticity , streamfunction , horizontal and vertical velocities (u and v respectively) will be compared with its analytical solutions. To perform the simulation, the free-slip condition was required on the axis of symmetry and the analytical horizontal velocity profile was used as inflow condition. The domain was discretized using 14,968 nodes and 7299 triangular elements with quadratic interpolation. The 2-norm relative error was estimated as:
where, is 2-norm relative error, is the numerical solution, is the analytical solution and the index i refers the nodes in a particular cross section. Table 1 shows the relative error for the horizontal velocity u, the vertical velocity v, the vorticity and the streamfunction fields. It is possible to observe that the relative error of the numerical solutions was less than 1% of all quantities. Therefore, we can conclude that the numerical code has an acceptable accuracy to perform simulations similar to the Poiseuille Symmetric Plannar Flow. It is also possible to simulate cases with greater complexity as are the problems proposed for the dynamics of concentration diffusion in a coronary artery with drug-eluting stent.

Table 1.
The 2-norm relative error of numerical solutions compared to the analytical solutions for the Poiseuille Symmetric Plannar Flow.
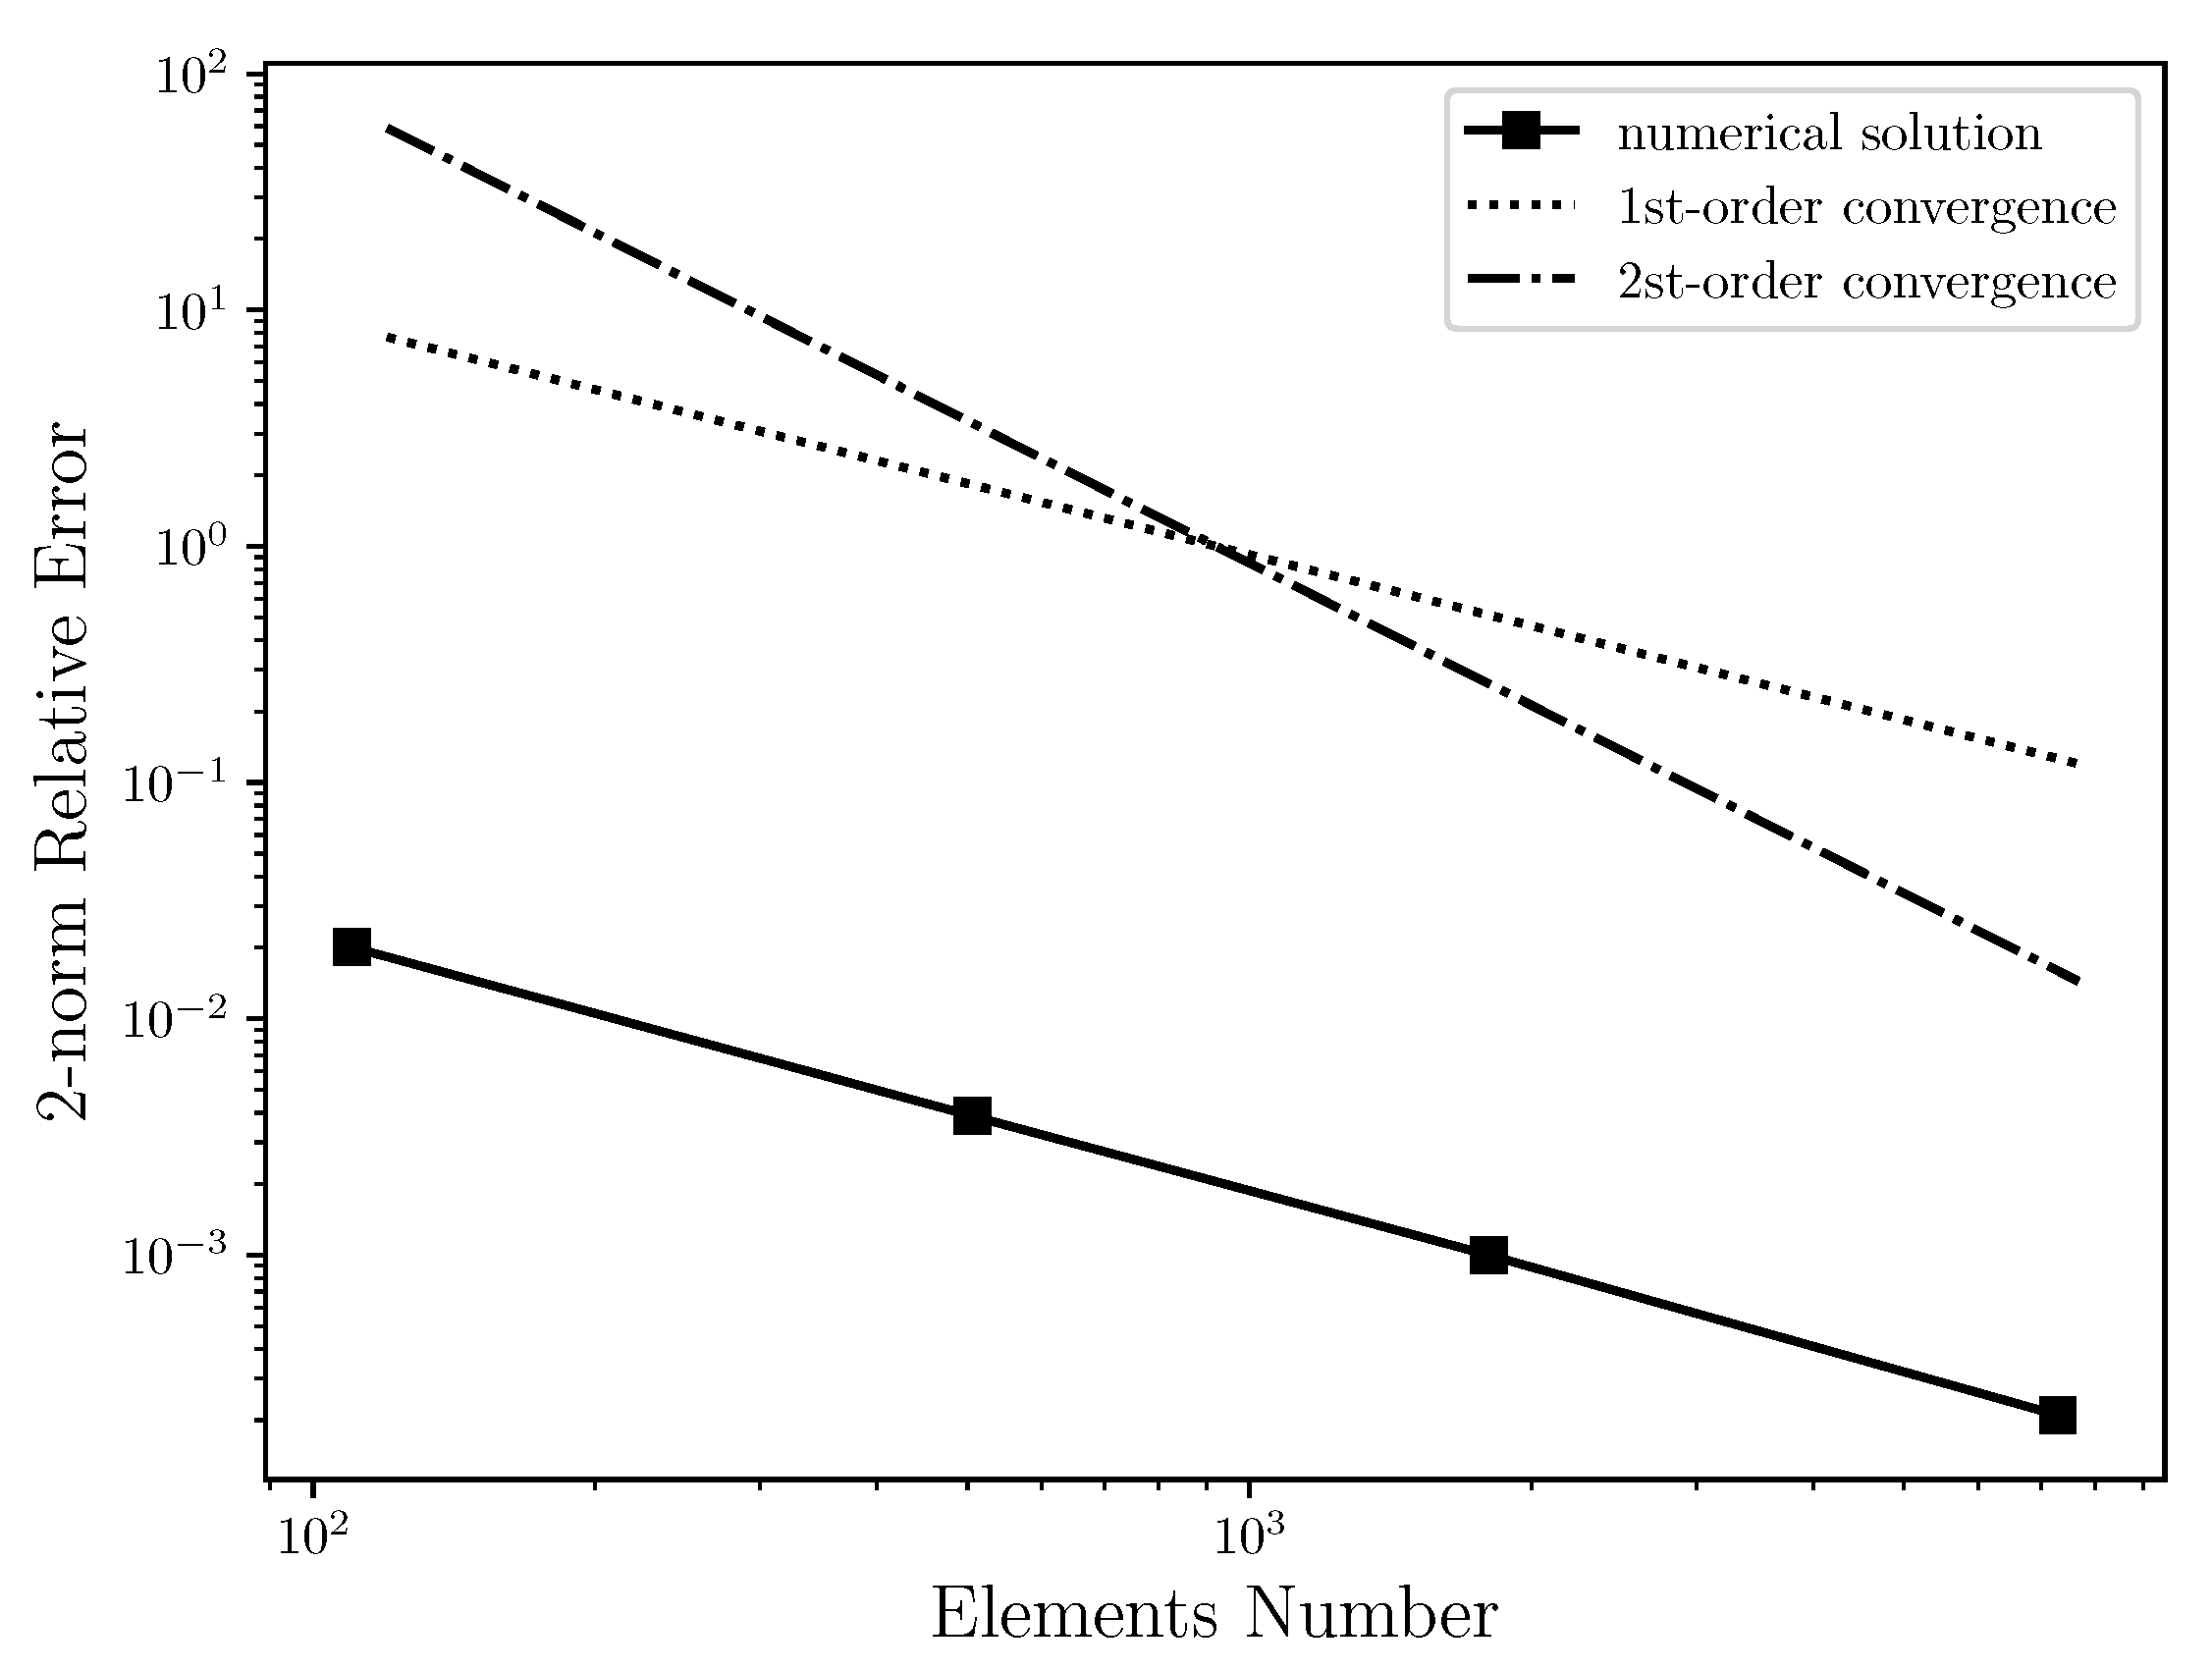
Table 2 shows the relative error between the numerical solution and the analytical solution for horizontal velocity field using several unstructured triangular meshes with quadratic interpolation, ranging from 100 to 7299 elements. This table is plotted and presented by the Figure 4, where the relative error of the numerical solution is compared to the first and second order convergence curves on a log-log scale. It was expected that the numerical solution had second order convergence. As can be seen, however, the relative error of the numerical solution for Poiseuille Symmetric Plannar flow has the form of first order convergence. Thus, when increasing the number of elements, the relative error of the numerical solution regresses linearly. The cause for the linear convergence is due to the vorticity boundary condition used in this work, that is, . Therefore, the use of the 2nd-order boundary condition would possibly improve the order convergence of the numerical solution. However, it is necessary to be investigated. In addition, the grid independent study was carried out where it was possible to conclude that from 15,640 elements, the numerical solution is not changed.

Table 2.
The 2-norm relative error of horizontal velocity numerical solution compared to the horizontal velocity analytical solution for several elements numbers in an unstructured triangular mesh with quadratic interpolation.
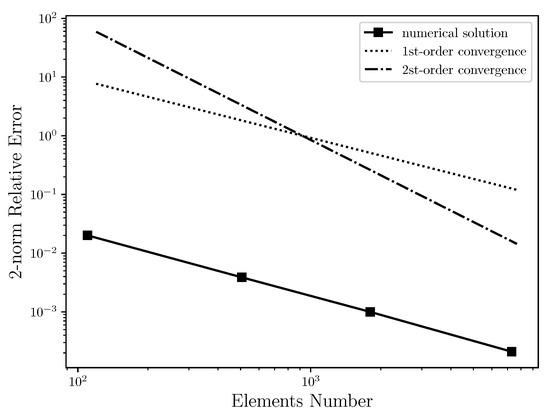
Figure 4.
Convergence order for the horizontal velocity in log-log scale: It is estimated that the 2-norm relative error of numerical solution has first order convergence due to the vorticity boundary condition used in this work, which is first order accurate.
3.2. Drug-Eluting Stent Diffusion Analysis
This section presents the simulation of the dynamics of concentration diffusion in a coronary artery with drug-eluting stent for three complex geometries. The first geometry is called the Straight Channel with Stent and it is represented by Figure 2b. This geometry is a straight model of coronary artery. This simplified model does not require a image processing; therefore, the mathematical equation use to describe the curve is sufficient. The width between the symmetric axis (bottom line) and the wall (top line) was equal to R = 1 (nondimensional value). The length of channel, that is, the difference between the inflow (left line) and the outflow (right line) was equal to L = 10 R. In addition, the drug-eluting stent of length equal to 6.55 R was modeled in this geometry by 10 uniform spaced semi-circles with radius equal to 0.125 R. The domain was discretized using 38,203 nodes and 18,616 triangular elements with quadratic interpolation. The second geometry is called the Curved Channel with Stent and it is represented by Figure 2c. This geometry is also a model as the previous geometry and it also does not require a image processing. The width and length of this geometry is similar to previous channel and the drug-eluting stent distribution is the same as Straight Channel with Stent. However, an atherosclerosis was considered for this case, where a sinusoidal equation was used to model 40% of channel obstruction. The domain was discretized using 39,686 nodes and 19,337 triangular elements with quadratic interpolation. Finally, the third geometry is called the Real Channel with Stent and it is represented by Figure 2d. This geometry was obtained through an image processing in an obstructed coronary artery due to the atherosclerosis. This geometry is particular to each patient due to the patient health conditions. The domain was discretized using 45,191 nodes and 22,034 triangular elements with quadratic interpolation. The all geometries, the concentration diffusion was investigated using four drug diffusion coefficients, whose Schmidt numbers were: {1, 10, 100, 1000}, which are equivalent to drug-lumen mass diffusion rates of × 10 m/s respectively. To perform the simulation, the free-slip condition was required on the axis of symmetry and the analytical horizontal velocity profile for the Poiseuille Symmetric Plannar Flow was used as inflow condition. In the drug-eluting stent, the concentration field was set as .
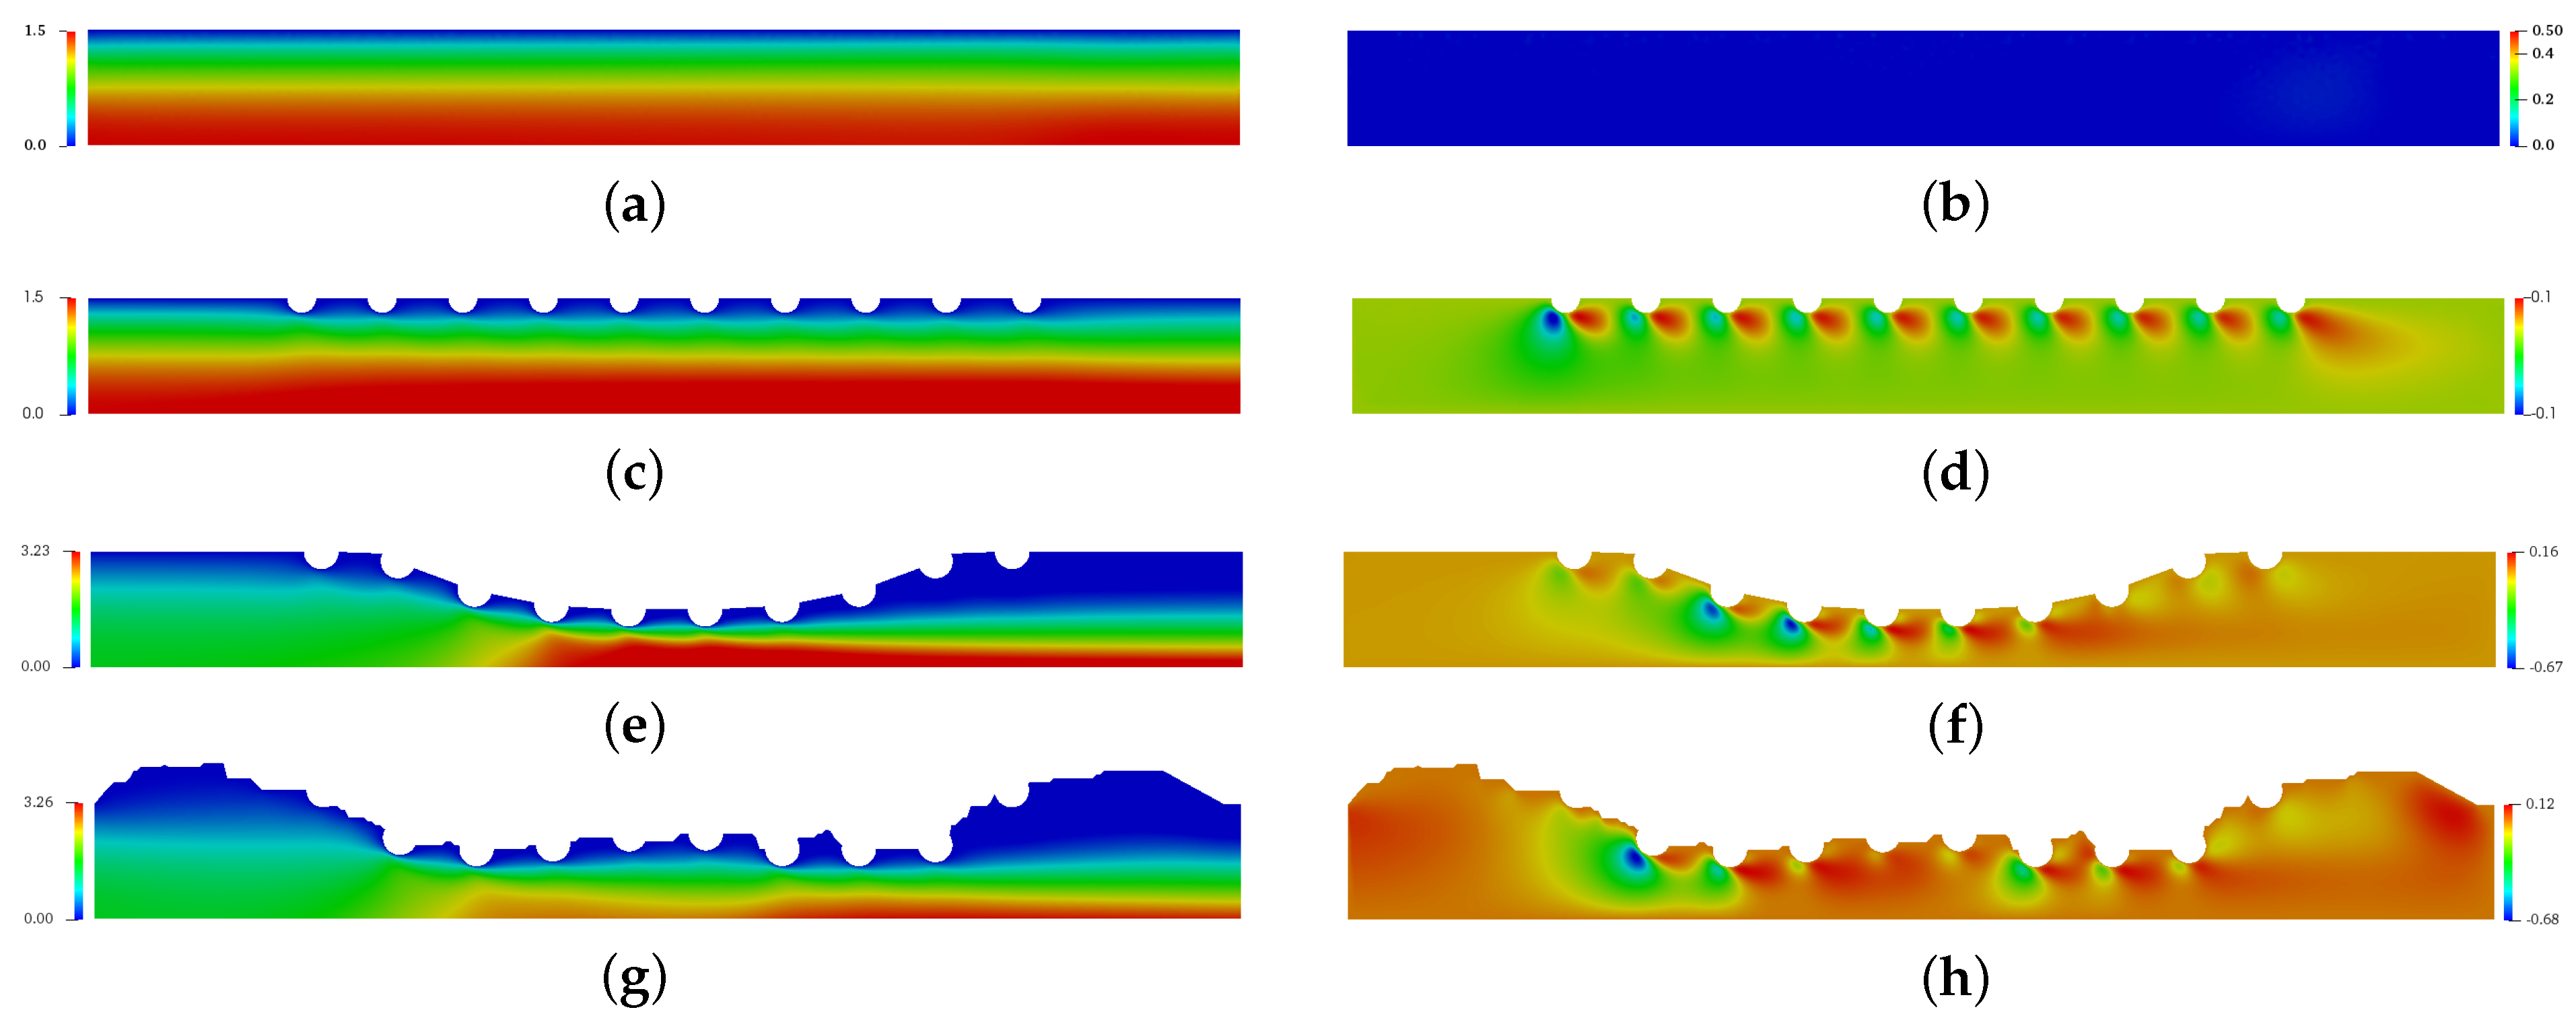
Figure 5 presents the spatial and temporal distribution of the blood horizontal (left column) and vertical (right column) velocities for each complex geometry previously mentioned in comparison with the straight channel with no implanted channels. The red color refers the maximum value and the blue color refers the minimum value. For (a), (c), (e) and (g) cases, the maximum horizontal velocity was found in the symmetric axis, while the minimum horizontal velocity was found close to the wall and drug-eluting stent. For (e) and (g) cases where the atherosclerosis is present, the maximum horizontal velocity is localized in the maximum obstrution of channel. The vertical velocity component assumes the null value for the straight channel (b), however the drug-eluting stent implantation makes the blood is initially directed downwards and changes the direction close to the end of channel for the (b), (d) and (f) cases.
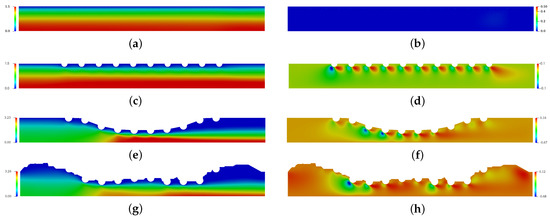
Figure 5.
The spatial and temporal distribuition of the blood horizontal velocity field (left column) and vertical velocity field (right column) for the straight channel (a,b), the straight channel with drug-eluting stent (c,d), the curved channel (e,f) and the real channel (g,h) with drug-eluting stent for the Reynols number Re = 54.5, where it is calculated using the lumen radius of the coronary artery R = 0.0015 m, the viscosity of the blood N·s/m, the density kg/m and the blood flow velocity in coronary artery m/s.
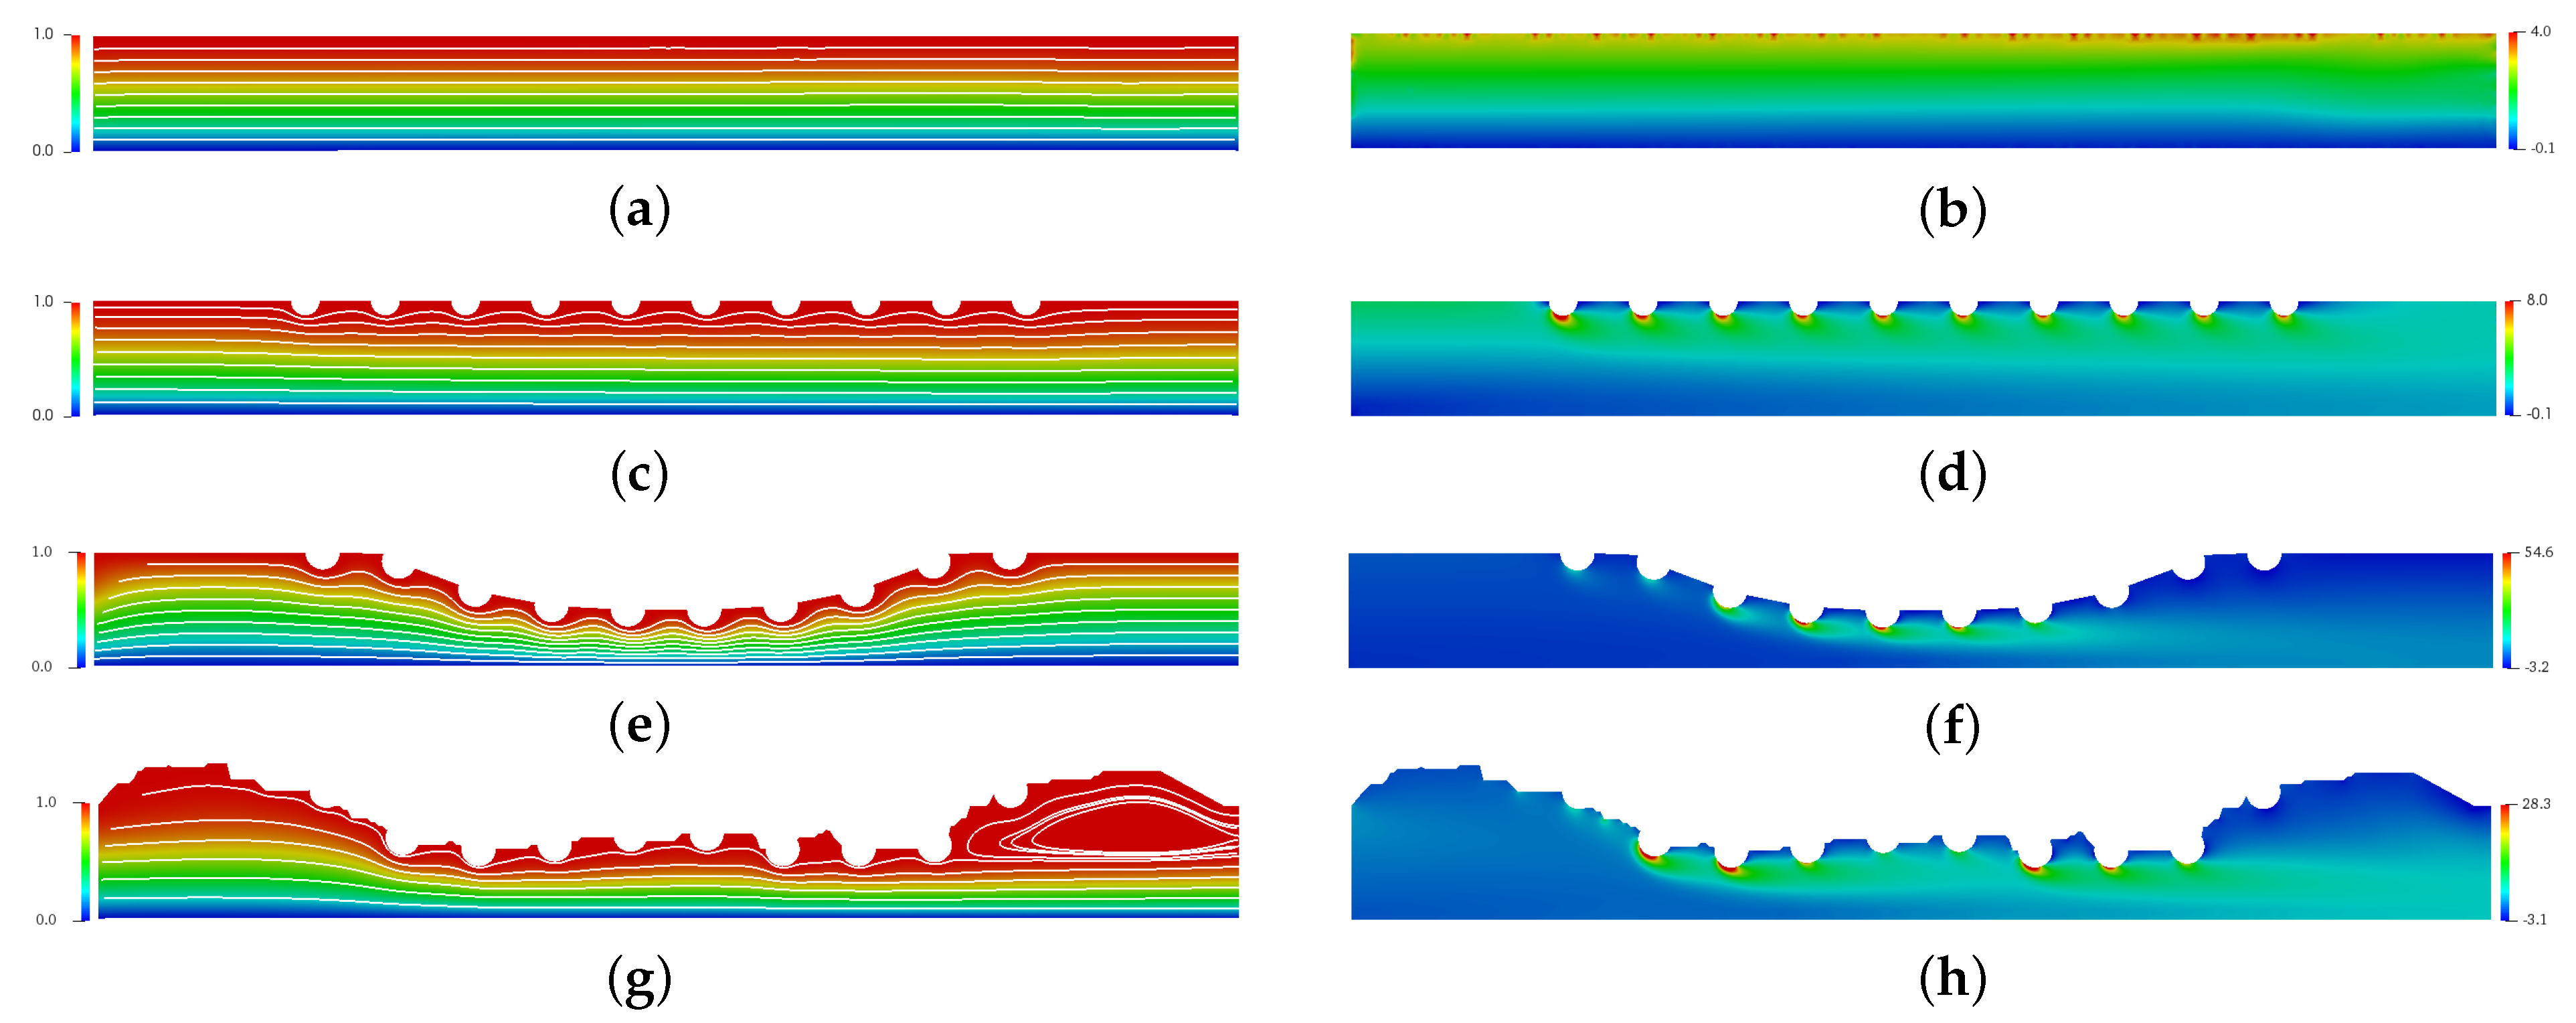
Figure 6 presents the spatial and temporal distribution of the blood streamlines (left column) and the vorticity field (right column) for each complex geometry previously mentioned in comparison with the straight channel with no implanted channels. The red color refers the maximum value and the blue color refers the minimum value. For (a), (c), (e) and (g) cases, it is possible to observe that atherosclerosis and the stent implantation directly affect the behavior of blood flow. For (g), a large recirculation zone can be seen after the stent. For (b), (d), (f) and (h) cases, it is possible to observe that the vorticity increases considerably in the region of the stent. This increase is of the order of 2 times for case (b), however it can reach 7 times for case (h) and 13 times for case (f). This increase contributes to the increase in surface tension. Thus, it is expected that the drug-eluting stent will have greater wear in this region. However, in this work, this wear was not considered.
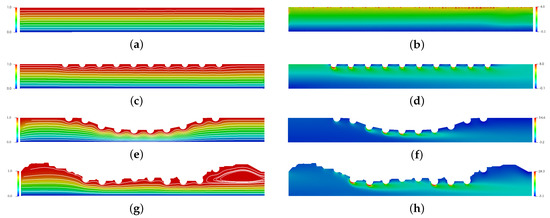
Figure 6.
The spatial and temporal distribution of the blood streamlines (left column) and the vorticity field (right column) for the straight channel (a,b), the straight channel with drug-eluting stent (c,d), the curved channel (e,f) and the real channel (g,h) with drug-eluting stent for the Reynols number Re = 54.5, where it is calculated using the lumen radius of the coronary artery R = 0.0015 m, the viscosity of the blood N·s/m, the density kg/m and the blood flow velocity in coronary artery m/s.
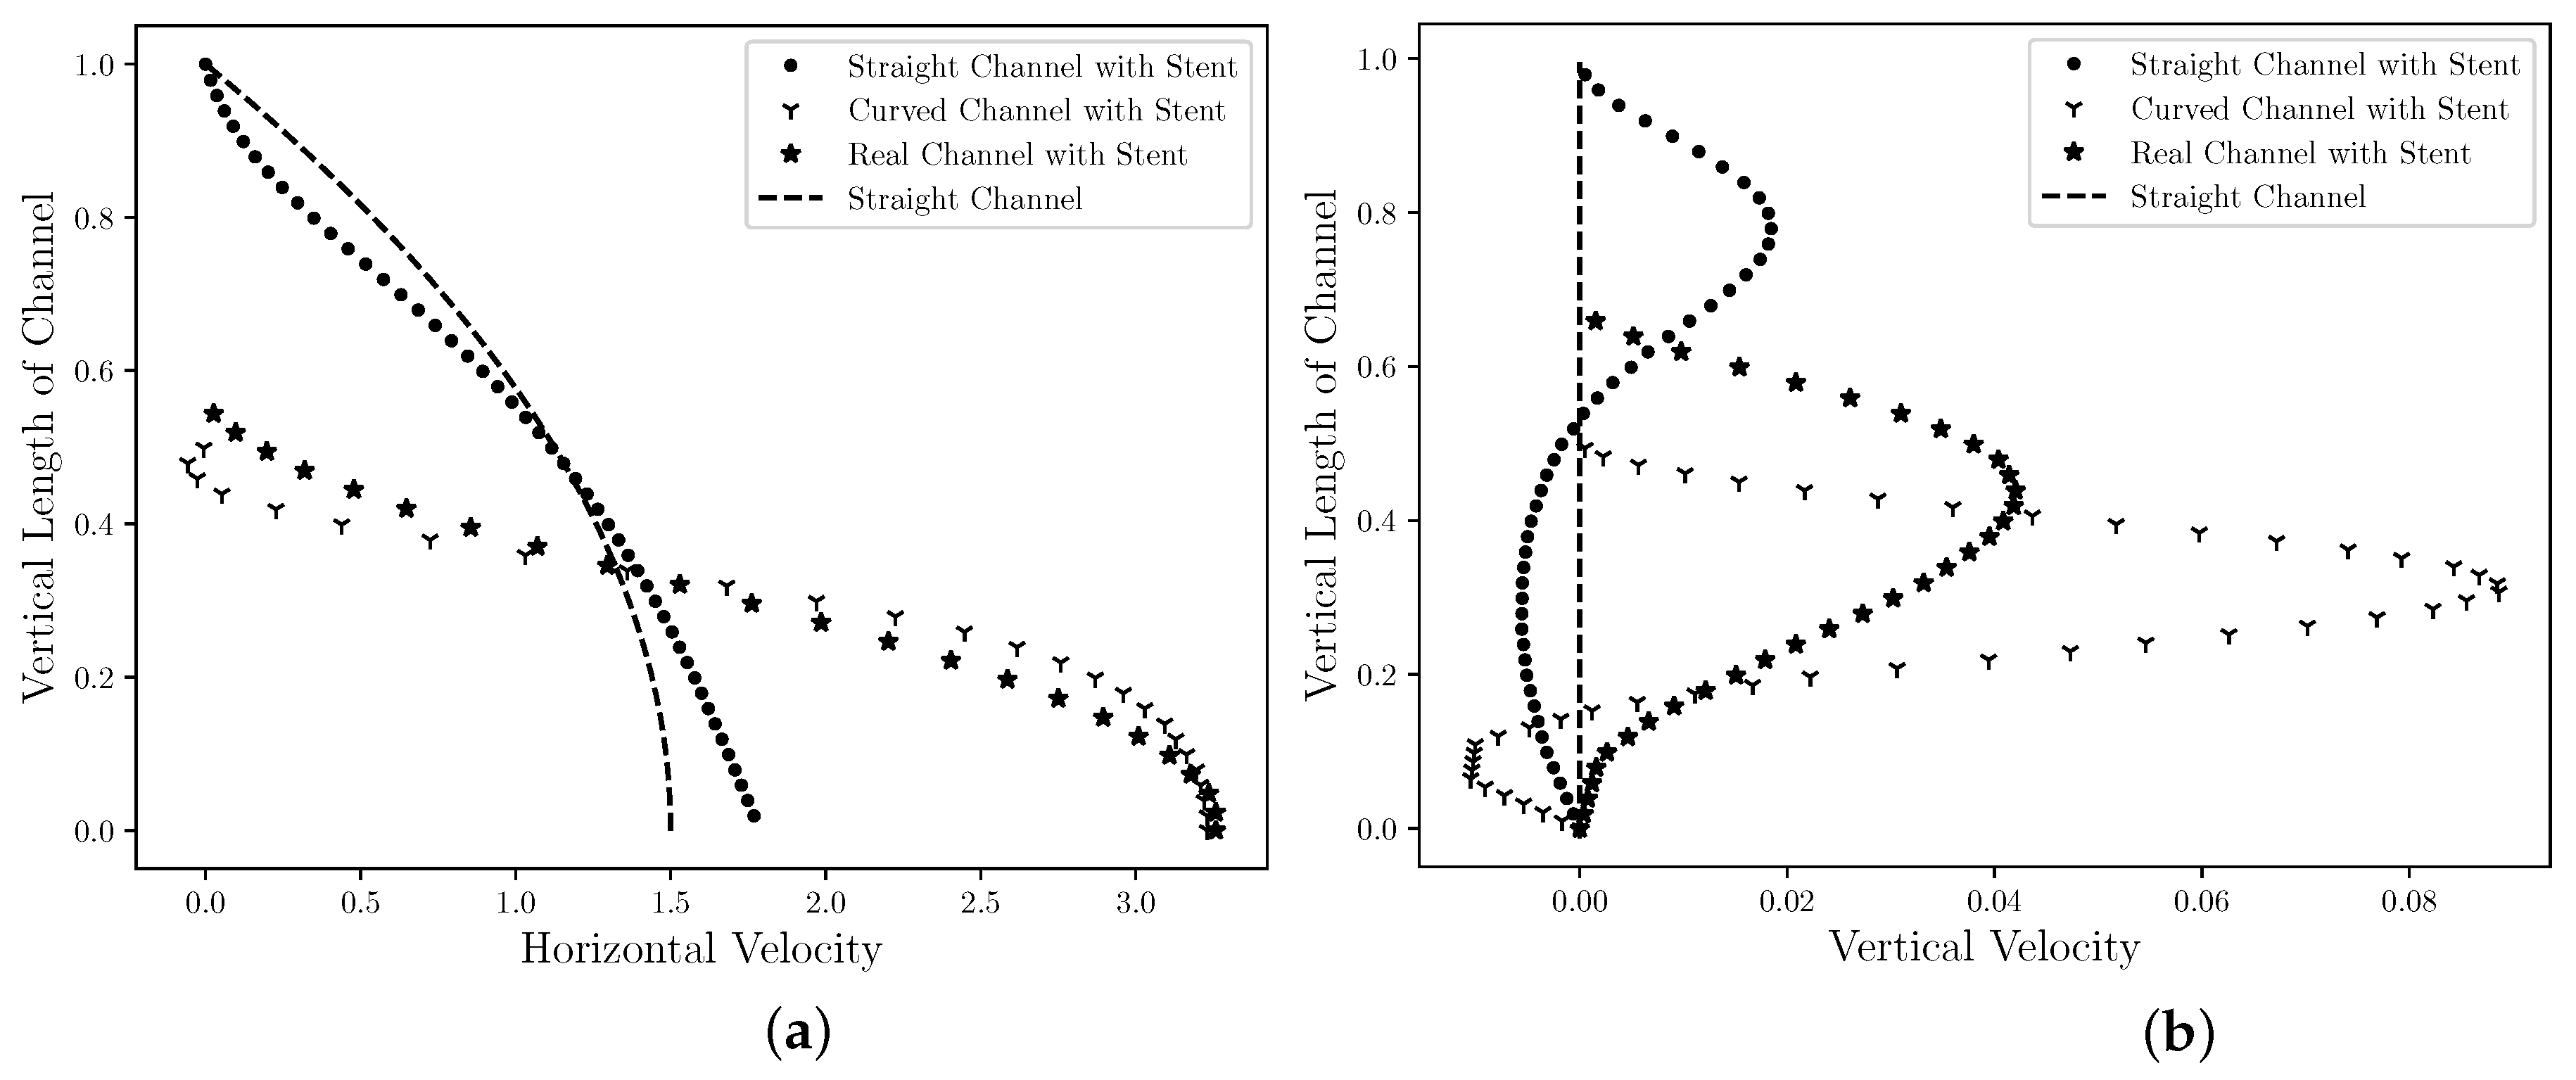
Figure 7 is presented the steady state of the horizontal (Figure 7a) and the vertical (Figure 7b) velocity profiles in the middle section channel, that is, R. In addition, the horizontal and vertical velocities profiles for the straight channel is also plotted in Figure 7 for comparison with flow without obstruction. This velocity field profile allows for the analysis of the influence that the drug-eluting stent implantation causes in the blood velocity field, since it could be considered the coronary artery without atherosclerosis and drug-eluting stent implanted. The velocities values are presented by nondimensional values, where it is possible to observe in Figure 7a that the drug-eluting stent implantation increases the maximum dimensionless horizontal velocity for all cases. For the cases where the atherosclerosis is present (Curved Channel with Stent and Real Channel with Stent), the horizontal velocity increase is even greater. The maximum dimensionless horizontal velocity for the Straight Channel with Stent is , that is, 18% higher compared to the coronary artery without atherosclerosis and the drug-eluting stent implanted. However, the maximum dimensionless horizontal velocity for the Curved Channel with Stent is , that is, more than 3× the blood velocity in coronary artery without atherosclerosis and drug-eluting stent implanted. Conveting to dimensional values, the maximum horizontal velocity assumes m/s. This increase can influence the dynamics of blood flow and its biological processes; therefore, a more detailed analysis should be performed. In addition, it is also possible to observe an inversion of the horizontal velocity field direction at the top of the figure. This inversion occurs in the region that is located between the stents strut semi-circles and a possible coagulation should be checked. For the Real Channel with Stent case, the maximum dimensionless horizontal velocity for the Curved Channel with Stent is , that is, less than 1% difference from Curved Channel with Stent. Therefore, the Curved Channel with Stent shows an acceptable approach to simulate the dynamics of concentration diffusion in coronary artery with atherosclerosis and drug-eluting stent implanted. This simplified model does not require image processing as the Real Channel and the mathematical equation used to describe the curve is sufficient. Converting to dimensional values, the maximum horizontal velocity assumes m/s However, this velocity may vary according to the coronary artery geometry for each patient. For the vertical velocity component, it is possible to observe in the Figure 7b that the drug-eluting stent implantation modifies the vertical velocity for all cases. For the Straight Channel where it does not have the atherosclerosis and the drug-eluting stent, the vertical velocity assumes the null value. However, it is possible to observe that the vertical velocity for the three cases in this work assumes others values. In all cases, the vertical velocity profiles are similar, where close to the drug-eluting stent, the blood flow acquires a upwards direction, while close to the axis of symmetry, the blood acquires a downward direction. In addition, the vertical velocity of Curved Channel has 2× the vertical velocity of Real Channel. However, the absolute value is only and this difference can be ignored.
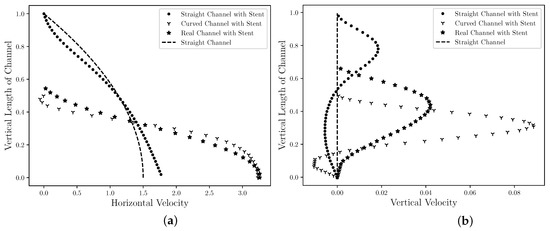
Figure 7.
The state steady of the blood horizontal (a) and vertical (b) velocities profiles in the middle ( R) for the straight channel, the curved channel and the real channel with drug-eluting stent. The velocities values are presented by nondimensional values and it is estimated that the drug-eluting stent implantation modifies the velocities profiles for all cases.
Figure 8 and Figure 9 present the temporal and spatial distribution of the concentration field for the three complex geometries with drug-eluting stent implanted using in each cases four drug diffusion coefficients, whose Schmidt numbers were: {1, 10, 100, 1000}, which are equivalent to drug-lumen mass diffusion rates of × 10 m/s respectively. The concentration field is represented with the nondimensional values where the red color represents and the blue color represents of the diffused concentration in the bloodstream. In Figure 8, it is presented the drug diffusion for (left column) and (right column) and the time in milliseconds to the steady state in each case. For the Straight Channel, the concentration diffusion acquires the steady state about 210 ms for , while for the is increased 65 ms. However, for the Curved Channel and Real Channel where the atherosclerosis is considered, the Curved Channel is faster than Real Channel in 24 ms for and 27 ms for , that is, about 7% for both cases. It is also possible to observe that the concentration field for is significantly more diffuse than in the , where the Schmidt number is 10 times higher. This means that a large portion of the diffused drug in bloodstream is quickly spread in the case. Moreover, in both cases, the concentration field is more dispersed at the end of the curved channel due to the direction of the blood flow and this diffusion affects the density and viscosity of the blood and consequently the Reynolds number. Therefore, the velocity field would also be affected. However, this influence is not considered in this work.

Figure 8.
The spatial and temporal distribution of the concentration diffusion using the (left column) and (right column) drug coefficients for the Straight Channel, the Curved channel and the Real Channel with the drug-eluting stent. It is estimated that the concentration field for is significantly more diffuse than in the , where the Schmidt number is 10 times higher. This means that a large portion of the diffused drug in bloodstream is quickly spread in the case.

Figure 9.
The spatial and temporal distribution of the concentration diffusion using the (left column) and (right column) drug coefficients for the Straight Channel, the Curved channel and the Real Channel with the drug-eluting stent. Both cases have a similar dynamic where it is possible to observe a decrease in the drug diffusion in the bloodstream when the Schmidt number is increased, it becomes a purely convective flow. Therefore, drugs with low mass diffusivity coefficients should be taken into account at drug-eluting stent design, in order to decrease the chemical species dissolution in the bloodstream.
In Figure 9, the drug coefficients is increased to (left column) and (right column) respectively. For the time analysis to steady state in the Curved Channel and Real Channel cases where the atherosclerosis is considered, the Curved Channel is faster than Real Channel in 48 ms for and 75 ms for , that is, about 9%. Moreover, both cases have a similar dynamic where it is possible to observe a decrease in the drug diffusion in the bloodstream when compared to the previous cases. The behavior of the drug is the same before the fat buildup and in the middle of the channel. However, the tests present a strong influence of the geometry of the channels on the drug accumulation after the buildup for cases with and 1000. Therefore, atherosclerosis has a direct influence on the drug diffusion field, modifying the dynamics of the drug diffusion in the bloodstream and moving the concentration In addition, the Schmidt number directly influences the drug transport in the blood flow, where the transport of chemical species becomes purely convective when low mass diffusivity coefficients are used; therefore, the choice of the drug plays an important role in the bloodstream diffusion. Drugs with low mass diffusivity coefficients should be taken into account at drug-eluting stent design, in order to decrease the chemical species dissolution in the bloodstream. However, the efficiency of these drug-eluting stents in the artery coronary wall should be investigated.
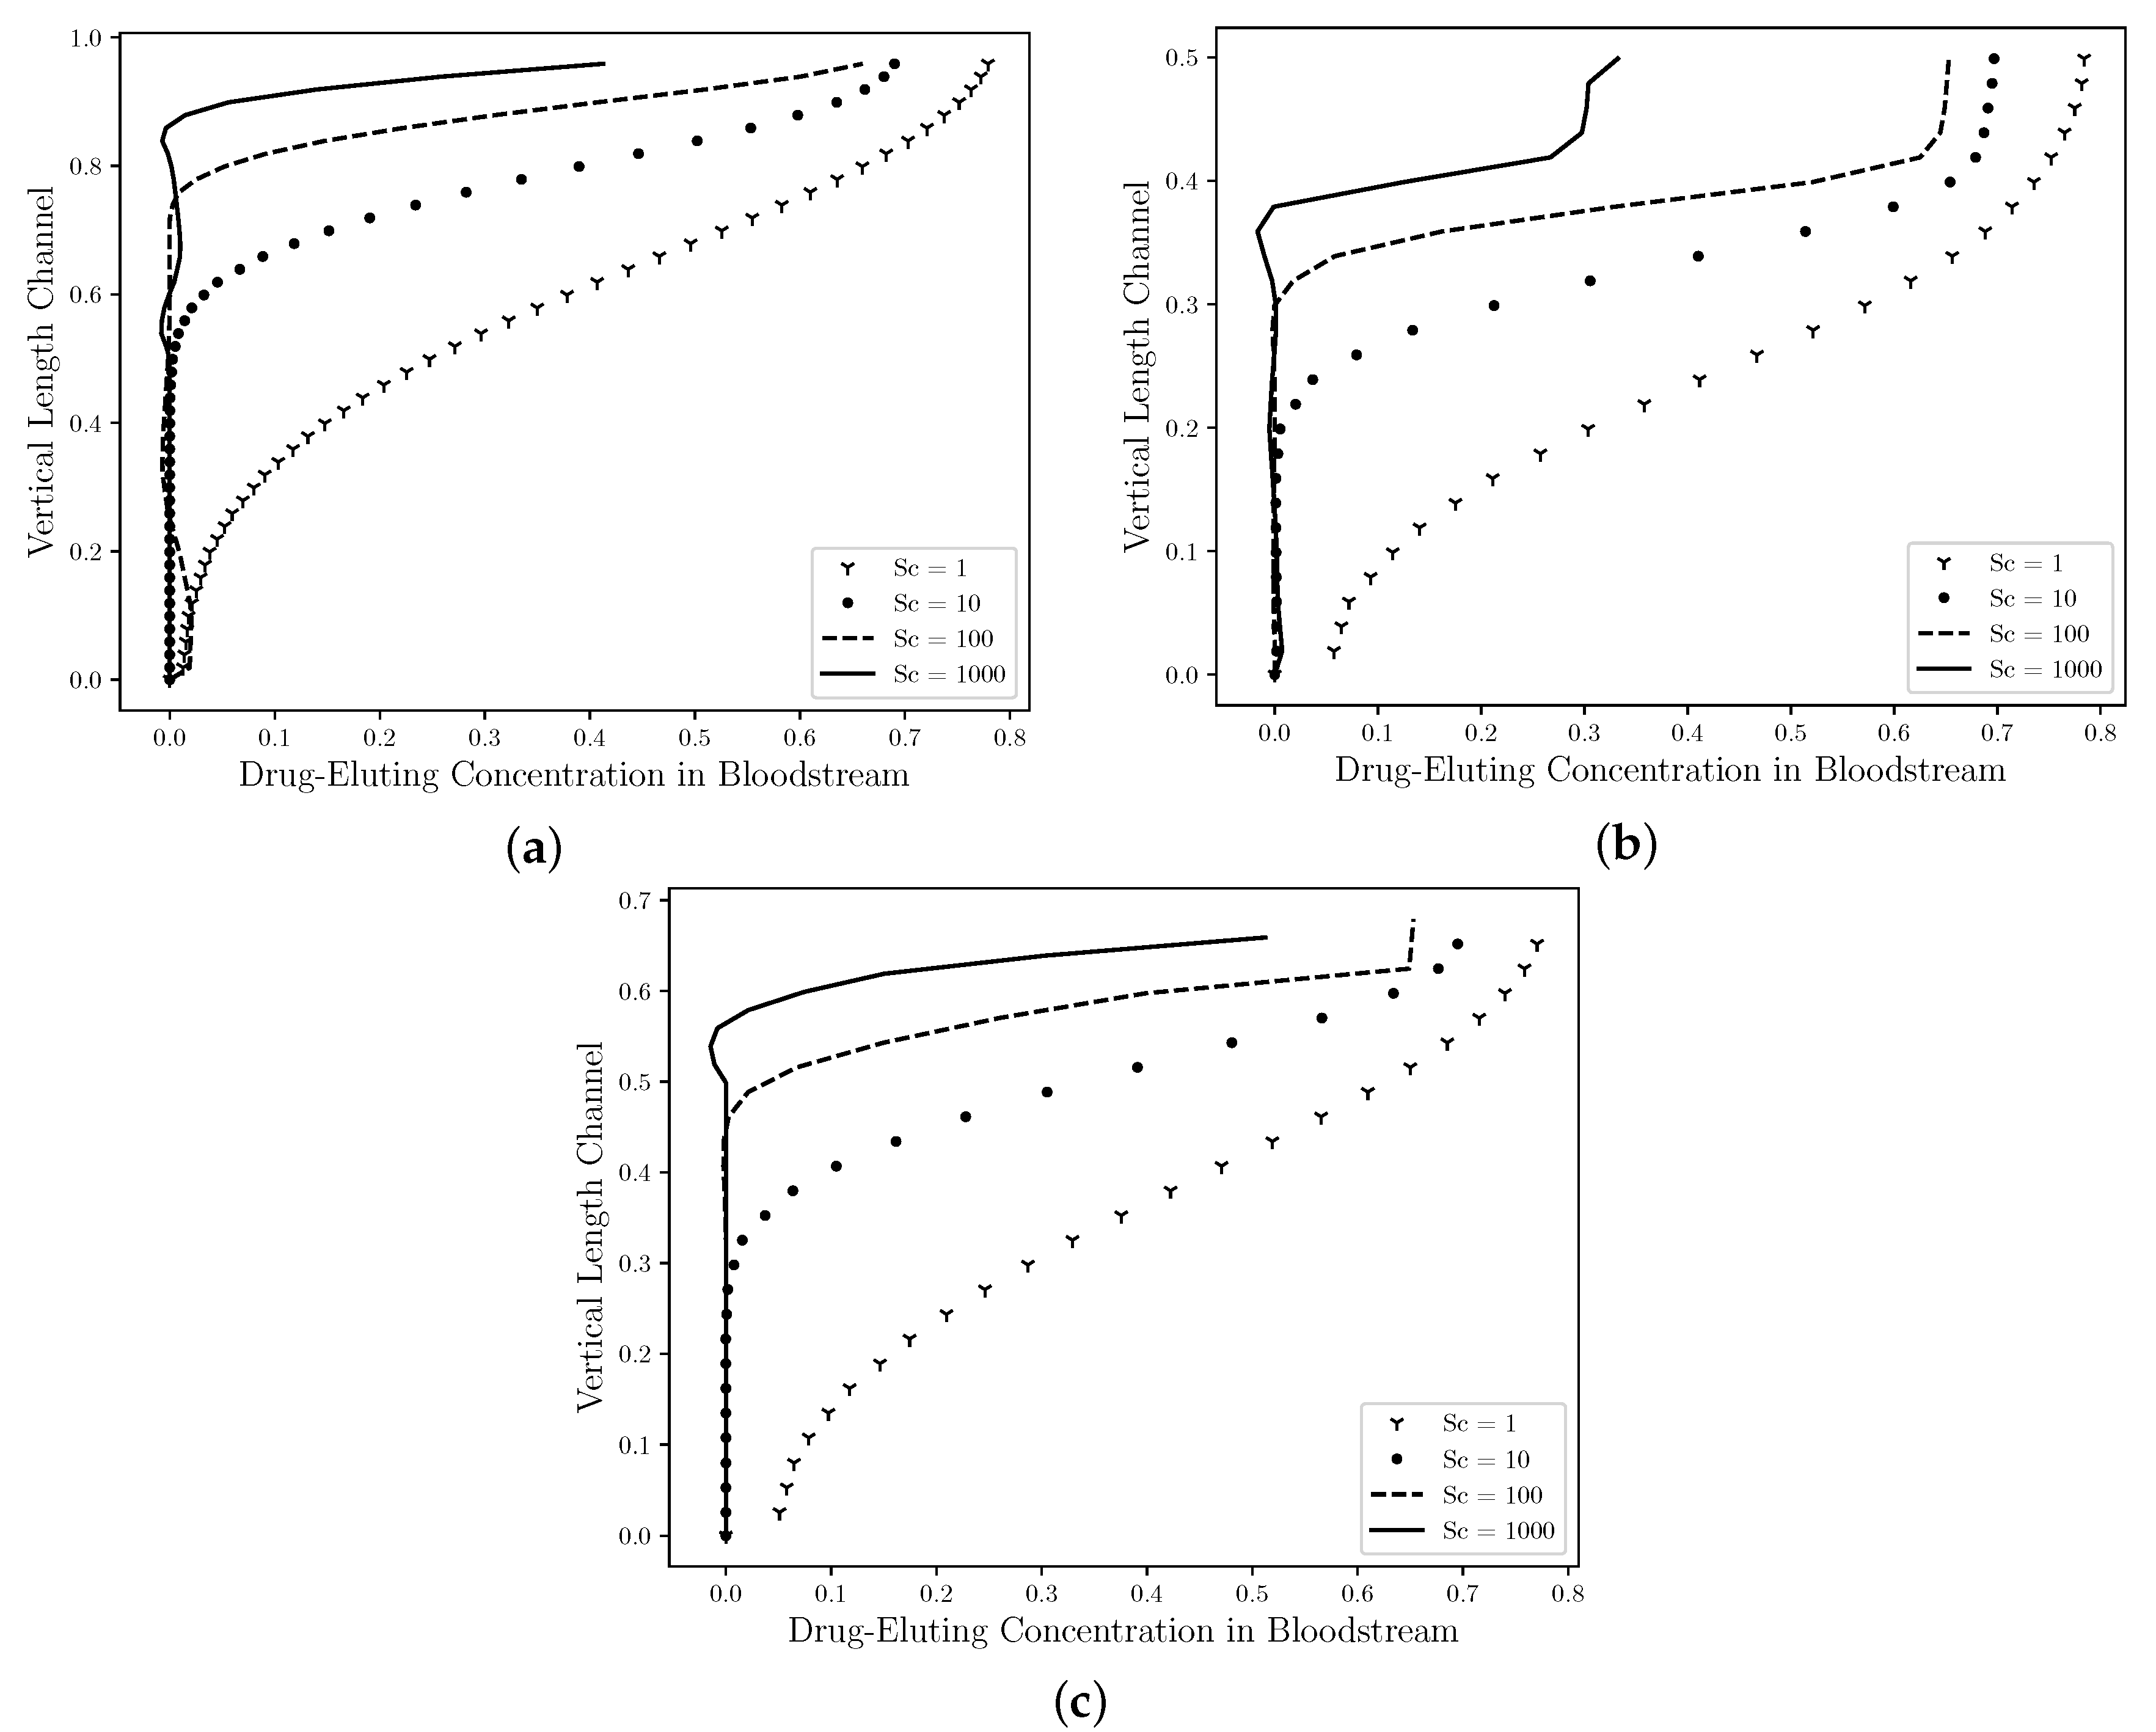
Figure 10 shows The comparison between the concentration profiles in the middle section channel ( R) for the Straight Channel (Figure 10a), the Curved Channel (Figure 10b) and the Real Channel (Figure 10c) are presented using four drug coefficients, whose Schmidt numbers were: 1, 10, 100, 1000}. As mentioned by Lucena et al. (2018), [8], it is estimated that 47% of the drug is diffused to the lumem and it is lost to the bloodstream. Therefore, in the Curved Channel (b), the maximum concentration field value that it assumes in the middle section channel for is 80% of this drug lost with a large diffusivity area in this section and it decreases as it approaches the symmetry axis. However, as the Schmidt number increases, the maximum concentration field is decreased and it assumes the 30% value for case. In addition, the concentration field profile is also dislocated in an upward direction and it becomes in a fine jet close to the drug-eluting stent. The maximum concentration field values in the Straight Channel (a), the Curved Channel (b), the Real Channel (c) have approximately the same values for each Schmidt number, that is, the maximum concentration value for Straight Channel when is equal to , while for the Curved Channel is equal to and the Real Channel is , therefore a difference of 2% between them. For the and cases, these differences are less than 1% in the both cases. Although, the atherosclerosis has a direct influence on the drug diffusion field; the behavior of the drug is the same in the middle of channel. Therefore, neither the atherosclerosis nor the drug-eluting stent influenced the dynamics of the drug diffusion.
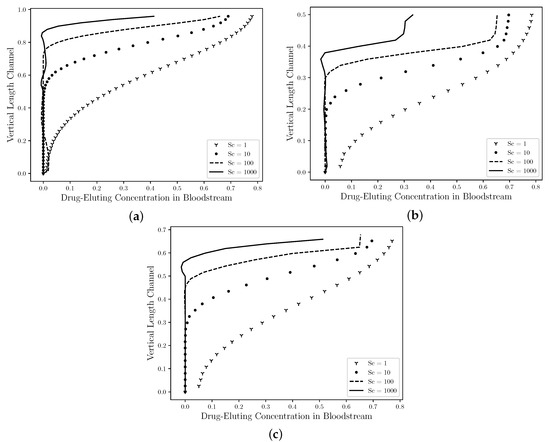
Figure 10.
The state steady of the drug diffusion profiles in the middle ( R) for the straight channel (a), the curved channel (b) and the real channel (c) with drug-eluting stent. The concentration values are presented by nondimensional values. It is observed that the maximum concentration field is decreased as the Schmidt number increases. In addition, the chemical species transport is dislocated in an upward direction and it becomes in a fine jet close to the drug-eluting stent. Therefore, it is estimated that the concentration field has a similar profile to all cases and neither the atherosclerosis nor the model channel influenced the dynamics of the drug diffusion.
4. Conclusions
In this work, the finite element simulation using the streamfunction-vorticity formulation with high order elements to compute biological flows found in coronary artery diseases was performed. The dynamics of concentration diffusion in coronary arteries requires a robust numerical method to compute the solution of the differential equations in a relevant model specially due to the presence of the thin drug concentration boundary layer that must be accurately captured. According to the results presented in the Poiseuille Symmetric Plannar Flow, the numerical code developed proved to be able to perform simulations in complex geometries such as those found in problems involving cardiovascular diseases.
The investigation of drug dissolution in bloodstream in the coronary arteries with atherosclerosis for the new generation of drug-eluting stents was carried out using three complex geometries as comparison of atherosclerosis recovering stages. A real artery geometry obtained using image processing allowed one to accurately investigate the dynamics of drug delivery in bloodstream. Recirculation zones were observed between the stents strut semi-circles and substantially increasing of velocity in arteries with atherosclerosis of more than three times if compared to a health artery. This increase influences the dynamics of blood flow and its biological processes. Moreover, the drug-eluting concentration in bloodstream is more dispersed at the end of the curved channel due to the direction of the blood flow and this diffusion affects the density and viscosity of the blood and consequently the Reynolds number. It was observed that the flow and drug spatial distributions before the fat buildup was not affected by the atherosclerosis. However, the tests present a strong influence of the geometry of the channels on the drug accumulation after the buildup for cases with and 1000. Therefore, atherosclerosis has a direct influence on the drug-eluting concentration field, modifying the dynamics of the drug diffusion in the bloodstream and moving the concentration field to the central region of the channel width. In addition, the Schmidt number directly influences the drug transport in the blood flow, where the transport of chemical species becomes purely convective when low mass diffusivity coefficients are used; therefore, the choice of the drug plays an important role in the bloodstream diffusion. Drugs with low mass diffusivity coefficients should be taken into account at drug-eluting stent design, in order to decrease the chemical species dissolution in the bloodstream. However, the efficiency of these drug-eluting stents in the artery coronary wall should be investigated.
Author Contributions
L.M. and G.R.A. have both contributed equally in the generation of the simulation results presented in this work as well as their quantitative and qualitative analysis. All authors have read and agreed to the published version of the manuscript.
Funding
This research was funded by Fundação Carlos Chagas Filho de Amparo à Pesquisa do Estado do Rio de Janeiro (E-26/202.631/2018 and E-26/202.815/2019).
Conflicts of Interest
The funders had no role in the design of the study; in the collection, analyses, or interpretation of data; in the writing of the manuscript, or in the decision to publish the results.
References
- World Health Organization (WHO). The Top 10 Causes of Death. 2018. Available online: www.who.int/news-room/fact-sheets/detail/the-top-10-causes-of-death (accessed on 6 April 2020).
- Siqueira, A.d.S.E.; Siqueira-Filho, A.G.d.; Land, M.G.P. Análise do impacto econômico das doenças cardiovasculares nos últimos cinco anos no Brasil. Arq. Bras. Cardiol. 2017, 109, 39–46. [Google Scholar]
- Spring, B.; Ockene, J.; Gidding, S.; Mozaffarian, D.; Moore, S.; Rosal, M.; Brown, M.; Vafiadis, D.; Cohen, D.; Burke, L.; et al. Better population health through behavior change in adults: A call to action. Circulation 2013, 128, 2169–2176. [Google Scholar] [CrossRef] [PubMed]
- Grüntzig, A.R.; Senning, A.; Siegenthaler, W.E. Nonoperative Dilatation of Coronary-Artery Stenosis. N. Engl. J. Med. 1979, 301, 61–68. [Google Scholar] [CrossRef]
- Hwang, C.; Wu, D.; Edelman, E.R. Physiological Transport Forces Govern Drug Distribution for Stent-Based Delivery. Circulation 2001, 104, 600–605. [Google Scholar] [CrossRef]
- Zunino, P.; D’Angelo, C.; Vergara, C.; Capelli, C.; Migliavacca, F. Numerical simulation of drug eluting coronary stents: Mechanics, fluid dynamics and drug release. Comput. Methods Appl. Mech. Eng. 2009, 198, 3633–3644. [Google Scholar] [CrossRef]
- Bozsak, F.J.-M.C.; Barakat, A. Modeling the transport of drugs eluted from stents: Physical phenomena driving drug distribution in the arterial wall. Biomech. Model Mechanobiol. 2014, 13, 327–347. [Google Scholar] [CrossRef] [PubMed]
- Lucena, R.; Mangiavacchi, N.; Pontes, J.; Anjos, G.; McGinty, S. On the transport through polymer layer and porous arterial wall in drug-eluting stents. J. Braz. Soc. Mech. Sci. Eng. 2018, 40, 1–10. [Google Scholar] [CrossRef]
- Batchelor, G. An Introduction to Fluid Dynamics; Cambridge University Press: Cambridge, UK, 1967. [Google Scholar]
- Babuska, I. Error bounds for Finite Element Method. Numer. Math. 1971, 16, 322–333. [Google Scholar] [CrossRef]
- Brezzi, F. On the existence, uniqueness and approximation of saddle-point problems arising from lagrange multipliers. Rev. Française d’Autom. Inform. Rech. Opérationnelle. Anal. Numérique 1974, 4, 1–26. [Google Scholar]
- Sawyer, J. A Semi-Lagrangian method of Solving the Vorticity Advection Equation. Tellus 1963, 15, 336–342. [Google Scholar] [CrossRef]
- Robert, A. A stable numerical integration scheme for the primitive meteorological equations. Atmosp. Ocean. 1981, 19, 35–46. [Google Scholar] [CrossRef]
- Pironneau, O. On the Transport-Diffusion Algorithm and its Applications to the Navier-Stokes Equation. Numer. Math. 1982, 38, 309–332. [Google Scholar] [CrossRef]
- Cowper, G. Gaussian quadrature formulas for triangles. Int. J. Numer. Methods Eng. 1973, 7, 405–408. [Google Scholar] [CrossRef]
- Kessler, W.; Moshage, W.; Galland, A.; Zink, D.; Achenbach, S.; Nitz, W.; Laub, G.; Bachmann, K. Assessment of coronary blood flow in humans using phase difference mr imaging comparison with intracoronary doppler flow measurement. Int. J. Card. Imaging 1998, 14, 179–186. [Google Scholar] [CrossRef] [PubMed]
- Henderson, A. Paraview Guide, a Parallel Visualization Application; Kitware Inc.: New York, NY, USA, 2007. [Google Scholar]
Publisher’s Note: MDPI stays neutral with regard to jurisdictional claims in published maps and institutional affiliations. |
© 2021 by the authors. Licensee MDPI, Basel, Switzerland. This article is an open access article distributed under the terms and conditions of the Creative Commons Attribution (CC BY) license (http://creativecommons.org/licenses/by/4.0/).

