Abstract
The influence of chemistry and differential diffusion transport modeling on methane oxy-fuel combustion is analyzed considering different diluent characteristics. Analyses are conducted in terms of numerical simulations using a detailed description of the chemistry. Herein, different reaction mechanisms are employed to represent the combustion of methane. Simulations were performed with the computational fluid dynamics (CFD) code CHEM1D following different numerical setups, freely propagating flame, counter flow flame, and propagating flame in droplet mist reactors. The employed method is validated against experimental data and simulation results available in the literature. While the counter-flow flame reactor is exclusively used in the validation stage, different scenarios have been established for propagating flame simulations, as in single- or two-phase flow configuration. These comprehend variations in diluent compositions, reaction mechanisms, and different models to account for diffusion transport. Conducted investigations show that the choice for a specific reaction mechanism can interfere with computed flame speed values, which may agree or deviate from experimental observations. The achieved outcomes from these investigations indicate that the so-called GRI 3.0 mechanism is the best option for general application purposes, as a good balance is found between accuracy and computational efforts. However, in cases where more detailed information and accuracy are required, the CRECK C1-C3 mechanism demonstrated to be the best choice from the evaluated mechanisms. Additionally, the results clearly indicate that commonly applied simplifications to general flame modeling as the unitary Lewis number and mixture averaged approach strongly interfere with the computation of flame propagation speed values for single- and two-phase flows. While the application of unitary Lewis number approach is limited to certain conditions, the mixture averaged approach demonstrated a good agreement with the complex model for flame speed computations in the various tested scenarios. Such an outcome is not limited to oxy-fuel applications, but are straightly extensible to oxy-steam and air-blown combustion.
1. Introduction
Oxy-fuel combustion stands out as one of the most promising carbon capture and storage (CCS) technologies when retrofitting is accounted for. Within this technology, air is completely or partially substituted by a mixture of pure oxygen and flue gas species [1]. The exchange of the nitrogen existing in air-blown combustion for predominantly and does not only modify mixture properties, but also reaction kinetics and heat transfer rates [2,3]. Altogether, these aspects are able to interfere with the resulting flame structure and with the form in which the flame interacts with the fluid flow. The resulting differential diffusion effects and radiation heat transfer are more pronounced in oxy-fuel than in air-blown combustion. As a consequence, flame stability and structure are modified when compared with air-blown combustion [3,4]. Regarding computational fluid dynamics simulations, the consideration of both phenomena makes this kind of calculation much more challenging for oxy-fuel combustion [5,6]. Generally, analysis of oxy-fuel combustion are conducted assuming pure as a diluent [2]. However, the usage of water steam as a diluent agent has been receiving special attention within the oxy-fuel combustion context [7,8,9]. Within the denoted oxy-steam combustion [7,8,9], flue gas recirculation is avoided and volumetric flow rates are reduced, which consequently allow the size reduction of involved components in a process. In fact, when employing flue gas recirculation, mole fraction may be as high as 30 vol% [8]. Considering these aspects, it is of interest to construct a comprehensive understanding about the effects of different diluent compositions as well as the influence of commonly applied models to represent species and energy diffusive transport in CFD applications of oxy-fuel combustion.
Park et al. [2] presented a comprehensive numerical analysis of the chemical reactions involving oxy-fuel combustion. The complete study is performed with the software Chemkin using the chemical mechanism GRI 3.0 [10]. Particularly, GRI 3.0 was evaluated by Hunger et al. [5] as a suitable mechanism to analyze oxy-fuel combustion of methane. Park et al. [2] gave focus on the chemical implications regarding the application of as a diluent, as well as the emission. As an outcome of this part of the study, they could observe that the recirculation of attenuates the production and consumption of . With respect to the influence of in combustion reactions evolution, the authors could demonstrate that this species does not only interfere with chemical reaction in terms of its specific thermal properties, but it also changes the chemical paths on which combustion reactions evolve. Such an investigation has been conducted including an artificial species with the same thermal properties as which behaves as an inert molecule. This procedure was also adopted by Xie et al. [3] to study the characteristics of freely propagating flames of methane diluted with , in which the chemical mechanism GRI 3.0 was also employed. In [3], different dilution fractions, operating pressures, and equivalence ratios were investigated numerically and experimentally. Similar conclusions about the influence of as presented in [2] could be observed.
In contrast with the previously listed detailed chemistry investigations, Wang et al. [11] employed the mechanism presented in [12,13,14] for oxy-fuel combustion of methane to investigate physical and chemical effects of different diluent species. Carbon dioxide and water have been investigated as diluent agents within the framework of wet and dry flue gas recirculation techniques. That study was conducted in a numerical framework where diverse artificial species are considered to allow single analysis of thermal and chemical effects, as well as the effects of transport properties of both diluent species. Similar to the work conducted by Park et al. [2], investigations are performed in counterflow flame burners. Recently, Bagheri et al. [15] evaluated the performance of a new version of the so called CRECK C1-C3 mechanism to predict methane oxy-fuel combustion diluted with and in different configurations. As done in [2,3,11], inert species mimicking diluent agents have been included in analysis of freely-propagating flames.
As well posed by Xie et al. [3], species transport properties do contribute to flame stability issues in oxy-fuel flames. Within this context, the denoted differential–diffusion transport [16] is a key phenomenon. In air-blown processes, the presence of attenuates such phenomenon due to its high concentration and proximity to unitary Lewis number. As a result, the unitary Lewis number assumption, often employed to simplify the chemical modeling, is less harmful in this kind of process. This topic has been recurrently subject of experimental [4,5] and numerical [6] studies, although with different focuses and approaches. Sevault et al. [4] performed a detailed analysis of a diffusion oxy-fuel flame varying fuel and oxidizer compositions, as well as fuel stream velocity. By employing simultaneous line-imaged Raman/Rayleigh laser diagnostics, they could measure temperature and main species concentration, which consequently allowed to analyze differential diffusion effects. The various operating conditions have been investigated in a coflow burner, where turbulent flames could be obtained. The authors noticed that differential–diffusion effects are concentrated at the upstream part of the flame, while such a phenomenon is attenuated in more downstream regions. It must be highlighted that, in [4,5,6], is mixed with methane to increase the relatively low chemical reaction rates of this last species. By adopting this procedure, differential diffusion effects are more pronounced, since hydrogen presents quite lower Lewis numbers when compared with the remaining species.
Hunger et al. [5] presented experimental and numerical investigations of laminar and turbulent flames in a coflow burner. Different radiation models and the influence of the Soret transport were numerically investigated. This paper stands out by the novelty of direct comparison of Rayleigh signals obtained from the experiments and numerical simulations. Following this procedure, systematic errors associated with the determination of the mixture composition through Rayleigh signals are reduced. The results show that simulations and measurements agree quite well in laminar flames, however deviations occur in turbulent context. Part of the observed deviations are assigned to the simplifications assumed in the turbulent flame modeling. Further contributions to the modeling of oxy-fuel turbulent flames are found in [6]. Gierth et al. [6] used one of the flames experimentally investigated by Sevault et al. [4] as a benchmark to assess new chemical models to capture differential diffusion effects. Different from Hunger et al. [5], who conducted the analysis in Reynolds averaged Navier–Stokes (RANS) context, Gierth et al. [6] performed simulations in large eddy simulation (LES) framework. As in [5], the chemical treatment also followed the flamelet progress variable (FPV) approach. Three different procedures were investigated: the unitary Lewis number assumption, a variable Lewis number model, and an intermediate approach that considers effective Lewis numbers. In this last model, species Lewis numbers vary from their laminar value up to one, where turbulence is supposed to interfere with the chemical reactions. The results obtained from a priori analysis show that the effective Lewis number approach delivers better results. However, no universal model could be clearly indicated as a best option for turbulent flame analysis.
It is the purpose in this work to investigate the effects of different reaction mechanisms and diffusion transport modeling in oxy-fuel combustion of methane including different dilution agent characteristics. This study also aims to contribute by addressing some raised questions in previous works [3,11]. For instance, Xie et al. [3] indicated that the GRI 3.0 mechanism under predicts the laminar burning velocities of oxy-fuel combustion for some mixture compositions. Specifically, this outcome of Xie et al. [3] is one of the main motivations to analyze the mechanism effects on oxy-fuel combustion in the present study. Analyses are conducted using the computational fluid dynamics (CFD) and a detailed description of the chemistry. In contrast with previous listed works in detailed chemistry context, the investigations of diffusion transport modeling is conducted in view of typical modeling strategies applied to general CFD solvers. Different from the analysis conducted by Wang et al. [11], water dilution is considered in view of oxy-steam application in which concentrations in fresh reactants streams are much higher. Therefore, to attain physical consistency in such a study, flames propagating in water droplet mists are considered to represent mixtures with water concentrations above saturation.
The remaining structure of this paper is divided into three parts. An overview of the theoretical background is described in Section 2. In Section 3, simulations results are presented. Validations of the applied methodology precedes the parametric analysis, in which the most important contributions of this work are presented. In the last part, final remarks and the main conclusions are summarized.
2. Modeling Approaches
Simulations were conducted with the CFD code CHEM1D [17], which has been extended with a Lagrangian module in [18] to study flames propagating in droplet mists. While overall single phase simulations are described in the Eulerian context, flames propagating in droplet mists of condensed water are performed within a Eulerian–Lagrangian framework. In this last scenario, a full inter-phase two-way coupling is considered.
Specific to the two-phase flow calculations, the simulations presented in this manuscript mimic unstrained laminar flames propagating in mono-dispersed and isotropic droplet mists in order to isolate the diverse underlying phenomena. Similar to as done in [18,19,20], the following simplifications and approximations are assumed: (a) the multi-dimensional aspects of the droplets dispersion does not modify the flame surface; (b) mists are diluted, thereby no droplets interaction are accounted for; and (c) no micro-mixing model is included, so that all the mass evaporated from a drop fills instantaneously the host control volume. It is important to highlight that, when a droplet crosses a cell boundary a splitting factor is used to interpolate the source of vapor between the two host control volumes. Furthermore, parcels are tracked instead of real drops. In this way, a parcel may represent more or even less than one real drop. The role played by them can be illustrated as a dispersed source of water vapor, which follows the physical models described in the following two sections. For more details about the numerical methods and simplifications applied to the dispersed phase, the reader is referred to [18,20].
2.1. Gas Phase
The description of the carrier phase follows a variable-density low Mach number formulation. Following the strategies presented in [17,18,21,22], the set of equations employed here is
Equation (1) ensures the mass conservation of the coupled system, where is the mixture mass flux, x is the spatial coordinate, K is the local stretch rate, and is the source term of vapor. The computation of the local stretch rate is performed by means of Equation (2), where is the viscosity and a is the applied strain rate. The conservation of chemical species is described by Equation (3). Herein, is the mass fraction of the species , is the total number of participating species, is the diffusion velocity, is the reaction rate, and is the Kronecker delta. The subscript k in Equation (3) refers to the vapor species. The last equation of this set is associated to the conservation of energy, which is expressed in terms of the absolute enthalpy h. The absolute enthalpy of each transported species is represented by , while the coupling term between phases is denoted by . For details about the coupling source terms, the reader is referred to [18]. Finally, q corresponds to the heat flux which is written as
in which is the thermal conductivity, T is the temperature, R is the gas constant, is the thermal diffusion coefficient, X is the molar fraction, and M is the molar mass. In Equation (4), is the heat source term, which is associated in this work with radiation heat transfer.
The full set of equations presented in terms of Equations (1)–(4) is adapted to each analyzed configuration. When single-phase flames are simulated, phase exchange terms and are not accounted for. Equation (2) is exclusively considered in counterflow flames configuration, which are single-phase flames in the subsequent investigations. This aspect justifies the absence of phase coupling source terms in Equation (2). Finally, for freely propagating flames, the terms including the local stretch rate in Equations (1), (3) and (4) are neglected.
As part of the main objective of the present work, different modeling strategies are applied to the diffusion transport of energy and species. Altogether, three strategies have been employed to characterize diffusion transport. Firstly, a detailed procedure is adopted throughout the presented analyses. Herein, thermal diffusion effects are accounted for in energy and mass transport in terms of Dufour effects (last term on the right hand side (RHS) of Equation (5)) and considering that
where the last term on the RHS includes Soret effects on mass transport. Within this first procedure, diffusion coefficients ( and ) are estimated following the strategy proposed by Ern and Giovangigli [23].
Following typically applied strategies in complex flows [6,24], the two other procedures chosen to characterize the diffusion transport refer to the Hirschfelder–Curtiss formulation (hereafter, denoted as the mixture averaged approach; [22] and a unitary Lewis number approach. In both, thermal diffusion effects are not considered. For the mixture averaged approach, diffusion velocities and heat flux are given by
and
in which is the Lewis number of species i and is the specific heat of the mixture. However, for the unitary Lewis numbers approach, the simplifying condition is not only specified by setting , but also considering that . This is a typical strategy applied to address turbulent combustion simulations based on tabulated chemistry [24,25]. As a consequence, diffusion velocities and heat flux are written as
To account for the radiation heat flux, an optically thin radiation model with the Planck mean absorption coefficient is employed. In addition to this modeling strategy being a common approach in detailed chemistry analysis of oxy-fuel combustion [2,3,11], it has been adopted in test cases used as a target for model validation in the present work. For simulations including heat transfer by radiation, the term in Equation (4) is computed by
where is the Stefan–Boltzmann constant, is the ambient temperature, and is the mean absorption coefficient. The last quantity is computed in terms of
In Equation (11), is the mean absorption coefficient of species i and is the local partial pressure. Coefficients correspond to corrected values from those presented in [26], which are summarized in Table 1.

Table 1.
Fitting coefficients for the calculation of the Planck mean absorption coefficient.
2.1.1. Chemistry
Altogether three reactions mechanisms have been employed to characterize methane combustion: GRI 3.0 [10], CRECK C1-C3 [15], and the one developed in [12,13,14] (hereafter, denoted as DTU mechanism). All of them have demonstrated good performance to address oxy-fuel combustion. Particularly, the GRI 3.0 was employed, for instance, in [2,3,5,6] to address different aspects of oxy-fuel combustion where is used as a diluent agent. Hunger et al. [5] classified this mechanism as suitable to analyze oxy-fuel combustion of methane, while some limitations of it were pointed out by Xie et al. [3] to address strongly diluted mixtures in laminar freely propagating flame setups. Recently, Bagheri et al. [15] validated the CRECK C1-C3 mechanism in methane oxy-fuel combustion using and as diluent agents in different setups. Wang et al. [11] employed the DTU mechanism to investigate methane oxy-fuel combustion diluted with and in laminar freely-propagating and counterflow flame setups.
A summary of the main characteristics of the three selected mechanisms are presented in Table 2. It is important to highlight that, here, transport properties have been extracted from those presented in [27] for the DTU mechanism. This choice has been adopted since original versions of this mechanism did not include transport properties. Following this strategy, we sought to keep each analyzed mechanism in the most consistent form with its proposing research group.
Table 2.
Summary of the employed reaction mechanisms.
2.2. Liquid Phase
In the one-dimensional Lagrangian framework, the tracking of a parcel is essentially described by two ordinary differential equations (ODE) (e.g., Sirignano [28])
for the parcel position and acceleration, respectively. In the present context, drag is the unique force acting on a droplet. For both equations, the subscript p indicates quantities of droplet parcels. Specifically, corresponds to the droplet position, is the density, u is the velocity, t is time, and is the droplet diameter. To compute the drag coefficient , the model recommended by Yuen and Chen [29] is adopted.
Heat and mass exchanges are, respectively, described by
with T the temperature, Nu the Nusselt number, a correction factor due to evaporation, Pr the Prandtl number, the heat of vaporization, , the specific heat of the liquid, expressing the particle relaxation time, and . In Equation (14), Sh is the Sherwood number, Sc is the gas Schmidt number, and represents the specific driving potential for mass transfer (). The non-dimensional numbers Pr and Sc are explicitly computed at each time integration of the evaporation equations based on material properties of the mixture film surrounding each tracked droplet. Notice that both are also used to compute the , which is consequently employed for instance in heat transfer Spalding number calculation (e.g., [20]). Within equations presented for , , and , is the specific heat at constant pressure and and denote the Spalding transfer numbers for heat and mass, respectively. Subscripts and correspond to surrounding gas properties and vapor properties, while refers to properties evaluated with the assumption of phase equilibrium. Observe that heat transfer by radiation is not considered in dispersed phase computations.
The structures of Equations (13) and (14) follow those proposed by Miller et al. [30], which are those implemented in Chem1D [18]. Within this formulation, the Abramzon–Sirignano model (see [31]) is adopted in the present study. This choice is based on the fact that this model has been broadly applied in different studies about spray combustion [20,32,33] due to their ability to represent droplet evaporation by considering infinite liquid thermal conductivity. The surrounding gas properties exclusively used in Lagrangian subroutines (i.e., , , , and ) are computed here following the strategy detailed in [20], where the gas composition in the far field follows the species diluted approach (SD) including all participating species. Certainly, the simplification of the gas mixture by a couple of major species should improve computational efficiency, as presented for air-blown combustion in [20]. Nevertheless, since this has not been extensively investigated for oxy-fuel combustion, this topic will be subject of future work.
An important aspect is that the carrier phase is described in a steady-state formulation, while the dispersed phase follows an unsteady framework. To couple both approaches, the methodology proposed in [18] is applied here.
3. Results
This section is divided into three parts. In the first, the resulting numerical modeling strategy is validated in terms of comparisons of simulation results against data extracted from the literature. Next, the effects of the three selected reaction mechanisms are tested and compared among each other. The influence of diffusion transport modeling is finally evaluated in the last part of this section. While validation is only conducted for single-phase flames, the remaining analyses are considered for both single- and two-phase flows.
3.1. Validation
To validate the resulting numerical setup, freely propagating flames are considered within a single-phase flow framework. Experimental data available in the literature for methane oxy-fuel combustion diluted with and are used to accomplish this task. Specific model features are additionally validated in counterflow flame configuration for methane oxy-fuel combustion, as presented in Appendix A.
A common characteristic of all reference works from which data was extracted for the model validation is that simulations were conducted with the GRI 3.0 mechanism. Therefore, in this section, simulation results are also conducted with this reaction mechanism. With respect to the diffusion transport modeling, in this section and the next one, detailed diffusion transport following Equations (5) and (6) are accounted for.
Laminar flame speed () values of methane oxy-fuel combustion diluted in are presented on the left side of Figure 1 for various equivalence ratios (). Simulation results are compared with the experimental data presented in [3]. Such a database was also employed by Bagheri et al. [15] to validate the performance of the CRECK C1-C3 mechanism in oxy-fuel combustion diluted with . For all cases, ambient pressure is set to 0.1 MPa and fresh reactants enter the computational domain with a temperature of 300 K. This temperature value is also used as the ambient temperature for simulations including radiation heat transfer. Different oxidizer compositions define the various scenarios, where .
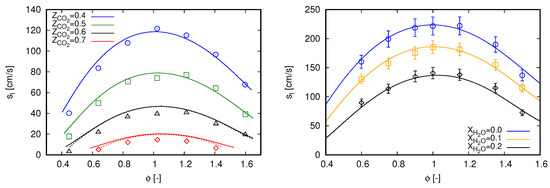
Figure 1.
Laminar flame speed computed with GRI 3.0 using freely propagating flame reactors. Marks, experimental data; continuous lines, adiabatic simulations; dashed lines, simulations with radiation heat losses. (left) dilution with experimental data extracted from [3]; and (right) dilution with experimental data extracted from [34].
An overall good agreement can be noticed between simulation results and measured data in Figure 1 (left) for all scenarios. Such a behavior is also achieved in [3] with GRI 3.0 and CHEMKIN-II [35], as well as in [15] with CRECK C1-C3 and OpenSMOKE++ [36]. However, different from both reference studies, slight deviations can be noticed here for lean mixtures. Contrastingly, deviations presented in [3] are rather concentrated near stoichiometric mixtures, while they occur for rich mixtures in [15].
The observed deviations in Figure 1 (left) are slightly attenuated with the inclusion of radiation heat transfer for cases with higher dilution fraction of . As expected, radiation effects on the propagation speeds of laminar freely propagating flames are not significant. Minor impacts in flame speed values do occur for cases with higher dilution fraction of and when the laminar flame thickness are relatively large, namely at smallest and highest values of . Within the oxy-fuel methane combustion diluted in , effects of radiation heat transfer are more pronounced in counterflow flame configuration. Specifically, the results presented in Appendix A are used to validate the employed radiation model.
Similar to the cases diluted with , the results presented in Figure 1 (right) do not change by including radiation heat transfer. Despite the moderate dilution fractions, some contribution of radiation heat transfer was expected due to the assumption of ambient temperature of 300 K, considering that fresh reactants enter enters the computational domain at 373 K. However, again, this does not occur for this setup.
Particular to Figure 1 (right), the proposed modeling strategy demonstrates to correctly capture the methane oxy-fuel combustion diluted with water. The results are predominantly within the experimental uncertainty for all scenarios. Similar results were also reported by Mazas et al. [34] with GRI 3.0 and CHEMKIN-II, as well as by Bagheri et al. [15] with CRECK C1-C3 and OpenSMOKE++. Here, simulation results are slightly out of the experimental uncertainties in the scenario for and in the scenario for and . It is important to mention that, for all cases presented in Figure 1 (right), ambient pressure is set to 101.325 kPa.
In summary, the results presented in this section indicate that the proposed modeling strategy is able to reproduce single-phase methane oxy-fuel combustion diluted with and . As radiation heat transfer is not pronounced to evaluate the laminar flame speed, the modeling of this phenomenon will not be considered in the subsequent analyses.
3.2. Effects of Reaction Mechanisms
The effects of reaction mechanisms on oxy-fuel combustion diluted with and are analyzed for single- and two-phase flows in this section. To accomplish this task, the three mechanisms listed in Section 2.1.1 are employed.
For single-phase flows, investigations are conducted considering the same reference scenarios as in the previous section. In this sense, laminar flame speed values computed with the different mechanisms are compared with experimental data in Figure 2. As three mechanisms are employed in this section, the results of adiabatic flames previously presented for the GRI 3.0 mechanism in Figure 1 are also included in Figure 2.
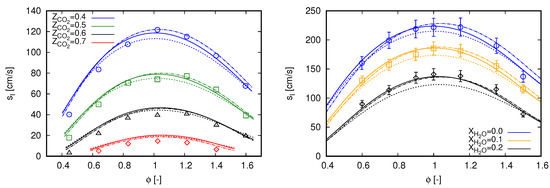
Figure 2.
Laminar flame speed computed with different mechanisms using freely propagating flame reactors. Marks, experimental data; continuous lines, GRI 3.0; dashed lines, DTU; dash-dot lines, CRECK C1-C3. (left) dilution with experimental data extracted from [3]; and (right) dilution with experimental data extracted from [34].
Observing the flame speed values obtained with the DTU mechanism for flames diluted with in Figure 2 (left), a recurrent behavior can be observed when compared with results obtained with the GRI 3.0 mechanism for the different scenarios. Flame speeds values are lower than those computed with GRI 3.0 for the inner and broadest part of the considered equivalence ratio range, while in the outer parts flame speeds computed with DTU mechanism are slightly higher. Such a behavior allows an overall better approach of computed values with DTU to the experimental data for lean mixtures of . The same occur for of , of , and of .
Similar to the behavior observed for flames diluted with in Figure 2 (left), the DTU mechanism predominantly delivers lower flame speeds than those achieved with GRI 3.0 in flames diluted with as presented in Figure 2 (right). Slightly higher flame speeds, when compared with GRI 3.0 results, are only noticed at the richest portion for the difference scenarios. In contrast to the observed for flames diluted with in Figure 2 (left), this overall behavior shifts results achieved with DTU mechanism away form the experimental data when dilution with water is accounted for, namely for and .
Flame speeds computed with the CRECK C1-C3 mechanism overall better agree with the experimental data when compared with the two other reaction mechanisms for diluted combustion. Particularly, comparisons of this mechanism with these same experimental data, as for and diluted combustion, were also conducted by Bagheri et al. [15]. The main difference between that study and the present one refers to the employed numerical solver; in [15], OpenSMOKE++ was used. By comparing both works, simulation results achieved with Chem1D seems to slightly better agree with the experimental data for diluted combustion, while in [15] computed flame speeds are slightly better for lean flames diluted with .
When results achieved with GRI 3.0 and CRECK C1-C3 mechanism are compared, the latter clearly reproduced the flame speed behavior observed in experimental data for of diluted combustion. Xie et al. [3] indicated that the GRI 3.0 mechanism under predicts the laminar burning velocities of oxy-fuel combustion exactly in the same region, i.e., . As mentioned in the Introduction, this raised aspect in [3] was one of the main motivations to analyze the mechanism effects on oxy-fuel and oxy-steam combustion in the present study. From the comparisons presented in Figure 2 (left), the CRECK C1-C3 mechanism appears to attend the previous raised demand in [3]. Furthermore, the CRECK C1-C3 mechanism also allows a better approach to the experimental data for the most lean mixtures in Figure 2 (left).
Concerning diluted combustion, CRECK C1-C3 mechanism also agrees well with available experimental data. The higher flame speed values for , when compared with GRI 3.0, are also noticed here. The results are predominantly within the error bars presented for Mazas et al.’s [34] measurements. Exceptions occur in some regions, for instance of and , as well as of .
To gain more understanding about the main causes of the deviations in flame speed values among the different mechanisms (as presented in Figure 2), two approaches were applied. First, common quantities to the three chosen mechanisms that are able to interfere with the computation of were sought. This option was chosen since these mechanisms differ in number and specifications of species and reactions, which in turn do not allow a one-by-one comparison of reaction parameters. Second, sensitivity analysis and an evaluation of reaction rates of each mechanism were performed. It is important to highlight that it is not the scope of this work to deepen into kinetic analysis, however deviations perceived in make it relevant to point out more specific information about chemical reactions.
According to the first chosen approach, the integrated heat release rate over the computational domain () and the thermal diffusivity () are chosen. and are, respectively, related to Equations (15) and (16), which are used to estimate the unstrained laminar flame speed.
and
Equation 15 is based on the integration of the energy transport equation in the x coordinate from to ∞ following the notation proposed in [16], where subscript indicates quantities evaluated in fresh gas and subscript is associated to burnt gas. Remaining properties without superscripts refer to volume averaged properties throughout the computational domain. With respect to the integration, is the heat release rate per volume unit of the computational cell i and is the one-dimensional cell length. Equation (15) refers to an expression based on the thermal theory following Mallard and LeChatelier’s development, as presented in [37]. In this equation, denotes the reaction rate of a reaction-progress variable in ().
The choice for and for the subsequent analysis allows an evaluation of the global behavior of the entire reaction mechanisms in terms of the heat release rate and the combination of thermal and transport properties. As a consequence, the main aspects that differ from one mechanism to another (i.e., thermal, transport, and reaction specifications) are covered in terms of mixture based quantities. The preceding term to in Equation (15) () is not considered since it does not comprehend transport properties and differences between tested cases are marginal. Similarly, is preferred instead of since it embraces reaction rates of all participating species of a specific mechanism.
Figure 3 presents values of both and for lean (), stoichiometric (), and rich () flames diluted with and at the same fractions as presented in Figure 1 and Figure 2. Differences among the mechanisms observed through exactly follow the same trend depicted in flame speed profiles in Figure 2. As previously mentioned, profiles of through do not significantly deviate among tested reaction mechanisms. Therefore, concerning Equation (15) (which delivers flame speed values with an averaged deviation of 3% and maximum deviation lower than 5% from Chem1D results), differentiation between mechanisms occurs by means of . Briefly, these aspects indicate that the differences of exo- and endothermic behaviors of chemical reactions which compose each mechanism clearly deliver different values of the global heat release rate, which consequently interferes with the flame propagation speed. Although the mechanisms were derived from different research works, no significant deviations are found between values. Hence, the results presented in Figure 3 indicate that the overall behavior observed in Figure 2 among the different mechanisms stems from the reactions specifications.
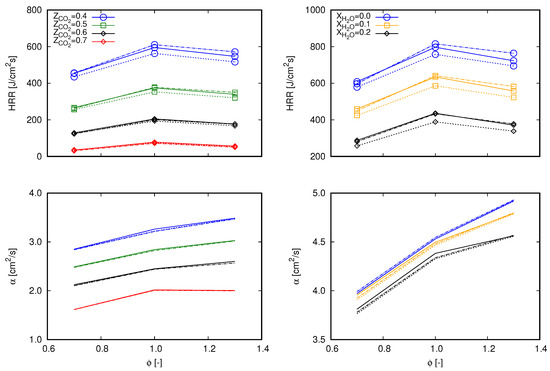
Figure 3.
Values of computational domain () (lines with marks) and (lines without marks) for 0.7, 1.0, and 1.3 computed with different mechanisms. Continuous lines, GRI 3.0; dashed lines, DTU; dash-dot lines, CRECK C1-C3. (left) dilution; and (right) dilution.
Figure 4 presents sensitivity coefficients of and reaction rates of the different mechanisms evaluated at for dilution at and dilution at . These two operating points are chosen since computed flame speed values on them depict clear deviations among mechanisms and, with respect to the dilution fraction, both correspond to intermediate conditions from those presented in Figure 3. By comparing the 15 most sensitive reactions of each mechanism, as shown in the sensitivity analysis presented in Figure 4, it turns out that each mechanism behaves in a specific and different fashion from the others. Nevertheless, some of these most sensitive reactions are common to them, which allow a comparative analysis. As expected from such kind of investigations (see, e.g., [15]), the chain branching reaction H + O2 = OH + O is the most sensitive reaction of all mechanisms. The second most sensitive reaction is the decomposition of HCO in H + CO, which occurs in terms of reactions HCO = H + CO for the DTU mechanism and with a third body M and HO in the CRECK C1-C3 and GRI 3.0 mechanisms, respectively. Specific to the GRI 3.0 mechanism, the decomposition of HCO in H + CO also occurs with the presence of a third body M as the ninth most sensitive reaction. Some of the remaining most sensitive reactions are common to all tested mechanisms, which are summarized in the reaction rate plot (Figure 4, right-bottom). In contrast to the two most sensitive reactions, the remaining ones are not in the same sequence for the different mechanisms.
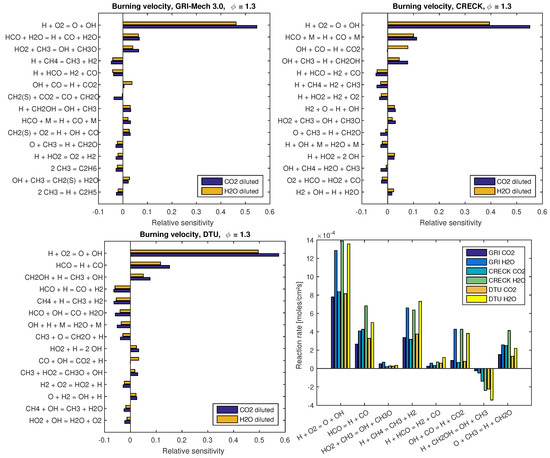
Figure 4.
Sensitivity analysis on the laminar flame speed and reaction rates of the different mechanisms evaluated at . For dilution , while for dilution . Sensitivity analysis are presented at: (left-top) for GRI 3.0; (left-bottom) for DTU; and (right-top) for CRECK C1-C3 mechanisms. At (right-bottom), reaction rates are presented.
Figure 4 (right-bottom) shows the integrated value of the reaction rate of common reactions to the most 15 sensitive ones of each mechanism. Labels on the x-axis follow the descending order presented in the most sensitive reactions of the GRI 3.0 mechanism, which is treated as a reference in the present study. Special attention must be paid to reaction label HCO = H + CO in Figure 4 (right-bottom). Herein, reaction rates of HCO decomposition in H + CO are presented. Namely, at this label position, reaction rates of GRI 3.0 refer to the sum of reaction rates HCO + H2O = H + CO + H2O and HCO + M = H + CO + M, while, for DTU and CRECK C1-C3, reaction rates HCO = H + CO and HCO + M = H + CO + M are presented, respectively.
From the combination of results presented in Figure 4, justifications from deviations noticed in flame speed values can be pointed out. For example, by comparing the decomposition of HCO in H + CO between DTU and CRECK C1-C3 mechanisms, it turns out that, although DTU is more sensitive to this reaction, the reaction rates obtained for this mechanism are smaller than those found for CRECK C1-C3. Such a deviation helps to understand the observed results in Figure 2. In the same sense, reactions CH4 + H = CH3 + H2 and H + HCO = H2 + CO (both contribute to the reduction of the flame speed) are more sensitive in DTU mechanism and present higher reaction rates for it. The former reaction shows similar sensitivity for both GRI 3.0 and CRECK C1-C3 mechanisms. However, the lower reaction rates of CRECK C1-C3 than for GRI 3.0 support the justification of the higher flame speeds observed for this former mechanism. From the other reactions summarized in Figure 4 (right-bottom), H + CH2OH = OH + CH3 stands out. This reaction has a positive effect on the increase of the flame speed being more sensitive for CRECK C1-C3 and DTU than for GRI 3.0 mechanism. Additionally, absolute values of this reaction rate increase for GRI 3.0, CRECK C1-C3, and DTU mechanisms in this sequence. Accordingly, the deviations among mechanisms found for this reaction also contribute to the differences observed in Figure 2.
Regarding the influence of different dilution agents, sensitivity plots demonstrate that almost all reactions have a similar influence on the flame speed. An exception occurs for the reaction OH + CO = H + CO2 in the CRECK C1-C3 mechanism, in which sensitivity coefficients of and diluted flames have the opposite sign. This may illustrate the influence of the different concentrations of in both scenarios, which is a participating species in this specific reaction. In general, the reactions listed in Figure 4 present higher sensitivity for than diluted flames. In contrast to this observation, reaction rates of diluted cases are much higher than those found for diluted flames, as shown in Figure 4 (right-bottom). This aspect is in agreement with the higher flame speeds observed for diluted flames at the chosen operating conditions (i.e., for dilution at and dilution at ), which are approximately two times the values found for diluted cases. For more specific details about reaction kinetics and pathways of GRI 3.0, CRECK C1-C3, and DTU mechanisms in oxy-fuel combustion, the reader is referred to the works of Park et al. [2,3] and Wang et al. [11]; Bagheri et al. [15]; and Glarborg and Bentzen [12], Mendiara and Glarborg [13] and Mendiara et al. [14], respectively.
Although the three mechanisms demonstrate being able to characterize the laminar flame propagation speed of and diluted combustion, both GRI 3.0 and CRECK C1-C3 mechanisms show the best performance. In fact, CRECK C1-C3 fulfills some demands presented in GRI 3.0, which are clearly evident in diluted combustion. Specific to the water dilution cases, both mechanisms have similar performance. In view of this, the influence of reaction mechanisms in flames propagating in water droplet mists are limited to both mechanisms, i.e., GRI 3.0 and CRECK C1-C3. Moreover, due to the lower number of species and reactions of GRI 3.0 (see Table 2), this is chosen in the diffusion transport modeling investigations presented in Section 3.3.
The effects of condensed water droplets on oxy-fuel combustion are analyzed considering flames propagating in mono-dispersed water droplet mists following the description presented in Section 2. To avoid a strong deviation from the simulation conditions presented in Figure 2 (right), the non-diluted fraction of the oxidizer is also maintained at a fixed composition of 50% of and 50% of in volume. Nevertheless, fresh reactants enter the computational domain at 300 K instead of 373 K. This option was chosen to reduce the evaporation process before droplets arrive at the reaction zone, consequently intensifying the interaction of liquid droplets and the reaction process. Another important aspect that differs between single- and two-phase flow simulations is that is a water molar fraction based only on the oxidizer stream in flames propagating in droplet mists, while the water molar fraction is based on the fresh mixture in single-phase cases. Within this context, refers to the total amount of water injected in the computational domain, i.e., the sum of water in liquid and vapor physical states. Accordingly, the dilution fraction can be expressed in terms of Equation (A1) for two-phase flow simulations, where the in the oxidizer stream is exactly equal to .
In view of the previously listed differences between results presented in Figure 2 (right) and Figure 5, single-phase flames computed with similar boundary conditions as for the two-phase flow cases are included for both dilution fractions in Figure 5. Such single-phase results may be interpreted as references to guide the subsequent discussions, but they might not be of practical application. Rigorously, these cannot be seen as a limiting condition where droplet diameter tends to zero. The absence of mixture cooling by the latent heat of liquid droplets evaporation are not accounted for in single-phase computations. Additionally, such single-phase scenarios consider water mass fractions above the saturation mass fraction at fresh oxidizer inlet conditions. Specifically, this value is approximately at 300 K and 1.0 atm.
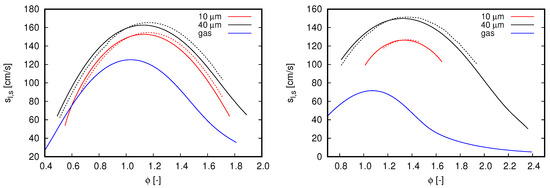
Figure 5.
Flame speed computed with different mechanisms. Blue lines refer to single-phase freely propagating flames, while the remaining curves refer to flames propagating in droplet mists. Continuous lines, GRI 3.0; dash-dot lines, CRECK C1-C3. (left) ; and (right) .
Two droplet initial diameters, 10 and 40 m, and two dilution fractions, and , compose the different scenarios used to investigate the effects of water droplets on oxy-fuel combustion. Notice that both dilution fractions are considerably higher than the saturation of water at fresh oxidizer inlet conditions. Diameter values were chosen in order to mimic the effects of different kind of water dilution strategies. The value of 10 μm may represent condensed water droplets, such that, when this occurs, droplet diameters are quite small. In contrast to this application, the value of 40 μm is chosen to represent the situation when condensed water is atomized within a mixing chamber to achieve the desired dilution fraction, which is typically the Sauter mean diameter (SMD) achieved with ultrasonic and air-assisted nebulizers.
Figure 5 shows the results achieved in the various analyzed scenarios. For all flames simulated within the two-phase flow context, droplets are injected at the same position cm in relation to the reaction zone (i.e., 3.0 cm upstream of the reaction zone).
With respect to the overall behavior of flames propagating in droplet mists, the results presented in Figure 5 clearly indicate the effects of initial droplet diameter and reinforce the flame speed reduction by increasing the dilution fraction. Both outcomes are expected from previous observations for flames propagating in fuel droplet mists [18,19] and single-phase analysis (see Figure 2, right). The reduction of flame speed values by increasing the dilution fraction of water droplets is also in agreement with the experimental observations of Chelliah et al. [38], in which water droplets interacts with air-blown flames. As small droplets evaporate faster than large ones, flame speed values decrease when water droplet size reduces. Another important aspect regarding the droplet initial diameter is the shorter range of for which solutions converge (not necessarily related to practical flammability limits) when droplets become smaller. Such an aspect becomes more evident when dilution fraction increase from to . Discussions about solver convergence are presented in the sequel.
In Figure 5, it is also noticed a displacement of highest flame speed values to rich flames as the dilution fraction is increased. As increases from 0.2 to 0.4, the maximum flame speed is found at and , respectively. Although this behavior is more pronounced for two-phase flow simulations, this can also be noticed in the reference single-phase flames as well as in the flame speeds presented in Figure 2 (right).
Although the single-phase flames used as reference in Figure 5 have higher enthalpy values than the flames propagating in droplet mists, considerably lower propagation velocity values are observed from them. This can be explained by the distributed injection of water caused by liquid droplets. Accordingly, the water dilution in two-phase flow flames is gradual and the respective flames do not necessarily burn in the total dilution fraction indicated by . Such a distributed injection of water vapor through the reaction zone may also justify the shifting of the highest flame speed to rich mixtures seem in Figure 5. Observe that this shifting is not only caused by the higher dilution fractions allowed by liquid droplet injection, as the reference single-phase flames do not exhibit a similar behavior.
By comparing the results obtained for different mechanisms, the overall behavior observed in Figure 2 is also noticed for flames propagating in droplet mists. The CRECK C1-C3 mechanism delivers lower flame speed values than GRI 3.0 for lean flames, while higher values for rich mixtures in cases where . This behavior is similar for cases computed with , but here the inversion from lower to higher values than the reference (GRI 3.0) occurs in the rich mixture region (i.e., ). Deviations from the reference case demonstrate to be insensitive to the initial droplet diameter. Nevertheless, as higher dilution fraction and lower initial droplet diameters are occurring, solver convergence becomes more difficult to be achieved. This explains why the results presented for small droplets are found in a shorter equivalence ratio range than those achieved for large droplets. Particularly, such a convergence issue is more intense for the CRECK C1-C3 mechanism.
Figure 6 depicts the structure of stoichiometric flames for the different dilution fractions and droplet initial diameters. On the left side of Figure 6, gas phase quantities are plotted, namely the mass fraction of water and temperature. On the right side, normalized droplet diameter by its initial diameter () is presented together with the source term of vapor.
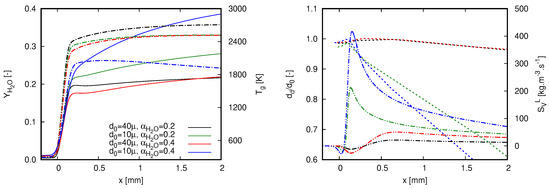
Figure 6.
Characteristics of different quantities along stoichiometric flames for both investigated dilution fractions and droplet initial diameters. Simulations were achieved with GRI 3.0. (left) Water mass fraction (continuous line) and gas temperature (dash-dot line); and (right) normalized droplet diameter (dashed line) and source term of vapor (dash-dot-dot line).
Prior to any deep interpretation of the results presented in Figure 6, it is worth highlighting that the increase of water mass fraction is caused by two different effects within this context: the burning process in which water is a reaction product and the droplet evaporation. The steep profile of is firstly caused by combustion reactions which strongly raise the gas temperature. As the gas temperature rises, the heat transfer to liquid droplets promotes the droplet heat up, which intensifies the droplet evaporation. By considering the decrease of droplet initial diameter and the increase of dilution fraction, the role played by droplet evaporation becomes more evident. This rationale justifies the highest values of achieved with the case in which μm and . The small droplet sizes combined with the high amount of liquid water causes an increase of after the rapid rise of gas temperature. Correspondingly, as droplet evaporation evolves, gas temperature decreases in the post-flame region.
An important aspect that must be considered in both plots presented in Figure 6 refers to the influence of the flame propagation speed. As already discussed in [18], without accounting for this quantity, a wrong interpretation of droplet evaporation process could be made from variable profiles presented along the coordinate x. Despite showing higher temperatures and lower mass fractions of water throughout the computational domain, droplet diameter decreases more slowly in the case where μm and than in the case where μm and . Alone, this statement sounds contradictory. To justify it, the flame speeds presented in Figure 5 must also be considered in the interpretation of the actual process. As the flame speed for the highest dilution case is lower, the elapsed time of a droplet within the domain presented in Figure 6 is higher since droplets enter the computational domain with no slip velocity (for more details about slip velocity in a similar configuration, see [18]). In this sense, droplet exposure time within the post-flame region is higher for the case in which μm and .
The general behavior of the profiles of the vapor source term is also noteworthy. In contrast to the scenario when fuel droplets interact with a flame (e.g., [18]), negative values of vapor source term can be noticed in Figure 6. Specifically, this occurs in the early stages of droplet–flame interactions, namely when cold liquid droplets face hot atmospheres with vapor concentration above its saturation value regarding the droplet surface temperature. The negative values of correspond to the vapor condensation which is also noticed in the slight increase of the diameter value. The condensation process occurs during the droplet heat-up period, which is longer as the diameter increases. It is this process that delays the increase of in the post-flame region. The impact of vapor condensation is evident for cases with μm in Figure 6, as the region where is broader than the other cases.
The contrasting lower flame speed values found for the case in which μm and in Figure 5 can be linked to the profiles presented in Figure 6. The higher heat and mass transfer between phases intensifies the influence of mixture cooling down and water injection in the proximity of the reaction zone. This is a straight outcome from high liquid mass fractions and small droplet sizes. For instance, observe that the maximum gas temperature is about 2000 K for μm and profile, while this quantity is at least 400 K higher for the remaining cases. For them, the lower dilution fractions and higher diameters attenuate the heat and mass transfer in the proximity of the reaction zone. Overall, this observation illustrates the flame behavior when injecting large droplets to reach high dilution fractions. Following this strategy, the impact of water evaporation through the reaction zone is lower than that achieved when smaller droplets are injected. Herein, the dilution process is mainly achieved in the post-flame region and will be successful as long as the entire liquid quantity evaporates into a specified domain.
Due to the absence of detailed experimental data necessary to conduct a validation process, a mechanism validation for such a two-phase flow configuration cannot be conducted. Nevertheless, from the results achieved from single-phase simulations and the fair agreement among the applied mechanisms, it is expected that the tested mechanisms can be applied to characterize oxy-fuel combustion diluted with liquid water droplets.
3.3. Influence of Diffusion Transport Modeling
The effects of diffusion transport in oxy-fuel combustion for different fuels, fuel mixtures, and dilution agents are comprehensively addressed in the literature [3,9,39,40]. In contrast with [3,9,39,40], in which focus is predominantly given on the phenomenological evaluation of the diffusion transport, typical strategies applied to model the chemical reactions in general combustion applications are evaluated here in single- and two-phase flows. To reach this objective, both unitary Lewis and mixture averaged approaches, as described in Section 2.1, are compared with results achieved with complex transport modeling. As a reference, simulations were conducted with the GRI 3.0 mechanism in all results presented in this section. Additionally, the same reference scenarios used in the previous section are employed here to facilitate the communication among results. Computations with the mixture averaged approach including thermal diffusion effects are also conveniently considered to better support the subsequent discussions.
For single-phase flows, laminar flame speed computed with the different diffusion transport modeling strategies are compared with experimental data in Figure 7. As for or diluted cases, the effects of the different strategies are similar. Although thermal diffusion effects are not included in computations conducted with the mixture averaged approach, the results are in good agreement with those obtained with the complex approach. Flame speed values achieved with the mixture averaged are slightly higher than the reference values in the full range of tested equivalence ratios. This good agreement may not be interpreted as an accurate description of all underlying phenomena to the analyzed combustion reactions. This aspect becomes more evident when thermal diffusion effects are included in the mixture averaged approach.
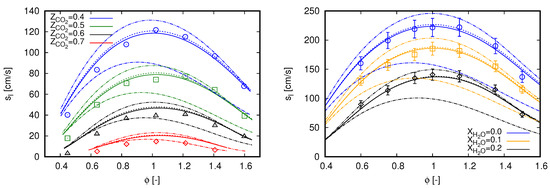
Figure 7.
Laminar flame speed computed with different diffusion transport modeling strategies using freely propagating flame reactors. Marks, experimental data; continuous lines, complex; dashed lines, mixture-averaged without thermal diffusion modeling; dash-dot-dot lines, mixture-averaged with thermal diffusion modeling; dash-dot lines, unitary Lewis number. (left) dilution with experimental data extracted from [3]; and (right) dilution with experimental data extracted from [34].
The results delivered from simulations performed with the mixture averaged approach and including thermal diffusion effects allow a better comparison with our reference simulations. For all scenarios presented in Figure 7, concerning both and diluted combustion, flame speed values are always higher than the reference. By comparing these two approaches, the only difference between them refers to the form in which mass diffusion coefficients are computed. Therefore, such a comparison indicates that the mixture averaged approach does not rigorously describe the underlying transport phenomena to methane oxy-fuel and oxy-steam combustion, even though computations neglecting thermal diffusion deliver accurate values of flame speeds.
With respect to the unitary Lewis number assumption with , computed flame speeds clearly deviate from all other simulation results. Overall, the values are lower than the reference, while this behavior increases as the mixture becomes richer in fuel. For reactions diluted with (see Figure 7, left), the lower values of allows a better approach to the experimental data for the most lean mixture compositions, i.e., of and as well as for of . Specific to the case when flame speeds computed with the unitary Lewis number assumption is the strategy that better approaches to the experimental data. The results obtained for flames diluted with (see Figure 7, right)] do not show such a good agreement with experimental data for some specific mixture compositions. Considering this dilution option, computations with always deliver lower values than all other cases, namely simulations and experiments. The general behavior of flame speed evolution with , in relation of flames diluted with , is preserved. At the most lean mixture compositions results approaches to other computed values, while deviations increases as the mixture becomes richer in fuel.
Considering the different modeling descriptions applied to each analyzed approach (see Section 2.1) and analyses presented in preceding studies [3,9,39,40], deviations among values were expected. By changing the way that diffusion transport is modeled, impacts on the full set of differential equations given by Equations (1)–(4) would be noticed. As a result, different mixture composition and state are obtained in a specific flame region for a given modeling strategy, which consequently interferes with the reaction rate computations. This rationale can be appraised in Figure 8 by means of values of both and for lean (), stoichiometric (), and rich () flames diluted with and at fractions also presented in Figure 7. Herein, the approach based on and calculations, which is applied in Section 3.2 to explore the deviations found in flame speed values achieved among different mechanisms, is considered.
Figure 8.
Values of (lines with marks) and (lines without marks) for 0.7, 1.0, and 1.3 computed with different diffusion transport modeling strategies. Continuous lines, complex; dashed lines, mixture-averaged without thermal diffusion modeling; dash-dot-dot lines: mixture-averaged with thermal diffusion modeling; dash-dot lines, unitary Lewis number. (left) dilution; and (right) dilution.
In contrast to results presented in Figure 3, besides deviations in , deviations in are also noticed for the different test cases in Figure 8. Following the aspects listed in the previous paragraph, these deviations are, however, expected. Modifications in the form that diffusion transport is modeled straightly interfere with computations. From the different cases presented in Figure 3, a general behavior can be noticed. Values of do change by different methods, but not significantly between cases computed with the mixture averaged approach. This indicates that the inclusion of thermal diffusion does not interfere with but with computations. Another common aspect refers to the lower values and the lower slope of curves obtained with the unitary Lewis approach throughout when compared with the other approaches. The influence of dilution agent concentration is quite apparent in the profiles. In cases diluted with , values achieved with the complex approach are always lower than those calculated with the mixture averaged approach. On the opposite side, in cases diluted with (i.e., and ), values achieved with the complex approach are always higher than those calculated with the mixture averaged approach. Regarding the profiles, the trends coincide with those found in plots in Figure 7, as for the analysis of reaction mechanisms.
The overall behavior observed for single-phase combustion is also noticed for flames propagating in droplet mists in Figure 9. Computations performed with the mixture averaged approach including thermal diffusion effects deliver the highest values of flame speed. The results achieved with the detailed transport description are found as intermediary values among the different models. Again, the mixture averaged approach computed without thermal diffusion modeling shows a good agreement with the reference model in all the tested scenarios.
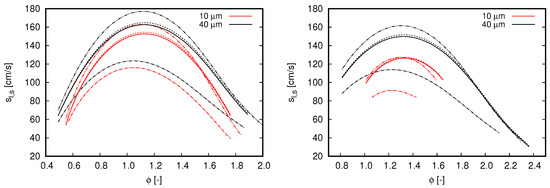
Figure 9.
Flame speed computed with different diffusion transport modeling strategies for flames propagating in droplet mists. Continuous lines, complex; dashed lines, mixture-averaged without thermal diffusion modeling; dash-dot-dot lines, mixture-averaged with thermal diffusion modeling; dash-dot lines, unitary Lewis number. (left) ; and (right) .
In contrast to flames propagating in fuel droplet mists (e.g., [18,19]), the existence of evaporating droplets does not attenuate the deviations between unitary and non-unitary Lewis number approaches. In all scenarios, the overall behavior observed in Figure 9 is quite similar to the results presented in Figure 7 for single-phase flames.
From the results presented in this section for single-phase flames, we can summarize that unitary Lewis assumption may be an option for analyses which intend to address the prediction of flame topology, as well as flame stabilization mechanisms (e.g., triple flames and swirl-stabilized flames [16]), concerning lean mixture compositions that are not far from the lean flammability limit. This is also a valid statement for general mixture compositions when strong dilution occurs. Except for these scenarios, differential diffusion effects should be considered in general oxy-fuel and oxy-steam combustion. The mixture-averaged approach is demonstrated to be a feasible choice to predict flame topology and stabilization mechanisms. Such differential diffusion effects may be included in general flame simulations indirectly in terms of the strategies proposed by Ramaekers et al. [41] and Gierth et al. [6], or it would require other formulations of mixture fraction transport equation to include it in a direct form (e.g., [42]). Nevertheless, in situations where interest goes beyond prediction of flame topology and stabilization mechanisms, complex diffusion transport modeling should be accounted for.
4. Conclusions
The effects of different reaction mechanisms and diffusion transport modeling in oxy-fuel combustion of methane are investigated including different dilution agent characteristics. Variations in diluent agent composition accounting for and are analyzed. Specific to water dilution cases, injection of the diluent in both gaseous and liquid phases are also studied. Special attention has been given to diffusion transport modeling in view of typical strategies applied to general CFD solvers. The employed setup has been successfully validated against experimental data and simulation results available in the literature. The results indicate that a commonly applied simplification to general flame modeling interferes with flame propagation speed values, which may be reflected on the prediction of flame topology and stabilization mechanisms. Furthermore, questions raised in previous works (e.g., in [3,11]), as the effects of different mechanisms for predicting laminar flame speeds of methane oxy-fuel combustion, could be addressed. The framework in which the effects of different reactions mechanisms are investigated (i.e., identical CFD code and similar numerical setup and boundary conditions) allowed extracting important observations for modelers interested in oxy-fuel combustion simulations. A summary of the main outcomes of the present study is listed in the sequel.
Analysis conducted with the three investigated mechanisms demonstrates that all of them are able to recover the laminar flame speed of oxy-fuel combustion diluted with and . The CRECK C1-C3 mechanism presented the best agreement with available experimental data in both situations and for different dilution fractions within the single-phase flow setup. The results obtained with the GRI 3.0, which is the smallest of the three analyzed mechanisms, show that it also performed quite well in different scenarios. Its robustness and relative low computational demands allowed the description of the broadest range of scenarios within the proposed analyses. On the other hand, the denoted DTU mechanism showed the highest sensitivity in the different tested conditions. In summary, the GRI 3.0 mechanism demonstrated to be a feasible choice for the general description of oxy-fuel combustion process. Computations conducted with GRI 3.0 required much less time and memory than those performed with the other mechanisms. However, when more details about oxy-fuel combustion are required, the CRECK C1-C3 mechanism is suggested. Particularly, the advantages of CRECK C1-C3 mechanism over GRI 3.0 should be more pronounced for rich mixtures and high dilution fractions.
Oxy-fuel combustion demonstrated to be sensitive to the different diffusion transport modeling approaches. Such an outcome was evident in all analyzed scenarios. In general, as more simplifications are included in a specific model, its agreement with available experimental data decreases. An exception occurs for the mixture averaged approach without including thermal diffusion effects, which is a typical strategy applied in general CFD solvers. Herein, a good agreement was observed with the complex model for single- and two-phase flow flames. Therefore, the mixture average approach without thermal diffusion effects can be seen as a feasible choice to improve the characterization of flame topology and stabilization mechanisms by including differential diffusion effects when computational costs are prohibitive to perform simulations with the complex model. Regarding the unitary Lewis number approach, high deviations from experimental data and the complex model are noticed. In contrast to previous studies associated with flames propagating in fuel droplet mists, no specific scenario (e.g., lean or rich mixtures) appears to significantly attenuate such deviations. In fact, such deviations are less pronounced for mixtures approaching the lower flammability limit in single- and two-phase flow framework. Such outcomes indicate that the differential diffusion transport may be an issue in general oxy-fuel combustion modeling. Nevertheless, to attest its relevance in general context, detailed and systematic investigations in turbulent combustion are further required.
Concerning the dilution process by means of liquid water droplets, significant impact on general combustion process could be noticed. The distributed heat and mass transfer throughout the flame caused by droplet evaporation and condensation is found to be the main reason of deviations from single- to two-phase flow combustion. Flames propagating in water droplet mists produced higher flame speed values than those computed in single-phase context, in which an overall dilution fraction is preserved. Besides the observed increase in flame propagation speed, a well pronounced shifting of the highest flame speed to rich mixtures (also noticed, but less pronounced, for gaseous flames) could be seen. Such outcomes point out that injection of liquid water to perform the flow stream dilution in oxy-fuel combustion may be a feasible alternative when high dilution fractions are required. As in air-blown cases, such a dilution strategy may allow the design of more compact devices for a defined mass flow rate of flue gas. Certainly, the option for such a dilution strategy shall present some drawbacks, for instance high production of thermal due to local regions with high temperatures in the case of infiltration. A systematic investigation of eventual drawbacks and limitations of the usage of condensed water as a dilution agent in oxy-fuel combustion is beyond the scope of the present work. This is therefore left as subject for future works. Finally, from analyses conducted to investigate the effects of of different reaction mechanisms and diffusion transport modeling, it could be noticed that characteristics observed in single-phase flow computations are similar to those in the two-phase flow context.
Author Contributions
Conceptualization and formal analysis, F.L.S.F., L.E.d.A.P.eF.d.C., and J.A.v.O.; methodology, F.L.S.F., J.A.v.O., and G.C.K.F.; software and writing-original draft preparation F.L.S.F., L.E.d.A.P.eF.d.C., and J.A.v.O.; writing-review and editing F.L.S.F., L.E.d.A.P.eF.d.C., J.A.v.O., and G.C.K.F.; and resources and funding acquisition, F.L.S.F. and G.C.K.F. All authors have read and agreed to the published version of the manuscript.
Funding
This research was funded by São Paulo Research Foundation (FAPESP), grant number 2014/50279-4.
Acknowledgments
We gratefully acknowledge support of the RCGI (Research Centre for Gas Innovation), hosted by the University of São Paulo (USP) and sponsored by FAPESP (São Paulo Research Foundation) (2014/50279-4) and Shell Brasil, and the strategic importance of the support given by ANP (Brazil’s National Oil, Natural Gas and Biofuels Agency) through the R&D levy regulation.
Conflicts of Interest
The authors declare no conflict of interest.
Abbreviations
The following abbreviations are used in this manuscript:
| CCS | carbon capture and storage |
| CFD | computational fluid dynamics |
| FPV | flamelet progress variable |
| LES | large eddy simulation |
| ODE | ordinary differential equation |
| RANS | Reynolds averaged Navier–Stokes |
| RHS | right hand side |
| SD | species diluted approach |
| SMD | Sauter mean diameter |
Appendix A. Counterflow Flames
Counterflow flames were simulated during the development of this work as part of the validation procedure. Within this configuration, radiation heat transfer is more pronounced than in freely propagating flames. Therefore, this setup is more suited to evaluate such a heat transfer mode coupled with methane oxy-fuel combustion.
To conduct counterflow flame simulations, the full set of equations (Equations (1)–(4)) is considered. Nevertheless, phase coupling terms are not accounted for, since single-phase flows are considered.
Simulation results extracted from [2] are used in Figure A1 as reference for validation of the implemented radiation model and the overall numerical setup. All cases are performed with a global strain rate of s and with fresh reactants injected at 300 K into the computational domain. This temperature value is also used as the ambient temperature in radiation heat transfer computations. Different oxidizer compositions define the various scenarios presented in Figure A1 considering that

Figure A1.
Maximum flame temperature by dilution fraction at different oxidizer compositions. Results are obtained from counterflow methane flames simulated with the mechanism GRI 3.0. Continuous lines, radiation included; dashed lines, radiation neglected; marks, simulation results extracted from Park et al. [2].

In Figure A1, the effects of radiation heat transfer are clearly noticed. As heat is transferred from the hot gases to the ambient, maximum flame temperature is clearly reduced. This temperature reduction is intensified as the dilution fraction increases. This is expected, since is a contributing species for radiation heat transfer (see Section 2.1). Another important aspect refers to the higher dilution fractions achieved when heat losses are not accounted for. In general, dashed lines in Figure A1 reaches higher values of than those related to the radiation heat transfer calculations.
With respect to the comparison with the reference data, a good agreement can be observed between our computations conducted with radiation heat transfer and the reference ones. Small deviations are noticed in cases computed with and slightly less pronounced for the highest dilution ratios with .
References
- Ditaranto, M.; Bakken, J. Study of a full scale oxy-fuel cement rotary kiln. Int. J. Greenh. Gas Control 2019, 83, 166–175. [Google Scholar] [CrossRef]
- Park, J.; Park, J.S.; Kim, H.P.; Kim, J.S.; Kim, S.C.; Choi, J.G.; Cho, H.C.; Cho, K.W.; Park, H.S. NO emission behavior in oxy-fuel combustion recirculated with carbon dioxide. Energy Fuels 2007, 21, 121–129. [Google Scholar] [CrossRef]
- Xie, Y.; Wang, J.; Zhang, M.; Gong, J.; Jin, W.; Huang, Z. Experimental and numerical study on laminar flame characteristics of methane oxy-fuel mixtures highly diluted with CO2. Energy Fuels 2013, 27, 6231–6237. [Google Scholar] [CrossRef]
- Sevault, A.; Dunn, M.; Barlow, R.S.; Ditaranto, M. On the structure of the near field of oxy-fuel jet flames using Raman/Rayleigh laser diagnostics. Combust. Flame 2012, 159, 3342–3352. [Google Scholar] [CrossRef]
- Hunger, F.; Zulkifli, M.F.; Williams, B.A.; Beyrau, F.; Hasse, C. A Combined Experimental and Numerical Study of Laminar and Turbulent Non-piloted Oxy-fuel Jet Flames Using a Direct Comparison of the Rayleigh Signal. Flow Turbul. Combust. 2016, 97, 231–262. [Google Scholar] [CrossRef]
- Gierth, S.; Hunger, F.; Popp, S.; Wu, H.; Ihme, M.; Hasse, C. Assessment of differential diffusion effects in flamelet modeling of oxy-fuel flames. Combust. Flame 2018, 197, 134–144. [Google Scholar] [CrossRef]
- Seepana, S.; Jayanti, S. Steam-moderated oxy-fuel combustion. Energy Convers. Manag. 2010, 51, 1981–1988. [Google Scholar] [CrossRef]
- Zheng, C.; Liu, Z. Oxy-Fuel Combustion: Fundamentals, Theory and Practice; Elsevier Academic Press: Cambridge, UK, 2017; p. 367. [Google Scholar] [CrossRef]
- Dai, C.; Wang, B.; Shu, Z.; Mi, J. Thermal Characteristics of a CH4 Jet Flame in Hot Oxidant Stream: Dilution Effects of CO2 and H2O. Energy Fuels 2018, 32, 7943–7958. [Google Scholar] [CrossRef]
- Smith, G.P.; Golden, D.M.; Frenklach, M.; Moriarty, N.W.; Eiteneer, B.; Goldenberg, M.; Bowman, C.T.; Hanson, R.K.; Song, S.; Gardiner, W.C.; et al. Available online: http://combustion.berkeley.edu/gri-mech/version30/text30.html (accessed on 15 December 2020).
- Wang, L.; Liu, Z.; Chen, S.; Zheng, C.; Li, J. Physical and chemical effects of CO2 and H2O additives on counterflow diffusion flame burning methane. Energy Fuels 2013, 27, 7602–7611. [Google Scholar] [CrossRef]
- Glarborg, P.; Bentzen, L.L. Chemical effects of a high CO2 concentration in oxy-fuel combustion of methane. Energy Fuels 2008, 22, 291–296. [Google Scholar] [CrossRef]
- Mendiara, T.; Glarborg, P. Reburn chemistry in oxy-fuel combustion of methane. Energy Fuels 2009, 23, 3565–3572. [Google Scholar] [CrossRef]
- Mendiara, T.; Glarborg, P. Ammonia chemistry in oxy-fuel combustion of methane. Combust. Flame 2009, 156, 1937–1949. [Google Scholar] [CrossRef]
- Bagheri, G.; Ranzi, E.; Pelucchi, M.; Parente, A.; Frassoldati, A.; Faravelli, T. Comprehensive kinetic study of combustion technologies for low environmental impact: MILD and OXY-fuel combustion of methane. Combust. Flame 2020, 212, 142–155. [Google Scholar] [CrossRef]
- Poinsot, T.; Veynante, D. Theoretical and Numerical Combustion, 1st ed.; R. T. Edwards: Philadelphia, PA, USA, 2001; p. 473. [Google Scholar]
- Somers, B. The Simulation of Flat Flames with Detailed and Reduced Chemical Models. Ph.D. Thesis, Technische Universiteit Eindhoven, Eindhoven, The Netherlands, 1994. [Google Scholar]
- Sacomano Filho, F.L.; Speelman, N.; van Oijen, J.A.; de Goey, L.P.H.; Sadiki, A.; Janicka, J. Numerical analyses of laminar flames propagating in droplet mists using detailed and tabulated chemistry. Combust. Theory Model. 2018, 22, 998–1032. [Google Scholar] [CrossRef]
- Neophytou, A.; Mastorakos, E. Simulations of laminar flame propagation in droplet mists. Combust. Flame 2009, 156, 1627–1640. [Google Scholar] [CrossRef]
- Sacomano Filho, F.L.; Krieger Filho, G.C.; van Oijen, J.A.; Sadiki, A.; Janicka, J. A novel strategy to accurately represent the carrier gas properties of droplets evaporating in a combustion environment. Int. J. Heat Mass Transf. 2019, 137, 1141–1153. [Google Scholar] [CrossRef]
- van Oijen, J.A.; de Goey, L.P. Modelling of premixed counterflow flames using the flamelet-generated manifold method. Combust. Theory Model. 2002, 6, 463–478. [Google Scholar] [CrossRef]
- van Oijen, J.A.; Donini, A.; Bastiaans, R.J.; ten Thije Boonkkamp, J.H.; de Goey, L.P. State-of-the-art in premixed combustion modeling using flamelet generated manifolds. Prog. Energy Combust. Sci. 2016, 57, 30–74. [Google Scholar] [CrossRef]
- Ern, A.; Giovangigli, V. Fast and Accurate Multicomponent Transport Property Evaluation. J. Comput. Phys. 1995, 120, 105–116. [Google Scholar] [CrossRef]
- Dressler, L.; Sacomano Filho, F.L.; Sadiki, A.; Janicka, J. Influence of Thickening Factor Treatment on Predictions of Spray Flame Properties Using the ATF Model and Tabulated Chemistry. Flow Turbul. Combust. 2020. [Google Scholar] [CrossRef]
- Sacomano Filho, F.L.; Hosseinzadeh, A.; Sadiki, A.; Janicka, J. On the interaction between turbulence and ethanol spray combustion using a dynamic wrinkling model coupled with tabulated chemistry. Combust. Flame 2020, 215, 203–220. [Google Scholar] [CrossRef]
- Ju, Y.; Guo, H.; Maruta, K.; Liu, F. On the extinction limit and flammability limit of non-adiabatic stretched methane-air premixed flames. J. Fluid Mech. 1997, 342, 315–334. [Google Scholar] [CrossRef]
- Glarborg, P.; Miller, J.A.; Ruscic, B.; Klippenstein, S.J. Modeling nitrogen chemistry in combustion. Prog. Energy Combust. Sci. 2018, 67, 31–68. [Google Scholar] [CrossRef]
- Sirignano, W.A. Fluid Dynamics and Transport of Droplets and Sprays, 2nd ed.; Cambridge University Press: New York, NY, USA, 2010; p. 462. [Google Scholar]
- Yuen, M.C.; Chen, L.W. On Drag of Evaporating Liquid Droplets. Combust. Sci. Technol. 1976, 14, 147–154. [Google Scholar] [CrossRef]
- Miller, R.S.; Harstad, K.; Bellan, J. Evaluation of equilibrium and non-equilibrium evaporation models for many-droplet gas-liquid flow simulations. Int. J. Multiph. Flow 1998, 24, 1025–1055. [Google Scholar] [CrossRef]
- Abramzon, B.; Sirignano, W.A. Droplet vaporization model for spray combustion calculations. Int. J. Heat Mass Transf. 1989, 32, 1605–1618. [Google Scholar] [CrossRef]
- Noh, D.; Gallot-Lavallée, S.; Jones, W.P.; Navarro-Martinez, S. Comparison of droplet evaporation models for a turbulent, non-swirling jet flame with a polydisperse droplet distribution. Combust. Flame 2018, 194, 135–151. [Google Scholar] [CrossRef]
- Hu, Y.; Kurose, R. Partially premixed flamelet in LES of acetone spray flames. Proc. Combust. Inst. 2019, 37, 3327–3334. [Google Scholar] [CrossRef]
- Mazas, A.N.; Lacoste, D.A.; Schuller, T. Experimental and numerical investigation on the laminar flame speed of CH4/O2 mixtures diluted with CO2 and H2O. In Proceedings of the ASME Turbo Expo 2010: Power for Land, Sea and Air, Glasgow, UK, 14–18 June 2010; Volume 2, pp. 411–421. [Google Scholar] [CrossRef]
- Kee, R.J.; Rupley, F.M.; Miller, J.A. Chemkin-II: A Fortran Chemical Kinetics Package for the Analysis of Gas Phase Chemical Kinetics; Sandia National Laboratories: Albuquerque, NM, USA, 1989; Sandia Report SAND89-8009B. [Google Scholar]
- Cuoci, A.; Frassoldati, A.; Faravelli, T.; Ranzi, E. OpenSMOKE++: An object-oriented framework for the numerical modeling of reactive systems with detailed kinetic mechanisms. Comput. Phys. Commun. 2015, 192, 237–264. [Google Scholar] [CrossRef]
- Kuo, K.K. Principles of Combustion, 2nd ed.; John Wiley & Sons Inc.: Hoboken, NJ, USA, 2005; p. 732. [Google Scholar]
- Chelliah, H.K.; Lazzarini, A.K.; Wanigarathne, P.C.; Linteris, G.T. Inhibition of premixed and non-premixed flames with fine droplets of water and solutions. Proc. Combust. Inst. 2002, 29, 369–376. [Google Scholar] [CrossRef]
- Park, J.; Kwon, O.B.; Yun, J.H.; Keel, S.I.; Chang Cho, H.; Kim, S. Preferential diffusion effects on flame characteristics in H2/CO syngas diffusion flames diluted with CO2. Int. J. Hydrog. Energy 2008, 33, 7286–7294. [Google Scholar] [CrossRef]
- Kim, J.S.; Park, J.; Kwon, O.B.; Yun, J.H.; Keel, S.I.; Kim, T.K. Preferential diffusion effects on NO formation in methane/hydrogen-air diffusion flames. Energy Fuels 2008, 22, 278–283. [Google Scholar] [CrossRef]
- Ramaekers, W.J.; Van Oijen, J.A.; De Goey, L.P. A priori testing of flamelet generated manifolds for turbulent partially premixed methane/air flames. Flow Turbul. Combust. 2010, 84, 439–458. [Google Scholar] [CrossRef]
- Liñán, A.; Vera, M.; Sánchez, A.L. Ignition, liftoff, and extinction of gaseous diffusion flames. Annu. Rev. Fluid Mech. 2015, 47, 293–314. [Google Scholar] [CrossRef]


Publisher’s Note: MDPI stays neutral with regard to jurisdictional claims in published maps and institutional affiliations. |
© 2021 by the authors. Licensee MDPI, Basel, Switzerland. This article is an open access article distributed under the terms and conditions of the Creative Commons Attribution (CC BY) license (http://creativecommons.org/licenses/by/4.0/).