Abstract
The paper is devoted to the experimental and CFD investigation of a plasma formation impact on the supersonic flow over a body “blunt cone-cylinder”. In the experiments, a series of schlieren pictures of bow shock wave–blast waves non-stationary interaction was obtained with the use of high speed shadowgraphy. The accompanying calculations are based on the system of Euler equations. The freestream Mach number is 3.1. The plasmoid is modeled by the instantaneous release of energy into a bounded volume of gas, increasing the pressure in the volume. The research of the dynamics of a shock wave structure caused by the bow shock wave and blast flow interaction has been conducted. The significant value of energy released to a supersonic flow (500J) allowed constructing a diagram of the generation and dynamics of the resulting shock waves and contact discontinuities, as well as obtaining a significant drop in the drag force and stagnation pressure (up to 80%). The dynamics of a low density and high gas temperature zone, which becomes the main factor reducing the frontal body drag force, was researched. The dynamics of the front surface drag forces have been studied for different values of the plasmoid energy as well. Qualitative agreement of the numerical flow patterns with the experiment ones has been obtained.
1. Introduction
Control of supersonic flows by means of plasma formations generated by electrical discharges, microwave energy release, and laser pulses is currently an extensive field of aerospace engineering studies (see [1] and surveys in [2,3,4,5,6]). A review of various applications of theoretical and experimental studies for supersonic and hypersonic flow modes in order to control drag reduction, establish the effective geometry of the vehicle, and mitigate sonic boom from it was presented in [7].
Reorganization of unsteady flow under the action of an external energy release has been researched since the second half of the last century and the beginning of this century [8,9,10,11,12]. In air, the effect of the external energy source produced by microwave discharge was shown to result in decreasing stagnation pressure together with the reduction in the drag force of a blunt cylinder [13]. A vortex mechanism of these phenomena was established in the calculations. Microwave energy releases, which effects the supersonic flow over a cylinder, were studied experimentally in [14,15] and numerically in [16].
Numerous experiments and simulations have been devoted to investigating laser impact on supersonic/hypersonic flow since the end of the twentieth century [17,18]. Among others there are the results of laser pulse impacts presented in [19,20] and the results of numerical simulations for laser action presented in [20,21,22,23]. The interaction of laser plasma with a bow shock wave, starting from the moment the laser spark formed until the moment when a gasdynamic perturbations developed has been considered [24]. The calculations were performed using the Navier–Stokes equations for supersonic and hypersonic air flows for a spherical blunt body and a body in the form of a double cone. The simulation results confirmed that localized energy release can be effectively used to control the bow shock configurations.
The discharge plasma effect on supersonic flow was investigated experimentally in [25] taking into account plasma, electric, and magnetic effects. In experiments, the possibility of using plasma formations (plasmoids) to change the supersonic flow near the model has been investigated in [26]. Complicated shock structures are formed in the processes of the energy sources-shock layers interaction including formation of triple-shock configurations [27,28]. The essential impact on the dynamics of the frontal drag force and the bow shock wave behaviour due to the presence of a heated area produced by energy release was obtained in all of these studies.
This paper is devoted to the experimental and numerical research of the plasmoid effect on the shock structure and frontal drag force that occurs during the supersonic streamlining a body “blunt cone-cylinder”. The novelty of the work is connected with the significant value of energy released to a supersonic flow (500 J) which allowed to track the generation and dynamics of the resulting shock waves and contact discontinuities, as well as to obtain a significant drop in the drag force and stagnation pressure (up to 80%). Comparison of the experimental schlieren images and computation flow patterns is analyzed together with the frontal surface drag force dynamics and the dynamics of shock wave (SW) fronts and contact discontinuities (CD) in the developing shock-wave structures.
2. Experimental Study
2.1. Experimental Setup
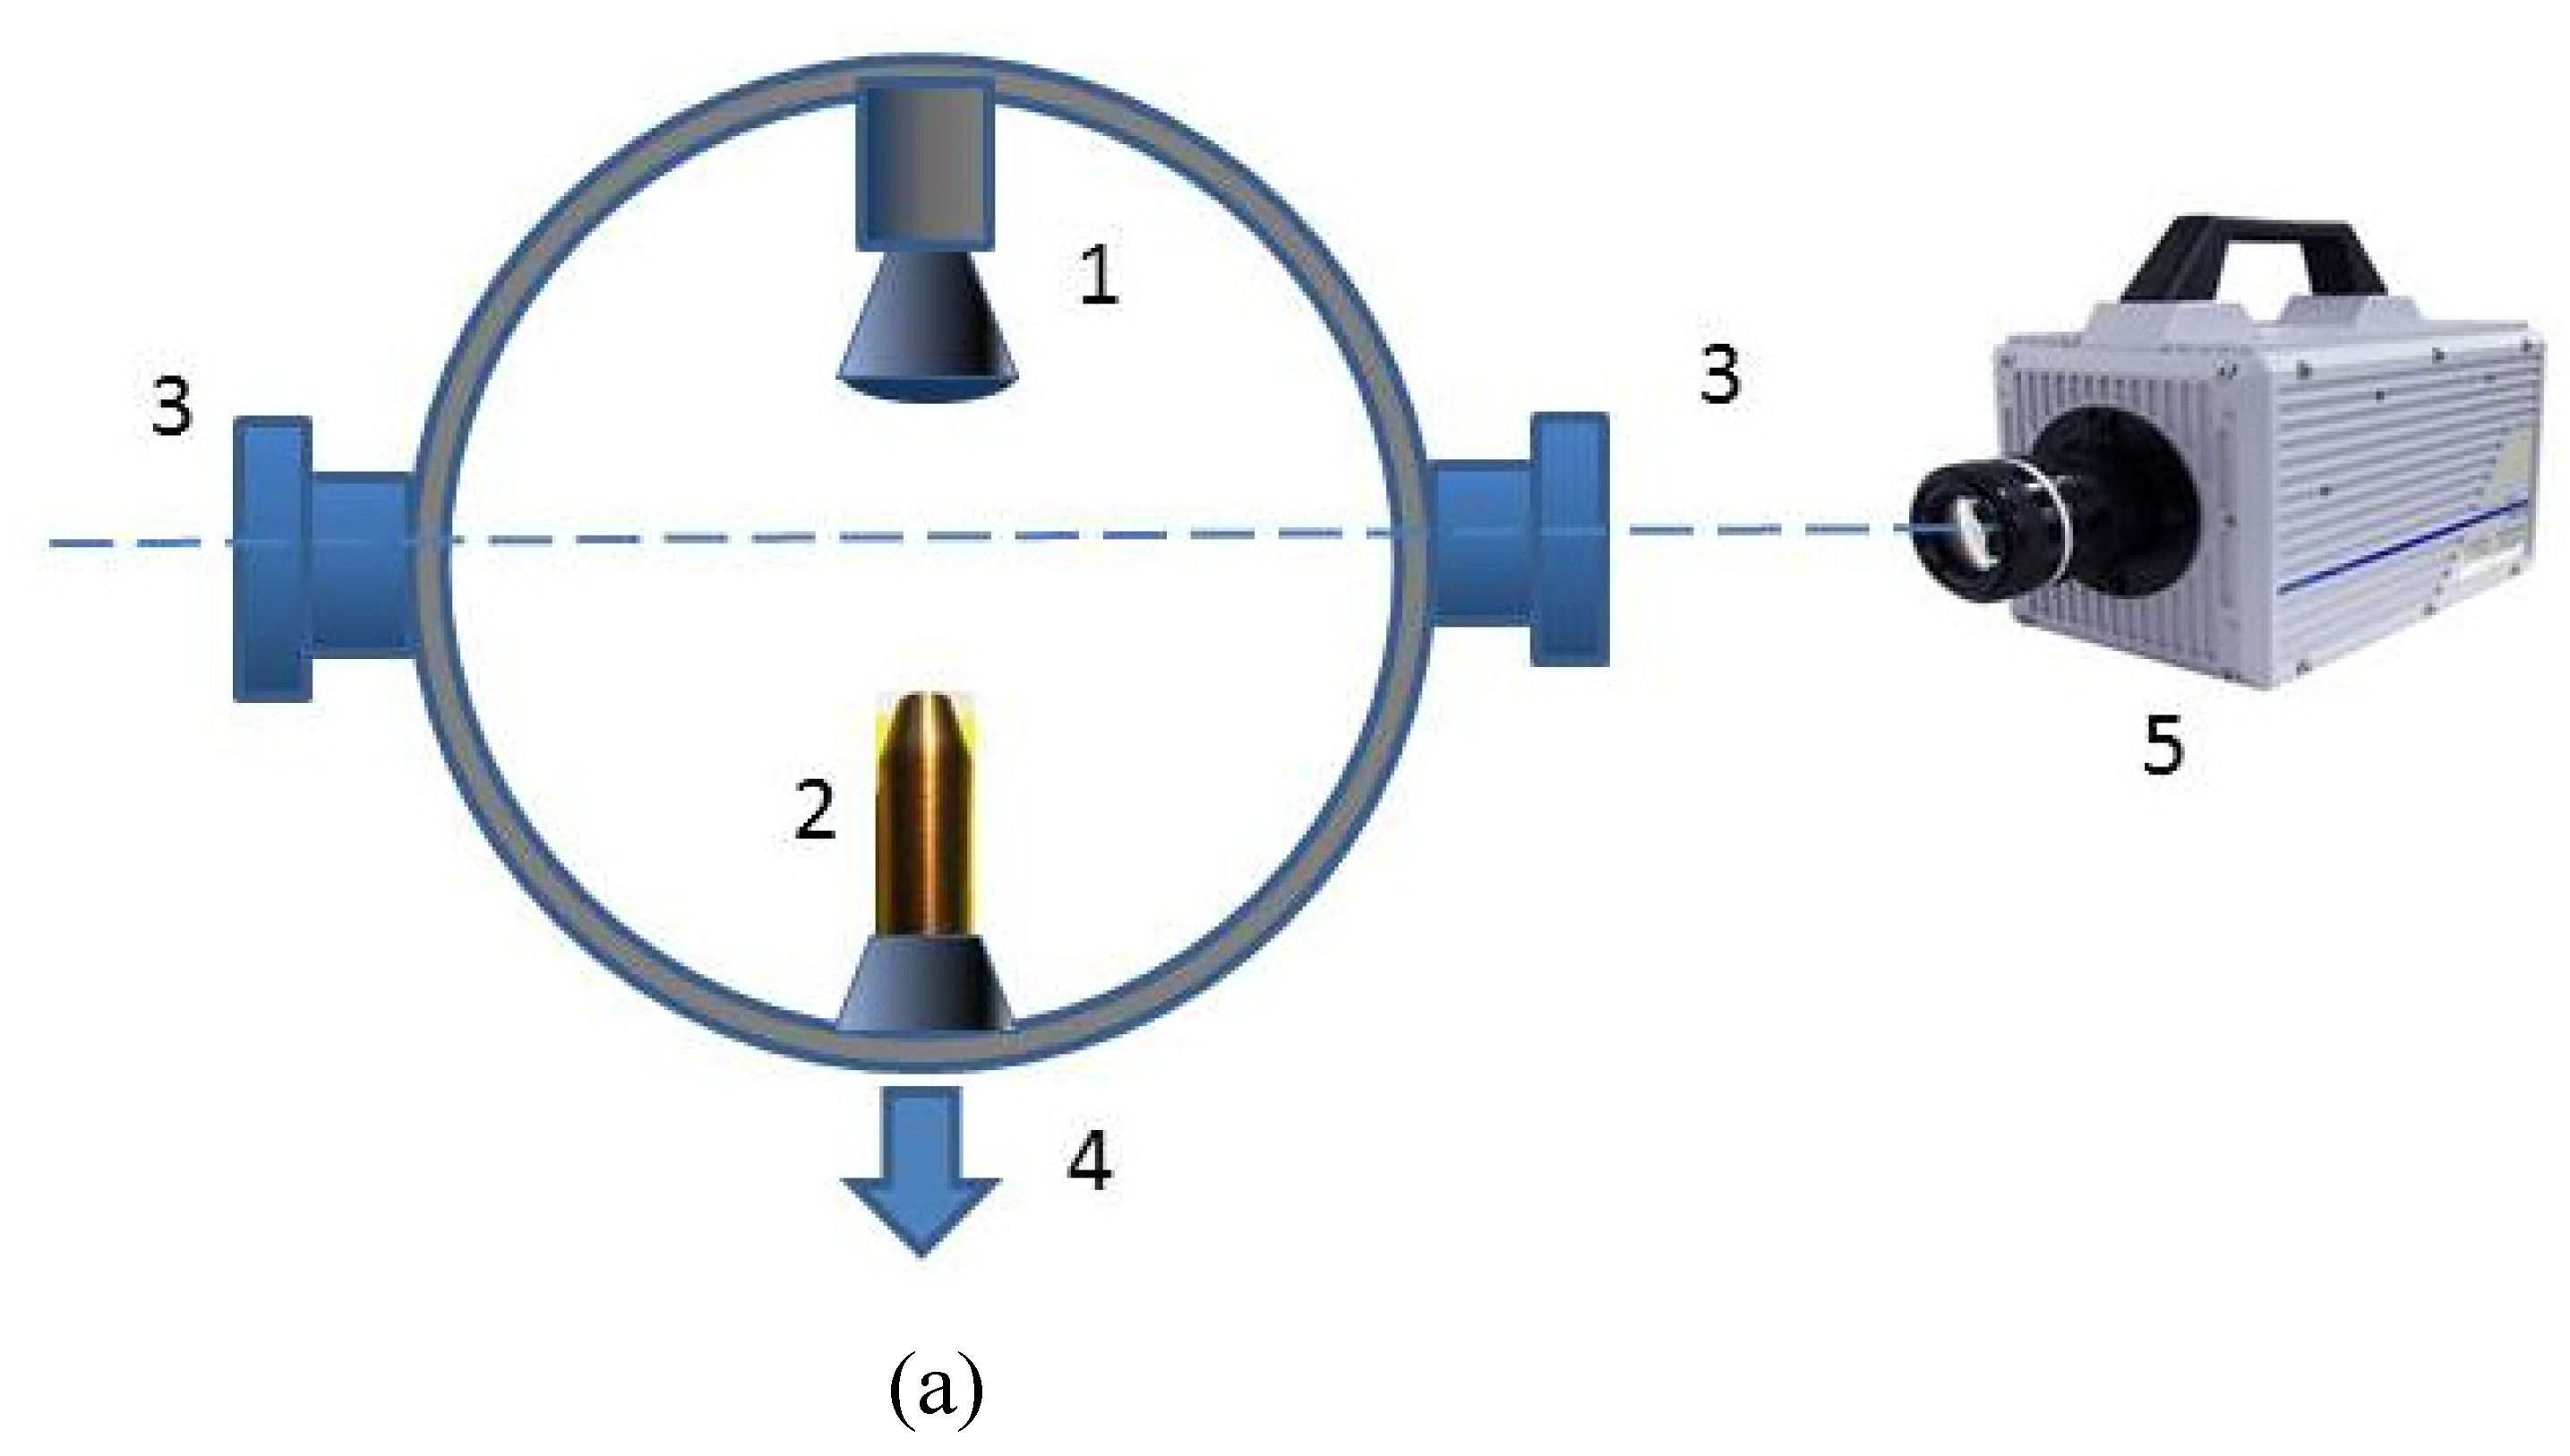
A scheme of the experimental installation is shown in Figure 1a (here, the flow direction is taken from top to bottom). Setup contains the Laval nozzle (1) (which had been designed for Mach number M = 2–3.5) and a plasma generator (2). It is based on a magnetoplasma compressor of special construction. These devices are mounted inside a low-pressure chamber. High pressure at the nozzle inlet was varied from 0.2 to 0.5 from that of the magnetoplasma compressor. The pressure at the nozzle inlet was supplied by a valve via connecting the pile. Power was supplied (4) via a connector.
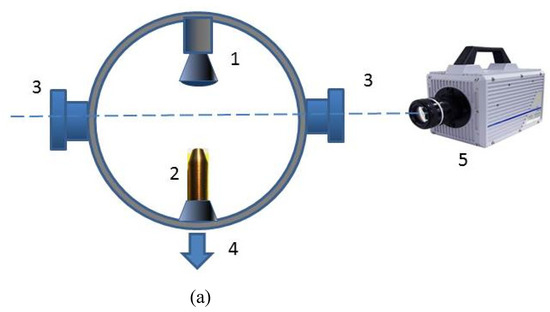
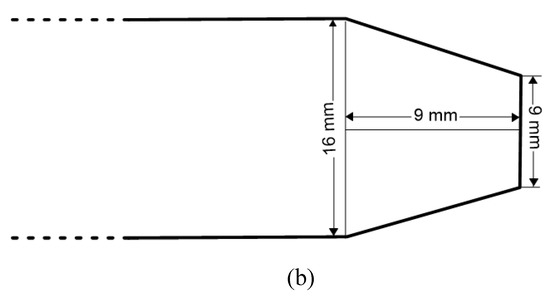
Figure 1.
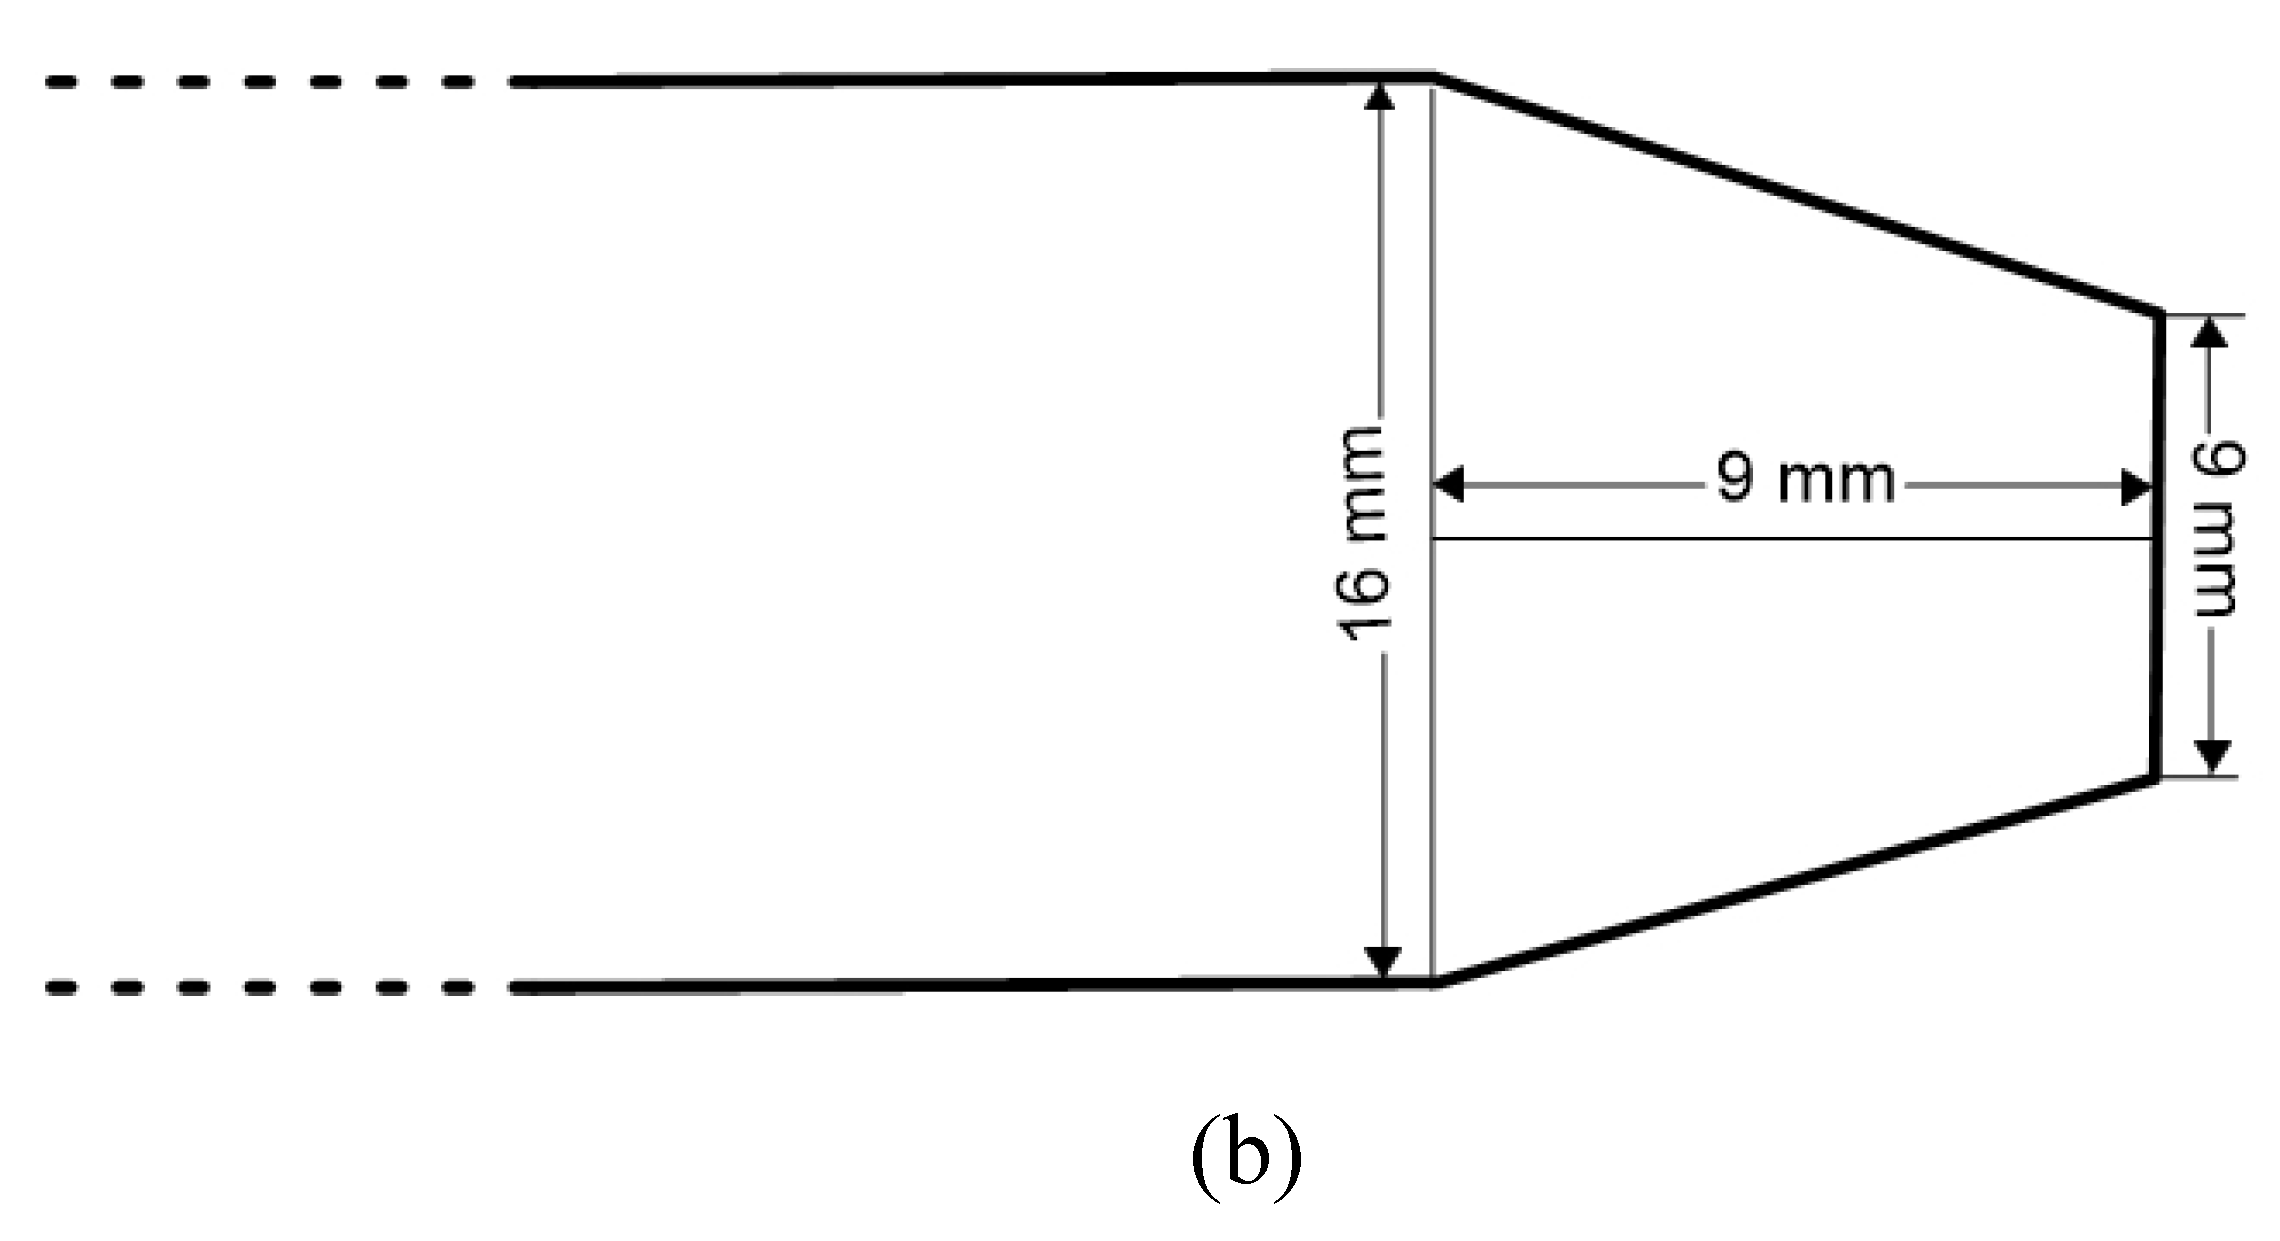
Experimental installation (schematic) (a): 1—Laval nozzle; 2—electrical discharger; 3—windows for visualization; 4—to power supply; 5—high speed camera; (b) model dimensions.
When a high-voltage pulse was fed to the spark gap, the supply voltage was fed to the magnetoplalma compressor, and it then was discharged with the generation of a plasma jet. Electric current time duration was ~100 μs, maximal current was ~12 kA, and voltage drop across the discharge was 700V; the average electron density is 1015–1016 cm–3. The freestream Mach number tested was 3.1. The diameter of the cylinder part of the body is D = 1.6·10−2 m; the diameter of a frontal surface of the body is Df = 9·10−3 m (Figure 1b).
The classical Tepler shadow scheme was used for flow visualization, including a parallel light beam passing through the windows (3). A digital recording system with the high temporal and spatial resolution was employed. The high-speed digital camera (5) has the exposure time of a frame about 1 μs. Recording regimes with 150,000 frames/s and 325,000 frames/s were used; the interval between the frames was about 7 and 4 μs, respectively. Films with a duration up to 3 s including all the stages of the plasma initiation, relaxation, and gasdynamic processes up to stationary streamlining have been recorded.
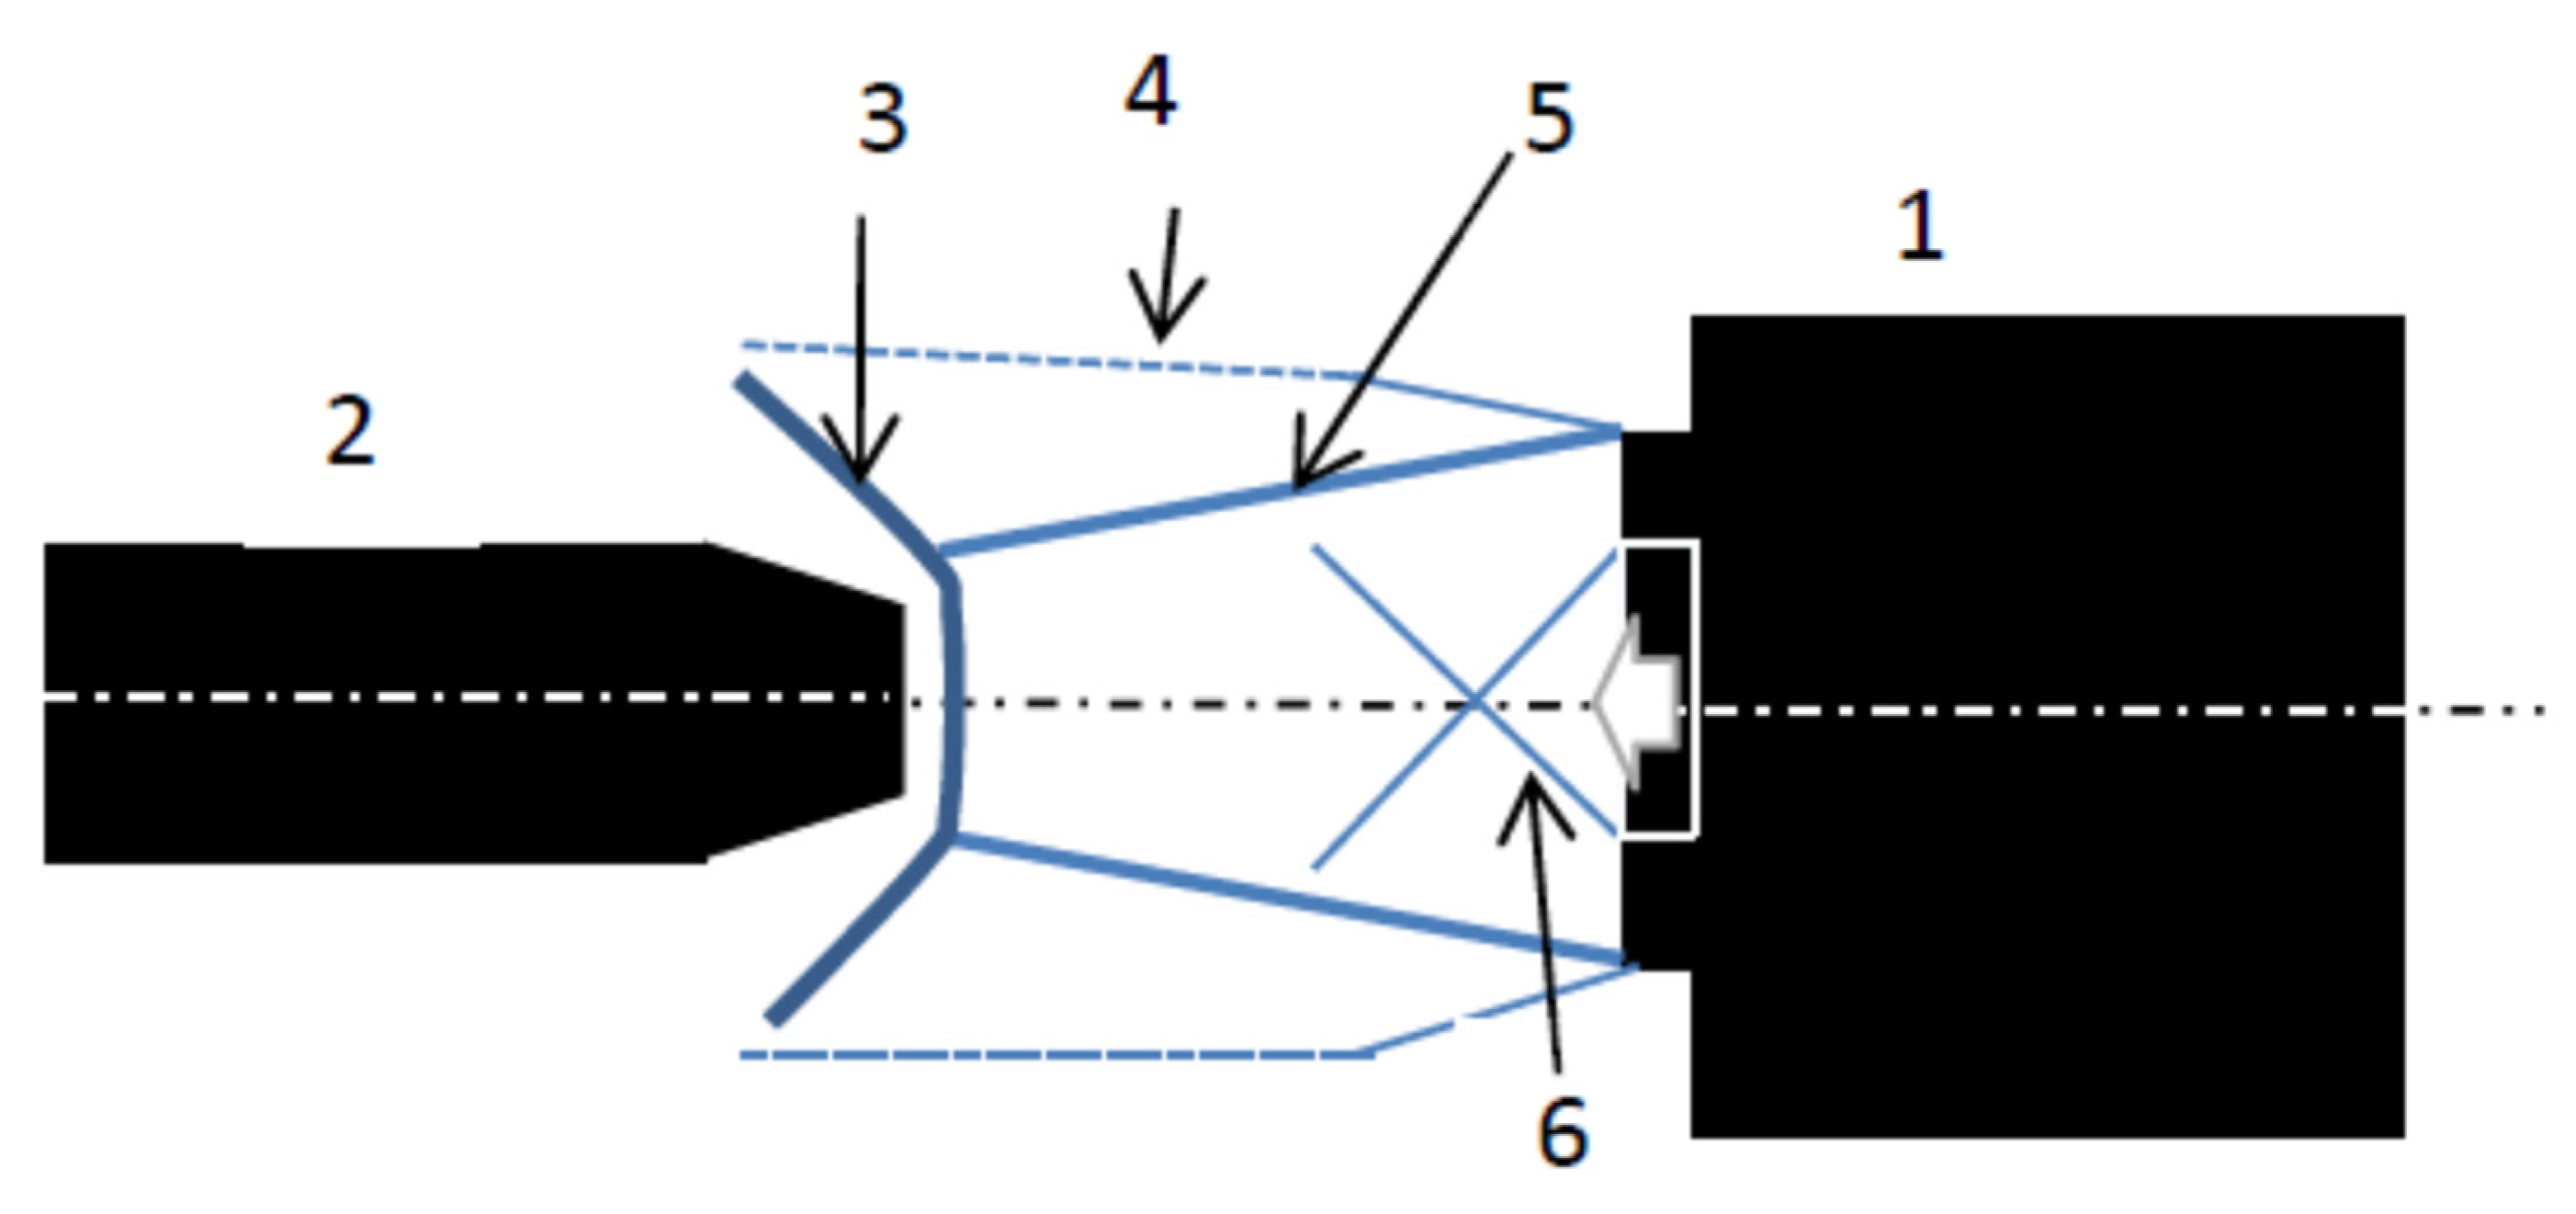
A scheme of the supersonic flow past the model is presented in Figure 2.
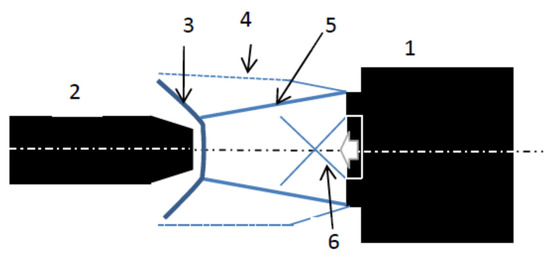
Figure 2.
Scheme of the supersonic flow field: 1—supersonic nozzle; 2—plasma formation generator in the flow; 3—bow shock wave; 4—outer boundary of the mixing layer; 5—inner boundary of the mixing layer; 6—suspended shocks.
2.2. Experimental Results
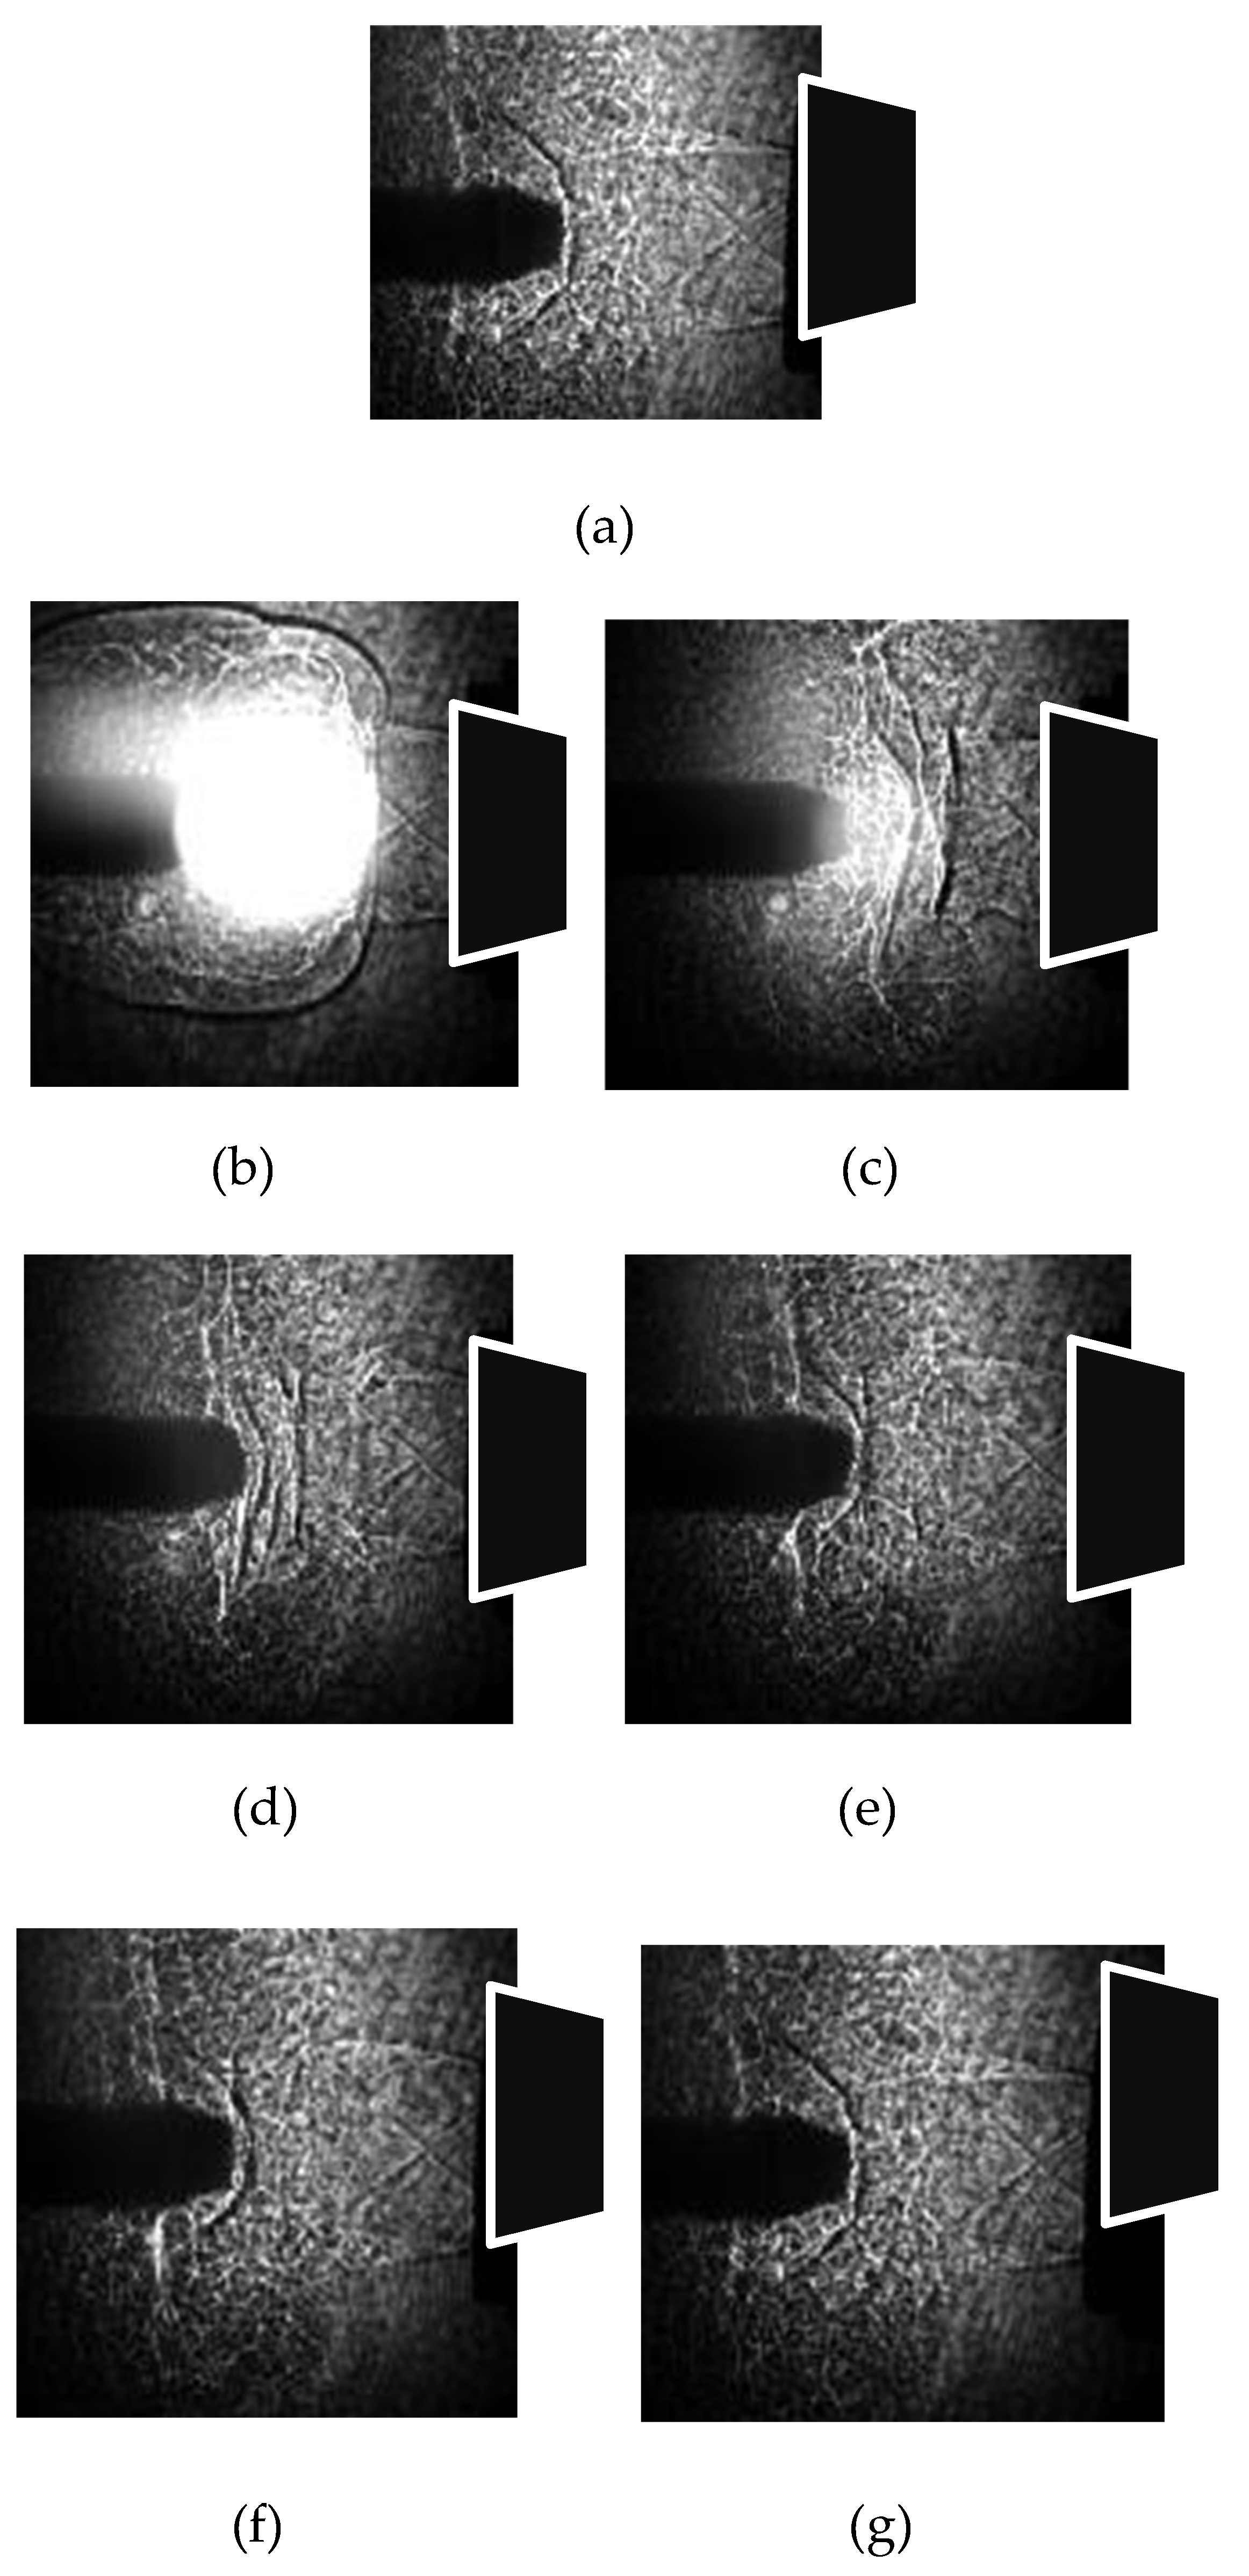
High-speed shadow imaging showed that due to the short time of plasma energy release, a blast wave arises from the discharge area. Its dynamics controls the non-steady stage of the bow shock wave structure evolution. In front of the streamlined body, the shock layer was shown to be reconstructed, with the value of the bow shock wave standoff on the axis of symmetry increasing significantly: approximately as long as the value of the plasmoid diameter (4 cm). Schlieren images of the plasmoid impact on the supersonic flow are presented in Figure 3. Steady streamlining is established at 150–200 µs after nozzle launching; some fractures of the bow shock wave are a result of the method of supersonic flow organization by means of the nozzle.
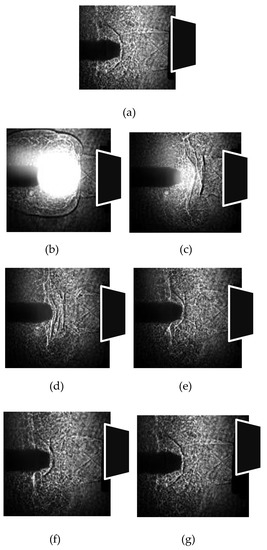
Figure 3.
Schlieren images: (a) t = 0; (b) t = 66 µs; (c) t = 107 µs; (d) t = 140 µs; (e) t = 166 µs; (f) t = 173 µs; (g) t = 193 µs.
After the establishment of steady flow mode, the plasma energy release begins (Figure 3b), thus causing a strong reconstruction of the entire flow. In the experiment, the moment of time of the discharge inclusion is accepted as the initial time. Several shock waves are visualized (Figure 2d and Figure 3c), which interact with each other (Figure 3e,f), and finally they form a new bow shock when the flow becomes steady again sometime after the end of the impact of the energy deposition area (Figure 3g).
3. Numerical Simulations
3.1. Methodology, Statement of the Problem, and Grid Convergence
Supersonic flow over a body “blunt cone-cylinder” under the impact of an energy release was studied at M = 3.1. The simulation is based on the Euler system of equations for perfect inviscid gas in curvilinear orthogonal coordinates with the ratio of specific heats γ = 1.4.
Here, the r-coordinate is directed on the radius of a body. The state equation for a perfect gas is used:
where ρ, p, u, and v are the gas density, pressure, and velocity of the x-components and y-components, and ε is the specific internal energy.
The problem is solved in dimensionless variables. Dimensionless quantities for time, spatial variables, components of sound velocity and velocity, gas density, pressure, and temperature are expressed with the dimensional ones (marked with the index “dim”) as follows.
Here, the following scales for the parameters are accepted:
where kl is the dimensionless value of D.
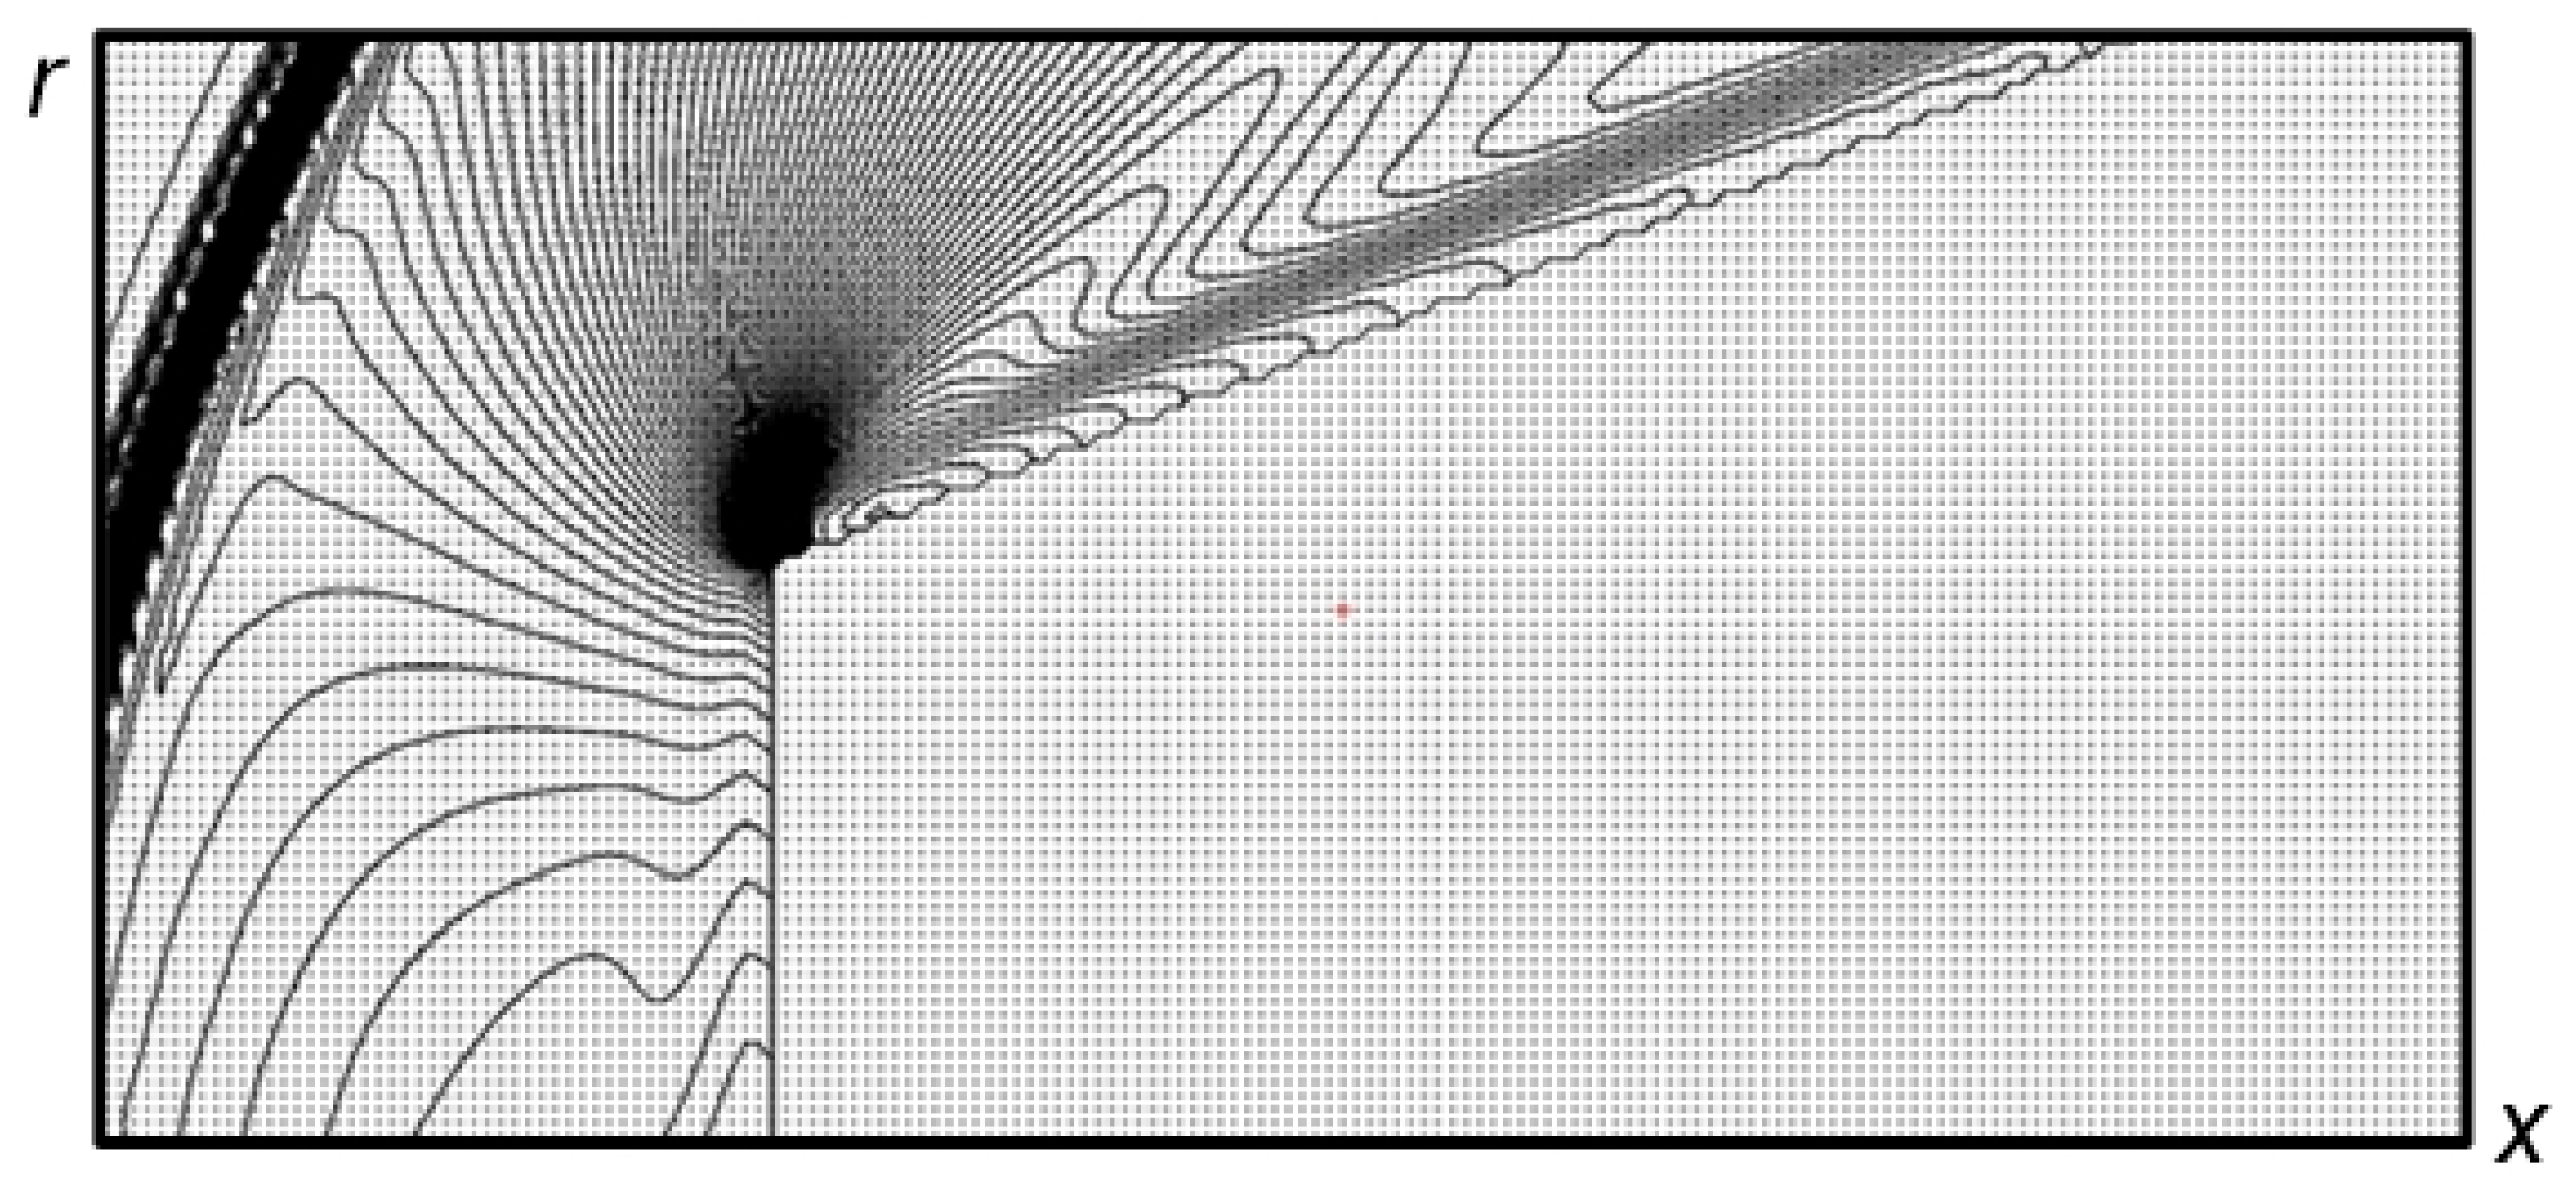
A domestic code based on the complex conservative difference schemes of the second approximation order in space and in time is used in the simulations [29]. The body’s boundaries are introduced into the calculation area without breaking the space-time conservation properties in it. For this purpose, the boundaries of the body are approximated by stepped lines, and discrete conservation laws are written for each resulting configuration. This allows calculations to be carried out conservatively in the entire computational domain, including the boundaries of the body [29]. The position of the angular part of the body on the grid in an enlarged form is shown in Figure 4. In the calculations, the staggered numerical grids are used with the distance between the nodes at each time level equal to 2hx and 2hy (hx and hy are the space steps in x-directions and y-directions).
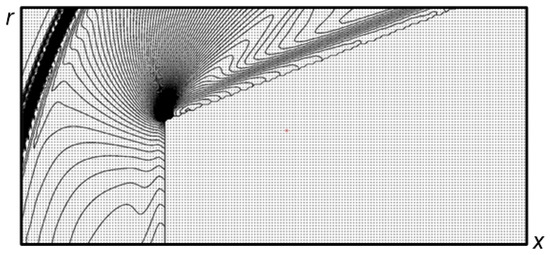
Figure 4.
The position of the angular part of the body on a computational grid (enlarged).
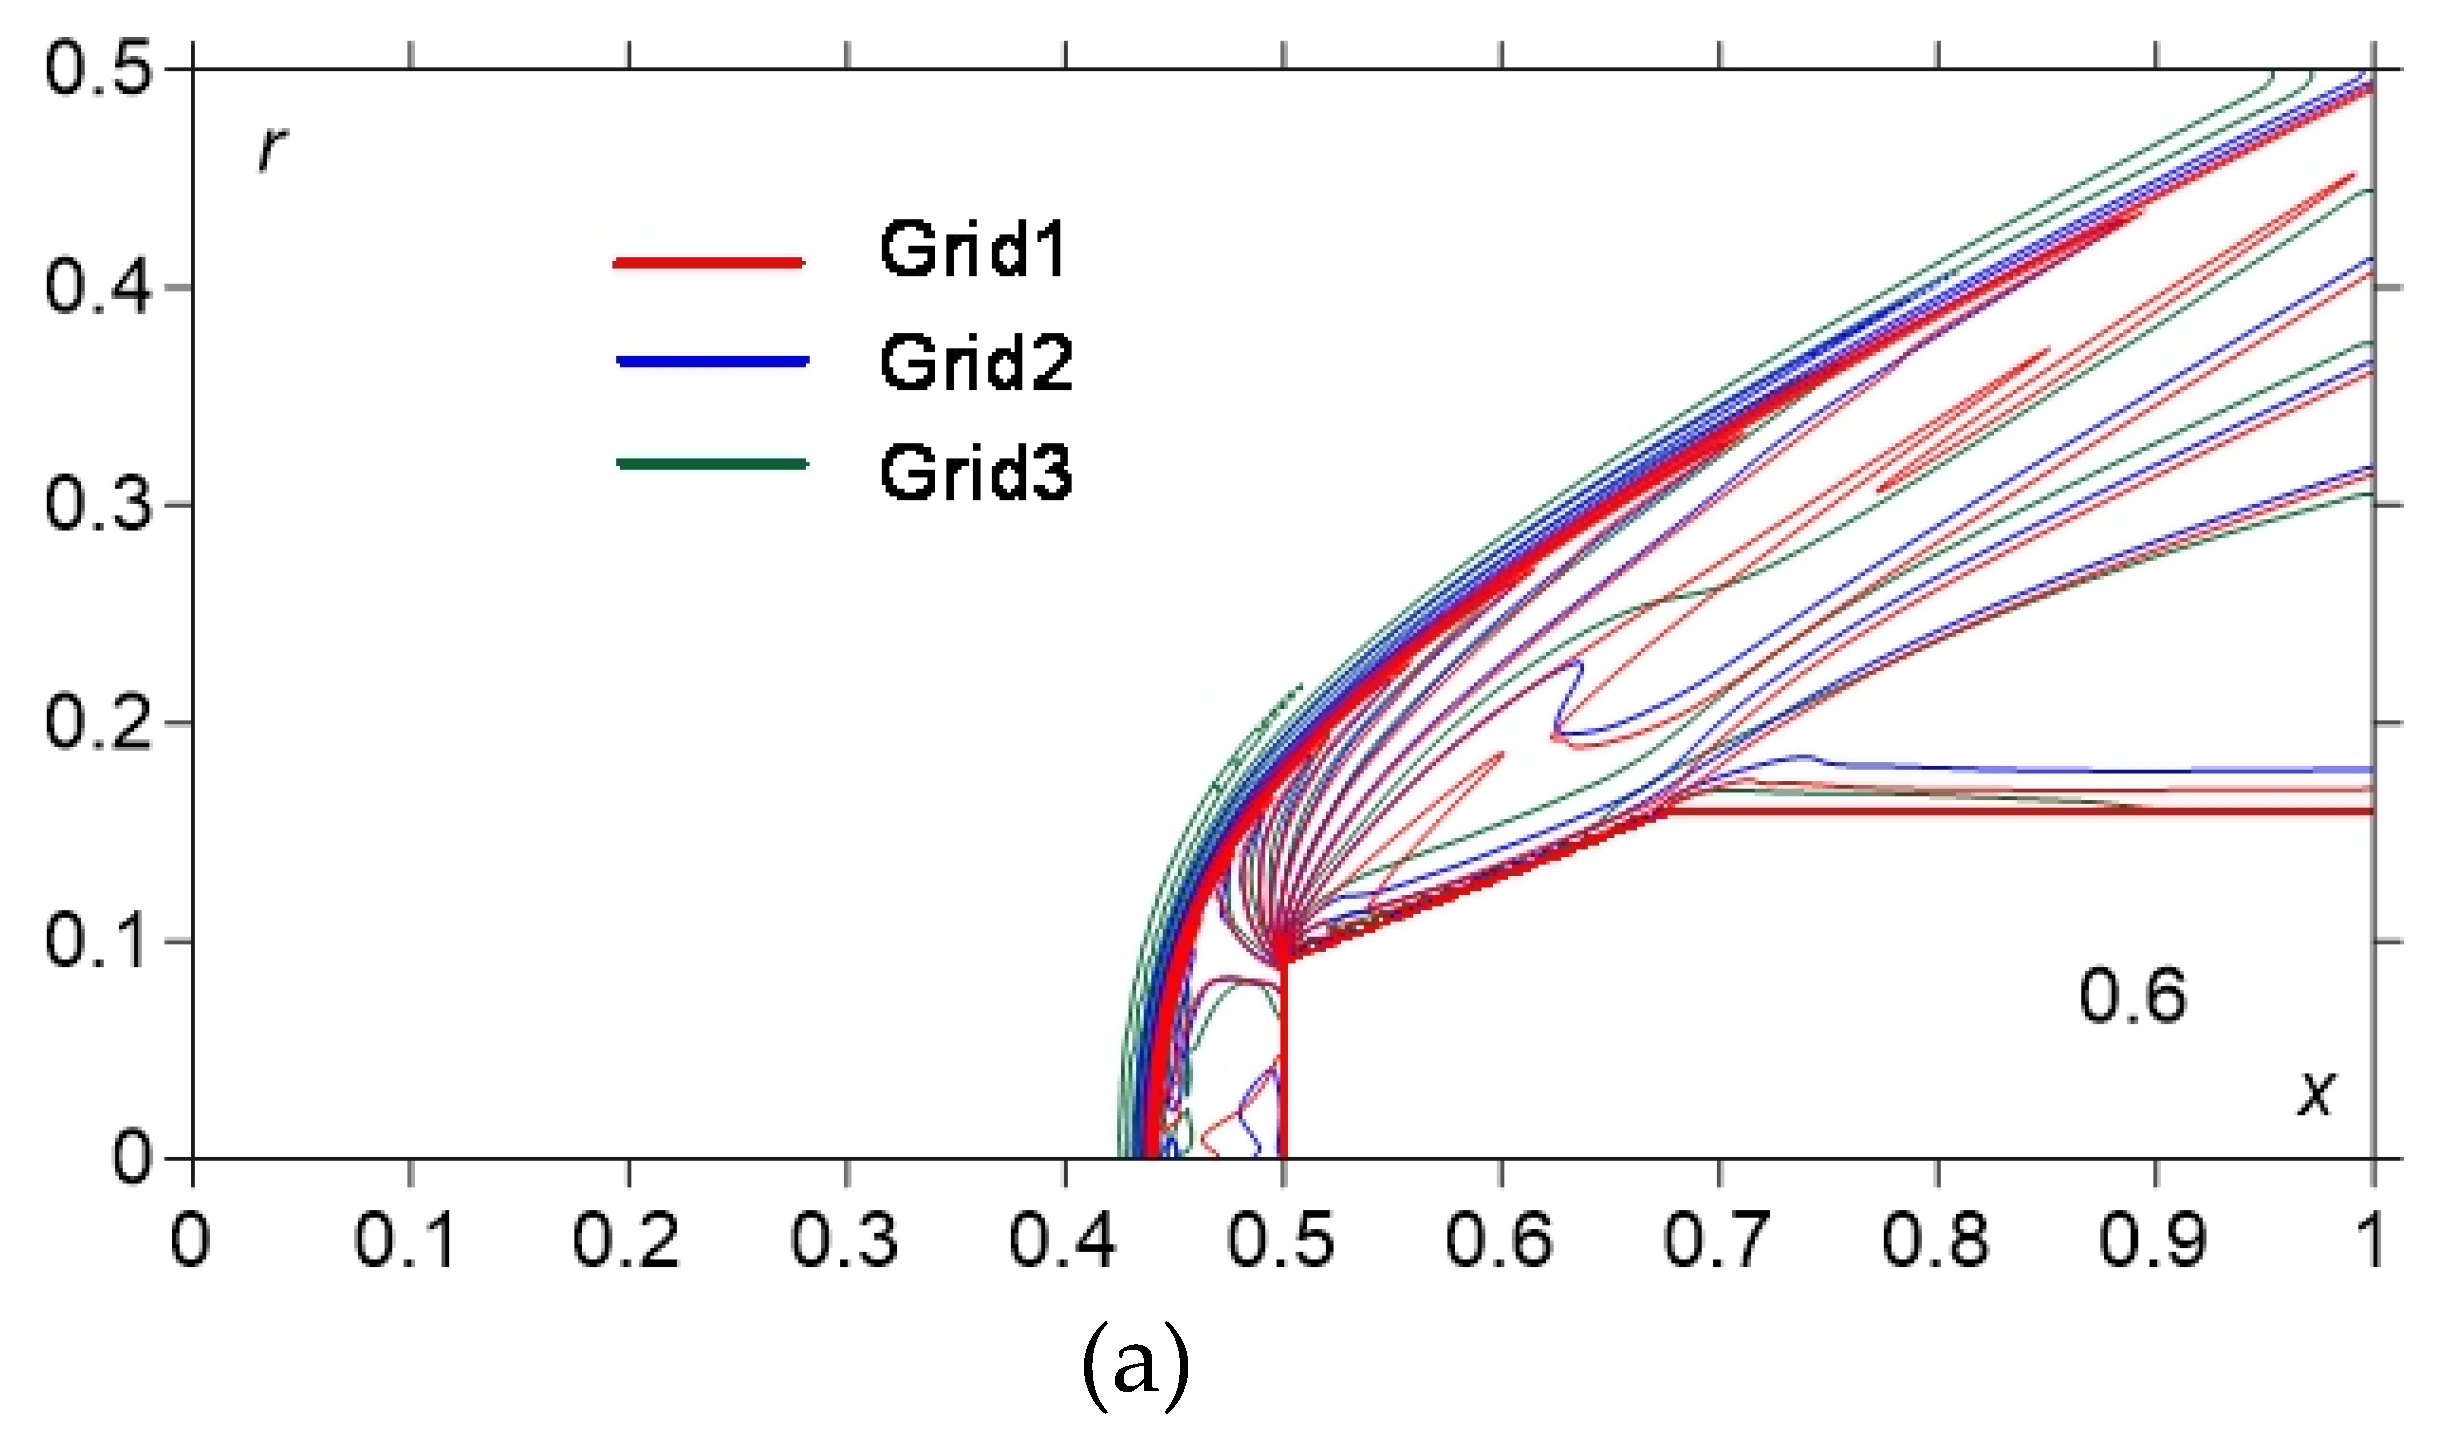
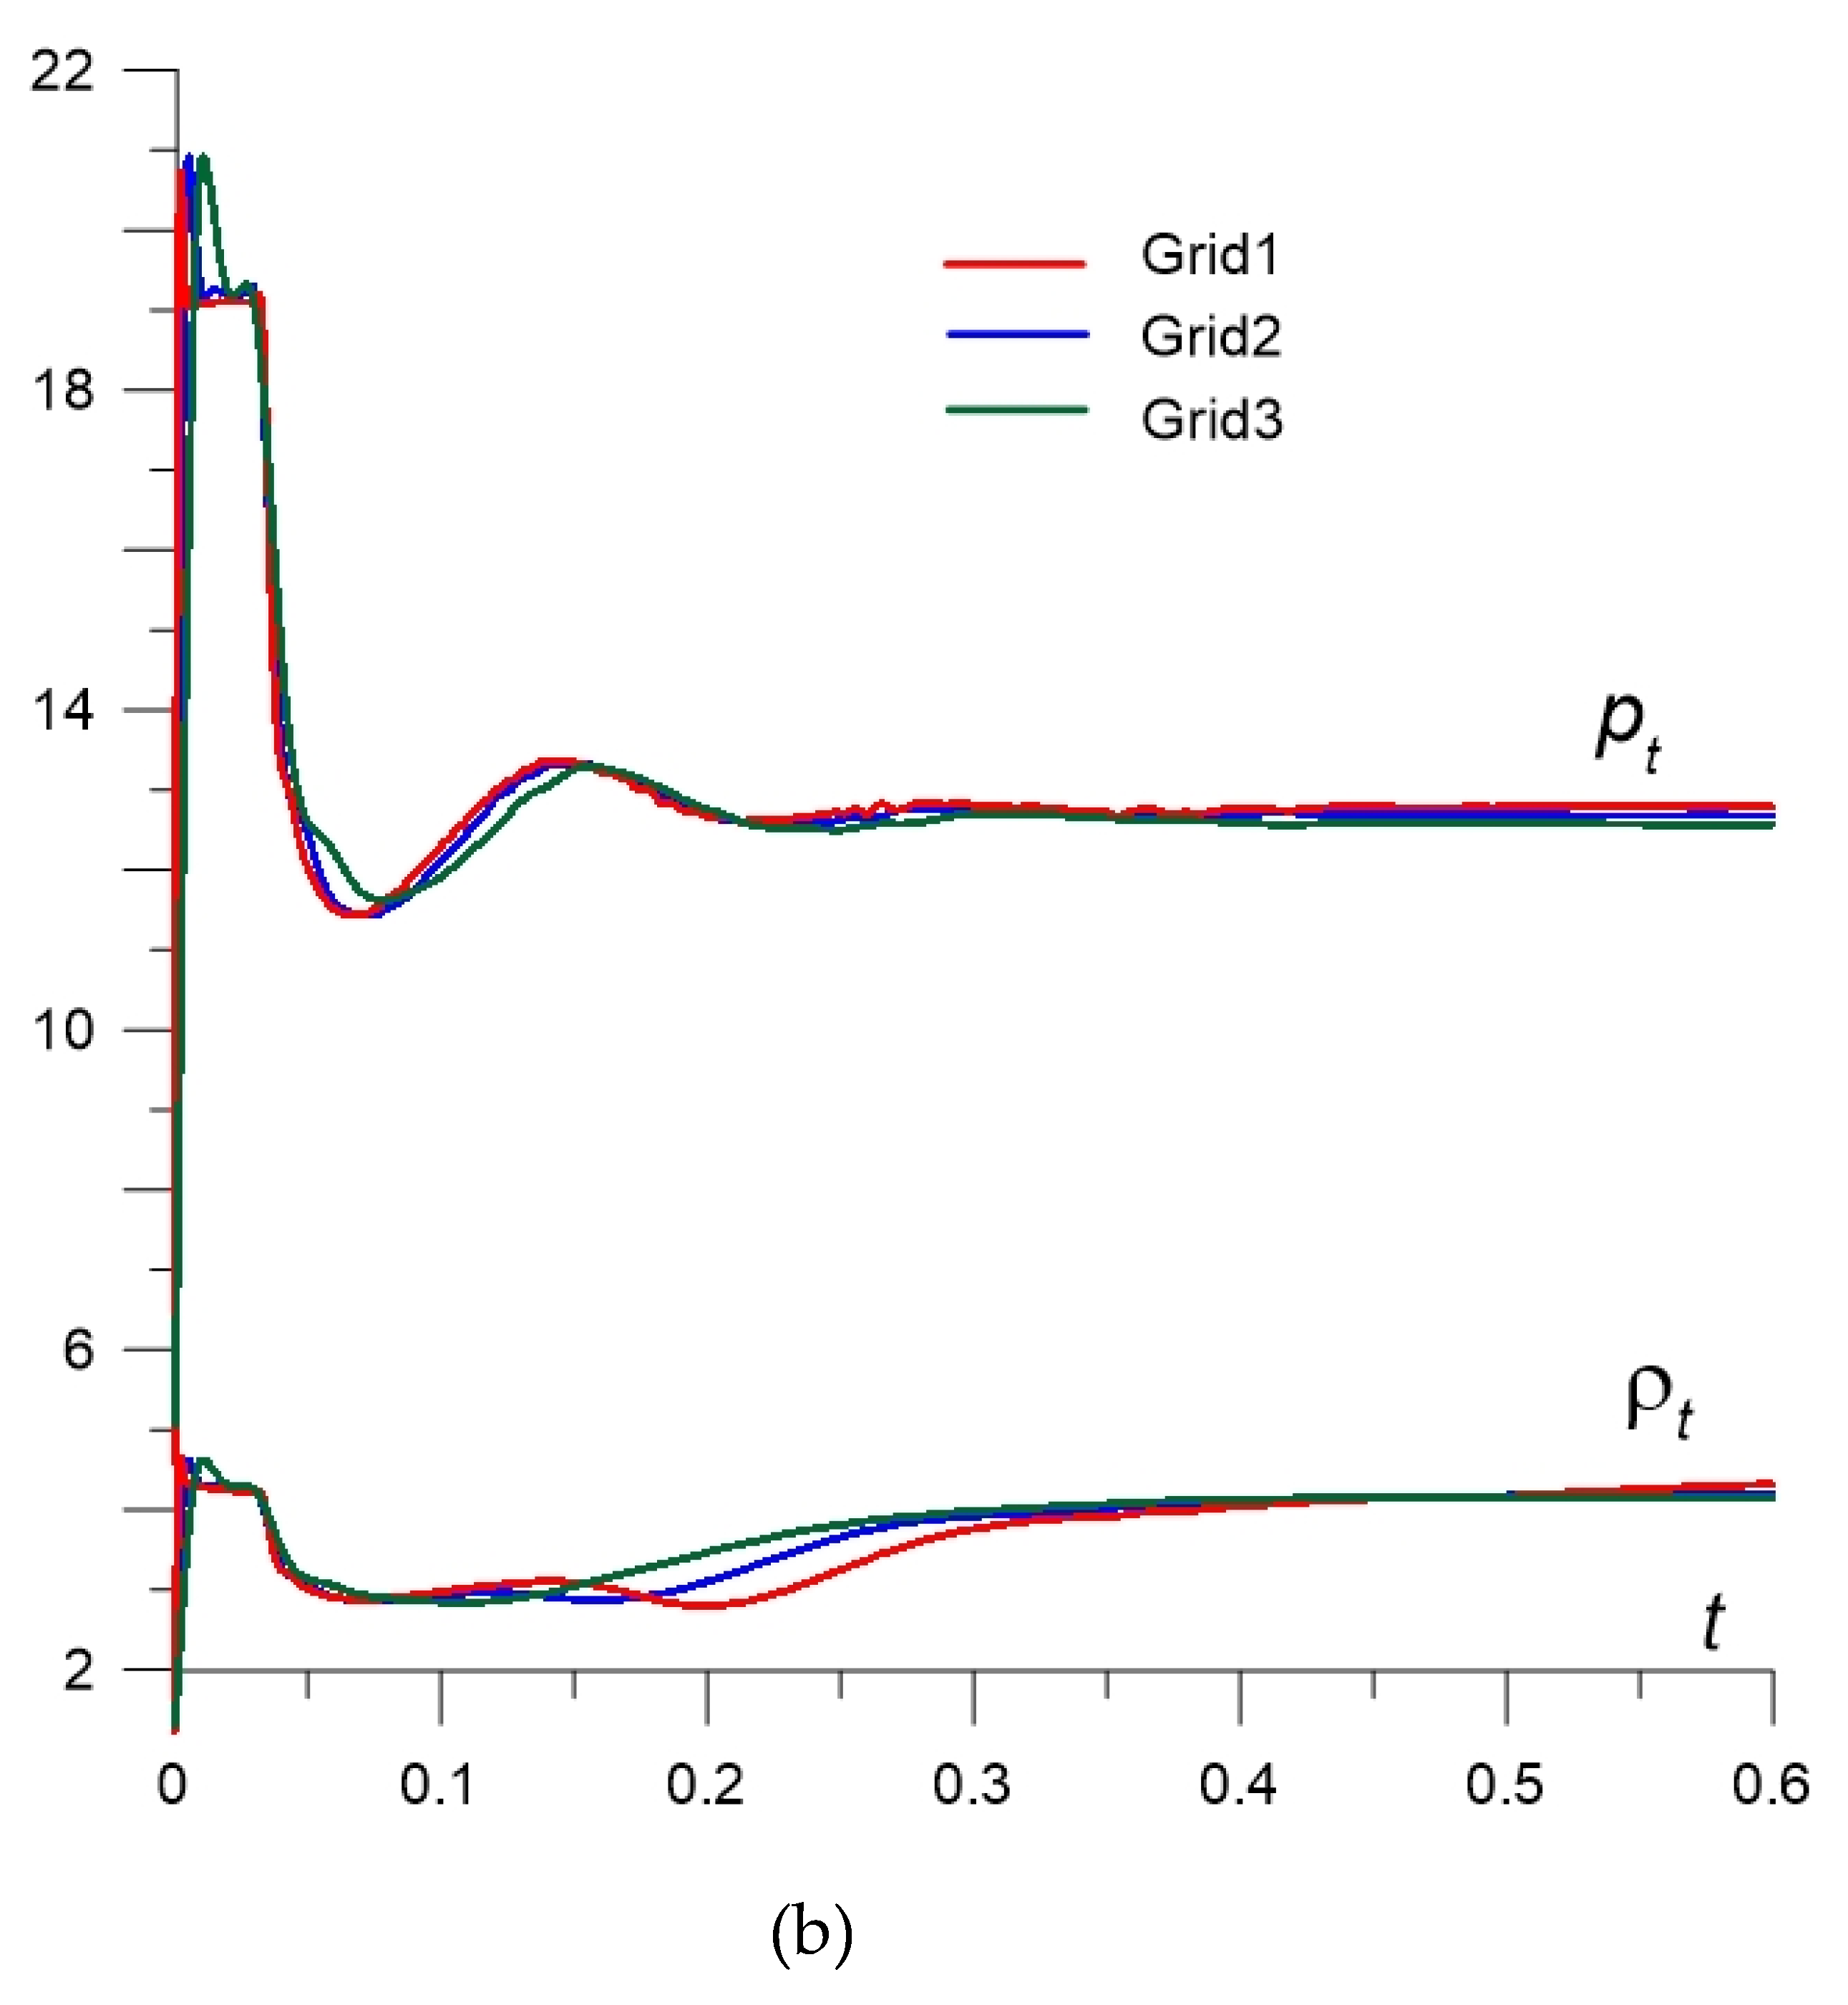
Grid convergence analysis was conducted for three difference grids (Table 1, t = 0.6). Here, the characteristics of the selected grids are presented and are chosen by taking into account the flow symmetry. The analysis of the stagnation parameters obtained using these grids is presented as well as the relative errors. Figure 5 demonstrates the flow fields in isochores (Figure 5a) and the dynamics of the parameters at the stagnation point (Figure 5b) obtained by using these three difference grids. It can be observed that despite the fact that the grids differ significantly (the numbers of nodes of Grid1 and Grid3 differ by 16 times; Grid1 and Grid2 differ by four times), the values at the stagnation point differ from their theoretical values from 0.5% for the stagnation pressure (Grid1) to 5.5% for the stagnation density (Grid3); the relative errors are smaller for finer grids. In addition, the positions of the bow shock wave almost coincide (see Figure 5a).

Table 1.
Characteristics of grids and analysis of grid convergence.
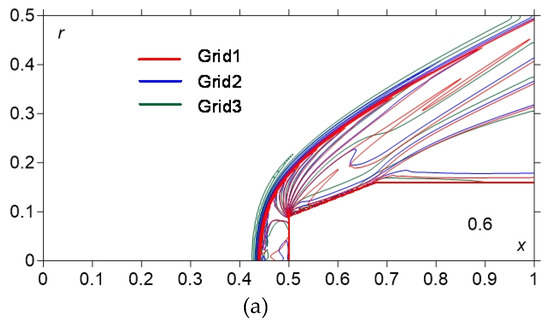
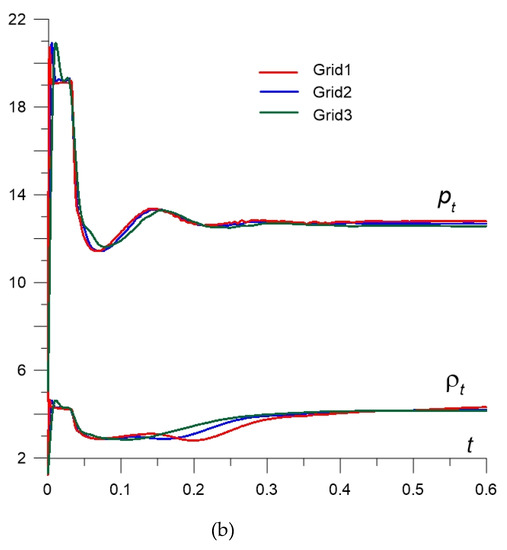
Figure 5.
Analysis of the grid convergence on three different grids: (a)—density fields (superposed); (b)—dynamics of the stagnation pressure pt and density ρt.
Thus, all of these factors indicate that the grid convergence takes place. For the simulation, we used Grid1, which contains 106 working nodes, and ≈103 nodes are located on the diameter of a cylinder part of the body (2R). In the simulation, the symmetrical flow picture is considered by regarding the experimental one, which is connected with the possibilities of the using software.
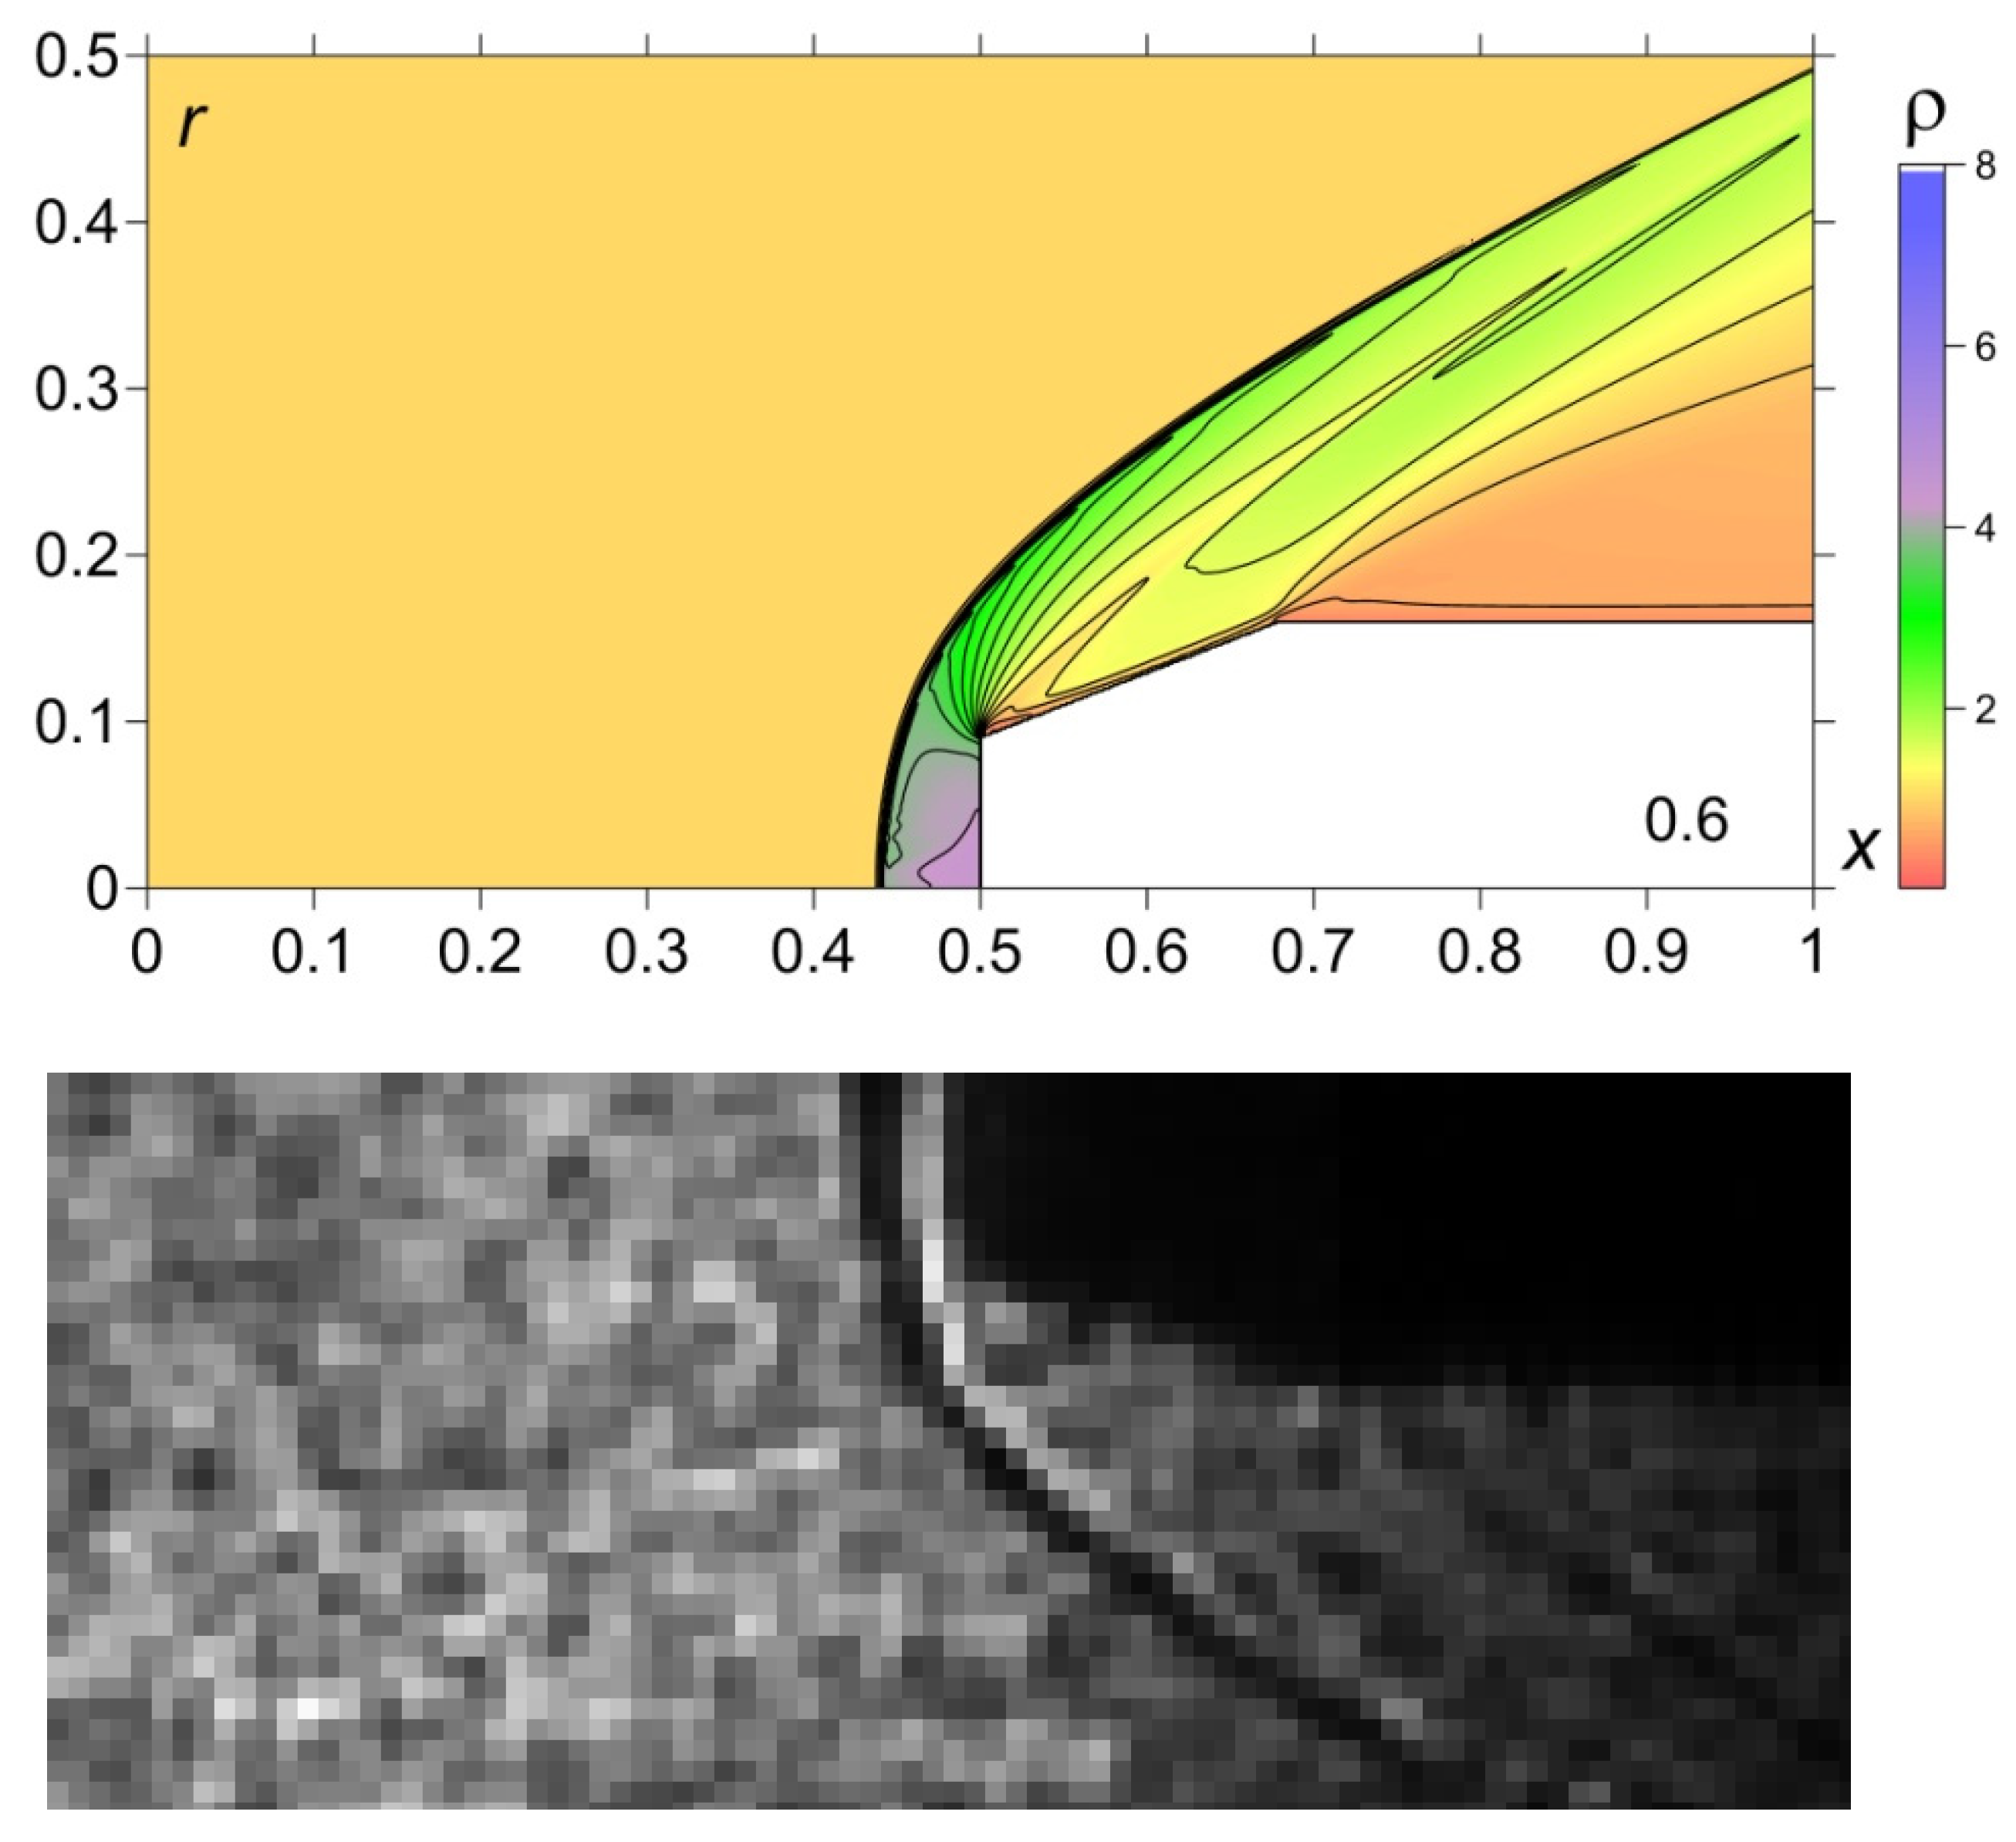
Initial conditions for the problem are the fields of gas parameters in a converged supersonic steady flow past the body (Figure 6), t = 0.6. At this time moment, the stagnation pressure and density differ from their theoretical values by 0.469% and 1.873%, accordingly. The boundary conditions have a sense of the absence of normal flows for the corresponding parameters on the body surfaces and the absence of the reflection in the normal directions at the exit flow boundaries.
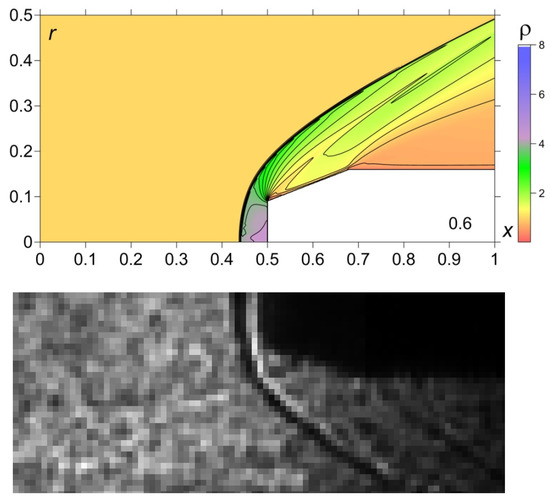
Figure 6.
Steady flow: comparison with the experiment; upper—calculations; bottom—experiment (enlarged and rotated).
The energy source is supposed to have a spherical shape. It is assumed to arise instantly in the steady flow at the time moment ti; the coordinate of its center x0 was chosen from the experiment. The radius of the energy source is chosen so that the volume to be located in front of the bow shock wave. The pressure in the energy source pi is supposed to be larger than in the surrounding flow while density and velocity remain the same (so the temperature in the energy source is increased in comparison with the surrounding flow). Thus, the model of the instant explosion of a bounded gas volume is used for energy deposition. The pressure value pi in the energy source is defined from the following relation.
Here, η is the part of the discharge energy spent to the expansion of a gas, E0 = 500 J (from the experiment). The value of η was estimated from the results of numerical modeling from the conditions of qualitative proximity of the processes occurring relative to the experiment. In the simulations, η was set to 0.07, i.e., it was assumed that 7% of the energy was consumed in gas expansion. It should be noted that in [22], an estimate of 0.1 was obtained for the value of η. The defining flow parameters and the normalizing coefficients used in the simulations are presented in Table 2.

Table 2.
Defining flow parameters and normalizing coefficients accepted in the simulations.
3.2. Results of the Simulations
The interaction of the energy source with the shock layer was shown to cause the change of the entire flow. The gas in the energy source moves from its center to the periphery and moves towards the bow shock as well. The shape of the energy source becomes asymmetrical. The process of the instant explosion is accompanied by the break of a shock on the boundary of the compressed gas, which can be described by the solution of the Riemann problem for the decay of an arbitrary discontinuity. As a result of gas expansion, the shock wave and contact discontinuity moving from the center are originated together with a rarefaction wave moving to the volume center. For a particular set of the parameters, a weak shock wave also can be generated from a boundary of the rarefaction wave. In this manner, an area of heated gas is formed in the internal region of expanding gas. The impact of this area was shown to be a reason for the front drag force reduction under the action of energy release [21,22].
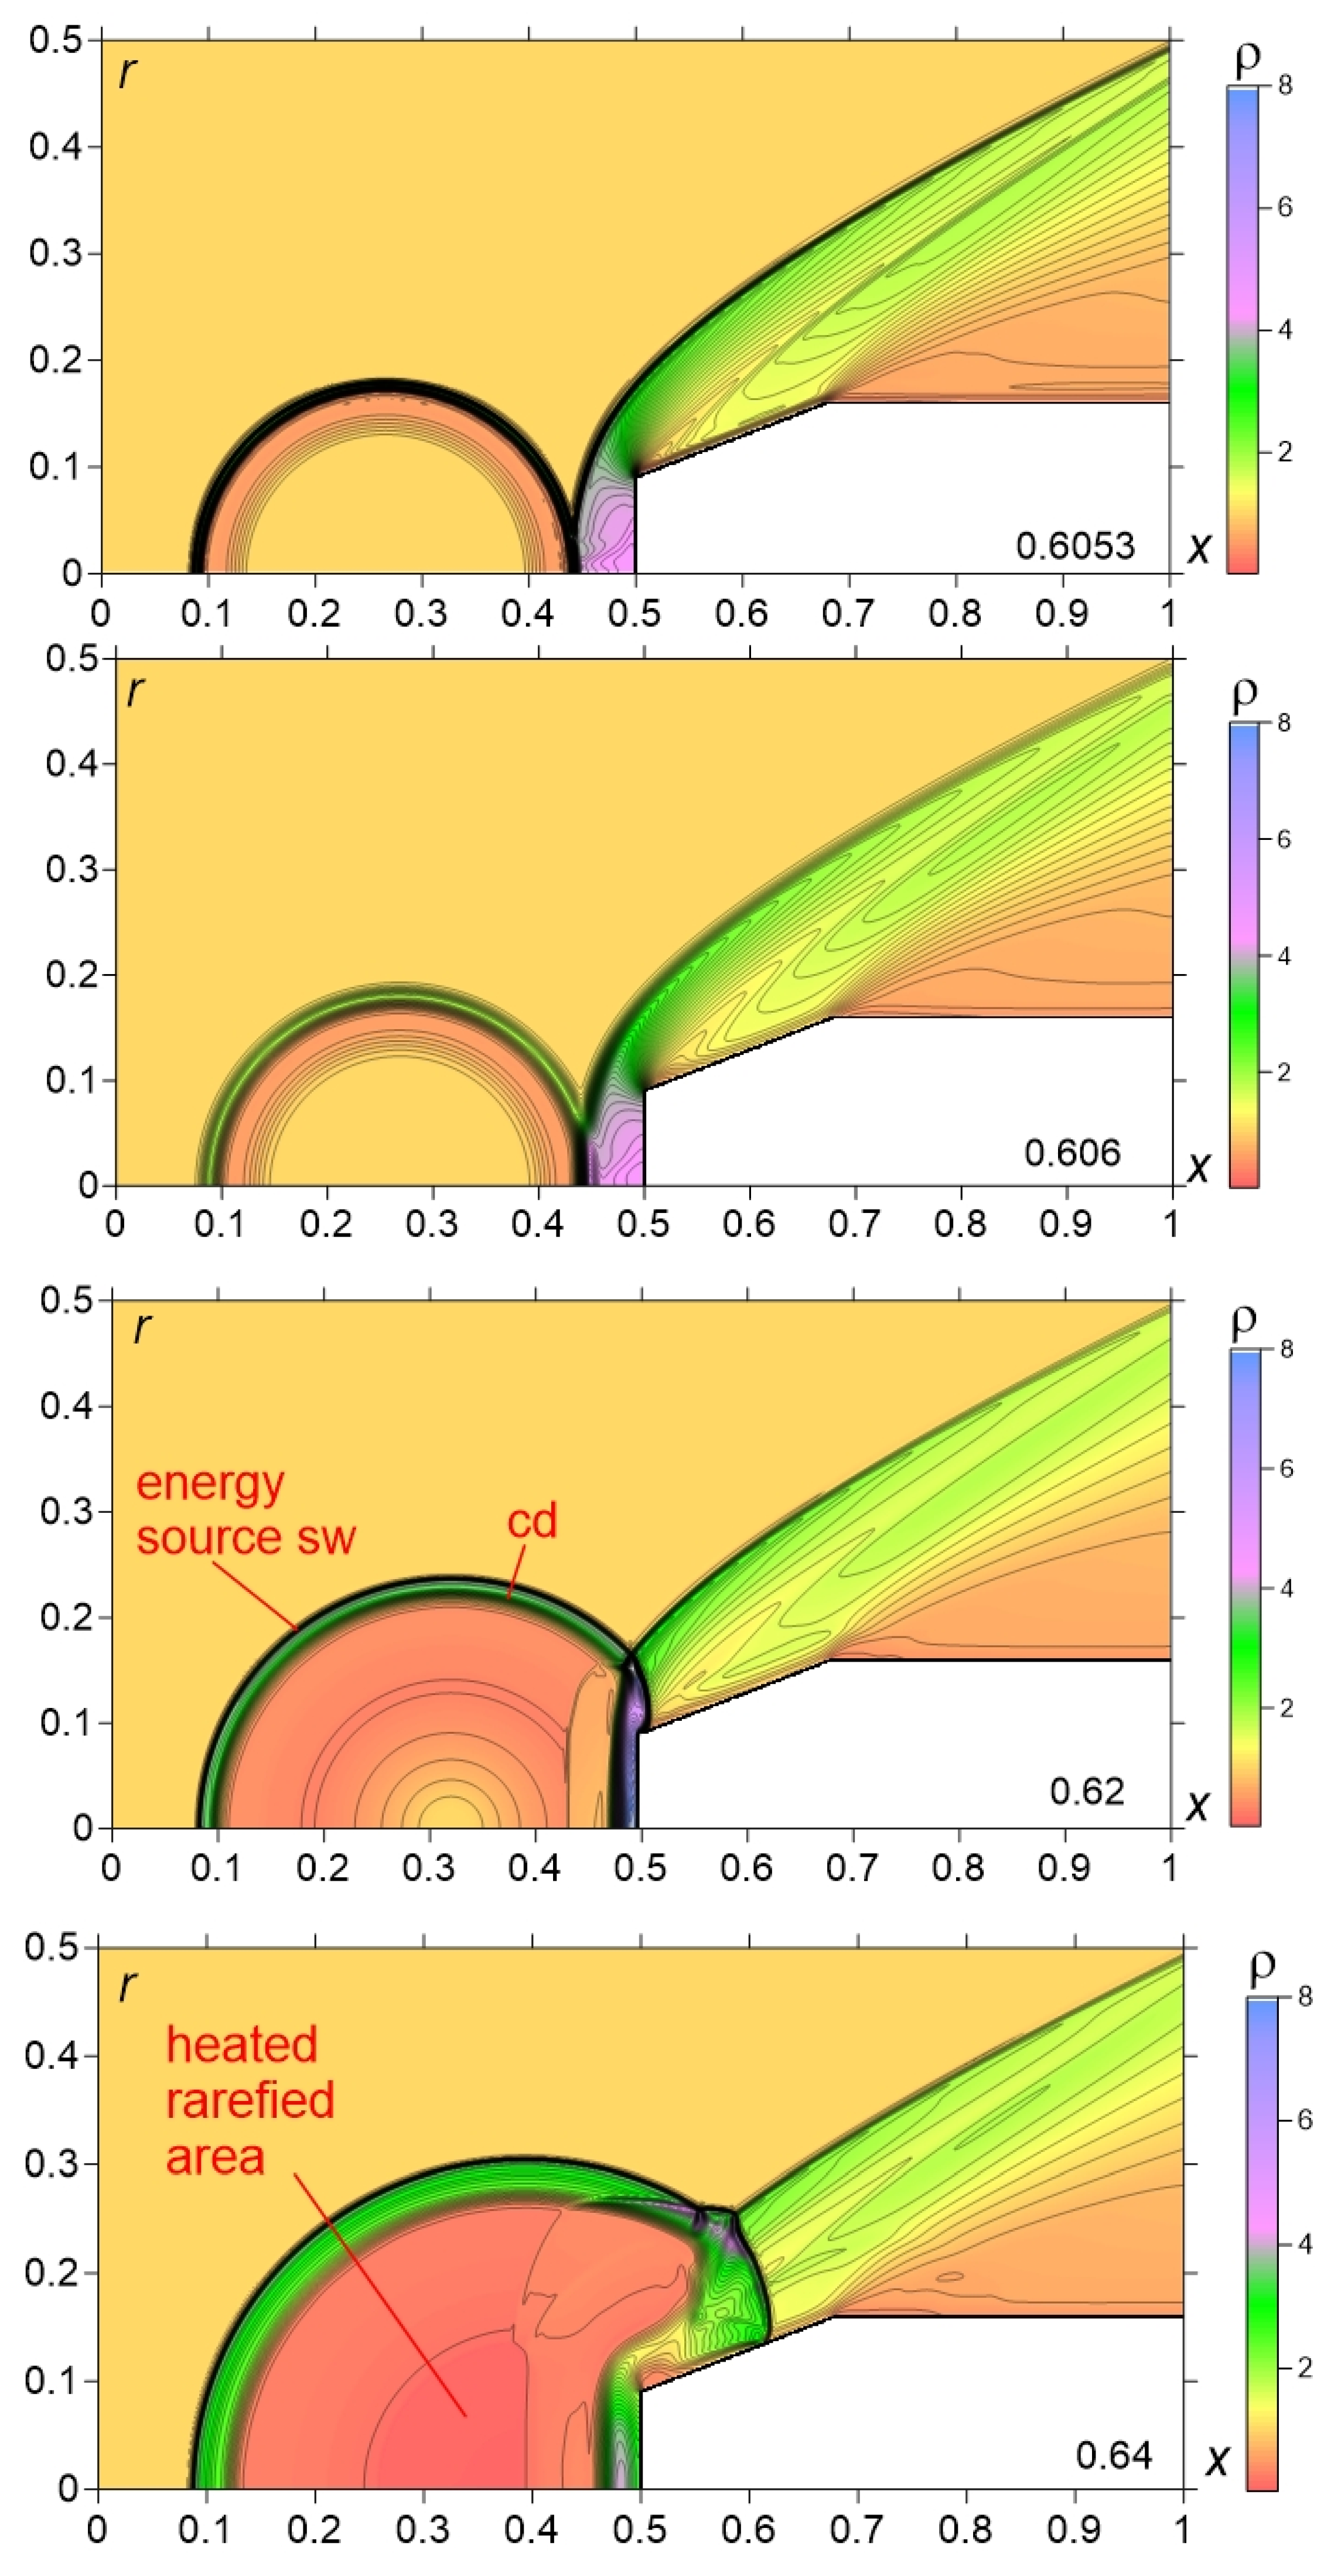
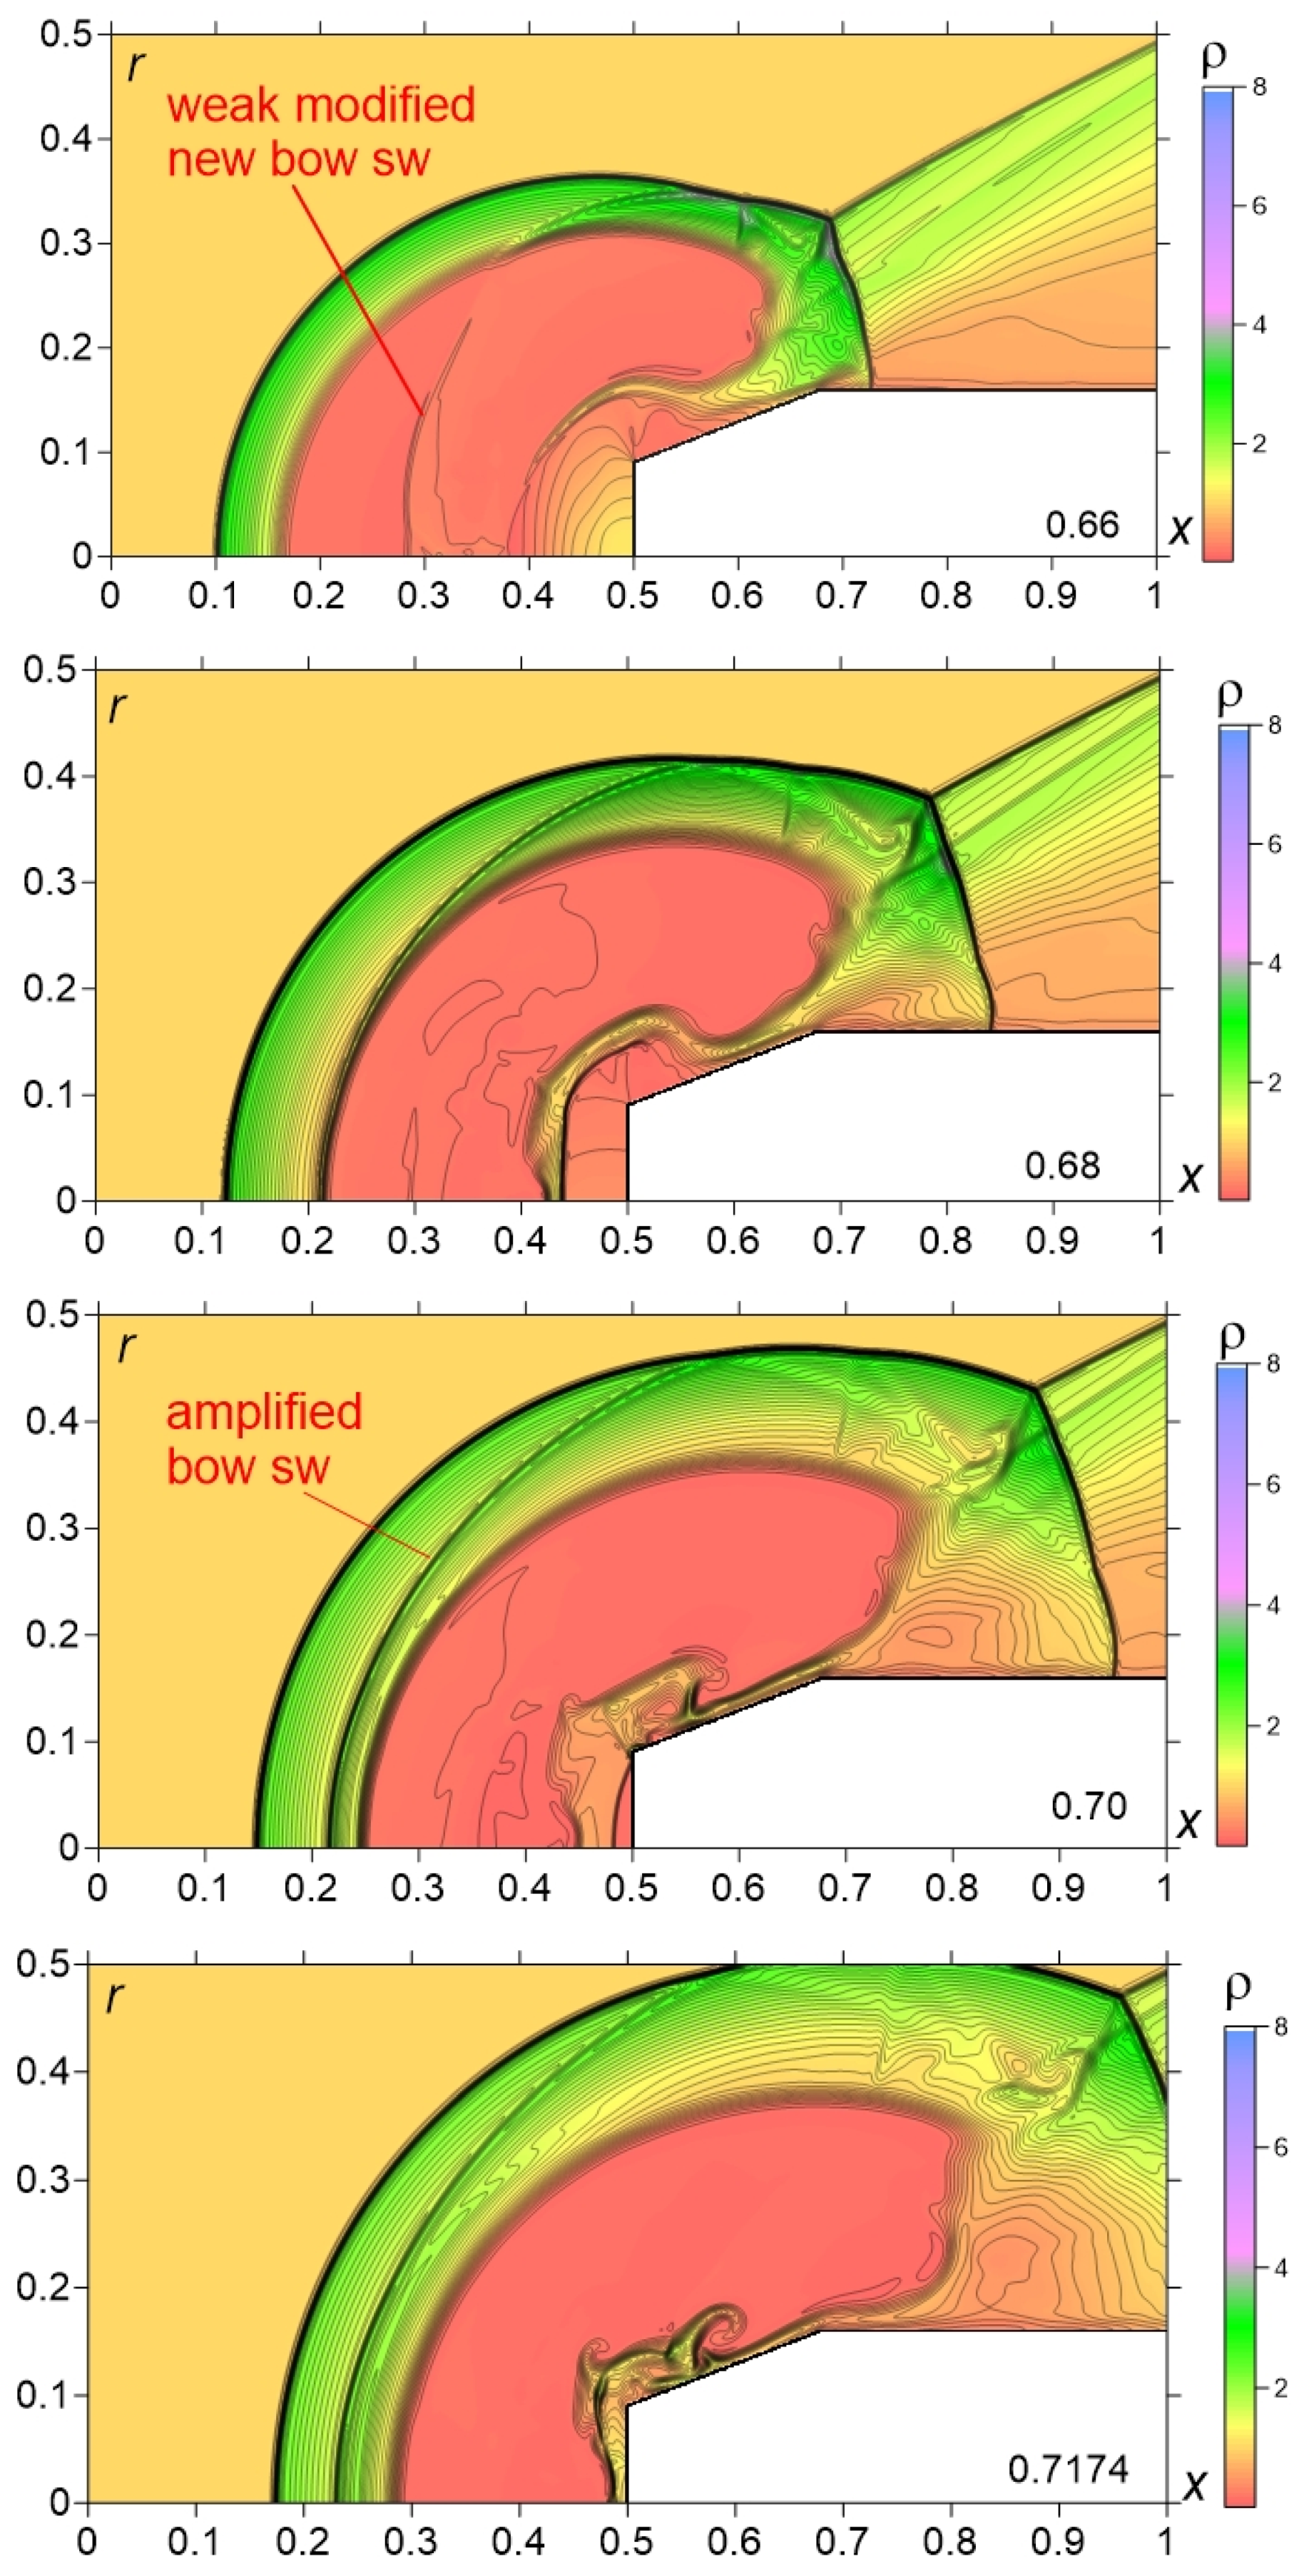
In Figure 7, the initial stage of the dynamics of energy source-shock layer interaction is presented (dimensionless time instants are indicated in the lower right corner). This stage is associated with the creation of a hot area due to energy release and its impact on the body. At the beginning of the interaction (t = 0.6053), a strong source shock wave and contact discontinuity are generated (t = 0.606). An area of compressed gas with increased pressure is formed together with a strong shock structure that is caused by the source’s shock wave and contact discontinuity interacting with the bow shock (t = 0.62). Then, the pressure in the area of the compressed gas decreases and a heated gas region is formed at the central part of the expanding energy source (t = 0.64). The right boundary of this heated gas area gives rise to the weak shock wave from which a modified new bow shock will be formed (t = 0.66). Later, it comes to the less hot left area between the contact discontinuity and the source shock wave (t = 0.68) and is strengthened there (t = 0.7). This modified bow shock can be interpreted as a bow shock formed by the streamlining of an energy source. It moves to the blast shock wave (t = 0.7, 0.7174). A boundary of the heated area is clearly observed (for t = 0.62–0.80 in Figure 7 and Figure 8), which is a contact discontinuity with different values of the flow density. This discontinuity (see image for t = 0.7174) can be the nearest shock to the body in the experimental image in Figure 3c. Multiple bow shock diffractions are observed during this stage of the interaction (t = 0.62–0.68), with the formation of a triple configuration in the upper part of the flow (t = 0.66–0.7) [27,28].
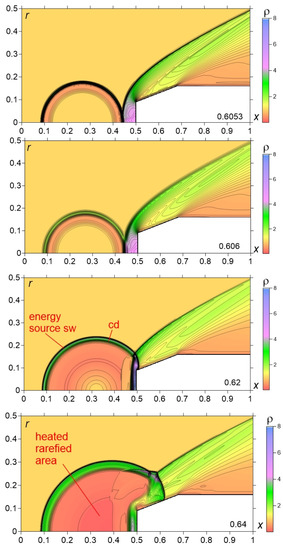
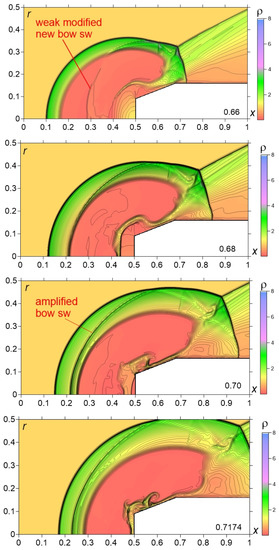
Figure 7.
Initial stage of energy source-shock layer interaction dynamics.
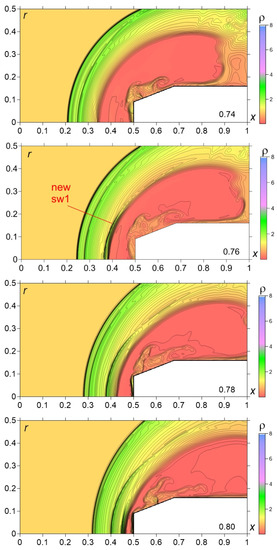
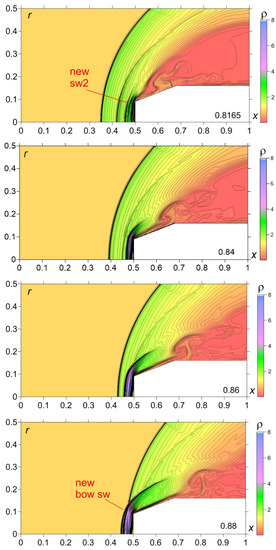
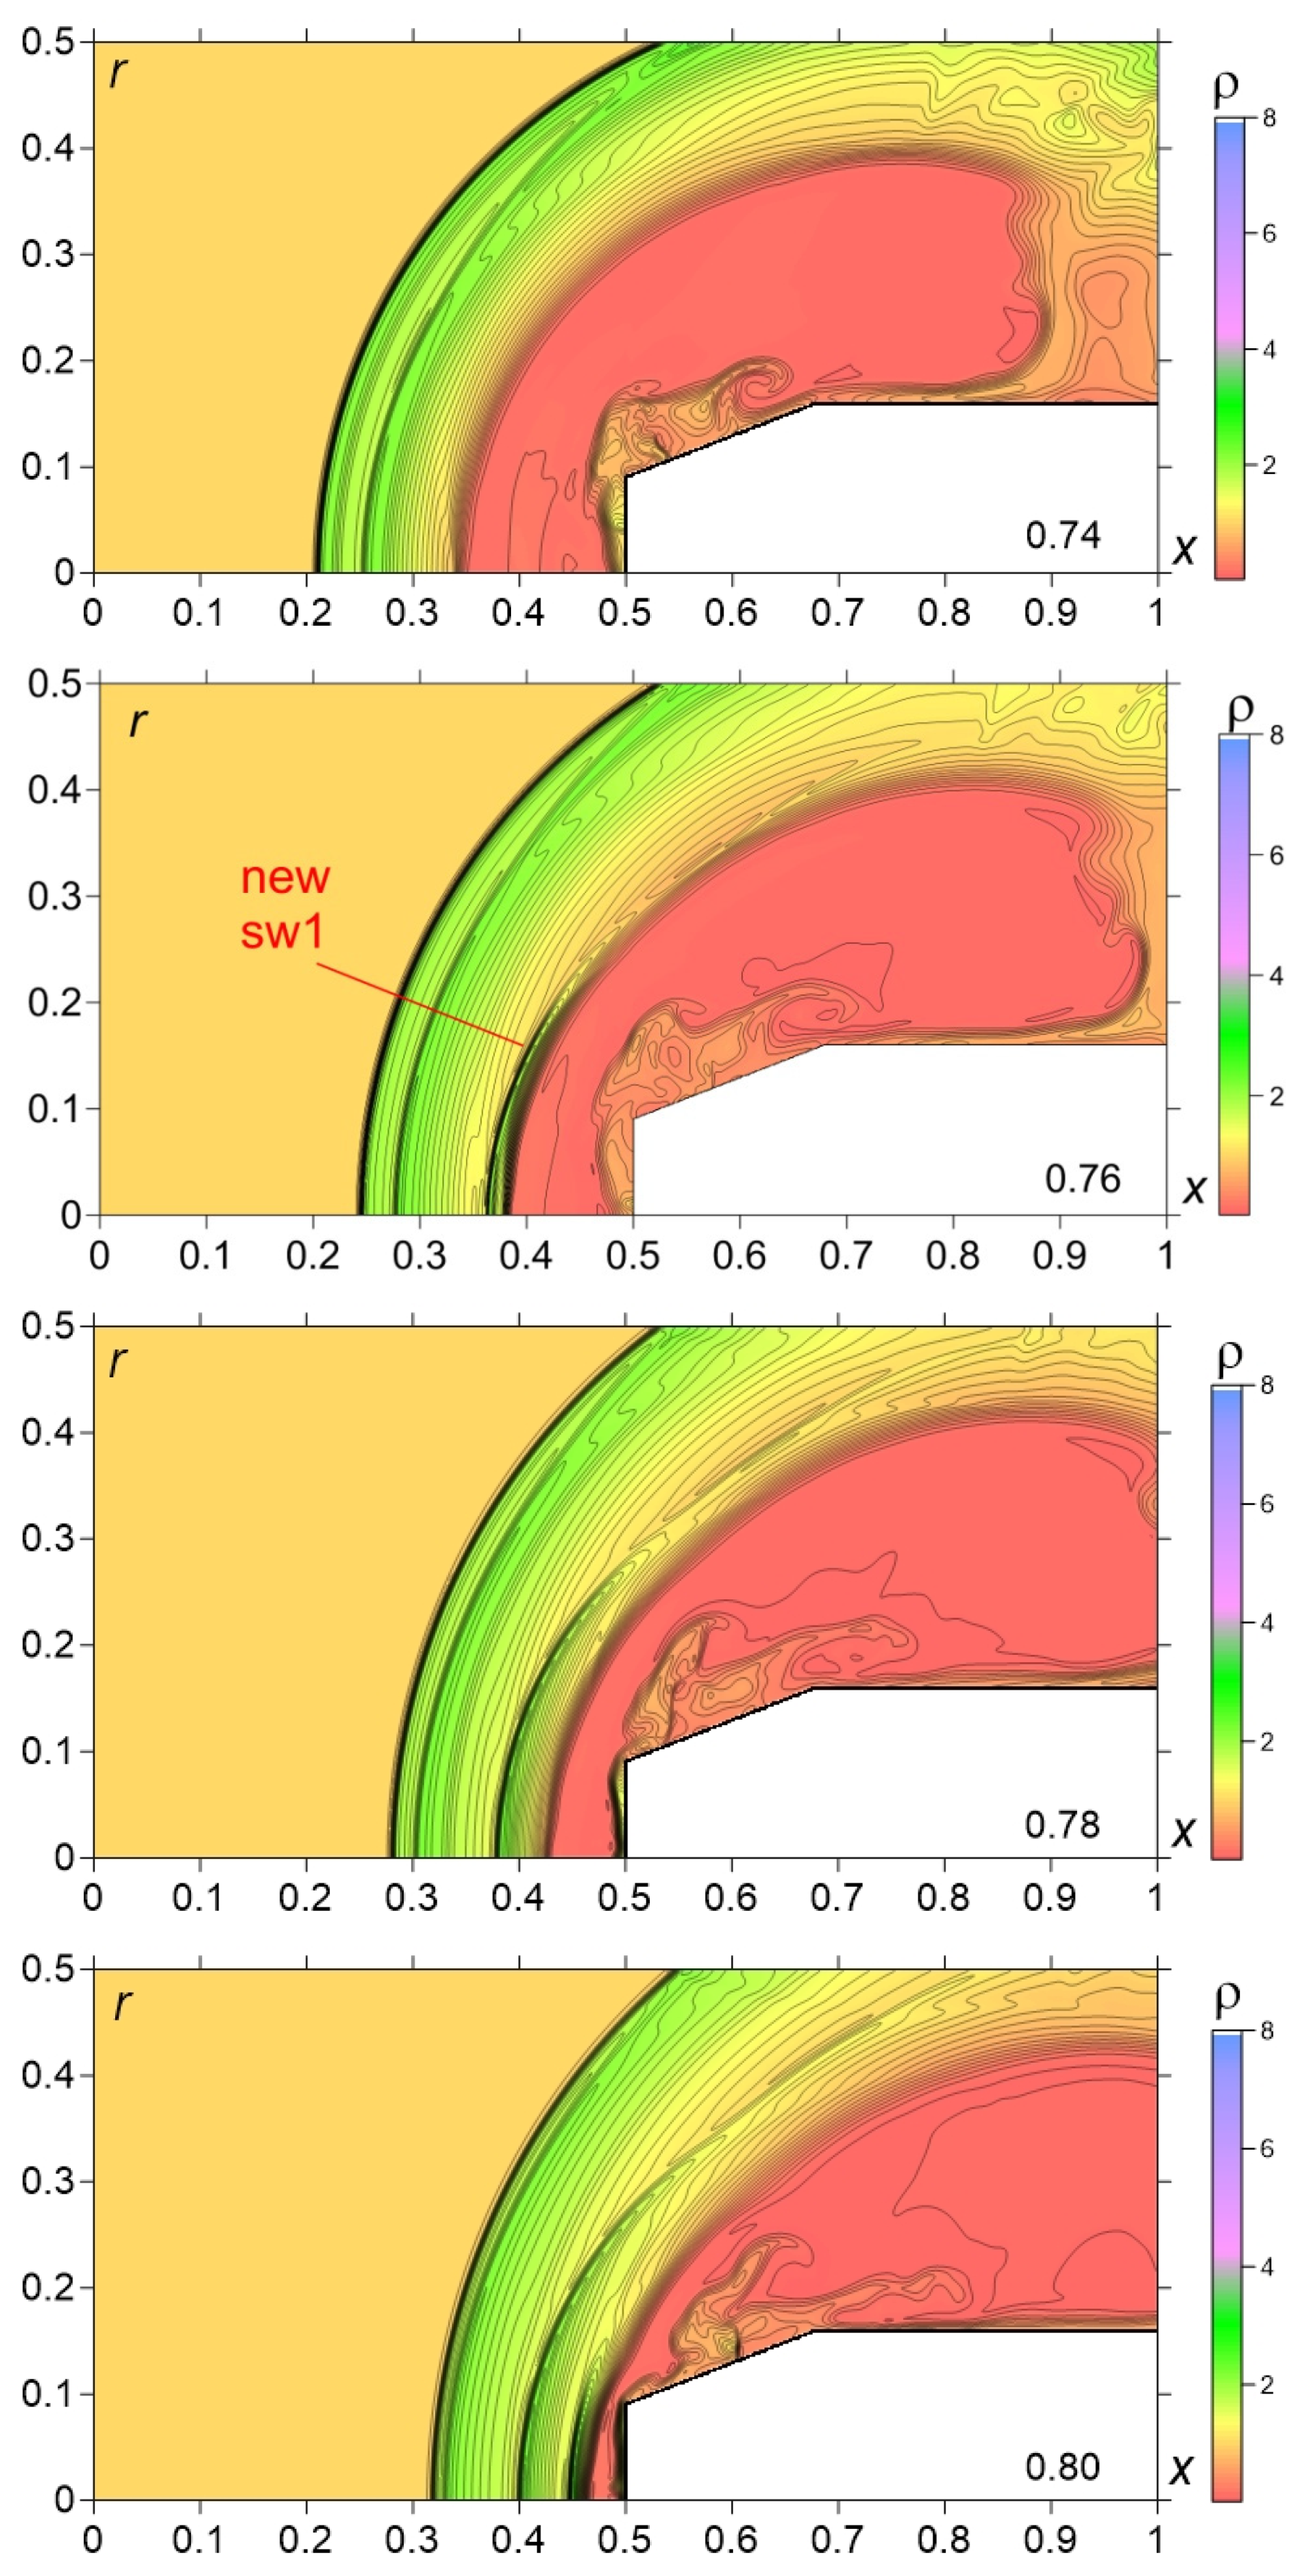
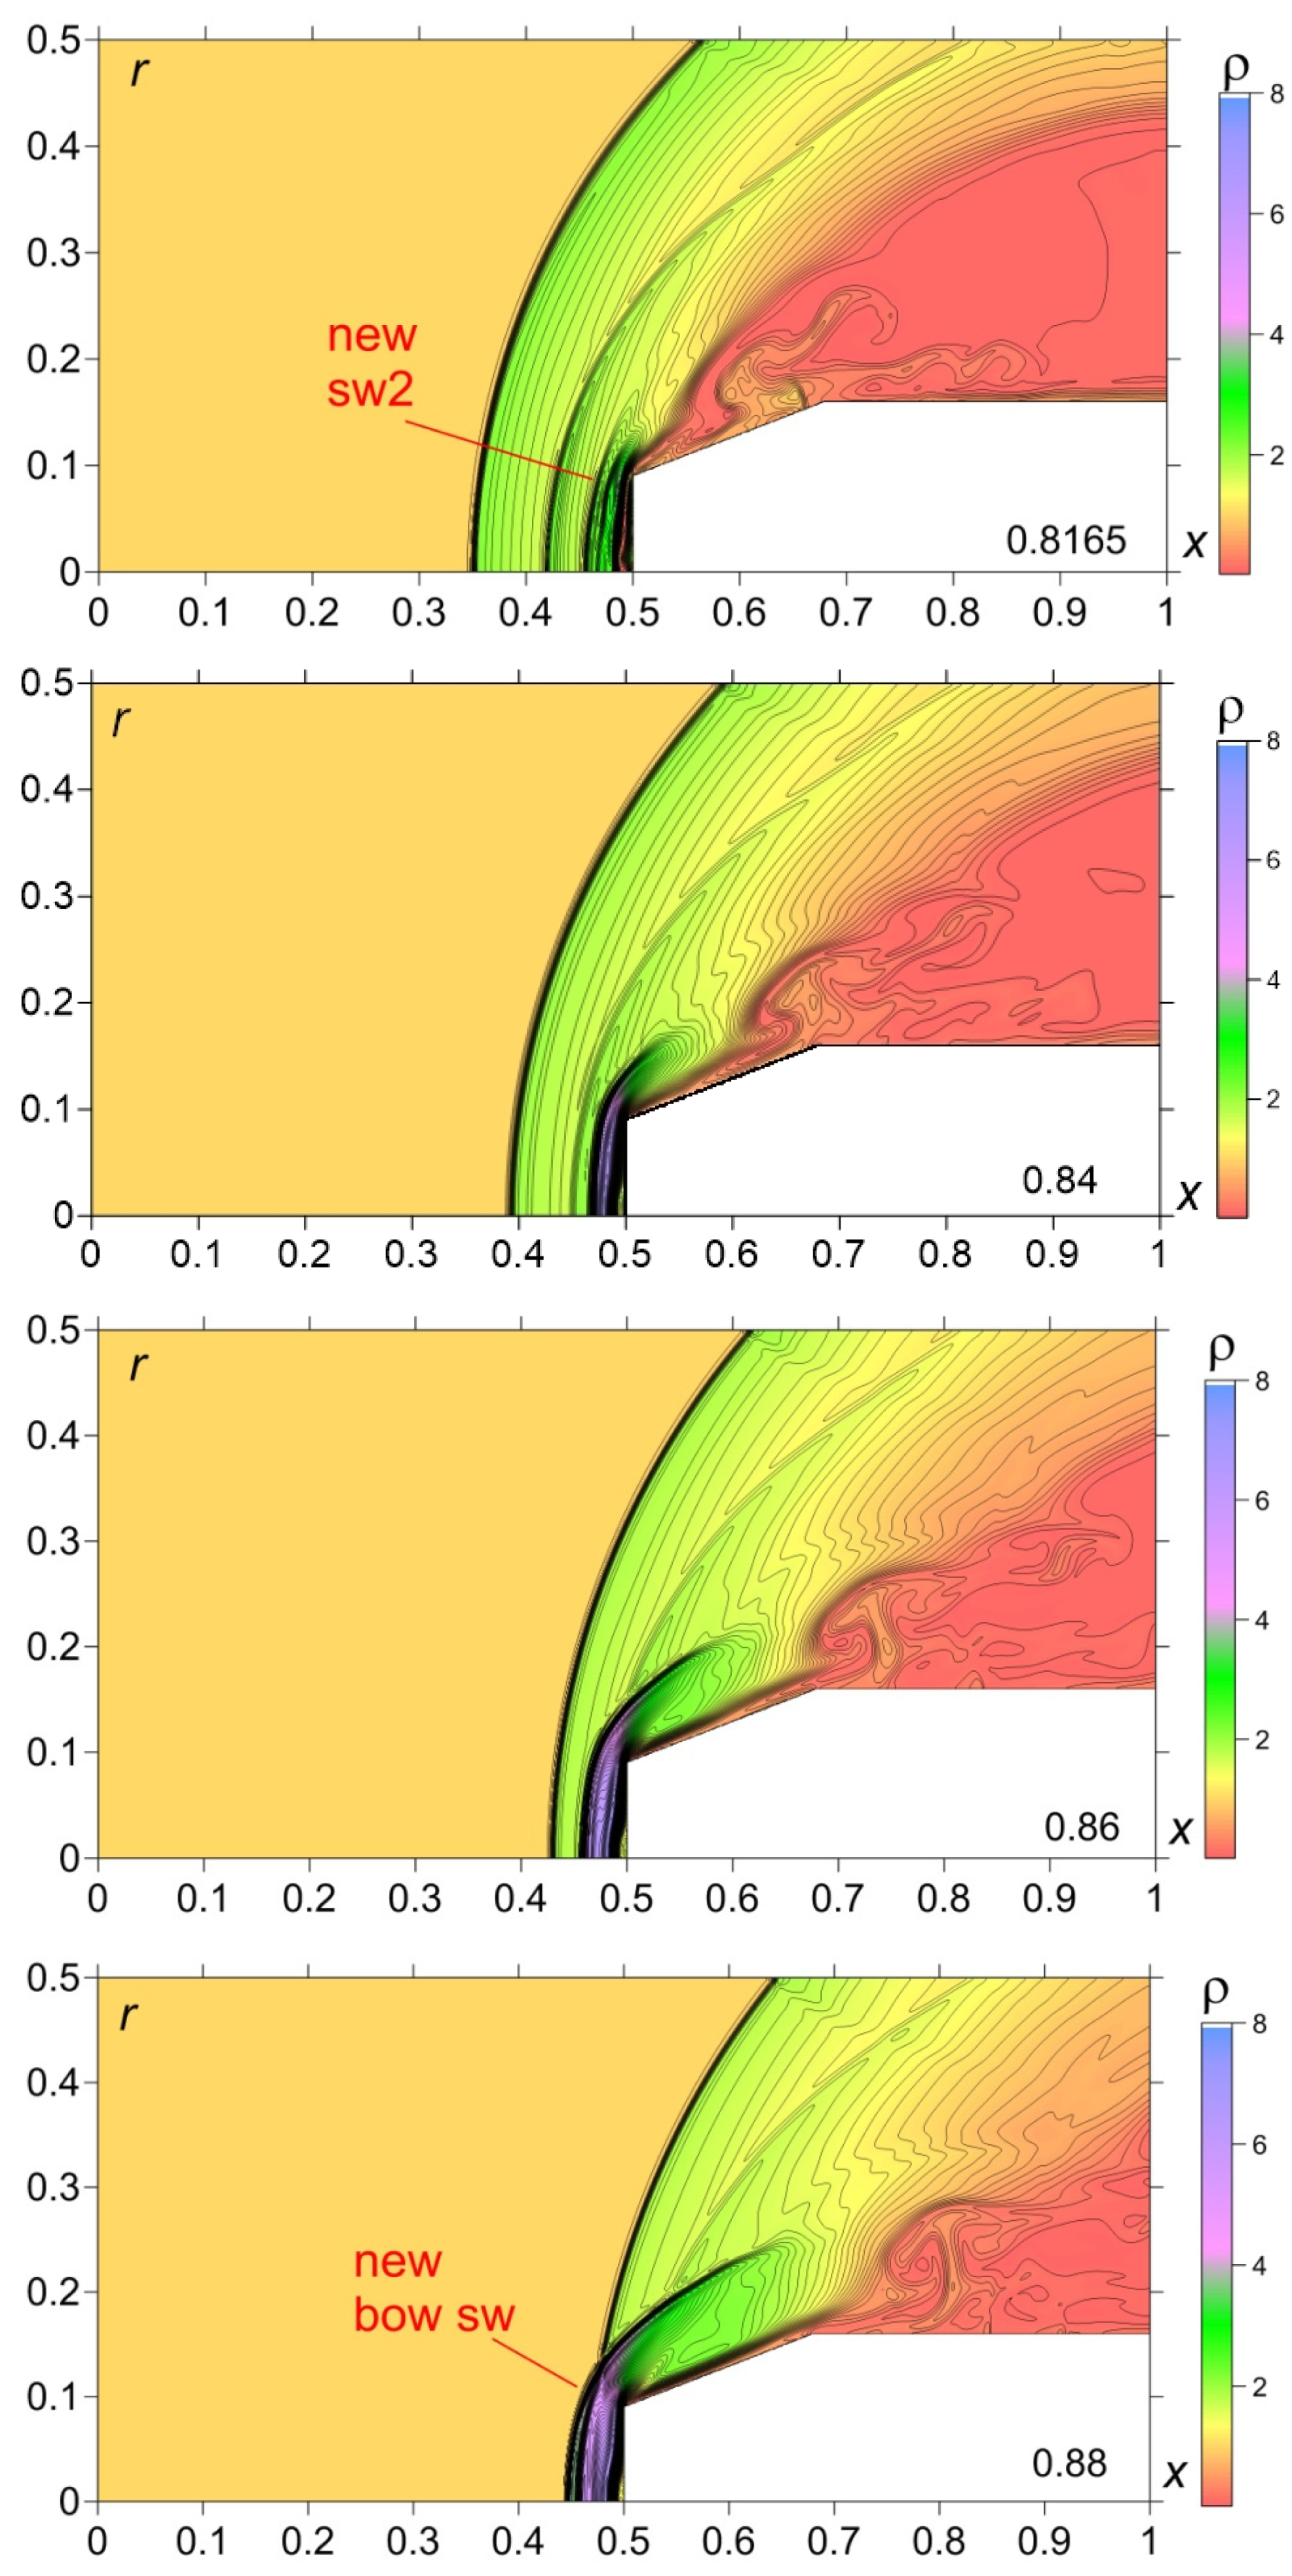
Figure 8.
Middle stage of energy source-shock layer interaction dynamics.
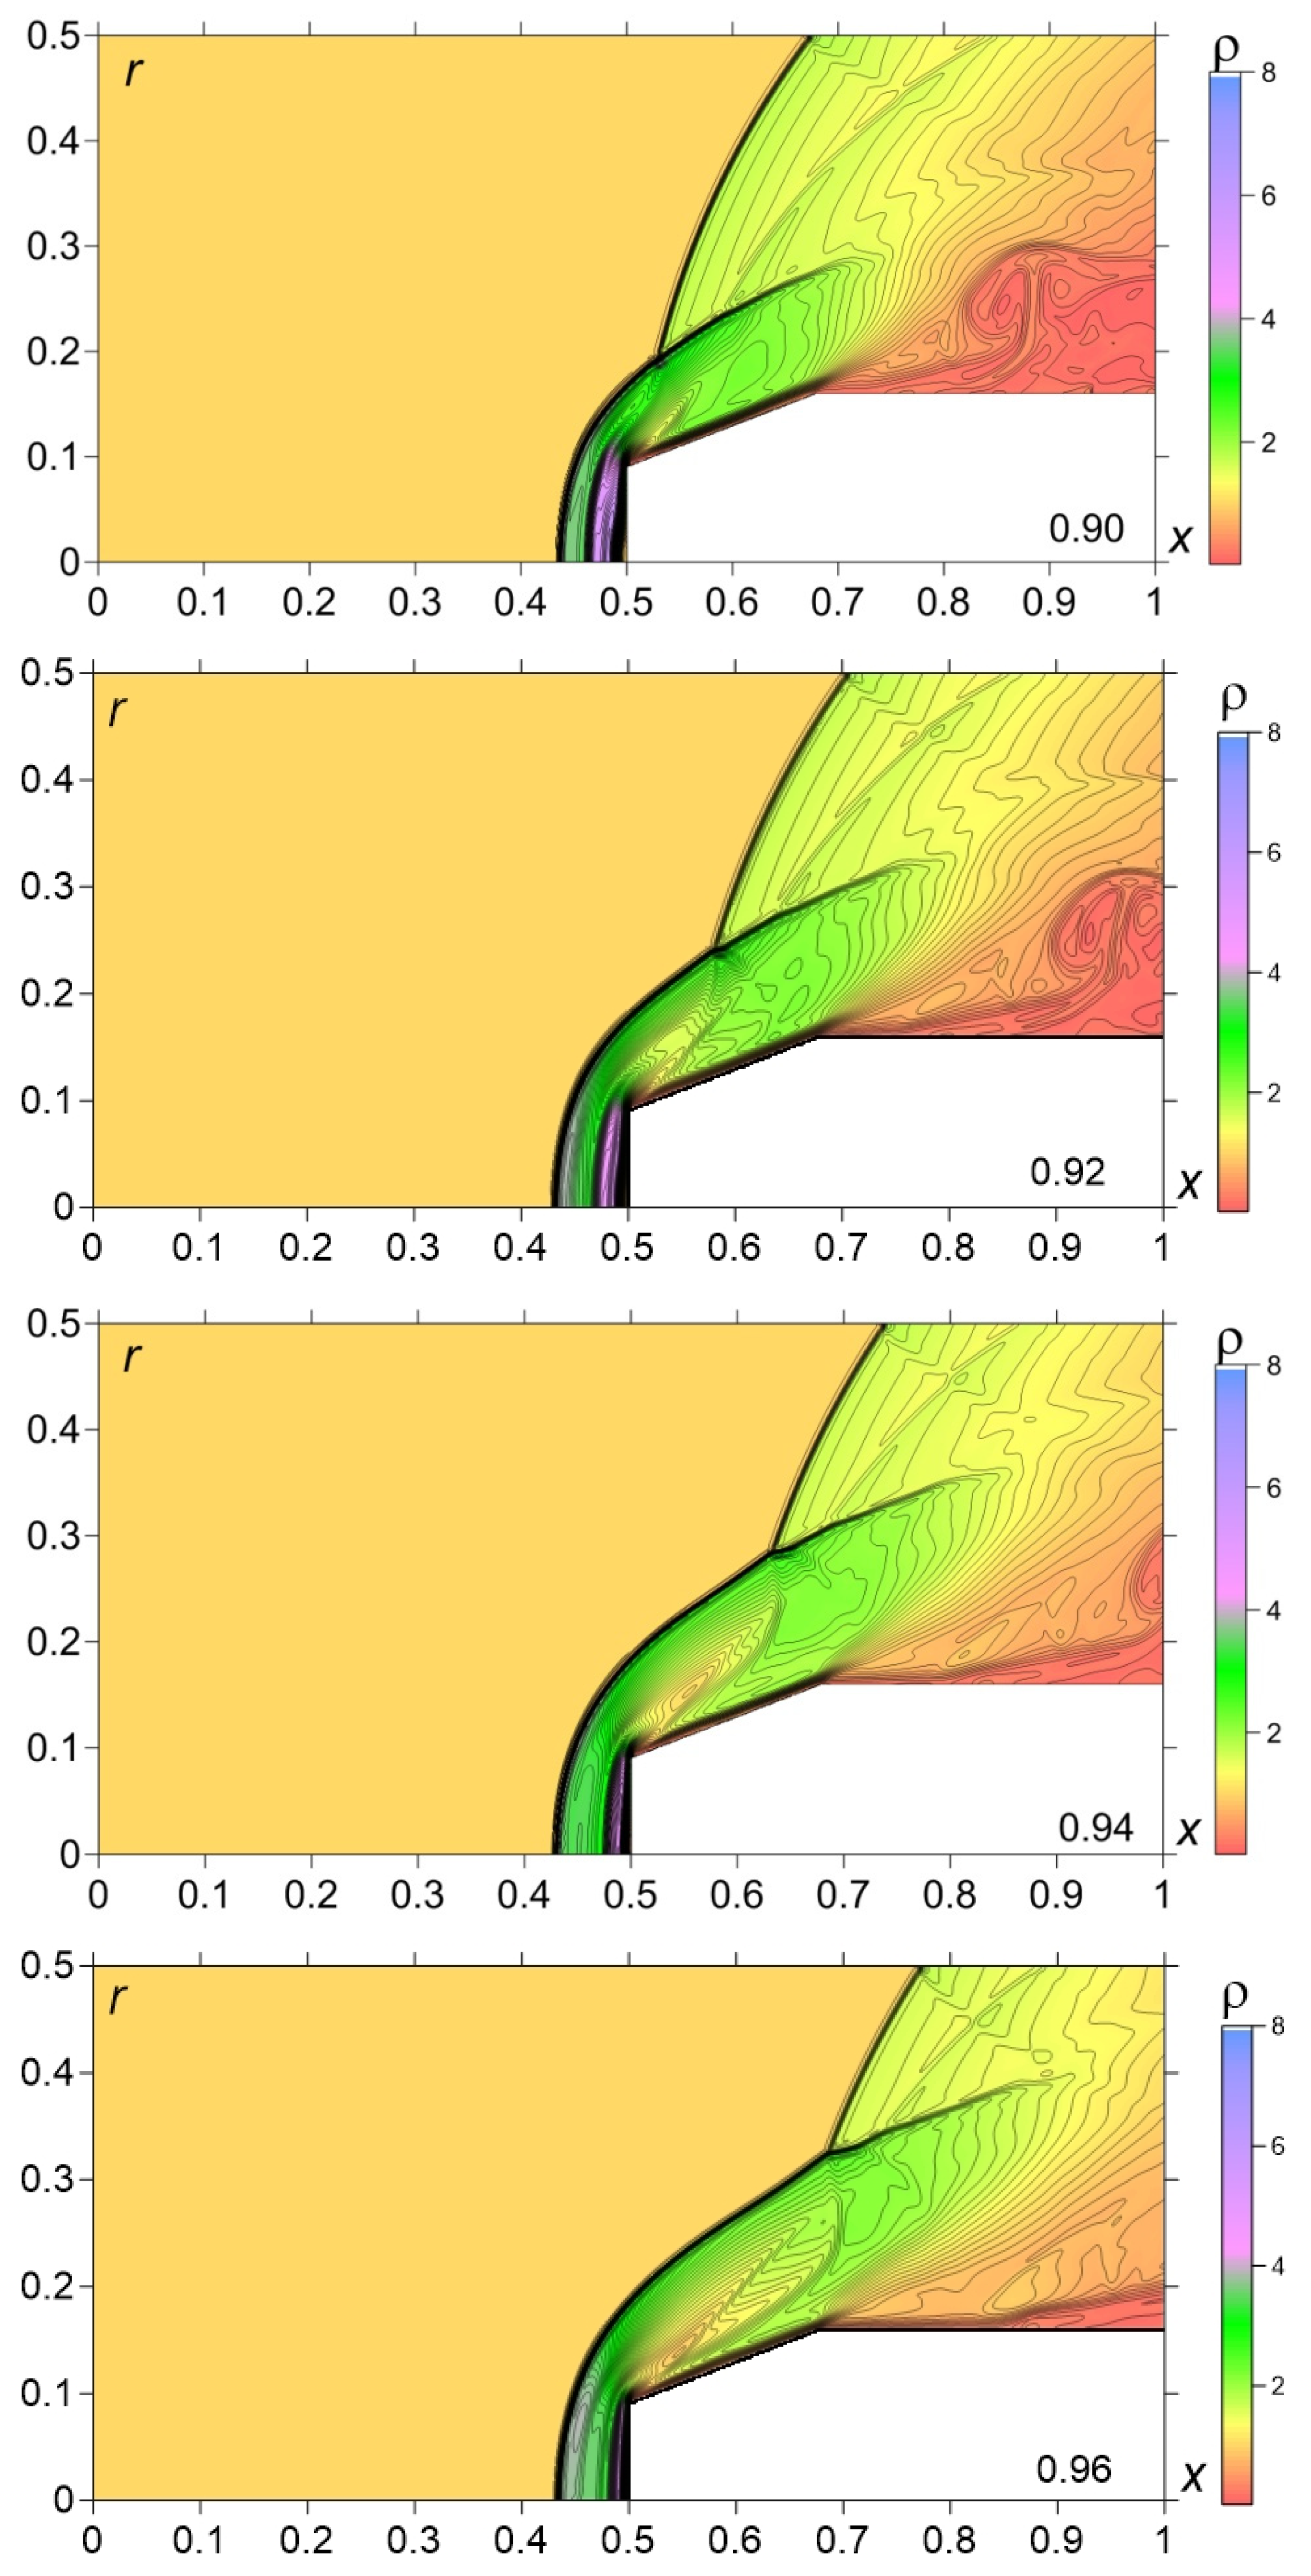
In Figure 8 the middle stage of the interaction is presented. This stage is associated with the movement of the hot area to the surface of the body and passing it behind the body. The modified bow shock moves to the source blast wave, becomes weaker, and later merges with it (t = 0.74, 0.76). At the same time, a new shock wave (SW1) is formed at the heated area boundary (t = 0.76). This shock wave is moving to the left towards the blast wave (t = 0.78). Another shock wave is initiated as well (SW2) (t = 0.80). After the hot area passing behind the body, a less heated gas (located between the contact discontinuity and the blast wave) is affecting the body’s surface. Thus, during the movement of the perturbation area to the body, a series of the shock waves was generated (up to three or even four ones) near the front surface of the body (t = 0.76–0.8165). They merge together, originating a strong shock wave that interacts with the left fragment of the source wave forming a new bow shock (t = 0.84–0.88). The area of compressed gas with high pressure near the body front surface at this time was observed.
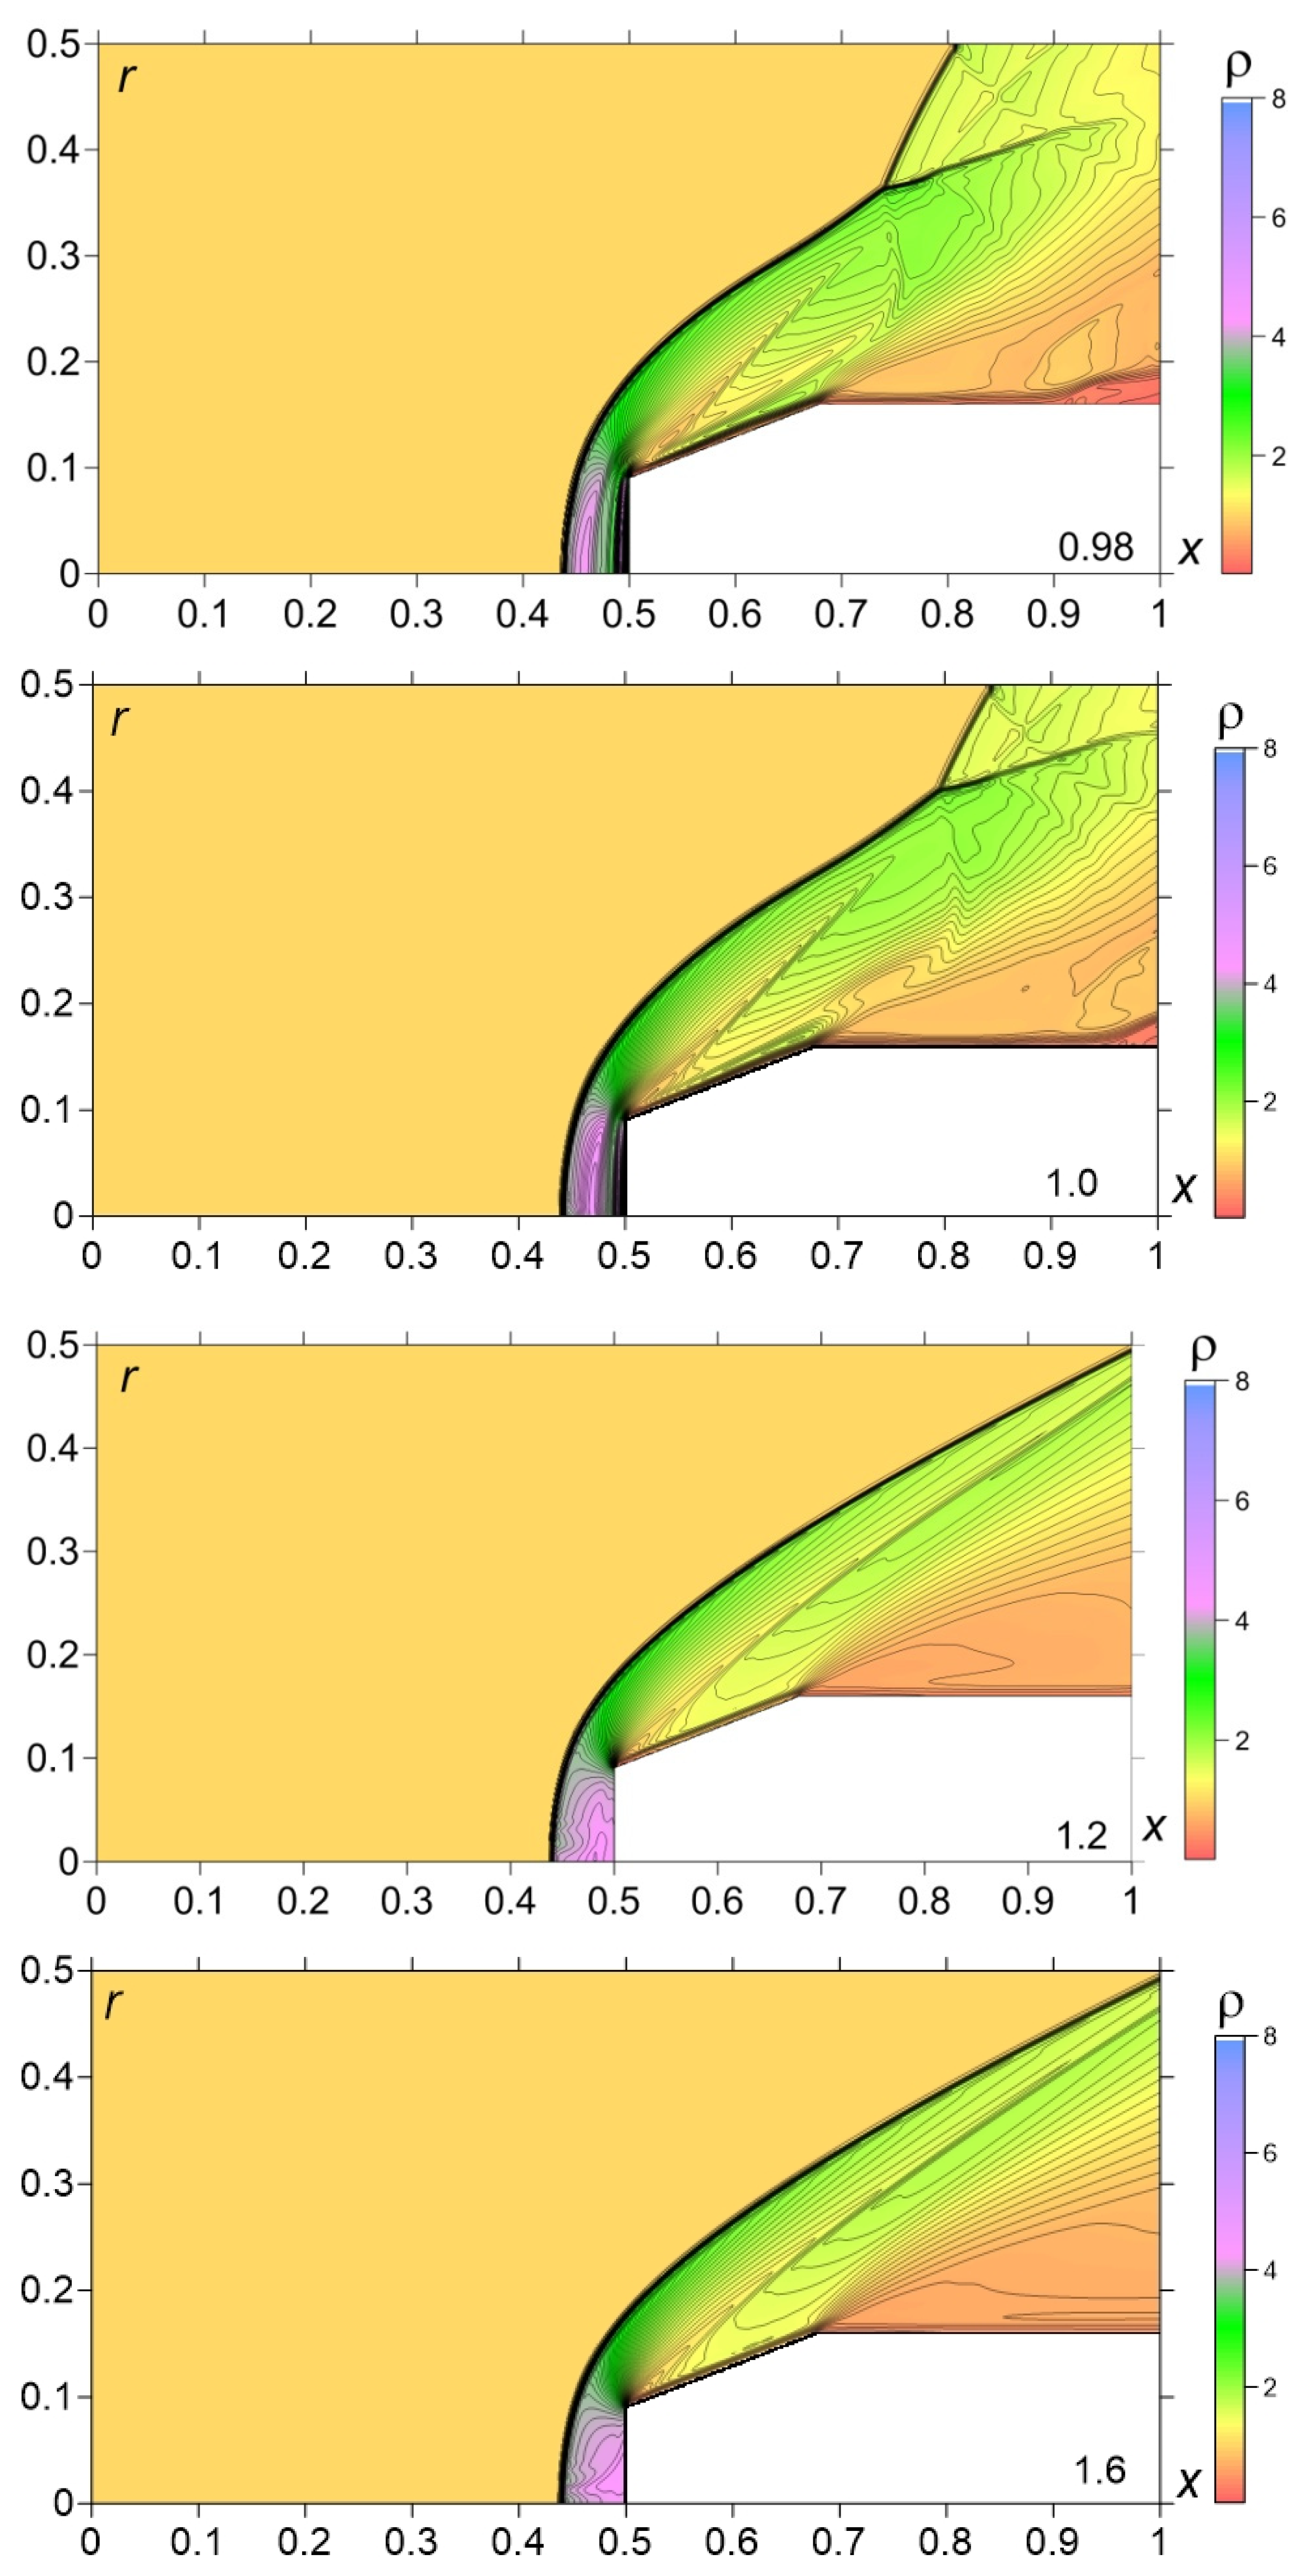
Figure 9 demonstrates the final stage of the interaction. This stage is associated with the dynamics of a new bow shock wave and setting a stationary flow mode. The new bow shock is moving to the left accompanied by another shock, which is the remainder part of the source shock wave (t = 0.9–0.94). Then, it stops and begins to move towards the body (t = 0.94–1.0). The area of compressed gas near the front surface gradually decreases and disappears. Finally, flow returns to the initial steady state (t = 1.2–1.6).
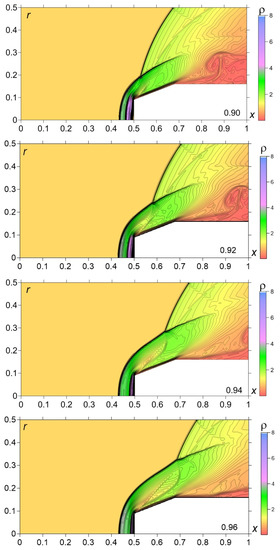
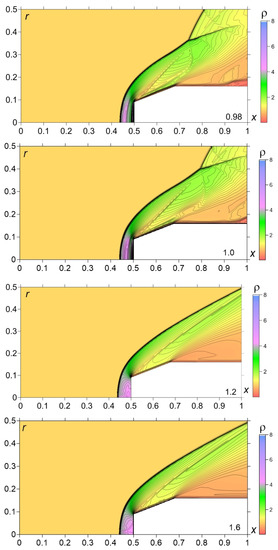
Figure 9.
Final stage of energy source-shock layer interaction dynamics.
It should be noted that the separation of the process at stages is conditional and reflects qualitatively ongoing processes and new details forming during these stages.
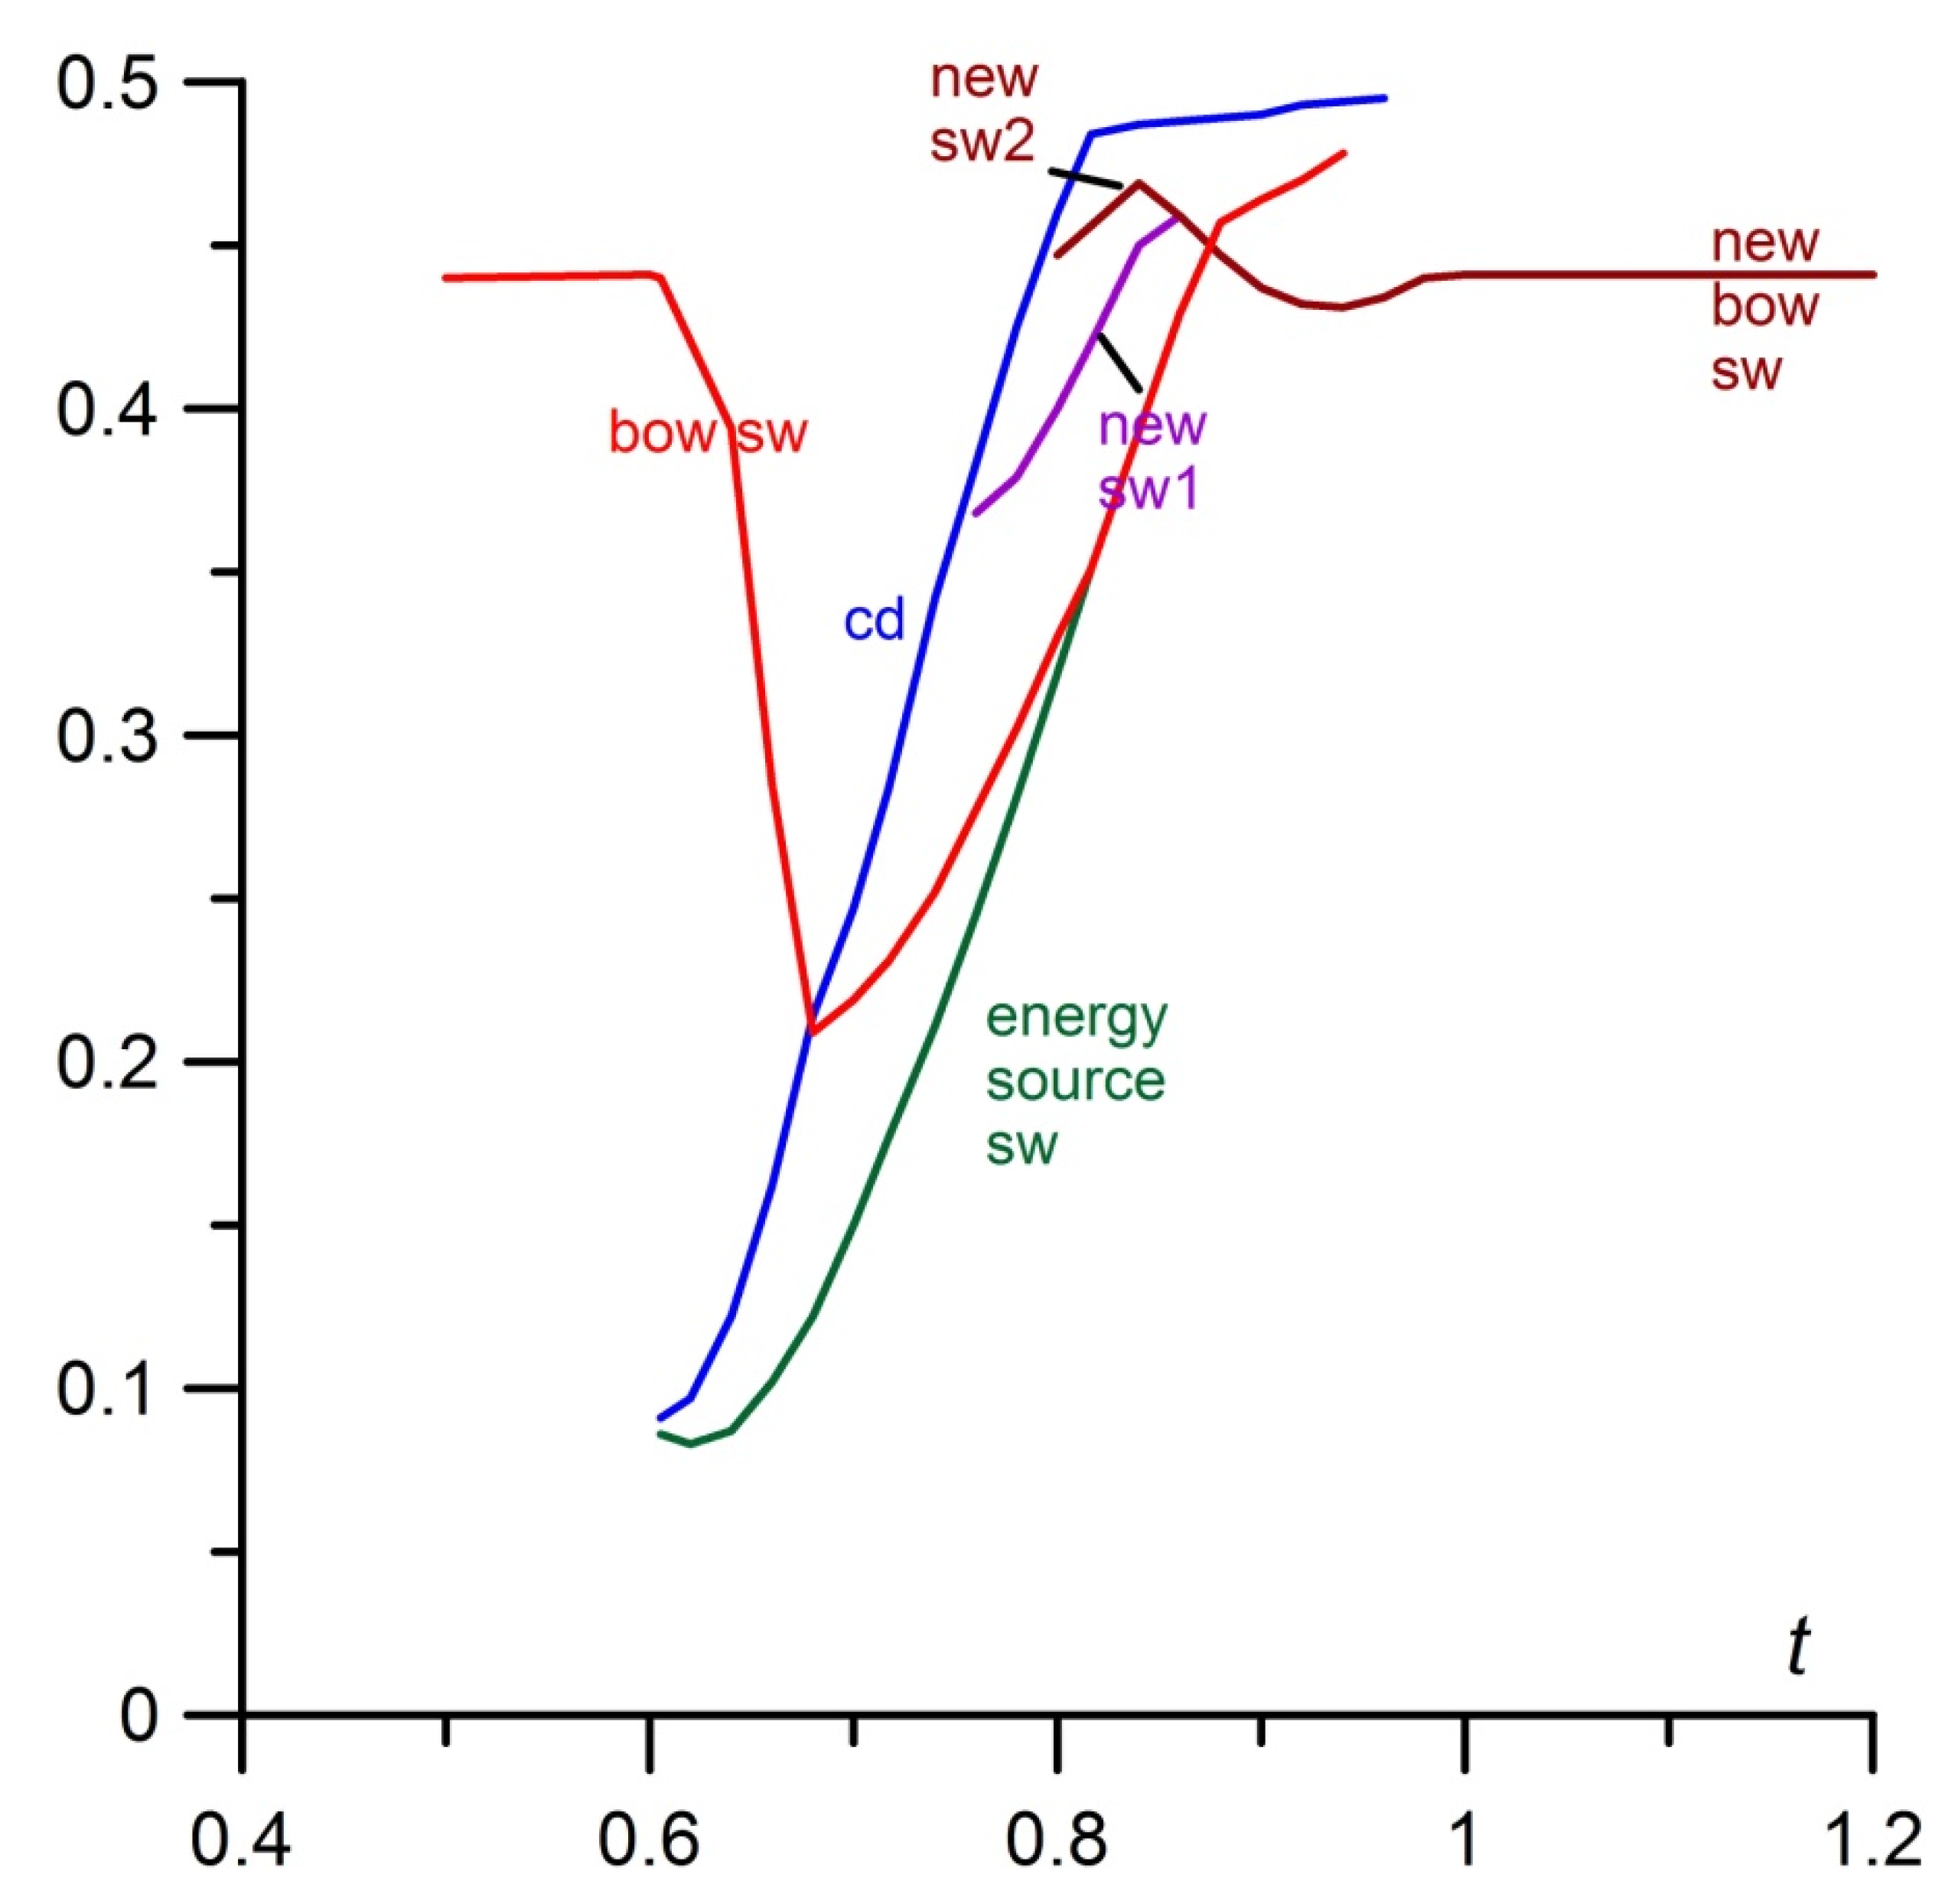
The trajectories of the main resultant shocks are presented in Figure 10. It should be noted that the considered interactions are complicated and characterized by multiple generations of additional shock waves and discontinuities. In this situation, it is not entirely clear which shock wave has to be considered as the bow shock wave (since the leftmost wave is the blast wave). We consider a bow shock wave to be a shock wave that occurs as a result of forming or a fusion with the main initial bow wave (and has the form of a bow shock wave).
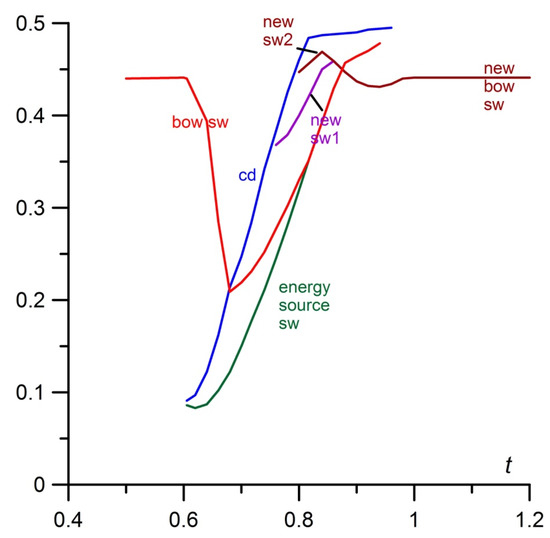
Figure 10.
Dynamics of shock waves during energy source-shock layer interaction, pi = 33.212.
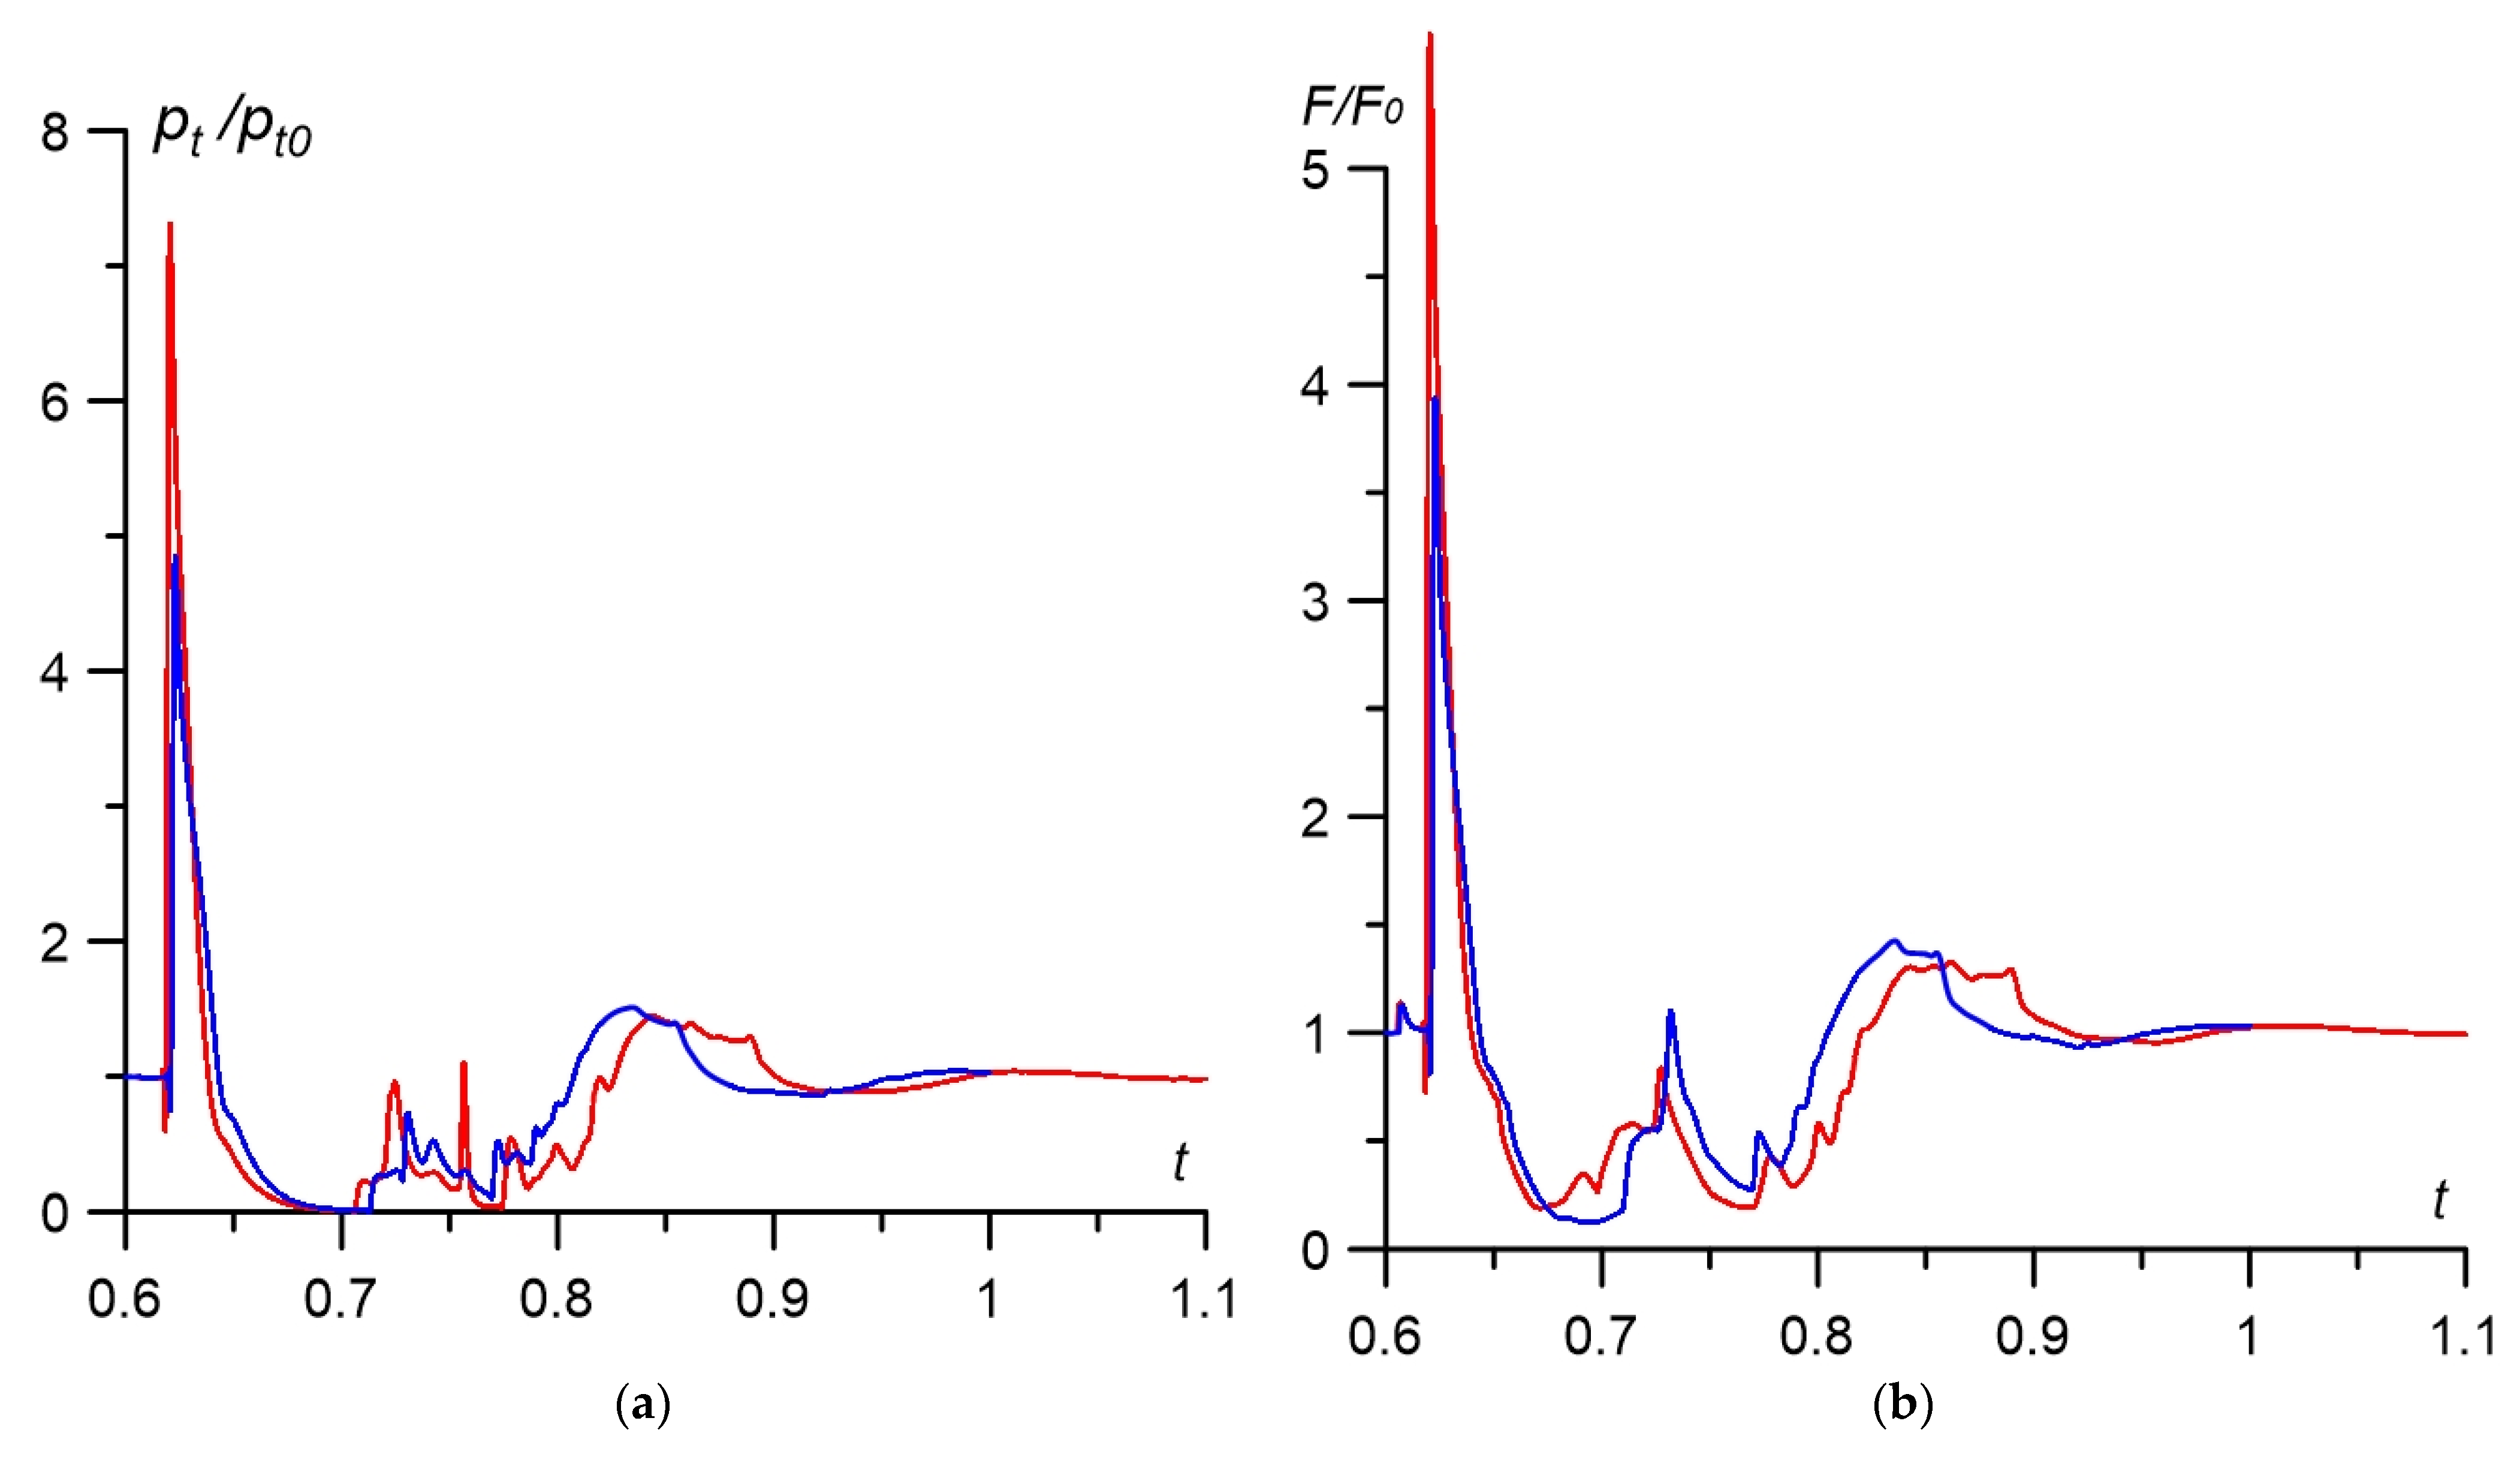
The impact of the energy deposition is a reason for the essential front drag force reduction that occurs simultaneously with the movement of the bow shock away from the body. Figure 11 shows the dynamics of the relative stagnation pressure (Figure 11a) and the relative frontal drag force F/F0 (Figure 11b) for two values of pressure in the energy source. Here, we have the following:
where pG and rG are the pressure value at the point with rG—coordinate at the frontal and conical parts of the body’s boundary, and R is the radius of the cylinder part of the body. F0 in Figure 11b is the value of F without energy deposition.
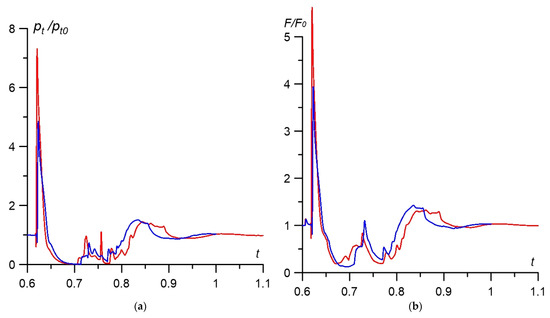
Figure 11.
Dynamics of relative stagnation pressure (a) and relative front surface drag force (b) during energy source-shock layer interaction: red curve—pi = 33.212 (η = 0.07), blue curve—pi = 19.407 (η = 0.04).
The first pick of the pressure (and drag force) reflects the impact of the source blast shock wave on the bow shock; the following decreasing front drag force is caused by the action of the heated gas area [22]. It can be observed that due to the action of the heated gas area, a significant local frontal drag force reduction (up to 80%) occurs (here min(F/F0) = 0.189385, t = 0.67). This is caused by the action of the central heated zone’s impact upon the body front surface (see Figure 7). At this time, the local stagnation pressure decrease according to the Euler approach used in the simulations is more than 90% (Figure 11a).
In Figure 11a,b the relative stagnation pressure and frontal drag force are also presented for initial pressures in the energy source pi = 19.407 (η = 0.04) when only 4% of the discharge energy has been spent on gas expansion. Nevertheless, it can be observed that the stagnation pressure drop and drag force reductions are significant as well.
4. Discussion
It should be underlined that the simulations based upon the Euler system of equations with the use of the instant explosion as the model of an energy deposition provide only a qualitative understanding of the considered phenomena. Additionally, in the experiment, the heated area is of a pulsing nature in time, which can be connected with complicated plasma processes needed to be described by using a non-equilibrium approach. Moreover, the time for the formation of the plasma area is not registered in the experiment.
Nevertheless, the qualitative flow features obtained in the conducted simulations are in agreement with the experimental results:
- Steady flow with the close values of numerical and experimental standoff of the bow shock wave and the close numerical and experimental shapes of the bow shock waves were obtained (Figure 6).
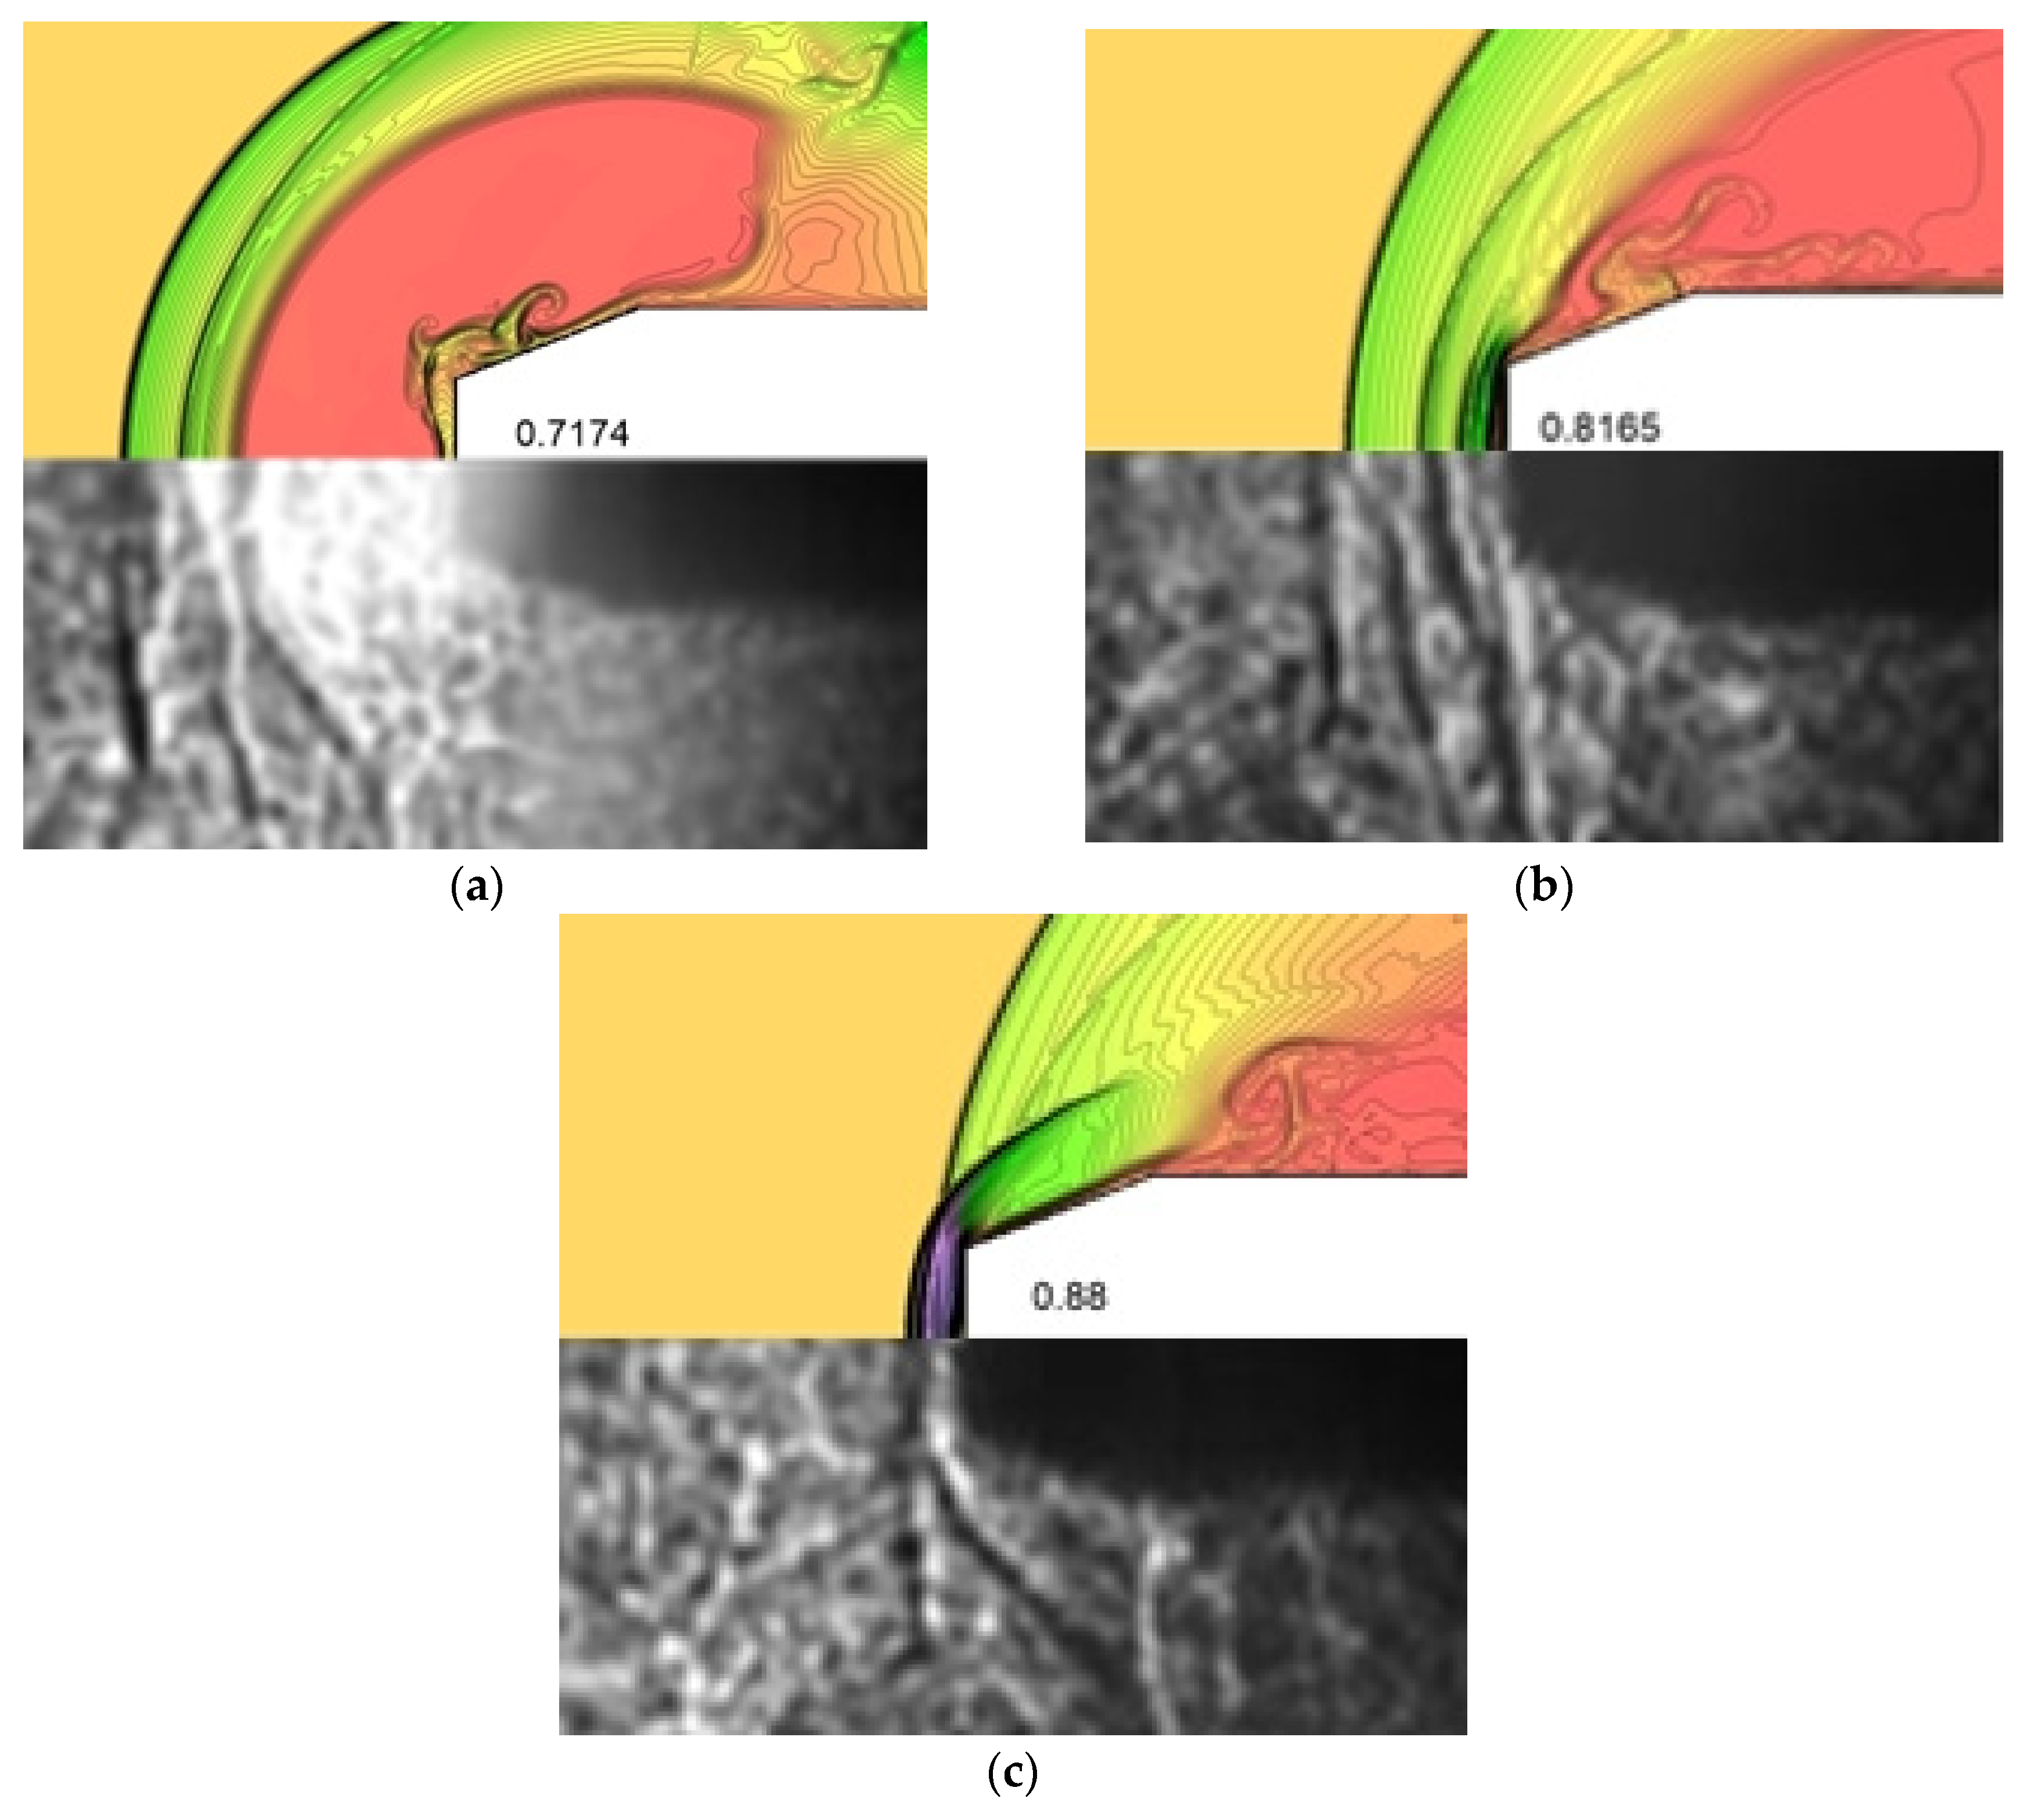
- The generation of three shocks (two shock waves and a contact discontinuity—a boundary of the heated area) in the region between the left part of the source shock wave and the body at the initial and middle stages of the interaction has been obtained numerically and recorded at the schlieren pictures (Figure 3c vs. flow image in Figure 7 for t = 0.7174) (Figure 12a).
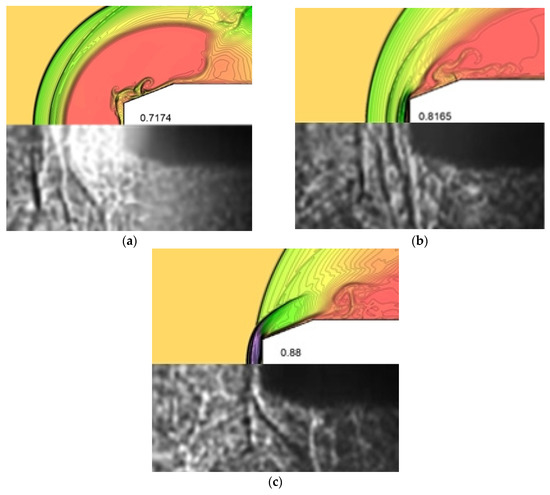 Figure 12. Qualitative agreement of numerical and experimental flow patterns. (a) t = 0.7174; (b) t = 0.8165; (c) t = 0.88.
 - The formation of a new bow shock from this shock wave which is accompanied by the pulsation of this new bow shock (during the steady flow establishing at the final stage of the interaction). This result can be observed in the experimental flow images (Figure 3e–g) and in the numerical flow patterns in Figure 8 and Figure 9 for t = 0.86–1.2 (Figure 12c, t = 0.88).
It should be noted that in this paper we chose such a degree of depth of analysis of the generation and dynamics of the discontinuities (shock waves and contact discontinuities), which allowed us to draw a diagram of discontinuities (Figure 10). This construction essentially was the purpose of this work. Straightly speaking, the generation of discontinuities is associated with the solution in the local domain of the corresponding (two-dimensional) Riemann problems of the decay of an arbitrary discontinuity. Drag change reflects the dynamics of the generation and the dynamics of the discontinuities. Therefore, the considerations stated above also apply to the dynamics of the drag force.
5. Conclusions
High speed flow schlieren images have been obtained experimentally for the process of the impact of the plasma area (plasmoid) on the supersonic layer past a body “blunt cone-cylinder” at Mach number 3.1. The images showed that the bow shock wave standoff on the axis of symmetry increases significantly upwards, as long as the diameter of the plasma formation. The dynamics of a complicated shock wave structure, which could include up to three additional shock waves being generated, resulting from the impact of the plasma zone have been visualized. This flow structure includes a series of new shock waves and new bow shock formation after the plasmoid action.
Numerical simulations on the base of the Euler system of equations have been conducted. The model of an energy release as an instant explosion in a gas was used. The simulations provided the qualitative understanding of the considered phenomena and showed sufficient agreement between the numerical flow patterns and the experimental shadow images. In the simulations, a steady flow with the shape of the bow shock wave and the value of its standoff close to the experimental ones were obtained. The generation of up to three shock waves and a contact discontinuity in the region between the left fragment of the blast shock wave and the body at the initial and middle stages of the interaction was predicted numerically; it is in agreement with the experimental images. The calculated numerical series for the other shock waves were also experimentally visualized. The formation of a new bow shock, accompanied by its pulsation, can be observed both in numerical flow patterns and in the experimental flow images. Additionally, it was observed that, due to the action of the heated gas area, a significant local stagnation pressure decrease and local frontal drag force reduction (up to 80%) occurred. In the future, the consideration of chemical reactions relative to the model of plasma formation is planned to be included.
Author Contributions
Conceptualization—I.Z.; formal analysis—I.Z., V.C. and O.A.; software—O.A.; visualization—I.Z., V.C. and O.A.; writing—original draft—I.Z. and O.A. All authors have read and agreed to the published version of the manuscript.
Funding
This research received no external funding.
Acknowledgments
The study was partly carried out within the framework of the Development Program of the Interdisciplinary Scientific and Educational School of Moscow State University “Photonic and Quantum Technologies: Digital Medicine”.
Conflicts of Interest
The authors declare no conflict of interest.
Nomenclature
| M | freestream Mach number |
| γ | ratio of specific heats |
| p∞, ρ∞, u∞, v∞ | freestream pressure, density and velocity components |
| R | diameter of a cylinder part of a body |
| ti | time moment of an energy source arising |
| pi | pressure in an energy source |
| ri | radius of an energy source |
| x0 | distance between the center of an energy source and a frontal surface of a body |
| η | part of the discharge energy spent to the expansion of a gas |
| pG, rG | pressure and r-coordinate at the body’s boundary |
| SW | shock wave |
| CD | contact discontinuity |
References
- Knight, D.D. Energy Deposition for High-Speed Flow Control; Cambridge University Press: Cambridge, UK, 2019; 450p. [Google Scholar] [CrossRef]
- Knight, D. Survey of aerodynamic drag reduction at high speed by energy deposition. J. Propuls. Power. 2008, 24, 1153–1167. [Google Scholar] [CrossRef]
- Russell, A.; Zare-Behtash, H.; Kontis, K. Joule heating flow control methods for high-speed flows. J. Electrost. 2016, 80, 34–68. [Google Scholar] [CrossRef] [Green Version]
- Leonov, S.B. Review of plasma-based methods for high-speed flow control. In Proceedings of the Sixth International Conference on Fluid Mechanics AIP Conference Proceedings, Guangzhou, China, 30 June–3 July 2011; Volume 1376, pp. 498–502. [Google Scholar] [CrossRef]
- Starikovskiy, A.Y.; Aleksandrov, N.L. Gasdynamic flow control by ultrafast local heating in a strongly nonequilibrium pulsed plasma. Plasma Phys. Rep. 2021, 47, 148–209. [Google Scholar] [CrossRef]
- Ahmed, M.Y.; Qin, N. Forebody shock control devices for drag and aero-heating reduction: A comprehensive survey with a practical perspective. Prog. Aerosp. Sci. 2020, 112, 100585. [Google Scholar] [CrossRef]
- Shneider, M.N.; Macheret, S.O.; Zaidi, S.H.; Girgis, I.G.; Miles, R.B. Virtual Shapes in Supersonic Flow Control with Energy Addition. J. Propuls. Power 2008, 24, 900–915. [Google Scholar] [CrossRef]
- Georgievsky, P.Y.; Levin, V.A. Supersonic flow over bodies in the presence of external energy input. Pis’ma Zhurnal Tekh. Fiziki. 1988, 14, 684–687. (In Russian) [Google Scholar]
- Artem’ev, V.I.; Bergel’son, V.I.; Nemchinov, I.V.; Orlova, T.I.; Smirnov, V.A.; Hazins, V.M. Changing the regime of supersonic streamlining obstacles via raising the thin channel of low density. Izv. Akad. Nauk SSSR Meh. Židk. Gaza. 1989, 5, 146–151. (In Russian) [Google Scholar]
- Nemchinov, I.V.; Artem’ev, V.I.; Bergel’son, V.I.; Hazins, V.M.; Orlova, T.I.; Rybakov, V.A. Rearrangement of the bow shock shape using a “hot spike”. Shock. Waves 1994, 4, 35–40. [Google Scholar] [CrossRef]
- Riggins, D.; Nelson, H.; Johnson, E. Blunt-body wave drag reduction using focused energy deposition. AIAA J. 1999, 37, 460–467. [Google Scholar] [CrossRef]
- Miles, R.B. Flow Control by Energy Addition into High-Speed Air. In Proceedings of the 38th AIAA Aerospace Sciences Meeting and Exhibit, AIAA, Denver, CO, USA, 19 June–22 June 2000; pp. 1–14, Paper AIAA-2000-2324. [Google Scholar]
- Kolesnichenko, Y.F.; Brovkin, V.G.; Azarova, O.A.; Grudnitsky, V.G.; Lashkov, V.A.; Mashek, I.C. Microwave energy release regimes for drag reduction in supersonic flows. In Proceedings of the 40th AIAA Aerospace Sciences Meeting & Exhibit, Reno, NV, USA, 14 January–17 January 2002; pp. 1–12, Paper AIAA-2002-0353. [Google Scholar]
- Knight, D.D.; Kolesnichenko, Y.F.; Brovkin, V.G.; Khmara, D.; Lashkov, A.V.; Mashek, I.C. Interaction of microwave-generated plasma with a hemisphere cylinder at Mach 2.1. AIAA J. 2009, 47, 2996–3010. [Google Scholar] [CrossRef]
- Knight, D.D.; Kolesnichenko, Y.F.; Brovkin, V.G.; Khmara, D.; Lashkov, A.V.; Mashek, I.C. Interaction of microwave-generated plasma with hemisphere-cone-cylinder. In Proceedings of the 48th AIAA Aerospace Sciences Meeting Including the New Horizons Forum and Aerospace Exposition, Orlando, FL, USA, 4 January 2010–7 January 2010; pp. 1–16, Paper AIAA-2010-1005. [Google Scholar]
- Azarova, O.A.; Knight, D.D. Numerical prediction of dynamics of microwave filament interaction with supersonic combined cylinder bodies. In Proceedings of the 53rd AIAA Aerospace Sciences Meeting, Kissimmee, FL, USA, 5–9 January 2015; pp. 1–12, Paper AIAA-2015-0581. [Google Scholar]
- Myrabo, L.N.; Raizer, Y.P. Laser-induced air spike for advanced transatmospheric vehicles. In Proceedings of the 25th Plasmadynamics and Lasers Conference, Colorado Springs, CO, USA, 20 June–23 June 1994. Paper AIAA-1994-2451. [Google Scholar]
- Tretyakov, P.K.; Fomin, V.M.; Yakovlev, V.I. New principles of control of aerophysical processes—research development. In Proceedings of the International Conference on the Methods Aerophysical Research, Novosibirsk, Russia, 29 June–3 July 1996; The Institute of Theoretical and Applied Mechanics: Novosibirsk, Russia, 1996; pp. 210–220. [Google Scholar]
- Adelgren, R.G.; Yan, H.; Elliott, G.S.; Knight, D.D.; Beutner, T.J.; Zheltovodov, A.A. Control of Edney IV interaction by pulsed laser energy deposition. AIAA J. 2005, 43, 256–269. [Google Scholar] [CrossRef]
- Zheltovodov, A.A.; Pimonov, E.A.; Knight, D.D. Energy deposition influence on supersonic flow over axisymmetric bodies. In Proceedings of the 45th AIAA Aerospace Sciences Meeting and Exhibit, Reno, NV, USA, 8 January–11 January 2007; pp. 1–31, Paper AIAA-2007-1230. [Google Scholar]
- Mortazavi, M.; Knight, D.D.; Azarova, O.A.; Shi, J.; Yan, H. Numerical simulation of energy deposition in a supersonic flow past a hemisphere. In Proceedings of the 52nd Aerospace Sciences Meeting, National Harbor, MD, USA, 13–17 January 2014; pp. 1–18, Paper AIAA-2014-0944. [Google Scholar]
- Azarova, O.A.; Knight, D.D. Interaction of microwave and laser discharge resulting “heat spots” with supersonic combined cylinder bodies. Aerosp. Sci. Technol. 2017, 43, 343–349. [Google Scholar] [CrossRef]
- Kim, S.; Lee, H.J. Influence of laser energy deposition conditions on the drag of a sphere in supersonic flow. Energies 2019, 16, 3914. [Google Scholar] [CrossRef] [Green Version]
- Alberti, A.; Munafo, A.; Pantano, C.; Panesi, M. Supersonic and hypersonic non-equilibrium flow control using laser energy deposition. In Proceedings of the AIAA Aviation 2019 Forum, Dallas, TX, USA, 17–21 June 2019; pp. 1–27, Paper AIAA 2019-2867. [Google Scholar]
- Lapushkina, T.A.; Erofeev, A.V. Supersonic flow control via plasma, electric and magnetic impacts. Aerosp. Sci. Technol. 2017, 69, 313–320. [Google Scholar] [CrossRef]
- Znamenskaya, I.A.; Naumov, D.S.; Sysoev, N.N.; Chernikov, V.A. Analysis of dynamic processes occurring during generation of plasmoid formations in a supersonic flow. Tech. Phys. 2019, 64, 802–806. [Google Scholar] [CrossRef]
- Azarova, O.A.; Gvozdeva, L.G. Control of triple-shock configurations in high speed flows over a cylindrically blunted plate in gases at different Mach numbers. Proc. Inst. Mech. Eng. Part G J. Aerosp. Eng. 2018. [Google Scholar] [CrossRef]
- Azarova, O.A.; Gvozdeva, L.G. Control of triple-shock configurations and vortex structures forming in high speed flows of gaseous media past AD body under the action of external energy sources. Aerospace 2017, 4, 9. [Google Scholar] [CrossRef] [Green Version]
- Azarova, O.A. Complex conservative difference schemes for computing supersonic flows past simple aerodynamic forms. Comput. Math. Math. Phys. 2015, 55, 2025–2049. [Google Scholar] [CrossRef]
Publisher’s Note: MDPI stays neutral with regard to jurisdictional claims in published maps and institutional affiliations. |
© 2021 by the authors. Licensee MDPI, Basel, Switzerland. This article is an open access article distributed under the terms and conditions of the Creative Commons Attribution (CC BY) license (https://creativecommons.org/licenses/by/4.0/).

