Pipeline Condition Assessment by Instantaneous Frequency Response over Hydroinformatics Based Technique—An Experimental and Field Analysis
Abstract
1. Introduction
2. Modification of Hilbert Huang Transform and Normalized Integrated Kurtosis Algorithm for Z-Notch Filter Technique as Analysis Technique
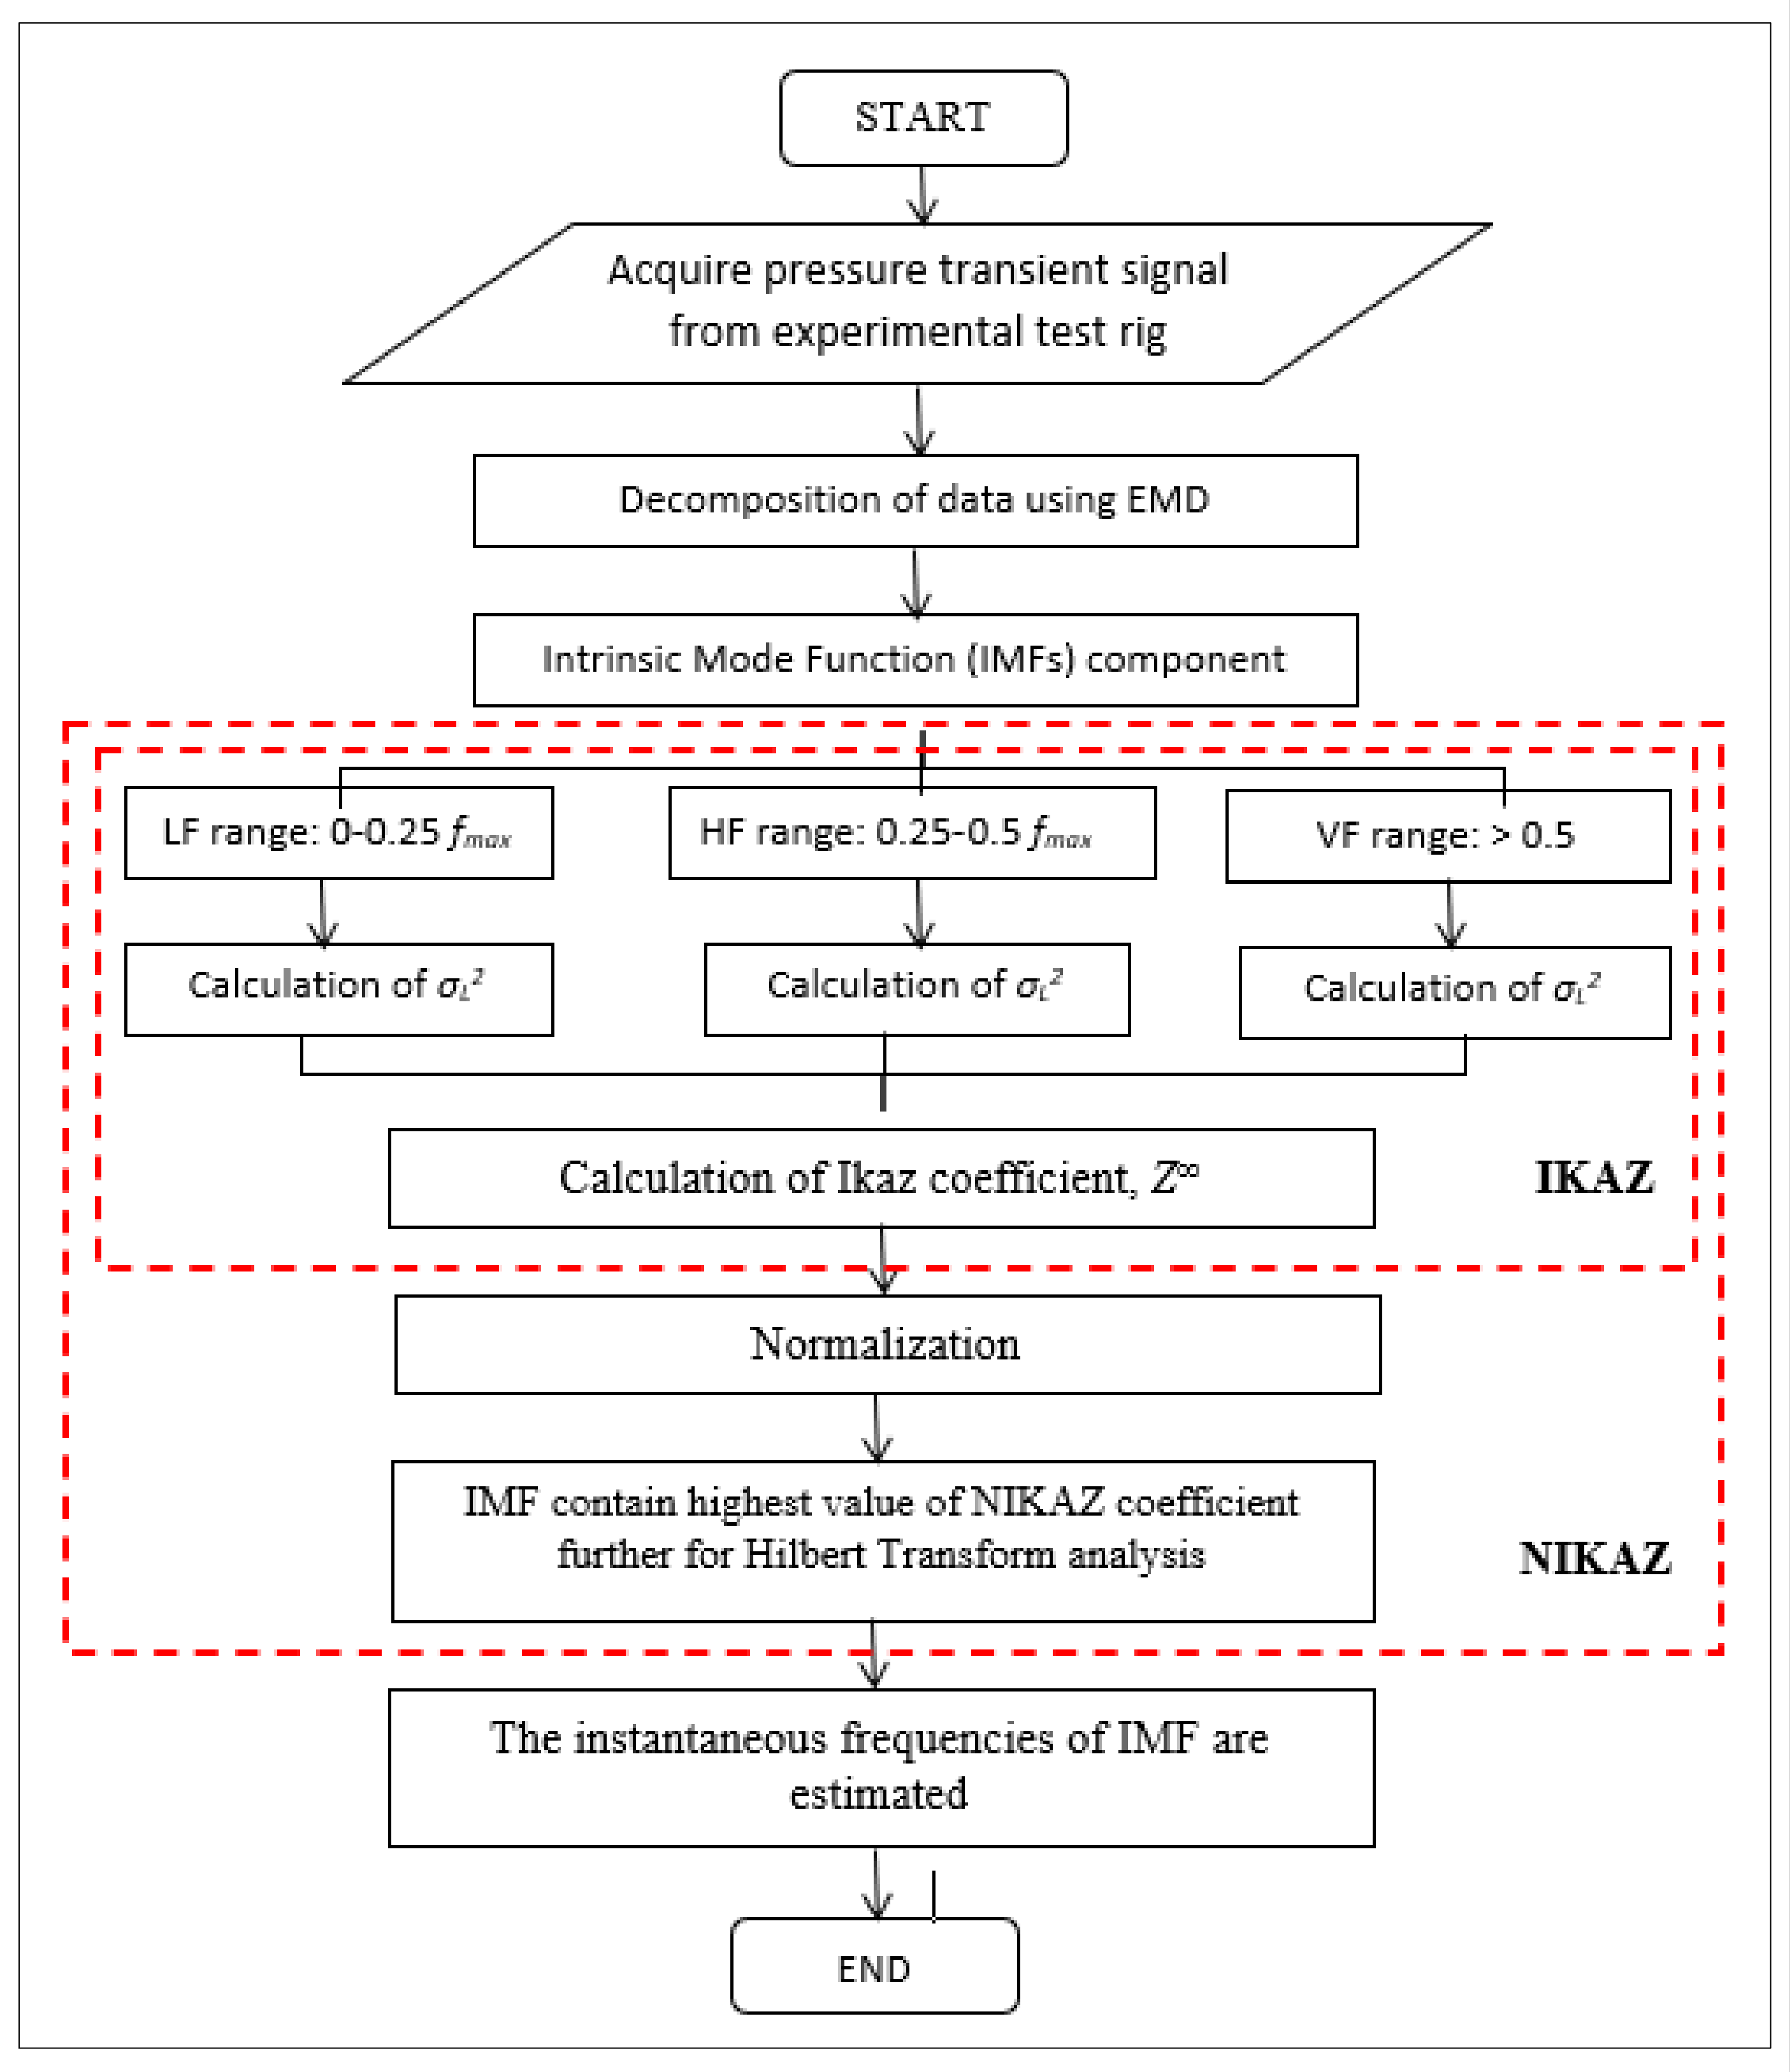
2.1. The Proposed Method
2.2. Empirical Mode Decomposition
- (a)
- The number of extrema and zero-crossing numbers shall be equal or only a difference of one may be permitted.
- (b)
- The means should at any point be equal to zero between the local total envelope and local minimum envelope.
- (c)
- This description is aimed at ensuring that each IMF has a significant instant frequency. With the definition, a signal x(t) EMD algorithm goes as follows [14]:
- (d)
- The x(t) from the given signal was defined for all local extremes, then bound to the top envelope by cubic splines. To find minima 1(b), the procedure has been repeatedly calculated.
- (e)
- (f)
- Detailed information, d(t) as an IMF, d(t) = x(t) − m(t).
- (g)
- The iteration on residual m(t) until the residual data is too small, an interpretation that is residual becomes a monotonic function or a function with only one extremum from which no more IMF can be extracted. The remaining is the norm.
2.3. Hilbert Transform
3. Laboratory Authentication Set Up
4. Field Authentication Set up
5. Results and Discussion
5.1. Laboratory Authentication Results and Discussion
5.2. Field Authentication Results and Discussion Discussion
6. Conclusions
Author Contributions
Funding
Institutional Review Board Statement
Informed Consent Statement
Acknowledgments
Conflicts of Interest
References
- World Economic Forum. Water Crises Are a Top Global Risk; Circle of Blue: Traverse City, MI, USA, 2015. [Google Scholar]
- Lai, C. Unaccounted for water and the economics of leak detection. Water Supply 1991, 9, 4. [Google Scholar]
- Yusop, H.M.; Ghazali, M.; Azmi, W.; Yusof, M.; PiRemli, M.; Rahim, M. A Study of Ikaz and Normalized Hilbert transform for solving faulty in pipeline distribution system using transmission line modelling. In IOP Conference Series: Materials Science and Engineering; IOP Publishing: Bristol, UK, 2019. [Google Scholar]
- Yusop, H.M.; Ghazali, M.; Yusof, M.; Hamat, W. Improvement of Cepstrum Analysis for the Purpose to Detect Leak, Feature and Its Location in Water Distribution System based on Pressure Transient Analysis. J. Mech. Eng. 2017, 4, 103–122. [Google Scholar]
- Ghazali, M.; Beck, S.; Shucksmith, J.; Boxall, J.; Staszewski, W. Comparative study of instantaneous frequency based methods for leak detection in pipeline networks. Mech. Syst. Signal Process. 2012, 29, 187–200. [Google Scholar] [CrossRef]
- Taghvaei, M.; Beck, S.; Staszewski, W. Leak detection in pipelines using cepstrum analysis. Meas. Sci. Technol. 2006, 17, 367. [Google Scholar] [CrossRef]
- Lee, P.J.; Lambert, M.F.; Simpson, A.R.; Vítkovský, J.P.; Liggett, J. Experimental verification of the frequency response method for pipeline leak detection. J. Hydraul. Res. 2006, 44, 693–707. [Google Scholar] [CrossRef]
- Lee, P.J.; Duan, H.-F.; Ghidaoui, M.; Karney, B. Frequency domain analysis of pipe fluid transient behaviour. J. Hydraul. Res. 2013, 51, 609–622. [Google Scholar] [CrossRef]
- Yusop, H.M.; Ghazali, M.; Azmi, W.; Yusof, M.; Remli, M.P.; Noordin, M. Application of Ikaz and direct quadrature for solving leakage in pipeline distribution by using transmission line modelling. In IOP Conference Series: Materials Science and Engineering; IOP Publishing: Bristol, UK, 2019. [Google Scholar]
- Yusop, H.M.; Ghazali, M.; Yusof, M.; Remli, M.P.; Kamarulzaman, M. Pipe leak diagnostic using high frequency piezoelectric pressure sensor and automatic selection of intrinsic mode function. In IOP Conference Series: Materials Science and Engineering; IOP Publishing: Bristol, UK, 2017. [Google Scholar]
- Liou, C.P. Pipeline leak detection by impulse response extraction. J. Fluids Eng. 1998, 120, 833–838. [Google Scholar] [CrossRef]
- Ghazali, M.F. Leak Detection Using Instantaneous Frequency Analysis; University of Sheffield: Sheffield, UK, 2012. [Google Scholar]
- Stephens, M.L.; Simpson, A.R.; Lambert, M.F.; Vítkovský, J.; Nixon, J. The detection of pipeline blockages using transients in the field. In Proceedings of the South Australian Regional Confence, Perth, WA, Australia, 15–16 July 2002. [Google Scholar]
- Huang, N.E.; Shen, Z.; Long, S.R.; Wu, M.C.; Shih, H.H.; Zheng, Q.; Yen, N.-C.; Tung, C.C.; Liu, H.H. The empirical mode decomposition and the Hilbert spectrum for nonlinear and non-stationary time series analysis. In Proceedings of the Royal Society of London A: Mathematical, Physical and Engineering Sciences; The Royal Society: London, UK, 1998. [Google Scholar]
- Shi, C.-X.; Luo, Q.-F. Hilbert-Huang transform and wavelet analysis of time history signal. Acta Seismol. Sin. 2003, 16, 422–429. [Google Scholar] [CrossRef]
- Bin, G.; Gao, J.; Li, X.; Dhillon, B. Early fault diagnosis of rotating machinery based on wavelet packets—Empirical mode decomposition feature extraction and neural network. Mech. Syst. Signal Process. 2012, 27, 696–711. [Google Scholar] [CrossRef]
- Manjula, M.; Sarma, A. Comparison of empirical mode decomposition and wavelet based classification of power quality events. Energy Procedia 2012, 14, 1156–1162. [Google Scholar] [CrossRef][Green Version]
- Ricci, R.; Pennacchi, P. Diagnostics of gear faults based on EMD and automatic selection of intrinsic mode functions. Mech. Syst. Signal Process. 2011, 25, 821–838. [Google Scholar] [CrossRef]
- Maji, U.; Mitra, M.; Pal, S. Automatic Detection of Atrial Fibrillation Using Empirical Mode Decomposition and Statistical Approach. Procedia Technol. 2013, 10, 45–52. [Google Scholar] [CrossRef]
- Kedadouche, M.; Thomas, M.; Tahan, A. Monitoring machines by using a hybrid method combining MED, EMD, and TKEO. Adv. Acoust. Vib. 2014, 2014, 592080. [Google Scholar] [CrossRef]
- De Souza, D.B.; Chanussot, J.; Favre, A.-C. On selecting relevant intrinsic mode functions in empirical mode decomposition: An energy-based approach. In Proceedings of the 2014 IEEE International Conference on Acoustics, Speech and Signal Processing (ICASSP), Florence, Italy, 4–9 May 2014. [Google Scholar]
- Nuawi, M.Z.; Nor, M.J.M.; Jamaludin, N.; Abdullah, S.; Lamin, F.; Nizwan, C. Development of integrated kurtosis-based algorithm for z-filter technique. J. Appl. Sci. 2008, 8, 1541–1547. [Google Scholar] [CrossRef][Green Version]
- Rizal, M.; Ghani, J.A.; Nuawi, M.Z.; Haron, C.H.C. A Comparative Study of I-kaz Based Signal Analysis Techniques: Application to Detect Tool Wear during Turning Process. J. Teknol. 2013, 66. [Google Scholar] [CrossRef][Green Version]
- Rizal, M.; Ghani, J.A.; Nuawi, M.Z.; Haron, C.H.C. The application of I-kazTM-based method for tool wear monitoring using cutting force signal. Procedia Eng. 2013, 68, 461–468. [Google Scholar] [CrossRef]
- Rilling, G.; Flandrin, P.; Goncalves, P. On empirical mode decomposition and its algorithms. In Proceedings of the IEEE-EURASIP Workshop on Nonlinear Signal and Image Processing NSIP-03, Grado, Italy, 8–11 June 2003. [Google Scholar]
- Hassan, H.H. Empirical mode decomposition (EMD) of potential field data: Airborne gravity data as an example. In SEG Technical Program Expanded Abstracts 2005; Society of Exploration Geophysicists: Tulsa, OK, USA, 2005; pp. 704–706. [Google Scholar]
- Daubechies, I. Ten Lectures on Wavelets; SIAM: Philadelphia, PA, USA, 1992; Volume 61. [Google Scholar]
- DiScala, M.; Abadi, D.J. Automatic generation of normalized relational schemas from nested key-value data. In Proceedings of the 2016 International Conference on Management of Data, San Francisco, CA, USA, 26 June–1 July 2016. [Google Scholar]
- Craig, A.; Cloarec, O.; Holmes, E.; Nicholson, J.K.; Lindon, J.C. Scaling and normalization effects in NMR spectroscopic metabonomic data sets. Anal. Chem. 2006, 78, 2262–2267. [Google Scholar] [CrossRef] [PubMed]
- Boashash, B. Estimating and interpreting the instantaneous frequency of a signal. I. Fundamentals. Proc. IEEE 1992, 80, 520–538. [Google Scholar]
- Isenmann, G.; Bellahcen, S.; Vazquez, J.; Dufresne, M.; Joannis, C.; Mose, R. Stage—Discharge relationship for a pipe overflow structure in both free and submerged flow. Eng. Appl. Comput. Fluid Mech. 2016, 10, 283–295. [Google Scholar] [CrossRef]
- Nguyen, S.T.N.; Gong, J.; Lambert, M.F.; Zecchin, A.C.; Simpson, A.R. Least squares deconvolution for leak detection with a pseudo random binary sequence excitation. Mech. Syst. Signal Process. 2018, 99, 846–858. [Google Scholar] [CrossRef]
- Ghazali, M.; Staszewski, W.; Shucksmith, J.; Boxall, J.; Beck, S. Instantaneous phase and frequency for the detection of leaks and features in a pipeline system. Struct. Health Monit. 2011, 10, 351–360. [Google Scholar] [CrossRef]


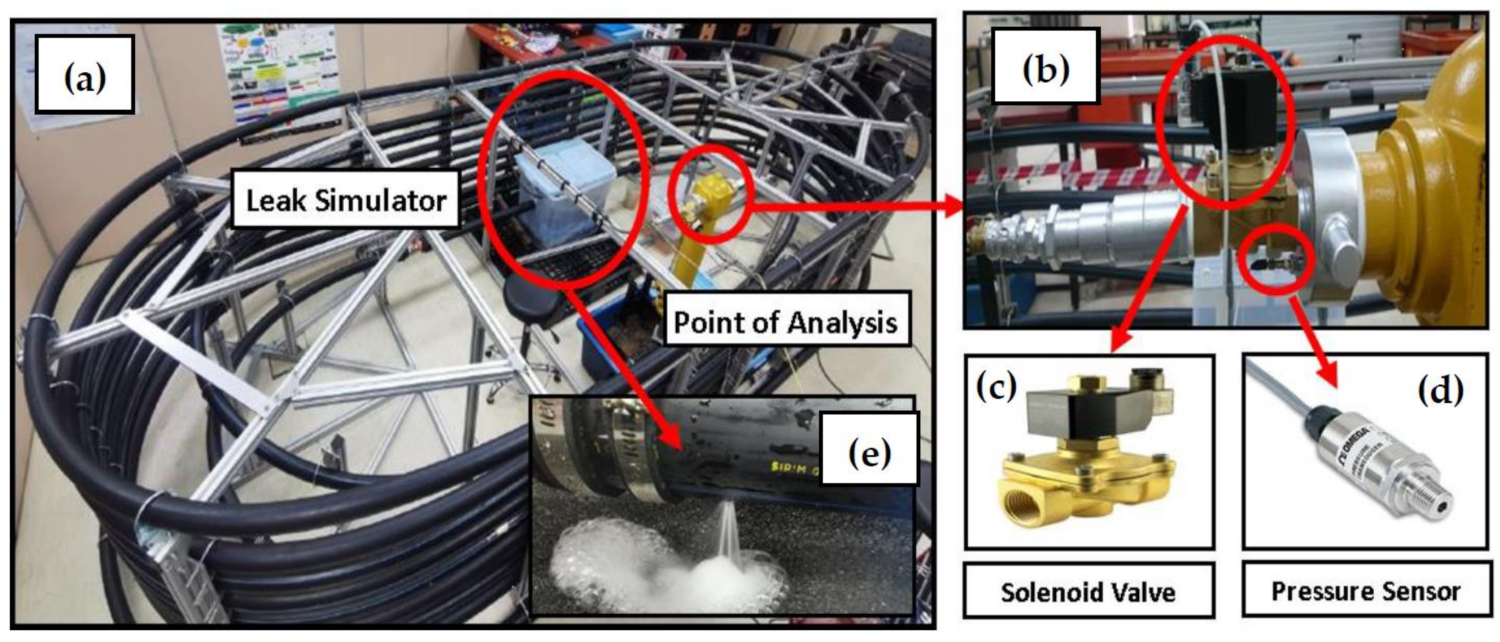








| Device/Hardware | Brand | Model | Sensitivity |
|---|---|---|---|
| Solenoid Valve | Sanlixin | SLA Series | 0.5–25 bar |
| Pressure Sensor | PCB Piezoelectronic | 113B27 | 7.25 mV/kPa |
| Acquisition Hardware | NationalIntrument | NI 9234 | AI, ±5 V, 24 Bit, 51.2 kS/s/ch Simultaneous, AC/DC |
| Type of Leak | Pipe Feature | Measured Position (m) | IMF Highest NIKAZ Coefficient | Corresponding Analyzed Position (m) | Mean Error % |
|---|---|---|---|---|---|
| No Leak | Hole | - | 6 | - | - |
| Outlet | 39.8 | 38.34 | 3.66 | ||
| 1 mm circular hole | Hole | 19.7 | 5 | 18.5 | 5.09 |
| Outlet | 39.8 | 39.23 | 1.43 | ||
| 3 mm circular hole | Hole | 19.7 | 6 | 19.58 | 0.61 |
| Outlet | 39.8 | 39.55 | 0.83 | ||
| 5 mm circular hole | Hole | 19.7 | 6 | 21.31 | 7.55 |
| Outlet | 39.8 | 40.85 | 2.64 | ||
| Horizontal crack | Hole | 19.7 | 6 | 19.14 | 2.84 |
| Outlet | 39.8 | 40.84 | 2.61 |
| Type of Leak | Pipe Feature | Measured Position (m) | IMF Highest NIKAZ Coefficient | Corresponding Analyzed Position (m) | Mean Error % |
|---|---|---|---|---|---|
| No Leak | Hole | - | 6 | - | - |
| Outlet | 39.8 | 41.08 | 3.21 | ||
| 1 mm circular hole | Hole | 19.7 | 5 | 21.18 | 7.51 |
| Outlet | 39.8 | 37.18 | 6.50 | ||
| 3 mm circular hole | Hole | 19.7 | 6 | 18.24 | 7.41 |
| Outlet | 39.8 | 39.49 | 0.77 | ||
| 5 mm circular hole | Hole | 19.7 | 6 | 18.71 | 4.06 |
| Outlet | 39.8 | 40.70 | 0.67 | ||
| Horizontal crack | Hole | 19.7 | 6 | 19.39 | 1.57 |
| Outlet | 39.8 | 40.32 | 1.31 |
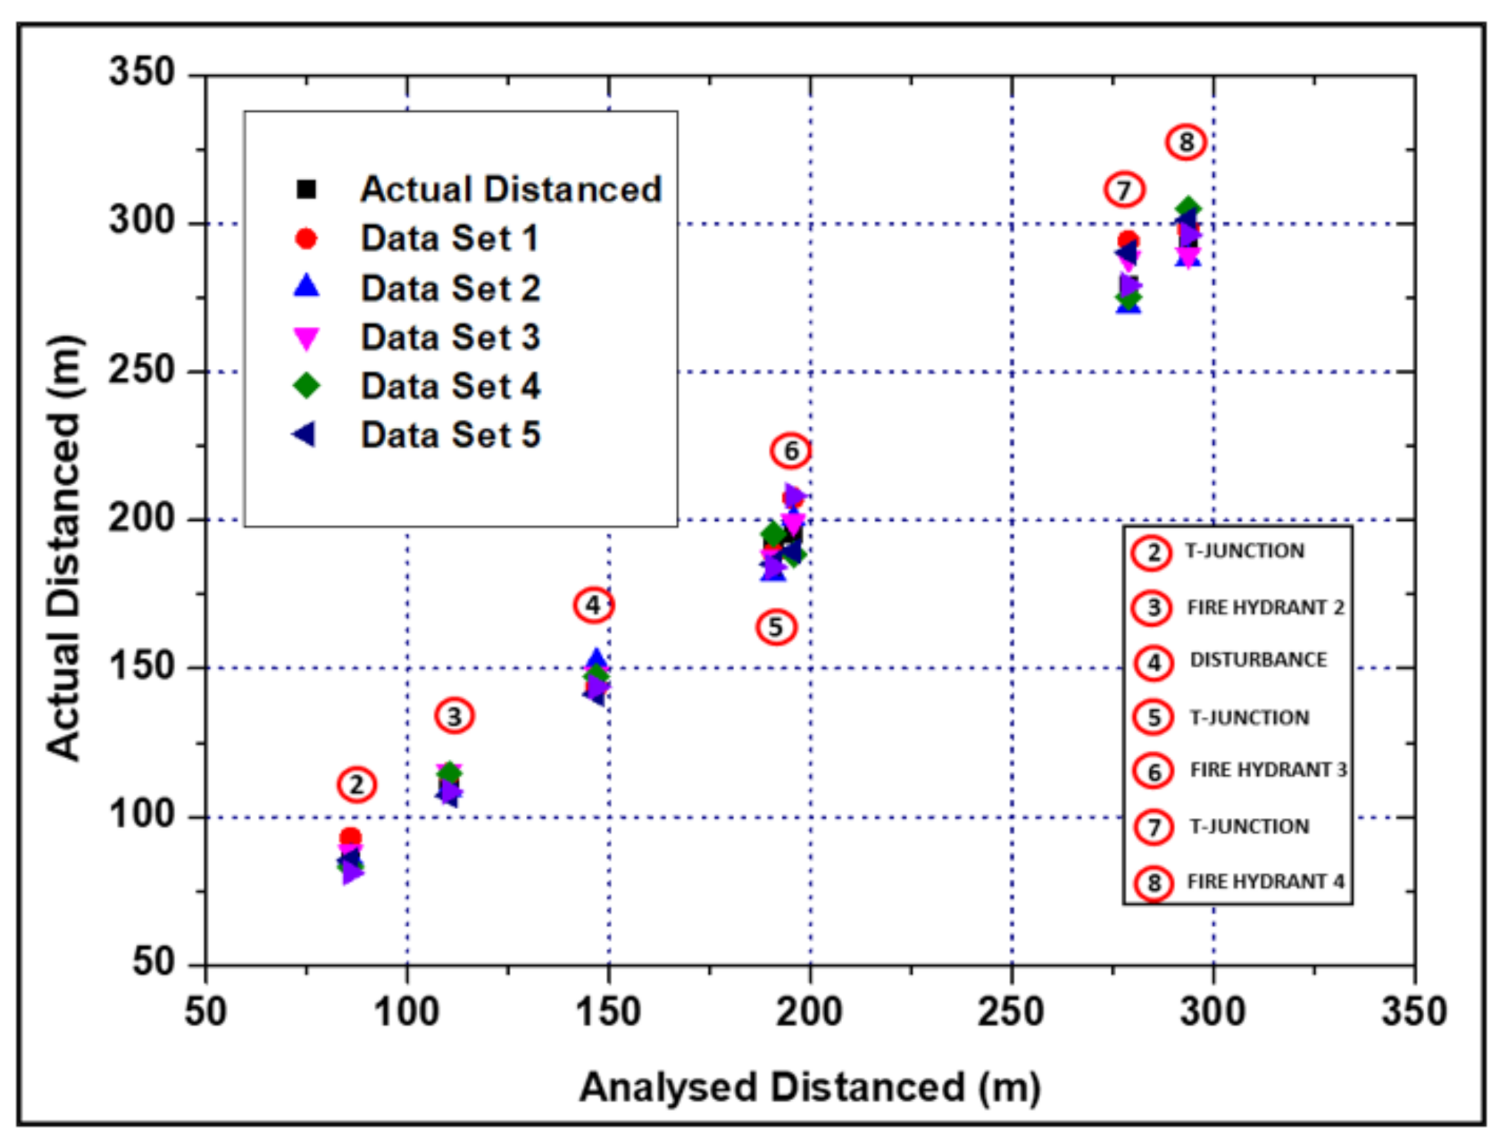
| No. | Type of Pipe Features | Distance from Blueprint (m) | Analysed Distanced (m) | Mean Error (%) | |||||
|---|---|---|---|---|---|---|---|---|---|
| Data Set 1 | Data Set 2 | Data Set 3 | Data Set 4 | Data Set 5 | Data Set 6 | ||||
| 1 | Point of analysis (Fire Hydrant 1) | - | - | - | - | - | - | - | - |
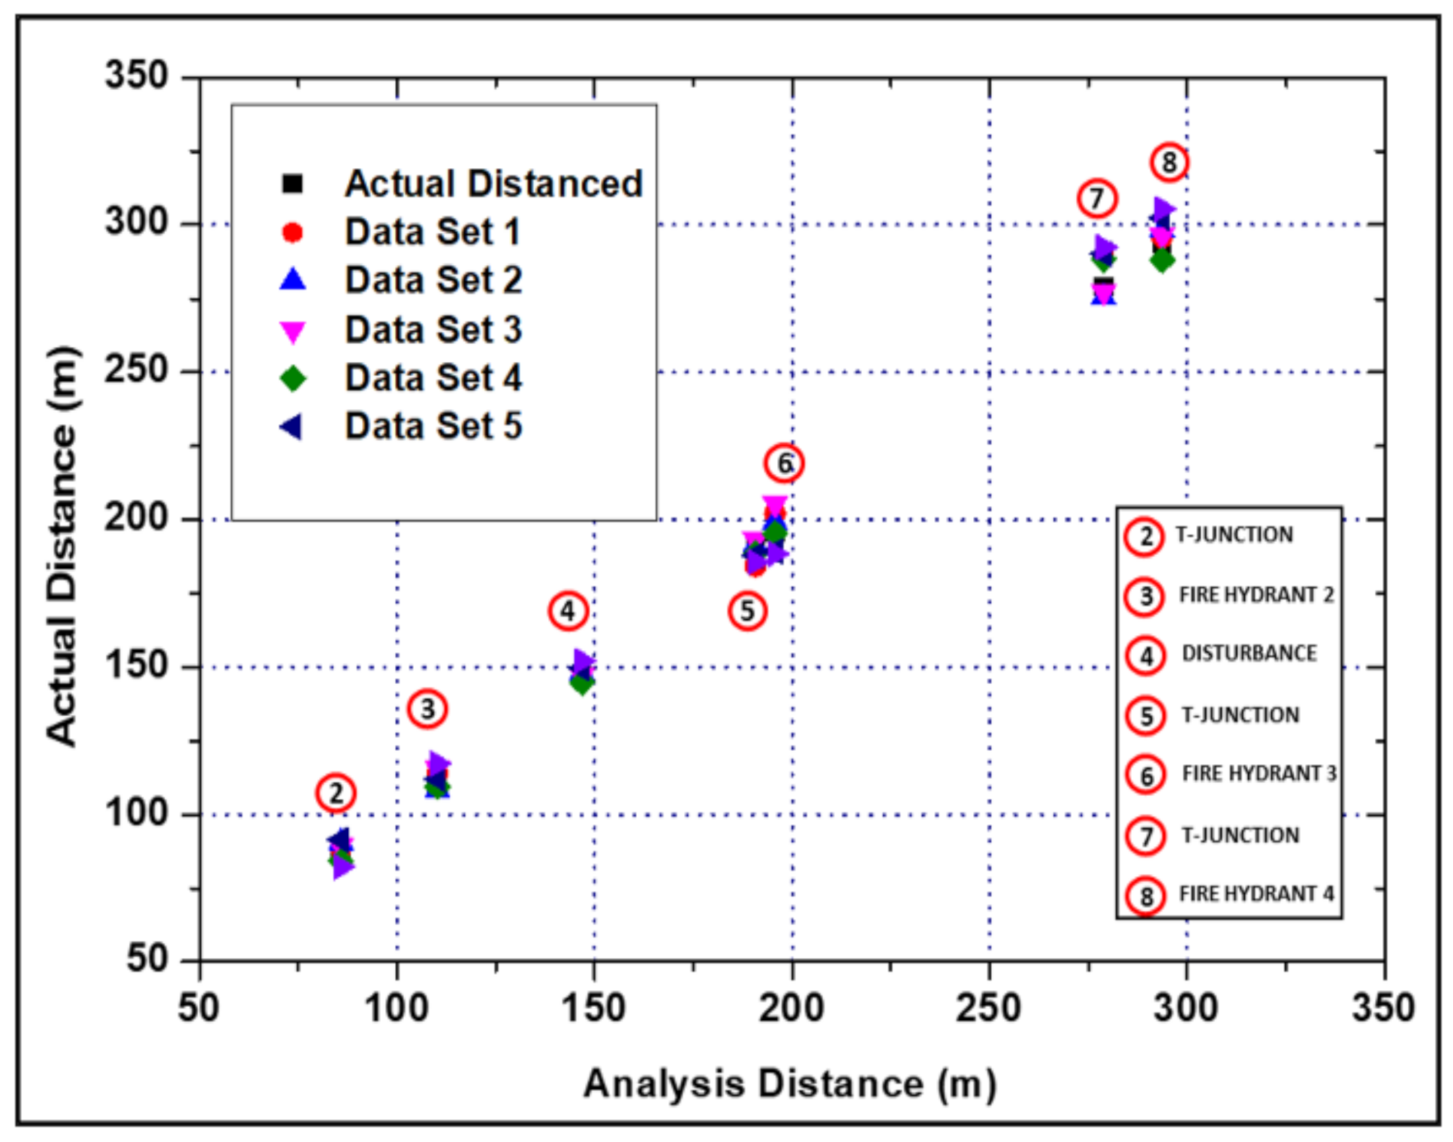
| 2 | T-Junction 1 | 85.8 | 88.5 | 90.5 | 89.3 | 84.2 | 91.5 | 82.2 | 4.1 |
| 3 | Fire Hydrant 2 | 110.3 | 114.0 | 108.4 | 115.7 | 109.5 | 112.0 | 117.3 | 3.0 |
| 4 | Brass Faucet | - | 146.2 | 148.2 | 147.3 | 144.8 | 149.5 | 152.2 | 1.4 |
| 5 | T-Junction 2 | 190.7 | 184.2 | 191.3 | 193.2 | 188.3 | 187.9 | 185.6 | 1.8 |
| 6 | Fire Hydrant 3 | 195.7 | 202.0 | 199.3 | 205.3 | 195.3 | 189.3 | 188.3 | 2.9 |
| 7 | T-Junction 3 | 278.9 | 289.3 | 275.4 | 277.3 | 288.5 | 290.2 | 292.5 | 2.9 |
| 8 | Fire Hydrant 4 | 293.7 | 295.9 | 298.3 | 296.3 | 288.1 | 302.3 | 305.5 | 2.0 |
| No. | Type of Pipe Features | Distance from Blueprint (m) | Analysed Distanced (m) | Mean Error (%) | |||||
|---|---|---|---|---|---|---|---|---|---|
| Data Set 1 | Data Set 2 | Data Set 3 | Data Set 4 | Data Set 5 | Data Set 6 | ||||
| 1 | Point of analysis (Fire Hydrant 1) | - | - | - | - | - | - | - | - |
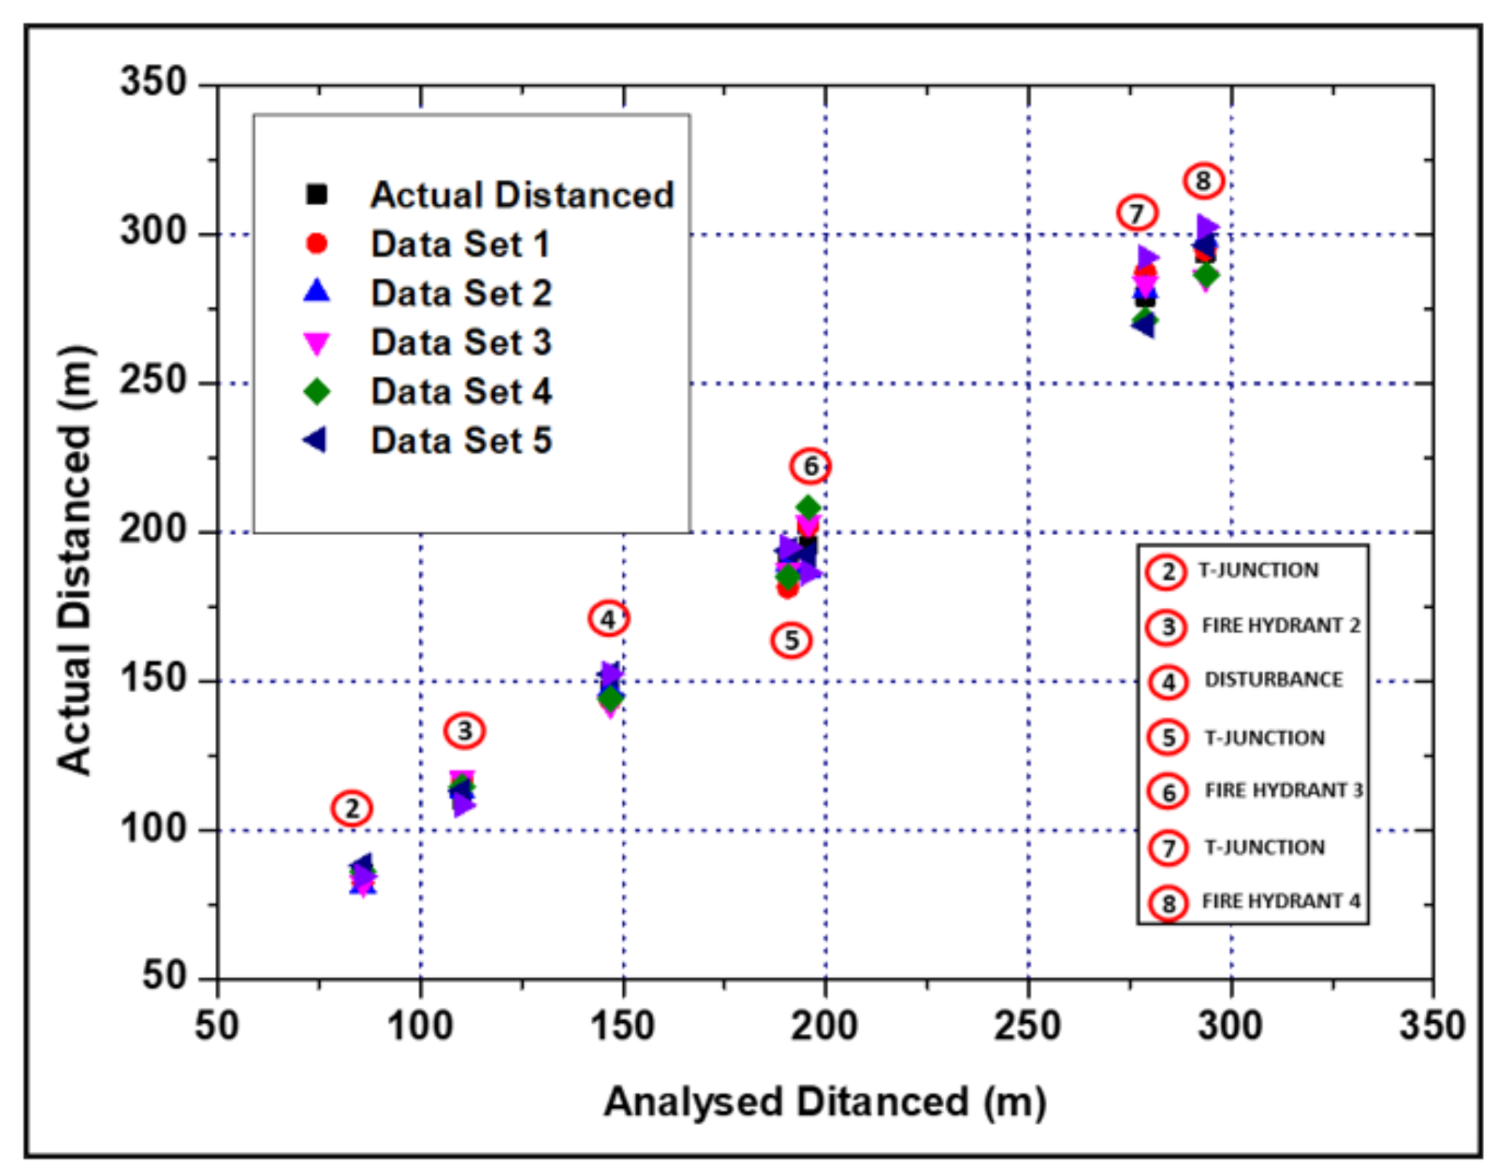
| 2 | T-Junction 1 | 85.8 | 82.5 | 81.5 | 82.3 | 86.2 | 88.2 | 84.5 | 3.0 |
| 3 | Fire Hydrant 2 | 110.3 | 116.4 | 113.4 | 117.2 | 114.5 | 113.1 | 108.4 | 3.6 |
| 4 | Brass Faucet | 146.9 | 143.7 | 147.3 | 142.3 | 144.2 | 152.3 | 152.5 | 2.5 |
| 5 | T-Junction 2 (Leak Induced) | 190.7 | 181.5 | 189.3 | 187.3 | 185.3 | 194.0 | 195.0 | 2.4 |
| 6 | Fire Hydrant 3 | 195.7 | 202.1 | 187.3 | 203.2 | 208.3 | 192.3 | 186.3 | 4.0 |
| 7 | T-Junction 3 | 278.9 | 287.0 | 281.3 | 283.2 | 271.2 | 269.3 | 292.2 | 2.7 |
| 8 | Fire Hydrant 4 | 293.7 | 294.7 | 298.3 | 285.3 | 286.3 | 296.3 | 302.6 | 1.9 |
| No. | Type of Pipe Features | Distance from Blueprint (m) | Analysed Distanced (m) | Mean Error (%) | |||||
|---|---|---|---|---|---|---|---|---|---|
| Data Set 1 | Data Set 2 | Data Set 3 | Data Set 4 | Data Set 5 | Data Set 6 | ||||
| 1 | Point of analysis (Fire Hydrant 1) | - | - | - | - | - | - | - | - |
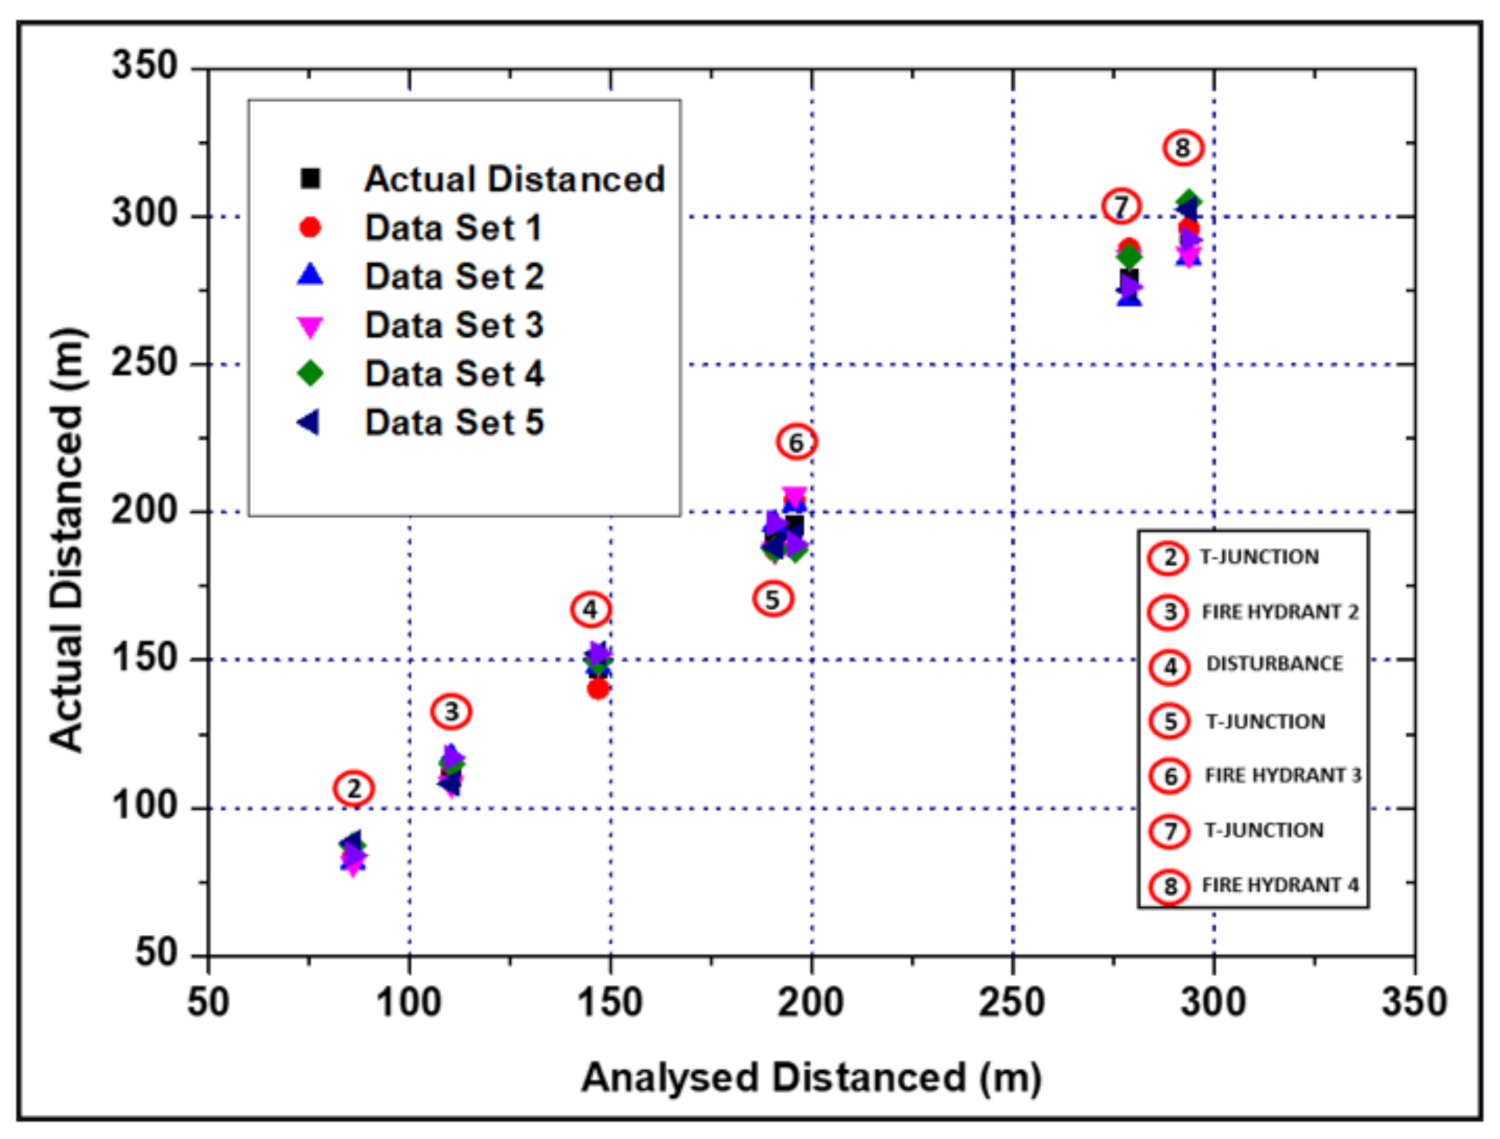
| 2 | T-Junction 1 | 85.8 | 83.3 | 82.1 | 81.4 | 87.3 | 88.3 | 84.2 | 3.2 |
| 3 | Fire Hydrant 2 | 110.3 | 115.1 | 117.2 | 108.2 | 115.1 | 108.2 | 117.1 | 4.0 |
| 4 | Brass Faucet | 146.9 | 140.4 | 148.3 | 149.4 | 149.6 | 152.4 | 152.4 | 2.7 |
| 5 | T-Junction 2 | 190.7 | 187.4 | 196.2 | 187.2 | 187.3 | 188.3 | 196.3 | 2.1 |
| 6 | Fire Hydrant 3 (Leak Induced) | 195.7 | 204.0 | 203.2 | 206.3 | 187.3 | 192.2 | 189.3 | 3.8 |
| 7 | T-Junction 3 | 278.9 | 289.2 | 272.3 | 286.2 | 286.7 | 275.2 | 276.3 | 2.3 |
| 8 | Fire Hydrant 4 | 293.7 | 296.1 | 286.3 | 287.3 | 305.3 | 302.6 | 292.3 | 2.1 |
| No. | Type of Pipe Features | Distance from BluePrint (m) | Analysed Distanced (m) | Mean Error (%) | |||||
|---|---|---|---|---|---|---|---|---|---|
| Data Set 1 | Data Set 2 | Data Set 3 | Data Set 4 | Data Set 5 | Data Set 6 | ||||
| 1 | Point of analysis (Fire Hydrant 1) | - | - | - | - | - | - | - | - |
| 2 | T-Junction 1 | 85.8 | 93.0 | 86.2 | 88.3 | 83.2 | 85.3 | 3.4 | |
| 3 | Fire Hydrant 2 (Leak Induced) | 110.3 | 114.5 | 109.3 | 115.2 | 114.5 | 107.3 | 2.8 | |
| 4 | Brass Faucet | 146.9 | 93.0 | 86.2 | 88.3 | 83.2 | 85.3 | 81.3 | 2.2 |
| 5 | T-Junction 2 | 190.7 | 114.5 | 109.3 | 115.2 | 114.5 | 107.3 | 108.6 | 2.7 |
| 6 | Fire Hydrant 3 (Leak Induced) | 195.7 | 143.8 | 152.3 | 148.3 | 147.4 | 141.3 | 143.8 | 3.9 |
| 7 | T-Junction 3 | 278.9 | 188.8 | 182.3 | 187.3 | 195.3 | 185.2 | 184.3 | 2.7 |
| 8 | Fire Hydrant 4 | 293.7 | 207.5 | 200.6 | 199.6 | 188.5 | 189.6 | 208.3 | 2.0 |
Publisher’s Note: MDPI stays neutral with regard to jurisdictional claims in published maps and institutional affiliations. |
© 2021 by the authors. Licensee MDPI, Basel, Switzerland. This article is an open access article distributed under the terms and conditions of the Creative Commons Attribution (CC BY) license (https://creativecommons.org/licenses/by/4.0/).
Share and Cite
Yusop, M.H.; Ghazali, M.F.; Yusof, M.F.M.; Remli, M.A.P. Pipeline Condition Assessment by Instantaneous Frequency Response over Hydroinformatics Based Technique—An Experimental and Field Analysis. Fluids 2021, 6, 373. https://doi.org/10.3390/fluids6110373
Yusop MH, Ghazali MF, Yusof MFM, Remli MAP. Pipeline Condition Assessment by Instantaneous Frequency Response over Hydroinformatics Based Technique—An Experimental and Field Analysis. Fluids. 2021; 6(11):373. https://doi.org/10.3390/fluids6110373
Chicago/Turabian StyleYusop, Muhammad Hanafi, Mohd Fairusham Ghazali, Mohd Fadhlan Mohd Yusof, and Muhammad Aminuddin Pi Remli. 2021. "Pipeline Condition Assessment by Instantaneous Frequency Response over Hydroinformatics Based Technique—An Experimental and Field Analysis" Fluids 6, no. 11: 373. https://doi.org/10.3390/fluids6110373
APA StyleYusop, M. H., Ghazali, M. F., Yusof, M. F. M., & Remli, M. A. P. (2021). Pipeline Condition Assessment by Instantaneous Frequency Response over Hydroinformatics Based Technique—An Experimental and Field Analysis. Fluids, 6(11), 373. https://doi.org/10.3390/fluids6110373


