1. Introduction
Fractures, cracks, vugs, and inclusions in a porous medium provide a focus for researchers in many application fields. They are of particular interest in the geo-sciences, and also receive increasing attention in the material sciences. In geology, such systems are most frequently met in the deep sub-surface where the material is consolidated or has been transformed by metamorphic processes. Fractures are of interest from different perspectives, one of which is fluid flow [
1,
2]. In general, studies deal with the problem as to how inhomogeneities affect flow [
3]. Fractures can be conduits or barriers. We adopt the term crack for a structural discontinuity that is a conduit open to fluid flow, in contrast to an anti-crack that acts as a barrier [
4]. Broberg [
5] defines a crack as a material separation by opening or sliding, with the separation distance substantially smaller than the separation extent—the crack length. In material sciences, flow through fractured porous media is of special concern for the design of technical devices as fuel cells [
6,
7,
8].
Several studies were interested in flow patterns that are induced by small-scale geometric features within the porous matrix. Some deal with a single small-scale entity, which also is the focus here, while others examine more elaborated configurations of different types, structured and unstructured, random or non-random networks etc. Berre et al. [
9] gave a review of such studies of flow in fractured porous media. It is a classical task to derive effective parameters that are relevant on the larger scale depending on the parameters of the smaller (micro)-scale [
10]—that also is an aim of this study.
While most of the studies deal with flow patterns, fewer are concerned with the effect on the transport processes. In his textbook, Sahimi [
11] covered both flow and transport. Here the interest lies on the transport phenomena that are induced by the flow within matrix-crack systems. Studies published with the same aim cover different geometric constellations and mathematical approaches. Bodin et al. [
12,
13] examined details of transport in a single crack of constant thickness. For a similar set-up, Liu et. al. [
14] derived an analytical solution for what they call velocity dispersion, i.e., dispersive effects caused by the velocity distributions. The topic is more recently been re-examined using domain-random walk numerical method [
15]. Natarajan et al. [
16] explored a sinusodial fracture geometry. More complex constellations with cracks of different geometries were also scrutinized [
17].
Altogether the studies cover flow, heat and solute transport, reaction, and deformation. For example, Bagalkot et al. [
18] specialized in colloid transport, including gravity effects. Zhu et al. [
19] are interested in the effects of reaction rates between the rock matrix and the crack. Lonergan et al. [
20] included mineralization in their study. More complex situations covering reactive transport also attracted interest recently [
21]. While transport studies in general deal with advection, diffusion, dispersion, sorption, and reaction we restrict our systematic approach to the physical processes, i.e., to advection and dispersion on a larger scale, what can be termed velocity dispersion [
14].
Concerning modeling there are various alternatives to deal with fractured media [
22,
23]. A multitude of random small-scale entities might be described by a continuum approach. Fracture networks are often treated using a multi-dimensional approach: 1D fractures in the 2D space, or 2D fractures in the 3D space [
24,
25]. This is justified, if higher-dimensional effects can be excluded. The aim here is to examine situations where such a simplification is not possible, so that matrix and crack have to be discretized in the same dimension. Here 2D transport is modeled with clear 2D characteristics (see the illustrating example in
Section 5.2).
2. Crack-Matrix Set-Up
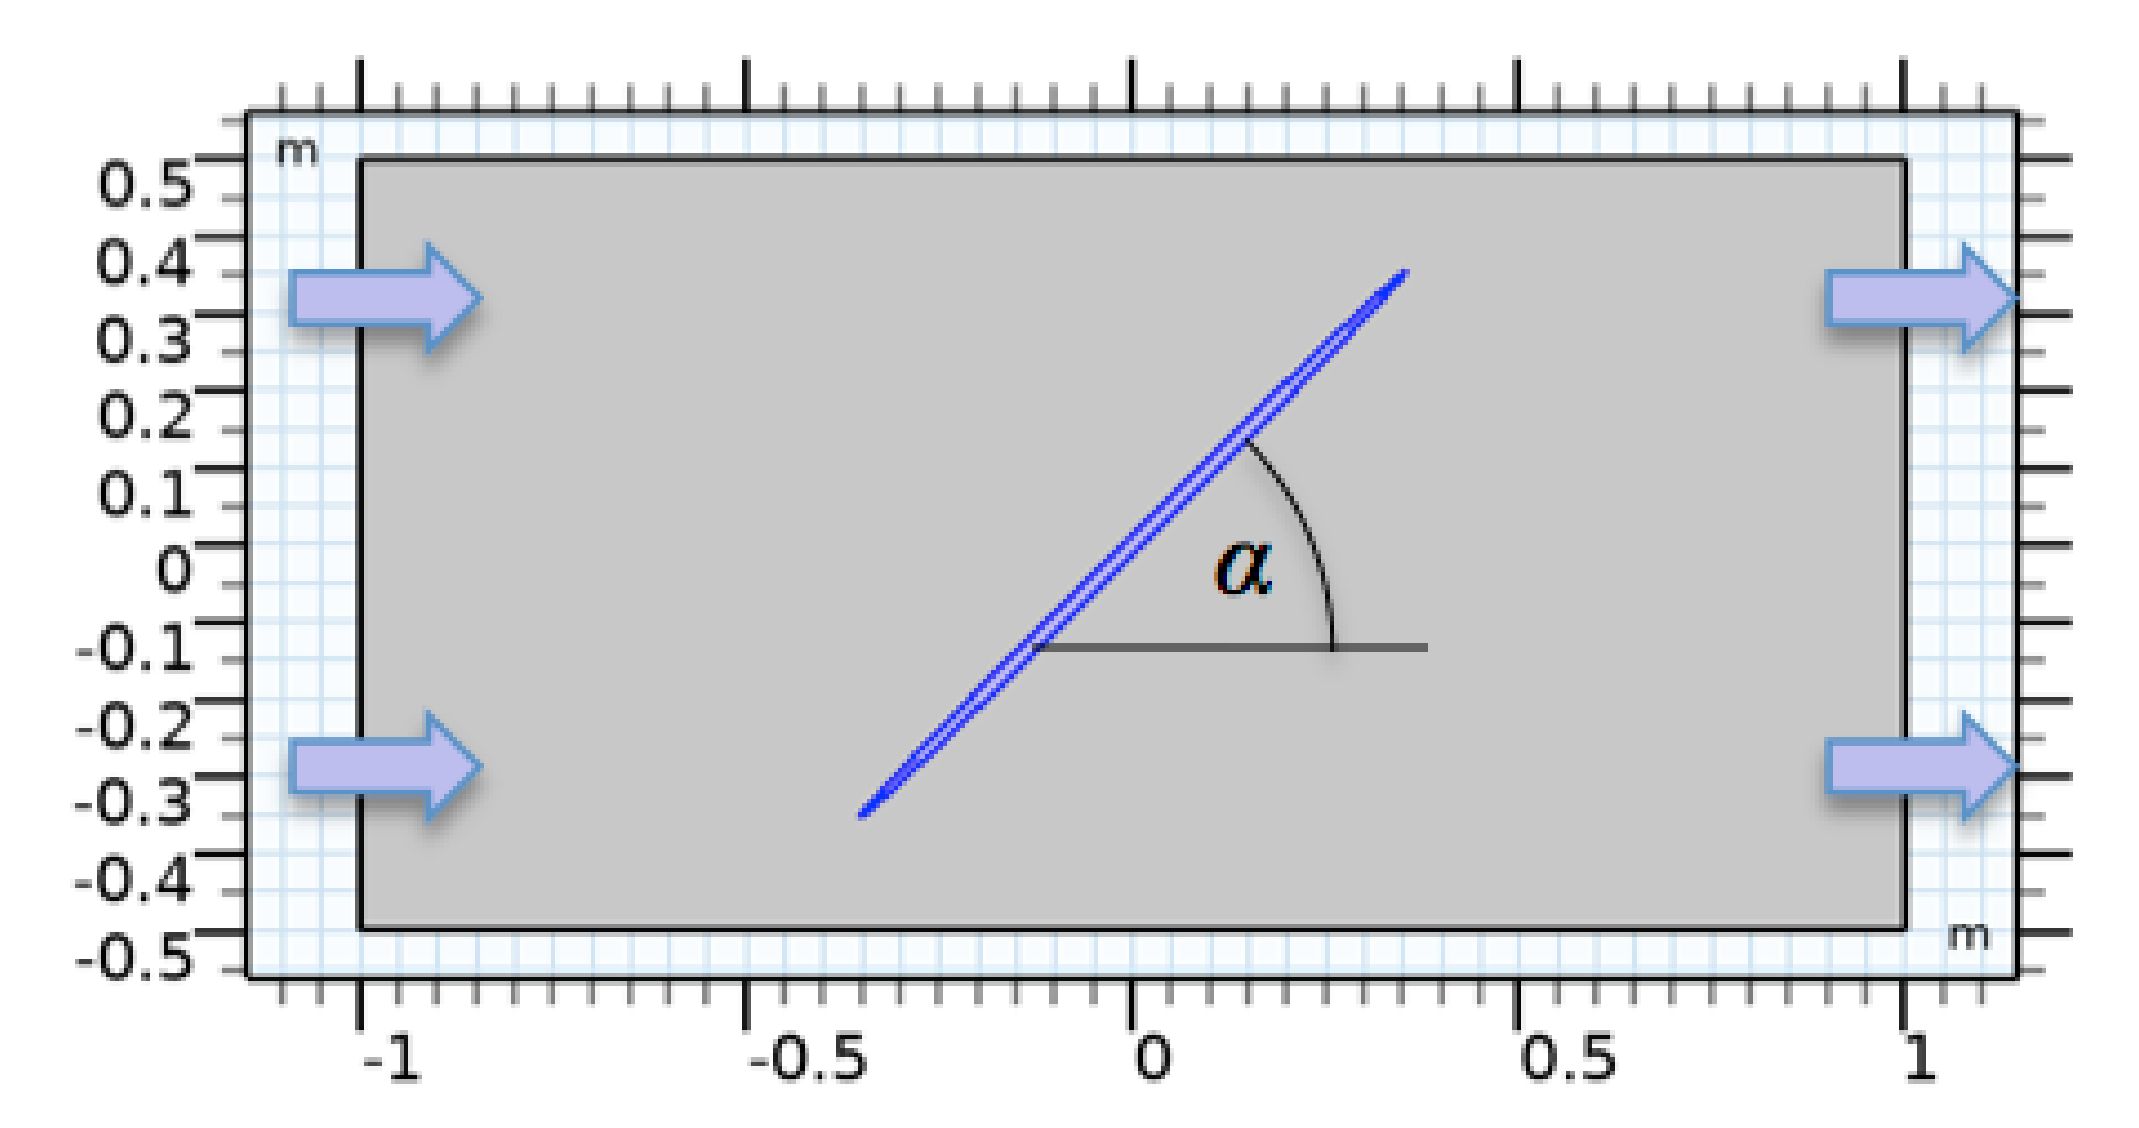
We examine scenarios in 2D of a single crack of elliptic shape in a porous medium (matrix). The constellation is sketched in
Figure 1, which shows the entire model region in grey and the crack in blue. The crack is assumed to have the shape of an ellipse, a concept that can be found in many studies on the mechanics of fracture propagation and closure [
26,
27], but that has been adopted in the hydro-sciences [
23,
27]. The main axis of the ellipse forms an angle
α with the flow direction. There are two opposite sides without normal fluxes, neither for fluid nor for solute or heat (in the sketch the horizontal sides). The other sides of the region are open, and the conditions are chosen to induce inflow on one side and outflow on the opposite one. The boundary conditions are chosen in a way that they would induce a 1D constant flow field in a set-up without the crack.
Our aim is a systematic examination of the described system to cover all solution characteristics and their sensitivities within the relevant parameter range. The two main geometric parameters that characterize the system sketched in
Figure 1 are the tilt angle
α between the main axis of the crack, and the flow direction and the crack aperture
d. The numerical simulations are performed to find out how the transport through the system changes dependent upon these parameters.
To cover various situations concerning the physical parameters, i.e., the properties of fluid and porous medium, we examine the system in a dimensionless analytical description [
28]. This has the advantage that results can be generalized [
29]. In particular, they are scale independent, or scale invariant [
30]. Another relevant advantage is that the number of parameters usually is much smaller than the original set [
30]. In
Section 3, we describe a formulation in which only three dimensionless parameter combinations (Re, Da and Pe) are used for the mathematical description of the equations.
The results are evaluated on the basis of the breakthrough curves, which describe the mean concentration across the outlet boundary as a function of time. The breakthrough curves of the 2D models are used in a fitting procedure with a 1D model approach. In this way, effective transport parameters are determined, allowing a check how far the input value of the 2D model differs from a 1D approach with effective parameters. The final results reveal that aside of the geometrical parameters only one of three dimensionless parameter combinations Re, Da and Pe is relevant for the characterization of the breakthrough curves.
3. Differential Equations
Let us first note the differential equations on which hydrodynamic flow and transport modeling is based. We rely on the equations for Darcy flow in the matrix and for Stokes flow in the open fracture, as well as on the advection-diffusion equation for transport. For the flow we assume stationary conditions, whereas transport phenomena are transient.
The equations for steady-state constant density flow in a porous medium are noted as [
28]:
with permeability
k and fluid viscosity
μ. The first equation is a formulation of Darcy’s law for the velocity vector
v, with
p denoting the hydraulically relevant pressure. The second equation is a formulation of the principle of mass conservation, under the assumption of constant density. The given formulation holds for stationary flow in porous media in 1D, 2D or 3D.
Inside the crack we assume that the flow is free, i.e., not hindered by any obstacles. Thus, the Navier–Stokes equations for laminar flow are assumed to be valid [
25,
28].
where
ρ denotes density.
denotes the nabla operator, and the subscript
T the transpose of a matrix. Equation (2) hold for steady laminar flow, which can be assumed to be valid because flow in porous media systems is usually very slow. Often the first term that accounts for inertia effects is neglected and the equation reduces to the description of Stokes flow [
31].
To obtain scale-independent results we construct the models in terms of normalized variables and parameters. Normalized to a reference length
L and a reference velocity
, the first equation in Equation (1) can be re-written as:
with normalized pressure
one can reformulate Equation (3) using dimensionless parameters Da and Re:
with Darcy number
and Reynolds number
.
Using the same variable transformations for the first of the Navier–Stokes Equation (2) yields:
with normalized pressure one thus obtains [
32]:
with the Reynolds number as only parameter.
Mass and heat transport can be described by the advection-diffusion equation that can be written as [
33]:
The variable θ represents concentration in case of solute transport and temperature in case of heat transport. D is the diffusivity. The values for the diffusivity D are of a very different scale for solute and thermal transport. For thermal transport the values are in the order of 10−6 m2/s, in mass transport in the order of 10−9 m2/s. The factor κ in the advection term is relevant only for heat transport, where it denotes the ratio of specific heat capacities . The terms denote the heat capacities where the subscripts refer to the fluid (f) and the fluid-solid (fs) phases. For solute mass transport Equation (7) holds with κ = 1.
For the general treatment of the problem, we normalize the transport equation. With the variable transformations given above the transport equation is written as [
28]:
with Peclet number Pe defined by:
where the subscripts on
D denote the solute and thermal cases. Pe measures the relation between advection and diffusion. For Re > 1 one speaks of advection dominated transport, while for Pe < 1 diffusive processes dominate. Please note that with the normalization of length and velocity as described, the time is implicitly transformed by:
.
4. Numerical Modeling
Based on the dimensionless formulation, as given by Equations (4), (6) and (8) a numerical model for flow and transport was set up in order to examine the breakthrough behavior. Extensive parametric sweeps were run to study the breakthrough curves. As result of the normalization three dimensionless parameter combinations could possibly be of relevance: Re, Da and Pe.
The model region is sketched in
Figure 1. The crack is of elliptic shape with a long axis of length
L and a ratio of half-axes of
d (smaller axis/larger axis). The region has a height (or width)
H and a length that is selected as double of the crack length. Several ratios of geometric entities define the shown set-up. Most relevant are the characteristics of the crack, i.e., the half-axis ratio
d and the angle
α by which the crack is tilted to the main flow direction. For
α = 0 the crack is aligned with the flow, for
α = 90° it is perpendicular to the flow direction.
The boundary conditions of the model are gathered in Equation (10).
x denotes the coordinate axis in flow direction, while
y denotes the perpendicular direction. Because of Darcy’s Law (1) the requirements for the normal components of the velocity
introduce a Neumann condition for pressure
p.
On the inflow side a Neumann condition is prescribed for flow , while on the outflow side there is a Dirichlet condition with p = 0. For transport there is a Dirichlet condition at the inflow boundary and the common Neumann condition at the outflow boundary. All other sides have no-flow boundary conditions for both flow and transport. The initial condition for the transient transport model is .
For the normalization we chose the crack length L and the inflow velocity . Thus, the model set-up is different to a Darcy experiment, where a pressure gradient is prescribed. The advantage of this formulation is that it is possible to distinguish between effects on advection and dispersion. Details are outlined below.
For the entire set-up we end up with five dimensionless parameters whose relevance is to be examined: Da, Re, Pe,
d and
α. These parameters are varied systematically in parametric sweeps in order to obtain a general view of the system’s breakthrough behaviour. Reference values in physical dimensions and the variations of the non-dimensionless combinations are listed in
Table 1.
The model was set-up using COMSOL Multiphysics 5.6. This software is very versatile for Finite Element numerical modeling of coupled processes in physics, chemistry, biology, geology, medicine etc. The software allows the use of various physical modes (formulations) for flow and transport and free flow and porous media. Most modes are implemented for use of variables and parameters with physical units. For this study, these formulations were transformed for the dimensionless form in the above given Equations (4), (6) and (8).
COMSOL Multiphysics has been applied for porous systems including cracks in previous studies. Using different numerical approaches Holzbecher et al. [
34] examined flow patterns in porous media with thin structures. Using a similar 2D setting with a single crack Romano-Perez & Diaz-Viera [
35] investigated flow results depending on different representations of the crack (explicit, embedded, domain decomposition), but not transport phenomena as provide the focus here. Perko et al. [
36] applied COMSOL Multiphysics in a verification and validation study on a sample with a given crack network. Their model covered flow and transport, similar to our approach. They were able to visualize and validate the complex transport behavior by comparison with experimental measurements. ‘A model validation exercise based on a 2D laboratory tracer test gave convincing results in terms of reproducing plume spreading (qualitative comparison) and breakthrough curves (quantitative comparison)’. The authors used the software in another study concerning the transport of radionuclides in cracked cement [
37].
In the Finite Element formulation, the flow variables, pressure and the velocity components were represented by linear elements (P1 + P1), the transport variable by 2-order elements. Meshing was always made with a considerable refinement near and within the crack.
Figure 2 shows an example mesh. A typical mesh consists of 3308 nodes, 6520 elements and 9750 degrees of freedom (DOF) for flow and 12,825 DOF for the transport discretization. Checking on the P2 + P1 alternative for the flow discretization led to 2899 DOFs. With an average element quality of 0.88 the meshing is good.
As the study deals with advection-dominated flow with high Peclet-numbers it was necessary to use several stabilization schemes. We only used consistent stabilization, as the streamline and crosswind diffusion. COMSOL Multiphysics proved to be quite effective dealing with problems that may arise during modeling of advection dominated transport [
38]. The temporal simulation is performed using time-stepping. The time steps are updated during the simulation, following the Courant-Friedrichs-Lewy (CFL) condition.
5. Results
5.1. Flow Pattterns
Flow in the combined matrix-crack system was modelled assuming Darcy flow in the matrix and Stokes flow in the crack. The relevance of the inertial term in the Navier–Stokes Equation (2), as discussed above, was scrutinized. A graphical representation of selected results is depicted in
Figure 3, showing velocity magnitude as a colormap, as well as flow paths and contour lines of the hydraulically relevant pressure
p.
The figure shows results for two angles α between crack orientation and the direction of matrix flow. For the large angle the maximum velocity magnitude that is observed in the crack doubles the mean flow velocity (that is normalized to ). For small angles the velocity within the crack reaches values that are more than 6 times higher than the mean. These differences already highlight the relevance of α that will be further scrutinized in the breakthrough curves. For large α pockets of very slow, almost stagnant flow appear near the tips of the crack. For the more upstream tip the low velocity pocket appears downstream; for the more downstream tip it appears upstream.
The figures show that the maximum velocity appears in the center of the crack, and that a boundary layer with reduced velocity is located near the interface between the porous matrix and the open crack. The results shown were obtained with consideration of the inertial term in the Navier–Stokes equations. Control model runs neglecting this term delivered output with marginal differences. As the computational costs of considering the inertial term are small, we left this option enabled for all following runs.
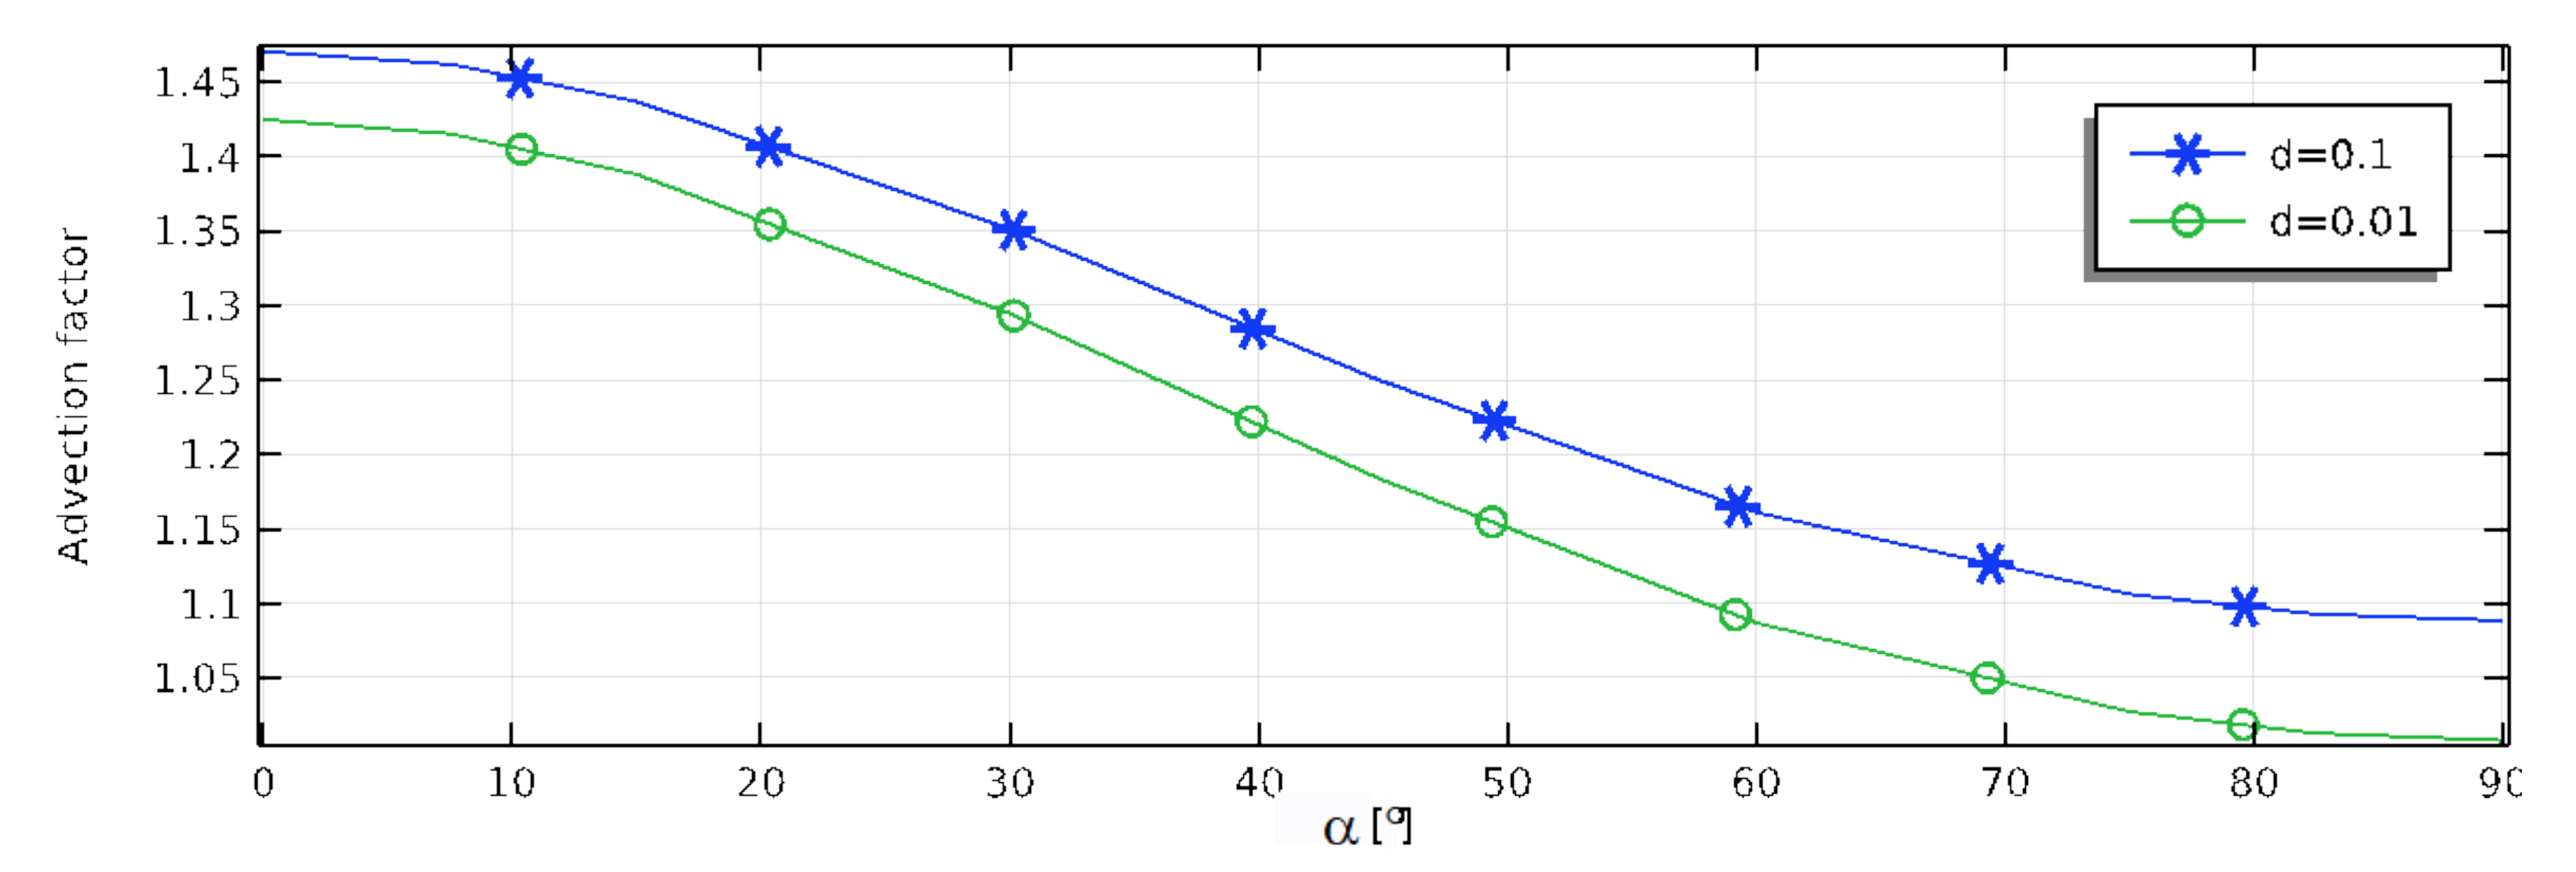
As outlined above the model is normalized to inflow velocity . The influence of the crack on the mean flow velocity cannot be measured directly, but can be evaluated indirectly by the pressure gradient, calculated by the model. Increased advective transport dependent on velocity is related to a decrease of the pressure gradient. As the pressure at the outlet is fixed at zero value, the computed average pressure at the inlet can be taken as representative for the overall pressure gradient. The ratio between the inlet pressures for systems without and with crack is the key measure for the increase of velocity that is induced by the crack. For a system with crack the higher velocity is represented by a small pressure gradient, so that this ratio delivers values greater than 1.
A change of mean velocity results in an equal change of advective transport through the system. Thus, we introduce an advection factor that quantifies the increase of advective transport due to the crack.
Figure 4 depicts the advection factor as function of the crack angle and the crack opening. Advective transport is higher for the wider crack, as expected. It depends strongly on the angle
α. If the crack is oriented perpendicular to the flow direction the factor is 1, i.e., there is no influence, while the factor increases with decreasing
α. Advection may increase by 50% if the crack is aligned with the flow.
5.2. Distributions of Concentration or Temperature
The pattern of transport through the combined system of a crack located within a porous matrix may differ significantly from the homogeneous case. It is the intention here to study extreme cases, where the distribution of the transport variable clearly deviates from the regular behavior that would be observed in a porous medium without a crack.
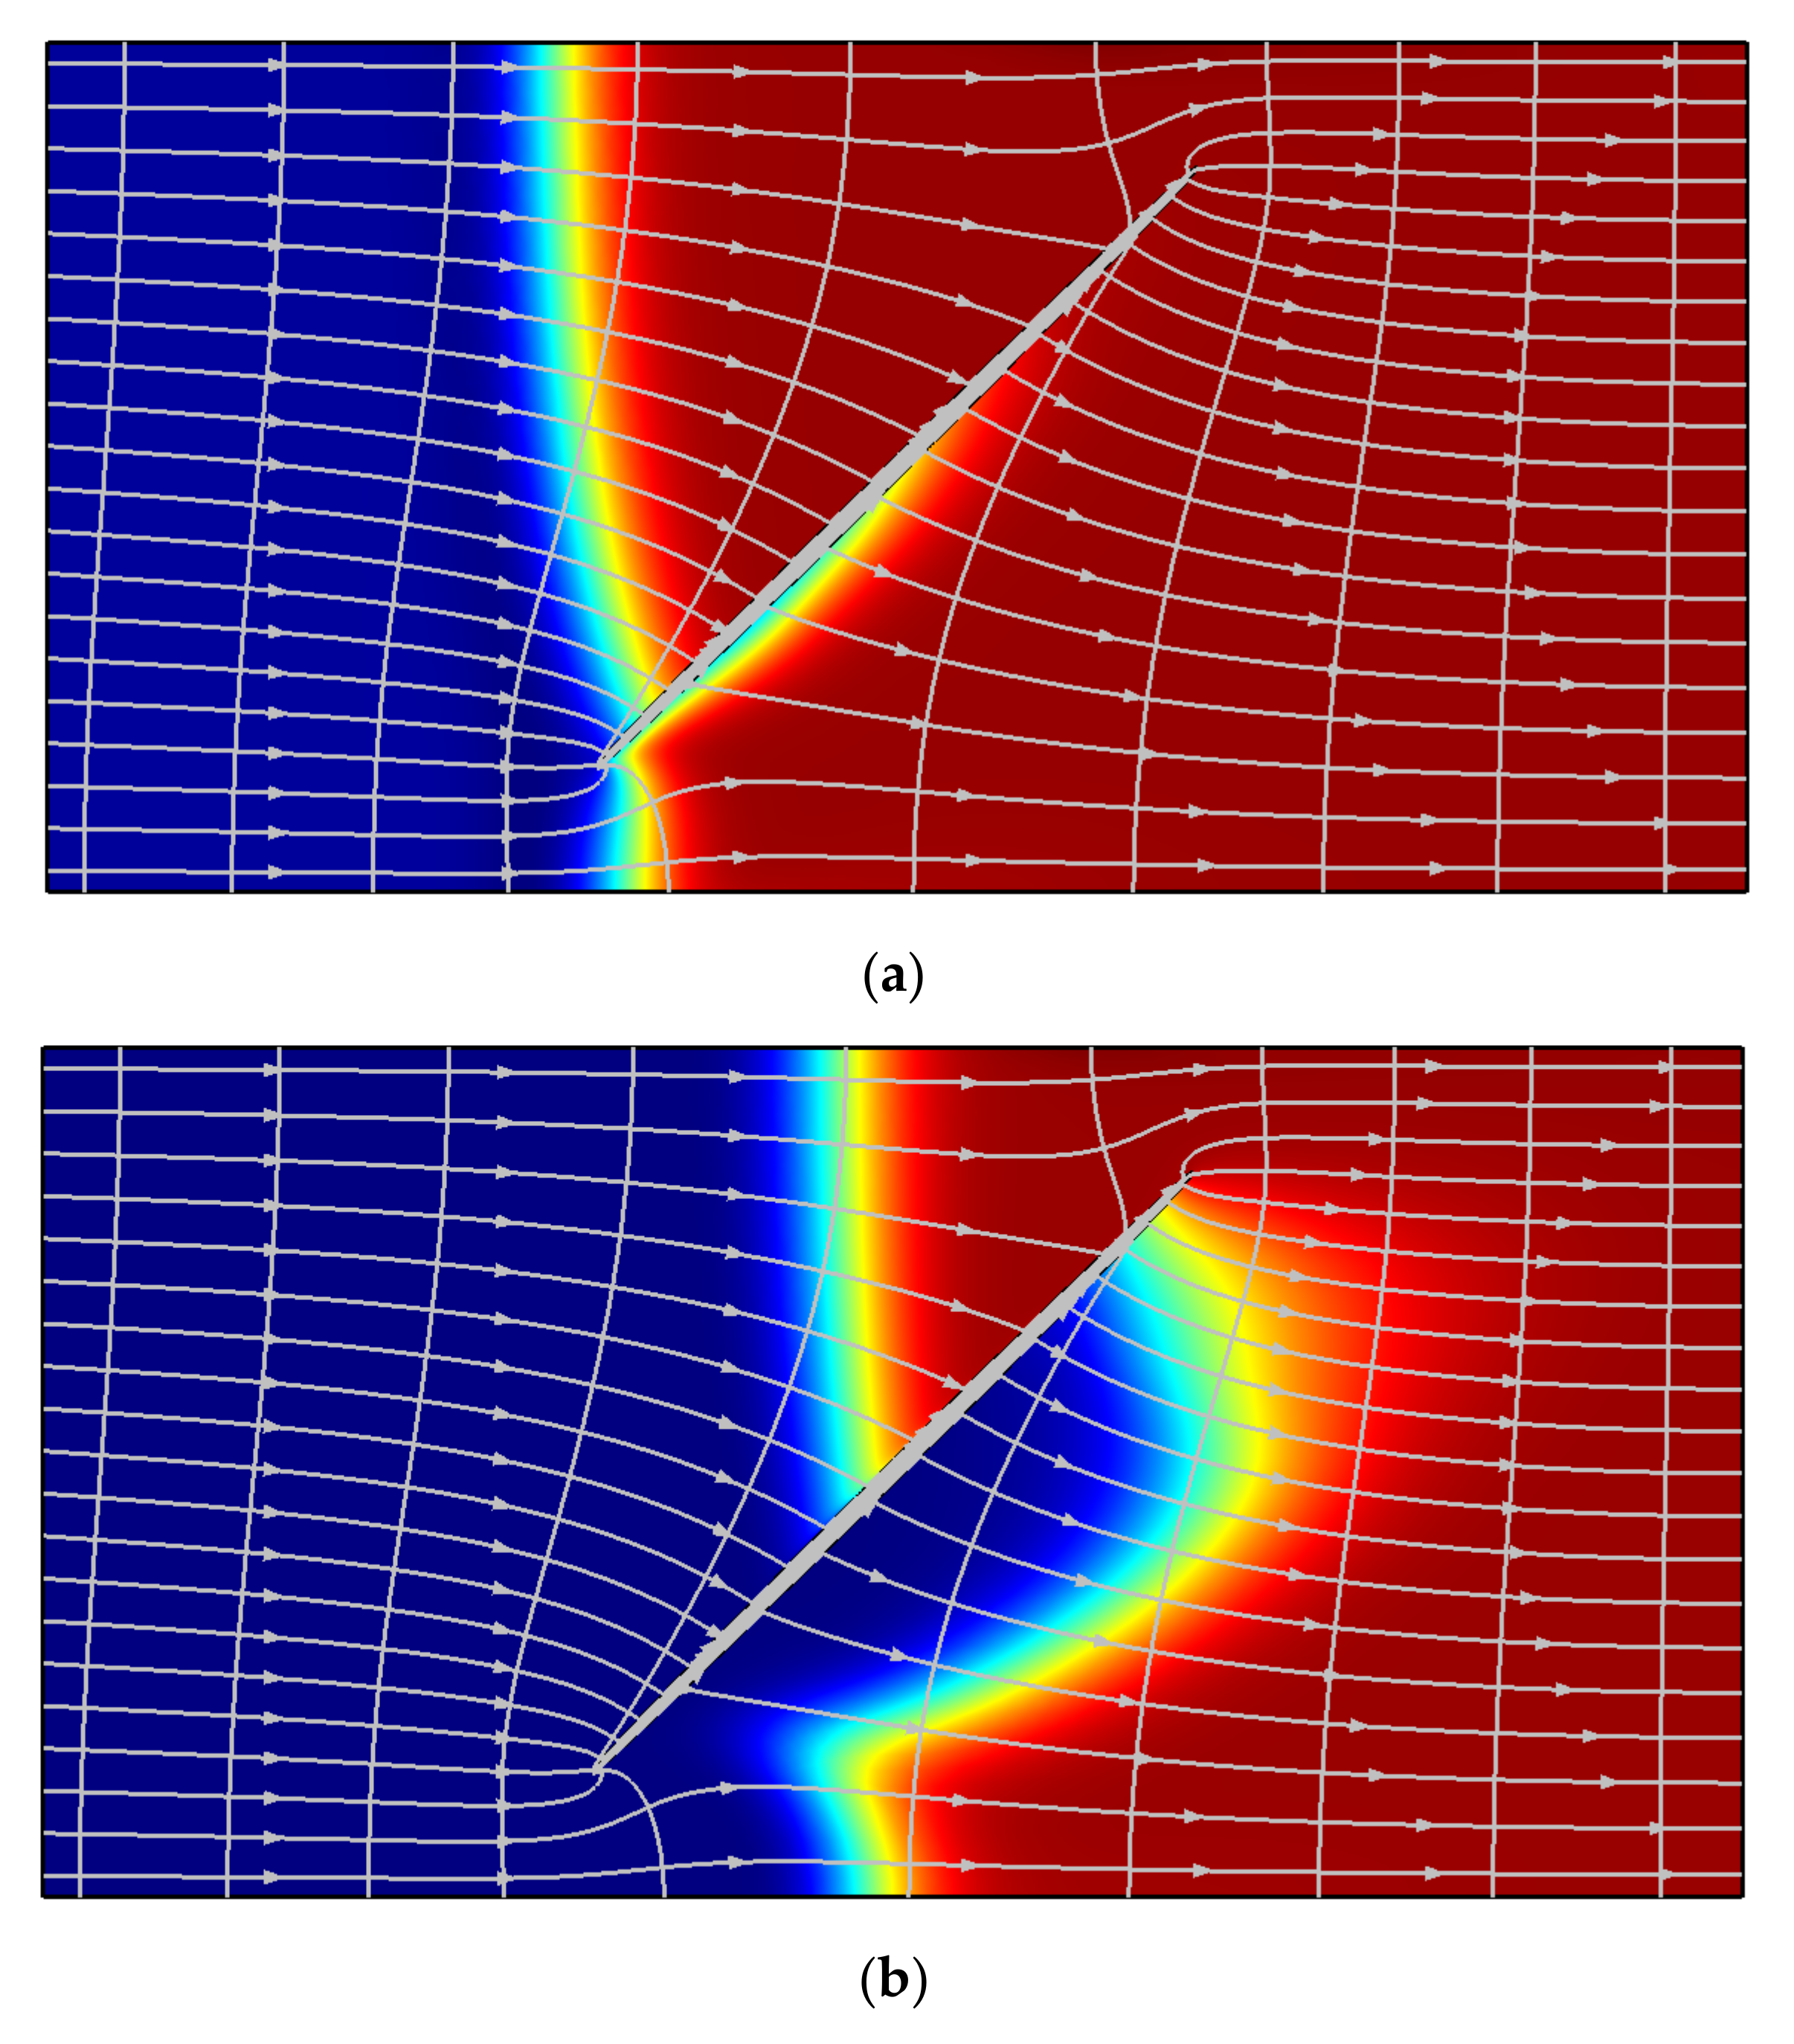
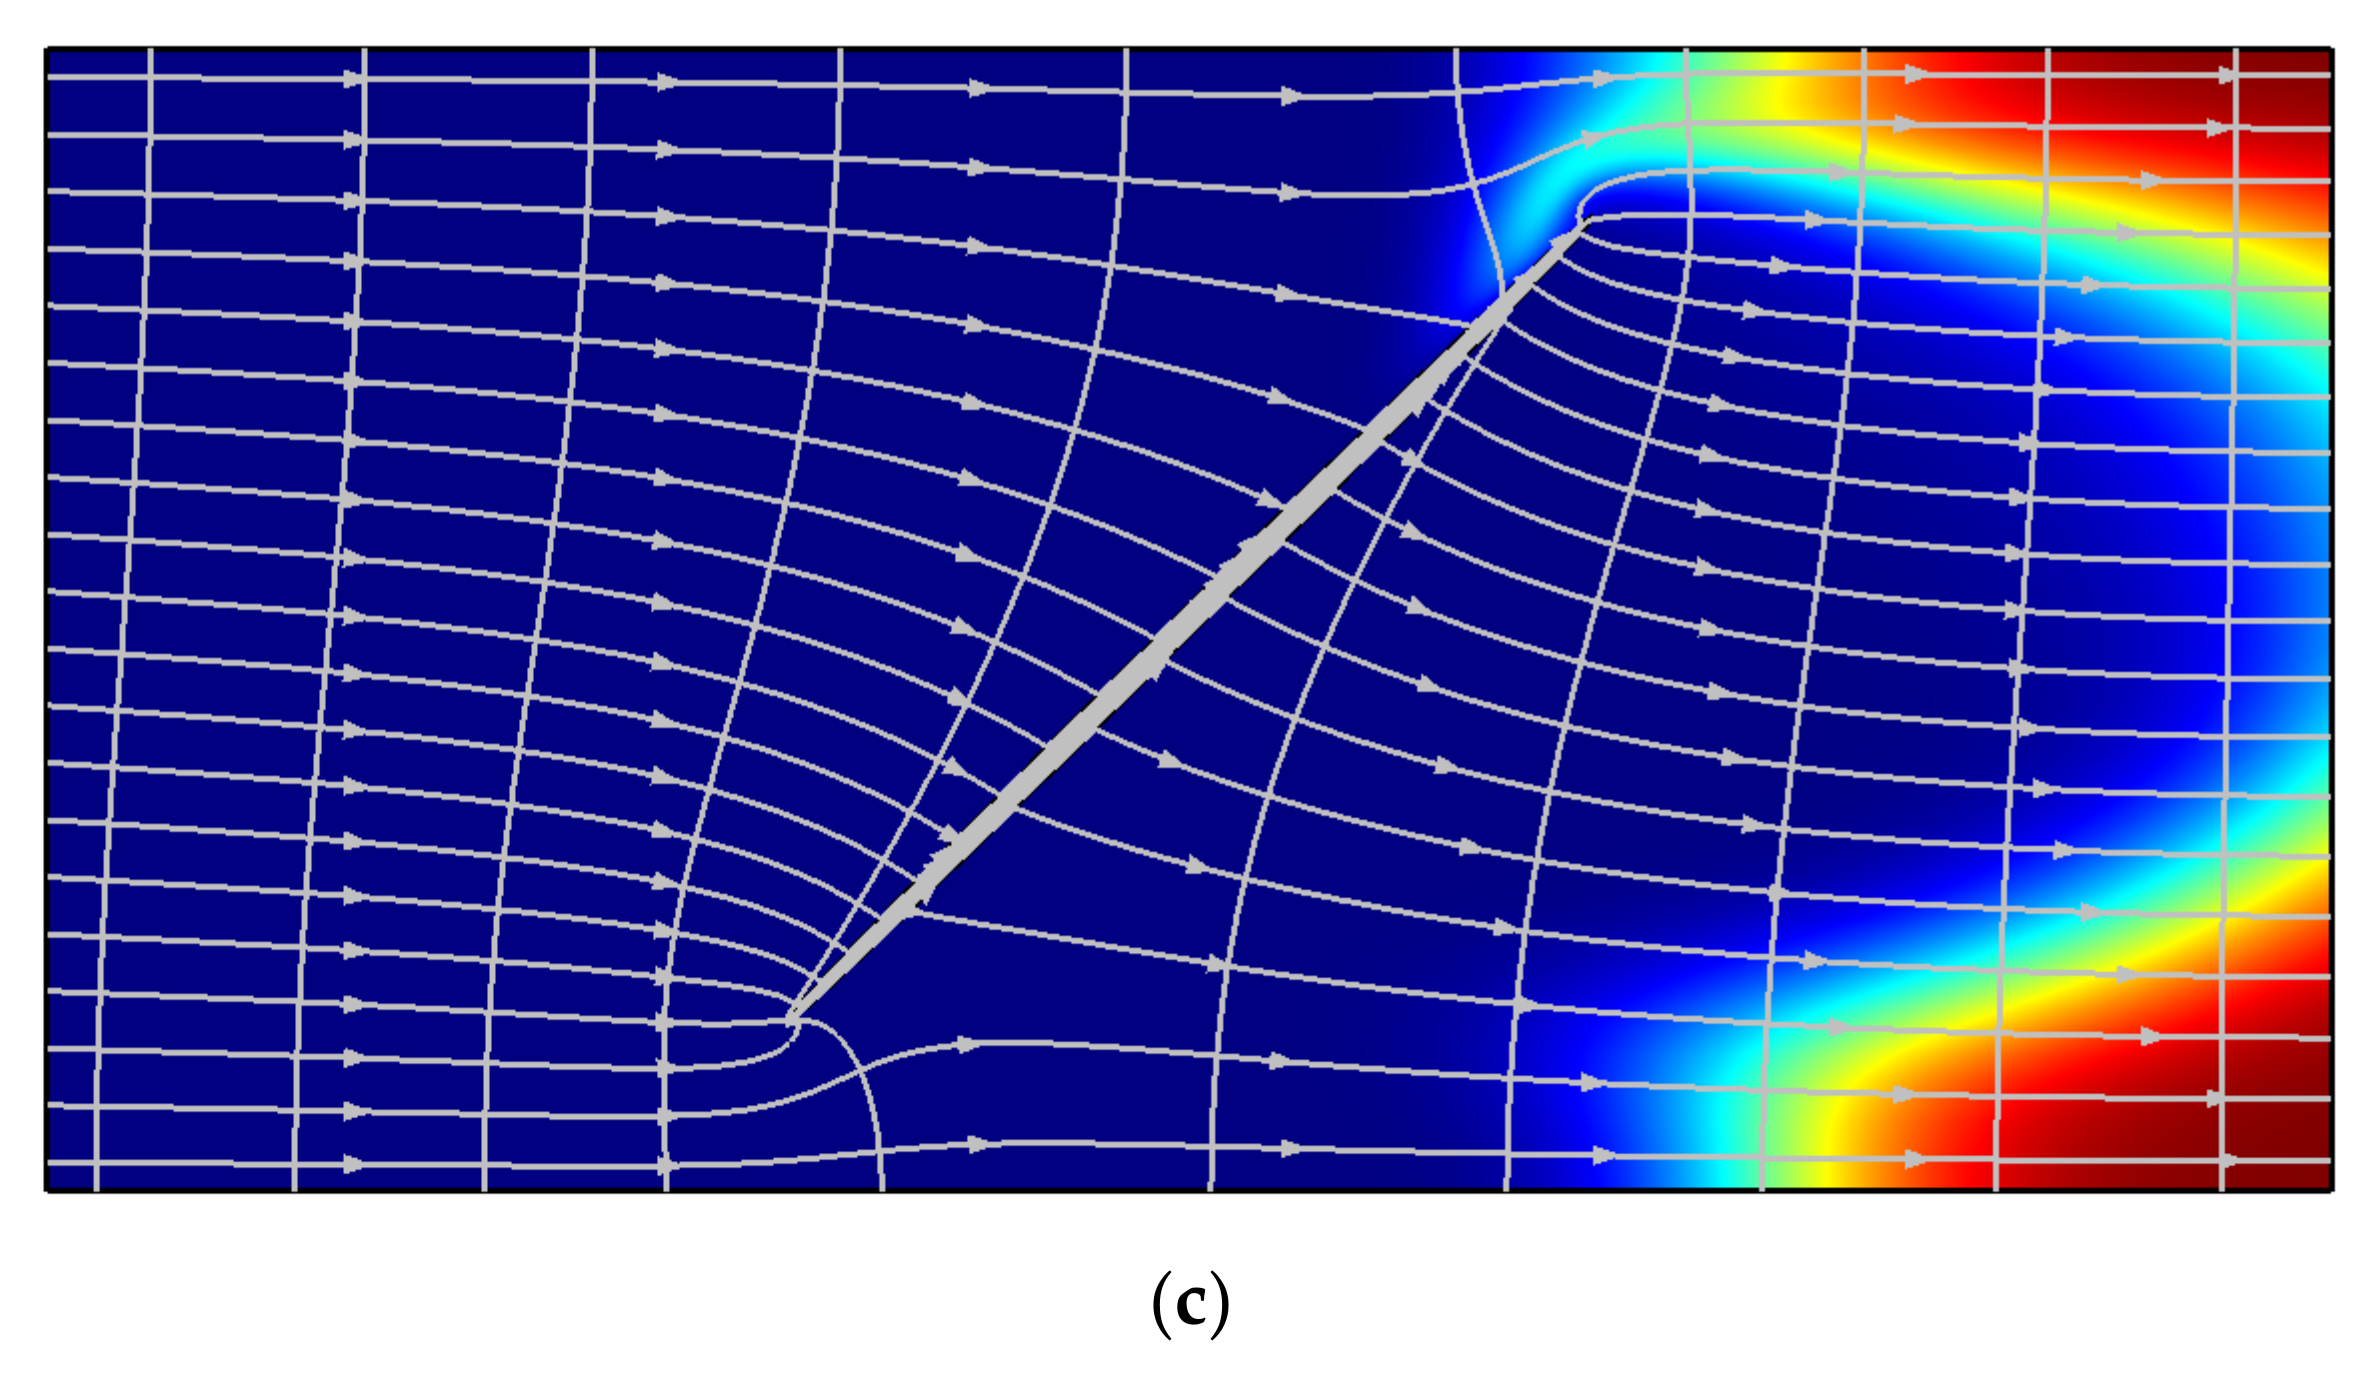
For a homogenous porous system, the studied set-up is essentially 1D and would show a front moving along straight flow paths under the regimes of advection and diffusion. The more complex behavior induced by the crack that is of interest here and is illustrated in
Figure 5. The three color-maps show the distribution of the transport variable (concentration or temperature) at time instants, when the front is reaching (a), passing through (b) and leaving the crack (c). The colors are chosen to resemble a cold front gradually replacing the warmer fluid that initially filled the entire system.
As soon as the front reaches the front end of the crack a rapid migration through the highly permeable structure can be observed (a). While the front is passing further downstream, a plume of the infiltrating fluid builds up all along beyond the downstream interface between the crack and the matrix (b). Further on, this plume extends in transversal and longitudinal direction, leading to a quick breakthrough in the center at the outflow boundary (c). Near the upper and lower boundaries however, pockets of the initial fluid remain for a long time, leading to tailing in breakthrough curves. The effective transport behavior is examined in more detail by scrutinizing the breakthrough at the outlet.
The described pattern identifies some pockets with a quick passing through the crack and thus an early arrival at downstream positions. On the other hand, other pockets are temporarily stuck in the low velocity zones and thus reach downstream positions with retardation. Altogether the breakthrough will thus show a dispersion effect, where we understand dispersion as generalized diffusive transport. The precise outlook of this dispersion is examined in the following.
In
Figure 5 the flow field is illustrated by streamlines and isobars. Isobars connect the upper and lower margins of the plots. The streamlines originate at the inflow boundary on the left at equidistant positions. The flow pattern clearly indicates the deviation from the horizontal lines due to the presence of the crack. Regions with high density of the streamlines, indicating elevated velocities can be recognized at both tips of the crack. The even higher velocities within the crack are not visible because of its small aperture. Regions of low streamline density, i.e., lower flow velocity that led to pockets with retarded transport can be identified adjacent to the crack.
5.3. Breakthrough Curves
The dispersive behavior of the matrix-crack system is examined by breakthrough curves (btc). The btcs show the mean concentration at the outlet as a function of time. The outlet concentration is computed by integrating the concentration along the outlet boundary. As we deal with heat- or mass transport, the breakthrough may refer to temperature (in the case of heat transport) or to concentration (in the case of mass transport). Thus, in the visualizations of the btcs the term ‘transport variable’ is used in the label of the y-axis. In both cases the inflow value in the model is 1, i.e., the variable is normalized to the inflow value, and thus dimensionless, too.
5.3.1. Influence of the Tilt Angle
To study the influence of the tilt, angle several parametric sweeps were run.
Figure 6 depicts the outflow btcs with α taking the values 0, 15, 30, 45, 60, 75 and 90°. For α = 0° the crack is aligned with the imposed pressure gradient and flow field. For α = 90° the crack is directed in a right angle with the flow.
If the crack is directed perpendicular to the flow direction, the velocity field differs only marginally from the result of a 1D plug flow model (for details see below). In that case fluxes transverse to the main flow are so small that they hardly make a difference, and the passing front remains steep. More recognizable is the slight shift of the btc towards upstream, which indicates a slightly earlier arrival time. With decreasing angle, the gradient of the btcs becomes less steep, as the figure shows. This may be conceived as an additional diffusion. As the term dispersion is usually used for generalized diffusive processes, we will use this term subsequently. For here, we can conclude that the dispersion increases, the more the crack is aligned with the flow direction.
The aim here is also to check whether the btcs from the model can be obtained by a 1D approach. For that aim we used the analytical solution of the 1D advection-diffusion equation, given by the often-cited Ogata-Banks formula [
39]:
The diffusivity
D and velocity
v in Equation (10) are fitted to the btcs of the 2D model, thus obtaining values for effective parameters
Deff and
veff. For this task we used the ‘transportfit’ simulator [
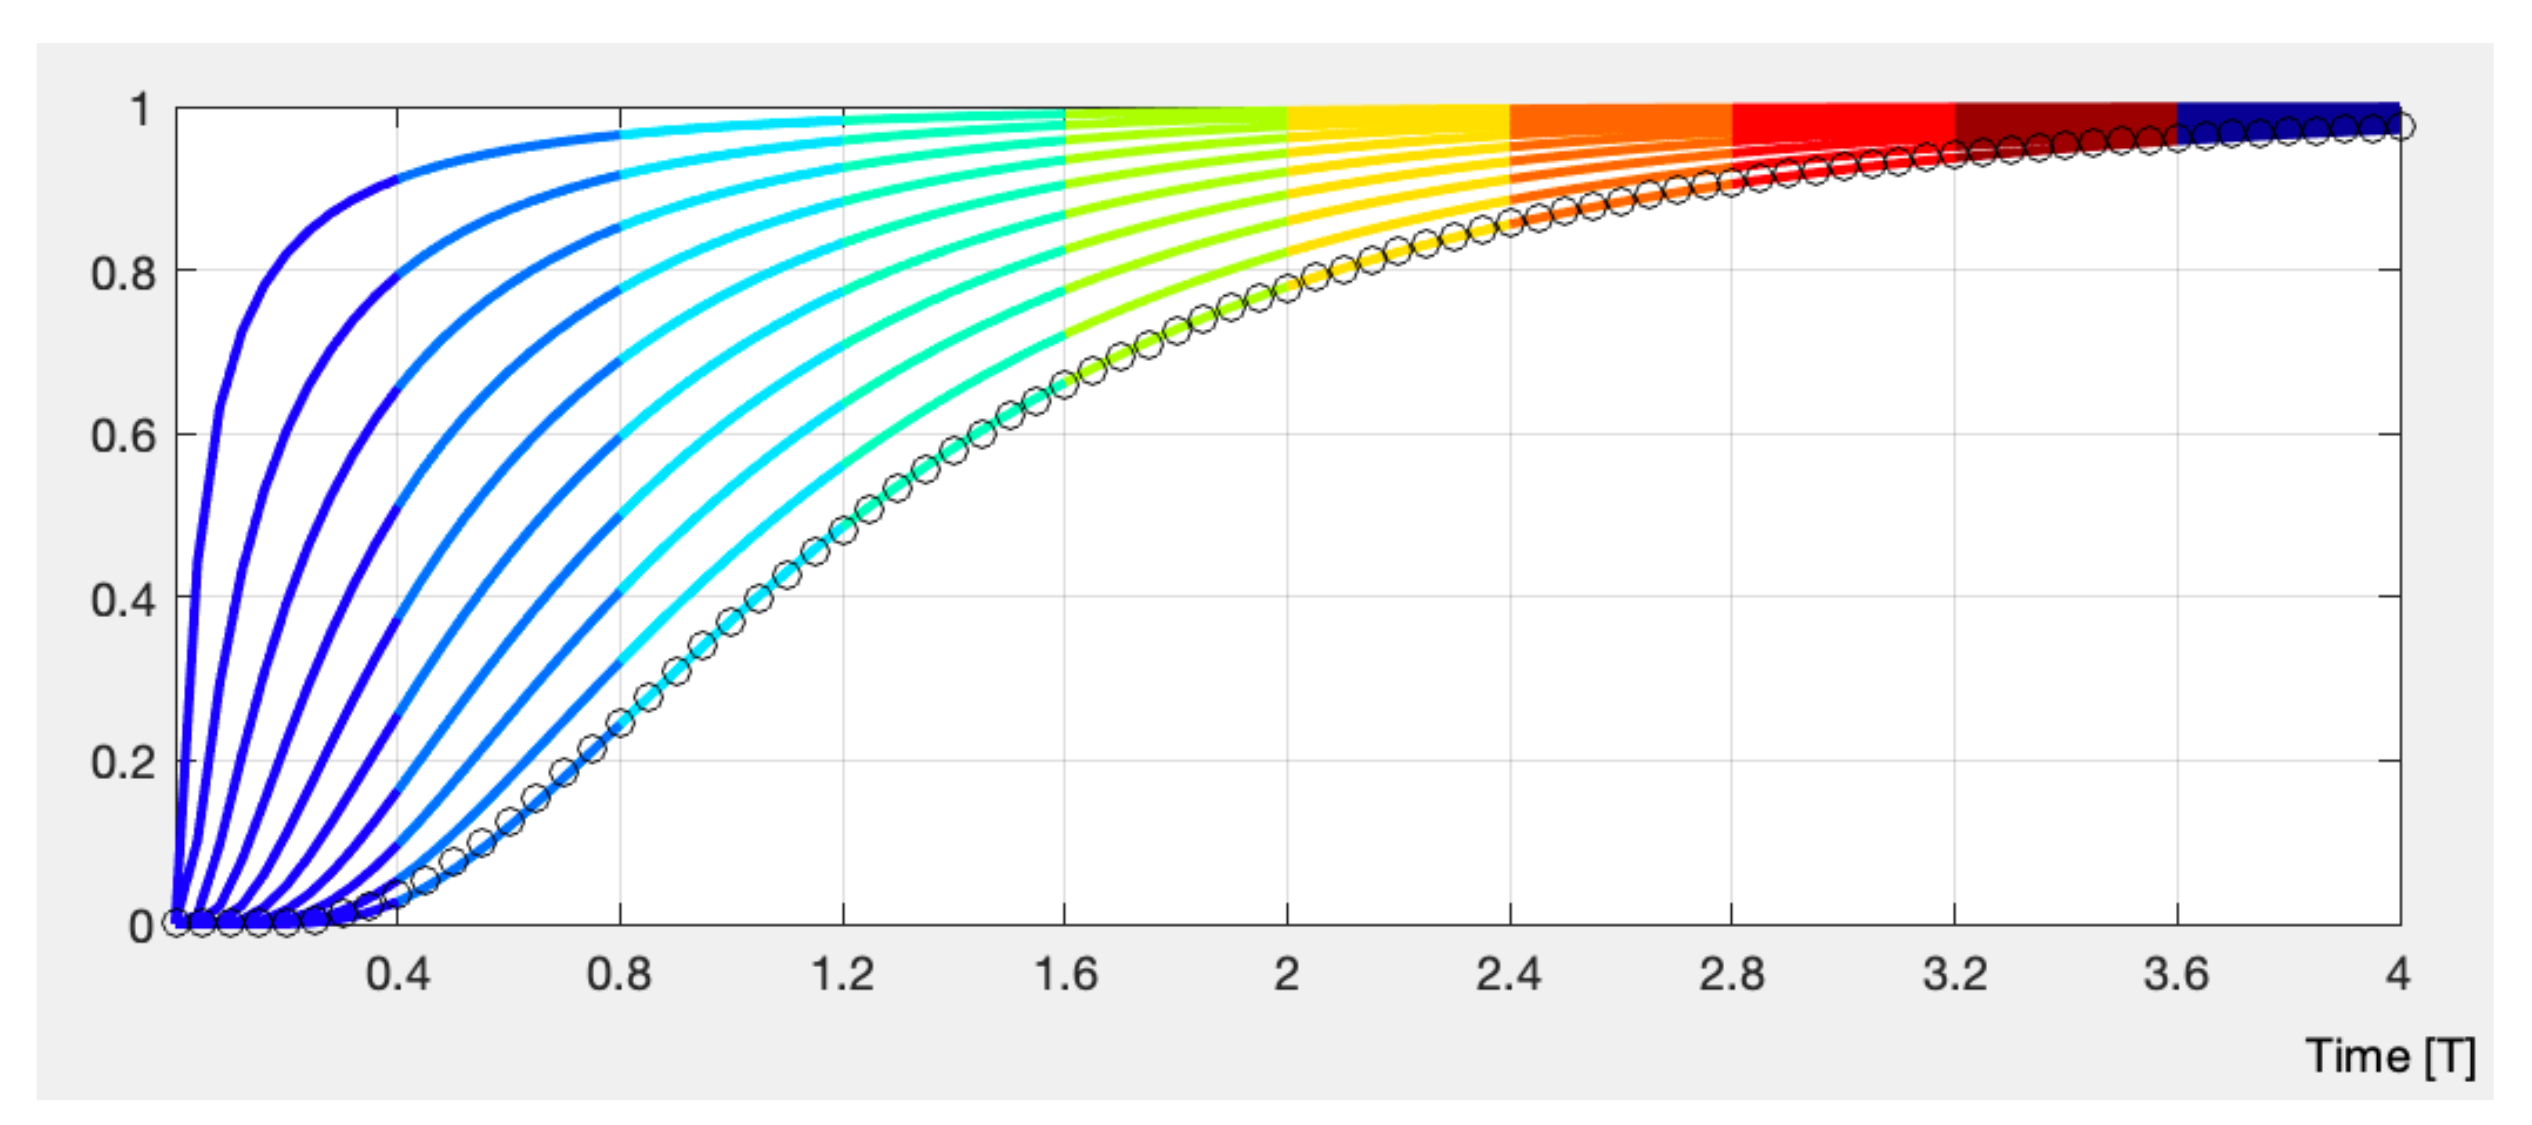
40], a MATLAB program that visualizes solutions of the 1D transport equation for advection, diffusion, decay, and retardation, based on analytical solutions (11). The program has the additional option to fit parameters to given btcs—an option that was used here.
Figure 7 depicts a typical graphical output of ‘transportfit’ for one btc that is representative for all btcs that are in question here. The given btc is represented by circles, while the colored curves provide btcs for intermediate observation points in the 1D approach. The last of the colored btcs fits perfectly with the given data, shown by circles. In most cases the effective value
veff and
Deff of the 1D approach deviate from the values of the original 2D system. For these cases the 1D approach can be used to reproduce the output of the more complex 2D model. This is not always the case, as will be shown below.
Table 2 lists the effective parameters obtained from the described fitting procedure. The effective Peclet number Pe
eff is calculated from the effective velocity and effective diffusivity. As expected, the effective velocity changes only slightly. The major change of velocity and thus of advection is included in the advection factor that was outlined above. That is due to the normalization of the model to the inflow velocity, which in the physical reality is varying.
The change of diffusivity could clearly be observed in
Figure 6. The outlined procedure provides numerical values for this change. The values listed in
Table 2 show that the diffusivity changes by almost one order of magnitude dependent upon the tilt angle.
5.3.2. Influence of the Crack Opening
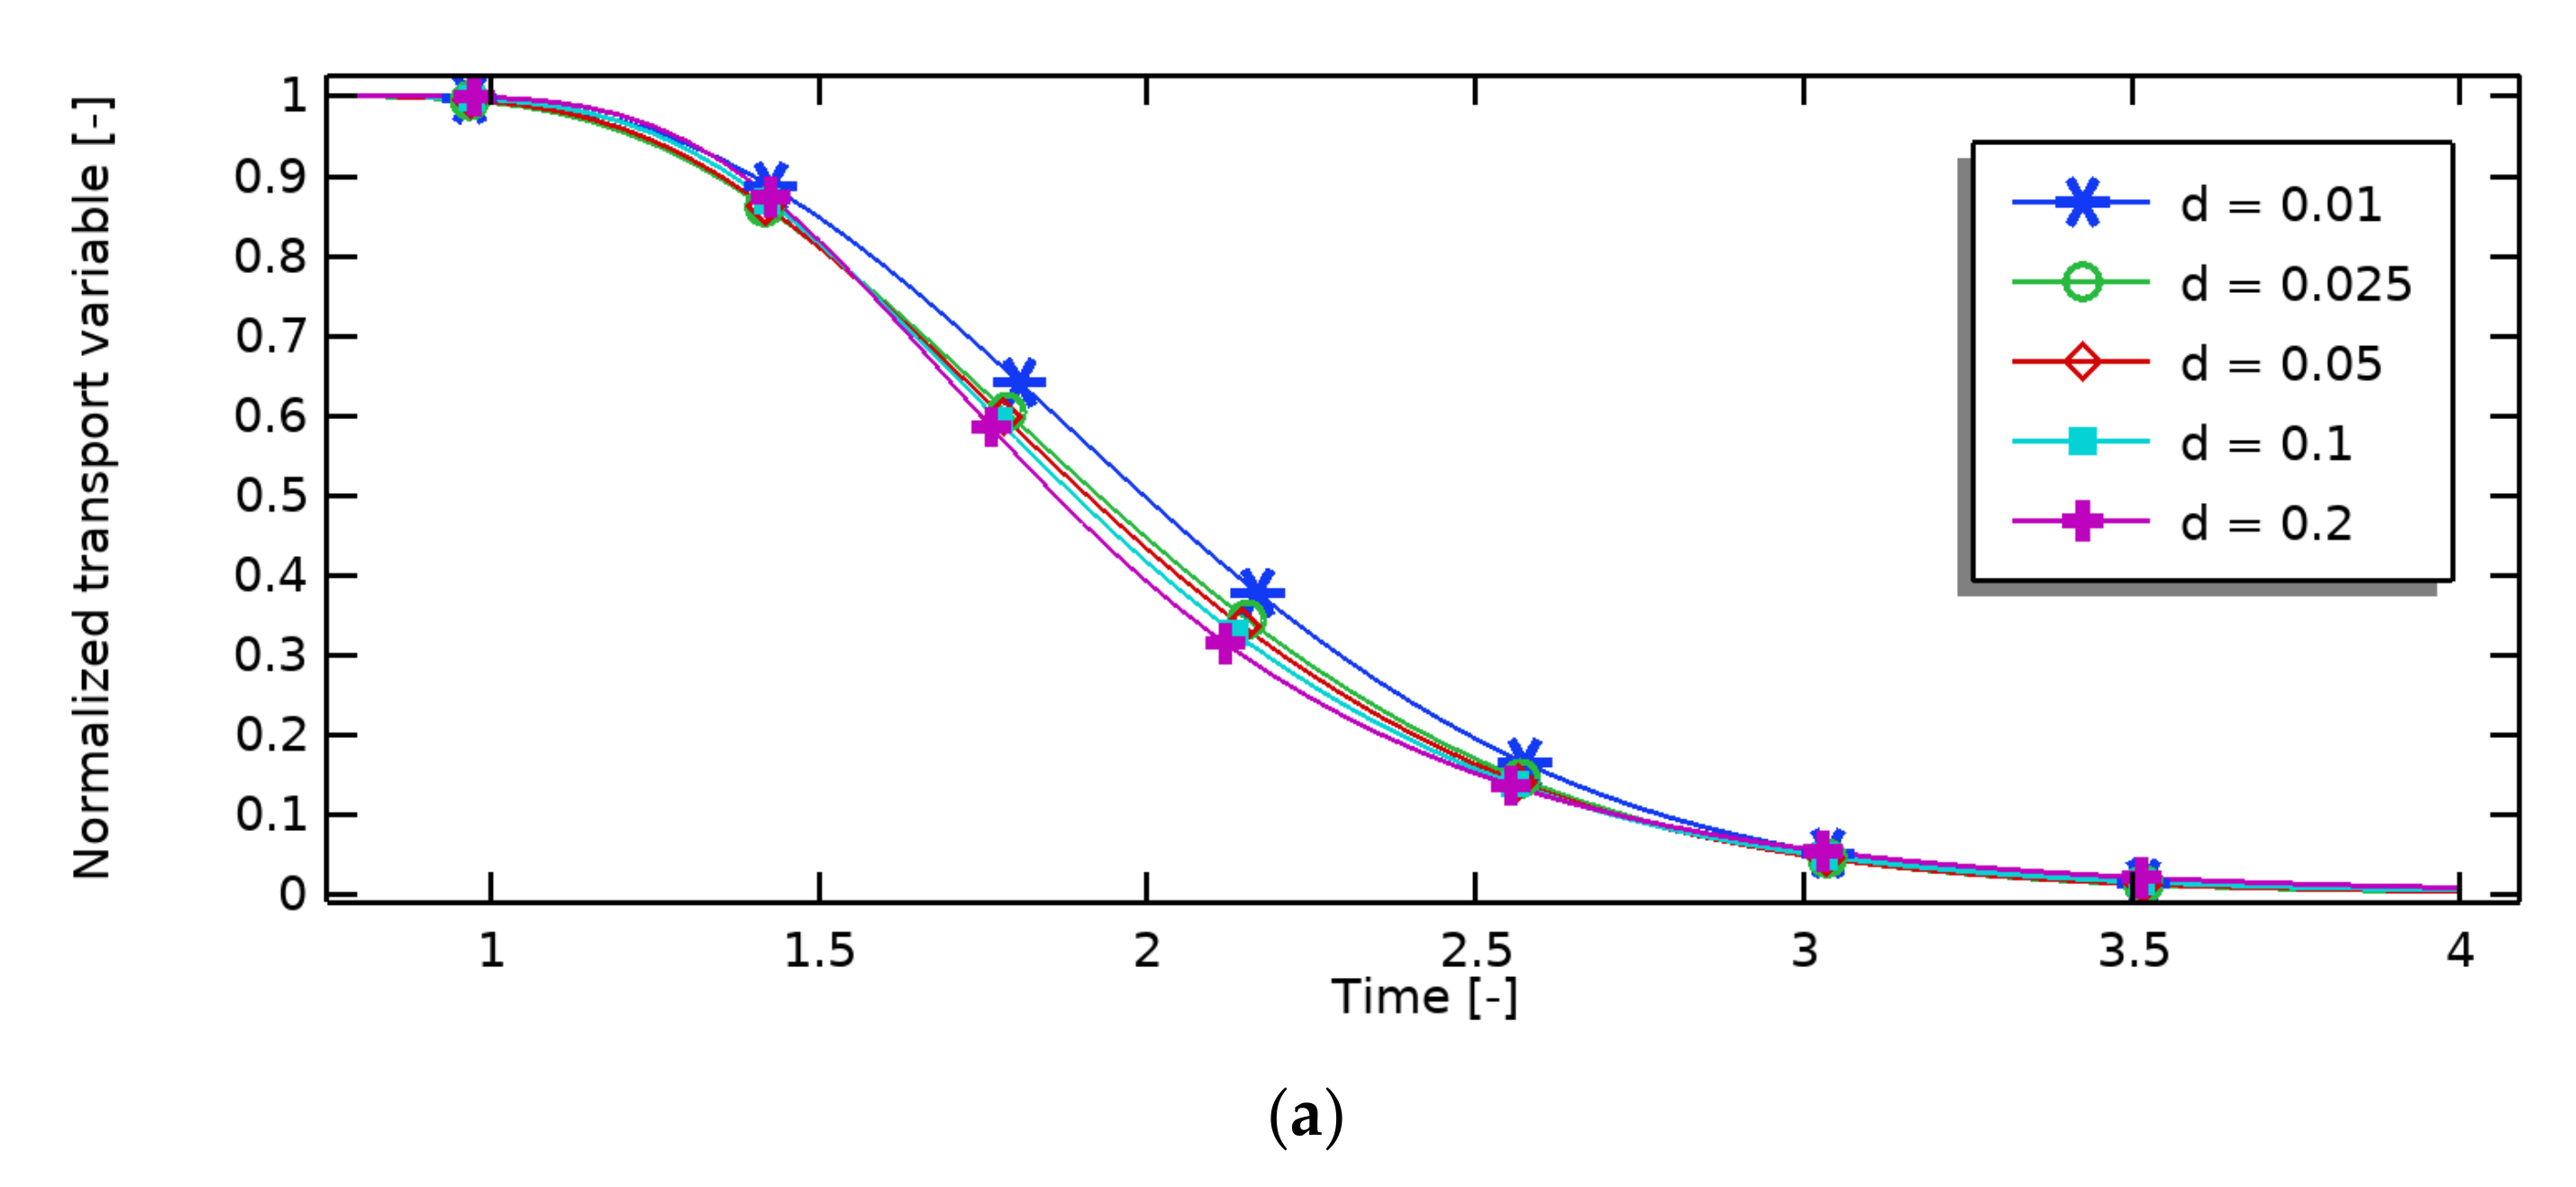
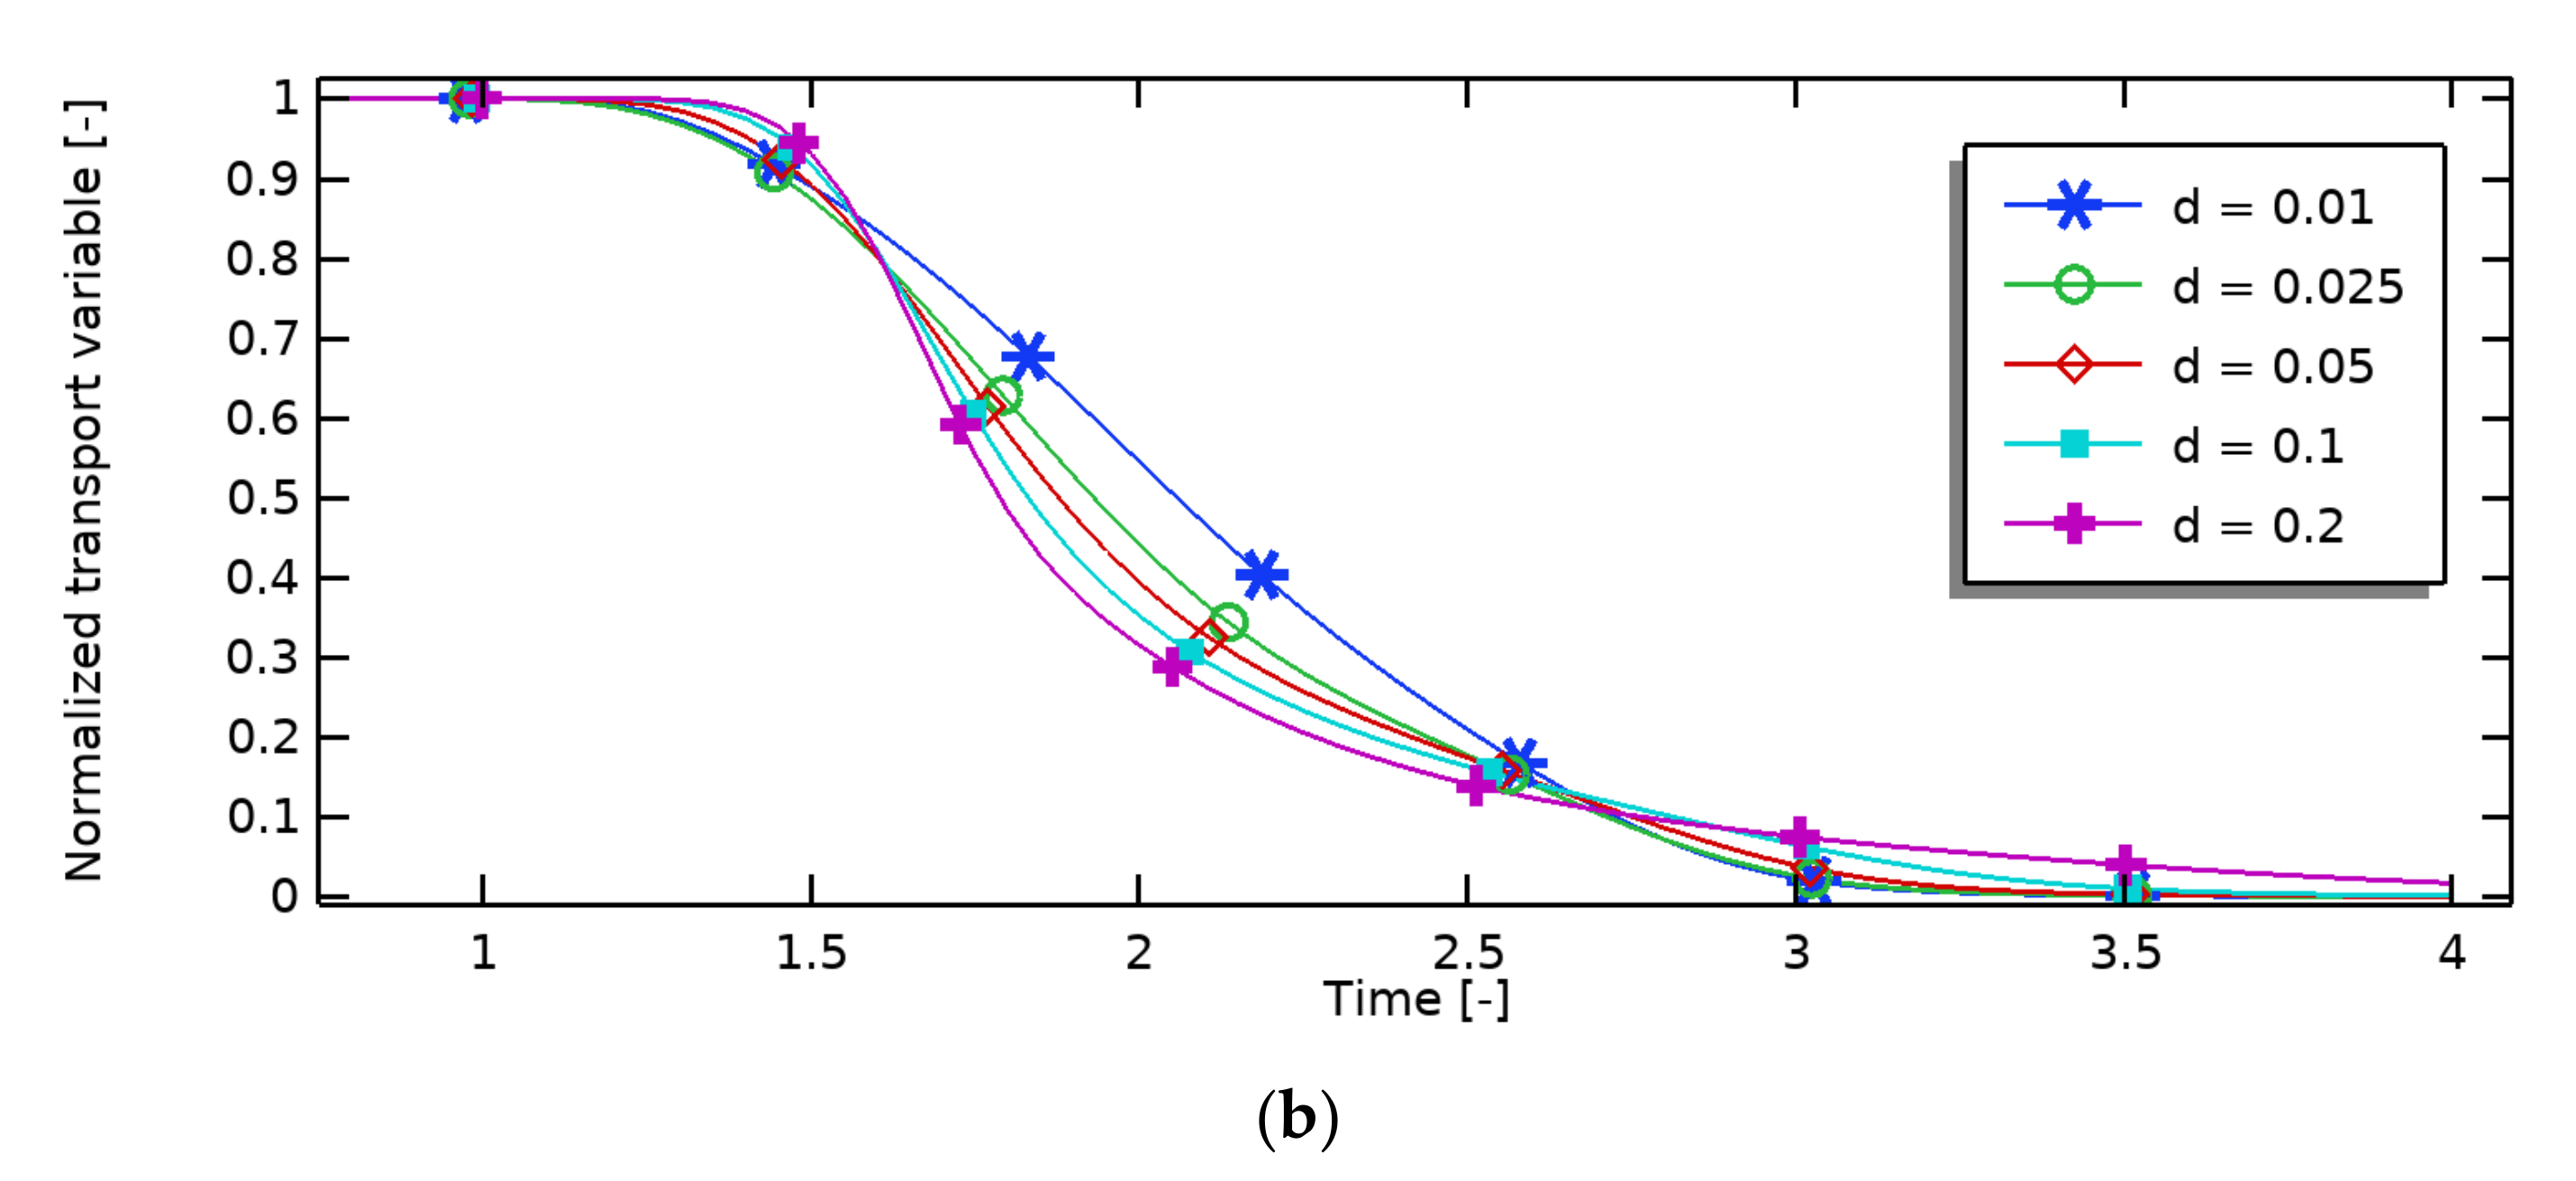
The effect of crack opening is demonstrated by comparing btcs from a parametric sweep over
d, the ratio between the long and the short axes of the elliptic crack, using values between a minimum of 0.01 and 0.2.
Figure 8 depicts the resulting btcs.
The effects of the aspect ratio on the btcs are relatively small, compared to the influence of
α observed above. The effects become more pronounced for highly advection-dominated flow.
Figure 8 depicts the results of parametric sweeps of the crack’s axes aspect ratio for Pe = 33.3 and 333, which clearly shows the additional effect of Pe.
There is an effect on the arrival time of the mean concentration or temperature value, i.e., on advection. For wider cracks the velocities in the crack increase and lead to an earlier breakthrough. With increasing
d the btcs show higher gradients in early stages, but smaller gradients in the tailing. The pockets with almost stagnant water (
Figure 3) can explain the longer tailing.
5.3.3. Influence of the Peclet Number
As a strong dependency on the tilt angle
α was observed, as described above, we focus here on the influence of the Pe-number on solutions for the different values of
α. We also include the cases of different crack aperture, for which a weaker influence was found above.
Figure 9 depicts btcs to illustrate the effects.
The Pe-number is a measure for advection dominance. Higher gradients can be expected for higher Pe. Comparing both plots in
Figure 9 with different degrees of advection-dominance confirms the expectation. The plots also show that there is an effect on the arrival of the mean concentration, which is an indicator for advection. A shift to earlier arrival can be observed, which indicates an additional effect on advection. While this shift is very small for cracks that are perpendicular to flow (
α = 90°), it becomes more pronounced with decreasing angles. This shift depends on
α and
d, but less on Pe.
For a further study of the additional effect on advection and diffusion the btcs were examined with respect to the 1D advection-diffusion model. The parameter fitting option in the ‘transportfit’ program was used for this aim. Using the btcs of the 2D model as input, diffusivity and velocity were fitted to obtain effective parameters
Deff and
veff. With the results an effective Pe-number Pe
eff can be computed using Equation (9). Results of this procedure for different values of
α and the 2D model Pe are listed in
Table 3.
Concerning Deff the table shows a different Pe dependence for different α. For low α (<45°) Deff increases with Pe until Pe = 16, then decreases. For high α (≥45°) Deff decreases with advection dominance. For α = 90° the effective values coincide with the 2D input values which are listed in the second row of the table. A view on the dependence on α for given Pe reveals that there is no effect for low advection-dominated flow, but a strong decrease for high Pe. The latter is in line with the former observation that the flow and transport regime is almost unaltered from 1D plug flow.
The comparison of veff with the reference value of 1, with which the 2D models were run, shows a simpler behavior: the angle dependence is marginal and concerning the Pe influence there is a monotonous decrease from the maximum of 1.33 to values ≈1. The additional effect on advection that is not reflected in the pressure increase is stronger if the advection dominance is weaker.
It is most convenient to compare the Peclet numbers Pe that are input in the 2D model with the effective one Peeff: obtained from the btcs as output from the 2D model. Similar to the observation for Deff there is a different Pe dependence depending on α. For low α (<45°) Peeff increases with Pe until Pe = 16, then decreases. For high α (≥45°) Peeff increases with Pe. The extremes are observed for high advection dominance. If the crack is aligned with flow the input and effective Pe-numbers differ by a factor of 200/2.7 = 74. If the crack is directed 90° to the flow the Pe-numbers are almost the same. Remarkably Peeff > Pe holds for slight advection-dominance. This can be attributed to the higher values of veff in comparison to the reference value .
Almost all btcs could be represented nicely by the 1D model using effective parameters. This finding is not valid for Pe > 100. For an illustration,
Figure 10 depicts btcs for high Pe-numbers (Pe = 100 and 1000). While the btcs for Pe = 100 show the common shape of 1D btcs, this is not true anymore if the Pe is increased further. This is especially visible in the btc for α = 0 and Pe = 1000, which contains two regions with increased slope: for an early stage (
t < 1.5) and a late stage (
t > 3).
5.3.4. Further Dependencies
Both Reynolds number Re and Darcy number Da were varied over several orders of magnitude, as noted in
Table 1. It is assumed that the flow within the crack is laminar. Thus, Re was not varied to values above 2000, which marks the transition to turbulence [
30]. According to its definition Da depends strongly on the scale of the model, i.e., the parameter
L. For
L = 1 m the parameter variation covers a range of permeable porous formations. Due to very low flow velocities low permeable media are of less physical interest. The parametric sweeps with Re and Da did not reveal any influence on the results.
6. Conclusions
The transport of components in a porous matrix containing a crack was investigated systematically by numerical modelling. Converting to dimensionless parameters the analytical description could be reduced to five dimensionless parameters: the geometry parameters α and d, as well as the parameter combinations Re, Pe, and Da. Using appropriate boundary conditions, it is possible to distinguish between effects of altered flow or transport. For a wide parameter range it is possible to fit the outflow breakthrough to the btc of a 1D model approach. In that way, effective parameters could be determined for the studied setting.
Most relevant results from parameter variation runs are:
Strong dependence on α; the larger the angle between crack orientation and the general flow direction, the larger the effective diffusivity, the smaller the effective Peclet number.
There is a much smaller influence from the crack axes ratio.
An advection factor was introduced as a measure for the increase of velocity and advection; the maximum value of the advection factor of ≈1.5 appears when the crack is aligned with the flow direction.
There is an additional increase of advection that is not related to the flow field, but to the transport; it is measured by veff, which takes its highest value of 1.33 for slightly advection dominated flow.
For highly advection dominated flow (Pe > 100) the btc cannot always be reproduced by a 1D approach.
The dimensionless parameters Da and Re are not relevant.
As a dimensionless approach was used in this study the results are scale independent. However, the presented values should not be taken as valid for any constellations of a matrix-crack system. The outcome of this study shows which parameters and parameter combinations are most relevant for the changed advective and diffusive behavior, and which are not relevant. The results provide expected values, to which degree diffusion and advection change for a given parameter constellation.
