1. Introduction
Suspension plasma spraying (SPS), which has been developed over the past 20 years, has greatly enhanced the quality of the thermal barrier, wear-resistant, corrosion-resistant, and superhydrophobic coatings [
1,
2,
3,
4,
5]. The technique involves the injection of nano- and submicron-sized particles into the plasma flow. Hence, unlike the conventional plasma spraying technique where powders with a size of 10 to 100 µm are used, SPS results in the coatings with a smaller characteristic length scale.
The suspension is produced by adding fine solid particles and usually a dispersant to a base liquid such as water or ethanol [
1,
2,
3,
4,
5,
6,
7]. To mix the suspension properly and to break existing particle-aggregates, ultrasonic devices are typically used. The suspension can be injected into the high-velocity high-temperature plasma flow using either a mechanical injection system with a simple nozzle or a twin-fluid atomizer such as air-blast and effervescent [
5,
6,
7,
8,
9]. In the former case, the interaction of a continuous liquid jet with the plasma flow results in the suspension breakup and formation of ligaments and fine droplets. However, in the latter case, the kinetic energy of the gas flow injected into the atomizer causes the suspension to disintegrate into ligaments and droplets first. Consequently, the produced fine droplets interact with the plasma flow.
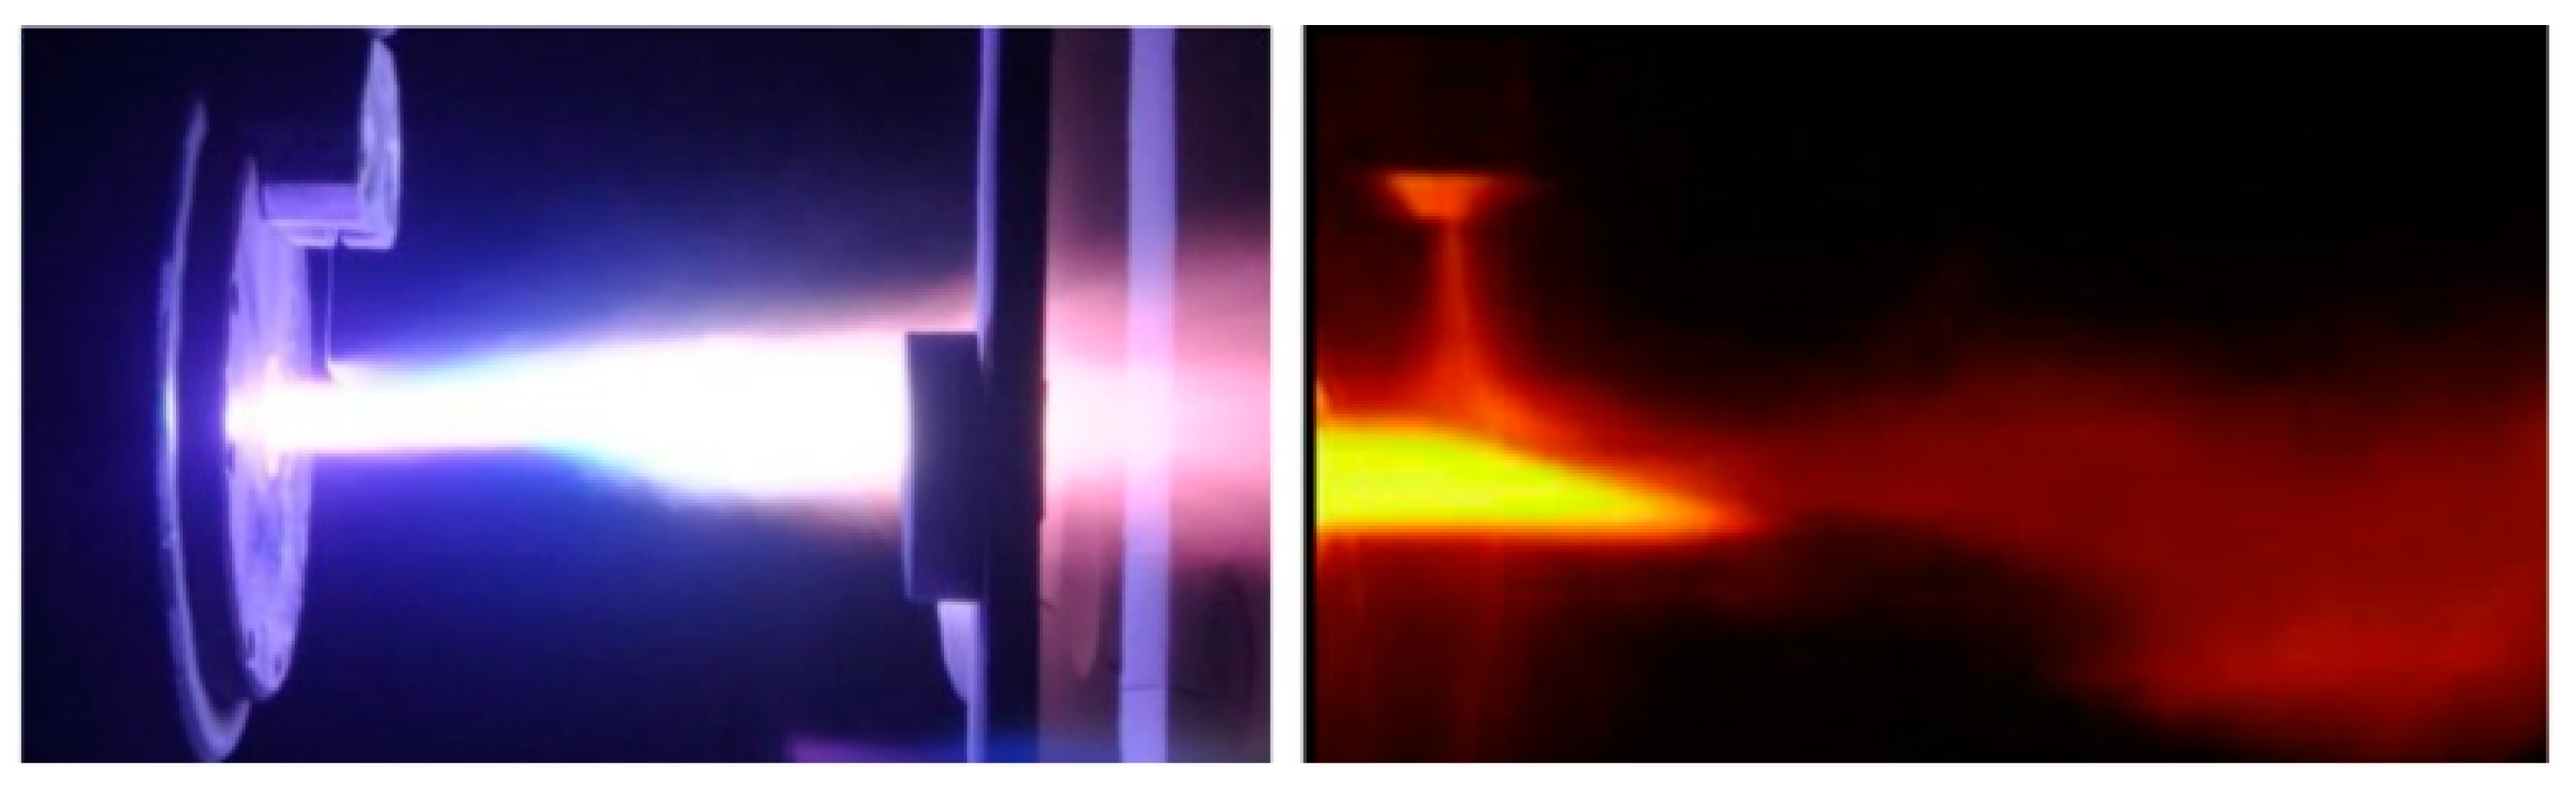
Figure 1 demonstrates the above-mentioned two injection techniques.
After the suspension breakup, the liquid evaporation becomes dominant. It is worth mentioning that the characteristic time scales of fragmentation and vaporization differ by around two orders of magnitude, and therefore, as experimentally observed, the suspension is first atomized by the plasma flow and then the liquid evaporation occurs [
4]. Due to the heat transfer between the suspension and the plasma flow, the temperature of suspension increases while the plasma flow cools down. By eliminating the liquid phase from the field, fine particles or agglomerates are accelerated and heated up by the plasma flow and will impact on the substrate to create the coating [
4]. In all thermal spray processes, temperature, velocity, and trajectory of the particles near the substrate control the quality and microstructure of the coating. However, in the SPS, estimating and controlling the in-flight particle behavior near the substrate is very challenging because the particle behavior strongly depends on enormous processes and parameters, such as suspension breakup, liquid evaporation, injector type, injector location, suspension flow rate, suspension properties (e.g., surface tension, viscosity, density, thermal conductivity, pH, etc.), particle size, particle type and concentration, dispersant type and concentration, plasma fluctuations, momentum and temperature, standoff distance, substrate shape, etc. [
1,
2,
3,
4,
5,
6,
7,
8,
9,
10,
11,
12,
13,
14].
To understand the physical phenomena involved in the SPS and estimate the in-flight droplet/particle behavior, several numerical simulations have been performed so far [
12,
13,
14,
15,
16,
17,
18]. The first algorithm for simulating the entire SPS process from the injection point to the particle landing location at different operating conditions was developed by Jabbari et al. in 2014 [
12]. In that study, the Eulerian–Lagrangian approach with a two-way coupling assumption was developed. A stream of the suspension droplets containing nickel (15 wt.%) and ethanol (85 wt.%) was injected into the plasma crossflow to simulate the mechanical injection approach mentioned above. Suspension with a specified particle concentration was assumed as a multi-component droplet carrying properties of the suspension. The droplet breakup was simulated by the Kelvin-Helmholtz Rayleigh-Taylor (KHRT) breakup model. Furthermore, the particle melting phenomenon was approximated by defining the particle-specific heat as a function of temperature. The effects of location, angle, and velocity of suspension injection on the suspension penetration in the plasma jet and the droplet/particle in-flight behavior were investigated. It was found that the suspension penetration becomes more efficient and higher particle velocity and temperature can be obtained if the injector is near the torch exit and its angle is toward the torch [
12].
The stated suspension model has been used by several researchers so far to simulate different suspension thermal spray processes, and its accuracy and reliability have been verified under various operating conditions [
12,
13,
14,
15,
16,
17,
18,
19,
20,
21,
22]. For instance, Pourang et al. [
13] used the mentioned approach and analyzed the temporal evolution of a 40 µm suspension droplet containing zirconia (10 wt.%) and ethanol (90 wt.%) while it was traveling inside the plasma flow. It was revealed that after ethanol evaporation, the particle temperature increases and then decreases along with the jet. In addition, it was shown that the melting state of the particle can be accurately simulated by the mentioned assumptions. Jadidi et al. [
14] studied the in-flight droplet/particle behavior near flat substrates located at various standoff distances in the SPS process. It was revealed that the stagnation region near the substrate causes several small particles to decelerate and get diverted. Pourang et al. [
15] analyzed the influence of substrate shape and standoff distance on particle in-flight behavior in the SPS process using the mentioned model. Cylindrical as well as flat substrates were considered, and it was shown that particles hit the flat substrate more frequently. The effect of plasma fluctuations on the in-flight droplet/particle behavior was studied by Dalir et al. [
16,
17,
18]. It was shown that suspension penetration depth, as well as droplet/particle trajectory, temperature, and velocity, are a strong function of plasma jet fluctuations and injection properties such as injection velocity. In addition to the SPS simulations, the stated model was successfully used by Jadidi et al. [
19,
20] and Chadha et al. [
21,
22] to model suspension high-velocity oxygen-fuel (HVOF) process as well. It should be pointed out that for simulating suspension HVOF, the Taylor Analogy Breakup (TAB) model was used to model the droplet breakup since the Weber number is relatively low in this process.
To the best of our knowledge, the SPS simulations have been based on the mechanical injection approach (see
Figure 1—Left) thus far [
12,
13,
14,
15,
16,
17,
18]. In all those simulations, a stream of the suspension droplets was injected from a simple plain orifice. However, as mentioned above and shown in
Figure 1—right, twin-fluid atomizers such as air-blast and effervescent have been used in the suspension plasma spraying as well [
6,
8,
9]. Despite the complexity of these processes and the challenges in the experimental measurements, numerical simulations are performed in the present study to understand the effect of air-blast suspension spray on the plasma crossflow and the droplet/particle in-flight behavior. In the present study, the suspension consists of ethanol (85 wt.%) and nickel (15 wt.%). In the next section, the numerical method, computational setup, as well as boundary conditions are explained.
2. Model Description
The Eulerian–Lagrangian approach with a two-way coupling assumption, implemented in ANSYS Fluent 2019R3, was used to model the SPS process in the current work. The detailed description of the mathematical modeling can be found in References [
12,
13,
14,
15], and hence, only the main assumptions are described here.
The turbulent plasma flow is modeled with the Reynolds Stress Model (RSM) [
12,
13,
14,
15]. Furthermore, to reduce the effects of plasma jet fluctuations on drops’ fragmentation and in-flight particle behavior, the steady mode is focused, and argon is considered to be the working gas [
12,
14]. The ideal gas model is also used, and the gas phase thermodynamic and transport properties are temperature-dependent only [
12,
13,
14,
15]. In addition, local thermal equilibrium (LTE) is assumed for modeling the plasma jet [
12,
13,
14,
15]. Velocity and temperature profiles are provided at the nozzle exit as the inlet boundary conditions for the plasma jet. A uniform 12,250 K temperature profile is assumed, with the velocity profile given with the below correlation [
12,
14]:
where
= 1800 m/s and
is the nozzle exit radius and is equal to 3.94 mm. To calculate the gas phase thermo-physical properties (e.g., viscosity), the data presented in Reference [
23] are used.
The discrete phase model (DPM) is utilized to simulate atomization, evaporation, velocity, temperature, and trajectory of the particulate/droplet phase. To simulate nickel suspension with a given concentration (here 15 wt.%), a two-component mixture model is used, where ethanol is one component and the second one carries nickel properties, such as its density, evaporation temperature, and latent heat of evaporation [
12,
13,
14,
15,
16,
17,
18,
19,
20]. As mentioned, nickel-ethanol suspension with the same concentration was used by Jabbari et al. [
12] as well. The surface tension of the droplet is estimated by a piecewise linear function. The suspension surface tension is used for the dispersed phase as long as the suspension temperature is less than or equal to the ethanol’s evaporation point and as far as the breakup process is dominant. In the next stage, molten nickel surface tension is used which is higher than the surface tension of the suspension [
12,
14]. Mass-weighted-mixing-law is used to calculate the suspension specific heat and viscosity [
12,
14]. The melting point, boiling point, density, viscosity, surface tension, and specific heat of the molten nickel are 1728 K, 3200 K, 7850 kg/m
3, 5.5 mPa.s, 1.778 N/m, and 735 J/kg.K, respectively [
24,
25,
26,
27].
As stated above, in the present study, the suspension is injected into the plasma crossflow using an air-blast injector.
Figure 2 shows the process schematically. At the nozzle exit, the gas phase velocity and temperature boundary conditions are imposed. The injector is located at an axial distance of 7 mm. It should be noted that increasing the axial distance causes the particle velocity and temperature to decrease significantly [
12]. Therefore, based on our previous study [
12], the typical axial distance used in the experiments is applied here. However, the effect of vertical distance will be investigated in the next section. The injector’s inner and outer diameters are assumed to be 0.2 and 0.3 mm, respectively. In addition, the suspension is injected using 10 streams [
28] with the initial temperature of 300 K. To create the suspension spray shown in
Figure 1 and
Figure 2, it is assumed that the air-suspension relative velocity, sheet constant, and ligament constant are 100 m/s, 12, and 0.5, respectively [
28]. The flat substrate (with the 5 mm thickness and 25 × 25 mm
2 surface area) is located at the standoff distance of 40 mm from the nozzle exit and is perpendicular to the torch axis as well.
Like other papers [
12,
13,
14,
15,
16,
17,
18], the KHRT breakup model is used to simulate the suspension atomization. In general, the KHRT model is used where the Weber number is high. Various studies have shown that for ethanol-based suspensions in the plasma core, the Weber number is high and catastrophic breakup occurs [
2,
6,
12]. In addition, in the present study, O’Rourke’s model is employed to model the droplet collision [
12,
14,
29]. To include the effects of turbulence fluctuations on trajectories of discrete phase, the stochastic tracking model is applied. The conservation equation is used to calculate the momentum of the dispersed phase. Similar to other works [
12,
13,
14,
15], the following drag coefficient is utilized:
where
is the Reynolds number and
,
, and
are constants [
28]. The lumped capacity method is applied to simulate the discrete phase heat transfer. To calculate the Nusselt number, the Ranz-Marshal correlation is used [
28]. Furthermore, to model the particle melting process, the specific heat of particles is defined to be a function of temperature:
where
is the approximated specific heat (which is about 29,600 J/kg),
is the heat of fusion, and
is assumed to be equal to 10 K (i.e., from the melting point 1728 to 1738 K). After melting, the specific heat of liquid nickel is used. Interested readers may refer to previous publications on the details of the particle melting process and the variations of specific heat with temperature [
12,
13,
14,
15,
16,
17,
18].
In this article, three-dimensional (3D) geometry consists of the substrate and the free space in front of the nozzle that is for the plasma plume (see
Figure 3). The mesh is fine at the jet’s core region and near the substrate to capture the large temperature and velocity gradients both in axial and radial directions. To model the boundary layers on the substrate, a Scalable wall function is used [
14]. No-slip boundary condition is also enforced at the substrate. Moreover, the adiabatic boundary condition is applied at the substrate as the interaction time between the plasma jet and the substrate is very short. To model the particle–substrate interaction, the trap boundary condition is applied in a way that particles stick on the substrate upon their strike [
14,
15].
In our baseline case, the injector is located at the vertical distance of 10 mm, the suspension mass flow rate is 0.52 g/s, and the spray half-angle is 20°. The suspension mass flow rate is based on the experimental study of Aghasibeig et al. [
30]. In the current work, in addition to the vertical distance, the effects of spray angle and suspension mass flow rate are discussed as well.
3. Results
As extensive validation of the plasma jet, the employed turbulence model, the discrete phase, and the breakup model are accomplished in previous studies [
12,
13,
14,
15,
16,
17,
18], to avoid repetition, we do not bring the details here. As an alternative, the effects of air-blast spray on the gas and the discrete phases are evaluated here. Specifically, the analysis of the particle’s velocity and temperature near the substrate will be discussed in more detail in this section.
Figure 4 and
Figure 5 show the gas-phase temperature and velocity before and after suspension injection. Noting that for the cases without suspension injection, an axisymmetric stagnation flow is formed on the substrate. In this case, the gas axial velocity decreases as it approaches the substrate, increasing the static pressure near the substrate [
14,
15]. It was shown in previous studies [
14,
15] that the formation of the stagnation region near the substrate has a significant influence on the trajectory and velocity of small particles. It is also shown that the gas-phase temperature decreases as the axial distances increases. After suspension injection (the baseline case mentioned above), a decrease in the gas temperature and velocity is observed due to heat transfer and momentum exchange between suspension and plasma crossflow (i.e., due to the suspension penetration and evaporation). Therefore, the gas flow structure is changed, and the stagnation region formed on the substrate is weaker in comparison to the case with no injection (see
Figure 4 and
Figure 5) [
14,
15].
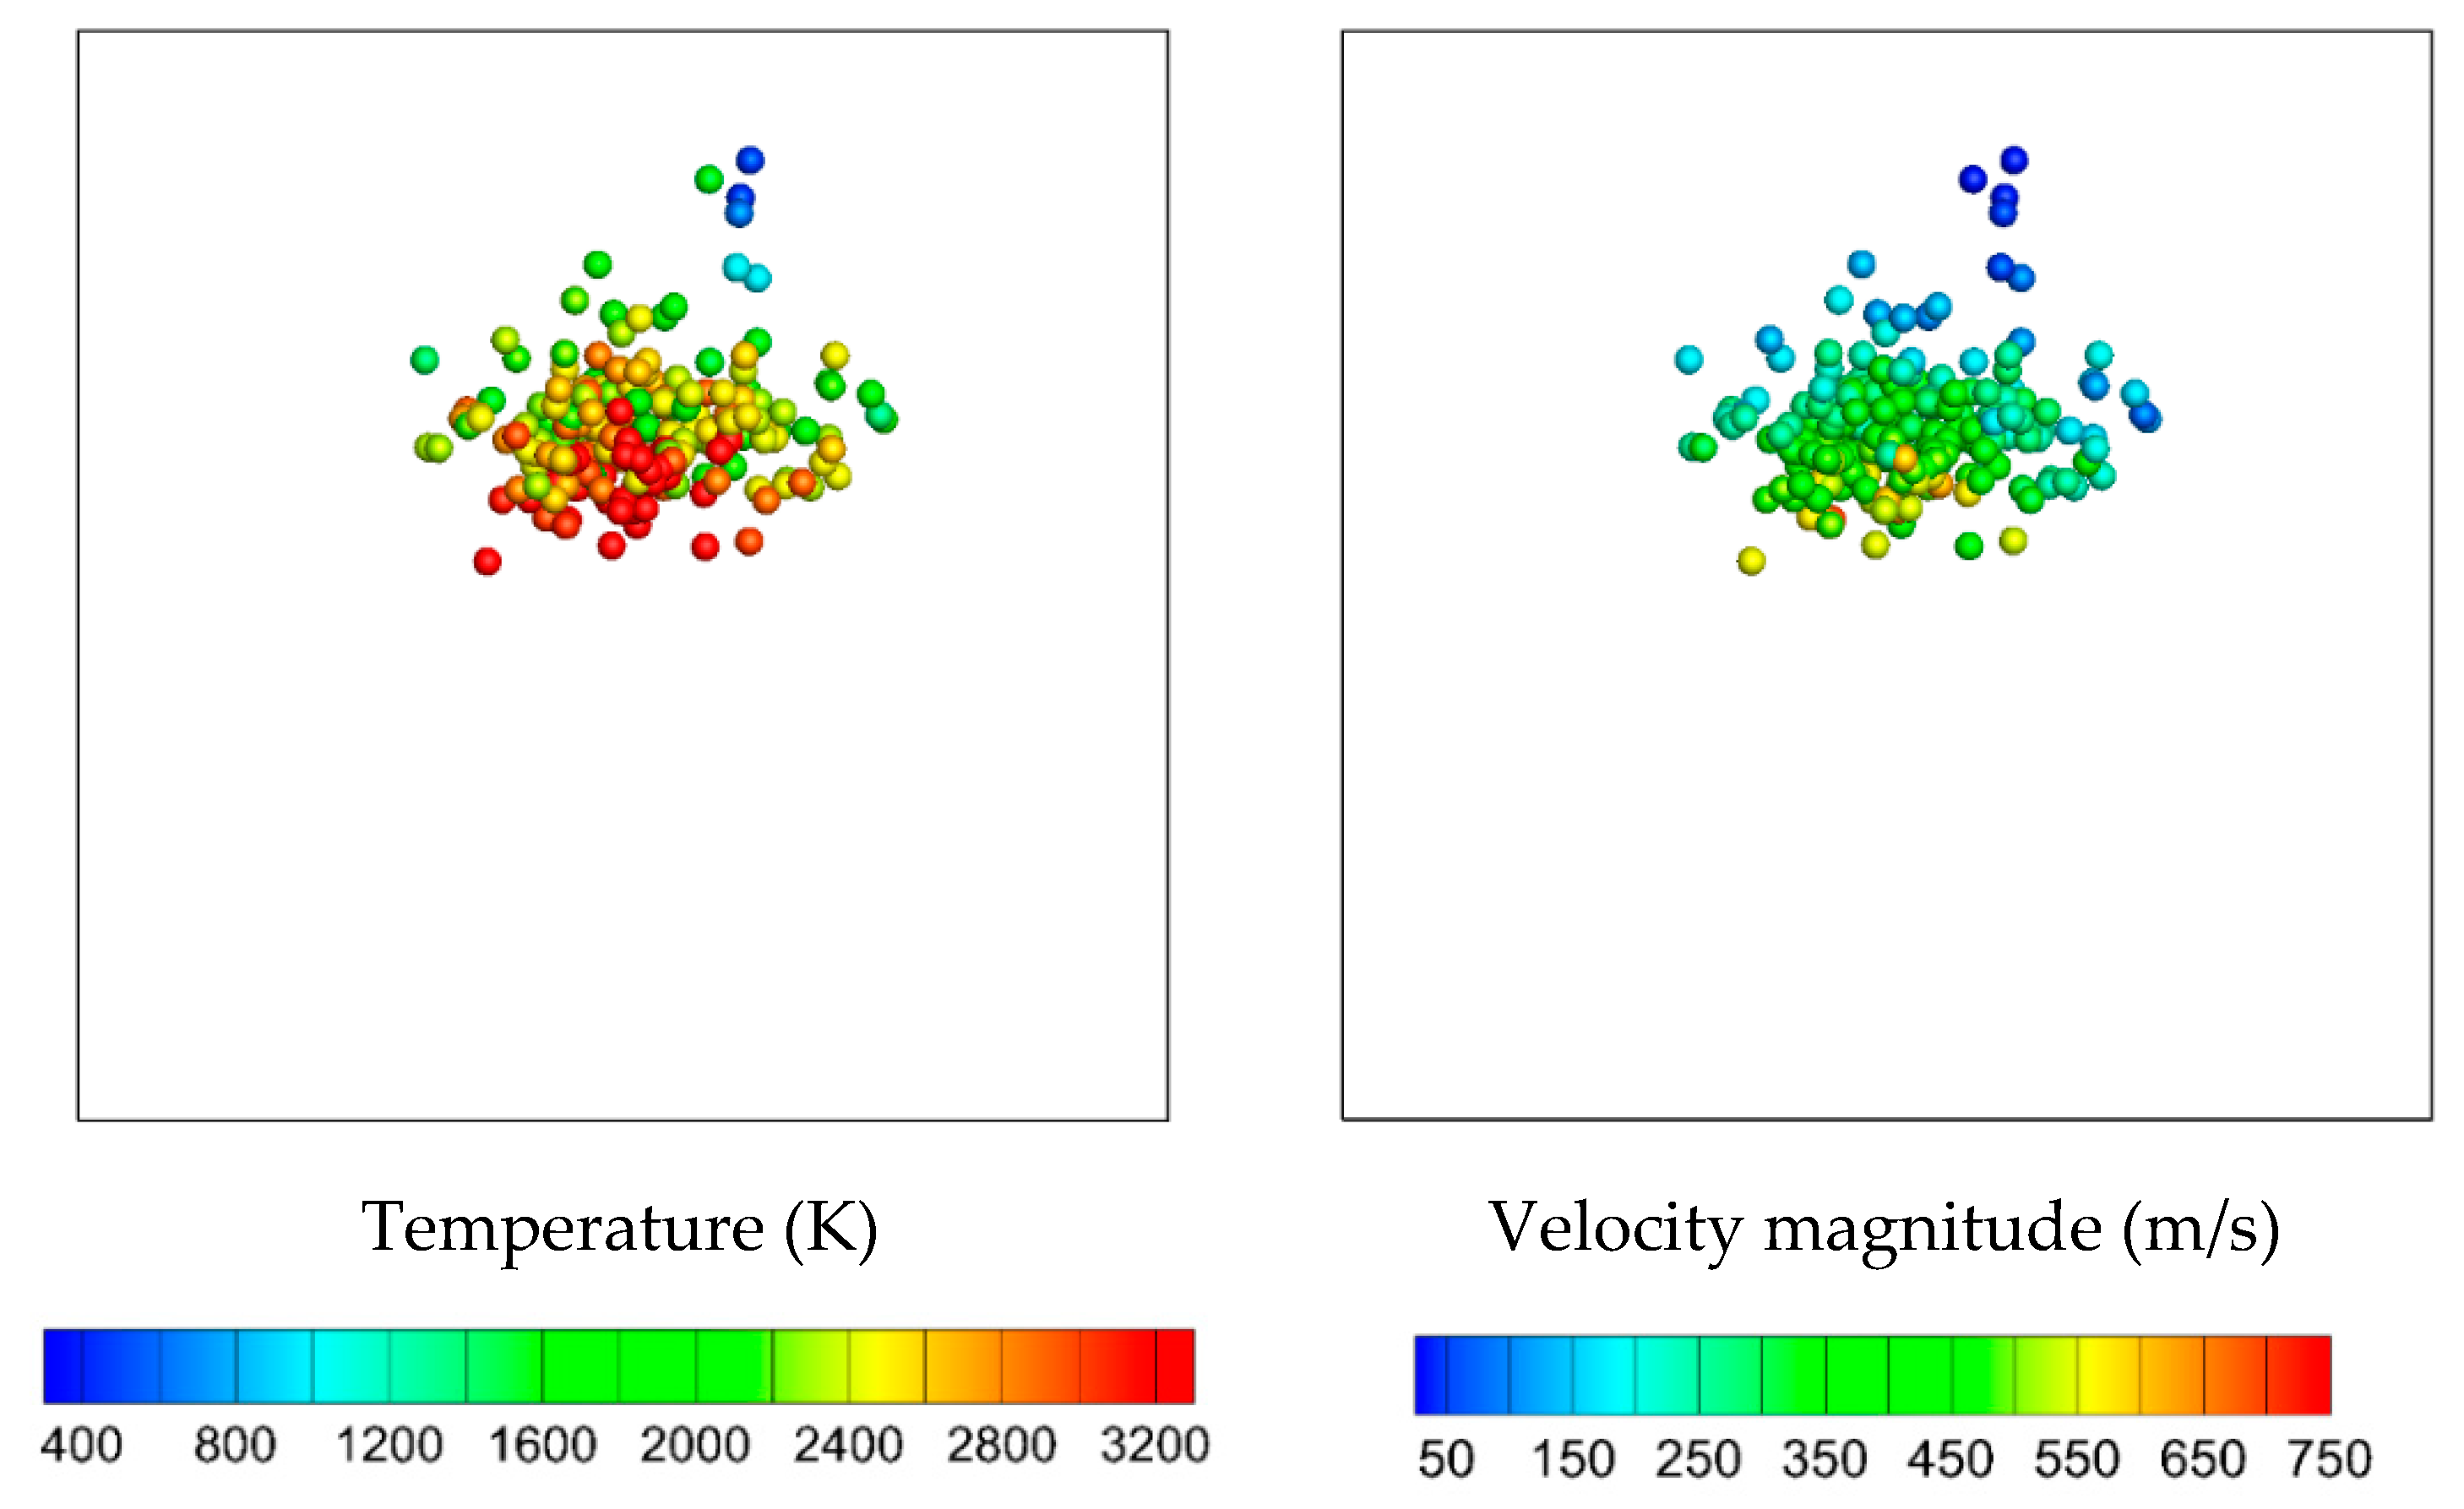
Figure 6 shows a side view of droplet/particle temperature, velocity, and diameter for the baseline case. As shown, after suspension–plasma interaction, the breakup phenomenon occurs, and the droplet size significantly reduces. Then, the droplet/particle temperature and velocity increase due to heat transfer and momentum exchange between suspension and plasma flow. As can be seen, the particles that move close to the jet centerline reach high temperature and velocity (many particles reach the molten state and the velocity higher than 350 m/s) and, therefore, can stick on the substrate. However, several fine particles follow the gas-phase streamlines and get diverted by the stagnation region. It is worth mentioning that this result is in agreement with other theoretical and numerical studies in this area [
14,
15,
31].
The landing location of the particles on the substrate as well as the particle temperature and velocity upon impact for the baseline case are shown in
Figure 7. The square area in the figure represents the substrate from the front view. All the particles landed on the upper half of the substrate and most of the particles are molten. Moreover, the velocity of a substantial number of particles is more than 350 m/s. In general, the deposition pattern reveals that by increasing the radial distance from the center point of the substrate, the particle temperature and velocity decline upon impact. In other words, if a dense coating is desired, the suspension penetration and breakup should be controlled in a way that most particles travel near the jet centerline and impact the substrate near its center point.
In a previous study [
12], it was revealed that in the mechanical injection approach (see
Figure 1—Left), the main parameter that controls the suspension penetration, breakup process, evaporation, as well as particle velocity, temperature, and trajectory, is the suspension mass flow rate. When the suspension mass flow rate was not enough, the suspension was not able to penetrate, therefore, many droplets bounced off the jet. On the other hand, if the suspension mass flow rate was too high, it completely passed through the plasma plume and the plume was not able to disintegrate the suspension sufficiently. In Reference [
12], this phenomenon was shown by increasing the suspension mass flow rate from 0.5 to 0.75 g/s.
In the current work, the effect of suspension mass flow rate is studied as well. To do this, the suspension mass flow rate in our baseline case is changed while other parameters are kept constant.
Figure 8 shows a side view of droplet/particle temperature, velocity, and diameter when the suspension mass flow rate is doubled (it is increased to 1.04 g/s). By comparing
Figure 6 and
Figure 8, it is observed that, in contrast to the work of Jabbari et al. [
12], doubling the suspension mass flow rate results in a slight increase of the suspension penetration. In addition, the breakup process and the in-flight droplet/particle behavior are not strong functions of suspension mass flow rate.
Figure 9 shows the effect of the spray angle on the suspension penetration and the in-flight droplet/particle behavior. The last image in this figure is obtained from the front view. Compared to the baseline case, all the parameters are the same and only the spray half-angle is increased to 30° here. It is clear that almost half of the suspension does not enter the plume region and therefore are wasted. Another drawback is that, since the mass flow rate of the suspension droplets that enter the plume region is reduced, the suspension penetration into the plasma crossflow is decreased, which can affect the droplet/particle velocity and temperature near the substrate.
Like the spray angle, the vertical distance of the atomizer from the nozzle exit has a significant influence on the suspension penetration and the in-flight droplet/particle behavior.
Figure 10 shows the droplet/particle temperature, velocity, and diameter when the vertical distance is increased to 20 mm, and other parameters are kept the same as the baseline case. As can be seen, the result is very similar to the case where the spray angle was increased (see
Figure 9).
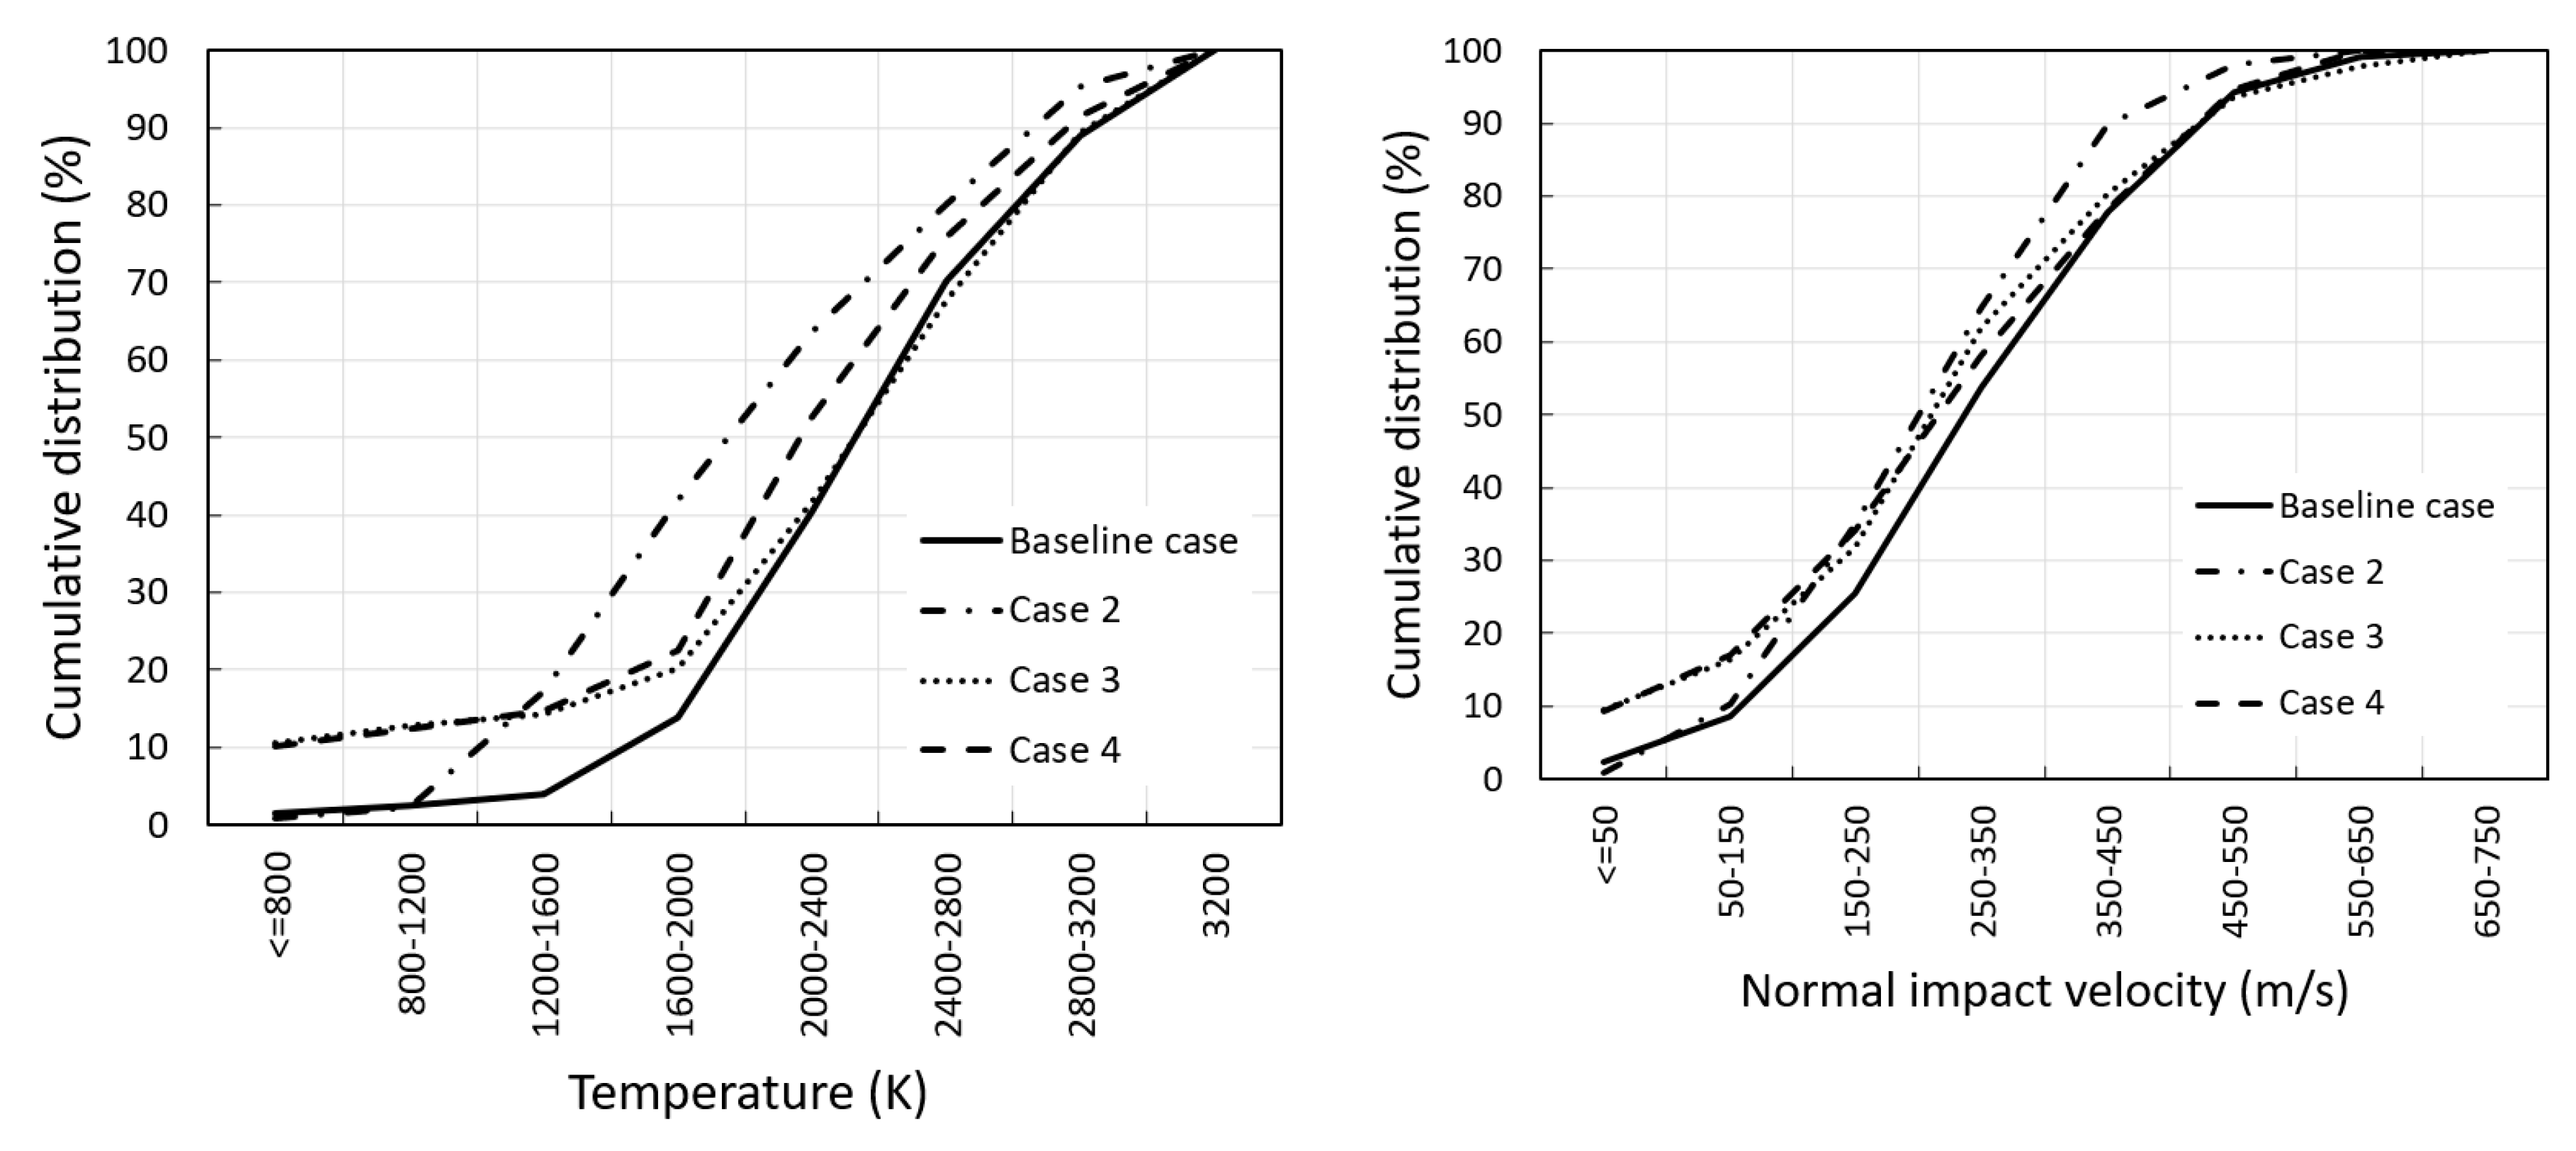
To analyze the effects of the mentioned parameters (e.g., suspension mass flow rate and spray angle) on the coating quality, the cumulative distributions of particle temperature and normal velocity upon impact are presented in
Figure 11. In this figure, cases 2, 3, and 4 are obtained from the results presented in
Figure 8,
Figure 9 and
Figure 10, respectively. As can be seen, although increasing the suspension mass flow rate does not influence the suspension penetration significantly (see
Figure 8), it causes both particle temperature and normal impact velocity to decrease considerably (case 2 vs. the baseline case in
Figure 11). The main reason is that by increasing the suspension mass flow rate, more energy is required from the plasma phase to heat the droplets and evaporate the ethanol. It leads to the plasma temperature reduction. As a result, the particle temperature near the substrate decreases. A similar discussion can be made to explain why the normal impact velocity of particles decreases (in comparison with the baseline case) as the suspension mass flow rate increases. In addition,
Figure 11 shows that by increasing the spray angle and vertical distance from the nozzle exit (cases 3 and 4 vs. the baseline case), both particle temperature and normal impact velocity decrease. In general, reduction of particle temperature and velocity near the substrate causes the coating porosity to increase [
30]. In cases 3 and 4, relatively cold and low-velocity particles were generated due to low penetration height (suspension could not enter the plasma core) and interaction of suspension droplets with the periphery of the plasma plume.


